
Rapid Stream Restoration Monitoring Protocol CBFO-S14-01 June 2014
U.S. Fish and Wildlife Service
RAPID STREAM RESTORATION MONITORING PROTOCOL
By: Sandra L. Davis, Richard R. Starr, and Christopher K. Eng Coastal Program Stream Habitat Assessment and Restoration U.S. Fish and Wildlife Service Chesapeake Bay Field Office CBFO-S14-01
Prepared in cooperation with: City of Baltimore, Department of Public Works, Bureau of Water and Wastewater
Annapolis, MD 2014
Rapid Stream Restoration Monitoring Protocol
ii
TABLE OF CONTENTS LIST OF FIGURES ..................................................................................................................... iii LIST OF TABLES……………………………………………………………………………...iii LIST OF PHOTOGRAPHS…………………………………………………………………....iii I. INTRODUCTION................................................................................................................. 1
II. PROTOCOL PURPOSE AND OBJECTIVES .................................................................. 2
III. EVALUATOR QUALIFICATIONS ................................................................................... 2
IV. RAPID STREAM RESTORATION MONITORING PROTOCOL ............................... 2 A. DESIGN APPROACH ........................................................................................................ 3 B. BANKFULL DETERMINATION AND HYDRAULIC ASSESSMENT ......................... 4 C. LIMITS OF INVESTIGATION .......................................................................................... 4 D. RAPID STREAM RESTORATION MONITORING FORM ............................................ 5 E. EVALUATION ATTRIBUTE DEFINITIONS .................................................................. 9 F. FIELD MONITORING PROCEDURES .......................................................................... 20 G. LIMITED STREAM MEASUREMENTS ........................................................................ 21
H. MONITORING RECOMMENDATIONS .................................................................... 22
V. CONCLUSION..................................................................................................................... 23

Rapid Stream Restoration Monitoring Protocol
iii
LIST OF FIGURES
Figure 1. Potential Bankfull Indicators (McCandless and Everett 2002) Figure 2. Rapid Stream Restoration Monitoring Form Figure 3. Partial Evaluation Attributes Table Figure 4. Pool-to-Pool Spacing (Harman et. al. 2012) Figure 5. Bank Height Ratio Figure 6. Entrenchment Ratio (Rosgen 2008) Figure 7. Meander Width Ratio (Harman et.al. 2012) Figure 8. Radius of Curvature (Rosgen 2008)
LIST OF TABLES
Table 1. Pool-to-Pool Spacing Ratio Summary Table 2. Depth Variability Ratio Summary Table 3. Channel Bank Height Ratio Summary Table 4. Channel Entrenchment Ratio Summary Table 5. Meander Width Ratio Summary Table 6. BEHI/NBS Summary Table 7. Bare Ground Summary Table 8. Riparian Species Composition Summary Table 9. Riparian Buffer Stability Summary Table 10. Riparian Buffer Width Summary
LIST OF PHOTOGRAPHS Photo 1. Regenerative Storm Conveyance (Underwood & Associates) Photo 2. Natural Channel Design (U.S. Fish and Wildlife Service) Photo 3. Regenerative Storm Conveyance/Valley Restoration (Biohabitats) Photo 4. Valley Restoration (Landstudies) Photo 5. Vertical Erosion Photo 6. Headcut Photo 7. Widespread Aggradation Photo 8. Appropriate Structure Deposition Photo 9. Leaning Trees from Excessive Lateral Erosion Photo 10. Failed Structure Photo 11. Buried Structure
APPENDIX A
Blank Rapid Stream Restoration Monitoring Form Example Rapid Stream Restoration Monitoring Form Rapid Stream Monitoring Evaluation Attributes Table Common Stream Design Measurements and Ratios

Rapid Stream Restoration Monitoring Protocol
U.S. Fish and Wildlife Service June 2014 Chesapeake Bay Field Office Page 1 of 24
I. INTRODUCTION
The U.S. Fish and Wildlife Service, Chesapeake Bay Field Office (Service) and the City of Baltimore (City) entered into a cooperative agreement (Agreement #51410-1902-5119) to enhance cooperation and coordination to facilitate the conservation, enhancement, and restoration of stream and riparian habitats in the Baltimore City watershed. These habitats are scarce and often impaired, and their conservation and restoration are critical for the Federal Trust Resources, such as migratory birds and anadromous fish. Under this agreement, the Service has developed a rapid stream restoration monitoring protocol to evaluate the functional stability of stream restoration projects. Monitoring is critical in both evaluating whether the project achieved its restoration objective(s) and analyzing a project’s cost-benefit. The cost-benefit analysis assesses the cost of habitat/resource benefits achieved from the restoration project. Restoration monitoring will also provide data to improve restoration designs and increase the success of restoration projects. An increase in successful projects will result in increased benefits to the Federal Trust Resources. The rapid stream restoration monitoring protocol can be applied to almost any stream restoration project design approach (i.e. regenerative storm conveyance, sand berm seepage systems, Natural Channel Design, valley restoration, among others). It uses visual observations to evaluate the functional stability of stream restoration projects and focuses on vertical stability, lateral stability, riparian condition and instream structures (i.e. log vane, w-weir). Note that it does not evaluate any physicochemical or biological functions. The parameters used to evaluate vertical stability, lateral stability, and riparian conditions are based on the document: A Function-Based Framework for Stream Assessment and Restoration Projects, (Harman et.al. 2012). The function-based framework is illustrated by a functional pyramid, which is a five-level hierarchical framework that categorizes stream functions and parameters that describe those functions. The evaluation of instream structures is based on structure performance and integrity. The rapid methodology uses these function-based parameters to identify restoration success and recommend future actions. Recommended future actions will always include the rapid assessment protocol, at least through the required monitoring period, but may also include two other recommendations. The first recommendation can be for intensive survey monitoring. Intensive survey monitoring involves detailed measurements at the location of stream adjustment to determine the stability trend of these adjustments. If the results of the intensive survey monitoring show the stream is trending towards degradation, then remediation and/or repair is required. The second recommendation can be for remediation and/or repair. Remediation and/ or repair is required if the rapid survey shows that there are widespread stream adjustments that will cause further damage and contribute to other structural or functional problems. It is not the intent of the Service to promote a rapid stream restoration monitoring survey over a more intensive survey. Clearly, a more intensive survey will provide a more definitive assessment of restoration success. Furthermore, a more intensive survey may be necessary depending on the goal(s) of the monitoring, as in the case where the evaluators are trying to assess the functional success of a specific restoration technique. However, the Service recognizes that project implementers often do not perform restoration monitoring due to a lack of

Rapid Stream Restoration Monitoring Protocol
U.S. Fish and Wildlife Service June 2014 Chesapeake Bay Field Office Page 2 of 24
time and/or funds. The Service developed this monitoring methodology to address this issue and provide a minimum standard for assessing project success.
II. PROTOCOL PURPOSE AND OBJECTIVES The purpose of this protocol is to rapidly monitor stream restoration success and identify any potential stream adjustments that may lead to failure. The Service and City worked together to develop protocol objectives for the rapid restoration monitoring survey protocol. The following list provides the most significant objectives:
• Develop a function-based rapid and standardized method to evaluate the stability and functional success of a restored stream
• Establish a minimum standard necessary to evaluate the stability and functional success of a restored stream
• Promote consistent and reproducible results • Identify situations that require additional monitoring • Identify potential causes for impairment • Identify potential corrective actions
III. EVALUATOR QUALIFICATIONS
Although this report provides stepwise procedures, the use of the rapid stream restoration monitoring protocol requires a well-experienced evaluator. Reducing subjectivity is a goal of the monitoring protocol. However, this protocol is primarily visually based, and therefore requires a skilled evaluator to implement correctly. The evaluator must be knowledgeable of fluvial geomorphic and watershed processes, and be well trained in the design approach used for the restoration. For example, if the restoration project follows a natural channel design approach the evaluator must be experienced in identifying bankfull. The evaluator should have extensive training and experience in stream assessment, including the assessment techniques presented in the manuals Stream channel reference sites: An illustrated guide to field technique (Harrelson et al. 1994), River Stability Field Guide (Rosgen 2008), and A Function-Based Framework for Stream Assessment and Restoration Projects, (Harman et.al. 2012). Furthermore, it is preferred that the evaluator be familiar with restoration design and construction.
IV. RAPID STREAM RESTORATION MONITORING PROTOCOL The rapid stream restoration monitoring protocol report consists of eight main sections: A) design approach, B) bankfull determination, C) limits of investigation, D) rapid stream restoration monitoring form, E) evaluation attribute definitions, F) monitoring procedures, G) limited stream measurements, and H) monitoring recommendations. If the evaluator was not responsible for the restoration design and/or implementation, the evaluator should contact the project designer and implementer to discuss the project design and
Rapid Stream Restoration Monitoring Protocol
U.S. Fish and Wildlife Service June 2014 Chesapeake Bay Field Office Page 3 of 24
construction. Prior to any field monitoring, the evaluator will review all previous baseline assessments, design, and monitoring reports. The evaluator will be familiar with the design characteristics, hydrologic and hydraulic assessments, restoration objectives, project constraints and limitations, and restoration design criteria. A. DESIGN APPROACH
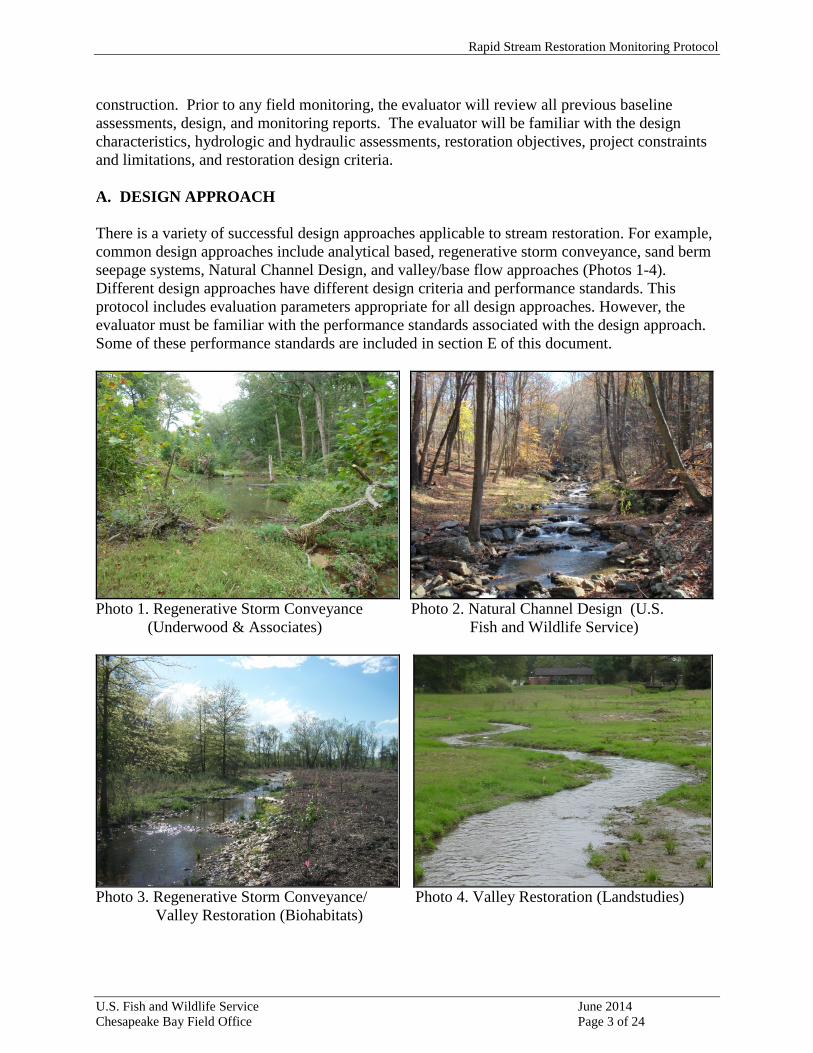
There is a variety of successful design approaches applicable to stream restoration. For example, common design approaches include analytical based, regenerative storm conveyance, sand berm seepage systems, Natural Channel Design, and valley/base flow approaches (Photos 1-4). Different design approaches have different design criteria and performance standards. This protocol includes evaluation parameters appropriate for all design approaches. However, the evaluator must be familiar with the performance standards associated with the design approach. Some of these performance standards are included in section E of this document.
Photo 1. Regenerative Storm Conveyance Photo 2. Natural Channel Design (U.S. (Underwood & Associates) Fish and Wildlife Service)
Photo 3. Regenerative Storm Conveyance/ Photo 4. Valley Restoration (Landstudies) Valley Restoration (Biohabitats)

Rapid Stream Restoration Monitoring Protocol
U.S. Fish and Wildlife Service June 2014 Chesapeake Bay Field Office Page 4 of 24
B. BANKFULL DETERMINATION AND HYDRAULIC ASSESSMENT
In some restoration approaches (i.e. Natural Channel Design and conveyance channels), the identification of bankfull is crucial to success. Bankfull discharge is the discharge (or range of discharges) responsible for the formation and maintenance of the stream channel dimensions, planform patterns and longitudinal profile. The stream typically develops bankfull field indicator(s), such as a significant slope break or floodplain feature, along the stream banks at the bankfull stage (Figure 1). An accurate determination of the bankfull indicator(s) is a critical aspect of stream restoration project evaluation because evaluators will use bankfull to assess stream stability and function and collect stream measurements.
Figure 1. Potential Bankfull Indicators (McCandless and Everett 2002)
To ensure an accurate determination of bankfull, the evaluator will compare bankfull field indicators with bankfull data/information provided in any available assessment and design reports. The evaluator will compare the bankfull information with gage station data and available regional bankfull curves. In addition to bankfull discharge and indicators, the evaluator must be familiar with baseflow, low flow (e.g. low flow bench), floodplain, and floodprone channel characteristics. Proper identification and interpretation of these stream features are important for evaluating channel stability and the functional success of the restoration project. C. LIMITS OF INVESTIGATION
The evaluation area dictates the limits of investigation. The monitoring reach should start and end at the point where the restoration has no visible influence on the stream. Typically, the monitoring reach will start upstream at the beginning of the restoration and extend downstream beyond the end of the restoration, to the point where there are no visible indications that the restoration is influencing the stream. For example, the monitoring reach would extend to include
Rapid Stream Restoration Monitoring Protocol
U.S. Fish and Wildlife Service June 2014 Chesapeake Bay Field Office Page 5 of 24
any erosion resulting from bank revetments, even if the erosion occurs downstream of the original project limits. If the restoration is influencing the stream beyond the upstream project limit, such as backwater and deposition resulting from an instream structure, the monitoring reach will begin at the upstream limit of the deposition. The evaluator should include the entire monitoring reach for evaluation, including areas that are currently stable and functioning. This will ensure documentation of any areas that change from stable to unstable in future years due to restoration elements.
D. RAPID STREAM RESTORATION MONITORING FORM
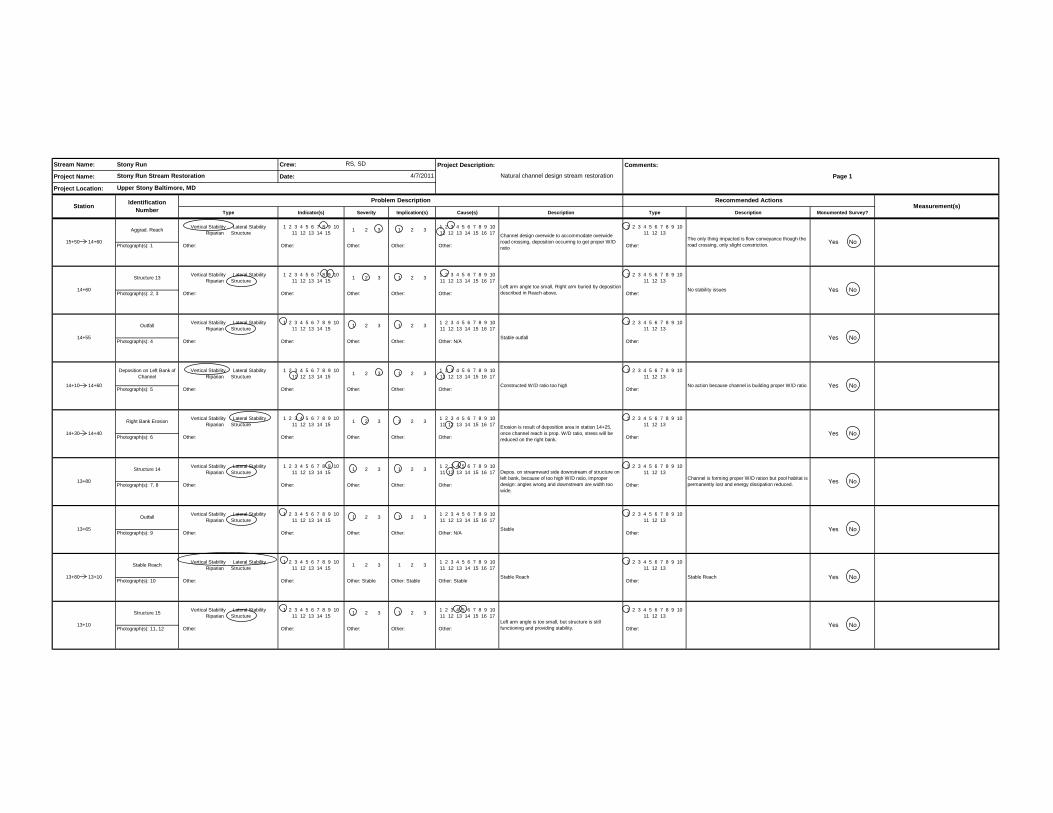
The Service prepared a rapid stream restoration monitoring form (monitoring form) to assist with efficiency and consistency of the monitoring survey (Figure 2). For discussion purposes, the Service has divided the monitoring form into six general sections: 1) project information, 2) station identification, 3) problem description, 4) recommended actions, 5) measurements, and 6) evaluation attributes. Detailed descriptions of terminology used in the form are in section E of this document. The monitoring form includes the most common situations that an evaluator would encounter during a monitoring survey. However, if the monitoring form does not accurately describe or evaluate the situation, the evaluator should provide a description in the description spaces provided on the form. Examples of a blank and completed monitoring form are located in Appendix A. 1. Project Information
This section allows the evaluator to record general information about the restoration project such as the project name, location, and description. For more complicated or larger restoration projects the evaluator may wish to divide the project into smaller reaches and provide descriptions for each of the smaller reaches.
2. Station Identification This section allows the evaluator to record the specific station or station interval (e.g. Station 0+00 to 1+00) that the evaluator is assessing. In most situations, the evaluator will use a station interval. However, the evaluator may use a specific station when assessing a discrete location, such as an outfall. If the evaluator is only assessing one stream bank or assessing each bank separately, it is important to identify which bank the evaluator is assessing. For

Rapid Stream Restoration Monitoring Protocol
U.S. Fish and Wildlife Service June 2014 Chesapeake Bay Field Office Page 6 of 24
Figure 2. Rapid Stream Restoration Monitoring Form
Project Information
Measurements
Problem Description Station Identification Recommended Actions

Rapid Stream Restoration Monitoring Protocol
U.S. Fish and Wildlife Service June 2014 Chesapeake Bay Field Office Page 7 of 24
consistency, this protocol will determine the left and right bank while facing downstream. This section also allows the evaluator to record a unique identification number that the evaluator will also record on the restoration plan and/or geomorphic map. The Service also provides a space for recording photograph numbers and descriptions.
3. Problem Description This section allows the evaluator to give a detailed and standardized description of the problem. There are multiple components to the problem description portion of the protocol. First, the section allows the evaluator to describe the type (i.e., vertical stability, lateral stability, riparian condition, and structure) and indicator(s) of the problem. The functional and structural-based evaluation attributes of the indicators associated with each type are described in more detail in section E of this document. If multiple problems are present in a reach, the Service recommends that the evaluator complete a separate description of each problem. In addition, the evaluator should complete a separate description if the area is stable. The Problem Description section also describes the severity and implications of the problem. The severity is a description of the magnitude of the problem (i.e. localized or wide spread) and the persistence of the problem (i.e. temporary or permanent). The implication of the problem describes the potential trend of the problem. The evaluator will predict whether the problem will improve over time, get worse over time, or require immediate remediation. The evaluator will also have an opportunity to identify the apparent cause of the problem. The monitoring form provides additional space for the evaluator to record a more detailed description of the problem. The information from the Problem Description portion of the assessment will determine restoration success and guide further actions.
4. Recommended Actions
This section allows the evaluator to recommend no action, additional monitoring, or suggest corrective action(s) to remediate the problem. The evaluator should be familiar with the recommendation thresholds discussed in the Monitoring Recommendations section of this report (section H).
5. Measurements This section allows the evaluator to record any field measurements necessary to evaluate the restoration project. A list of common field measurements is in the evaluation attribute table located on the back of the monitoring form. In some cases, it may be necessary for the evaluator to develop dimensionless ratios and/or compare the field measurements to the design criteria
6. Evaluation Attributes This section provides a table with a description of the numeric attributes used in the monitoring form, and provides a list of common field measurements that may be useful in

Rapid Stream Restoration Monitoring Protocol
U.S. Fish and Wildlife Service June 2014 Chesapeake Bay Field Office Page 8 of 24
1 1 1 1 Wbfk
2 2 2 2 Dbkf
3 3 3 3 Wbkf/Dbkf
4 4 4 4 Wac
5 5 5 5 Dac
6 6 6 6 Wfp
7 7 7 E
8 8 8 Lm
9 9 9 Wblt
10 10 10 MWR
11 11 K
12 Rc
13 Rc/Wbkf
14 BHR
15 Save
1 1 1 1 Sfacet
2 2 2 2 BEHI
3 3 3 3 NBS
1 1 1 1 D50
2 2 2 2 D84
3 3 3 3 Dbar
Bed Particle Size (84th Percentile) (mm)
Immediate concern; will cause further damage and contribute to other problems
Immediated concern; will cause further damage and contribute to other problems
Immediated concern; will cause further damage and contribute to other problems
Immediated concern; will cause further damage and contribute to other problems
Largest Particle Size on Bar (mm)
Impl
icat
ion(
s)
Not expected to worsen or cause further problems; may stabilize over time
Not expected to worsen or cause further problems; may stabilize over time
Not expected to worsen or cause further problems; may stabilize over time
Not expected to worsen or cause further problems; may stabilize over time
Bed Particle Size (50th Percentile) (mm)
Expected to worsen over time Expected to worsen over time Expected to worsen over time Expected to worsen over time
Localized, moderate bank erosion; moderate loss of bank material; BEHI and NBS have a rating of moderate
Localized riparian degradationPartial failure of structure; minimally functioning as intended
Dominant Bank Erosion Hazard Index
Widespread scour or bar formation; extensive changes to bed characteristics
Widespread failure of entire bank; bank actively eroding and substantial loss of bank material; BEHI and NBS have a rating of high or greater
Widespread riparian degradation
Complete structural failure; no longer functioning as intended
Dominant Near Bank Shear Stress (specify method used to determine NBS)
Other Reach Average Stream Slope
Seve
rity
Temporary scour or deposition formation
Localized bank erosion; minor loss of bank material; BEHI and/or NBS have a rating of low or less
Temporary riparian degredation Minor stress on the structure; still functioning as intended Facet Slope
Localized scour or bar formation; minor changes to bed characteristic
Aggradation Radius of Curvature (ft)
Increase in entrenchment Ratio of Curvature to Bankfull Width
Decrease in entrenchment Bank Height Ratio
Decrease in facet slope OtherAccelerated lateral scour upstream/downstream of the structure
Meander Width Ratio
Deposition/Bar Development Other Sinuousity
Poor pool depth variablity Bank deposition Accelerated deposition in pool Meander Length (ft)
Poorly defined facet features Dominant BEHI and NBS rating of moderate or greater Buried structure Beltwidth (ft)
Incorrect pool-to-pool spacing Cutoff channel development Other Accelerated vertical scour/exposed footer rocks Floodprone Width (ft)
Increase in facet slope Loss of bank vegetationAccelerated lateral scour/scour along deposition area at the structure
Entrenchment Ratio
Decrease bank height ratio Lateral scour/undercut Poor riparian survvial Flow piping through structure Active Channel Width (ft)
Scour Planform/radius of curvature adjustments Poor riparian width Lack of adequeate pool
depth/pool formation Active Channel Depth (ft)
Bankfull Depth (ft)
Increase bank height ratio Increase in meander width ratio Invasive species present Unstable/repositioned structure rocks Width/Depth Ratio
Prob
lem
Incd
icat
or(s
)
None (no problem indicators) None (no problem indicators) None (no problem indicators) None (no problem indicators) Bankfull Width (ft)
Degradation Decrease in meander width ratio Bare ground present Collapsed structure
RAPID STREAM MONITORING EVALUATION ATTRIBUTESVertical Stability Lateral Stability Riparian Condition Structure Measurements
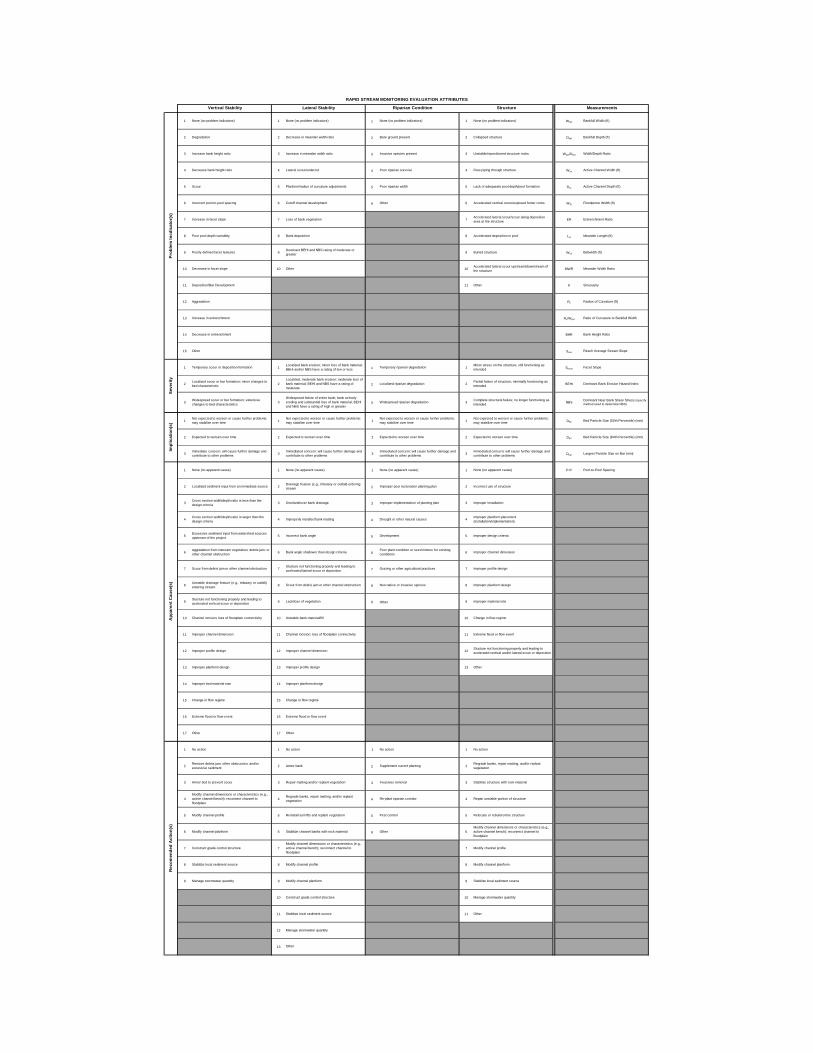
evaluating the restoration project. The attributes are listed in a table format and are assigned numeric values that will be used in the monitoring form to describe the condition of the restoration project. The evaluation attributes are located on the back of the monitoring form. The attribute table is presented in a similar format as the monitoring form and is partitioned by problem type (i.e. vertical stability, lateral stability, etc). Each problem type is divided into five evaluation attribute categories: 1) Problem Indicator(s), 2) Severity, 3) Implication(s), 4) Apparent Cause(s), and 5) Recommended Action(s). Definitions of the evaluation attributes are in the Evaluation Attribute Definitions section of this report (section E). Figure 3 is a partial evaluation attributes table. A complete attribute table is located in Appendix A.
Figure 3. Partial Evaluation Attributes Table
Measurement Description
Problem Types
Evaluation Attribute Categories

Rapid Stream Restoration Monitoring Protocol
U.S. Fish and Wildlife Service June 2014 Chesapeake Bay Field Office Page 9 of 24
E. EVALUATION ATTRIBUTE DEFINITIONS
Although stream restoration practitioners commonly use the evaluation attributes selected for the protocol, the Service has elaborated on several terms to improve interpretation and data collection consistency. The performance measures provided are from the document: A Function-Based Framework for Stream Assessment and Restoration Projects, (Harman et.al. 2012). 1. Vertical Stability Description Parameters associated with vertical stability typically refer to conditions of the streambed, and include measurements that describe sediment transport and floodplain connectivity. a) Bedform Diversity Parameters
Monitoring sediment transport processes will allow an evaluator to determine whether a stream reach is stable, aggrading or degrading. The simplest way to measure sediment transport is by using parameters that describe bedform diversity.
i. Pool-to-pool Spacing: Pool-to-pool spacing measures the frequency of pools in the stream reach (Figure 4). The measurement is a distance, measured along the centerline, between the deepest points of two pools. The value is converted into a dimensionless ratio by dividing the distance by the bankfull riffle width. Severe bank erosion tends to occur when pool-to-pool spacing ratio is less than three or greater than eight. As pool-to-pool spacing in a stream increases, the risk of bed instability increases. A summary of pool-to-pool spacing ratios are located in Table 1.
Figure 4. Pool-to-Pool Spacing (Harman et. al. 2012)

Rapid Stream Restoration Monitoring Protocol
U.S. Fish and Wildlife Service June 2014 Chesapeake Bay Field Office Page 10 of 24
Table 1. Pool-to-Pool Spacing Ratio Summary
Pool-to-Pool Spacing Ratio
Stability Rating Functioning Functioning-
At-Risk Not Functioning
Perennial Streams in Alluvial Valleys (C,E Stream Types) Watersheds > 10 mi2
5.0 to 7.0 3.5 to 5.0 and 5.0 to 7.0
<3.0 and > 7.0
Watersheds < 10 mi2
>1.5 1.2 to 5.0 and 7.0 to 8.0
<3.5 and >8.0
Moderate Gradient Perennial Streams in Colluvial Valleys (B Stream Types) Slope Between 3 and 5%
2.0 to 4.0 4.0 to 6.0 >6.0
ii. Depth Variability: Depth variability compares pool and riffle depths. Depth
variability is determined by measuring pool depth at the bankfull stage in each pool along the reach, and dividing these depths by the representative mean riffle depth at the bankfull stage. This measurement is the Pool Max Depth ratio. Since depth variability is an indicator of how the stream is processing sediment, if the ratios are similar (i.e. < 1.2) that indicates that the pools are of the same depth as the riffles and are likely filling with sediment. It is preferable to have a range of ratios. Common depth variability ratios are in Table 2.
Table 2. Depth Variability Ratio Summary Depth Variability Ratio
Stability Rating Functioning Functioning-
At-Risk Not Functioning
Perennial Streams in Alluvial Valleys (C,E Stream Types) Gravel Bed Streams
>1.5 1.2 to 1.5 <1.2
Sand Bed Streams
>1.2 1.1 to 1.2 <1.1
Moderate Gradient Perennial Streams in Colluvial Valleys (B Stream Types) >1.5 1.2 to 1.5 <1.2
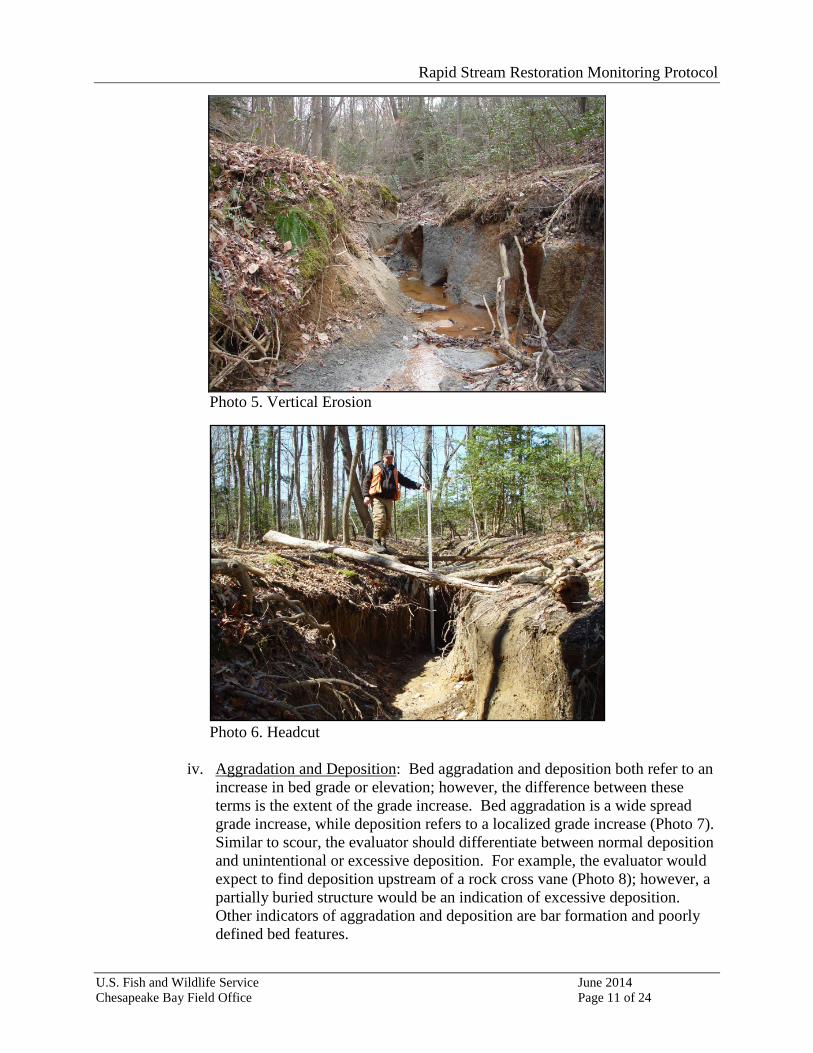
iii. Degradation and Scour: Bed degradation and scour both refer to vertical
erosion or loss of bed grade or elevation (Photo 5); however, the difference between these terms is the extent of vertical erosion. Bed degradation refers to wide spread bed grade loss, while scour refers to localized grade loss. When determining bed scour, the evaluator should differentiate between normal bed scour and unintentional or excessive scour. For example, the evaluator would expect to find scour downstream of an outfall; however, an indication of excessive scour is an advancing headcut (Photo 6) that is threatening to undermine the outfall. Poorly defined bed features are often associated with degradation and scour.
Rapid Stream Restoration Monitoring Protocol
U.S. Fish and Wildlife Service June 2014 Chesapeake Bay Field Office Page 11 of 24
Photo 5. Vertical Erosion
Photo 6. Headcut
iv. Aggradation and Deposition: Bed aggradation and deposition both refer to an increase in bed grade or elevation; however, the difference between these terms is the extent of the grade increase. Bed aggradation is a wide spread grade increase, while deposition refers to a localized grade increase (Photo 7). Similar to scour, the evaluator should differentiate between normal deposition and unintentional or excessive deposition. For example, the evaluator would expect to find deposition upstream of a rock cross vane (Photo 8); however, a partially buried structure would be an indication of excessive deposition. Other indicators of aggradation and deposition are bar formation and poorly defined bed features.

Rapid Stream Restoration Monitoring Protocol
U.S. Fish and Wildlife Service June 2014 Chesapeake Bay Field Office Page 12 of 24
Photo 7. Widespread Aggradation
Photo 8. Appropriate Structure Deposition
v. Facet slope Increase or Decrease: Facet slopes measurements are indicators of the quality and stability of the bedform. In a functioning system, the evaluator would expect to see steep, shallow riffles and flat pools. However, extremes in the facet slopes can indicate bed degradation or aggradation. For example, if riffles become too steep, larger particles are transported downstream, leading to degradation. In addition, although pools should be relatively flat, if the pool slope approaches zero this is an indicator that the pool may be more likely to fill. These measures are also related to pool-to-pool spacing. For example, as facet slope increases pool-to-pool spacing decreases (Harman et.al. 2012).
Rapid Stream Restoration Monitoring Protocol
U.S. Fish and Wildlife Service June 2014 Chesapeake Bay Field Office Page 13 of 24
Height of Low Bank
Max Bankfull Depth
Bank Height RatioBHR = Height of Low Bank / Max Bankfull Depth
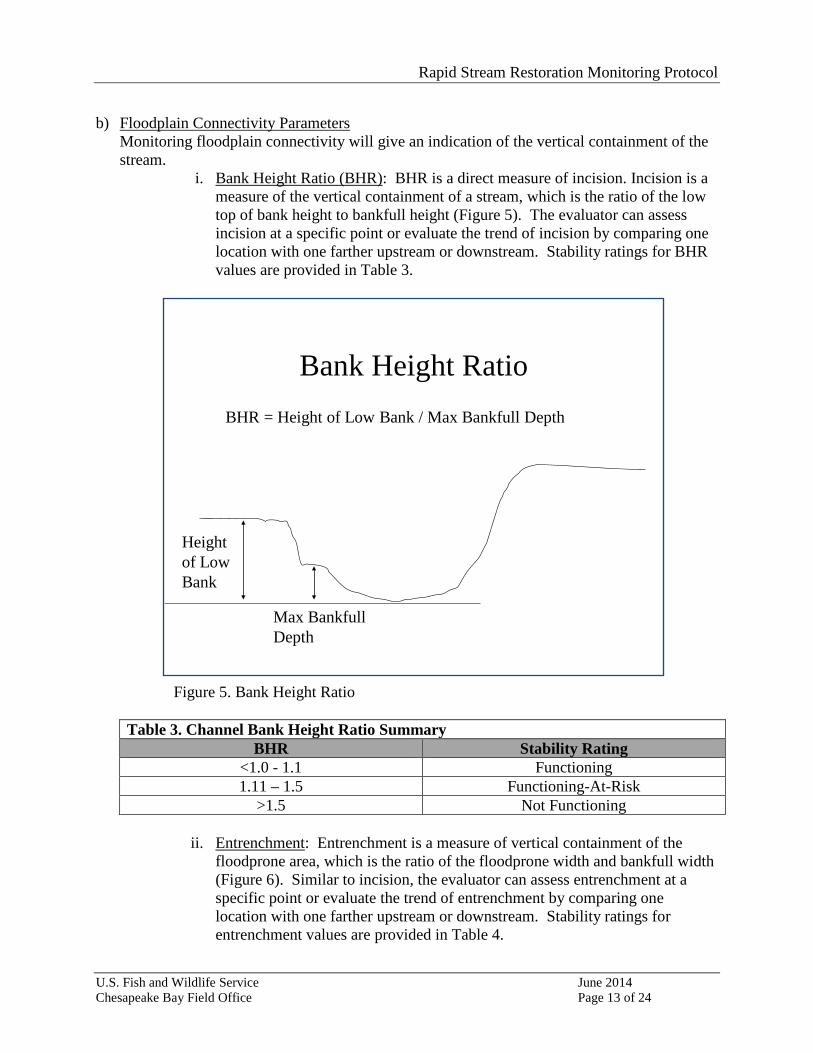
b) Floodplain Connectivity Parameters
Monitoring floodplain connectivity will give an indication of the vertical containment of the stream.
i. Bank Height Ratio (BHR): BHR is a direct measure of incision. Incision is a measure of the vertical containment of a stream, which is the ratio of the low top of bank height to bankfull height (Figure 5). The evaluator can assess incision at a specific point or evaluate the trend of incision by comparing one location with one farther upstream or downstream. Stability ratings for BHR values are provided in Table 3.
Figure 5. Bank Height Ratio
Table 3. Channel Bank Height Ratio Summary BHR Stability Rating
<1.0 - 1.1 Functioning 1.11 – 1.5 Functioning-At-Risk
>1.5 Not Functioning
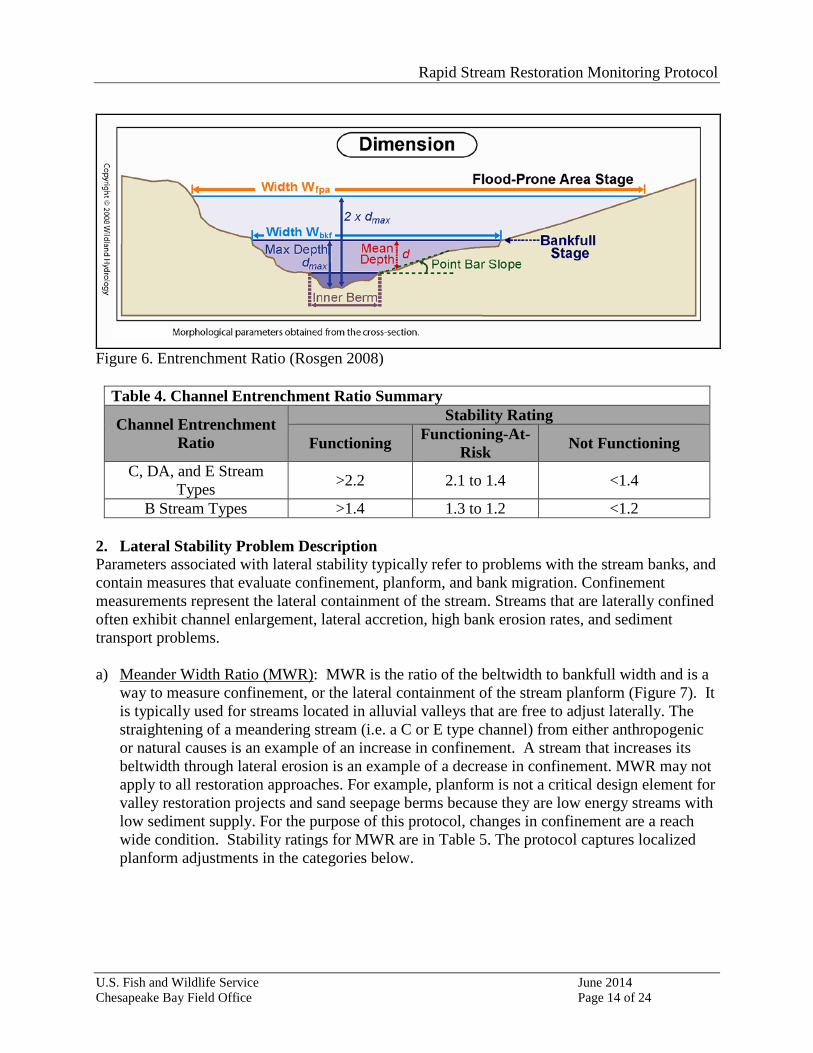
ii. Entrenchment: Entrenchment is a measure of vertical containment of the floodprone area, which is the ratio of the floodprone width and bankfull width (Figure 6). Similar to incision, the evaluator can assess entrenchment at a specific point or evaluate the trend of entrenchment by comparing one location with one farther upstream or downstream. Stability ratings for entrenchment values are provided in Table 4.
Rapid Stream Restoration Monitoring Protocol
U.S. Fish and Wildlife Service June 2014 Chesapeake Bay Field Office Page 14 of 24
Figure 6. Entrenchment Ratio (Rosgen 2008)
Table 4. Channel Entrenchment Ratio Summary
Channel Entrenchment Ratio
Stability Rating
Functioning Functioning-At-Risk Not Functioning
C, DA, and E Stream Types >2.2 2.1 to 1.4 <1.4
B Stream Types >1.4 1.3 to 1.2 <1.2
2. Lateral Stability Problem Description Parameters associated with lateral stability typically refer to problems with the stream banks, and contain measures that evaluate confinement, planform, and bank migration. Confinement measurements represent the lateral containment of the stream. Streams that are laterally confined often exhibit channel enlargement, lateral accretion, high bank erosion rates, and sediment transport problems. a) Meander Width Ratio (MWR): MWR is the ratio of the beltwidth to bankfull width and is a
way to measure confinement, or the lateral containment of the stream planform (Figure 7). It is typically used for streams located in alluvial valleys that are free to adjust laterally. The straightening of a meandering stream (i.e. a C or E type channel) from either anthropogenic or natural causes is an example of an increase in confinement. A stream that increases its beltwidth through lateral erosion is an example of a decrease in confinement. MWR may not apply to all restoration approaches. For example, planform is not a critical design element for valley restoration projects and sand seepage berms because they are low energy streams with low sediment supply. For the purpose of this protocol, changes in confinement are a reach wide condition. Stability ratings for MWR are in Table 5. The protocol captures localized planform adjustments in the categories below.

Rapid Stream Restoration Monitoring Protocol
U.S. Fish and Wildlife Service June 2014 Chesapeake Bay Field Office Page 15 of 24
Figure 7. Meander Width Ratio (Harman et. al. 2012)
Table 5. Meander Width Ratio Summary
MWR for C and E Stream Types Stability Rating ≥ 3.5 Functioning
3.0 to 3.5 Functioning-At-Risk >1.5 Not Functioning
b) Planform Adjustments
Although planform adjustments affect stream confinement, the attributes described below refer to localized planform adjustments.
i. Radius of Curvature Adjustments: Changes in radius of curvature indicate
planform adjustments. It is the measure of the tightness of an individual meander bend and is expressed as a ratio to the bankfull channel width (Rosgen 2008)(Figure 8).
Figure 8. Radius of Curvature (Rosgen 2008)

Rapid Stream Restoration Monitoring Protocol
U.S. Fish and Wildlife Service June 2014 Chesapeake Bay Field Office Page 16 of 24
ii. Cutoff Channel Development: A stream with very tight meander bends and small radius of curvature measurements can start to develop cutoff channels.
c) Bank Migration
Bank migration parameters are a function of bank materials, vegetative cover, and in-stream hydraulic forces. These parameters address erosion potential of the stream banks.
i. BEHI/NBS: Combinations of Bank Erodabilty Hazard Index (BEHI) and Near Bank Stress (NBS) assess the bank’s potential to erode and the shear stress placed on the bank. BEHI incorporates simple measurements and visual observation to determine the bank erodability potential while NBS involves observations of channel flow characteristics to assess the bank shear stress. When these two assessments are combined, a loss of bank (in linear feet) can be predicted on an annual basis using bank erosion rate curves. The ratings for both BEHI and NBS range from very low to extreme. The measurements can be a quantative measure of every bank following the methods described in A Watershed Assessment for River Stability and Sediment Supply (WARSSS) (Rosgen 2006) or more rapidly through qualitative predictions. Table 6 illustrates the functional categories for BEHI/NBS combinations.
Table 6. BEHI/NBS Summary
BEHI Rating Stability Rating
Functioning Functioning-At-Risk Not Functioning
Low BEHI Rating Very Low to Moderate NBS
Moderate to Very High NBS Extreme NBS
Moderate BEHI Rating Very Low to Low NBS
Low to High NBS High to Extreme NBS
High and Very High BEHI Rating N/A Low to Moderate
NBS Moderate to Extreme
NBS Extreme BEHI Rating N/A Low NBS Low to Extreme NBS
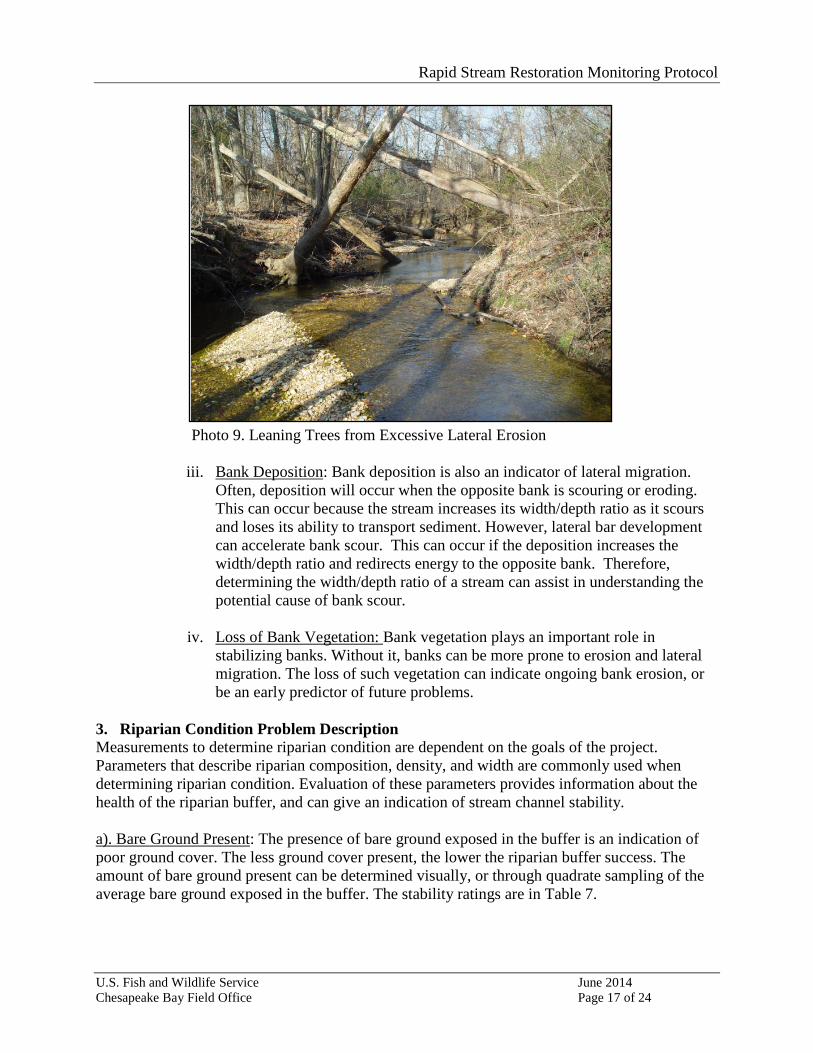
ii. Lateral Scour or Undercut: Presence of lateral scour is a visual determination of current or potential bank migration. The rate of scour or undercut will determine the severity of the lateral adjustment. Bank scour is severe if the rate of scour resulted in the stream not being able to maintain its channel dimensions (i.e., width and depth). In this case, an evaluator would notice that the stream has a high width/depth ratio. Another example of severe bank scour is the loss of riparian vegetation or streamward leaning trees (Photo 9).
Rapid Stream Restoration Monitoring Protocol
U.S. Fish and Wildlife Service June 2014 Chesapeake Bay Field Office Page 17 of 24
Photo 9. Leaning Trees from Excessive Lateral Erosion
iii. Bank Deposition: Bank deposition is also an indicator of lateral migration. Often, deposition will occur when the opposite bank is scouring or eroding. This can occur because the stream increases its width/depth ratio as it scours and loses its ability to transport sediment. However, lateral bar development can accelerate bank scour. This can occur if the deposition increases the width/depth ratio and redirects energy to the opposite bank. Therefore, determining the width/depth ratio of a stream can assist in understanding the potential cause of bank scour.
iv. Loss of Bank Vegetation: Bank vegetation plays an important role in stabilizing banks. Without it, banks can be more prone to erosion and lateral migration. The loss of such vegetation can indicate ongoing bank erosion, or be an early predictor of future problems.
3. Riparian Condition Problem Description Measurements to determine riparian condition are dependent on the goals of the project. Parameters that describe riparian composition, density, and width are commonly used when determining riparian condition. Evaluation of these parameters provides information about the health of the riparian buffer, and can give an indication of stream channel stability.
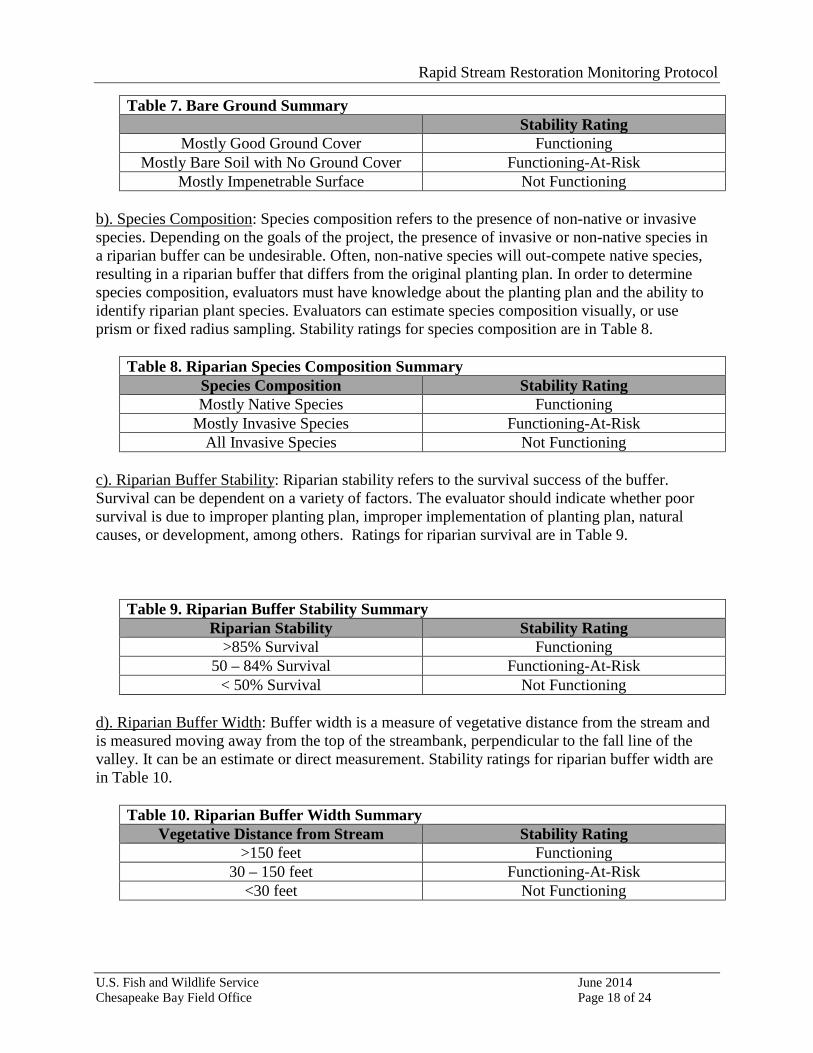
a). Bare Ground Present: The presence of bare ground exposed in the buffer is an indication of poor ground cover. The less ground cover present, the lower the riparian buffer success. The amount of bare ground present can be determined visually, or through quadrate sampling of the average bare ground exposed in the buffer. The stability ratings are in Table 7.
Rapid Stream Restoration Monitoring Protocol
U.S. Fish and Wildlife Service June 2014 Chesapeake Bay Field Office Page 18 of 24
Table 7. Bare Ground Summary Stability Rating
Mostly Good Ground Cover Functioning Mostly Bare Soil with No Ground Cover Functioning-At-Risk
Mostly Impenetrable Surface Not Functioning
b). Species Composition: Species composition refers to the presence of non-native or invasive species. Depending on the goals of the project, the presence of invasive or non-native species in a riparian buffer can be undesirable. Often, non-native species will out-compete native species, resulting in a riparian buffer that differs from the original planting plan. In order to determine species composition, evaluators must have knowledge about the planting plan and the ability to identify riparian plant species. Evaluators can estimate species composition visually, or use prism or fixed radius sampling. Stability ratings for species composition are in Table 8.
Table 8. Riparian Species Composition Summary Species Composition Stability Rating Mostly Native Species Functioning
Mostly Invasive Species Functioning-At-Risk All Invasive Species Not Functioning
c). Riparian Buffer Stability: Riparian stability refers to the survival success of the buffer. Survival can be dependent on a variety of factors. The evaluator should indicate whether poor survival is due to improper planting plan, improper implementation of planting plan, natural causes, or development, among others. Ratings for riparian survival are in Table 9.
Table 9. Riparian Buffer Stability Summary Riparian Stability Stability Rating
>85% Survival Functioning 50 – 84% Survival Functioning-At-Risk
< 50% Survival Not Functioning
d). Riparian Buffer Width: Buffer width is a measure of vegetative distance from the stream and is measured moving away from the top of the streambank, perpendicular to the fall line of the valley. It can be an estimate or direct measurement. Stability ratings for riparian buffer width are in Table 10.
Table 10. Riparian Buffer Width Summary Vegetative Distance from Stream Stability Rating
>150 feet Functioning 30 – 150 feet Functioning-At-Risk
<30 feet Not Functioning
Rapid Stream Restoration Monitoring Protocol
U.S. Fish and Wildlife Service June 2014 Chesapeake Bay Field Office Page 19 of 24
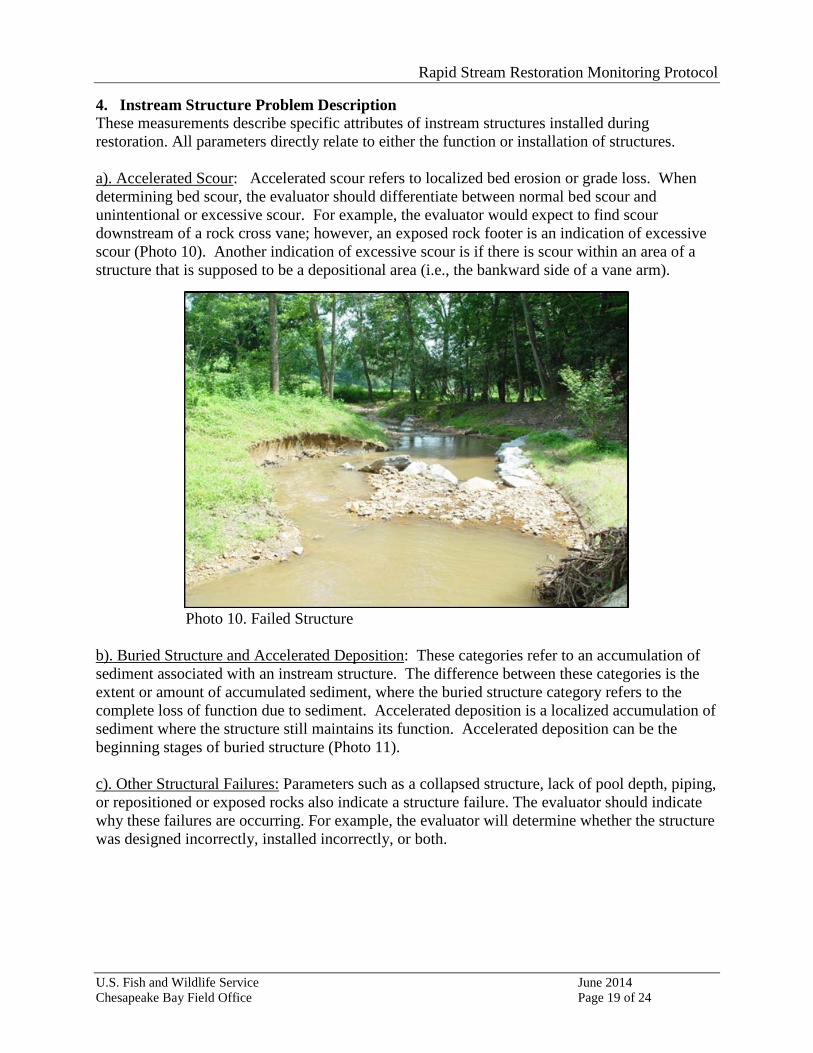
4. Instream Structure Problem Description These measurements describe specific attributes of instream structures installed during restoration. All parameters directly relate to either the function or installation of structures. a). Accelerated Scour: Accelerated scour refers to localized bed erosion or grade loss. When determining bed scour, the evaluator should differentiate between normal bed scour and unintentional or excessive scour. For example, the evaluator would expect to find scour downstream of a rock cross vane; however, an exposed rock footer is an indication of excessive scour (Photo 10). Another indication of excessive scour is if there is scour within an area of a structure that is supposed to be a depositional area (i.e., the bankward side of a vane arm).
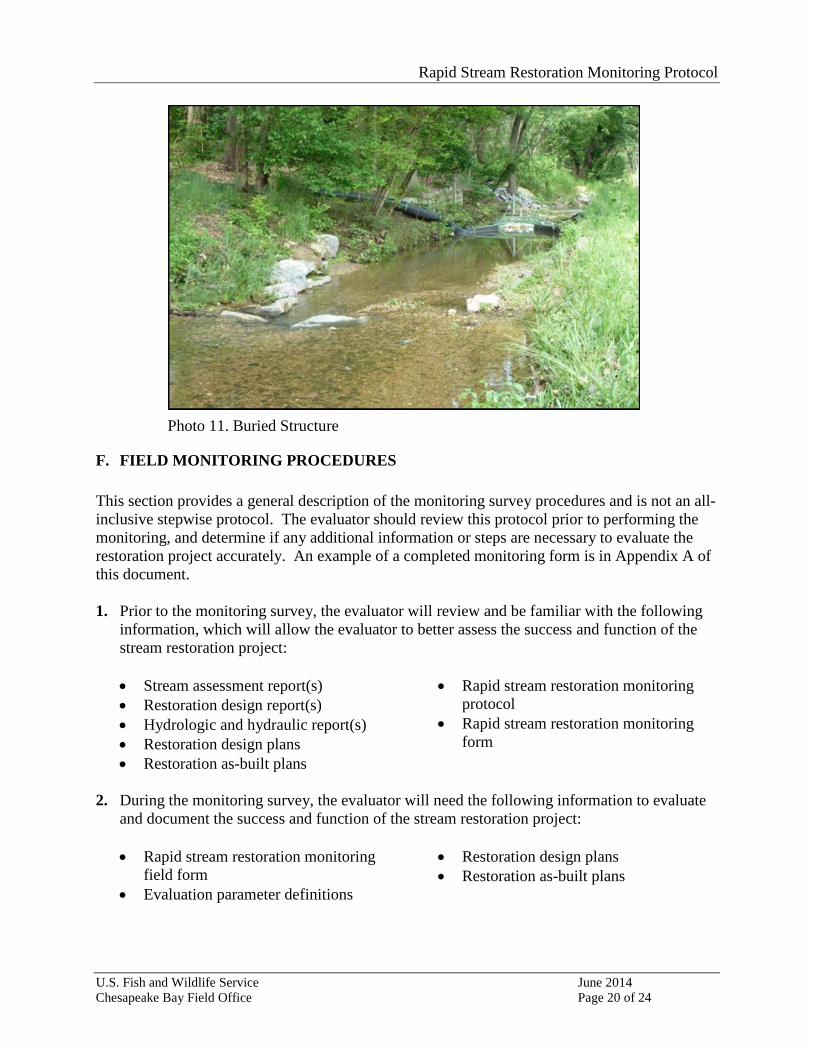
Photo 10. Failed Structure b). Buried Structure and Accelerated Deposition: These categories refer to an accumulation of sediment associated with an instream structure. The difference between these categories is the extent or amount of accumulated sediment, where the buried structure category refers to the complete loss of function due to sediment. Accelerated deposition is a localized accumulation of sediment where the structure still maintains its function. Accelerated deposition can be the beginning stages of buried structure (Photo 11). c). Other Structural Failures: Parameters such as a collapsed structure, lack of pool depth, piping, or repositioned or exposed rocks also indicate a structure failure. The evaluator should indicate why these failures are occurring. For example, the evaluator will determine whether the structure was designed incorrectly, installed incorrectly, or both.
Rapid Stream Restoration Monitoring Protocol
U.S. Fish and Wildlife Service June 2014 Chesapeake Bay Field Office Page 20 of 24
Photo 11. Buried Structure
F. FIELD MONITORING PROCEDURES
This section provides a general description of the monitoring survey procedures and is not an all-inclusive stepwise protocol. The evaluator should review this protocol prior to performing the monitoring, and determine if any additional information or steps are necessary to evaluate the restoration project accurately. An example of a completed monitoring form is in Appendix A of this document. 1. Prior to the monitoring survey, the evaluator will review and be familiar with the following
information, which will allow the evaluator to better assess the success and function of the stream restoration project:
• Stream assessment report(s) • Restoration design report(s) • Hydrologic and hydraulic report(s) • Restoration design plans • Restoration as-built plans
• Rapid stream restoration monitoring protocol
• Rapid stream restoration monitoring form
2. During the monitoring survey, the evaluator will need the following information to evaluate
and document the success and function of the stream restoration project:
• Rapid stream restoration monitoring field form
• Evaluation parameter definitions
• Restoration design plans • Restoration as-built plans
Rapid Stream Restoration Monitoring Protocol
U.S. Fish and Wildlife Service June 2014 Chesapeake Bay Field Office Page 21 of 24
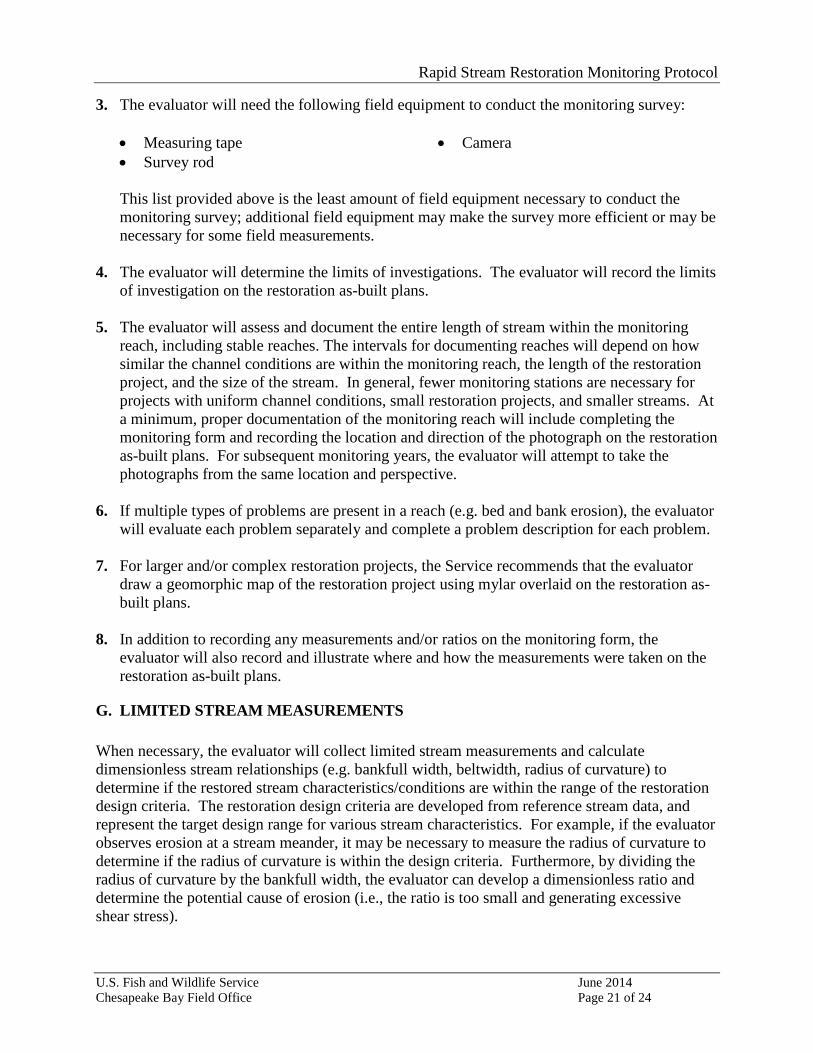
3. The evaluator will need the following field equipment to conduct the monitoring survey:
• Measuring tape • Survey rod
• Camera
This list provided above is the least amount of field equipment necessary to conduct the monitoring survey; additional field equipment may make the survey more efficient or may be necessary for some field measurements.
4. The evaluator will determine the limits of investigations. The evaluator will record the limits
of investigation on the restoration as-built plans. 5. The evaluator will assess and document the entire length of stream within the monitoring
reach, including stable reaches. The intervals for documenting reaches will depend on how similar the channel conditions are within the monitoring reach, the length of the restoration project, and the size of the stream. In general, fewer monitoring stations are necessary for projects with uniform channel conditions, small restoration projects, and smaller streams. At a minimum, proper documentation of the monitoring reach will include completing the monitoring form and recording the location and direction of the photograph on the restoration as-built plans. For subsequent monitoring years, the evaluator will attempt to take the photographs from the same location and perspective.
6. If multiple types of problems are present in a reach (e.g. bed and bank erosion), the evaluator
will evaluate each problem separately and complete a problem description for each problem.
7. For larger and/or complex restoration projects, the Service recommends that the evaluator draw a geomorphic map of the restoration project using mylar overlaid on the restoration as-built plans.
8. In addition to recording any measurements and/or ratios on the monitoring form, the
evaluator will also record and illustrate where and how the measurements were taken on the restoration as-built plans.
G. LIMITED STREAM MEASUREMENTS
When necessary, the evaluator will collect limited stream measurements and calculate dimensionless stream relationships (e.g. bankfull width, beltwidth, radius of curvature) to determine if the restored stream characteristics/conditions are within the range of the restoration design criteria. The restoration design criteria are developed from reference stream data, and represent the target design range for various stream characteristics. For example, if the evaluator observes erosion at a stream meander, it may be necessary to measure the radius of curvature to determine if the radius of curvature is within the design criteria. Furthermore, by dividing the radius of curvature by the bankfull width, the evaluator can develop a dimensionless ratio and determine the potential cause of erosion (i.e., the ratio is too small and generating excessive shear stress).

Rapid Stream Restoration Monitoring Protocol
U.S. Fish and Wildlife Service June 2014 Chesapeake Bay Field Office Page 22 of 24
When collecting the stream measurements, the evaluator will follow standard survey techniques such as those presented in the manuals Stream channel reference sites: An illustrated guide to field technique (Harrelson et al. 1994), and River Stability Field Guide (Rosgen 2008). A list of common stream measurement and dimensionless ratios are provided in Appendix A. However, the evaluator should not be limited by this list. If there are other measurements that could assist the evaluator in assessing the project, the evaluator should take those measurements.
H. MONITORING RECOMMENDATIONS
Regardless of the rapid monitoring results, the rapid monitoring survey should be conducted every year within the required monitoring period. If results of the rapid survey indicate potential structural or functional failure, the protocol requires that the project evaluator conduct a more intensive monitoring survey. During the more intensive survey, the Service proposes that project evaluators take measurements of the existing stream conditions and compare them to the proposed design criteria data to determine if remediation is required. Depending on the severity of the problems, this action can take two forms. The evaluator can recommend either a partially or fully monumented stream survey of the project reach. Regardless of the method selected, there are two possible outcomes. If the measurements are not outside of design criteria but there is potential for the stream to evolve outside of the criteria, then the evaluator should continue the monumented surveys to determine the stability trend over time. In this case, the evaluator does not move to remediation unless conditions evolve outside of the design criteria. However, if the measurements are outside of design criteria then remediation is required. As of the issuance of this report, the Service has not prepared protocols for the more intensive monitoring surveys. However, this protocol has provided some guidance on when to make these recommendations. The criteria for determining whether to recommend additional monitoring or restoration repair are based on the severity of the stream adjustments and the potential consequences of the adjustments. The evaluator will recommend intensive monitoring if the adjustment is localized and does not pose a significant threat to the success or function of the restoration. The evaluator will recommend restoration repair if the adjustment is widespread and poses a significant threat to the success or function of the restoration. A significant threat is defined as any condition that would result in failure to achieve any of the restoration objectives, failure of a restoration technique (e.g. rock cross vane) to function as intended, or damage to property beyond the limits of the restoration. For example, an evaluator should consider undermining of a rock cross vane and loss of grade control a significant threat. Although the Service has provided recommendation guidance, the Service recognizes that the criteria are still general and subjective. However, the Service thinks that an experienced evaluator should easily be able to determine when repair is required.

Rapid Stream Restoration Monitoring Protocol
U.S. Fish and Wildlife Service June 2014 Chesapeake Bay Field Office Page 23 of 24
V. CONCLUSION
In recent years, there has been a strong emphasis by the restoration community to evaluate the success of stream restoration projects. However, time and financial constraints have often limited the opportunities to evaluate restoration projects. Restoration monitoring is critical in assessing whether the project achieved its restoration objective(s), improved restoration science to improve future restoration projects, and benefitted Federal Trust Resources. The Service developed this rapid stream restoration monitoring protocol to promote monitoring by reducing the financial and time demands necessary to evaluate the success of a project. It is not the intent of the Service to promote a rapid monitoring survey over a more intensive survey, but to develop an alternative that addresses the constraints that prevents monitoring. The purpose of this protocol is to evaluate the stability and functional success of a restoration project visually. Although this protocol relays primarily on observation, this protocol can effectively evaluate the success of a project and provide consistent and comparable results/recommendations when implemented by an experienced and prepared evaluator. In addition, the form and protocol are a “living document.” As long as there is an associated performance standard, the form can modified to add other indicators of instability.
Rapid Stream Restoration Monitoring Protocol
U.S. Fish and Wildlife Service June 2014 Chesapeake Bay Field Office Page 24 of 24
LITERATURE CITED
1. Harman, W.,R. Starr, M. Carter, K. Tweedy, M. Clemmons, K. Suggs, C. Miller. 2012. A
Function-Based Framework for Stream Assessment and Restoration Projects. U.S. Environmental Protection Agency, Office of Wetlands, Oceans, and Watersheds. Washington, D.C. EPA 843-K-12-006.
2. Harrelson, C.C., C.L. Rawlins, and J.P. Potyondy. 1994. Stream Channel Reference Sites:
An Illustrated Guide to Field Technique. U.S. Forest Service, Fort Collins, CO.
3. McCandless, T.L. & R.A. Everett. 2002. Maryland Stream Survey: Bankfull Discharge and Channel Characteristic of Streams in the Piedmont Hydrologic Region. U.S. Fish and Wildlife Service, CBFO-S02-01. Annapolis, MD.
4. Rosgen, D.L. 2006. A Watershed Assessment for River Stability and Sediment Supply
(WARSSS). Wildland Hydrology Books, Fort Collins, Colorado.
5. Rosgen, D.L. 2008. River Stability Field Guide. Wildland Hydrology. Fort Collins, CO.

APPENDIX A

Stream Name: Crew: Project Description: Comments:
Project Name: Date:
Project Location:
Type Indicator(s) Severity Implication(s) Cause(s) Description Type Description Monumented Survey?
Other: Other: Other: Other: Other: Other:
Other: Other: Other: Other: Other: Other:
Other: Other: Other: Other: Other: Other:
Other: Other: Other: Other: Other: Other:
Other: Other: Other: Other: Other: Other:
Other: Other: Other: Other: Other: Other:
Other: Other: Other: Other: Other: Other:
Other: Other: Other: Other: Other: Other:
Other: Other: Other: Other: Other: Other:
Yes No
Yes No
Yes No
Yes No
Yes No
Yes No
1 2 3 4 5 6 7 8 9 10 11 12 13
1 2 3 4 5 6 7 8 9 10 11 12 13
Yes No
Measurement(s)Recommended Actions
Yes No
Yes No
1 2 3 1 2 3
1 2 3 1 2 3 4 5 6 7 8 9 10 11 12 13 14 15 16 17
1 2 3 4 5 6 7 8 9 10 11 12 13 14 15 16 17
Vertical Stability Lateral Stability Riparian Structure
1 2 3 4 5 6 7 8 9 10 11 12 13 14 15
Photograph(s):
Photograph(s):
1 2 3 4 5 6 7 8 9 10 11 12 13
1 2 3
1 2 3 4 5 6 7 8 9 10 11 12 13 14 15 1 2 3Vertical Stability Lateral Stability
Riparian Structure
1 2 3 4 5 6 7 8 9 10 11 12 13
1 2 3 4 5 6 7 8 9 10 11 12 13
1 2 3 4 5 6 7 8 9 10 11 12 13 14 15 1 2 3 1 2 3
1 2 3
1 2 3 4 5 6 7 8 9 10 11 12 13 14 15 16 17
Vertical Stability Lateral Stability Riparian Structure
1 2 3 4 5 6 7 8 9 10 11 12 13 14 15
1 2 3 4 5 6 7 8 9 10 11 12 13 14 15 16 17
Photograph(s):
Vertical Stability Lateral Stability Riparian Structure
Vertical Stability Lateral Stability Riparian Structure
1 2 3 4 5 6 7 8 9 10 11 12 13 14 15
Photograph(s):
Photograph(s):
1 2 3 1 2 3
1 2 3 4 5 6 7 8 9 10 11 12 13 14 15 16 17
1 2 3 4 5 6 7 8 9 10 11 12 13
Photograph(s):
1 2 3 4 5 6 7 8 9 10 11 12 13 14 15 1 2 3 1 2 3 1 2 3 4 5 6 7 8 9 10
11 12 13 14 15 16 17
Photograph(s):
Vertical Stability Lateral Stability Riparian Structure
Vertical Stability Lateral Stability Riparian Structure
1 2 3 4 5 6 7 8 9 10 11 12 13 14 15
Problem Description
1 2 3 1 2 3 1 2 3 4 5 6 7 8 9 10 11 12 13 14 15 16 17
1 2 3 1 2 3 4 5 6 7 8 9 10 11 12 13
1 2 3 4 5 6 7 8 9 10 11 12 13 14 15 16 17
1 2 3 4 5 6 7 8 9 10 11 12 13
Photograph(s):
1 2 3Vertical Stability Lateral Stability Riparian Structure
1 2 3 4 5 6 7 8 9 10 11 12 13 14 15 16 17
Photograph(s):
Station Identification Number
1 2 3 4 5 6 7 8 9 10 11 12 13
1 2 3
Vertical Stability Lateral Stability Riparian Structure
1 2 3 4 5 6 7 8 9 10 11 12 13 14 15 1 2 3
1 2 3 4 5 6 7 8 9 10 11 12 13 14 15
Stream Name: Stony Run Crew: Project Description: Comments:
Project Name: Date:
Project Location:
Type Indicator(s) Severity Implication(s) Cause(s) Description Type Description Monumented Survey?
Other: Other: Other: Other: Other: Other:
Other: Other: Other: Other: Other: Other:
Other: Other: Other: Other: Other: N/A Other:
Other: Other: Other: Other: Other: Other:
Other: Other: Other: Other: Other: Other:
Other: Other: Other: Other: Other: Other:
Other: Other: Other: Other: Other: N/A Other:
Other: Other: Other: Stable Other: Stable Other: Stable Other:
Other: Other: Other: Other: Other: Other:
1 2 3
1 2 3
1 2 3
1 2 3
1 2 3
1 2 3
Photograph(s): 11, 12
1 2 3
Page 1
1 2 3 1 2 3 4 5 6 7 8 9 10 11 12 13 14 15 16 17
Left arm angle is too small, but structure is still functioning and providing stability.
1 2 3 4 5 6 7 8 9 10 11 12 13
Yes No
1 2 3 4 5 6 7 8 9 10 11 12 13
Stable Reach Yes NoPhotograph(s): 10
13+10
Structure 15 Vertical Stability Lateral Stability Riparian Structure
1 2 3 4 5 6 7 8 9 10 11 12 13 14 15
Photograph(s): 9
13+80 13+10
Stable Reach Vertical Stability Lateral Stability Riparian Structure
1 2 3 4 5 6 7 8 9 10 11 12 13 14 15 1 2 3 1 2 3 4 5 6 7 8 9 10
11 12 13 14 15 16 17
Stable Reach
1 2 3 1 2 3 4 5 6 7 8 9 10 11 12 13 14 15 16 17
Stable
1 2 3 4 5 6 7 8 9 10 11 12 13
Yes No
1 2 3 4 5 6 7 8 9 10 11 12 13
Channel is forming proper W/D ration but pool habitat is permanently lost and energy dissipation reduced. Yes No
Photograph(s): 7, 8
13+65
Outfall Vertical Stability Lateral Stability Riparian Structure
1 2 3 4 5 6 7 8 9 10 11 12 13 14 15
Photograph(s): 6
13+80
Structure 14 Vertical Stability Lateral Stability Riparian Structure
1 2 3 4 5 6 7 8 9 10 11 12 13 14 15 1 2 3 1 2 3 4 5 6 7 8 9 10
11 12 13 14 15 16 17 Depos. on streamward side downstream of structure on left bank, because of too high W/D ratio, improper design: angles wrong and downstream are width too wide.
1 2 3 1 2 3 4 5 6 7 8 9 10 11 12 13 14 15 16 17 Erosion is result of deposition area in station 14+25,
once channel reach is prop. W/D ratio, stress will be reduced on the right bank.
1 2 3 4 5 6 7 8 9 10 11 12 13
Yes No
1 2 3 4 5 6 7 8 9 10 11 12 13
No action because channel is building proper W/D ratio Yes NoPhotograph(s): 5
14+30 14+40
Right Bank Erosion Vertical Stability Lateral Stability Riparian Structure
1 2 3 4 5 6 7 8 9 10 11 12 13 14 15
Photograph(s): 4
14+10 14+60
Deposition on Left Bank of Channel
Vertical Stability Lateral Stability Riparian Structure
1 2 3 4 5 6 7 8 9 10 11 12 13 14 15 1 2 3 1 2 3 4 5 6 7 8 9 10
11 12 13 14 15 16 17
Constructed W/D ratio too high
1 2 3 1 2 3 4 5 6 7 8 9 10 11 12 13 14 15 16 17
Stable outfall
1 2 3 4 5 6 7 8 9 10 11 12 13
Yes No
1 2 3 4 5 6 7 8 9 10 11 12 13
No stability issues Yes NoPhotograph(s): 2, 3
14+55
Outfall Vertical Stability Lateral Stability Riparian Structure
1 2 3 4 5 6 7 8 9 10 11 12 13 14 15
Photograph(s): 1
14+60
Structure 13 Vertical Stability Lateral Stability Riparian Structure
1 2 3 4 5 6 7 8 9 10 11 12 13 14 15 1 2 3 1 2 3 1 2 3 4 5 6 7 8 9 10
11 12 13 14 15 16 17Left arm angle too small, Right arm buried by deposition described in Reach above.
1 2 3 1 2 3 4 5 6 7 8 9 10 11 12 13 14 15 16 17 Channel design overwide to accommodate overwide
road crossing, deposition occurring to get proper W/D ratio
1 2 3 4 5 6 7 8 9 10 11 12 13
The only thing impacted is flow conveyance though the road crossing, only slight constriction. Yes No
Station Identification Number
Problem Description Recommended ActionsMeasurement(s)
15+50 14+60
Aggrad. Reach Vertical Stability Lateral Stability Riparian Structure
1 2 3 4 5 6 7 8 9 10 11 12 13 14 15 1 2 3
RS, SD
Natural channel design stream restorationStony Run Stream Restoration 4/7/2011
Upper Stony Baltimore, MD
1 1 1 1 Wbfk
2 2 2 2 Dbkf
3 3 3 3 Wbkf/Dbkf
4 4 4 4 Wac
5 5 5 5 Dac
6 6 6 6 Wfp
7 7 7 ER
8 8 8 Lm
9 9 9 Wblt
10 10 10 MWR
11 11 K
12 Rc
13 Rc/Wbkf
14 BHR
15 Save
1 1 1 1 Sfacet
2 2 2 2 BEHI
3 3 3 3 NBS
1 1 1 1 D50
2 2 2 2 D84
3 3 3 3 Dbar
1 1 1 1 P-P
2 2 2 2
3 3 3 3
4 4 4 4
5 5 5 5
6 6 6 6
7 7 7 7
8 8 8 8
9 9 9 Other 9
10 10 10
11 11 11
12 12 12
13 13 13
14 14
15 15
16 16
17 17
1 1 1 1
2 2 2 2
3 3 3 3
4 4 4 4
5 5 5 5
6 6 6 6
7 7 7
8 8 8
9 9 9
10 10
11 11
12
13
None (no apparent cause)
Other
Pool-to-Pool Spacing
RAPID STREAM MONITORING EVALUATION ATTRIBUTES
Bed Particle Size (84th Percentile) (mm)
Floodprone Width (ft)
None (no apparent cause)
Bed Particle Size (50th Percentile) (mm)
Radius of Curvature (ft)
Reach Average Stream Slope
Facet Slope
Dominant Bank Erosion Hazard Index
Dominant Near Bank Shear Stress (specify method used to determine NBS)
Meander Length (ft)
Beltwidth (ft)
Bank Height Ratio
Ratio of Curvature to Bankfull Width
Improper planform design
Measurements
Bankfull Width (ft)
Bankfull Depth (ft)
Width/Depth Ratio
Active Channel Width (ft)
Active Channel Depth (ft)
Stucture not functioning properly and leading to acelerated vertical and/or lateral scour or deposition
Other
Increase in meander width ratio
Buried structure
Temporary riparian degredation
Extreme flood or flow event Extreme flood or flow event
Improper bed material size
Improper profile design Other
Improper material size
Drainage feature (e.g., tributary or outfall) entering stream
None (no problem indicators)
Collapsed structure
None (no problem indicators)
Decrease in meander width ratio
Unstable/repositioned structure rocks
Improper planform placement (installation/implementation)
Improper channel dimension
Incorrect bank angle Improper design criteria
Improperly installed bank matting
Localized riparian degradation
Cutoff channel development
Flow piping through structure
Increase in facet slopeAccelerated lateral scour/scour along deposition area at the structure
Accelerated deposition in pool
Lateral scour/undercutDecrease bank height ratio
Poor pool depth variablity
Poor riparian survvial
Poor riparian width
Degradation
Other
Poorly defined facet features
Increase bank height ratio
Bank deposition
Increase in entrenchment
Decrease in entrenchment
Loss of bank vegetation
Dominant BEHI and NBS rating of moderate or greater
Scour
Decrease in facet slope
Deposition/Bar Development
Change in flow regime
Prob
lem
Incd
icat
or(s
)
Unstable drainage feature (e.g., tributary or outfall) entering stream
Aggradation
Improper planform design
Improper profile design
Seve
rity
None (no problem indicators)
Impl
icat
ion(
s)
Expected to worsen over time Expected to worsen over time Expected to worsen over time
Immediate concern; will cause further damage and contribute to other problems
Widespread scour or bar formation; extensive changes to bed characteristics
Widespread riparian degradation
Not expected to worsen or cause further problems; may stabilize over time
Immediated concern; will cause further damage and contribute to other problems
Immediated concern; will cause further damage and contribute to other problems
Localized scour or bar formation; minor changes to bed characteristic
Immediated concern; will cause further damage and contribute to other problems
Widespread failure of entire bank; bank actively eroding and substantial loss of bank material; BEHI and NBS have a rating of high or greater
Excessive sediment input from watershed sources upstream of the project
None (no apparent cause)
Unstable bank material/fill
None (no apparent cause)
Aggradation from instream vegetation, debris jam, or other channel obstruction
Stucture not functioning properly and leading to acelerated vertical scour or deposition Lack/loss of vegetation
Repair unstable portion of structure
Relocate or rebuild entire structure
Modify channel dimensions or characteristics (e.g., active channel bench); reconnect channel to floodplain
Modify channel planform Stabilize channel banks with rock material
Armor bed to prevent scour
Modify channel dimensions or characteristics (e.g., active channel bench); reconnect channel to floodplain
Modify channel profile
Regrade banks, repair matting, and/or replant vegetation
Other
Modify channel planform
Stabilize local sediment source
Manage stormwater quantity
Other
Modify channel dimensions or characteristics (e.g., active channel bench); reconnect channel to floodplain
Channel incision; loss of floodplain connectivity
Construct grade control structure
Remove debris jam, other obstruction, and/or excessive sediment
Change in flow regime
Stabilize local sediment source
No action
Regrade banks, repair matting, and/or replant vegetation
Stabilize local sediment source
Modify channel profile
No action
Armor bank
Repair matting and/or replant vegetation
Other
Construct grade control structure
Rec
omen
ded
Act
ion(
s)
Minor stress on the structure; still functioning as intended
Partial failure of structure; minimally functioning as intended
Complete structural failure; no longer functioning as intended
Reinstall soil lifts and replant vegetation
Manage stormwater quantity
Temporary scour or deposition formation
Bank angle shallower than design criteria
No action
Improper channel dimension
Planform/radius of curvature adjustments
Vertical Stability Lateral Stability Structure
Localized sediment input from an immediate source
Cross section width/depth ratio is larger than the design criteria
Not expected to worsen or cause further problems; may stabilize over time
Cross section width/depth ratio is less than the design criteria
Incorrect pool-to-pool spacing
Largest Particle Size on Bar (mm)
Riparian Condition
None (no problem indicators)
Bare ground present
Invasive species present
Modify channel profile
Manage stormwater quantity Modify channel planform
Other
Lack of adequeate pool depth/pool formation
Accelerated vertical scour/exposed footer rocks
Accelerated lateral scour upstream/downstream of the structure
Entrenchment Ratio
Sinuousity
Improper profile design
Not expected to worsen or cause further problems; may stabilize over time
Localized bank erosion; minor loss of bank material; BEHI and/or NBS have a rating of low or less
Localized, moderate bank erosion; moderate loss of bank material; BEHI and NBS have a rating of moderate
Meander Width RatioOther
Not expected to worsen or cause further problems; may stabilize over time
Expected to worsen over time
Re-plant riparian corridor
Pest control
Improper post restoration planting plan
Improper implementation of planting plan
Drought or other natural causes
Development
Poor plant condition or seed mixture for existing conditions
Grazing or other agricultural practices
Non-native or invasive species
No action
Supplement current planting
Invasives removal
Scour from debris jam or other channel obstruction
Stabilize structure with rock material
Stucture not functioning properly and leading to acelerated lateral scour or deposition
Extreme flood or flow eventChannel incision; loss of floodplain connectivity
Change in flow regime
Improper channel dimension
Improper planform design
App
aren
t Cau
se(s
)
Other
Overland/over bank drainage
Scour from debris jam or other channel obstruction
Improper installation
Incorrect use of structure
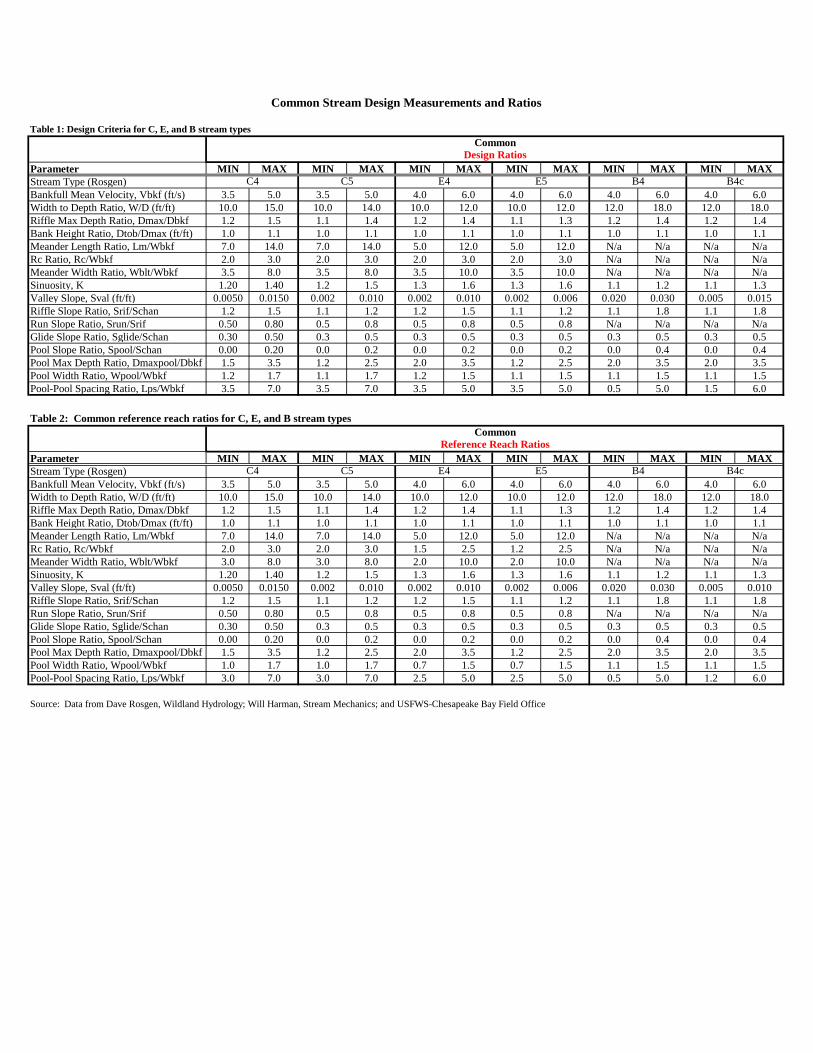
Table 1: Design Criteria for C, E, and B stream types
Parameter MIN MAX MIN MAX MIN MAX MIN MAX MIN MAX MIN MAXStream Type (Rosgen)Bankfull Mean Velocity, Vbkf (ft/s) 3.5 5.0 3.5 5.0 4.0 6.0 4.0 6.0 4.0 6.0 4.0 6.0Width to Depth Ratio, W/D (ft/ft) 10.0 15.0 10.0 14.0 10.0 12.0 10.0 12.0 12.0 18.0 12.0 18.0Riffle Max Depth Ratio, Dmax/Dbkf 1.2 1.5 1.1 1.4 1.2 1.4 1.1 1.3 1.2 1.4 1.2 1.4Bank Height Ratio, Dtob/Dmax (ft/ft) 1.0 1.1 1.0 1.1 1.0 1.1 1.0 1.1 1.0 1.1 1.0 1.1Meander Length Ratio, Lm/Wbkf 7.0 14.0 7.0 14.0 5.0 12.0 5.0 12.0 N/a N/a N/a N/aRc Ratio, Rc/Wbkf 2.0 3.0 2.0 3.0 2.0 3.0 2.0 3.0 N/a N/a N/a N/aMeander Width Ratio, Wblt/Wbkf 3.5 8.0 3.5 8.0 3.5 10.0 3.5 10.0 N/a N/a N/a N/aSinuosity, K 1.20 1.40 1.2 1.5 1.3 1.6 1.3 1.6 1.1 1.2 1.1 1.3Valley Slope, Sval (ft/ft) 0.0050 0.0150 0.002 0.010 0.002 0.010 0.002 0.006 0.020 0.030 0.005 0.015Riffle Slope Ratio, Srif/Schan 1.2 1.5 1.1 1.2 1.2 1.5 1.1 1.2 1.1 1.8 1.1 1.8Run Slope Ratio, Srun/Srif 0.50 0.80 0.5 0.8 0.5 0.8 0.5 0.8 N/a N/a N/a N/aGlide Slope Ratio, Sglide/Schan 0.30 0.50 0.3 0.5 0.3 0.5 0.3 0.5 0.3 0.5 0.3 0.5Pool Slope Ratio, Spool/Schan 0.00 0.20 0.0 0.2 0.0 0.2 0.0 0.2 0.0 0.4 0.0 0.4Pool Max Depth Ratio, Dmaxpool/Dbkf 1.5 3.5 1.2 2.5 2.0 3.5 1.2 2.5 2.0 3.5 2.0 3.5Pool Width Ratio, Wpool/Wbkf 1.2 1.7 1.1 1.7 1.2 1.5 1.1 1.5 1.1 1.5 1.1 1.5Pool-Pool Spacing Ratio, Lps/Wbkf 3.5 7.0 3.5 7.0 3.5 5.0 3.5 5.0 0.5 5.0 1.5 6.0
Table 2: Common reference reach ratios for C, E, and B stream types
Parameter MIN MAX MIN MAX MIN MAX MIN MAX MIN MAX MIN MAXStream Type (Rosgen)Bankfull Mean Velocity, Vbkf (ft/s) 3.5 5.0 3.5 5.0 4.0 6.0 4.0 6.0 4.0 6.0 4.0 6.0Width to Depth Ratio, W/D (ft/ft) 10.0 15.0 10.0 14.0 10.0 12.0 10.0 12.0 12.0 18.0 12.0 18.0Riffle Max Depth Ratio, Dmax/Dbkf 1.2 1.5 1.1 1.4 1.2 1.4 1.1 1.3 1.2 1.4 1.2 1.4Bank Height Ratio, Dtob/Dmax (ft/ft) 1.0 1.1 1.0 1.1 1.0 1.1 1.0 1.1 1.0 1.1 1.0 1.1Meander Length Ratio, Lm/Wbkf 7.0 14.0 7.0 14.0 5.0 12.0 5.0 12.0 N/a N/a N/a N/aRc Ratio, Rc/Wbkf 2.0 3.0 2.0 3.0 1.5 2.5 1.2 2.5 N/a N/a N/a N/aMeander Width Ratio, Wblt/Wbkf 3.0 8.0 3.0 8.0 2.0 10.0 2.0 10.0 N/a N/a N/a N/aSinuosity, K 1.20 1.40 1.2 1.5 1.3 1.6 1.3 1.6 1.1 1.2 1.1 1.3Valley Slope, Sval (ft/ft) 0.0050 0.0150 0.002 0.010 0.002 0.010 0.002 0.006 0.020 0.030 0.005 0.010Riffle Slope Ratio, Srif/Schan 1.2 1.5 1.1 1.2 1.2 1.5 1.1 1.2 1.1 1.8 1.1 1.8Run Slope Ratio, Srun/Srif 0.50 0.80 0.5 0.8 0.5 0.8 0.5 0.8 N/a N/a N/a N/aGlide Slope Ratio, Sglide/Schan 0.30 0.50 0.3 0.5 0.3 0.5 0.3 0.5 0.3 0.5 0.3 0.5Pool Slope Ratio, Spool/Schan 0.00 0.20 0.0 0.2 0.0 0.2 0.0 0.2 0.0 0.4 0.0 0.4Pool Max Depth Ratio, Dmaxpool/Dbkf 1.5 3.5 1.2 2.5 2.0 3.5 1.2 2.5 2.0 3.5 2.0 3.5Pool Width Ratio, Wpool/Wbkf 1.0 1.7 1.0 1.7 0.7 1.5 0.7 1.5 1.1 1.5 1.1 1.5Pool-Pool Spacing Ratio, Lps/Wbkf 3.0 7.0 3.0 7.0 2.5 5.0 2.5 5.0 0.5 5.0 1.2 6.0
Source: Data from Dave Rosgen, Wildland Hydrology; Will Harman, Stream Mechanics; and USFWS-Chesapeake Bay Field Office
Common Stream Design Measurements and Ratios
B4 B4c
E4 B4E5 B4c
CommonDesign Ratios
C4 C5
C4 C5
CommonReference Reach Ratios
E4 E5


