
1
RE-EXAMINING TRADITIONAL SERVICE QUALITY
IN AN E-BANKING ERA
ABSTRACT
Purpose: The paper re-examines the role of traditional service quality in an e-banking
environment by providing a review of (a) how traditional service quality perceptions
have evolved through the current and continuing stream of change in banking
technology and (b) the corresponding changes in the nature of how banks interact with
their customers.
Design/methodology/approach: Data were collected from a mail survey sent out to a
commercially purchased mailing list of 2,500 business names and addresses. The
overall usable response rate was 30.6%. Quadrant analysis was performed on the
service quality dimensions from the SERVQUAL scale.
Findings: While the importance ranking of the five SERVQUAL dimensions have
not changed dramatically over the years, large discrepancies were found between
customer expectations and their perceived performance of traditional banking
services.
Practical implications: Quadrant analysis produced specific recommendations on
how banks should prioritise the allocation of their resources to maintain high
perceived service quality in their human interactions.
Originality/value: This is the first study which revisits and re-examines traditional
service quality in the e-banking era. It highlights how high levels of traditional service
quality may lead to increased customer trust and thus more successful cross-selling of
e-banking products to customers.
Keywords: Service Quality, Interactive Marketing, Financial Services, e-Banking,
Electronic Commerce, Business Banking.
Paper Type: Research paper.
2
RE-EXAMINING TRADITIONAL SERVICE QUALITY
IN AN E-BANKING ERA
INTRODUCTION
Electronic commerce (e-commerce) has become a very important technological
advancement for businesses in changing business practices (Brodie et al., 2007;
(Gonzalez et al., 2008; Lichtenstein and Williamson, 2006). This has experienced
tremendous growth in recent years as a result of new business initiatives utilising
these technologies (Barwise and Farley, 2005). In particular, industries that are
information-oriented such as the banking services and securities trading sector are
expected to experience the highest growths in e-commerce (Ibrahim et al. 2006;
Hughes, 2002). Inevitably, this phenomenon has sparked a lot of attention in the
academic literature lately (such as Gan et al., 2006; Pikkarainen et al., 2006;
Shamdasani et al., 2008).
Undoubtedly, electronic banking (e-banking) has experienced explosive growth and
has transformed traditional practices in banking (Barwise and Farley, 2005; Gonzalez
et al., 2008; Lichtenstein and Williamson, 2006). Brodie et al. (2007) speculated that
these would lead to a massive shift in marketing practices leading to superior business
performance. In fact, it has become the main means for banks to market and sell their
products and services (Amato-McCoy, 2005) and is perceived to be a necessity in
order to stay profitable and successful (Gan et al., 2006). The changes occurring in the
banking sector can be attributed to increasing deregulation and globalization, the
major stimulus for rationalization, consolidation, and an increasing focus on costs
(Ibrahim et al., 2006; Hernandez and Mazzon, 2007). One offspring of this has been
the rapid development and use of various new and innovative technologies by banks
in the form of electronic banking services (e.g. Pikkarainen et al., 2006; Orr, 1998).
The implementation of e-banking, such as Internet banking and the use of computer-
based office banking software hold several obvious advantages for banks. It improves
the bank’s profit levels through the reduction of both variable and infrastructure costs,
provides a source of differentiation and competitive advantage, provides global reach,
3
adds another communication and feedback channel, increases customer satisfaction
through the reduction of waiting times and thus improving service performance, or
otherwise enabling the bank to more fully realise its sales potential through the
achievement of higher sales volume (Lichtenstein and Williamson, 2006; Fox, 2005;
Hernandez and Mazzon, 2007; Pikkarainen et al., 2006; Shamdasani et al., 2008;
Schaggnit, 1998; Schneiderman, 1992).
As can be appreciated, the advantages to banks are manifold. These have led many
banks to undertake high levels of marketing effort in the bid to push more customers,
in particular businesses, into implementing e-banking into their business processes.
This current strategic approach undertaken by banks, however, may be seen as
contrary to the views of many authors of relationship marketing, such as presented by
McKenna (1992) who proposes that marketers need to devise strategies with the
primary objective of sustaining and enhancing relationships with their customers over
time. Others scholars such as Roth and Van der Velde (1989) suggest that the role of
human interactions within the bank branch will be even more critical in the future,
despite the increasing popularity and acceptance of new banking technologies. Tyler
and Stanley (2001) have reiterated that human interaction between the bank manager
and the corporate financial officer to be of prime importance. O’Donnell et al. (2002)
echoed this finding that business banking customers generally prefer personalised
human interactions with their bank as a means of communication, and that this is
especially pronounced for smaller businesses. Interestingly, despite the efficiencies
created by e-banking, many businesses are still keeping duplicative traditional
records, and performing traditional banking tasks that result in less than full
implementation of the technology and continued dependency on human interactions.
These problems in the adoption of electronic services are not uncommon, and have
also been reported in related industries such as in securities brokerage services (Yang
and Fang, 2004). More importantly, Howcroft and Durkin (2000) suggest that such
interaction preferences on the part of both the bank and the customer are important
considerations as they will ultimately have a significant impact on the perceived
quality of the relationship by both parties.
4
These issues encountered in electronic service delivery have thus prompted a
proliferation of research into how service quality may be measured and managed for
electronic service deliveries (such as Parasuraman et al., 1991, 2005, Zeithaml et al.
2000, 2001, 2002; Yang and Jun, 2002; Bauer et al., 2005; Ibrahim et al., 2006;
Shamdasani et al., 2008). Research by Patricio et al. (2003) goes one step further to
measure service quality of various banking services for different delivery channels,
including both electronic and traditional channels. They have found that perceived
service quality with one delivery channel has an impact on how another channel is
perceived. Similarly, Burke (2002) suggests that marketers need to understand the
value consumers place on technology as part of the overall interaction process, and
stress that new interactions brought about by the advancement of technology are not
separate, but rather act to enhance the overall shopping experience. Moreover,
Fassnacht and Köse (2007) found that high electronic service quality in Web-based
services had an important role in building overall customer trust for the service
provider. Indeed, it seems that e-banking and traditional banking, though very
different in their bases of customer interaction, are inseparable facets of the banking
system, and should be seen as complimentary rather than substitutable ways of
banking. It follows then that the customer’s experiences with e-banking may have an
influence on changing their expectations and perceptions of traditional banking
services.
Significance and Objectives of this Research
Based on the preceding discussion, a number of pertinent questions have emerged and
have been reiterated by many scholars. First, what impact the adoption of e-banking
by the customer has on sustaining and enhancing the bank-customer relationship (e.g.
Reibstein, 2002)? Second, what impact does this new e-banking environment, brought
about by the increasing popularity of e-banking, have on the customer’s perception of
traditional bank service quality (e.g. Pikkarainen et al., 2006)? These are gaps in the
literature that have not been adequately looked at and should be revisited. Thus the
over-arching objective of this paper is to re-examine the role of traditional service
quality in an e-banking environment by providing a review of (a) how traditional
service quality perceptions have evolved through the current and continuing stream of
5
change in banking technology and (b) the corresponding changes in the nature of how
banks interact with their customers.
The paper is organised as follows. First, the theories and relevant literature in service
quality and customer satisfaction are reviewed. The methodology and analysis and
discussion of results are next presented. The paper concludes with the implications for
both marketing theory and business practices and directions for future research.
THEORY AND RELEVANT LITERATURE
Service Quality and SERVQUAL
There are numerous models of service quality described in the literature. Grönroos
(1984) pioneered this concept and defines service quality as a set of perceived
judgements resulting from an evaluation process where customers compare their
expectations with the service they perceive to have received. He suggests that it may
be split into two facets – technical quality (what is done) and functional quality (how
it is done). These two facets may be further interpreted to suggest that the service
must be effective (doing the right things) in satisfying the specific needs of the
customer as well as executing the service efficiently (doing things right). Parasuraman
et al. (1985) introduced a gap-model that focused on gaps in the perceptions of
consumers. Both these models stressed the importance of expectation versus
perception in service encounters. Cronin and Taylor (1992) introduced a service
quality model based only on perceptions and not expectations as in the previous
models. There are many other research describing models with varying degrees of
difference to these original models, some of which are reviewed by Seth et al. (2005).
The importance of measuring consumer expectations is paramount especially in the
context of banking and financial services. Recent service developments, particularly
with respect to the electronic delivery of these services, have resulted in a continuous
increase in customer expectations and the consumer’s subsequent demands as the
quality of service improves (Rao and Kelkar, 1997; Parasuraman et al., 1988). Any
6
previous experience with traditional or electronic services, word-of-mouth, or
advertising will have an influence on the expectations of the consumer.
One such model that accounts for both expectations and perceived performance is the
SERVQUAL model formulated by Parasuraman et al. (1985) that highlights the main
requirements for delivering high service quality. These researchers found five
dimensions of service quality. These are presented in order of their importance as
follows: Reliability - the ability to perform the promised service dependably and
accurately, Responsiveness - the willingness to help customers and to provide prompt
service, Assurance - the knowledge and courtesy of employees and their ability to
convey trust and confidence, Empathy - the provision of caring, individualised
attention to customers, and Tangibles - the appearance of physical facilities,
equipment, personnel, and communication materials (Berry and Parasuraman, 1991).
Perceived service quality is thus measured from the differences in degree and
direction between the perceptions of service performance and expectations for each of
these dimensions (Parasuraman et al., 1988).
This model is the most widely accepted and used measurement (Gonzalez et al., 2008)
and has been tested in a wide variety of service industries for its validity and
robustness. Many researchers have employed near identical models and have
emerged with similar dimensions (such as Saleh and Ryan, 1992; Gagliano and
Hatchcote, 1994; Dabholkar et al., 1996; Devlin and Dong, 1994 and Boulding et al.,
1993).
Customer Satisfaction and Expectancy Disconfirmation Paradigm
Customer satisfaction is often seen as the long-term success factor to an
organization’s competitiveness (Hennig-Thurau and Alexander, 1997). Satisfaction
refers to the consumer’s emotional evaluation of their experiences with the
consumption or ownership of specific goods and services (Westbrook, 1981). The
literature on satisfaction is divided into two schools of thought – the process and
outcome definitions of satisfaction. Outcome definitions of satisfaction can be
viewed as a state of fulfilment that is connected to reinforcement and arousal. Several
7
examples are given in the satisfaction-as-states framework developed by Oliver
(1989). Literature on process definitions of satisfaction is more wide spread and
generally more accepted in academic circles. The central theme of the process
definition is the expectancy disconfirmation paradigm (Ruyter and Bloemer, 1999).
According to this paradigm, a consumer’s feeling of satisfaction results from
comparing a product or service’s perceived performance in relation to his or her
expectations. If the performance falls short of expectations, negative disconfirmation
occurs, resulting in a feeling of dissatisfaction. If the performance exceeds the
expectations, positive disconfirmation occurs, and the consumer is highly satisfied. If
the performance just matches expectations, the consumer’s expectations are
confirmed, and the consumer is just satisfied.
Cumulative satisfaction is an overall evaluation based on the consumer’s total set of
consumption experiences with the product or service over time (Anderson et al.,
1994). This set of experiences is multi-faceted and includes experiences related to
various aspect of dealing with the organisation providing the product or service, as
well as the experiences related to consuming these products or services. Examples are
given by Westbrook (1981) (retail store satisfaction) and Crosby and Stephens (1987)
(satisfaction with life insurance companies). It is undoubtedly the aim of many
organizations to achieve high customer satisfaction. Highly satisfied consumers are
found to be much less ready to switch as high satisfaction creates an emotional bond
with the brand, and not just a rational preference. The result is high customer loyalty.
Service Quality and Satisfaction
Both service quality and satisfaction are constructs resulting from the comparison of
expectations and performance. They are thus very strongly related, but as several
authors have pointed out are not necessarily equivalent (Bolton and Drew, 1991;
Parasuraman et al., 1988). The difference between these two constructs, is that
perceived service quality is a form of attitude and is a long run overall evaluation,
where customer satisfaction is more of a transaction-specific measure (Chadee and
Mattsson, 1996; Cronin and Taylor, 1992; Bolton and Drew, 1991; Bitner, 1990).
Indeed, empirical research by Parasuraman et al. (1985) have found several examples
8
where consumers satisfied with a service still did not think that it was of high quality.
Oliver (1993) has also suggested that customers require experience with the product
or service to determine how satisfied they are with it, while quality can be perceived
without actual consumption experience.
Despite these differences, the link between service quality and satisfaction is an
important one in this research. Mattsson (1992) found that service quality is the
outcome of the satisfaction process; Spreng and Mackoy (1996) connect the
constructs of perceived service quality and consumer satisfaction derived from
expectations, perceived performance and desires. Dabholkar et al. (2000) describe a
broader conceptual framework supported by the antecedents of service quality and the
mediators of customer satisfaction. In other research, it has been shown that service
quality affects satisfaction and that satisfaction in turn affects behavioural intentions
(Gotlieb et al., 1994; Taylor and Baker, 1994; Fornell, 1992; Halstead and Page,
1992). Organisations that strive to continually increase service quality have shown to
be more successful in retaining repeat customers as well as more successful in cross
selling products and services to these customers (Rao and Kelkar, 1997). Reibstein
(2002) argues that firms will only be profitable if these customers are retained and in
order to do that, firms must attain high levels of customer satisfaction.
More specifically, Fullerton (2005) tested the relationships between service quality,
commitment, and switching and advocacy intentions. The results show that
commitment served as a partial mediator of the service quality-loyalty relationship.
Tam and Wong (2001) has also examined similar constructs and shown that trust and
satisfaction built up through human interaction through the salesperson's relationship
orientation significantly influenced the success of future product adoption by
customers. This evidence from traditional service settings show that service quality is
a major driver of customer satisfaction, trust, and loyalty, which ultimately lead to
increased sales opportunities and profitability. In the context of this research, high
perceived service quality with traditional bank services will enable more successful
cross-selling of e-banking products to customers through a relationship of trust and
commitment.
9
METHODOLOGY
Measures
Operationalisation of the service quality construct was based on Parasuraman et al.’s
service quality model SERVQUAL (Parasuraman et al., 1985). Since this scale has
been specifically developed for and tested in the financial services industry (Berry and
Parasuraman, 1991), the same scales will be used in this research measuring the five
dimensions of service quality; identified as Reliability, Responsiveness, Assurance,
Empathy, and Tangibles. Perceived service quality in this research is thus to be
measured from the differences in degree and direction between the perceptions of
service performance and expectations for each of these dimensions (Parasuraman et
al., 1988). Expectations and perceptions were measured on a 7-point scale from 0
(Strongly Disagree) to 6 (Strongly Agree). Of the 22 items in the scale, each
assessing the different aspects of service quality, nine items were negative statements.
These were subsequently recoded to form a set of unidirectional statements that can
then be compared with each other based on their means.
Using the SERVQUAL scale without any alterations will allow a direct examination
of how service quality perceptions have evolved in the 17 years that have passed
between the aforementioned research and this research. This enabled direct
comparisons to be made between the findings discovered by Berry and Parasuraman
(1991) and the data collected in this research.
Survey Instrument
The survey instrument used in this research was a self-administered mail
questionnaire that included two sections measuring expectations and perceived
performance from the SERVQUAL scale, and a variety of personal and business
demographic measures that provided information to establish categories for analysis.
10
Data Collection
An Australia-wide database of 2,500 business names and addresses was purchased
from a professional source for use as a sampling frame for the mail survey. The data
collection procedure followed the recommendations provided by Dillman’s work on
conducting successful mail surveys (Dillman, 1978, 2000). This included the use of a
four stage pre-notification procedure suggested by Dillman (2000), and involved the
use of personalised cover letters to respondents, and by making prior contact to notify
the respondent of the pending arrival of the questionnaire in order to substantiate its
authenticity and increase respondent cooperation. A self addressed pre-paid envelope
accompanied each questionnaire.
Of the 2,500 sampling elements, 114 addresses were deemed void, 25 businesses
responded to request removal of their details from the database, and 706 businesses
responded within the 30 day cut-off period for valid questionnaires to be returned.
This represented an overall response rate of 30.6%.
RESULTS
Sample
A broad range of businesses from various industry groups was surveyed. Table 1
shows the proportion of different types of business based on their main activity and
annual turnover. The largest segment of the market is businesses with sales turnover
between AUD$1M and AUD$3M, representing 36.5% of the total market. Service
based businesses make up over half of this segment with 18.9% of the market.
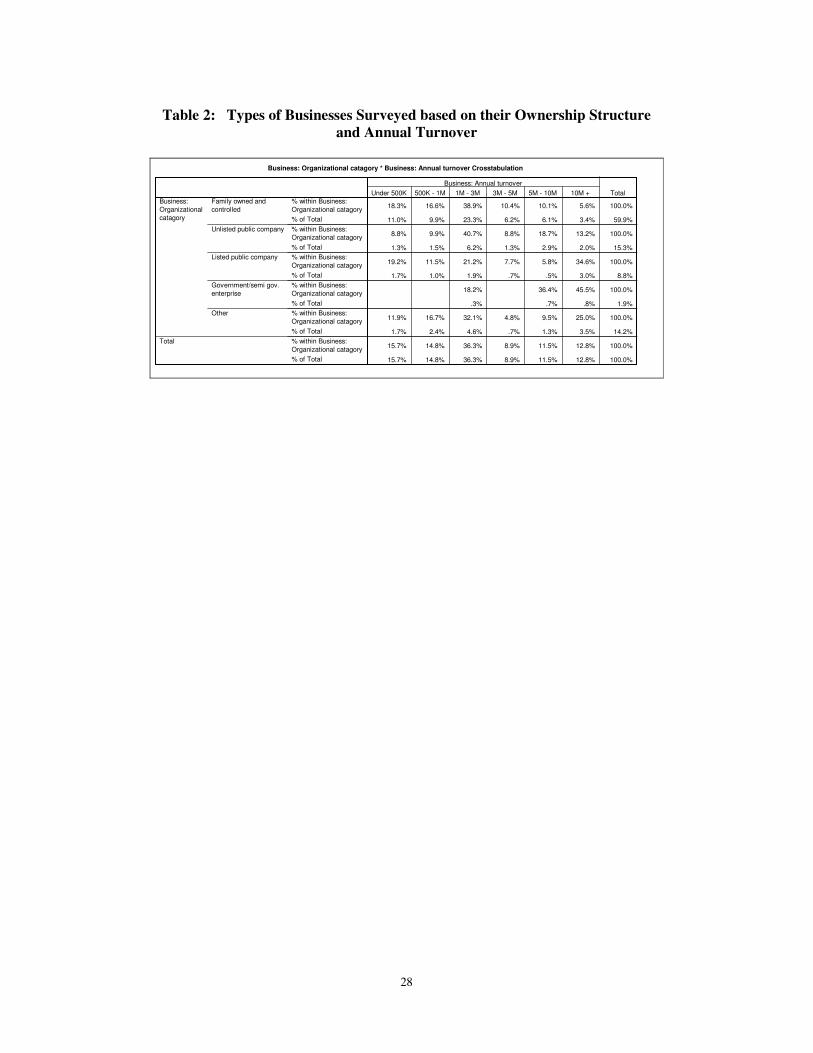
Table 2 shows the distribution of business according to their ownership structure and
annual turnover. Businesses that are family owned and controlled are by far the
largest market segment, comprising 59.9% of the market. Of these family owned and
controlled businesses, a large proportion are small businesses that have sales turnover
of less than AUD$3M; this group representing 44.2% of the overall market. Large
businesses (sales turnover of between AUD$5M to AUD$10M) and corporations with
11
sales turnover of greater than AUD$10M are predominantly publicly or government
owned, and collectively constitute 9.9% of the market.
- Insert Table 1 here –
- Insert Table 2 here –
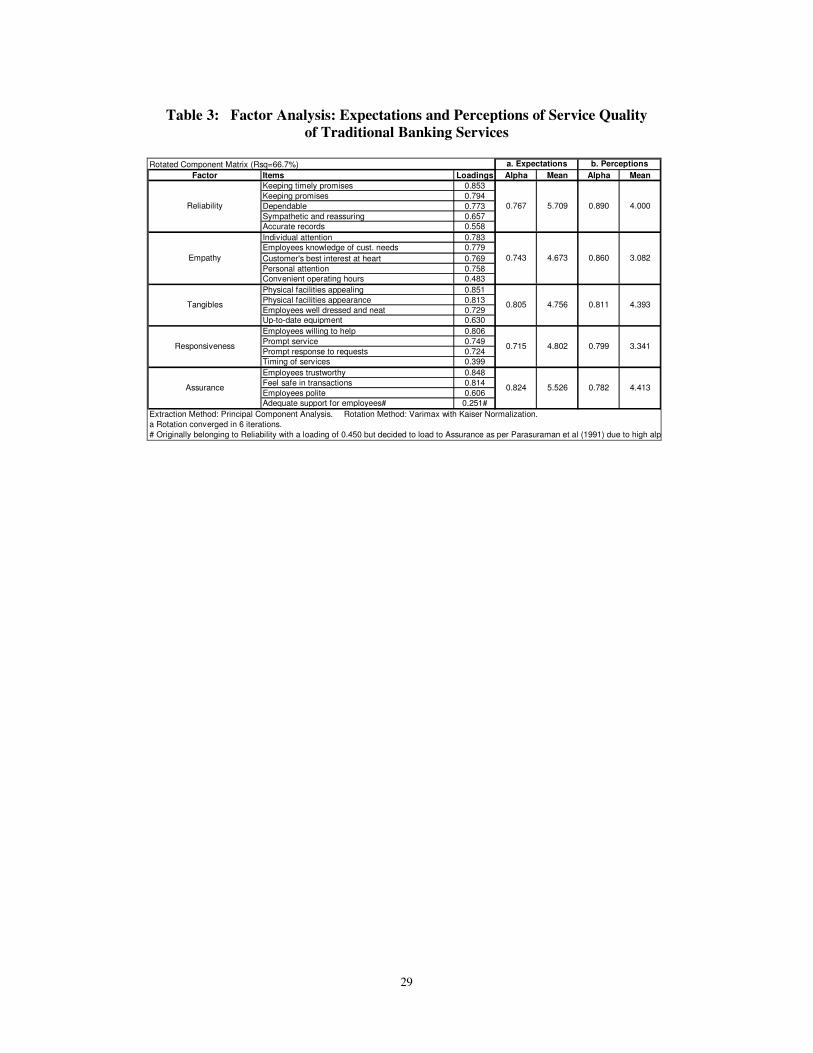
Factor Analysis
Factor analysis was undertaken on the 22 items in the service quality scale to
determine the main dimensions of service quality in this research, which can then be
used to compare against Berry and Parasuraman’s (1991) dimensions found
previously in their research.
The final statistics and the rotated factor matrix (after subjecting to Varimax rotation)
of the 22 items yielded five factors, which are summarized in Table 3 (KMO=0.910,
Barletts Test of Sphericity=0.000). Only one item (“Adequate support for
employees”) was loaded to a different dimension than was originally found by Berry
and Parasuraman (1991). In this research, the said item was shown to belong to the
Reliability dimension with a loading of 0.450. However, it was decided that for the
purposes of comparing these results to that of past research, to load this item to the
Assurance dimension as per Berry and Parasuraman’s previous findings. A total of
66.7% of the variances is captured collectively by the five factors.
Cronbach’s Alpha was used to test the extent to which the various items purporting to
measure the underlying dimension are reliable, and thus may be added together to
give an overall score for each dimension of service quality. The item (“Adequate
support for employees”) that was reallocated from the Reliability dimension to the
Assurance dimension as described above, still brought about a very high alpha for the
Assurance dimension – α=0.824 and α=0.782 for the expectations and perceptions
scales respectively, thus confirming its high reliability in belonging to this dimension.

12
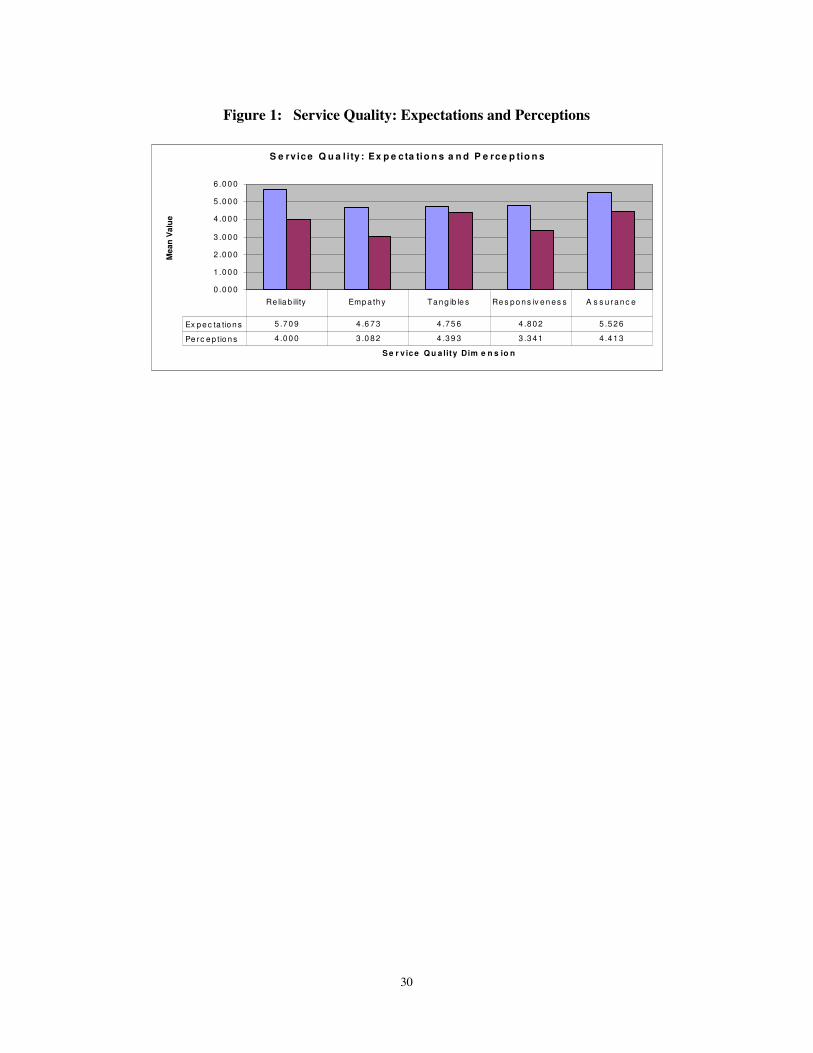
The mean scores for each dimension are also indicated in Table 3 as well as illustrated
graphically in Figure 1. The data shows how businesses rated what they expected and
what they perceived in terms of the five service dimensions. Reliability and
Assurance were the top two dimensions businesses expected from the bank, while
banks were seen to be performing best in terms of Tangibles and Assurance.
- Insert Table 3 here -
- Insert Figure 1 here –
ANALYSIS AND DISCUSSION
Comparing Service Quality Dimensions with Past Research
Comparing the results from the service quality dimensions from this research to that
of past research, namely that of Berry and Parasuraman (1991) is useful in gaining
insights into how the relative importance of these dimensions to customers have
changed through time, and more specifically in the new era of e-banking.
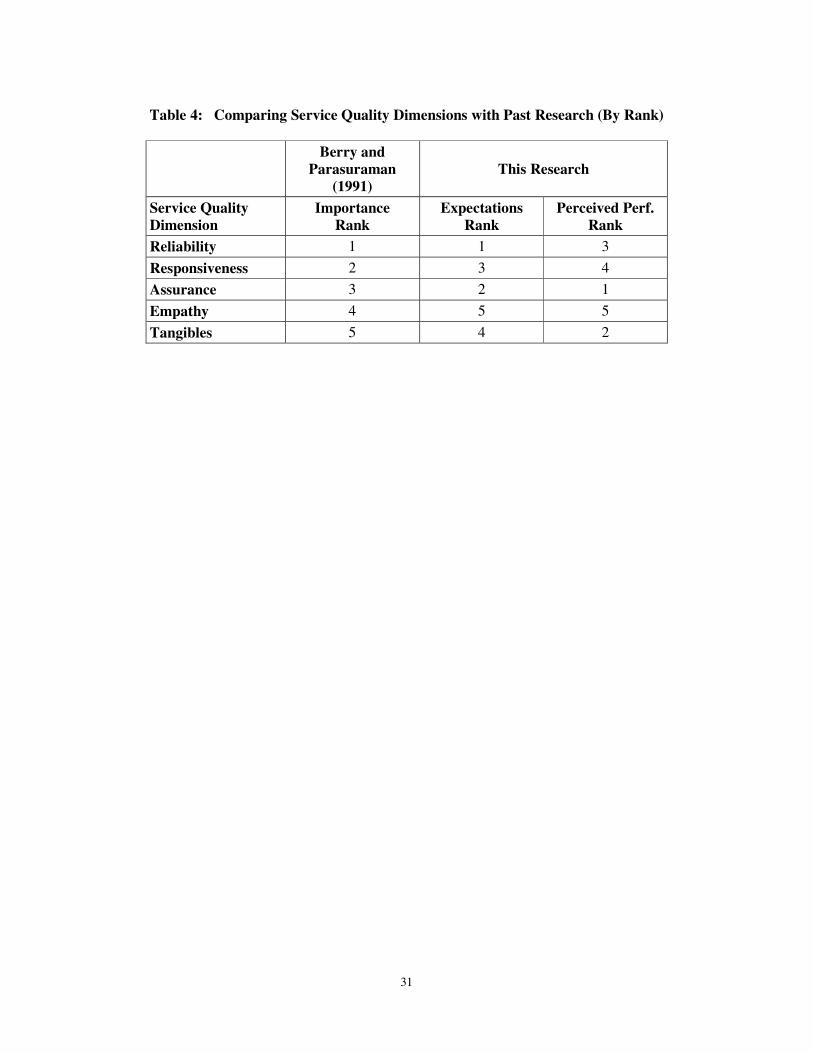
Table 4 shows how the expectation ranking of the five service quality dimensions is
compared to that of Berry and Parasuraman’s (1991) original research. It is seen that
time has brought little change with regards to the relative importance of these service
quality dimensions to the customer. Reliability remains to be the top most important
aspect of service quality for the customer. Responsiveness has moved down to 3rd
place while Assurance has moved up to 2nd place in terms of importance rank.
Similarly, Empathy has moved down a rank, while Tangibles has moved up a rank. In
each of these shifts, the change is only by one rank.
Comparing the perceived performance ranking with the expectations ranking of this
research, however, shows much larger discrepancies. For the top two expectations,
only Assurance is perceived to be doing well, while in the bottom two expectations,
Tangibles seem to be overrated.
13
- Insert Table 4 here -
Comparing the differences in service quality expectations and perceived performances
merely by rank, however, is inadequate to highlight the true size of these service
quality gaps (or the size of the expectation – perception discrepancy). Other tools
such as quadrant analysis will be more useful to examine the size of these service
quality gaps, which will have implications on how banks are fairing on each
dimension, and hence corresponding implications on the bank’s resource allocation
strategy to improve its performance on these dimensions. Quadrant analysis was
performed on these service quality dimensions adopting a similar approach to Joseph
et al.’s (2005) work on banking technology.
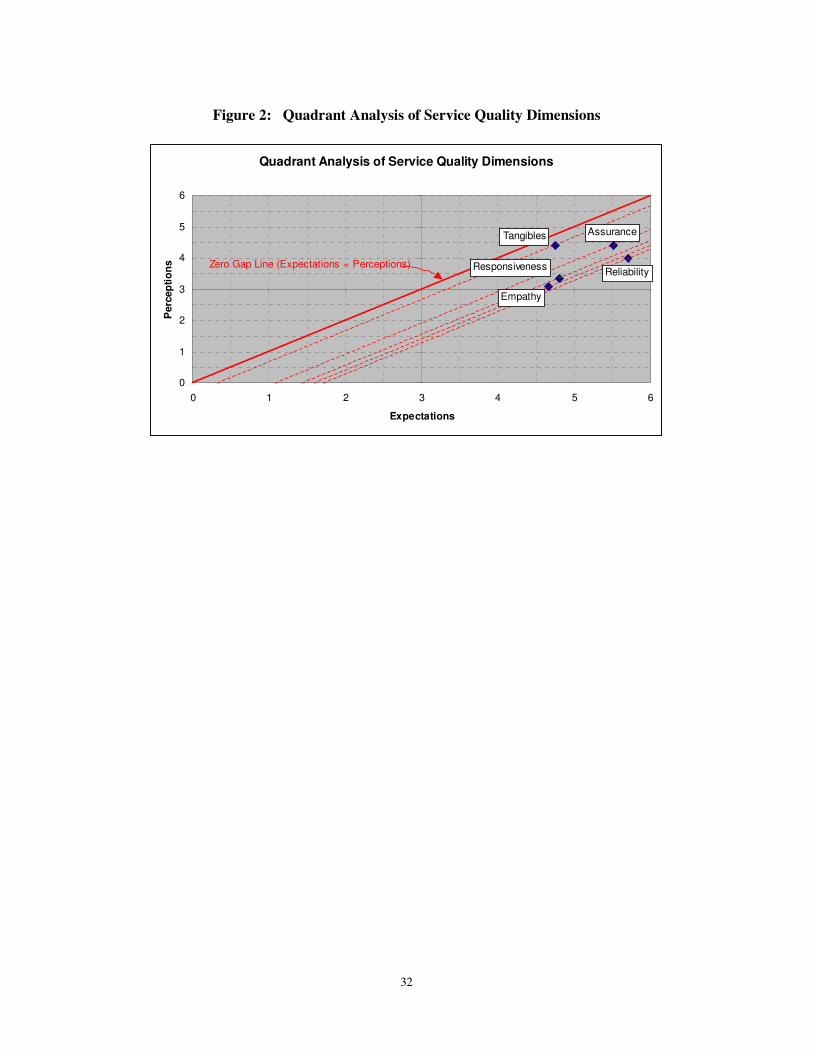
Quadrant Analysis of Service Quality Dimensions
Quadrant analysis can be seen as a variation of cross tabulation where responses to
two rating scale variables are plotted graphically. This is shown for the service
quality dimensions in Figure 2.
- Insert Figure 2 here -
Here, expectations are plotted along the horizontal axis, while perceptions are plotted
along the vertical axis. The Zero Gap Line is shown passing through the origin (0,0),
and each of the points where expectations equal perceptions. This line is where the
service quality gap is 0, indicating that customers rated their expectations similarly to
their perceptions of the bank’s performance and are hence satisfied with the service.
Points above the zero gap line are where perceptions exceed expectations indicating
very satisfied or delighted customers, while points below the line are where
perceptions fall short of expectations indicating that the customer is dissatisfied with
the service.
In the case at hand, it is shown that all five service quality dimensions fall within the
upper right hand quadrant in the matrix. More detailed examination, however,
indicate that for all dimensions, perceptions fall short of expectations (all points are

14
below the zero gap line). It has become imperative then not so much to judge within
which quadrant the points lie or whether the point is above or below the zero gap line,
but rather more importantly how far the point is below the zero gap line.
Results from this analysis then bring about an indication of the service quality gaps
that exist for each of these five dimensions. These five dimensions are listed again in
order of the size of their corresponding service quality gaps from smallest (least
dissatisfied) to biggest (most dissatisfied).
1. Tangibles (Smallest Service Quality Gap)
2. Assurance v
3. Responsiveness v
4. Empathy v
5. Reliability (Biggest Service Quality Gap)
This shows that banks are performing relatively well in terms of their appearances
(tangibles), and in building trust and confidence with their customers (assurance),
while relatively poorer in providing prompt service (responsiveness), individualised
attention (empathy), and dependability and accuracy (reliability).
Measuring the size of the service quality gaps is important in determining how
satisfied or dissatisfied customers are with the bank’s service. The question now
arises on the bank’s resource allocation in dealing with these levels of satisfaction or
dissatisfaction - which of these gaps need to be given attention first, and how much
attention.
The simple notion is to prioritise resources according to the size of each service
quality gap. That is, that the dimensions with the largest service quality gaps should
gain the most attention of resources in order to close the gap, while the dimensions
with the smallest gaps should be given a lower priority and allocation of resources.

15
This however is a fallacy as it neglects to analyse the most important aspect of service
quality – how important that gap is to the customer. It may be that a large gap exists
for a service dimension, but if the overall magnitude of the customer’s expectations is
relatively low, that dimension should not receive more attention than another
dimension with the same gap but has a higher customer expectation. The latter case
should be dealt with more fervently by the bank than the former case.
To account for the differences in magnitude of expectations for the five dimensions of
service quality, it is necessary to first calculate the mean ratings for expectations and
perceptions across the five service quality dimensions and replot the quadrant analysis
matrix with these means as the dividing lines between quadrants in the matrix.
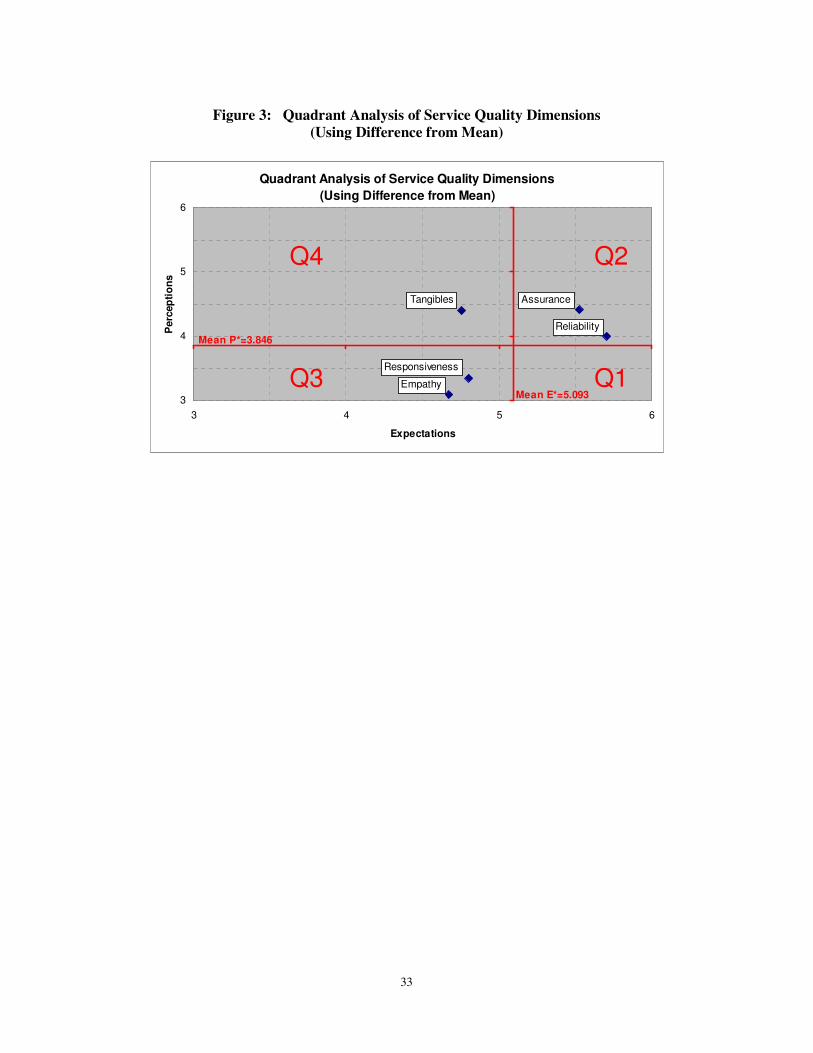
The resulting quadrant analysis shown in Figure 3 now shows each service quality
dimension plotted using its difference from the mean expectations and perceptions
across all five dimensions. Points in quadrant one (Q1) would indicate a higher than
average expectation of the service and a lower than average perception of the same
service. Points in Q1 should receive the most attention in closing or minimising the
service quality gap. The second priority would be the points that lie within quadrant
two (Q2). Points in this quadrant have a higher than average expectation, but also
have a higher than average perception. These points should receive second priority in
resource allocations needed to further minimise or close the gap and to maintain or
improve service quality. Quadrant three (Q3) indicates a lower than average
expectation with also a lower than average perception, while quadrant four (Q4)
indicate a lower than average expectation but higher than average perception. They
should receive third and fourth priorities respectively.
In this analysis, we note that there are no points within Q1, but two points within Q2.
These two dimensions of service quality – namely Reliability and Assurance, should
receive the highest priority and most attention from the banks. Despite Assurance
having a relatively small service quality gap (as found in the first analysis from Figure
2), the high expectation by customers for the bank to perform well in this dimension
makes it an important gap to close. Reliability of the banking service also holds a

16
high expectation from customers, and its relatively larger service quality gap (as
found in the first analysis from Figure 2) further accentuates its needed attention.
- Insert Figure 3 here -
Responsiveness and empathy are the next dimensions to be dealt with that fall in Q3.
These dimensions should receive lower priority in resource allocation than the
dimensions in Q2 described earlier. They have moderately large service quality gaps,
but lower than average expectations.
Tangibles should receive the lowest priority in resource allocation as it falls within
Q4, where despite still having a small service quality gap, this dimension is
characterised by lower than average customer expectations, while being perceived as
performing higher than average.
IMPLICATIONS AND CONCLUDING COMMENTS
The results of this study have provided a re-examination of how traditional service
quality perceptions have evolved amid the challenges faced by the banking sector
brought about by the advancement of e-commerce.
Little has changed with regard to the various dimensions of service quality and their
importance to the customer. These findings seem to point to the apparent stability of
the revealed factor structure with regard to the validity and robustness of the
SERVQUAL measure (similar findings to Ibrahim et al., 2006). This is particularly
important noting the concern about the multi-dimensionality and reliability of the
SERVQUAL scale (e.g. Gonzalez et al., 2008). The SERVQUAL scale has withstood
the course of time and will remain a popular measure in consonance with Gonzalez et
al. (2008).

17
Managerial Implications
This research has shown that the shift in expectation rankings is minimal and is
expected, given the continued importance of human interactions in bank-customer
relationships in the new e-banking era. Despite the increasing popularity and
acceptance of new banking technologies and the increasing move to an e-banking
landscape, these findings continue to support the views of many past scholars (such as
Yang and Fang, 2004; O’Donnell et al., 2002; Tyler and Stanley, 2001; Roth and Van
der Velde, 1989) that have found that customers, in particular businesses, still have a
high preference for human interactions when dealing with their bank. This is an
exceedingly valuable proposition in this e-banking era where banks are continuing to
erroneously cut costs through the reduction of service staff levels and the streamlining
of branch operations.
The comparisons of expectations and perceived performance ratings appeared to have
more than modest differences. While the raw comparisons alone may not be
statistically robust, they raise the concern for both practitioners and academics alike.
These findings reflect Rao and Kelkar (1997) contention that the electronic delivery
of such services, have resulted in a continuous increase in customer expectations and
the consumer’s subsequent demands as the quality of service improves.
The use of the quadrant analysis served to add more reliability to the discrepancy and
the results show that the performance of traditional banking services is misaligned to
the current set of customer expectations. This misalignment is the source of
dissatisfaction among customers. As stated in Reibstein (2002), e-banking will only
be successful if banks can retain existing customers. This study has applied the tools
needed to understand and identify the dimensions, identified by customers as
determinants of satisfaction and more importantly, allow banks to optimise the of use
sometimes scarce resources available to them. As such, it is proposed that banks need
to prioritise their resources to focus on key service quality dimensions critical to the
customer as well as at the tactical level in devising marketing programs for products
such as e-banking. More specifically, banks should focus on improving their service
performance on the Reliability and Assurance dimensions of service quality as their
18
first priority. This supports Fassnacht and Köse (2007) study that high electronic
service quality in Web-based services had an important role in building overall
customer trust for the service provider. The dimensions of Responsiveness and
Empathy should be served as the second priority, and lastly Tangibles as their third
priority. High customer satisfaction will in turn act to increase the effectiveness of
marketing effort to increase the adoption of e-commerce innovations like e-banking;
thus more fully realising the cost advantages for the bank, an issue that has also been
highlighted by other researchers (Hernandez and Mazzon, 2007; Ibrahim et al., 2006).
In summary, this research has focussed on providing a more current examination of
the service quality of traditional banking services in an environment where customers
are now presented with greater choice on how they choose to interact with their bank.
Burke (2002), in stressing that new interactions brought about by the advancement of
technology are not separate, but rather act to enhance the overall interaction
experience, called for further research to better understand the value consumers place
on these different ways of interacting with service providers. This research has
answered that call by confirming the value of human interactions. It therefore
provides a first step toward investigating other constructs associated with a bank’s
relationship with its customers and how e-banking products may be more successfully
marketed to them. Indeed, it seems that e-banking and traditional banking, though
very different in their bases of customer interaction, are inseparable facets of the
banking system, and should be seen as complimentary rather than substitutable ways
of banking.
Directions for Future Research
The findings of this study are limited to the Australian context where the Australian
internet maturity is solid (Lichtenstein and Williamson, 2006). It should be replicated
in other countries especially those with different levels of development and
proliferation of Internet infrastructure, or where the adoption of e-banking has not
reached critical mass for various reasons. For example, an emerging economy versus
a fully industrialised one may have differing customer expectations of service quality
(Pikkarainen et al., 2006; Hernandez and Mazzon, 2007). Further research should
19
also look to examine how different levels of traditional service quality influence the
rate of e-banking adoption by the customer. The extent to which high traditional
service quality is a necessary antecedent to successful cross-selling of e-banking
solutions to customers, and the mediating role of trust and commitment will need to
be further investigated. Other questions that need to be answered include how banks
should respond to the aging population and how other demographic variables
influence e-banking usage behaviour and practices? How will these issues affect the
perceived quality of traditional bank services and other forms of bank-customer
interaction options like e-banking?

20
REFERENCES
Amato-McCoy, D. (2005) “Creating virtual value”, Bank Systems and Technology,
Vol. 1, Iss. 22.
Anderson, E.W., Fornell, C. and Lehmann, D.R. (1994), “Customer Satisfaction,
Market Share, and Profitability: Findings from Sweden”, Journal of Marketing,
Vol. 58, Iss. July; pp. 53-66.
Barwise P. and Farley, J. U. (2005), “The state of interactive marketing in seven
countries: Interactive marketing comes of age”, Journal of Interactive
Marketing, vol. 19, Iss. 3; pp 67-80.
Bauer, H.H. and Hammerschmidt, M., Falk, T. (2005), “Measuring the quality of e-
banking portals”, The International Journal of Bank Marketing, Vol. 23, Iss.
2/3; pp. 153.
Berry, L.L. and Parasuraman, A. (1991), Marketing Services: Competing Through
Quality, New York: Free Press.
Bitner, M.J. (1990), “Evaluating Service Encounters: The Effects of Physical
Surroundings and Employee Responses”, Journal of Marketing, Vol. 54, Iss.
April; pp. 69-82.
Bolton, R.N. and Drew, J.H. (1991), “A Multistage Model of Customer’s Assessment
of Service Quality and Value”, Journal of Consumer Research, Vol. 17, Iss.
March, pp. 375-384.
Boulding, W.; Kalra, A. and Staelin, R. (1993), “A Dynamic Process Model of
Service Quality: From Expectations to Behavioural Intentions”, Journal of
Marketing Research, Feb 1993; pp. 7-27.
Brodie, R.J, Winklhofer, H., Coviello, N.E. and Johnston, W.J. (2007), "Is e-
marketing coming of age? An examination of the penetration of e-marketing
and firm performance", Journal of Interactive Marketing, Vol. 21, Iss. 1; pp. 2-
21.
Burke, R.R. (2002), “Technology and the customer interface: What consumers want
in the physical and virtual store”, Academy of Marketing Science Journal, Vol.
30, Iss. 4; pp. 411.
21
Chadee, D.D. and Mattsson, J. (1996), “An Empirical Assessment of Customer
Satisfaction in Tourism”, The Service Industries Journal, Vol. 16, Iss. 3; pp.
305-320.
Cronin, JJ. and Taylor, S.A. (1992), "Measuring service quality: a reexamination and
extension", Journal of Marketing, Vol. 6; pp. 55-68.
Crosby, L.A. and Stephens, N. (1987), “Effects of Relationship Marketing on
Satisfaction, Retention, and Prices in the Life Insurance Industry”, Journal of
Marketing Research, Vol. 24, Iss. Nov, pp. 404-411.
Dabholkar, P.A., Shepherd, C.D. and Thorpe, D.I. (2000), "A comprehensive
framework for service quality: an investigation of critical conceptual and
measurement issues through a longitudinal study", Journal of Retailing, Vol. 76,
Iss. 2; pp. 131-9.
Dabholkar, P.A., Thorpe, D.I. and Rente, J.O. (1996), "A measure of service quality
for retail stores: scale development and validation", Journal of the Academy of
Marketing Science, Vol. 24, Iss. 1; pp. 3-16.
Devlin, S.J. and Dong, H.K. (1994), “Service Quality from the Customer’s
Perspective”, Marketing Research: A Magazine of Management & Applications,
Iss. winter 1994; pp. 4-13.
Dillman, D.A. (1978), Mail and Telephone Surveys: The Total Design Method, John
Wiley and Sons, New York.
Dillman, D.A. (2000), Mail and Internet Surveys: The Tailored Design Method, John
Wiley and Sons, New York.
Fassnacht, M. and Köse, I. (2007), “Consequences of Web-based service quality:
Uncovering a multi-faceted chain of effects”, Journal of Interactive Marketing,
Vol. 21, Iss. 3; pp. 35.
Fornell, C. (1992), “A National Customer Satisfaction Barometer: The Swedish
Experience”, Journal of Marketing, Vol. 56; pp. 6-21.
Fox, S. (2005), "Online banking jumps 47% in 2 years", Pew Internet and American
Life project.
Fullerton, G. (2005), “How commitment both enables and undermines marketing
relationships”, European Journal of Marketing, Vol. 39, Iss. 11/12; pp. 1372.
22
Gagliano, K.B. and Hatchcote, J. (1994), "Customer expectations and perceptions of
service quality in apparel retailing", Journal of Services Marketing, Vol. 8, Iss.
1; pp. 60-9.
Gan, C., Clemes, M., Limsombunchai, V. and Weng, A. (2006), "A logit analysis of
electronic banking in New Zealand", The International Journal of Bank
Marketing, Vol. 24, Iss. 6; pp. 360.
González, M.E., Dentiste, M.R. and Rhonda, M.W. (2008), "An Alternative Approach
in Service Quality: An e-Banking Case Study", The Quality Management
Journal, Vol. 15, Iss. 1; pp.41.
Gotlieb, J.B., Grewal, D. and Brown, S.W. (1994), “Consumer Satisfaction and
Perceived Quality: Complementary or Divergent Constructs?”, Journal of
Applied Psychology, Vol. 79, Iss. 6; pp. 875-885.
Grönroos, C. (1984), "A service quality model and its marketing implications",
European Journal of Marketing, Vol. 18, Iss. 3; pp. 36-44.
Halstead, D. and Page, T.J.J. (1992), “The Effects of Satisfaction and Complaining
Behaviour on Consumers Repurchase Behaviour”, Journal of Satisfaction,
Dissatisfaction, and Complaining Behaviour, Vol. 5; pp. 1-11.
Hennig-Thurau, T. and Alexander, K. (1997), “The Impact on Customer Satisfaction
and Relationship Quality on Customer Retention: A Critical Reassessment and
Model Development”, Psychology and Marketing, Vol. 14, Iss. 8; pp. 737-764.
Hernandez, J.M.C and Mazzon, J.A. (2007), "Adoption of internet banking:
proposition and implementation of an integrated methodology approach", The
International Journal of Bank Marketing, Vol. 25, Iss. 2; pp. 72.
Howcroft, J.B. and Durkin, M. (2000), "Reflections on bank-customer interactions in
the new millennium," Journal of Financial Services Marketing, Vol. 5, Iss. 1;
pp. 9-20.
Hughes, T.J. (2002), “Marketing principles in the application of e-commerce”,
Qualitative Market Research, Vol. 5, Iss. 4; pp. 252.
Ibrahim, E.E., Joseph, M. and Ibeh, K.I.N. (2006), “Customers' perception of
electronic service delivery in the UK retail banking sector”, The International
Journal of Bank Marketing, Vol. 24, Iss. 7; pp. 475.
23
Joseph, M., Sekhon, Y., Stone, G. and Tinson, J. (2005), “An exploratory study on the
use of banking technology in the UK: A ranking of importance of selected
technology on consumer perception of service delivery performance”, The
International Journal of Bank Marketing, Vol. 23, Iss. 4/5; pp. 397.
Lichtenstein, S. and Williamson, K. (2006), "Understanding consumer adoption of
internet banking: An interpretive stud in the Australian banking context”,
Journal of Electronic Commerce Research, Vol. 7, Iss. 2; pp. 50.
Mattsson, J. (1992), "A service quality model based upon ideal value standard",
Journal of Service Industry Management, Vol. 3, Iss. 3; pp. 18-33.
McKenna, R. (1992), “Relationship Marketing”, Executive Excellence, Vol. 9; pp. 7-
8.
O'Donnell, A., Durkin M.G. and McCartan-Quinn, D. (2002), “Corporate banking in
the UK: Personal vs remote interaction”, The International Journal of Bank
Marketing, Vol. 20, Iss. 6; pp. 273.
Oliver, R.L. (1989), “Processing of the Satisfaction Response in Consumption: A
suggested Framework and Research Propositions”, Journal of Satisfaction,
Dissatisfaction, and Complaining Behaviour, Vol. 2; pp. 1-16.
Oliver, R.L. (1993), “A Conceptual Model of Service Quality and Service
Satisfaction: Compatible Goals, Different Concepts”, in Swartz, T.A., Bowen,
D.E. and Brown, S.W. (Eds.), Advances in Services Marketing and
Management, Vol. 2, pp. 65-85, Greenwich, CT: JAI Press Inc.
Orr, B. (1998), “Where will Internet banking be in Two Years?”, ABA Banking
Journal, Vol. 90, Iss. 3; pp. 56-57.
Parasuraman, A., Berry, L. and Zeithaml, V. (1991), "Refinement and reassessment of
the SERVQUAL scale", Journal of Retailing, Vol. 67, Iss. 4; pp. 420-50.
Parasuraman, A., Zeithaml, V. and Malhotra, A. (2005), "E-S-QUAL: a multiple-item
scale for assessing electronic service quality", Journal of Service Research, Vol.
7, Iss. 3; pp. 213-33.
Parasuraman, A., Zeithaml, V.A. and Berry, L.L. (1985), "A conceptual model of
service quality and its implications for future research", Journal of Marketing,
Vol. 49, Iss. 3; pp. 41-50.
24
Parasuraman, A., Zeithaml, V.A. and Berry, L.L. (1988), “SERVQUAL: A Multiple-
Item Scale for Measuring Consumer Perceptions of Service Quality”, Journal of
Retailing, Vol. 64, Iss. 1; pp. 12-40.
Patricio, L., Fisk, R.P., e Cunha, J.F. (2003), “Improving satisfaction with bank
service offerings: measuring the contribution of each delivery channel”,
Managing Service Quality, Vol. 13, Iss. 6; pp. 471.
Pikkarainen, K., Pikkarainen, T., Karjaluoto, H. and Pahnila, S. (2006), "The
measurement of end-user computing satisfaction of online banking services:
empirical evidence from Finland", The International Journal of Bank
Marketing, Vol. 24, Iss. 2/3; pp. 158.
Rao, C.P. and Kelkar, M.M. (1997), “Relative Impact of Performance and Importance
Ratings on Measurement of Service Quality”, Journal of Professional Services
Marketing, Vol. 15, Iss. 2; pp. 69-86.
Reibstein, D.J. (2002), “What attracts customers to online stores and what keeps them
coming back?”, Journal of the Academy of Marketing Science, Vol. 30, No. 4;
pp. 465-75.
Roth, A.V. and Van der Velde, M. (1989), "Investing in retail delivery system
technology", Journal of Retail Banking, Vol. 11, Iss. 2; pp. 23-34.
Ruyter, K. and Bloemer, J. (1999), “Customer Loyalty in Extended Service Settings:
The Interaction between Satisfaction, Value Attainment and Positive Mood”,
International Journal of Service Industry Management, Vol. 10, Iss. 3; pp. 320-
336.
Saleh, F. and Ryan, C. (1992), "Analysing service quality in the hospitality industry
using the SERVQUAL model", Services Industries Journal, Vol. 11, Iss. 3; pp.
324-43.
Schaggnit, T. (1998), “Business by Bytes”, Ivey Business Quarterly, Vol. 62, Iss. 4;
pp. 32-37.
Schneiderman, B. (1992), Designing the User Interface: Strategies for Effective
Human Computer Interaction, 2nd Ed., Addison-Wesley: Reading.
Seth, N., Deshmukh, S.G. and Vrat, P. (2005), "Service quality models: a review",
International Journal of Quality & Reliability Management, Vol. 22, Iss. 9; pp.
913-49.
25
Shamdasani, P., Mukherjee, A. and Malhotra N. (2008), “Antecedents and
consequences of service quality in consumer evaluation of self-service internet
technologies”, The Service Industries Journal, Vol. 28, Iss. 1; pp. 117.
Spreng, R.A. and Mackoy, R.D. (1996), "An empirical examination of a model of
perceived service quality and satisfaction", Journal of Retailing, Vol. 72, Iss. 2;
pp. 201-14.
Tam, J.L.M. and Wong, Y.H. (2001), “Interactive selling: A dynamic framework for
services”, The Journal of Services Marketing, Vol. 15, Iss. 4/5; pp. 379.
Taylor, S.A. and Baker, T.L. (1994), “An Assessment of the Relationship between
Service Quality and Customer Satisfaction in the Formation of Consumers’
Purchase Intentions”, Journal of Retailing, Vol. 70, Iss. 2; pp. 163-178.
Tyler, K. and Stanley, E. (2001), "Corporate banking: the strategic impact of
boundary spanner effectiveness," International Journal of Bank Marketing, Vol.
19, Iss. 6; pp. 246-60.
Westbrook, R.A. (1981), “Sources of Satisfaction with Retail Outlets”, Journal of
Retailing, 57 (fall); pp. 68-85.
Yang, Z. and Fang, X. (2004), “Online service quality dimensions and their
relationships with satisfaction: A content analysis of customer reviews of
securities brokerage services”, International Journal of Service Industry
Management, Vol. 15, Iss. 3/4; pp. 302.
Yang, Z. and Jun, M. (2002), "Consumer perception of e-service quality: from
Internet purchaser and non-purchaser perspectives", Journal of Business
Strategies, Vol. 19, Iss. 1; pp. 19-41.
Zeithaml, V., Parasuraman, A. and Malhotra, A. (2000), "e-Service quality: definition,
dimensions and conceptual model", working paper, Marketing Science Institute,
Cambridge, MA.
Zeithaml, V.A., Parasuraman, A. and Malhotra, A. (2001), "A conceptual framework
for understanding e-service quality: implications for future research and
managerial practice", MSI Working Paper Series, No. 00-115, Cambridge, MA;
pp. 1-49.

26
Zeithaml, V.A., Parasuraman, A. and Malhotra, A. (2002), "Service quality delivery
through Web sites: a critical review of extant knowledge", Journal of the
Academy of Marketing Science, Vol. 30 Iss. 4; pp. 362-75.

27
Table 1: Types of Businesses Surveyed based on their Main Activity
and Annual Turnover
Business: Main activity * Business: Annual turnover Crosstabulation
6.0% 9.6% 48.2% 8.4% 16.9% 10.8% 100.0%
.9% 1.4% 7.0% 1.2% 2.4% 1.6% 14.5%
19.0% 15.0% 33.6% 8.1% 11.5% 12.8% 100.0%
10.7% 8.4% 18.9% 4.5% 6.5% 7.2% 56.1%
15.5% 16.7% 36.3% 9.5% 8.9% 13.1% 100.0%
4.5% 4.9% 10.7% 2.8% 2.6% 3.8% 29.4%
16.1% 14.7% 36.5% 8.6% 11.5% 12.6% 100.0%
16.1% 14.7% 36.5% 8.6% 11.5% 12.6% 100.0%
% within Business:
Main activity
% of Total
% within Business:
Main activity
% of Total
% within Business:
Main activity
% of Total
% within Business:
Main activity
% of Total
Retail
Service
Manufacturing
Business:
Main activity
Total
Under 500K 500K - 1M 1M - 3M 3M - 5M 5M - 10M 10M +
Business: Annual turnover
Total
28
Table 2: Types of Businesses Surveyed based on their Ownership Structure
and Annual Turnover
Business: Organizational catagory * Business: Annual turnover Crosstabulation
18.3% 16.6% 38.9% 10.4% 10.1% 5.6% 100.0%
11.0% 9.9% 23.3% 6.2% 6.1% 3.4% 59.9%
8.8% 9.9% 40.7% 8.8% 18.7% 13.2% 100.0%
1.3% 1.5% 6.2% 1.3% 2.9% 2.0% 15.3%
19.2% 11.5% 21.2% 7.7% 5.8% 34.6% 100.0%
1.7% 1.0% 1.9% .7% .5% 3.0% 8.8%
18.2% 36.4% 45.5% 100.0%
.3% .7% .8% 1.9%
11.9% 16.7% 32.1% 4.8% 9.5% 25.0% 100.0%
1.7% 2.4% 4.6% .7% 1.3% 3.5% 14.2%
15.7% 14.8% 36.3% 8.9% 11.5% 12.8% 100.0%
15.7% 14.8% 36.3% 8.9% 11.5% 12.8% 100.0%
% within Business:
Organizational catagory
% of Total
% within Business:
Organizational catagory
% of Total
% within Business:
Organizational catagory
% of Total
% within Business:
Organizational catagory
% of Total
% within Business:
Organizational catagory
% of Total
% within Business:
Organizational catagory
% of Total
Family owned and
controlled
Unlisted public company
Listed public company
Government/semi gov.
enterprise
Other
Business:
Organizational
catagory
Total
Under 500K 500K - 1M 1M - 3M 3M - 5M 5M - 10M 10M +
Business: Annual turnover
Total
29
Table 3: Factor Analysis: Expectations and Perceptions of Service Quality
of Traditional Banking Services Rotated Component Matrix (Rsq=66.7%)
Factor Items Loadings Alpha Mean Alpha Mean
Keeping timely promises 0.853
Keeping promises 0.794
Dependable 0.773
Sympathetic and reassuring 0.657
Accurate records 0.558
Individual attention 0.783
Employees knowledge of cust. needs 0.779
Customer's best interest at heart 0.769
Personal attention 0.758
Convenient operating hours 0.483
Physical facilities appealing 0.851
Physical facilities appearance 0.813
Employees well dressed and neat 0.729
Up-to-date equipment 0.630
Employees willing to help 0.806
Prompt service 0.749
Prompt response to requests 0.724
Timing of services 0.399
Employees trustworthy 0.848
Feel safe in transactions 0.814
Employees polite 0.606
Adequate support for employees# 0.251#
Extraction Method: Principal Component Analysis. � Rotation Method: Varimax with Kaiser Normalization.
a Rotation converged in 6 iterations.
# Originally belonging to Reliability with a loading of 0.450 but decided to load to Assurance as per Parasuraman et al (1991) due to high alpha.
Assurance
0.811 4.393
0.799
Reliability
Empathy
Tangibles
Responsiveness 3.341
0.805
0.715
0.824
4.756
4.802
5.526 0.782 4.413
a. Expectations b. Perceptions
0.767
0.743
5.709
4.673
0.890 4.000
0.860 3.082
30
Figure 1: Service Quality: Expectations and Perceptions
S e rv ic e Q u a l i ty : Ex p e c ta tio n s a n d P e rce p tio n s
0 .0 0 0
1 .0 0 0
2 .0 0 0
3 .0 0 0
4 .0 0 0
5 .0 0 0
6 .0 0 0
S e r v ic e Q u a lity Dim e n s io n
Me
an
Va
lue
Ex p e c ta tio n s 5 .7 0 9 4 .6 7 3 4 .7 5 6 4 .8 0 2 5 .5 2 6
Pe rc e p tio n s 4 .0 0 0 3 .0 8 2 4 .3 9 3 3 .3 4 1 4 .4 1 3
Re lia b ility Emp a th y Ta n g ib le s Re s p o n s iv e n e s s A s s u r a n c e
31
Table 4: Comparing Service Quality Dimensions with Past Research (By Rank)
Berry and
Parasuraman
(1991)
This Research
Service Quality
Dimension
Importance
Rank
Expectations
Rank
Perceived Perf.
Rank
Reliability 1 1 3
Responsiveness 2 3 4
Assurance 3 2 1
Empathy 4 5 5
Tangibles 5 4 2
32
Figure 2: Quadrant Analysis of Service Quality Dimensions
Quadrant Analysis of Service Quality Dimensions
0
1
2
3
4
5
6
0 1 2 3 4 5 6
Expectations
Perc
ep
tio
ns
Reliability
Empathy
Tangibles
Responsiveness
Assurance
Zero Gap Line (Expectations = Perceptions)
33
Figure 3: Quadrant Analysis of Service Quality Dimensions
(Using Difference from Mean)
Quadrant Analysis of Service Quality Dimensions
(Using Difference from Mean)
3
4
5
6
3 4 5 6
Expectations
Perc
ep
tio
ns
Reliability
Empathy
Tangibles
Responsiveness
Assurance
Mean E*=5.093
Mean P*=3.846
Q4
Q3 Q1
Q2


