
Report EUR 26337 EN
Reading Literacy in EU Countries:
Evidences from PIRLS
Patrícia Dinis da Costa, Patrícia Albergaria Almeida and Luísa Araújo
European Commission
Joint Research Centre
Institute for the Protection and Security of the Citizen
Contact information
Patrícia Albergaria Almeida
Address: Joint Research Centre, Via Enrico Fermi 2749, TP 361, 21027 Ispra (VA), Italy
E-mail: [email protected]
Tel.: +39-0332-789155
Fax: +39-0332-785733
http:/ipsc.jrc.ec.europa.eu/
http://crell.jrc.ec.europa.eu/
This publication is a Reference Report by the Joint Research Centre of the European Commission.
Legal Notice
Neither the European Commission nor any person acting on behalf of the Commission
is responsible for the use which might be made of this publication.
Europe Direct is a service to help you find answers to your questions about the European Union
Freephone number (*): 00 800 6 7 8 9 10 11
(*) Certain mobile telephone operators do not allow access to 00 800 numbers or these calls may be billed.
A great deal of additional information on the European Union is available on the Internet.
It can be accessed through the Europa server http://europa.eu/.
JRC 86217
EUR 26337 EN
ISBN 978-92-79-34677-4
ISSN 1831-9424
doi: 10.2788/40816
Luxembourg: Publications Office of the European Union, 2013
© European Union, 2013
Reproduction is authorised provided the source is acknowledged.
Printed in Italy

Page | 3
Contents Introduction .................................................................................................................................................. 5
1. Theoretical Framework ............................................................................................................................. 8
1.1. Reading Literacy ................................................................................................................................. 8
1.1.1. Purposes for Reading .......................................................................................................... 10
1.1.2. Processes of Comprehension .............................................................................................. 10
1.1.3. Reading Literacy Behaviours and Attitudes ........................................................................ 12
1.2. Contexts for Learning to Read .................................................................................................... 12
2. Assessment Design .............................................................................................................................. 16
2.1. General Design of the Assessment ............................................................................................. 16
2.1.1. PIRLS 2011 Reading Passages and Question Types ............................................................. 16
2.2. Background Questionnaires ........................................................................................................ 29
3. Rationale for the study ....................................................................................................................... 30
4. Methodology ....................................................................................................................................... 31
4.1. Participants ................................................................................................................................. 31
4.2. Data Analysis ............................................................................................................................... 32
4.3. Variables...................................................................................................................................... 35
5. Results ..................................................................................................................................................... 38
5.1. Descriptive Statistics ........................................................................................................................ 38
5.2. Multivariate Analysis ........................................................................................................................ 42
5.3. Country-level Analysis ...................................................................................................................... 46
5.4. Trends over time .............................................................................................................................. 55
6. Discussion and Policy Implications .......................................................................................................... 59
References .................................................................................................................................................. 62
Annex .......................................................................................................................................................... 66


Introduction
Page | 5
Introduction
International large-scale assessments, such as the Program for International Student Assessment (PISA),
and probably the best known large-scale assessment, have long attracted the attention from the media
and policy makers. In particular, focus has been on the relative rankings of countries on the basis of
students' average achievement scores. PISA began in 2000 and occurs in three-yearly cycles. A project of
the Organization for Economic Cooperation and Development (OECD), 74 countries participated in the
most recent assessment cycle in 2012 representing nearly 90% of world’s economy. As part of PISA,
students complete an assessment including items testing reading literacy, mathematical literacy and
scientific literacy.
More than any other skill, the ability to read is fundamental to successfully navigating the school
curriculum. Reading literacy is one of the most important abilities students acquire as they advance
through their early school years. It is the basis for learning across all subjects. Furthermore, it is vital to
determining each individual’s trajectory through life, his or her economic wellbeing, and the ability to
dynamically and fully participate in broader society (Mullis, Martin, Foy, Drucker, 2011; OECD, 2013a).
Reading literacy is a key competence in modern societies.
Due to the importance of this skill, in 1991, the International Association for the Evaluation of School
Achievement (IEA) conducted its first international study specifically aimed at analyzing reading
achievement, the Reading Literacy Study. Later, in 2001, IEA launched the Program for International
Reading Literacy Study (PIRLS). PIRLS is one of the regular research studies of cross-national
achievement conducted by IEA, and it relies on collaboration among the research centres accountable
for data collection in each country.
In 2001 35 countries participated in PIRLS, in 2006 45 countries took part in the study, and in the last
2011 study 49 countries participated in PIRLS and prePIRLS1. So, PIRLS 2011 was the third in an
international 5-yearly cycle of assessments designed to measure trends in reading literacy achievement
at the fourth grade. Grade 4 was chosen because it represents an important transition point in students’
1 Administered for the first time in 2011 at the end of the primary school cycle, prePIRLS responds to the particular
demands and circumstances of those countries and sub-national entities whose children are still developing the
fundamental reading skills that are prerequisites for success on PIRLS. Three countries implemented prePIRLS in
2011 (Mullis et al., 2011).
Introduction
Page | 6
development, the point at which students have already learned how to read and are now using reading
to learn (Chall, 1983, 1996; Mullis et al., 2011). It is also the point at which many countries start having
separate classes for different subjects (for instance, languages, mathematics, and science). Though,
given the linguistic and cognitive demands of reading, PIRLS wants to avoid assessing very young
children. Therefore, if the average age of grade 4 students at the time of testing would be less than 9.5
years, PIRLS recommends that countries assess the next higher grade (Mullis, Martin, Kennedy, Trong &
Sainsbury, 2009).
In 2011, the PIRLS five-year cycle came into alignment with the four-cycle of IEA’s Trends in International
Mathematics and Science Study, widely known as TIMSS. TIMSS has been conducted at the fourth and
eighth grades every four years since 1995. TIMSS 2011 will be the first TIMSS assessment to have data
collection in the same school year as PIRLS at fourth grade, providing a rare opportunity for countries to
collect internationally comparable information on reading, mathematics, and science in the same year
and on the same students.
PIRLS 2011 focused on three aspects of reading literacy:
(i) purposes of reading (i.e., reading for literary experience and reading to acquire and use
information);
(ii) processes of comprehension (i.e., focusing and retrieving explicitly stated information,
making straightforward inferences, interpreting and integrating ideas and information, and
examining and evaluating content, language, and textual elements); and
(iii) behaviours and attitudes towards reading.
PIRLS provides participating countries with unique information on how well their students can read after
four years of elementary school and places this information in an internationally comparative context.
From its foundation, PIRLS was designed to measure trends in reading literacy achievement. It has been
conducted every five years (2001, 2006, 2011). The next assessment is planned for 2016. Many of the
countries participating in PIRLS 2011 also participated in the previous study cycles. So, it is possible to
measure progress in reading achievement across three time points in these countries. However, in this
specific report we only analyze some trends in reading literacy from 2006 to 2011.
In addition to data on reading achievement, PIRLS also collects an important array of contextual
information about home and school supports for literacy through the student, home, teacher, and
school questionnaires. The data from these questionnaires enables PIRLS to relate students’ attainment
Introduction
Page | 7
to different types of curricula, teaching and learning practices, and school environments. Since
educational systems vary widely around the world, the study of their variations provides a unique
opportunity to gain a deeper understanding of the effects of different policies and practices. The results
obtained by PIRLS can be used to improve teaching and learning methods in reading in many countries.
Furthermore, Mullis, Kennedy, Martin & Sainsbury (2006) claim that PIRLS provides “a wealth of
information that can be used not only to improve the reading curriculum and instruction for younger
students, but also help in interpreting the results for 15-year-olds in PISA” (p. 102). However, as stated
by Shiel and Eivers (2009) there is no evidence that students´ achievement in PIRLS is related to literacy
instruction. In addition, although the relationship between students´ reading scores and some
background variables at the student, household, school and class within school levels have been
investigated, more research is needed to identify the effects of the factors associated with reading
achievement.
In this report factors that explain reading achievement in EU countries are identified using PIRLS. In the
next section the theoretical framework that contextualizes the PIRLS assessment is presented. In section
2 the assessment design is briefly described. The following section presents the rationale for the study.
The methodology in terms of participants, data analysis and variables is described in section 4. The
results are presented in section 5, regarding descriptive statistics of the variables used in the analysis,
multivariate analysis, country-level analysis and, finally, some trends over time are established. In the
last section, the results previously presented are discussed and some policy measures are proposed.
Theoretical Framework
Page | 8
1. Theoretical Framework
1.1. Reading Literacy
To take a comprehensive notion of the meaning of the ability to read, PIRLS joins two terms: reading and
literacy. Combining the terms links the ability to reflect on what is read with the ability to use reading as
a tool for reaching individual and societal goals (Mullis et al., 2009). The term reading literacy has been
employed by IEA since its 1991 Reading Literacy Study (Elley, 1992, 1994; Wolf, 1995), which served as a
basis for establishing the assessment framework used by PIRLS. The framework has been regularly
updated and improved since that time, as reflected in the subsequent cycles of the PIRLS assessment
(Campbell, Kelly, Mullis, Martin, & Sainsbury, 2001; Mullis et al., 2006; Mullis et al., 2009).
In developing a definition of reading literacy to serve as the basis for PIRLS, the Reading Development
Group for 2001 looked to IEA’s 1991 study, in which reading literacy was defined as “the ability to
understand and use those written language forms required by society and/or valued by the individual.”
The Reading Development Group for 2001 elaborated on this definition for PIRLS so that it applies across
ages yet makes explicit reference to aspects of the reading experience of young children. Beginning with
PIRLS 2006, the definition was refined to highlight the widespread importance of reading in school and
everyday life. The PIRLS 2011 Assessment Framework provides the following definition of reading
literacy:
For PIRLS, reading literacy is defined as the ability to understand and use those written language
forms required by society and/or valued by the individual. Young readers can construct meaning
from a variety of texts. They read to learn, to participate in communities of readers in school and
everyday life, and for enjoyment (Mullis et al., 2009, p. 11).
This definition of reading literacy considers reading as a constructive and interactive process (Alexander
& Jetton, 2000; Anderson & Pearson, 1984; Chall, 1983; Rudell & Unrau, 2004; Walter, 1999). Readers
construct meaning in an active way, using a range of linguistic skills, cognitive and metacognitive
strategies, and their background knowledge. Literate readers are those who enjoy reading but also learn
from it, acquiring knowledge of the world and of themselves. They can enjoy and gain information from
the many forms in which text is accessible in today’s society (Greaney & Neuman, 1990; OECD, 2000;
Wagner, 1991). This encompasses traditional written forms such as newspapers, magazines, books, and
Theoretical Framework
Page | 9
documents. It also includes information and communication technologies, such as the Internet, email,
and text messaging, as well as text integrated with various video and television media (Leu, Kinzer,
Coiro, & Cammack, 2004).
According to Almasi and Garas-York (2009) and Guice (1995), discussing what students have read with
different groups of individuals permits them to build text meaning in varied contexts. Galda and Beach
(2001) and Kucer (2005) underline that social interactions about reading in one or more communities of
readers can contribute in helping students build an understanding and appreciation of texts. Guthrie
(1996) also emphasizes the role of socially constructed environments in the classroom or, for instance,
in the school library. This kind of contexts can provide pupils with formal and informal opportunities to
widen their views about texts and to conceive reading as a shared experience with their classmates.
These environments can be extended to communities outside of school as learners share with their
families and friends ideas and information obtained from reading.
Reading to learn is vital for children, since it allows them to engage in lifelong learning and,
consequently, prepares them for their professional future and their personal development. It is
commonly established that the move from learning to read to reading to learn is usually made around
Grade 4 (Chall, 1983, 1996; Mullis et al., 2006, 2009).
It is important to note the similarities that exist between the definitions of reading in PIRLS and PISA.
Although these programs target two different student populations (Grade 4 for PIRLS and 15-year-old
students for PISA), both highlight the constructive and cooperative nature of reading. Similarly to PIRLS,
PISA uses the comprehensive term of reading literacy and defines it as “understanding, using, reflecting
on and engaging with written texts, in order to achieve one’s goals, to develop one’s knowledge and
potential, and to participate in society” (OECD, 2010, p. 23). Thus, both programs share similar
definitions. PIRLS examines three aspects of students’ reading literacy:
(i) purposes for reading,
(ii) processes of comprehension, and
(iii) reading literacy behaviours and attitudes.
These three aspects are interconnected and are influenced by the contexts in which students live and
learn. With the purpose of identifying and characterizing effective procedures and practices for
developing pupils’ reading literacy, PIRLS also collects information on these contexts through
background questionnaires.
Theoretical Framework
Page | 10
In the next sections, each aspect of the reading literacy examined by PIRLS is discussed in detail.
1.1.1. Purposes for Reading
The first aspect studied by PIRLS is directly linked to the question “Why do people read?” and, more
specifically, “Why do young students read?”. PIRLS focuses on two main purposes: reading for literary
experience, and reading to acquire and use information. These two purposes account for a significant
part of the reading done by pupils in and out of school, which is frequently related to specific types of
text:
(i) Reading for literary experience. Due to the literary experience it provides, fiction is the type
of text most often read by children. It allows them to get involved in fictional actions,
events, ideas and characters while appreciating the language itself. PIRLS uses mostly
narrative fiction, for instance, short stories and novels. This kind of text provides children an
opportunity to explore and reflect upon situations that they could come across in life.
(ii) Reading to acquire and use information. This kind of reading is generally related to
informational texts, allowing pupils to understand how the real world works and why things
happen the way they do. These comprise texts that narrate events (for instance,
biographies), expository texts (for instance, textbooks and research papers), persuasive
texts (for instance, advertisements), and procedural texts (for instance, instructions and
recipes). The structure and presentation of information differs, depending on the kind of
text (Labrecque, Chuy, Brochu & Houme, 2012).
Although PIRLS distinguishes between the two purposes for reading, the comprehension processes
employed by readers for both purposes are more analogous than different.
1.1.2. Processes of Comprehension
Processes of comprehension are related to the question “How do readers construct meaning from a
text?” The four processes examined by PIRLS are:
(i) Focusing on and retrieving explicitly stated information. This process requires the reader to
be able to understand unambiguously stated information and to relate it to the question
asked. Since meaning is evident and clearly stated in the text, little or no inferring is
required. Though, the importance of the information should be recognized by the reader.
Instances of this kind of text processing include tasks such as identifying information that is

Theoretical Framework
Page | 11
relevant to the specific goal, searching for definitions of words or phrases, looking for
specific ideas, identifying the setting of a story, and finding the topic sentence or main idea
(when explicitly stated).
(ii) Making straightforward inferences. This process enables the reader to fill in the “gaps” in
meaning by deducing information from the text. Straightforward inferences require very
little effort and are usually performed routinely by skilled readers. Examples of the process
include tasks such as inferring that one event caused another event, drawing conclusions
about what the main point of a series of arguments is, determining the referent of a
pronoun, identifying generalizations made in the text, and describing the relationship
between two characters.
(iii) Interpreting and integrating ideas and information. This process allows the reader to
construct a more complete understanding of the text by integrating both prior knowledge
and the information available in the text. The connections to be made are not only implicit;
they may also be open to the reader’s interpretation. Since the interpretation is very much
determined by a reader’s personal experience, the meaning constructed through this type
of processing is likely to vary among readers. Examples of the process include tasks such as
discerning the overall message or theme of a text, considering an alternative to the actions
of the characters, comparing and contrasting text information, inferring a story’s mood or
tone, and interpreting a real-world application of text information.
(iv) Examining and evaluating content, language, and textual elements: this process enables the
reader to stand apart from the text in order to critically consider its content, language, or
textual elements. When evaluating the content, the reader may compare the writer’s
representation of the world with his or her own understanding, or with information from
other sources. When evaluating the language and textual elements, the reader may reflect
on how well the meaning is expressed by drawing upon his or her own knowledge of text
genre, structure, or language conventions. In any case, the evaluation process depends on
the reader’s familiarity with the topic and language. Examples of the process include tasks
such as evaluating the likelihood that the events described could really happen, describing
how the author devised a surprise ending, judging the completeness or clarity of
information in the text, and determining an author’s perspective on the central topic
(Labrecque, Chuy, Brochu & Houme, 2012).

Theoretical Framework
Page | 12
The four processes described above are assessed within each of the two purposes for reading (reading
for literary experience, and reading to acquire and use information).
1.1.3. Reading Literacy Behaviours and Attitudes
The ability to realize one’s potential requires not only efficient processes of comprehension, but also
behaviours and attitudes that support lifelong reading. Because of this, PIRLS dedicates a considerable
proportion of the student questionnaire to the assessment of the following important aspects:
(i) Student reading literacy behaviours. Entertaining activities, such as reading books and
magazines, searching for information on the internet, or visiting a library, play an important role
in the development of reading literacy. Several studies (Sainsbury & Schangen, 2004; van der
Voort, 2001) show that students who read for fun and participate in social aspects of reading by
discussing books with family and friends demonstrate higher reading performance. On the other
hand, van der Voort (2001) concluded that students who spend most of their leisure time
watching television tend to show lower reading achievement. Thus, out-of-school behaviours
and social interactions can be considered important aspects when assessing reading literacy.
(ii) Attitudes toward reading. Positive attitudes toward reading are among the most important
requirements for lifelong readers. Research indicates that good readers are typically those who
enjoy reading and demonstrate a positive attitude toward different reading activities (Mullis,
Martin, Kennedy, & Foy, 2007). Furthermore, a meta-analysis conducted by Petscher in 2010
showed that the positive relationship between reading attitudes and achievement is stronger
for elementary-school students than for older students.
(iii) Attitudes toward learning to read. Motivation to learn to read comprises the value of reading for
the student, his or her interest in what is read, and, most important, the feeling that he or she
can do well. It is important for students to have a strong self-concept and self-esteem regarding
their own reading skills to be capable to reach higher levels of reading literacy (Quirk,
Schwanenflugel & Webb, 2009). Fluent and successful readers enjoy challenging reading, which
goes away from simple decoding and word recognition and involves personal interest in what is
read.
1.2. Contexts for Learning to Read
Young children acquire reading literacy through a variety of activities and experiences within different
contexts. During their primary school years, their skills, behaviors, and attitudes associated with reading
Theoretical Framework
Page | 13
literacy are mainly developed at home and in school. Several resources and activities support children’s
reading literacy, including those that happen as a natural and informal part of the daily life. Actually, less
structured activities can be as important in facilitating young children develop reading literacy as the
more structured activities that happen in classrooms. Furthermore, each context supports the other,
and the link between home and school is a crucial element in learning (Mullis et al., 2009; Park, 2008;
Weinberger, 1996).
Further than the direct influence of home and school on children’s reading are the wider environments
in which children live and learn. Children’s homes and schools are sited in communities with different
aims, resources, and organizational characteristics. These features will likely influence home
environments and schools and therefore children’s reading literacy.
The national context in which children live and go to school is also very important. The level of resources
generally available in a country; government decisions about the priorities given to education; and the
curricular goals, programs, and policies related to reading education will unquestionably impact on
school and on home contexts for learning to read (Mullis et al., 2009, p. 33). Because the factors that
may foster success in learning or those that may impede learning are distributed across community,
home, and school environments, PIRLS has adopted a framework that considers relationships among
different contexts:
(i) Home context. IEA studies conducted over the past 20 years have shown a strong positive
relationship between the reading achievement of elementary school students and a
supportive environment at home (Mullis, Martin, Foy & Drucker, 2012). In order to further
investigate this relationship, the PIRLS 2011 Learning to Read Survey was used to collect
data on economic, social, and educational resources at home; parental emphasis on literacy
development; and parents’ reading behaviours and attitudes.
(ii) Classroom context. The classroom context is as important as the home context for literacy
development, since pupils spend several hours each day with other pupils and teachers in
the classroom. Among classroom factors examined by PIRLS are teacher education and
development; teacher characteristics and attitudes; teaching, learning and assessment
strategies; instructional materials and technology; and classroom characteristics (for
instance, class size).

Theoretical Framework
Page | 14
(iii) School context. Since resources and policies established at the school level frequently
influence the structure and environment at the classroom level, PIRLS pays particular
attention to school factors, including school characteristics (for instance, location,
composition by student background), school resources, school climate for learning, school
organization for instruction, and parental participation in school activities.
(iv) Community context. Contexts previously described - home, classroom, and school - do not
function isolated from each other; they are all closely interconnected and shaped by a more
global community context. The capability of a country to create a literate population
depends deeply on its ability to develop and implement effective educational programs and
stimulus for further reading improvement. In order to evaluate cultural, social, political, and
economic factors at the country level, PIRLS collects information on countries’ languages
and emphasis on literacy, demographics and resources, the organization and structure of
the education system, and the reading curriculum in elementary school (Labrecque, Chuy,
Brochu & Houme, 2012).
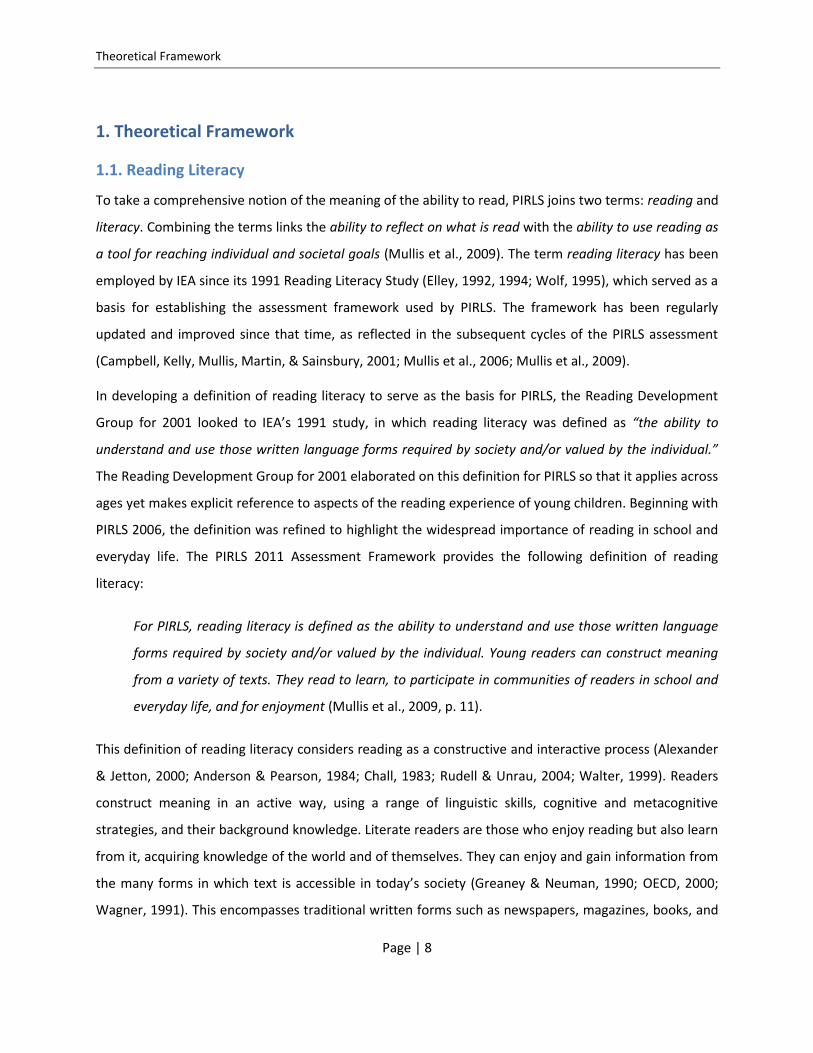
Figure 1. Contexts that influence children’s reading literacy (adapted from Mullis et al., 2009, p. 35).
School Classroom Home
National and
Community
Contexts
Instruction
and
Experiences
Student
Reading
Achievement
Student
Reading
Behaviours and
Attitudes

Theoretical Framework
Page | 15
Figure 1 illustrates the interactions among the home, school, and classroom contexts on pupils’ reading
development and how these relationships are shaped by the community and country contexts. The
figure shows how learners’ outcomes, such as reading achievement, behaviors and attitudes, are
products of instruction and experiences gained in diverse contexts. Also, it is important to underline that
achievement and attitudes can strengthen one another. Better readers may enjoy and value reading
more than poorer readers, thus reading more and further improving their skills (Mullis et al, 2009, p.
34).
Information about the home, school, and classroom contexts was collected by means of background
questionnaires that were completed by the students being tested, their parents or caregivers, their
school principals, and their teachers. Information about the community contexts was collected through a
curriculum questionnaire completed by the national research coordinators in each country. Based on
this questionnaire, each PIRLS country prepared a chapter for the PIRLS 2011 Encyclopedia2 (Mullis,
Martin, Minnich, Drucker & Ragan, 2012), summarizing the structure of its education system; the
reading curriculum and reading instruction in primary school; teacher-education requirements; and
assessment and examination practices.
Assessment Design
Page | 16
2. Assessment Design
2.1. General Design of the Assessment
The goal of the PIRLS assessment is to provide a comprehensive picture of reading literacy achievement
across the world (Mullis et al., 2009). The texts and items used in PIRLS 2011 were selected based on the
conceptual framework, which targeted two reading purposes and four comprehension processes, as
described formerly. The assessment was divided evenly between reading for literary experience and
reading to acquire and use information — the two purposes that account for most of the reading
activity. Within each of these purposes, four processes of comprehension were measured: focusing on
and retrieving explicitly stated information (20 per cent); making straightforward inferences (30 per
cent); interpreting and integrating ideas and information (30 per cent); and examining and evaluating
content, language, and textual elements (20 per cent). Table 1 shows the reading purposes and
processes assessed by PIRLS and the percentages of the test allocated to each.
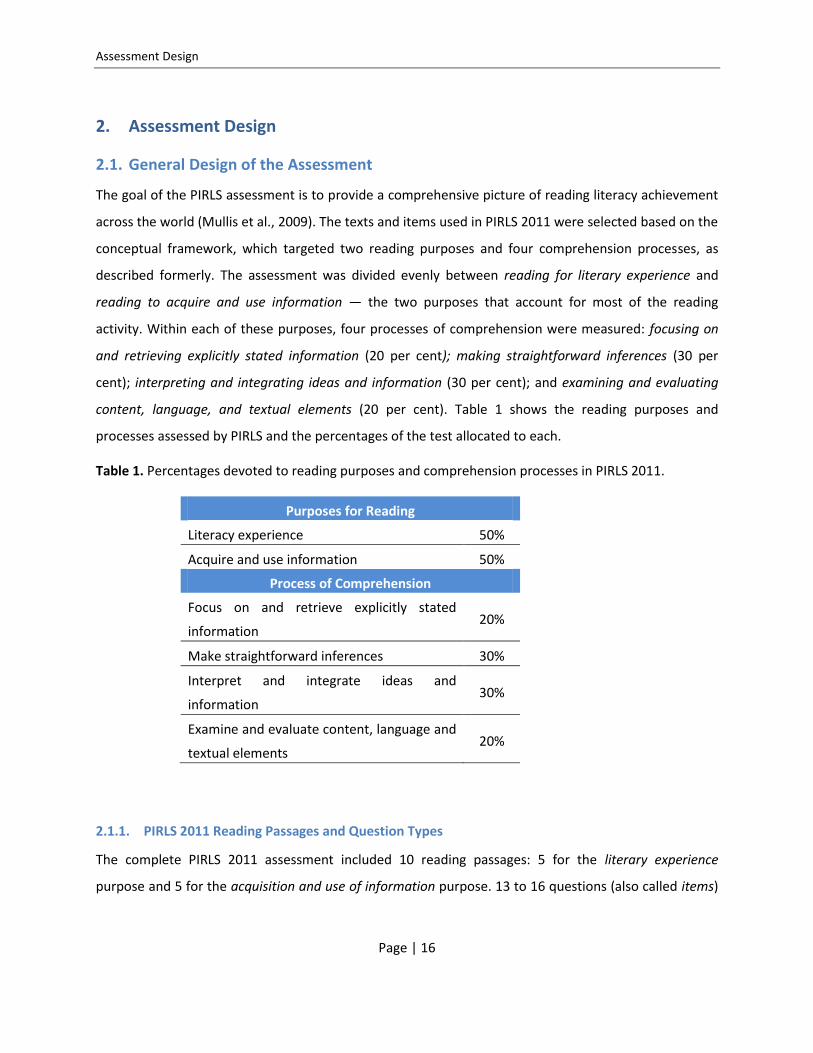
Table 1. Percentages devoted to reading purposes and comprehension processes in PIRLS 2011.
Purposes for Reading
Literacy experience 50%
Acquire and use information 50%
Process of Comprehension
Focus on and retrieve explicitly stated
information 20%
Make straightforward inferences 30%
Interpret and integrate ideas and
information 30%
Examine and evaluate content, language and
textual elements 20%
2.1.1. PIRLS 2011 Reading Passages and Question Types
The complete PIRLS 2011 assessment included 10 reading passages: 5 for the literary experience
purpose and 5 for the acquisition and use of information purpose. 13 to 16 questions (also called items)

Assessment Design
Page | 17
were raised for each reading passage. There were 135 items in total, divided almost equally between
multiple-choice questions and constructed-response questions.
Table 2. Main characteristics of the reading passages selected for the PIRLS 2011 assessment.
Text feature Literary texts Informational texts
Type of passages Complete short stories or episodes
(contemporary and traditional)
Continuous and non-continuous
informational passages (covering
scientific, ethnographic, biographical,
historical, and practical information
and ideas)
Number and
length of passages
Five passages of approximately 800
words
Five passages of 600 to 900 words
Visuals Supportive colourful illustrations Presentational features such as
diagrams, maps, illustrations,
photographs, or tables
Structure Two main characters and a plot with
one or two central events in each
story
Various structures, including structure
by logic, argument, chronology, and
topic
Other features A range of styles and language
features, such as first person
narration, humour, dialogue, and
some figurative language
A range of organizational features,
such as subheadings, text boxes, or
lists
With the purpose of linking the data across years and to provide a groundwork for measuring trends, 6
of 10 passages and item sets (3 literary and 3 informational) were retained from former assessments.
The remaining 4 passages and items sets (2 literary and 2 informational) were newly developed.
Hundreds of passages were reviewed regarding the selection of those that would satisfy PIRLS
requisites:
(i) Passages had to be appropriate for Grade 4 students in content, level of interest, and
readability;
Assessment Design
Page | 18
(ii) Passages had to be well written in terms of depth and complexity to allow for an adequate
number of questions;
(iii) Passages had to avoid cultural bias, and to be equally familiar or unfamiliar to all
respondents.
Table 2 summarizes the main features of the reading passages of the PIRLS 2011 assessment.
Students’ ability to comprehend text through the four PIRLS comprehension processes is assessed via
comprehension questions that accompany each text. As mentioned previously, two question formats
are used in the PIRLS assessment — multiple-choice and constructed-response:
(i) Multiple-choice. This question format includes four answer options, which are written in a
succinct manner to lessen the reading load. Only one of the four options is correct. The
incorrect options were reasonable, but not deceptive. Though any comprehension
processes could be assessed with multiple-choice questions, this format was mostly used
for processes that do not rely on complex evaluations and interpretations.
(ii) Constructed-response. This question format requires learners to construct a written
response, and intends to illicit an interaction between the reader, the text, and the context.
The constructed-response items can be either short or extended. They are used to assess
any of the four comprehension processes but are mainly suitable for interpretation
processes calling for students’ background knowledge and experiences.
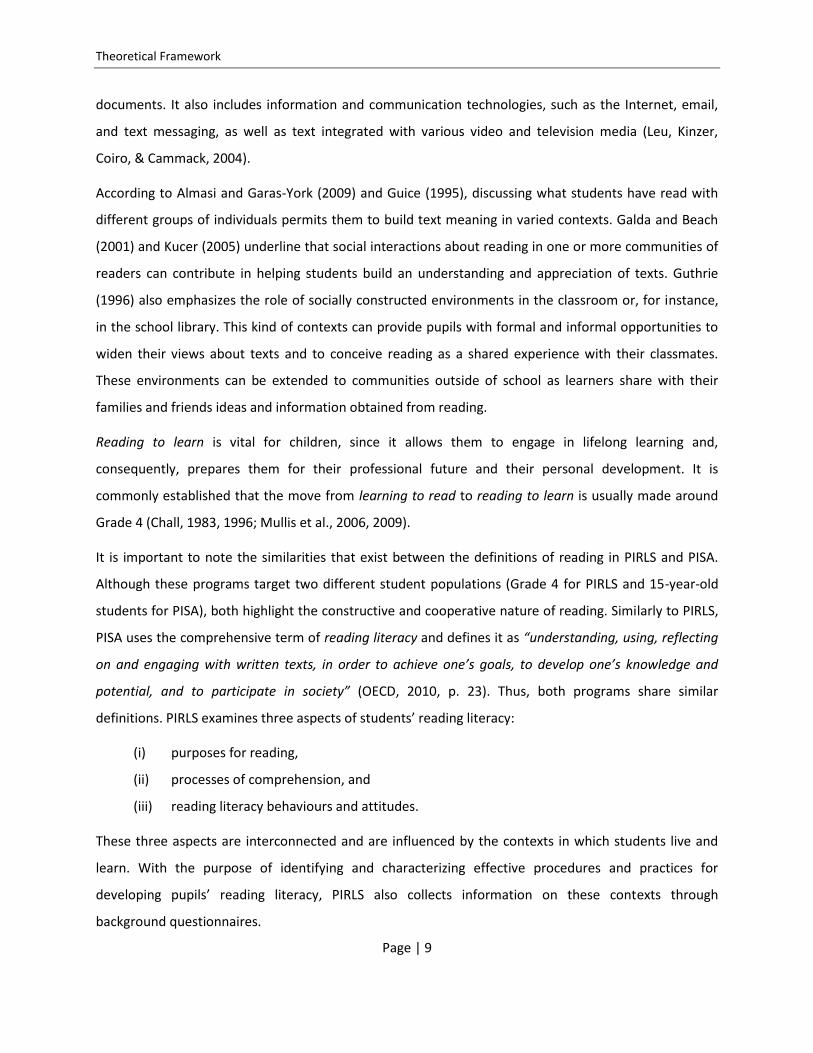
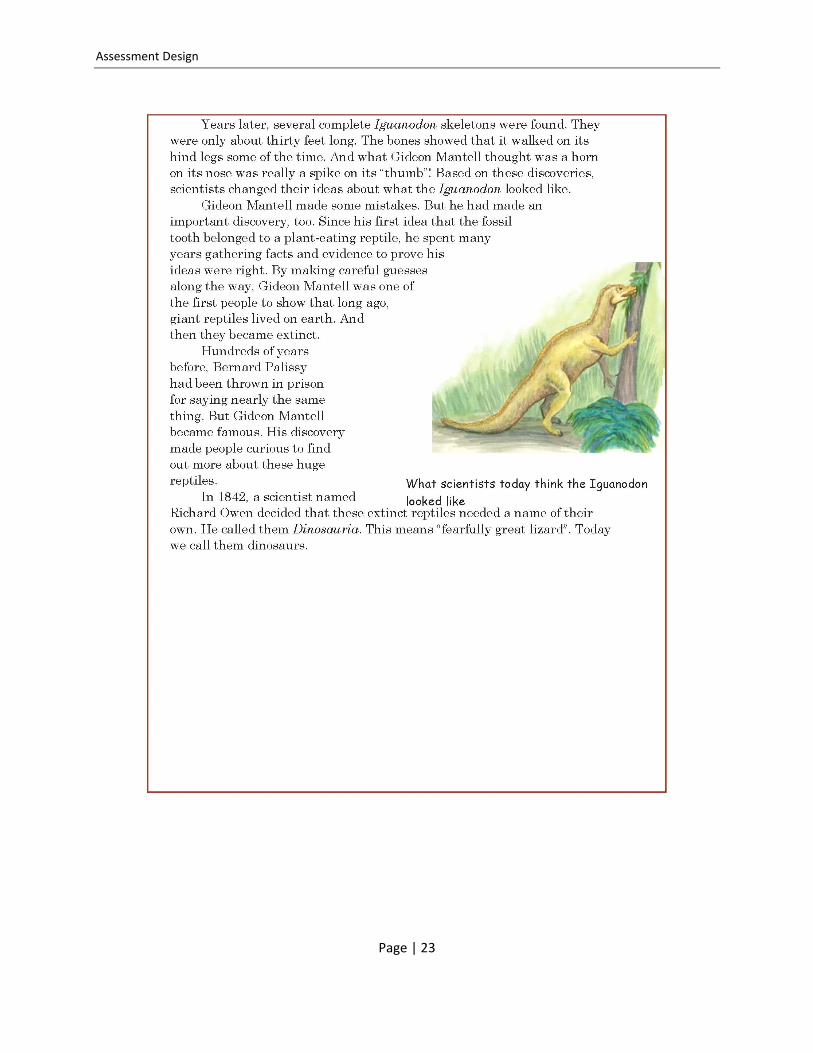
In the next pages an example2 of an informational reading passage used in the 2011 PIRLS survey is
shown: The Giant Tooth Mystery. Samples of questions about the same passage are also presented.
2 Example of the informational reading passage and of the questions from PIRLS 2011 Assessment. Copyright
© 2013 International Association for the Evaluation of Educational Achievement (IEA). Publisher: TIMSS &
PIRLS International Study Center, Lynch School of Education, Boston College, Chestnut Hill, MA and
International Association for the Evaluation of Educational Achievement (IEA), IEA Secretariat, Amsterdam,
the Netherlands. Online available: http://nces.ed.gov/surveys/pirls/pdf/passage_full.pdf

Assessment Design
Page | 19

Assessment Design
Page | 20

Assessment Design
Page | 21

Assessment Design
Page | 22
Assessment Design
Page | 23

Assessment Design
Page | 24
The following question is an example of a multiple choice question aiming at examining students’ ability
to focus on and retrieve explicitly stated information.
Example 1. What is a fossil | Multiple-choice question | Focus on and retrieve explicitly stated
information
Example 2 shows a constructed-response item that examines learners’ ability to make straightforward
inferences.
Example 2. Why people believed in giants | Constructed-response question | Make straightforward
inferences
An instance of a correct response for the previous question:
Assessment Design
Page | 25
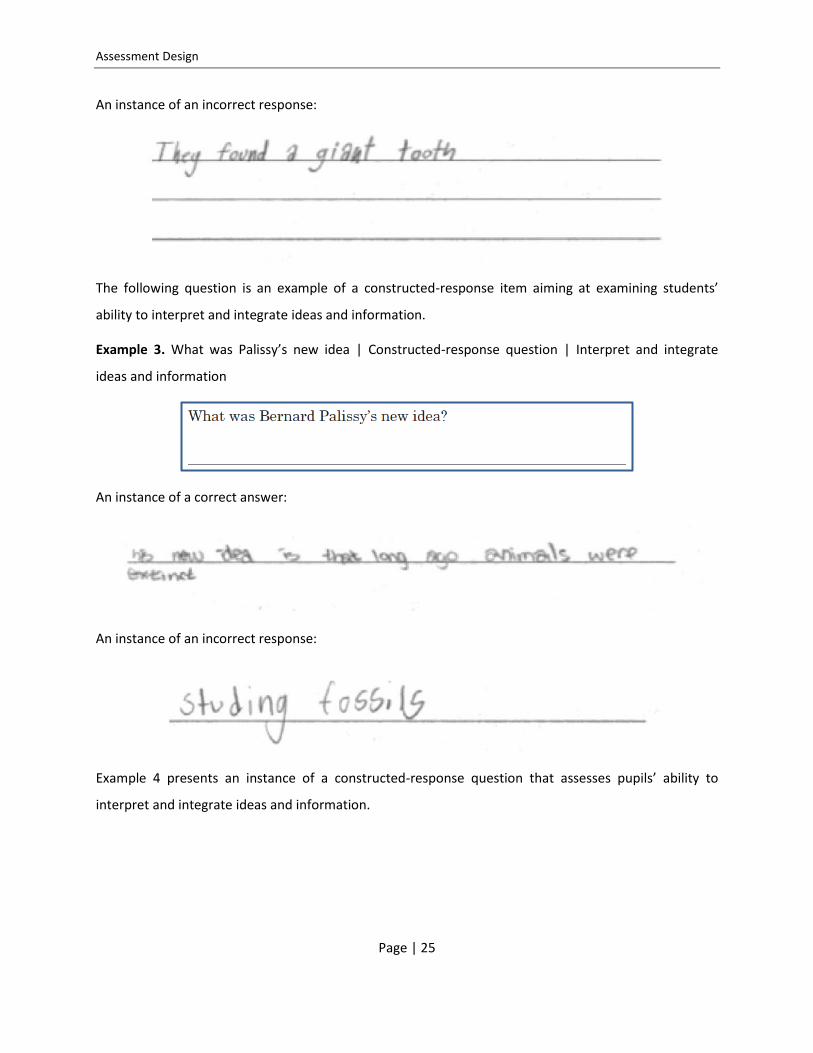
An instance of an incorrect response:
The following question is an example of a constructed-response item aiming at examining students’
ability to interpret and integrate ideas and information.
Example 3. What was Palissy’s new idea | Constructed-response question | Interpret and integrate
ideas and information
An instance of a correct answer:
An instance of an incorrect response:
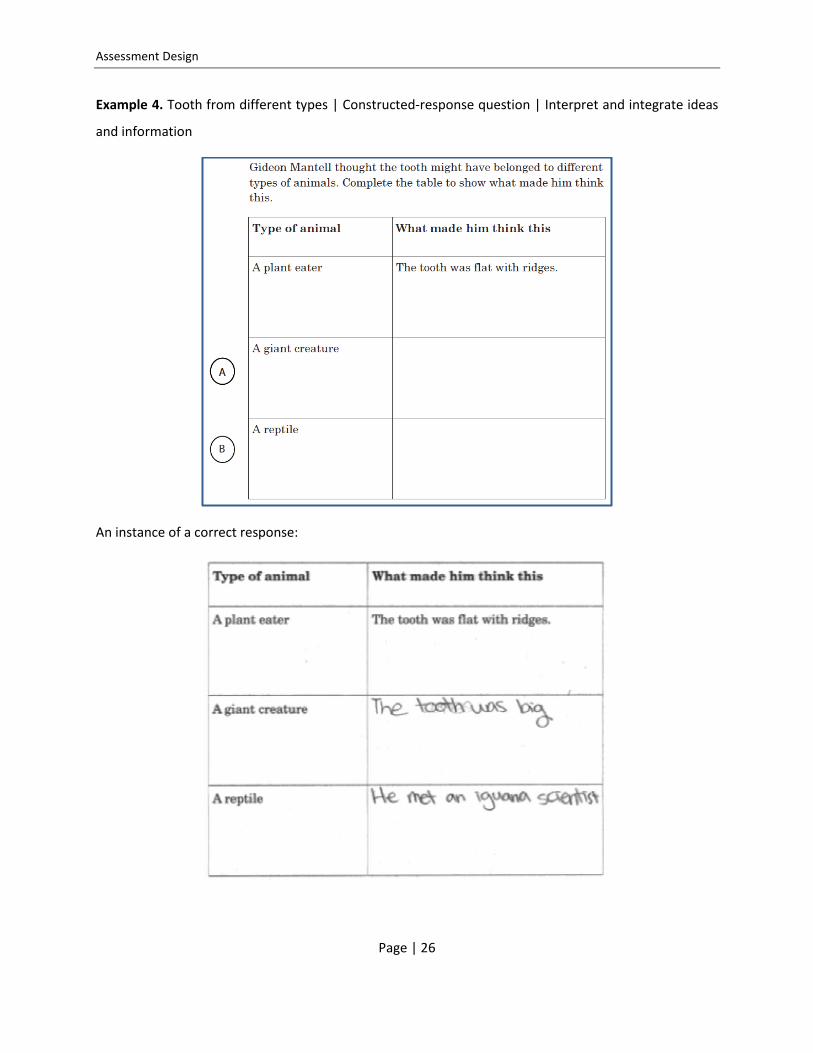
Example 4 presents an instance of a constructed-response question that assesses pupils’ ability to
interpret and integrate ideas and information.
Assessment Design
Page | 26
Example 4. Tooth from different types | Constructed-response question | Interpret and integrate ideas
and information
An instance of a correct response:

Assessment Design
Page | 27
An instance of an incorrect response:
Example 5 shows a multiple-choice question that aims to test learners’ ability to make straightforward
inferences.
Example 5. Why Gideon took tooth to a museum | Multiple-choice question | Make straightforward
inferences.
The next example presents a constructed response item aiming at testing students’ ability to examine
and evaluate content, language, and textual elements.
Assessment Design
Page | 28
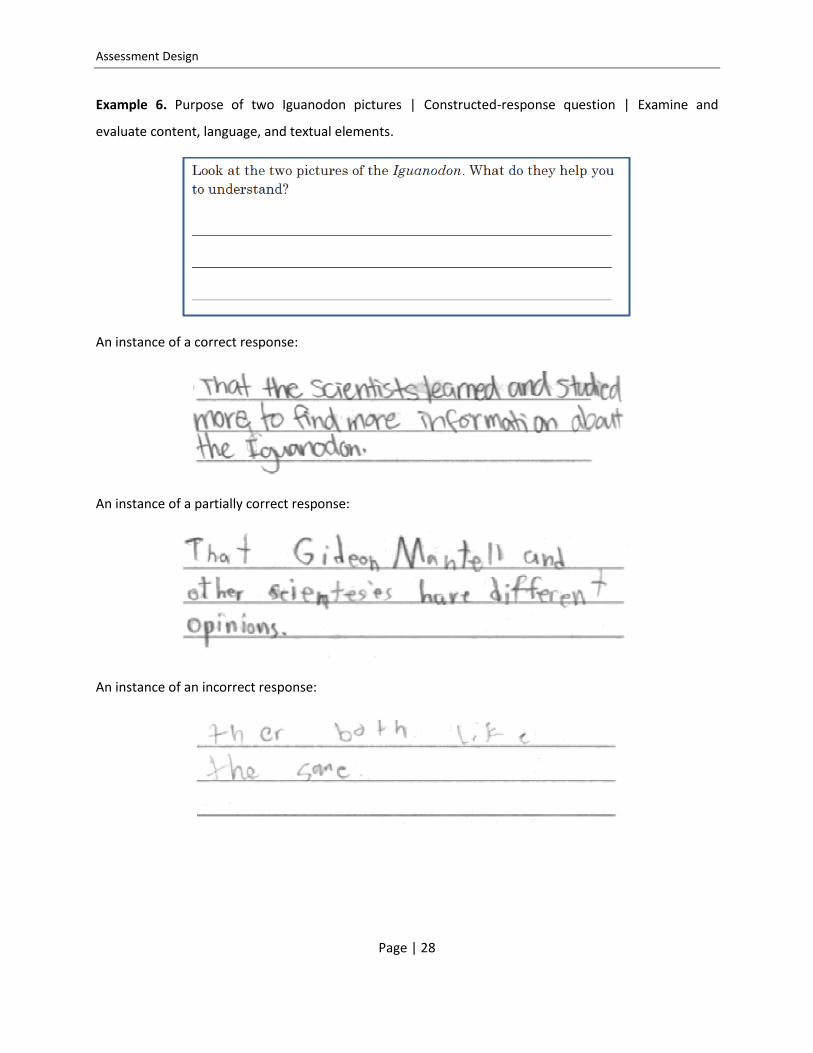
Example 6. Purpose of two Iguanodon pictures | Constructed-response question | Examine and
evaluate content, language, and textual elements.
An instance of a correct response:
An instance of a partially correct response:
An instance of an incorrect response:
Assessment Design
Page | 29
2.2. Background Questionnaires
As mentioned in section 1.2, several contexts can contribute to the development of children’s reading
abilities. Thus, in order to gather information on community, school, and home environments, PIRLS
2011 administered the following background questionnaires:
(i) Student Questionnaire. This questionnaire was included in the assessment booklets and was
completed by each participating student. It asked about aspects of students’ home and school
lives, particularly demographic information, home setting, school climate for learning, out-of-
school reading behaviours, and attitudes toward learning.
(ii) Learning to Read Survey (Home Questionnaire). This questionnaire was addressed to the parents
or primary caregivers of each participating student. It asked about language spoken at home,
preschool literacy-centred experiences, homework activities, home–school involvement,
number of books at home, parent education and involvement, parents’ reading habits and
attitudes toward reading.
(iii) Teacher Questionnaire. This questionnaire was addressed to the reading teacher of each
participating Grade 4 class. It asked about the teacher’s background and education, the school
climate for learning, attitudes toward teaching, classroom characteristics, and student
engagement.
(iv) School Questionnaire. This questionnaire had to be completed by the principal of each
participating school. It asked about school characteristics, instructional time, resources and
technology, parental involvement, school climate for learning, teaching staff and the role of the
principal.
(v) Curriculum Questionnaire. This questionnaire was completed by the national research centre of
each participating country. It asked about the country’s reading curriculum, including national
policy on reading, goals and standards for reading instruction, time specified for reading, and
provision of books and other literary resources (Labrecque, Chuy, Brochu & Houme, 2012).
Rationale for the Study
Page | 30
3. Rationale for the study
Given the identified effects of the factors associated with reading achievement in PIRLS 2006 for the EU
participating countries (Araújo & Costa, 2012) we sought to continue to contribute to evidence-based
policy running a secondary analysis of the PIRLS 2011 dataset for the participating Member States.
Specifically, this study addresses the following questions:
(i) Which variables related with student background characteristics, class characteristics and school
characteristics explain reading achievement in the PIRLS 2011?
(ii) What trends over time can we identify in the countries that participated in PIRLS 2006 and PIRLS
2011?
Methodology
Page | 31
4. Methodology
4.1. Participants
The European Union (EU) countries that participated in PIRLS 2011 were selected:. Austria, French
Belgium, Bulgaria, Croatia, Check Republic, Denmark, England, Finland, France, Germany, Hungary,
Ireland, Italy, Lithuania, Malta, Netherlands, Poland, Portugal, Romania, the Slovak Republic, Slovenia,
Spain and Sweden.
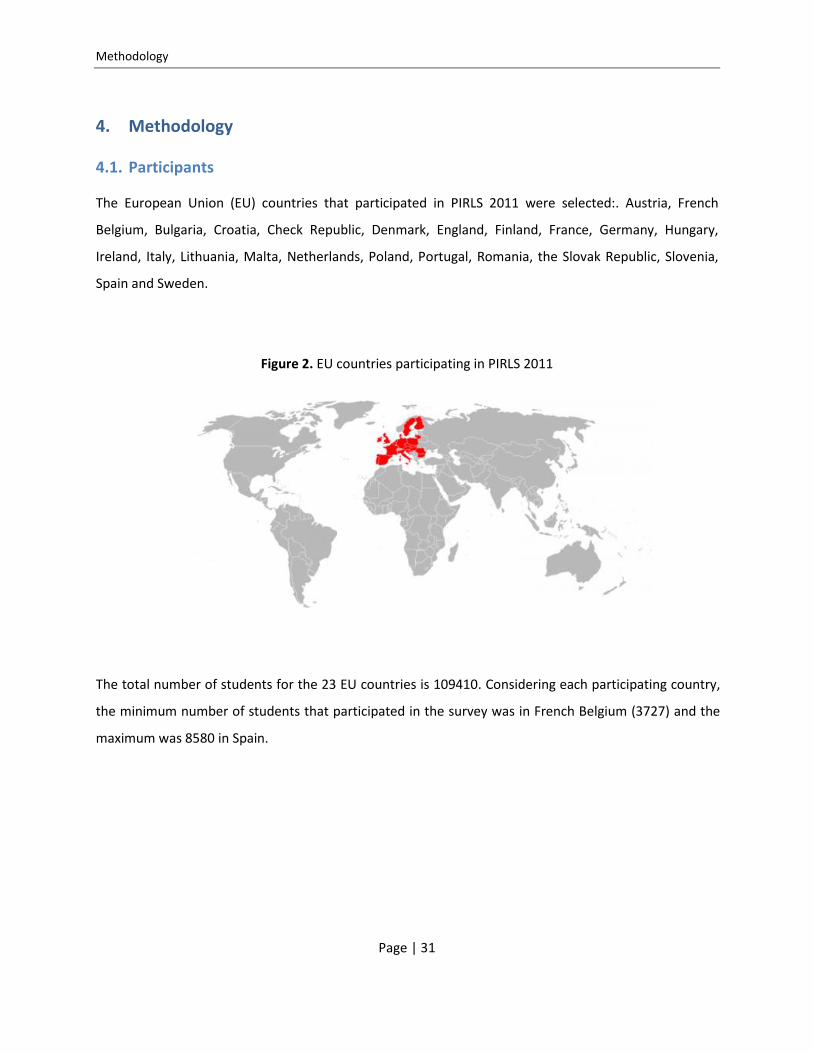
Figure 2. EU countries participating in PIRLS 2011
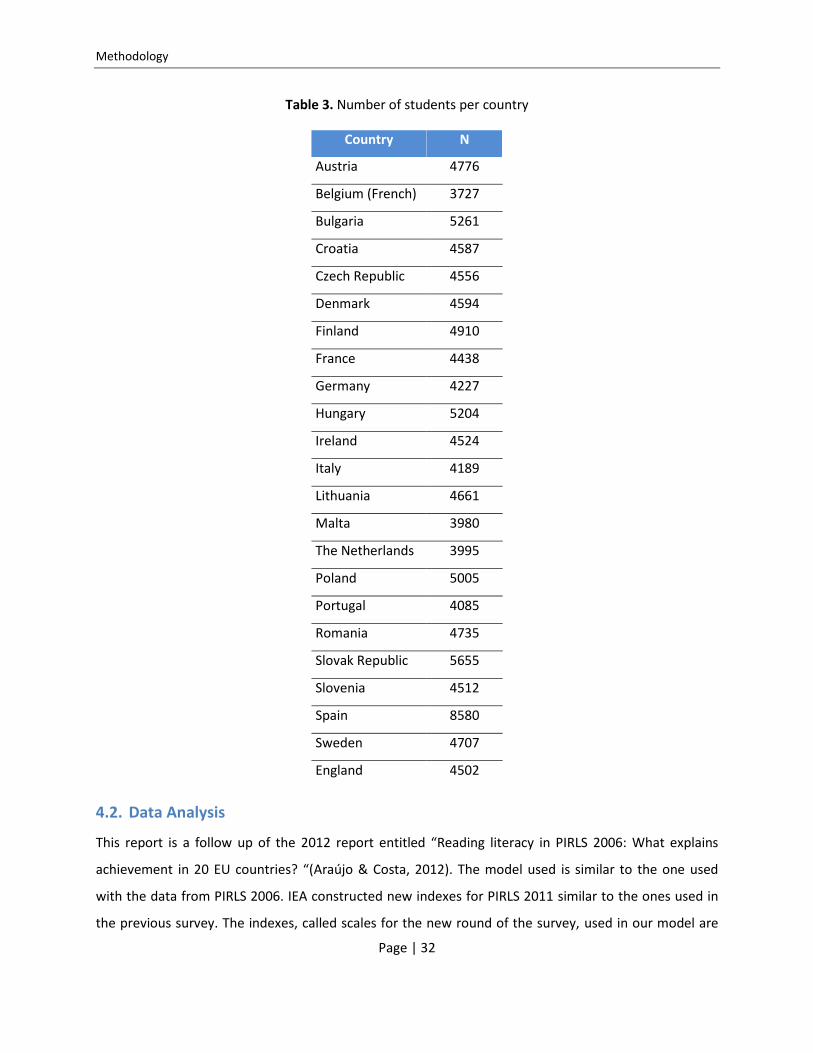
The total number of students for the 23 EU countries is 109410. Considering each participating country,
the minimum number of students that participated in the survey was in French Belgium (3727) and the
maximum was 8580 in Spain.
Methodology
Page | 32
Table 3. Number of students per country
Country N
Austria 4776
Belgium (French) 3727
Bulgaria 5261
Croatia 4587
Czech Republic 4556
Denmark 4594
Finland 4910
France 4438
Germany 4227
Hungary 5204
Ireland 4524
Italy 4189
Lithuania 4661
Malta 3980
The Netherlands 3995
Poland 5005
Portugal 4085
Romania 4735
Slovak Republic 5655
Slovenia 4512
Spain 8580
Sweden 4707
England 4502
4.2. Data Analysis
This report is a follow up of the 2012 report entitled “Reading literacy in PIRLS 2006: What explains
achievement in 20 EU countries? “(Araújo & Costa, 2012). The model used is similar to the one used
with the data from PIRLS 2006. IEA constructed new indexes for PIRLS 2011 similar to the ones used in
the previous survey. The indexes, called scales for the new round of the survey, used in our model are
Methodology
Page | 33
the following: Home Resources for Learning, Students Like Reading, and Instruction Affected by Reading
Resource Shortages.
The Home Resources for Learning (HRL) scale is grounded on students’ responses to questions in the
Student Questionnaire concerning availability of home resources, such as, number of books, and
number of home study supports (Number of books in the home; Number of home study supports), and
their parents’ responses to questions in the Learning to Read Survey (or Home Questionnaire) on the
number of children’s books, their level of education, and their occupation (Number of children’s books
in the home; Highest level of education of either parent; Highest level of occupation of either parent).
The scale was coded by IEA as many resources, some resources, few resources.
The Students Like Reading (SLR) scale is based on students’ responses to the following eight statements
of the Student Questionnaire: I read only if I have to; I like talking about what I read with other people; I
would be happy if someone gave me a book as a present; I think reading is boring; I would like to have
more time for reading; I enjoy reading; I read for fun and I read things that I choose myself. This scale
assumes the categories like reading, somewhat like reading and do not like reading.
The Instruction Affected by Reading Resource Shortages (RRS) scale was created based on principals’
responses to the School Questionnaire concerning eleven school and classroom resources, as follows:
Instructional materials (e.g., textbooks); Supplies (e.g., papers, pencils); School buildings and grounds;
Heating/cooling and lighting systems; Instructional space (e.g., classrooms); Technologically competent
staff; Computers for instruction; Teachers with a specialization in reading; Computer software for
reading instruction; Library books; Audio–visual resources for reading instruction. This variable assumes
the categories not affected, somewhat affected and affected a lot.
PIRLS data has a hierarchical structure in which students are nested in classes, and classes are nested in
schools. Multilevel modeling (Goldestein, 2003) was used in order to investigate which explanatory
factors could be found at students, class and school levels with respect to reading attainment. Three
hierarchical levels are included in the models: the first level is composed by student variables, level 2
represents the class and the last level represents the school. The variance components model was
applied to the data and the model was then estimated using iterative generalized least squares (IGLS)
(Goldestein, 1986). The computational component was generated using MLWin 2.24 software (Rabash,
Steele, Browne, & Goldstein, 2009). The bottom-up procedure, the deviance and the Akaike’s
information criteria (Akaike, 1981) were used to decide which variables to include in the model.

Methodology
Page | 34
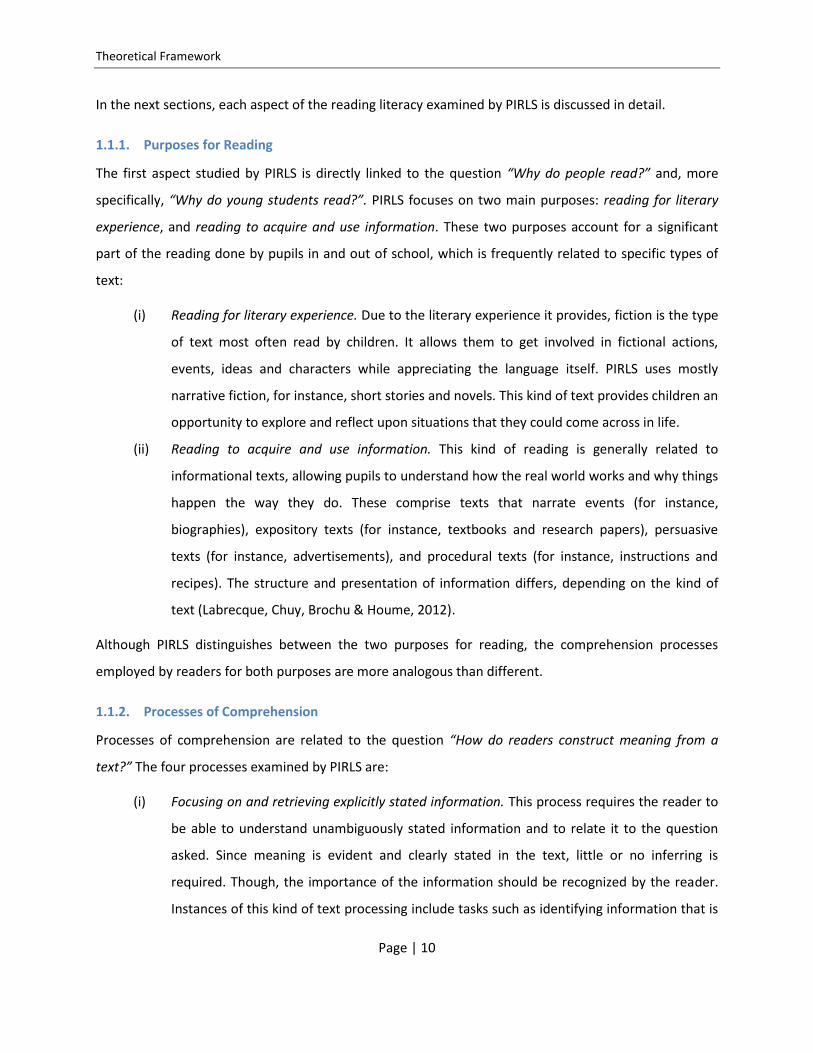
The conceptual framework followed is presented in figure 3 which is based on the previous work done
by Araújo and Costa (2012).
Figure 3. Conceptual framework of the model
The model explores the impact of home and student characteristics, class variables and school
characteristics, as reported by school principals, on students reading achievement. Variables from the
background questionnaires were considered.
The results are analyzed for the EU as a whole taking into account country effects and also at the
country level to measure the effects of specific variables on reading achievement. We took into
consideration the model with country fixed effects because it allows us to control for unobserved
heterogeneity that can be found due to historical and/or institutional factors of individual countries.
These unique effects of each country correspond to country-specific correlations with the independent
variables.
SCHOOL
Parental occupational status, school composition, school climate and parent-teacher
relationships
CLASS
Class composition, teachers’
gender
STUDENT
Socio-demographic and cultural
characteristics of the student
and parents
READING
ACHIEVEMENT

Methodology
Page | 35
In short, separate multi-level models per country were computed in order to complement the analysis
and understand which variables are more or less significant in explaining reading achievement in each
country. England, Denmark and Germany were excluded from the analysis because in at least one of the
variables of the model most of the values were missing. For instance, in England there was no data for
the variable called “Language spoken at home”. Thus, the current analysis presents results for the
remaining 20 EU countries.
The description of the variables used at each level of the model is presented below for the 20 EU
participating countries as a whole.
4.3. Variables
In the first level, corresponding to the individual characteristics of the students, the following variables
were entered:
(i) Gender – dichotomous variable with a value of 1 for girls (reference group) and 2 for boys;
(ii) Language spoken at home before began school – dichotomous variable with a value of 1 if
the language of the test is the same as the one spoken at home and 2 when it is not spoken
at home;
(iii) Parents’ highest occupational status – variable that includes: professional, small business
owner, clerical, skilled worker and general laborer. The first category represents the highest
level of occupational status for and the last option the lowest level;
(iv) Employment situation of the father - variable that considers at least full time, part time and
not working for pay;
(v) Employment situation of the mother - the same as the previous variable for the father;
(vi) Pre-school attendance - dichotomous variable with the value 1 for yes and 2 for no;
(vii) Home resources for learning scale - variable that considers many resources, some
resources, few resources constructed by IEA;
(viii) Students like reading - variable that considers like reading, somewhat like reading and do
not like reading high, medium and low levels constructed by IEA;
(ix) Recognize most letters of the alphabet – variable with three categories recoded on the

Methodology
Page | 36
basis of the original four (very well, moderately well, not very well and not at all). Similar to
the variable used by Araújo and Costa (2012).
(x) Parental book reading – variable with three categories corresponding to often, sometimes,
never or almost never.
In the second level, corresponding to the class characteristics, were considered the following variables:
(i) Gender of the teacher – dichotomous variable with a value of 1 for females (reference
group) and 2 for males;
(ii) Percentage of students not speaking the language of the test – variable that expresses the
percentage of students in a class who do not speak the test language
(iii) Percentage of students with few educational resources - variable that expresses the class
percentage of students with low home educational resources;
In the third and last level, corresponding to the school characteristics, were entered:
(i) The percentage of students that come from economically disadvantaged homes – the
variable assumes the categories 0-10%, 11-25%, 26-50%, more than 50%;
(ii) Location of the school/If is non rural or rural – dichotomous variable with 0 for non rural
(urban, suburban and medium size city) and one for rural (small town or remote rural);
(iii) Mean of the parents’ highest occupational level – the variable represent the school average
of the parents’ highest occupational level;
(iv) Instruction affected by reading resource shortage – the variable assumes three values: not
affected, somewhat affected and affected a lot, as defined by IEA;
(v) Parental involvement in school activities – variable “How would you characterize parental
involvement in school activities within your school?” which assumes the categories very
high, high, medium, low and very low;
(vi) School climate - variable defined with basis on teachers’ expectations for student
achievement: assumes the categories very high, high, medium, low and very low.
There were some adjustments in the variables used in the present analysis when compared to the
previous secondary analysis of PIRLS 2006 (Araújo & Costa, 2012), due to the fact that some variables

Methodology
Page | 37
were not part of the new round of the survey. Specifically, the variable “Teacher uses a variety of
organizational/instructional approaches” and the variable “Reading for fun outside school” could not be
included in our analysis because in PIRLS 2011 they are part of the index called “Students like reading
scale”.

Results
Page | 38
5. Results
5.1. Descriptive Statistics
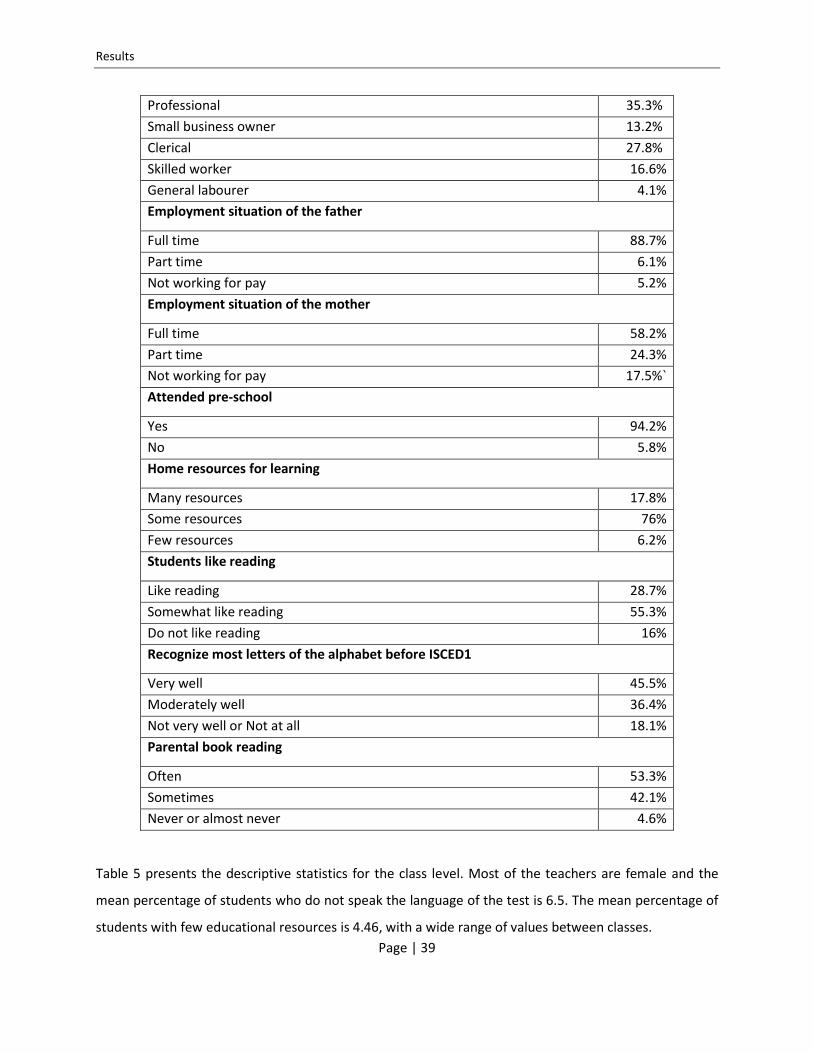
Table 4 lists the descriptive statistics for the individual-level variables. The average reading achievement
of all the students in the sample (96087) is approximately 529, with a standard deviation of 70.4. For this
variable the minimum is 130.6 and the maximum is 800.6. With respect to gender, 50.7% of the students
were boys. In what concerns immigration background, 4.5% didn’t speak the test language at home
before they began school. For the parents’ higher occupational level, the mode is the professional
category (35.3% of the parents) and the lowest percentage is obtained for general labourer. Most of the
students’ fathers worked in full time jobs and 5.2% were not working for pay. The percentage of
mothers that had a full time job was 58.2% and 17.5% were not working for pay. The percentage of
children that attended pre-school is 94.2%. In what concerns Home Resources for Learning, the
percentage of students classified in the higher level was 17.8, in the medium level was 78 and for the
low level only 6.2%. The distribution of the scale Students like Reading is the following: 28.7% of the
students like reading, 55.3% of the students reported somewhat like reading and 16% of the students do
not like reading. About forty six percent (45.5%) of students recognized most of the letters of the
alphabet very well, 36.4% moderately well and 18.1% not very well or not at all. The distribution of
parental book reading is 53.3% for the often category and 4.6% for never or almost never.
Table 4. Descriptive statistics of the individual level
Individual level
Reading achievement
M 529
SD 70.4
Min 130.6
Max 800.6
Gender
Boys 50.7%
Girls 49.3%
Language spoken at home
Is the same of the test 95.5%
Is not the same of the test 4.5%
Parent's higher occupation level
Results
Page | 39
Professional 35.3%
Small business owner 13.2%
Clerical 27.8%
Skilled worker 16.6%
General labourer 4.1%
Employment situation of the father
Full time 88.7%
Part time 6.1%
Not working for pay 5.2%
Employment situation of the mother
Full time 58.2%
Part time 24.3%
Not working for pay 17.5%`
Attended pre-school
Yes 94.2%
No 5.8%
Home resources for learning
Many resources 17.8%
Some resources 76%
Few resources 6.2%
Students like reading
Like reading 28.7%
Somewhat like reading 55.3%
Do not like reading 16%
Recognize most letters of the alphabet before ISCED1
Very well 45.5%
Moderately well 36.4%
Not very well or Not at all 18.1%
Parental book reading
Often 53.3%
Sometimes 42.1%
Never or almost never 4.6%
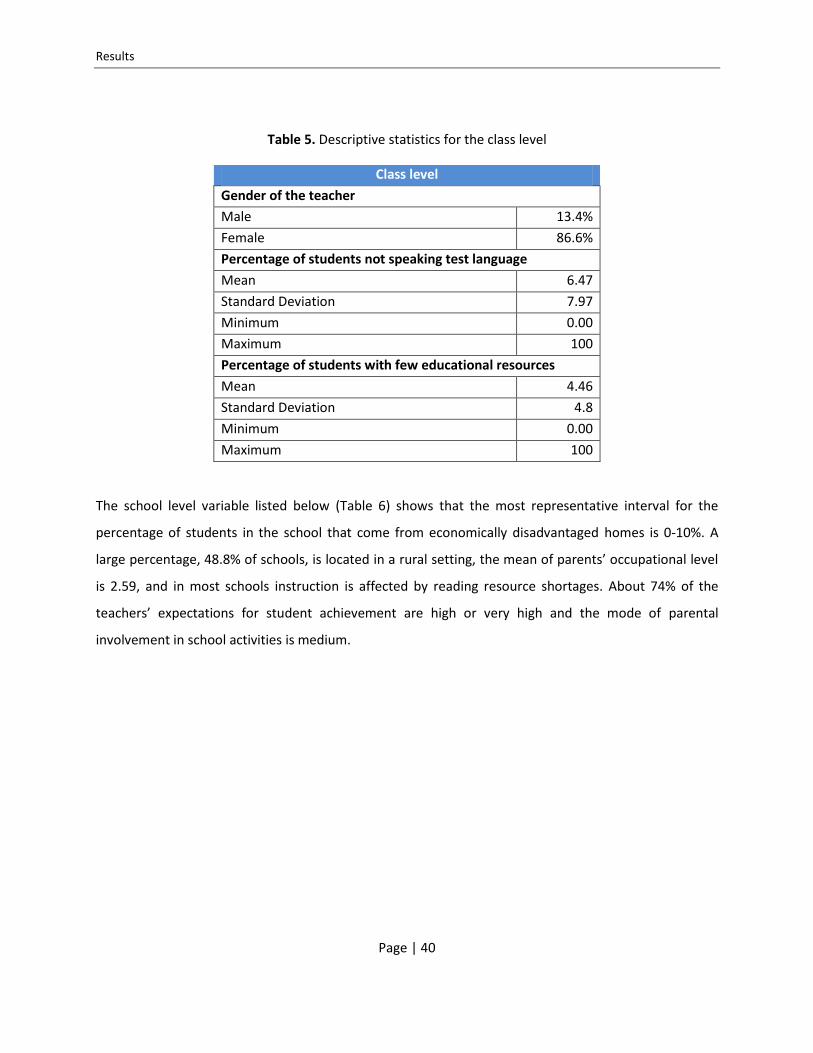
Table 5 presents the descriptive statistics for the class level. Most of the teachers are female and the
mean percentage of students who do not speak the language of the test is 6.5. The mean percentage of
students with few educational resources is 4.46, with a wide range of values between classes.
Results
Page | 40
Table 5. Descriptive statistics for the class level
Class level
Gender of the teacher
Male 13.4%
Female 86.6%
Percentage of students not speaking test language
Mean 6.47
Standard Deviation 7.97
Minimum 0.00
Maximum 100
Percentage of students with few educational resources
Mean 4.46
Standard Deviation 4.8
Minimum 0.00
Maximum 100
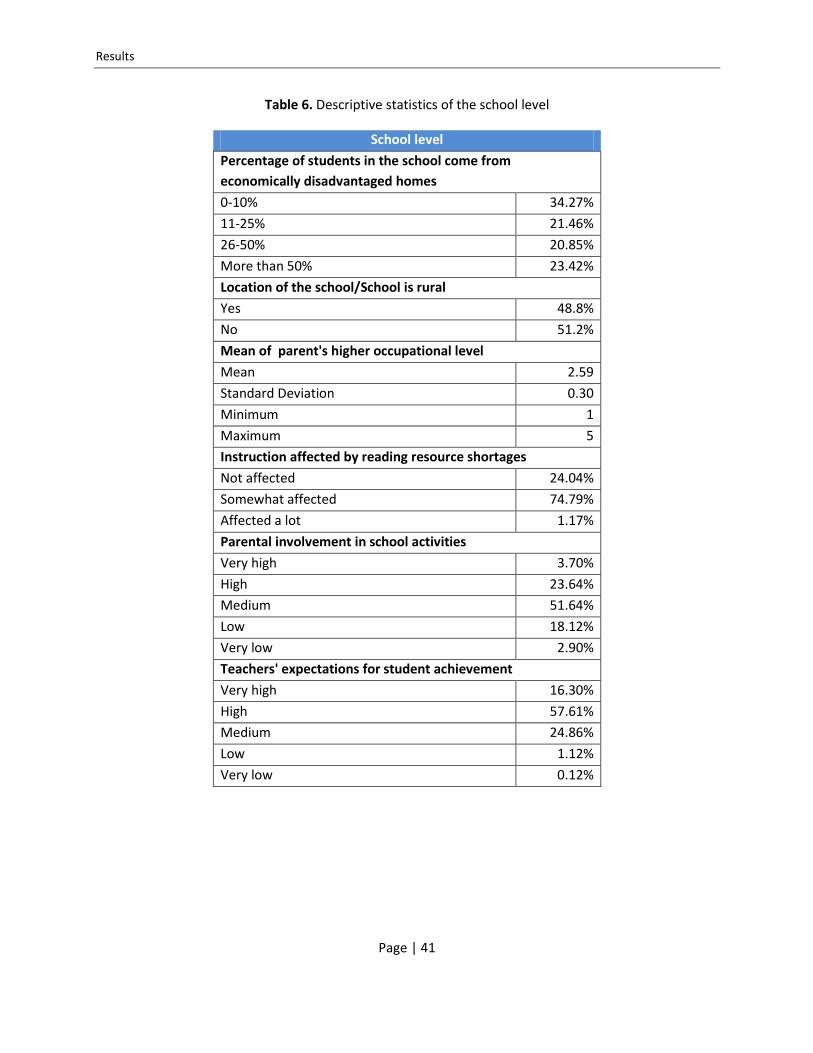
The school level variable listed below (Table 6) shows that the most representative interval for the
percentage of students in the school that come from economically disadvantaged homes is 0-10%. A
large percentage, 48.8% of schools, is located in a rural setting, the mean of parents’ occupational level
is 2.59, and in most schools instruction is affected by reading resource shortages. About 74% of the
teachers’ expectations for student achievement are high or very high and the mode of parental
involvement in school activities is medium.
Results
Page | 41
Table 6. Descriptive statistics of the school level
School level
Percentage of students in the school come from
economically disadvantaged homes
0-10% 34.27%
11-25% 21.46%
26-50% 20.85%
More than 50% 23.42%
Location of the school/School is rural
Yes 48.8%
No 51.2%
Mean of parent's higher occupational level
Mean 2.59
Standard Deviation 0.30
Minimum 1
Maximum 5
Instruction affected by reading resource shortages
Not affected 24.04%
Somewhat affected 74.79%
Affected a lot 1.17%
Parental involvement in school activities
Very high 3.70%
High 23.64%
Medium 51.64%
Low 18.12%
Very low 2.90%
Teachers' expectations for student achievement
Very high 16.30%
High 57.61%
Medium 24.86%
Low 1.12%
Very low 0.12%

Results
Page | 42
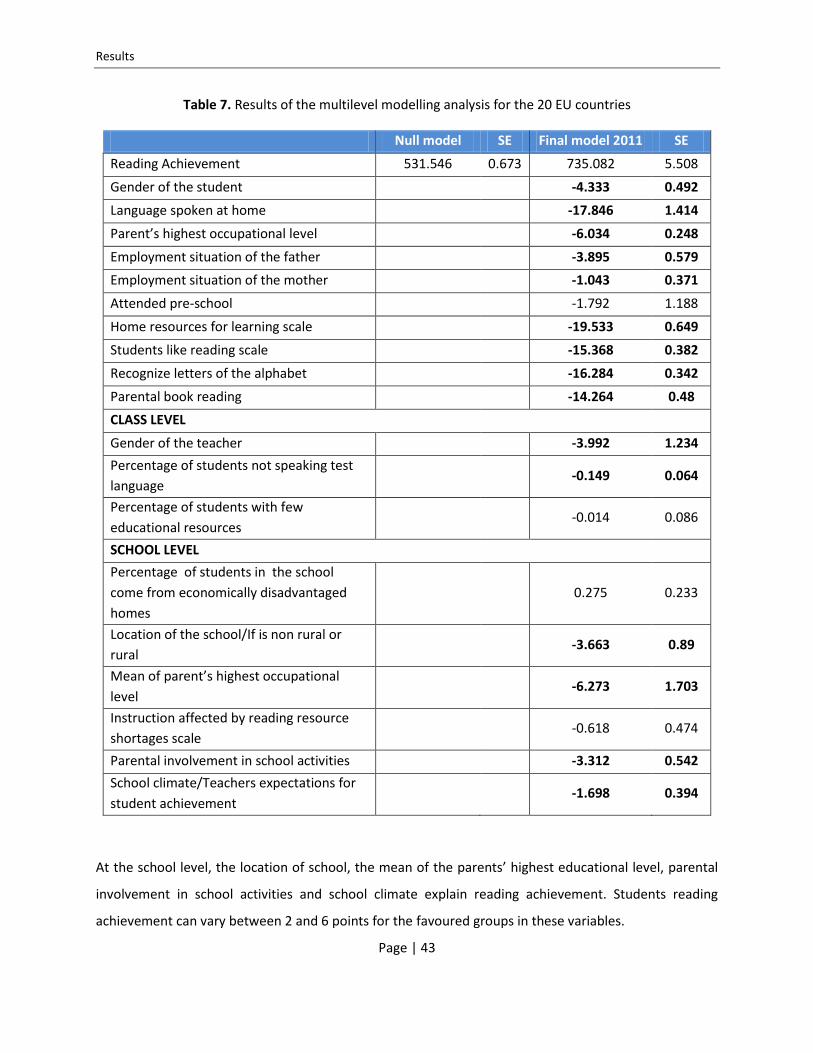
5.2. Multivariate Analysis
The results of the multilevel analysis for the EU countries as a whole are presented below. The null
model, allows us to obtain the proportion of variability, calculated using the variances estimated for the
errors, between students, between classes within schools and between the schools. The variance of the
reading proficiency can be divided as follows: about 88% of the variance is situated at the student level,
6.5% at the class level and 5.5% at the school level. The results show that a multilevel modelling is
adequate for this analysis. All the coefficient estimates presented in bold are statistically significant at
the 0.05 level. The values presented in the last column, where it says SE, indicate standard errors
associated to the coefficients. The coefficients often take a negative sign because most categorical
variables are coded either dichotomously or with the lowest value assuming the best category of the
variable.
The value of the r-square of the full model is 0.367, which indicates that 36.7% of the total variance in
reading achievement is explained by this model. Comparing the null model with the final model there is
a clear reduction in the amount of deviance in relation to that found for the null model. This indicates a
better fit and a corresponding increase in the explanation of the reading achievement.
The results show that the variables with the highest impact on students´ overall reading score at student
level are related to home resources and practices and to students´ pre - reading knowledge. More
specifically, both the students´ home resources for reading and the students like reading variables are
about as significant in explaining attainment as their knowledge of the alphabet at the start of
compulsory education and their parents´ shared book reading practices. An increase between 14 to 19
points in reading achievement is found for these variables. Additionally, the students who spoke the
same language of the test at home have an increase of 17 points in reading achievement comparing
with those who not speak the language of the test.
Moreover, at the class level the teacher’s gender and the percentage of students not speaking the test
language also influence students´ reading achievement, with a female teacher associated with better
performance (increase in reading achievement in about 4 points) and a high percentage of students not
speaking test language in a given class with worse performance.
Results
Page | 43
Table 7. Results of the multilevel modelling analysis for the 20 EU countries
Null model SE Final model 2011 SE
Reading Achievement 531.546 0.673 735.082 5.508
Gender of the student -4.333 0.492
Language spoken at home -17.846 1.414
Parent’s highest occupational level -6.034 0.248
Employment situation of the father -3.895 0.579
Employment situation of the mother -1.043 0.371
Attended pre-school -1.792 1.188
Home resources for learning scale -19.533 0.649
Students like reading scale -15.368 0.382
Recognize letters of the alphabet -16.284 0.342
Parental book reading -14.264 0.48
CLASS LEVEL
Gender of the teacher -3.992 1.234
Percentage of students not speaking test
language
-0.149 0.064
Percentage of students with few
educational resources
-0.014 0.086
SCHOOL LEVEL
Percentage of students in the school
come from economically disadvantaged
homes
0.275 0.233
Location of the school/If is non rural or
rural
-3.663 0.89
Mean of parent’s highest occupational
level
-6.273 1.703
Instruction affected by reading resource
shortages scale
-0.618 0.474
Parental involvement in school activities -3.312 0.542
School climate/Teachers expectations for
student achievement
-1.698 0.394
At the school level, the location of school, the mean of the parents’ highest educational level, parental
involvement in school activities and school climate explain reading achievement. Students reading
achievement can vary between 2 and 6 points for the favoured groups in these variables.
Results
Page | 44
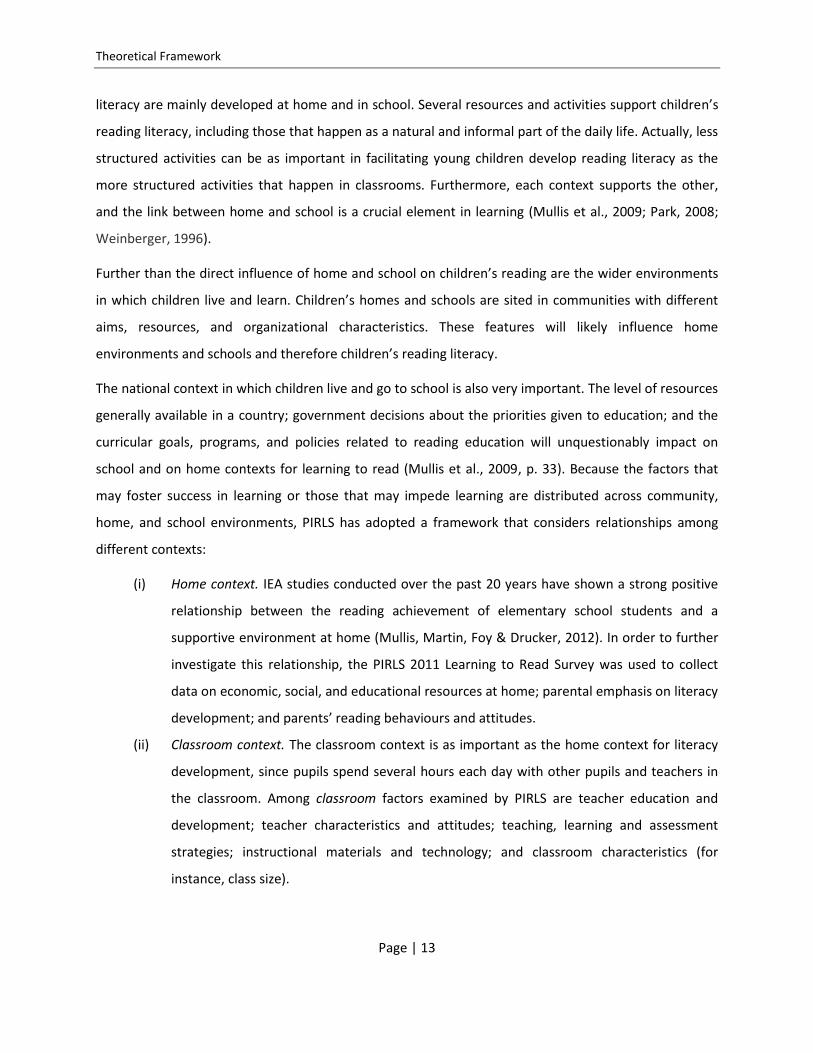
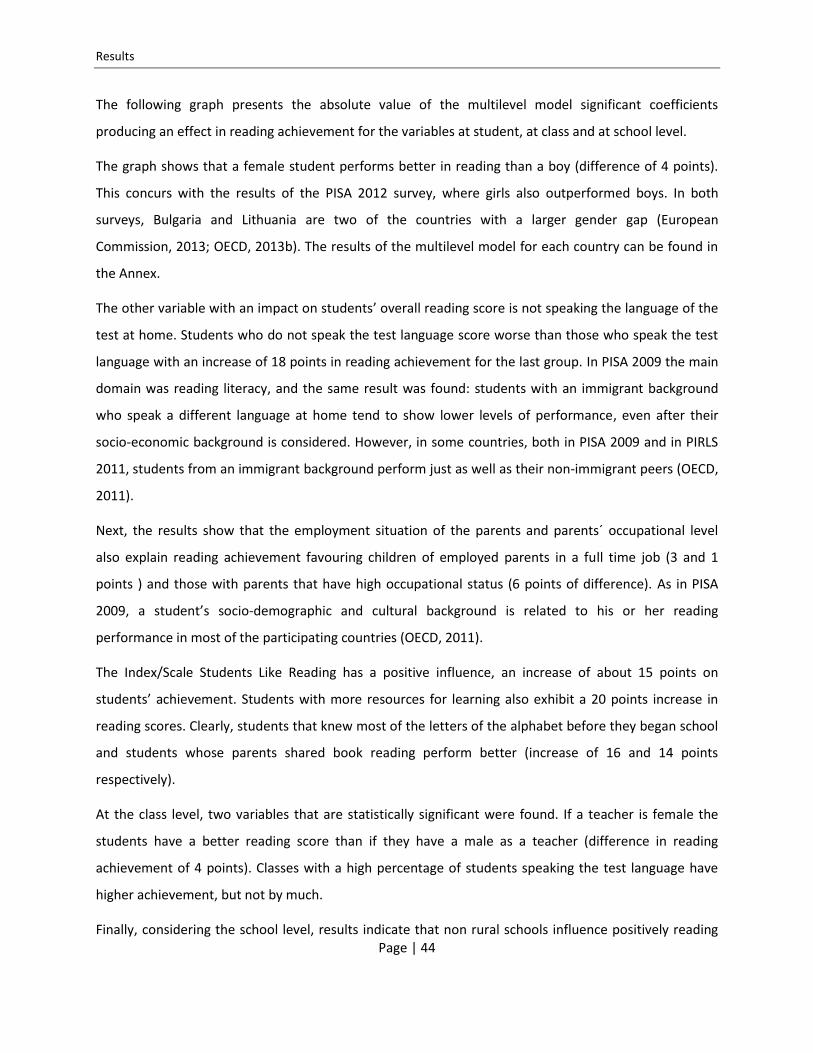
The following graph presents the absolute value of the multilevel model significant coefficients
producing an effect in reading achievement for the variables at student, at class and at school level.
The graph shows that a female student performs better in reading than a boy (difference of 4 points).
This concurs with the results of the PISA 2012 survey, where girls also outperformed boys. In both
surveys, Bulgaria and Lithuania are two of the countries with a larger gender gap (European
Commission, 2013; OECD, 2013b). The results of the multilevel model for each country can be found in
the Annex.
The other variable with an impact on students’ overall reading score is not speaking the language of the
test at home. Students who do not speak the test language score worse than those who speak the test
language with an increase of 18 points in reading achievement for the last group. In PISA 2009 the main
domain was reading literacy, and the same result was found: students with an immigrant background
who speak a different language at home tend to show lower levels of performance, even after their
socio-economic background is considered. However, in some countries, both in PISA 2009 and in PIRLS
2011, students from an immigrant background perform just as well as their non-immigrant peers (OECD,
2011).
Next, the results show that the employment situation of the parents and parents´ occupational level
also explain reading achievement favouring children of employed parents in a full time job (3 and 1
points ) and those with parents that have high occupational status (6 points of difference). As in PISA
2009, a student’s socio-demographic and cultural background is related to his or her reading
performance in most of the participating countries (OECD, 2011).
The Index/Scale Students Like Reading has a positive influence, an increase of about 15 points on
students’ achievement. Students with more resources for learning also exhibit a 20 points increase in
reading scores. Clearly, students that knew most of the letters of the alphabet before they began school
and students whose parents shared book reading perform better (increase of 16 and 14 points
respectively).
At the class level, two variables that are statistically significant were found. If a teacher is female the
students have a better reading score than if they have a male as a teacher (difference in reading
achievement of 4 points). Classes with a high percentage of students speaking the test language have
higher achievement, but not by much.
Finally, considering the school level, results indicate that non rural schools influence positively reading

Results
Page | 45
achievement, with an increase of 4 points. The higher the parents’ occupational level the higher the
students’ reading scores (about six points). Moreover, a higher parental involvement in school activities
is related to an increase of three points in students’ reading scores. A better school climate result in a
higher reading score by about two points.
Graph 1. Absolute value of the coefficients statistically significant in the model at students, class and
school level that affect students’ reading achievement (20 EU countries as a whole)
0123456789
101112131415161718192021
Gen
der
of
the
stu
de
nt
Lan
guag
e sp
oke
n a
t h
om
e
Par
ent’
s h
igh
est
occ
up
atio
nal
Lev
el
Emp
loym
en
t si
tuat
ion
of
the
fat
her
Emp
loym
en
t si
tuat
ion
of
the
mo
ther
Ho
me
res
ou
rces
fo
r re
adin
g sc
ale
Stu
den
ts li
ke r
ead
ing
scal
e
Re
cogn
ize
lett
ers
of
the
alp
hab
et
Par
enta
l bo
ok
read
ing
Gen
der
of
the
teac
her
Pe
rcen
tage
of
stu
den
ts n
ot
spe
akin
g te
st la
ngu
age
Loca
tio
n o
f th
e sc
ho
ol/
If is
ru
ral o
r n
ot
Mea
n o
f p
aren
t’s
hig
hes
t o
ccu
pat
ion
al le
vel
Par
enta
l in
volv
em
en
t in
sch
oo
l act
ivit
ies
Sch
oo
l clim
ate
/Te
ach
ers
exp
ect
atio
ns
for
stu
de
nt
ach
ieve
me
nt
Student level Class level School level
Incr
eas
e in
th
e n
um
be
r o
f p
oin
ts
Significant effects on reading achievement - PIRLS 2011
Results
Page | 46
5.3. Country-level Analysis
The results of the model per country can be found in the Annex (Table A1 to Table A20). In the
description of these results we, firstly, highlight the variables that are statistically significant in the EU
model with all 20 countries. The results show that the four variables that have a strong impact on
reading achievement at the individual level (student and home characteristics) for the model with all
countries are still consistently significant in the large majority of individual countries. These are: 1)
Home resources for learning, 2) Students like reading, 3) Recognize most of the letters of the alphabet
and 4) Parental book reading.
Across all countries, in absolute values, for the index of home resources for learning, the values vary
between ten in Lithuania and thirty two in Ireland. Concerning the Index of students like reading, the
coefficients vary between three in Croatia and twenty four in France. The variable related to the
knowledge of the alphabet varies between seven in Austria and twenty seven in Lithuania. For parental
book reading, the variation is from six points in Romania, and twenty one in Malta.
Below, we summarize the statistically significant findings for each country. In all the descriptions we first
refer to the total variance explained by the model and then we present the variance partitioned into the
three levels. After that, we present the results for the variables mentioned above that consistently show
a strong impact on reading achievement across countries. Finally, we explain the results for the other
variables at the students´, class and school levels that are statistically significant in each country.
Austria: 27.4% of the total variance in reading achievement is explained by the model. The
variance partitions of the model show that 92% is the variance between students within classrooms, 4%
is the variance among classrooms within schools and 4% is the variance among schools. The most
significant effect in reading achievement is the students’ home resources for learning. Students with
higher home resources for learning can score 22 points higher in reading. Students whose parents share
book reading practices perform better in reading (21 points). Students that like reading score 11 points
higher in reading than those who do not like reading. Students who recognized most of the letters of the
alphabet before beginning primary school have an increase of 7 points in reading achievement. If the
students’ language spoken at home is the same as that of the test there is an increase in the reading
achievement of 21 points and a higher parents’ occupational level produces a difference of 7 points.
Classes with a higher percentage of students with few educational resources can have students that
Results
Page | 47
score 1 point higher. Students that attend schools in a rural environment score 8 points higher than
those in other environments.
French Belgium: The model explains 35.4% of the total variance of students reading
achievement. The amount of variation in reading scores which can be attributed to different levels is
91.6% for the student level and 4.2% both for the classroom and for the school levels. The possession of
more resources for learning at home increases the students´ reading scores in 23 points. The ability to
recognize letters of the alphabet at the start of compulsory education impacts positively students´
reading achievement (difference of 11 points). Positive attitudes toward reading produce an increase of
19 points in students’ performance. Parental book reading is associated to higher scores (13 points).
Students that attended pre-school tends to score 31 points more in reading achievement. The students
that speak the same language of the test at home have an increase in reading achievement of 23 points.
There is an increase of 6 points in reading for students with parents who have a higher occupational
level.
Bulgaria: The value of the r-square of the full model is 0.382, which indicates that 38.2% of the
total variance in reading achievement is explained by this model. The proportions of variability between
students, between classes within schools and between the schools are 78.7%, 10.3% and 11%,
respectively. Students´ knowledge of the alphabet prior to the start of compulsory school produces
better scores in reading, specifically 21 points. Higher home resources for learning are associated to an
additional 15 points in reading. If the parents have book reading activities with their children there is an
increase of 10 points in students´ reading achievement. Students who like reading tend to perform
better in reading (9 points). Additionally, at the student level, two more variables have statistically
significant coefficients: students’ gender and parents’ occupational level. For the first variable, there is a
better performance of girls compared with boys that corresponds to a 10 point difference. A higher
parental occupational level produces a higher performance of the students by 7 points. At the school
level, schools with higher teacher expectations for students’ achievement have students that score 12
points higher in reading.
Croatia: The model explains 22.1% of the total variance in students´ reading achievement. The
variance among students within classrooms is 91.4%. The variance among classrooms within schools is
7.1% and the variance among schools is 1.5%. Knowledge of the letters of the alphabet before starting
school has a positive impact in students´ achievement of 21 points. The possession of home resources
for learning produces an increase of 11 points in students’ scores. A higher engagement of parents´

Results
Page | 48
reading activities with their children is associated to higher reading performance (11 points). Students
who report that they do not like reading present higher reading achievement of 3 points. Girls perform
better than boys in reading, with a difference of 9 points. A higher parental occupational level results in
an additional 7 points in students’ reading achievement. If the school is rural, a negative difference of 9
points can be found for the reading attainment of the students.
Czech-Republic: 29.3% of the total variance in reading achievement is explained by the model.
The variance explained at the student level is 92.2%. The variance explained at the classroom level is
7.8% and there is no variance between schools. Higher home resources for learning are associated to
higher reading performance (18 points). Students who enjoy reading activities and students whose
parents have book reading practices present better scores in reading (13 points for both variables). The
students’ knowledge of the alphabet at the beginning of primary education results in an increase of 12
points in students´ reading achievement. The language spoken at home and having a female teacher
impact reading achievement (32 points favoring those that speak the same language of the test and 15
points favoring those taught by female teachers). The highest occupational level of the parents is
associated with better reading performance, a difference of about 9 points. Students in schools where
parents have higher occupational levels also score 12 points higher in reading achievement. Parents with
a higher involvement in school activities results in an increase of reading score of 4 points.
Finland: The model explains 34.4% of the total variance of students reading achievement. The
proportions of variability between students and between classes within schools are 92% and 8%,
respectively. Additionally, the model indicates that there is no variance between schools. Recognizing
most of the letters of the alphabet before school starts has a positive impact in students’ performance in
reading of 25 points. Students that like reading activities have higher achievement (22 points). Higher
home possessions for learning are associated to higher scores in reading of about 16 points. Parental
book reading activities produces a positive impact in students´ achievement (12 points). In addition, we
find a difference in reading achievement of 10 points between girls and boys, favoring the first group.
Students that speak the same language of the test achieve an additional 50 points in reading, when
compared to students who do not speak the same language. The highest occupational level of the
parents is associated with better reading performance, of about 2 points. Students that attend schools
that have a higher percentage of students that come from economically disadvantaged homes have
lower reading achievement (2 points). The variables associated to the schools that have an impact in
reading achievement are: mean of parent’s highest occupational level, instruction affected by reading

Results
Page | 49
resource shortages and parental involvement in school activities. For the first variable, the coefficient of
the model indicates that a higher mean produces higher students’ reading score (16 points). For the
second variable, the coefficient is 3 points which means that for schools with better resources for
learning the students perform better. A higher involvement of the parents in school activities has a
positive impact of 6 points in the reading achievement.
France: 34.4% of the total variance in reading achievement is explained by the model. The
variance partitions of the model show that 90.4% corresponds to the variance between students within
classrooms, 7.7% is the variance among classrooms within schools and 1.8% is the variance among
schools. Students who like reading present higher scores in reading (difference of 24 points). Higher
home resources for learning and knowledge of the letters of the alphabet before the beginning of
primary education produce an increase in students’ reading achievement of 16 points. Students whose
parents share book reading practices perform better in reading (15 points). The students that speak the
same language of the test at home have an increase in reading achievement of 39 points. Students
whose parents present a higher occupational level exhibit an increase of 5 points in the reading scores.
A full time job of the father has a positive impact in the reading score of 6 points. Schools that present a
better school climate produce higher reading achievement (3 points).
Hungary: The model explains 45.9% of the total variance in students´ reading achievement. The
variance explained at the student level is 89.9%, at the classroom level is 2.9% and at the school level is
7.2%. Students who possess higher home resources for learning have an increase of 25 points in their
reading scores. Students who enjoy reading activities and recognize most of the letters of the alphabet
before beginning school perform better in reading (17 and 11 points, respectively). Parental book
reading is associated with higher student reading skills (10 points of difference). Girls perform better
than boys in reading (difference of 5 points). Students who speak the language of the test at home score
better in reading by 25 points. A higher occupational level of the parents and a full time job of the father
have a positive impact in the reading score (5 and 12 points, respectively). Similar results, although
higher, were found for schools whose students’ parents have a high occupational level. Attending non-
rural schools results in an increase of 11 points in students’ reading achievement. A better school
climate and higher parental involvement in school activities produce higher reading achievement (5 and
6 points, respectively).
Ireland: 39.5% of the total variance in students’ reading achievement is explained by the model.
Results
Page | 50
The variance between students within classrooms is 96%, the variance among classrooms within schools
is 4% and there is no variance among schools. Higher home resources for learning are associated with an
increase in students’ scores of 31 points. Students who like reading present higher scores in reading
(increase of 20 points). Students whose parents shared book reading activities perform better in reading
(difference of 18 points). Recognizing the letters of the alphabet before beginning school produces an
increase of 15 points in reading achievement. Girls have better performance in reading than boys (6
points). The variable with a strong negative impact on students´ overall reading achievement is not
speaking the language of the test at home (14 points). Students whose parents have high occupational
status and the father has a full time job have an increase in the reading score (3 and 7 points,
respectively). Schools with a high percentage of students that come from disadvantaged homes result in
an increase in the reading score of the students of 2 points. Rural schools produce an increase of 8
points in the performance of the students. A better involvement of the parents in school activities has a
positive impact of 5 points in the reading achievement.
Italy: The model explains 22.9% of the total variance in reading achievement. The variance
among students within classrooms is 78.1%. The variance among classrooms within schools is 5.6% and
the variance among schools is 16.3%. A higher number of resources for learning at home produce an
increase of 16 points in students’ scores. Students whose parents read books at home have an increase
in the reading score of 15 points. Knowledge of the alphabet and enjoyment for reading activities are
associated with high reading achievement (12 and 13 points, respectively). Other variables with an
impact in students’ reading achievement are not speaking the language of the test and the employment
situation of the father. The first variable produces a negative impact of 23 points in the reading score,
which means that students that speak the test language perform better. The second one indicates that a
better employment situation of the father produces a higher performance by 9 points. In addition, we
find a difference in reading achievement of 7 points between girls and boys, favoring the second group.
A higher occupational level of the parents reflects a change of 7 additional points in reading
achievement.
Lithuania: The value of the r-square of the full model is 0.342, which indicates that 34.2% of the
total variance in reading achievement is explained by this model. The variance partitions of the model
indicate that 87.9% is the variance between students within classrooms, 5.5% is the variance among
classrooms within schools and 6.6% is the variance among schools. Recognizing most of the letters of
the alphabet reflects an additional 27 points in students’ reading achievement. Parental book reading

Results
Page | 51
activities are associated with an increase of 16 points in students’ scores. Higher home resources for
learning and liking reading activities impact positively students’ performance, 10 and 9 points,
respectively. Girls have better performance in reading than boys (10 points). At the individual level and
at the school level a higher parental occupational level has a positive impact in reading achievement of 6
and 16 points, respectively. Students whose father is in a full time job have an increase in the reading
score of 5 points. A high percentage of students with few educational resources can increase the reading
score in 1 point. If the school is rural, a decrease of 14 points can be found for the reading attainment of
the students. Better school climate and higher instructional resources produce higher reading
achievement (5 points in both cases).
Malta: 43.3% of the total variance of students reading achievement is explained by the model.
The partition of variance at the student level is 86.4%, at the class level is 7.8% and at the school level is
5.8%. The ability to recognize most of the letters of the alphabet reflects an additional change of 27
points in students’ performance. Students whose parents shared book reading activities perform better
in reading, with a difference of 21 points. Students who appreciate reading activities present better
scores in reading (19 points). Having more resources at home for reading produce higher reading
achievement (14 points). Students who speak the same language of the test have an increase of 14
points in reading achievement. Parents’ occupational level has a similar relationship with the students’
reading score, 11 points for higher occupations. Moreover, classes with a high percentage of students
not speaking the test language are associated with an increased score of 1 point.
Netherlands: The model explains 22.2% of the total variance of students reading achievement.
95.8% of the variance is between students within classrooms, 1.5% is the variance among classrooms
within schools and 2.7% is the variance among schools. Students reporting enjoyment in reading
activities score higher in reading, specifically 19 points. The possession of home resources for learning
has a positive impact in students’ scores of 15 points. Recognizing most of the letters of the alphabet
before beginning primary school and parental book reading produces an increase in students’ reading
performance of 11 and 8 points, respectively. Additionally, at the students’ level, a higher occupational
level of the parents and a full time job of the father and of the mother impact positively students
achievement (5 points, 10 points and 5 points, respectively). At the school level, the location of the
school and reading resources shortages affects students’ reading scores. For the first variable, a non-
rural school produces an increase of 7 points in students’ proficiency. For the second variable, a school
with higher resources reflects an increase of 7 points in students’ reading score.
Results
Page | 52
Poland: 34.3% of the total variance in reading achievement is explained by the model. The
variance partitions of the model shows that 92.1% is the variance at student level, 4.5% at the class level
and 3.4% is the variance among schools. Students who have more resources for learning have an
increase in their reading score of 27 points. Knowledge of the letters of the alphabet at the start of
compulsory education reflects an additional 21 points in students’ reading achievement. Parents that
share reading activities with their children contribute to higher scores of their children in reading (20
points). Students who enjoy reading perform better in reading achievement (difference of 15 points). A
high occupational level of the parents and a full time job of the father reflect a better performance of
the students (7 and 5 points, respectively). In addition, better school instructional resources allow the
students to perform better (3 points).
Portugal: The model explains 29% of the total variance in students’ reading achievement. The
variance partitions of the model show that 91.9% is the variance between students within classrooms,
4.5% is the variance among classrooms within schools and 3.4% is the variance among schools. Positive
attitudes toward reading (enjoying reading activities) produce an increase of 16 points in students’
scores. The possession of more resources for learning at home increases the students´ reading
achievement in 15 points. The ability to recognize letters of the alphabet at the start of compulsory
education impacts positively students´ reading achievement (difference of 14 points). Students whose
parents share book reading practices perform better in reading (13 points). Students whose parents
have a higher occupational level have a positive impact of 6 points in the achievement of students. In
addition, a full time job of both parents influences positively the students’ performance in reading by 9
points for the father and 6 points for the mother. A female teacher impacts reading achievement by 18
points favoring those taught by female teachers. Classes with a high percentage of students with few
educational resources have a negative impact in the reading scores of the students.
Romania: 41.8% of the total variance in reading is explained by the model. 77.8% of the variance
is at the student level, 6.5% of the variance is at the class level and 15.7% is at the school level. The
possession of home resources for learning reflects a change of 23 additional points in reading
achievement. Students who recognize most of the letters of the alphabet before primary education have
an increase of 17 points in their reading scores. Students that like reading and whose parents share
reading activities perform better in reading (13 points and 6 points, respectively). The reading score of
girls is higher than that of boys by 12 points. The occupational level of the parents has a positive impact
in the reading score (of about 6 points). Students that attended pre-school have an increase of 30 points
Results
Page | 53
in reading achievement. If the school is rural, a decrease of 25 points can be found in the reading
attainment of the students.
Slovak Republic: The model explains 38.2% of the total variance in reading achievement. The
percentage of variability between students, between classes within schools and between the schools is
88.8, 7.6 and 3.6 respectively. Higher home resources for reading produce a positive impact in students’
reading achievement (20 points). A higher enjoyment for reading activities and parental book reading
reflect an increase of 13 points in reading performance. Knowledge of the alphabet before the beginning
of school produces an increase of 11 points in reading scores. Girls perform better than boys in reading,
with a difference of 5 points. At the individual level and at the school level a higher parental
occupational level has a positive impact in reading achievement (6 and 12 points, respectively). Students
that have both parents with a full time job perform better (4 points for the father and 7 points for the
mother). Rural schools produce a decrease of 10 points in the performance of the students. Finally, and
counter-intuitively, students that attend schools with a better school climate tend to perform worse
than those attending schools with a less ideal school climate (3 points).
Slovenia: 31.6% of the total variance in reading achievement is explained by the model. 95.6% of
the variance is at the student level, 1.8% is at the class level and 2.6% is at the school level. Higher
possession of resources for reading at home and parental book reading activities produce an increase of
21 points in students´ reading achievement. Positive attitudes toward reading reflect an increase of 19
points in students’ performance. Recognizing most of the letters of the alphabet before beginning
school has a positive impact of 18 points in the achievement of students. Girls perform better than boys
in reading (4 points of difference). The language spoken at home has an impact in the reading score, an
increase of 20 points for students whose language is the same of the test. The occupational level of the
parents and the employment situation of the father also have an impact in the reading score (8 and 11
points, respectively).
Spain: The value of the r-square of the full model is 0.281, which indicates that 28.1% of the
total variance in reading achievement is explained by this model. The variance partitions of the model
show that 89.4% is the variance between students within classrooms, 4.3% is the variance among
classrooms within schools and 6.3% is the variance among schools. Knowledge of the letters of the
alphabet produces an increase of 24 points in the reading achievement of the students. Higher home
resources for reading reflect an additional 17 points in students´ reading scores. Students who reported
Results
Page | 54
that they enjoy reading activities present higher performance (14 points). Students whose parents read
books to them at home score 10 points higher in reading. In addition, at the individual level, parents’
highest occupational level has an impact in students score. A higher occupational level reflects an
increase of 3 points in students’ reading achievement. Classes that are composed by a high percentage
of students who do not speak the same language of the test present a negative relationship with
students’ reading. Schools located in a rural environment influence negatively students achievement by
9 points.
Sweden: The model explains 36.7% of the total variance in reading achievement. At the students
level the variability is 94.3%. At the classroom level the variability is 2.9% and at the school level is 2.8%.
Students that possess more home resources for reading present higher scores in reading (21 points).
Students´ positive attitudes toward reading produces an increase of 19 points in reading achievement.
Recognizing most of the letters of the alphabet before the start of primary school and parental book
reading reflect a change in students´ reading performance of additional 17 and 15 points, respectively.
Students that speak the same language of the test at home score 20 points higher in reading. The
occupational level of the parents has a significant impact in the reading score of 3 points. Students
whose father has a full time job have an increase in the reading score of 8 points.
Results
Page | 55
5.4. Trends over time
In order to answer to the second research question “What trends over time can we identify in the
countries that participated in PIRLS 2006 and PIRLS 2011?” we compared the results obtained in the
multilevel models. In terms of the variance explained by the model, we find that, for the EU countries
aggregated model, 42.7% was the total variance in PIRLS 2006 and 36.7% is the total variance in PIRLS
2011. It must be taken in consideration that the model of PIRLS 2011 doesn’t include 2 variables
previously considered, namely “Teachers uses variety of organizational approaches” and “Reading for
fun outside school”. The second variable was included in the students like reading scale as defined by
IEA. Despite the fact that the variables used in the PIRLS 2011 model are measuring the same constructs
as in PIRLS 2006 model, some of them are slightly different when comparing both models. Specifically,
there are some changes in the variables: home resources for learning scale, students like reading scale,
location of school, instruction affected by reading resource shortage scale and parental involvement in
school activities. Finally, we are not using the same 20 EU countries in the aggregate model for both
PIRLS. These differences may account for the difference found in the total explained variance between
the two rounds of the PIRLS survey.
For the EU model as a whole, and concerning the percentage of variability between students, between
classes within schools and between the schools, the results are, respectively, 85.1%, 9.4% and 5.5% for
PIRLS 2006 and 88%, 6.5% and 5.5% for PIRLS 2011.
The main findings of the PIRLS 2011 model, both for the EU as a whole and for individual countries,
show that the four variables that have a strong impact on reading achievement are: home resources for
learning scale, students like reading scale, recognize most of the letters of the alphabet and parental
book reading. These findings are in line with the previous analysis performed for PIRLS 2006. The only
difference is the variable reading for fun outside school, which was not part of the model used for PIRLS
2011 data. It must be noted that the impact of the variables mentioned above, related with student and
home characteristics, is reported and highlighted not only in terms of the large magnitude of values but
also in terms of statistical significance.
The following graphs present the absolute value of the multilevel coefficients obtained for the models
using PIRLS 2006 and PIRLS 2011 datasets. The coefficients are presented in ascending order of the
coefficients obtained for PIRLS 2011 considering the aggregated EU data and individual countries that
participated in each round of the survey.

Results
Page | 56
Graph 2. Absolute values of the multilevel coefficients for the home resources for learning scale
Graph 3. Absolute values of the multilevel coefficients for the students like reading variable
0
5
10
15
20
25
30
35
Lith
uan
ia
Cro
atia
Mal
ta
Po
rtu
gal
Bu
lgar
ia
Net
her
lan
ds
Ital
y
Fin
lan
d
Fran
ce
Spai
n
Cze
ch-R
epu
blic
20
EU
co
un
trie
s
Slo
vak
Rep
ub
lic
Slo
ven
ia
Swed
en
Au
stri
a
Fre
nch
Bel
giu
m
Ro
man
ia
Po
lan
d
Hu
nga
ry
Ire
lan
d
Co
eff
icie
nt
Home resources for Learning
PIRLS 2006
PIRLS 2011
0
5
10
15
20
25
Cro
atia
Lith
uan
ia
Bu
lgar
ia
Au
stri
a
Slo
vak
Rep
ub
lic
Ro
man
ia
Ital
y
Cze
ch-R
epu
blic
Spai
n
Po
lan
d
20
EU
co
un
trie
s
Po
rtu
gal
Hu
nga
ry
Swed
en
Fre
nch
Bel
giu
m
Net
her
lan
ds
Mal
ta
Slo
ven
ia
Ire
lan
d
Fran
ce
Fin
lan
d
Co
eff
icie
nt
Students like reading
PIRLS 2006
PIRLS 2011

Results
Page | 57
Graph 4. Absolute values of the multilevel coefficients for the recognize letters of the alphabet variable
Graph 5. Absolute values of the multilevel coefficients for the parental book reading variable
0
5
10
15
20
25
30
Au
stri
a
Fre
nch
Bel
giu
m
Slo
vak
Rep
ub
lic
Hu
nga
ry
Net
her
lan
ds
Ital
y
Cze
ch-R
epu
blic
Po
rtu
gal
Ire
lan
d
Fran
ce
20
EU
co
un
trie
s
Swed
en
Ro
man
ia
Slo
ven
ia
Cro
atia
Bu
lgar
ia
Po
lan
d
Spai
n
Fin
lan
d
Mal
ta
Lith
uan
ia
Co
eff
icie
nt
Recognize letters of the alphabet
PIRLS 2006
PIRLS 2011
0
5
10
15
20
25
Ro
man
ia
Net
her
lan
ds
Spai
n
Bu
lgar
ia
Hu
nga
ry
Cro
atia
Fin
lan
d
Slo
vak
Rep
ub
lic
Cze
ch-R
epu
blic
Po
rtu
gal
Fre
nch
Bel
giu
m
20
EU
co
un
trie
s
Fran
ce
Ital
y
Swed
en
Lith
uan
ia
Ire
lan
d
Po
lan
d
Slo
ven
ia
Mal
ta
Au
stri
a
Co
eff
icie
nt
Parental book reading
PIRLS 2006
PIRLS 2011
Results
Page | 58
Despite the fact that of the results obtained for the models of the two different rounds are not directly
comparable, the graphical representations indicate that, in general and for most of the countries, larger
differences are found in the number of points influencing students’ achievement in PIRLS 2011, when
compared to the coefficients of the model used for PIRLS 2006. For the variable “home resources for
learning scale” the exceptions are Austria, Lithuania and Poland. Concerning the scale “students like
reading” the countries that present a higher number of points in reading achievement in PIRLS 2006 are
Austria, Bulgaria, Lithuania, Poland and Romania. In Austria, Italy, Hungary, Spain, Slovak Republic and
Sweden, the coefficients obtained for the variable “knowledge of the alphabet” for the model using
PIRLS 2006 data are higher than for the model using PIRLS 2011 data. Regarding parental book reading,
the graph shows that only for French Belgium, Netherlands, Romania and Spain the coefficients are
lower for the data from 2006 than for the 2011 data.
Discussion and Policy Implications
Page | 59
6. Discussion and Policy Implications
The results of the multilevel analysis using PIRLS 2011 data indicate that a large proportion of variance is
explained by the model. The variables that impact students’ achievement the most are related to
individual and family/home level background characteristics, including students´ that like reading, home
resources for learning, home literacy practices in the form of book reading, and students´ ability to
recognize letters of the alphabet at the start of compulsory education. In some countries, at the student
level, the students´ gender, the language spoken at home, the occupational level of the parents and the
employment situation of the father also explain achievement. At the class level, students attending
classes without a large percentage of peers that have few educational resources and also classes with a
lower percentage of students not speaking the test language present slightly better reading attainment.
At the school level, compositional effects related to the location of the school and school climate were
also significant in explaining reading achievement. In general, attending schools located in a rural
environment affect students´ reading score negatively. A better school climate results in a higher
reading attainment on the part of the students.
The individual country analysis reveals that there are substantial differences among countries with
respect to the coefficients that are significant and that explain reading achievement. Nonetheless, in all
the countries studied the explanatory variables that are consistently statistically significant are: home
resources for learning, home book reading practices, students´ attitudes toward reading (students like
reading) and students´ ability to recognize letters of the alphabet at the start of compulsory education.
The proportion of variance between student level, between classes within schools and between the
schools, indicates that there is a wide difference across countries. The results show that the proportion
of variance between students can vary from 77.8%, in Romania, to 96%, in Ireland. Concerning the
proportion of variance between classes within schools, we find that the lowest value is obtained for The
Netherlands (1.5%) and the highest (10.3%) for Italy. At the school level, the maximum proportion of
variance is 16.3% for Italy. In Czech-Republic , Finland and Ireland there is no variance between schools.
Regarding the models used to establish trends in students’ reading achievement for both PIRLS 2006
and PIRLS 2011 data, the results show that the main findings are very similar and that the variables that
consistently have a strong impact in students’ achievement are related to home resources and practices
(Araújo & Costa, 2012). Specifically, home resources for learning, students like reading, recognize most

Discussion and Policy Implications
Page | 60
of the letters of the alphabet and parental book reading are again the most significant variables that
explain students´ achievement.
The policy implications that can be addressed to improve students´ performance should focus on
educational interventions and societal changes. It is possible to intervene to make positive changes in
the socio - economic conditions of families and their home educational resources in order to improve
reading achievement. Although measures related to curriculum and instruction also have an important
role to play in improving in students’ achievement, evidence indicates that ensuring a literate
environment in the home is of the utmost importance (European Commission, 2012). For example,
launching literacy/reading national plans, like some countries have done, can bring educational
resources, such as electronic children’s books, to the home environment (Portuguese National Reading
Plan, 2011, http://www.planonacionaldeleitura.gov.pt/index1.php). In Poland, the campaign “All of
Poland Reads to Kids”, launched in 2001, has similar goals; to raise awareness of the importance of
reading in schools and in society at large and to equip libraries with books (European Commission,
2012). Many other countries, such as the United Kingdom, Germany and Lithuania, have taken similar
initiatives and have focused specifically on an early start (European Commission, 2012). Reading to
children from birth promotes emergent literacy skills like understanding that print carries a message and
that in alphabetic languages letters encode speech and, above all, that reading for enjoyment is a
pleasurable activity. As children approach formal primary education, this enjoyment and knowledge
base should be expanded to include specific knowledge about the letters of the alphabet and the sounds
they represent (Ehri, 1983). As such, and as our study suggests, another important measure that can be
conducted by governments is to ensure that children know the alphabet before starting compulsory
education. Our analysis of the PIRLS 2011 data shows that the knowledge of the alphabet before the
beginning of primary school would significantly improve the future reading development of students in
grade four. Thus, introducing curriculum goals and effective instruction to address gaps in this
knowledge should be implemented.
Furthermore, measures to reduce the persistent and significant gender gaps in reading literacy should
be implemented. Boys’ low level performance may be attributed to low levels of motivation for reading
and low engagement with school (OECD, 2013b). Therefore, specific approaches aiming at motivating
boys to read should be implemented, for instance, through gender-specific reading tasks. These reading
tasks should be aligned with writing activities and should be taught as essential skills across the
curriculum (European Commission, 2013).
Discussion and Policy Implications
Page | 61
Other significant factors can be addressed by equity measures that can be implemented by national
governments, such as the promotion of social and economic diversity in schools to reduce the school
compositional effects identified in this study and in previous research (Bellin, Dunge & Gunzenhauser,
2010). In the European Union, one in ten children live in homes where no adult has a job and this affects
literacy outcomes as the caregivers may not be able to provide the material well-being related to good
literacy outcomes (European Commission, 2012). School aid to buy books may be a strategy to reduce
some specific effects of poverty and, subsequently, to increase equity. As highlighted in PISA in Focus
(OECD, 2013c), countries that have improved their reading performance have reduced the impact of
students’ socio-economic status on their performance.
Primary school has the pivotal role of ensuring that children are ready to learn upon entering secondary
school but research indicates that their reading literacy level may not be good enough to continue
learning other school subjects effectively (European Commission, 2012). Students who do not develop
sound literacy skills during primary school tend to avoid reading and to show low levels of motivation for
reading (Adams, 1990). Conversely, students who enjoy reading exhibit high engagement in reading and,
as our report shows, reading for enjoyment is strongly related to better achievement. As students move
on to secondary school, their motivation to read and consequently their engagement in reading
activities diminishes.
This report supports and extends recent evidence stressing the role of home literacy practices and
resources for reading achievement and it identifies specific areas that need intervention, such as
addressing the gender gap and the teaching of the alphabet before the start of compulsory education.
Furthermore, this report identifies challenges and opportunities that are specific to each of the
countries studied. In this sense, we believe it can be a useful tool to assess common European policies as
well as to give each member state more information on their own school system.
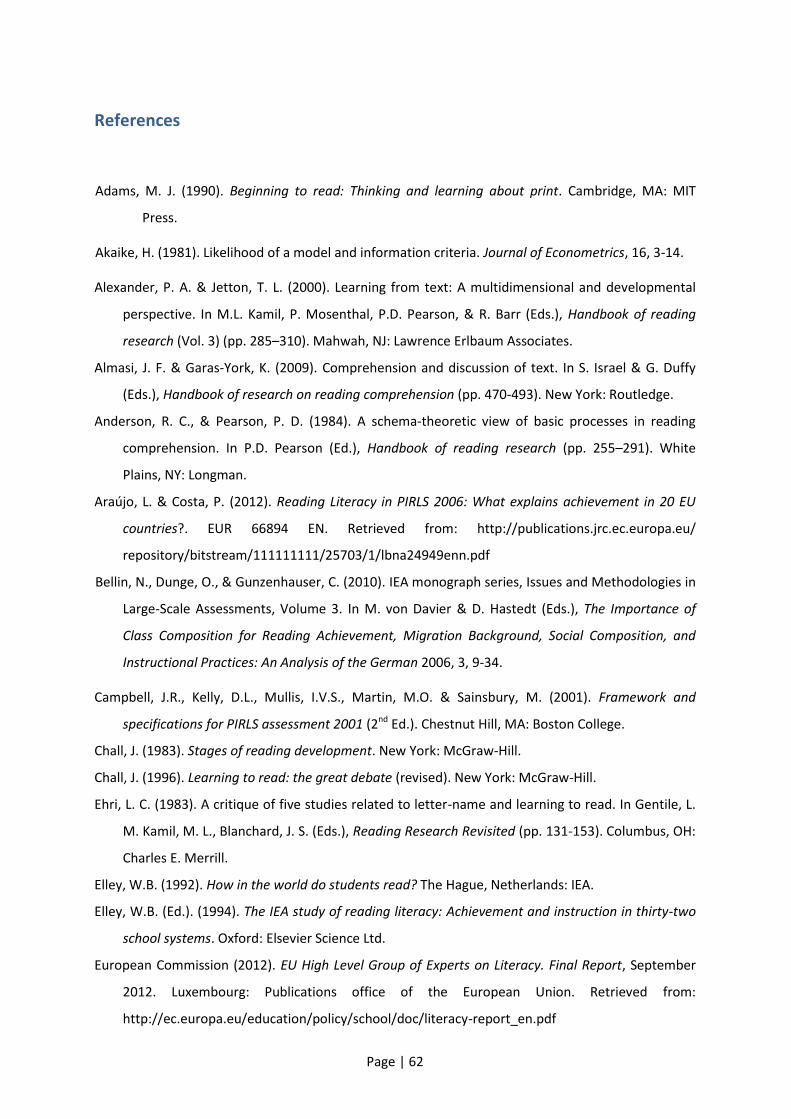
Page | 62
References
Adams, M. J. (1990). Beginning to read: Thinking and learning about print. Cambridge, MA: MIT
Press.
Akaike, H. (1981). Likelihood of a model and information criteria. Journal of Econometrics, 16, 3-14.
Alexander, P. A. & Jetton, T. L. (2000). Learning from text: A multidimensional and developmental
perspective. In M.L. Kamil, P. Mosenthal, P.D. Pearson, & R. Barr (Eds.), Handbook of reading
research (Vol. 3) (pp. 285–310). Mahwah, NJ: Lawrence Erlbaum Associates.
Almasi, J. F. & Garas-York, K. (2009). Comprehension and discussion of text. In S. Israel & G. Duffy
(Eds.), Handbook of research on reading comprehension (pp. 470-493). New York: Routledge.
Anderson, R. C., & Pearson, P. D. (1984). A schema-theoretic view of basic processes in reading
comprehension. In P.D. Pearson (Ed.), Handbook of reading research (pp. 255–291). White
Plains, NY: Longman.
Araújo, L. & Costa, P. (2012). Reading Literacy in PIRLS 2006: What explains achievement in 20 EU
countries?. EUR 66894 EN. Retrieved from: http://publications.jrc.ec.europa.eu/
repository/bitstream/111111111/25703/1/lbna24949enn.pdf
Bellin, N., Dunge, O., & Gunzenhauser, C. (2010). IEA monograph series, Issues and Methodologies in
Large-Scale Assessments, Volume 3. In M. von Davier & D. Hastedt (Eds.), The Importance of
Class Composition for Reading Achievement, Migration Background, Social Composition, and
Instructional Practices: An Analysis of the German 2006, 3, 9-34.
Campbell, J.R., Kelly, D.L., Mullis, I.V.S., Martin, M.O. & Sainsbury, M. (2001). Framework and
specifications for PIRLS assessment 2001 (2nd Ed.). Chestnut Hill, MA: Boston College.
Chall, J. (1983). Stages of reading development. New York: McGraw-Hill.
Chall, J. (1996). Learning to read: the great debate (revised). New York: McGraw-Hill.
Ehri, L. C. (1983). A critique of five studies related to letter-name and learning to read. In Gentile, L.
M. Kamil, M. L., Blanchard, J. S. (Eds.), Reading Research Revisited (pp. 131-153). Columbus, OH:
Charles E. Merrill.
Elley, W.B. (1992). How in the world do students read? The Hague, Netherlands: IEA.
Elley, W.B. (Ed.). (1994). The IEA study of reading literacy: Achievement and instruction in thirty-two
school systems. Oxford: Elsevier Science Ltd.
European Commission (2012). EU High Level Group of Experts on Literacy. Final Report, September
2012. Luxembourg: Publications office of the European Union. Retrieved from:
http://ec.europa.eu/education/policy/school/doc/literacy-report_en.pdf

Page | 63
European Commission (2013). PISA 2012 performance and first inferences regarding education and
training policies in Europe. Retrieved from: http://ec.europa.eu/education/policy/strategic-
framework/doc/pisa2012_en.pdf
Galda, L. & Beach, R. (2001). Theory and research into practice: Response to literature. Reading
Research Quarterly, 36, 64–73.
Goldstein, H. (1986). Multilevel mixed linear model analysis using iterative generalized least squares.
Biometrika, 73, 43-56.
Goldstein, H. (2003). Multilevel Statistical Models (3rd Ed.), Kendall’s Library of Statistics 3. London:
Edward Arnold.
Guice, S. L. (1995). Creating communities of readers: A study of children’s information networks as
multiple contexts for responding to texts. Journal of Reading Behavior, 27, 379-397.
Greaney, V. & Neuman, S. B. (1990). The functions of reading: a cross-cultural perspective. Reading
Research Quarterly, 25, 172-195.
Guthrie, J. T. (1996). Educational contexts for engagement in literacy. The Reading Teacher, 49(6),
432-445.
Kucer, S. B. (2005). Dimensions of Literacy: A Conceptual Base for Teaching Reading and Writing in
School Settings (2nd Ed.). Mahwah, NJ: Lawrence Erlbaum.
Labrecque, M., Chuy, M., Brochu, P. & Houme, K. (2012). PIRLS 2011. Canada in Context. Council of
Ministers of Education, Canada.
Leu, D. J., Jr., Kinzer, C. K., Coiro, J. & Cammack, D. (2004). Toward a theory of new literacies
emerging from the Internet and other ICT. In R.B. Ruddell & N. Unrau (Eds.), Theoretical Models
and Processes of Reading, Fifth Edition (pp. 1568-1611). Newark, DE: International Reading
Association.
Ma, X., Ma, L. & Bradley, K. D. (2008). Using Multilevel Modeling to Investigate School Effects. In A.
Connell & D. B. McCoach (Eds.). Multilevel Modeling of Educational Data. USA: Information Age
Publishing Inc.
Mullis, I. V. S., Kennedy, A. M., Martin, M. O. & Sainsbury, M. (2006). PIRLS 2006 Assessment
framework and specifications (2nd Ed.). TIMSS & PIRLS International Study Center. Chestnut Hill,
MA: Boston College.
Mullis, I. V. S., Martin, M. O., Foy, P. & Drucker, K. T. (2011). PIRLS 2011 International results in
Reading. Chestnut Hill, MA: TIMSS & PIRLS International Study Center, Boston College.
Retrieved from http://timssandpirls.bc.edu/pirls2011/international-results-pirls.html

Page | 64
Mullis, I. V. S., Martin, M. O., Foy, P. & Drucker, K. T. (2012). PIRLS 2011 International Results in
Reading. Chestnut Hill, MA: TIMSS & PIRLS International Study Center, Lynch School of
Education, Boston College.
Mullis, I. V. S., Martin, M. O., Kennedy, A. M., & Foy, P. (2007). PIRLS 2006 international report: IEA’s
progress in international reading literacy study in primary schools in 40 countries. Chestnut Hill,
MA: Boston College.
Mullis, I. V. S., Martin, M. O., Kennedy, A. M., Trong, K. L. & Sainsbury, M. (2009). PIRLS 2011
assessment framework. Chestnut Hill, MA: TIMSS & PIRLS International Study Center, Lynch
School of Education, Boston College.
Mullis, I. V. S., Martin, M. O., Minnich, C. A., Drucker, K. T., & Ragan, M. A. (Eds.) (2012). PIRLS 2011
encyclopedia: Education policy and curriculum in reading. Chestnut Hill, MA: TIMSS & PIRLS
International Study Center, Boston College.
OECD (2000). Literacy in the Information Age. Final Report of the International Adult Literacy Survey.
Retrieved from: http://www.oecd.org/edu/skills-beyond-school/41529765.pdf
OECD (2010). PISA 2009 assessment framework: Key competencies in reading, science and
mathematics. Paris: Author.OECD. (1999). Classifying educational programmes: Manual for
ISCED-97 implementation in OECD countries (1999 ed.). Retrieved from
http://www.oecd.org/dataoecd/7/2/1962350.pdf
OECD (2011). PISA 2009 at a Glance. OECD Publishing. Retrieved from http://www.oecd-
ilibrary.org/content/book/9789264095298-
en?contentType=/ns/StatisticalPublication,/ns/Chapter&itemId=/content/chapter/9789264095
250-20-en&containerItemId=/content/book/9789264095298-
en&accessItemIds=&mimeType=text/html
OECD (2013a). PISA 2015 Draft Reading Literacy Framework. Retrieved from:
http://www.oecd.org/pisa/pisaproducts/Draft%20PISA%202015%20Reading%20Framework%2
0.pdf
OECD (2013b). PISA 1012 results: What students know and Can Do. Student performance in
Mathematics, Reading and Science. Volume I. Retrieved from:
http://www.oecd.org/pisa/keyfindings/pisa-2012-results-volume-I.pdf
OECD (2013c). PISA in Focus 34. Who are the stronger performers and successful reformers in
education? Retrieved from: http://www.oecd.org/pisa/pisaproducts/pisainfocus/pisa-in-focus-
n34-(eng)-FINAL.pdf
Park, H. (2008). Home literacy environments and children’s reading performance: a comparative
study of 25 countries. Educational Research and Evaluation: An International Journal on Theory
and Practice, 14(6), 489-505.

Page | 65
Petscher, Y. (2010). A meta-analysis of the relationship between student attitudes towards reading
and achievement in reading. Journal of Research in Reading, 33(4), 335–355.
Quirk, M., Schwanenflugel, P.J., & Webb, M. (2009). A short-term longitudinal study of the
relationship between motivation to read and reading fluency skill in second grade. Journal of
Literacy Research, 41, 196–227.
Rabash, J., Steele, F., Browne, W. J. & Goldestein H. (2009). A Users Guide to Mlwin, v2.10. Centre for
Multilevel Modelling, University of Bristol.
Ruddell, R. B., & Unrau, N. J. (Eds.). (2004). Theoretical models and processes of reading (5th ed.).
Newark, DE: International Reading Association.
Sainsbury, M., & Schagen, I. (2004). Attitudes to reading at ages nine and eleven. Journal of Research
in Reading, 27, 373–386.
Shiel, G. & Eivers, E. (2009). International comparisons of reading literacy: what can they tell us?
Cambridge Journal of Education, 39(3), 345-360.
van der Voort, T.H.A. (2001). Television’s impact on children’s leisure time reading and reading skills.
In L. Verhoeven & C. Snow (Eds.), Literacy and motivation: Reading engagement in individuals
and groups (pp. 95–121). Mahwah, NJ: Lawrence Erlbaum.
Wagner, D. A. (1991). Literacy in a global perspective. In I. Lundberg & T. Hoien (Eds.). Literacy in a
world of change: Perspectives on reading and reading disability. Norway, Stavanger: Centre for
Reading Research.
Walter, P. (1999). Defining literacy and its consequences in the developing world. Journal of Lifelong
Education, 18(1), 31–48.
Weinberger, J. (1996). Literacy goes to School – The parents’ role in young children’s literacy learning.
Liverpool, Paul Chapman Publishing.
Wolf, R.M. (Ed.). (1995). The IEA reading literacy study: Technical report. The Hague, Netherlands:
IEA.
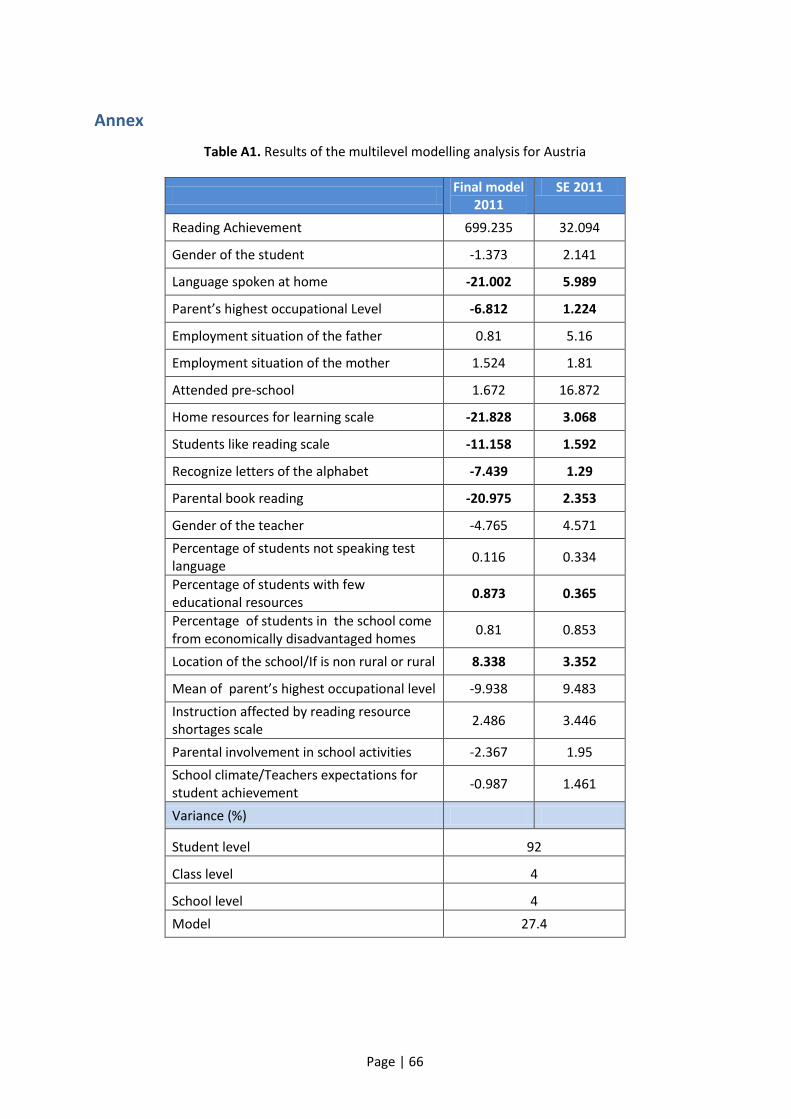
Page | 66
Annex
Table A1. Results of the multilevel modelling analysis for Austria
Final model
2011 SE 2011
Reading Achievement 699.235 32.094
Gender of the student -1.373 2.141
Language spoken at home -21.002 5.989
Parent’s highest occupational Level -6.812 1.224
Employment situation of the father 0.81 5.16
Employment situation of the mother 1.524 1.81
Attended pre-school 1.672 16.872
Home resources for learning scale -21.828 3.068
Students like reading scale -11.158 1.592
Recognize letters of the alphabet -7.439 1.29
Parental book reading -20.975 2.353
Gender of the teacher -4.765 4.571
Percentage of students not speaking test language
0.116 0.334
Percentage of students with few educational resources
0.873 0.365
Percentage of students in the school come from economically disadvantaged homes
0.81 0.853
Location of the school/If is non rural or rural 8.338 3.352
Mean of parent’s highest occupational level -9.938 9.483
Instruction affected by reading resource shortages scale
2.486 3.446
Parental involvement in school activities -2.367 1.95
School climate/Teachers expectations for student achievement
-0.987 1.461
Variance (%)
Student level 92
Class level 4
School level 4
Model 27.4

Page | 67
Table A2. Results of the multilevel modelling analysis for French Belgium
Final model
2011 SE 2011
Reading Achievement 730.324 26.251
Gender of the student -0.406 2.333
Language spoken at home -23.84 6.991
Parent’s highest occupational Level -6.471 1.254
Employment situation of the father -1.165 2.632
Employment situation of the mother 1.581 1.802
Attended pre-school -31.038 15.733
Home resources for learning scale -22.506 3.114
Students like reading scale -18.639 1.857
Recognize letters of the alphabet -10.501 1.588
Parental book reading -13.737 2.171
Gender of the teacher -2.798 4.421
Percentage of students not speaking test language
-0.541 0.462
Percentage of students with few educational resources
-0.491 0.538
Percentage of students in the school come from economically disadvantaged homes
1.342 1.03
Location of the school/If is non rural or rural 0.085 3.786
Mean of parent’s highest occupational level -8.034 7.722
Instruction affected by reading resource shortages scale
-1.654 2.242
Parental involvement in school activities -1.962 2.056
School climate/Teachers expectations for student achievement
0.827 1.098
Variance (%)
Student level 91.6
Class level 4.2
School level 4.2
Model 35.4

Page | 68
Table A3. Results of the multilevel modelling analysis for Bulgaria
Final model
2011 SE 2011
Reading Achievement 788.37 35.096
Gender of the student -10.282 2.168
Language spoken at home -6.737 5.941
Parent’s highest occupational Level -7.262 1.05
Employment situation of the father -0.834 2.312
Employment situation of the mother -3.153 1.801
Attended pre-school -0.693 4.222
Home resources for learning scale -15.299 2.896
Students like reading scale -8.692 1.745
Recognize letters of the alphabet -20.707 1.735
Parental book reading -10.008 1.813
Gender of the teacher -8.28 9.659
Percentage of students not speaking test language -0.221 0.392
Percentage of students with few educational resources 0.312 0.431
Percentage of students in the school come from economically disadvantaged homes -0.268 1.425
Location of the school/If is non rural or rural -6.385 5.394
Mean of parent’s highest occupational level -20.374 11.707
Instruction affected by reading resource shortages scale -0.363 5.425
Parental involvement in school activities -2.469 3.384
School climate/Teachers expectations for student achievement -12.035 2.633
Variance (%)
Student level 78.7
Class level 10.3
School level 11
Model 38.2

Page | 69
Table A4. Results of the multilevel modelling analysis for Croatia
Final model
2011 SE 2011
Reading Achievement 665.191 25.948
Gender of the student -8.699 1.879
Language spoken at home -22.905 12.583
Parent’s highest occupational Level -6.995 0.887
Employment situation of the father -2.699 1.622
Employment situation of the mother -1.951 1.177
Attended pre-school -0.487 2.458
Home resources for learning scale -11.262 3.011
Students like reading scale 2.545 0.456
Recognize letters of the alphabet -20.562 1.479
Parental book reading -10.976 1.743
Gender of the teacher -8.717 8.209
Percentage of students not speaking test language
0.448 0.263
Percentage of students with few educational resources
-0.196 0.258
Percentage of students in the school come from economically disadvantaged homes
-0.435 0.922
Location of the school/If is non rural or rural -8.832 3.198
Mean of parent’s highest occupational level 4.941 7.058
Instruction affected by reading resource shortages scale
-1.526 3.03
Parental involvement in school activities -1.182 1.911
School climate/Teachers expectations for student achievement
0.35 1.482
Variance (%)
Student level 91.4
Class level 7.1
School level 1.5
Model 22.1

Page | 70
Table A5. Results of the multilevel modelling analysis for Czech-Republic
Final model
2011 SE 2011
Reading Achievement 752.121 24.237
Gender of the student 0.891 1.863
Language spoken at home -31.763 10.26
Parent’s highest occupational Level -6.889 0.934
Employment situation of the father 3.4 3.843
Employment situation of the mother 0.499 1.688
Attended pre-school 2.798 10.041
Home resources for learning scale -18.097 2.536
Students like reading scale -13.467 1.447
Recognize letters of the alphabet -12.084 1.265
Parental book reading -12.958 1.952
Gender of the teacher -15.493 7.878
Percentage of students not speaking test language
-0.245 0.311
Percentage of students with few educational resources
0.357 0.347
Percentage of students in the school come from economically disadvantaged homes
0.616 1.107
Location of the school/If is non rural or rural -4.104 2.859
Mean of parent’s highest occupational level -11.936 5.637
Instruction affected by reading resource shortages scale
-0.944 2.696
Parental involvement in school activities -4.359 1.887
School climate/Teachers expectations for student achievement
-0.354 1.673
Variance (%)
Student level 92.2
Class level 7.8
School level 0
Model 29.3

Page | 71
Table A6. Results of the multilevel modelling analysis for Finland
Final model
2011 SE 2011
Reading Achievement 839.312 23.006
Gender of the student -9.753 1.834
Language spoken at home -49.837 10.343
Parent’s highest occupational Level -2.107 1
Employment situation of the father -0.724 2.17
Employment situation of the mother -0.866 1.592
Attended pre-school -10.303 10.413
Home resources for learning scale -16.21 2.235
Students like reading scale -22.263 1.39
Recognize letters of the alphabet -24.795 1.378
Parental book reading -11.594 2.082
Gender of the teacher -3.309 3.096
Percentage of students not speaking test language
0.322 0.388
Percentage of students with few educational resources
0.464 0.386
Percentage of students in the school come from economically disadvantaged homes
1.38 0.782
Location of the school/If is non rural or rural 3.367 2.745
Mean of parent’s highest occupational level -16.49 6.492
Instruction affected by reading resource shortages scale
-3.291 2.234
Parental involvement in school activities -5.941 1.861
School climate/Teachers expectations for student achievement
-1.881 2.264
Variance (%)
Student level 92
Class level 8
School level 0
Model 34.4

Page | 72
Table A7. Results of the multilevel modelling analysis for France
Final model
2011 SE 2011
Reading Achievement 709.152 28.98
Gender of the student -1.679 2.12
Language spoken at home -38.898 10
Parent’s highest occupational Level -5.237 1.082
Employment situation of the father -5.554 2.694
Employment situation of the mother -0.226 1.621
Attended pre-school 48.169 16.405
Home resources for learning scale -16.498 2.801
Students like reading scale -24.241 1.778
Recognize letters of the alphabet -15.764 1.667
Parental book reading -14.6 2.081
Gender of the teacher 2.217 3.787
Percentage of students not speaking test language 0.278 0.334
Percentage of students with few educational resources -0.272 0.516
Percentage of students in the school come from economically disadvantaged homes 1.359 0.809
Location of the school/If is non rural or rural -0.428 3.276
Mean of parent’s highest occupational level -11.355 8.384
Instruction affected by reading resource shortages scale -9.017 3.936
Parental involvement in school activities -2.772 1.911
School climate/Teachers expectations for student achievement -2.495 1.335
Variance (%)
Student level 90.4
Class level 7.7
School level 1.8
Model 34.4

Page | 73
Table A8. Results of the multilevel modelling analysis for Hungary
Final model
2011 SE 2011
Reading Achievement 776.259 63.525
Gender of the student -5.1 2.22
Language spoken at home -25.107 12.496
Parent’s highest occupational Level -4.46 1.162
Employment situation of the father -12.34 2.876
Employment situation of the mother -1.846 1.797
Attended pre-school -28.664 55.771
Home resources for learning scale -24.934 2.852
Students like reading scale -17.026 1.65
Recognize letters of the alphabet -10.941 1.353
Parental book reading -10.41 2.238
Gender of the teacher -14.311 11.983
Percentage of students not speaking test language 0.07 0.327
Percentage of students with few educational resources -0.615 0.394
Percentage of students in the school come from economically disadvantaged homes -0.773 1.542
Location of the school/If is non rural or rural -11.39 4.031
Mean of parent’s highest occupational level 13.49 9.183
Instruction affected by reading resource shortages scale 0.383 3.828
Parental involvement in school activities -5.904 2.901
School climate/Teachers expectations for student achievement -4.565 2.442
Variance (%)
Student level 89.9
Class level 2.9
School level 7.2
Model 45.9

Page | 74
Table A9. Results of the multilevel modelling analysis for Ireland
Final model
2011 SE 2011
Reading Achievement 751.96 25.853
Gender of the student -6.047 2.608
Language spoken at home -13.584 5.75
Parent’s highest occupational Level -2.938 1.274
Employment situation of the father -7.406 2.261
Employment situation of the mother 2.279 1.618
Attended pre-school -3.365 4.857
Home resources for learning scale -31.376 3.051
Students like reading scale -19.811 1.851
Recognize letters of the alphabet -15.104 1.765
Parental book reading -17.76 2.785
Gender of the teacher 0.111 3.381
Percentage of students not speaking test language
0.003 0.469
Percentage of students with few educational resources
-0.512 0.599
Percentage of students in the school come from economically disadvantaged homes
1.591 0.679
Location of the school/If is non rural or rural 7.613 3.192
Mean of parent’s highest occupational level -0.901 9.29
Instruction affected by reading resource shortages scale
0.333 1.633
Parental involvement in school activities -5.371 1.564
School climate/Teachers expectations for student achievement
-2.064 1.578
Variance (%)
Student level 96
Class level 4
School level 0
Model 39.5

Page | 75
Table A10. Results of the multilevel modelling analysis for Italy
Final model
2011 SE 2011
Reading Achievement 707.843 29.802
Gender of the student 7.286 2.407
Language spoken at home -23.097 6.41
Parent’s highest occupational Level -7.021 1.211
Employment situation of the father -9.084 3.887
Employment situation of the mother -0.821 1.595
Attended pre-school 8.337 12.993
Home resources for learning scale -15.78 3.601
Students like reading scale -13.059 1.967
Recognize letters of the alphabet -11.62 1.582
Parental book reading -14.958 2.063
Gender of the teacher -18.345 16.251
Percentage of students not speaking test language
0.492 0.274
Percentage of students with few educational resources
-0.083 0.341
Percentage of students in the school come from economically disadvantaged homes
0.753 1.388
Location of the school/If is non rural or rural 5.387 5.102
Mean of parent’s highest occupational level -9.03 6.664
Instruction affected by reading resource shortages scale
-1.828 2.627
Parental involvement in school activities 3.518 3.275
School climate/Teachers expectations for student achievement
2.012 1.998
Variance (%)
Student level 78.1
Class level 5.6
School level 16.3
Model 22.9

Page | 76
Table A11. Results of the multilevel modelling analysis for Lithuania
Final model
2011 SE 2011
Reading Achievement 748.021 31.16
Gender of the student -9.655 2.088
Language spoken at home -3.063 11.232
Parent’s highest occupational Level -5.757 0.934
Employment situation of the father -4.551 1.865
Employment situation of the mother 0.909 1.535
Attended pre-school -0.97 3.482
Home resources for learning scale -10.062 2.925
Students like reading scale -8.633 1.681
Recognize letters of the alphabet -27.189 1.693
Parental book reading -15.607 1.959
Gender of the teacher 4.467 21.717
Percentage of students not speaking test language
0.3 0.356
Percentage of students with few educational resources
0.78 0.37
Percentage of students in the school come from economically disadvantaged homes
-0.849 1.019
Location of the school/If is non rural or rural -14.228 4.475
Mean of parent’s highest occupational level -15.924 5.92
Instruction affected by reading resource shortages scale
-4.808 2.421
Parental involvement in school activities -4.339 3.109
School climate/Teachers expectations for student achievement
-4.771 2.5
Variance (%)
Student level 87.9
Class level 5.5
School level 6.6
Model 34.2

Page | 77
Table A12. Results of the multilevel modelling analysis for Malta
Final model
2011 SE 2011
Reading Achievement 752.191 50.887
Gender of the student -5.529 3.783
Language spoken at home -14.248 3.568
Parent’s highest occupational Level -10.858 1.7
Employment situation of the father -6.811 6.154
Employment situation of the mother -2.185 2.068
Attended pre-school 23.079 22.7
Home resources for learning scale -14.216 4.569
Students like reading scale -19.102 2.401
Recognize letters of the alphabet -26.83 2.547
Parental book reading -20.919 3.317
Gender of the teacher -0.496 6.239
Percentage of students not speaking test language
-0.632 0.231
Percentage of students with few educational resources
0.464 0.606
Percentage of students in the school come from economically disadvantaged homes
1.523 1.93
Location of the school/If is non rural or rural 0.519 6.508
Mean of parent’s highest occupational level -19.951 17.512
Instruction affected by reading resource shortages scale
0.543 4.407
Parental involvement in school activities -6.103 3.972
School climate/Teachers expectations for student achievement
-5.608 4.21
Variance (%)
Student level 86.4
Class level 7.8
School level 5.8
Model 43.3
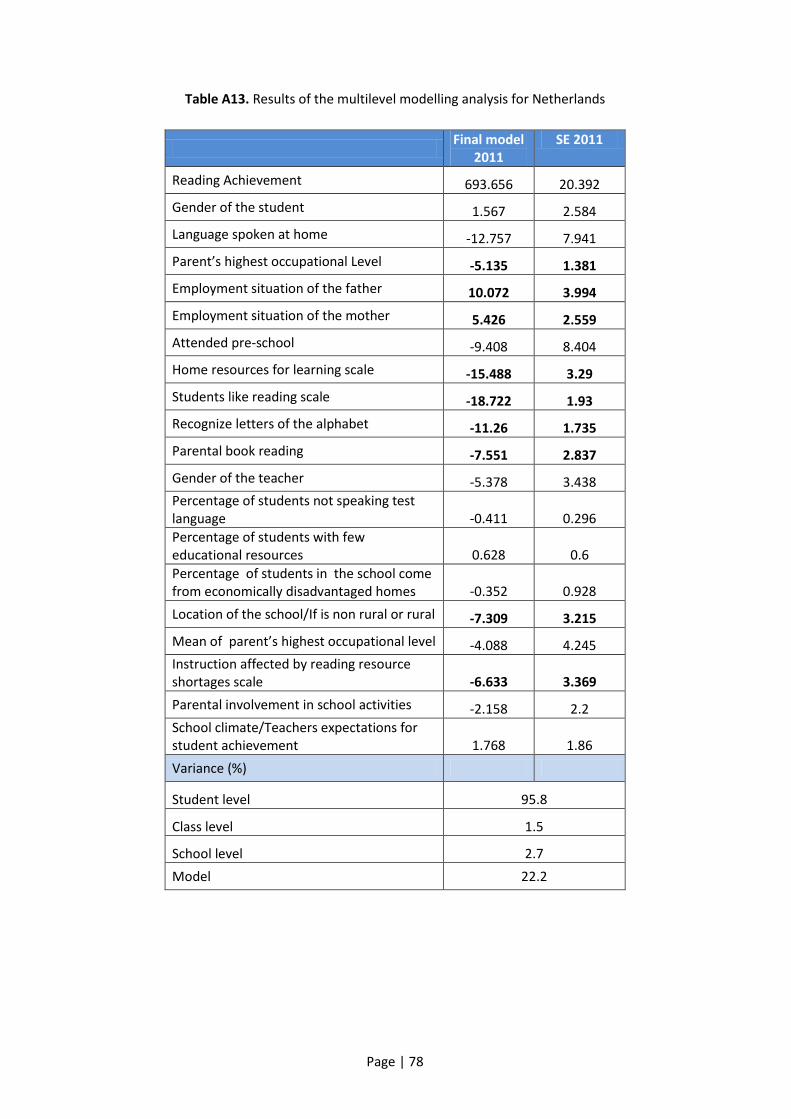
Page | 78
Table A13. Results of the multilevel modelling analysis for Netherlands
Final model
2011 SE 2011
Reading Achievement 693.656 20.392
Gender of the student 1.567 2.584
Language spoken at home -12.757 7.941
Parent’s highest occupational Level -5.135 1.381
Employment situation of the father 10.072 3.994
Employment situation of the mother 5.426 2.559
Attended pre-school -9.408 8.404
Home resources for learning scale -15.488 3.29
Students like reading scale -18.722 1.93
Recognize letters of the alphabet -11.26 1.735
Parental book reading -7.551 2.837
Gender of the teacher -5.378 3.438
Percentage of students not speaking test language -0.411 0.296
Percentage of students with few educational resources 0.628 0.6
Percentage of students in the school come from economically disadvantaged homes -0.352 0.928
Location of the school/If is non rural or rural -7.309 3.215
Mean of parent’s highest occupational level -4.088 4.245
Instruction affected by reading resource shortages scale -6.633 3.369
Parental involvement in school activities -2.158 2.2
School climate/Teachers expectations for student achievement 1.768 1.86
Variance (%)
Student level 95.8
Class level 1.5
School level 2.7
Model 22.2
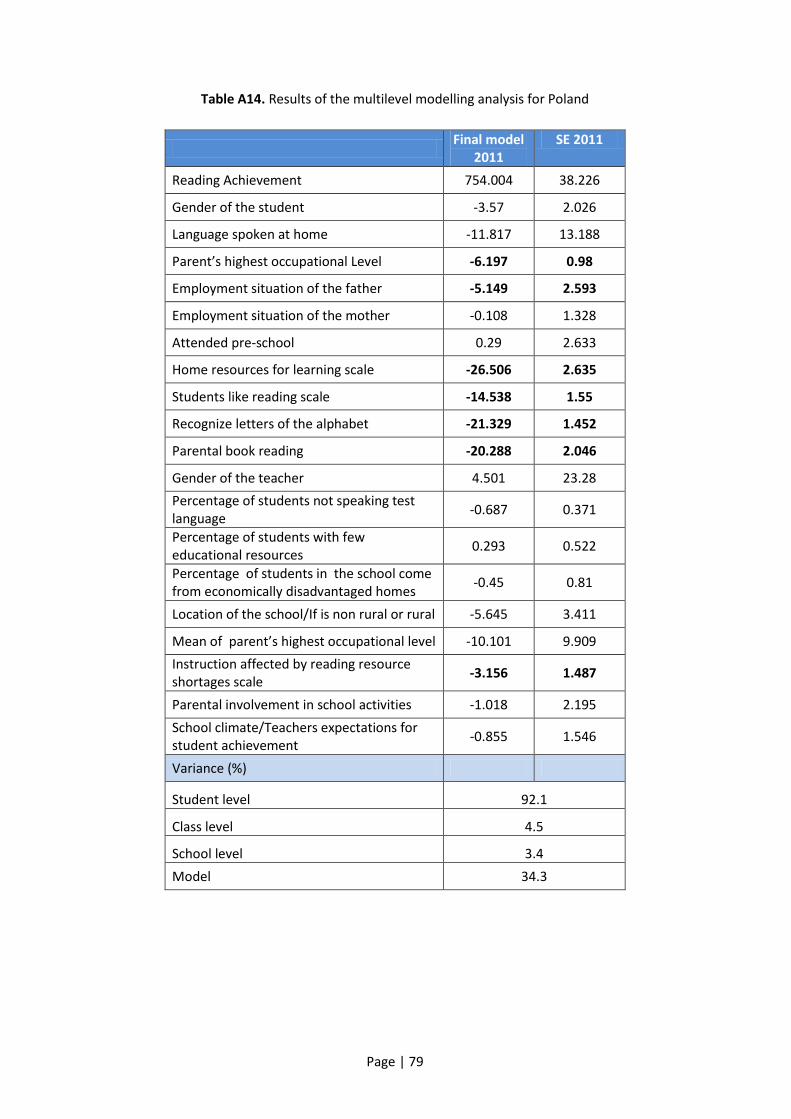
Page | 79
Table A14. Results of the multilevel modelling analysis for Poland
Final model
2011 SE 2011
Reading Achievement 754.004 38.226
Gender of the student -3.57 2.026
Language spoken at home -11.817 13.188
Parent’s highest occupational Level -6.197 0.98
Employment situation of the father -5.149 2.593
Employment situation of the mother -0.108 1.328
Attended pre-school 0.29 2.633
Home resources for learning scale -26.506 2.635
Students like reading scale -14.538 1.55
Recognize letters of the alphabet -21.329 1.452
Parental book reading -20.288 2.046
Gender of the teacher 4.501 23.28
Percentage of students not speaking test language
-0.687 0.371
Percentage of students with few educational resources
0.293 0.522
Percentage of students in the school come from economically disadvantaged homes
-0.45 0.81
Location of the school/If is non rural or rural -5.645 3.411
Mean of parent’s highest occupational level -10.101 9.909
Instruction affected by reading resource shortages scale
-3.156 1.487
Parental involvement in school activities -1.018 2.195
School climate/Teachers expectations for student achievement
-0.855 1.546
Variance (%)
Student level 92.1
Class level 4.5
School level 3.4
Model 34.3

Page | 80
Table A15. Results of the multilevel modelling analysis for Portugal
Final model
2011 SE 2011
Reading Achievement 682.725 25.76
Gender of the student -2.62 2.38
Language spoken at home 15.33 11.375
Parent’s highest occupational Level -5.679 1.274
Employment situation of the father -8.939 4.261
Employment situation of the mother -5.915 3.076
Attended pre-school -4.316 4.749
Home resources for learning scale -14.531 2.972
Students like reading scale -15.527 2.157
Recognize letters of the alphabet -14.121 1.602
Parental book reading -12.999 2.261
Gender of the teacher -17.611 5.21
Percentage of students not speaking test language -0.082 0.452
Percentage of students with few educational resources -1.084 0.487
Percentage of students in the school come from economically disadvantaged homes 0.215 1.017
Location of the school/If is non rural or rural 3.602 3.947
Mean of parent’s highest occupational level 8.494 8.064
Instruction affected by reading resource shortages scale 2.013 2.025
Parental involvement in school activities -2.631 2.182
School climate/Teachers expectations for student achievement -2.245 1.375
Variance (%)
Student level 91.9
Class level 4.5
School level 3.4
Model 29

Page | 81
Table A16. Results of the multilevel modelling analysis for Romania
Final model
2011 SE 2011
Reading Achievement 734.751 51.764
Gender of the student -11.58 2.57
Language spoken at home 7.216 10.559
Parent’s highest occupational Level -5.961 1.326
Employment situation of the father -2.525 2.283
Employment situation of the mother 1.078 1.878
Attended pre-school -30.264 10.394
Home resources for learning scale -22.983 3.533
Students like reading scale -12.766 2.058
Recognize letters of the alphabet -17.239 1.827
Parental book reading -5.893 2.597
Gender of the teacher -8.63 8.602
Percentage of students not speaking test language
-0.292 0.496
Percentage of students with few educational resources
-0.46 0.358
Percentage of students in the school come from economically disadvantaged homes
0.005 1.458
Location of the school/If is non rural or rural -24.612 6.686
Mean of parent’s highest occupational level 0.388 17.288
Instruction affected by reading resource shortages scale
1.234 7.526
Parental involvement in school activities -2.96 4.186
School climate/Teachers expectations for student achievement
-3.628 3.865
Variance (%)
Student level 77.8
Class level 6.5
School level 15.7
Model 41.8

Page | 82
Table A17. Results of the multilevel modelling analysis for Slovak Republic
Final model
2011 SE 2011
Reading Achievement 724.659 21.077
Gender of the student -5.297 1.806
Language spoken at home 1.496 7.599
Parent’s highest occupational Level -6.373 0.923
Employment situation of the father -3.596 1.977
Employment situation of the mother -7.168 1.492
Attended pre-school 5.167 7.938
Home resources for learning scale -20.265 2.527
Students like reading scale -12.638 1.408
Recognize letters of the alphabet -10.677 1.096
Parental book reading -12.791 1.867
Gender of the teacher -1.71 6.043
Percentage of students not speaking test language
-0.004 0.332
Percentage of students with few educational resources
0.076 0.376
Percentage of students in the school come from economically disadvantaged homes
-0.335 0.828
Location of the school/If is non rural or rural -9.583 3.255
Mean of parent’s highest occupational level -11.711 5.898
Instruction affected by reading resource shortages scale
0.171 2.811
Parental involvement in school activities -0.542 2.074
School climate/Teachers expectations for student achievement
-2.763 1.159
Variance (%)
Student level 88.8
Class level 7.6
School level 3.6
Model 38.2
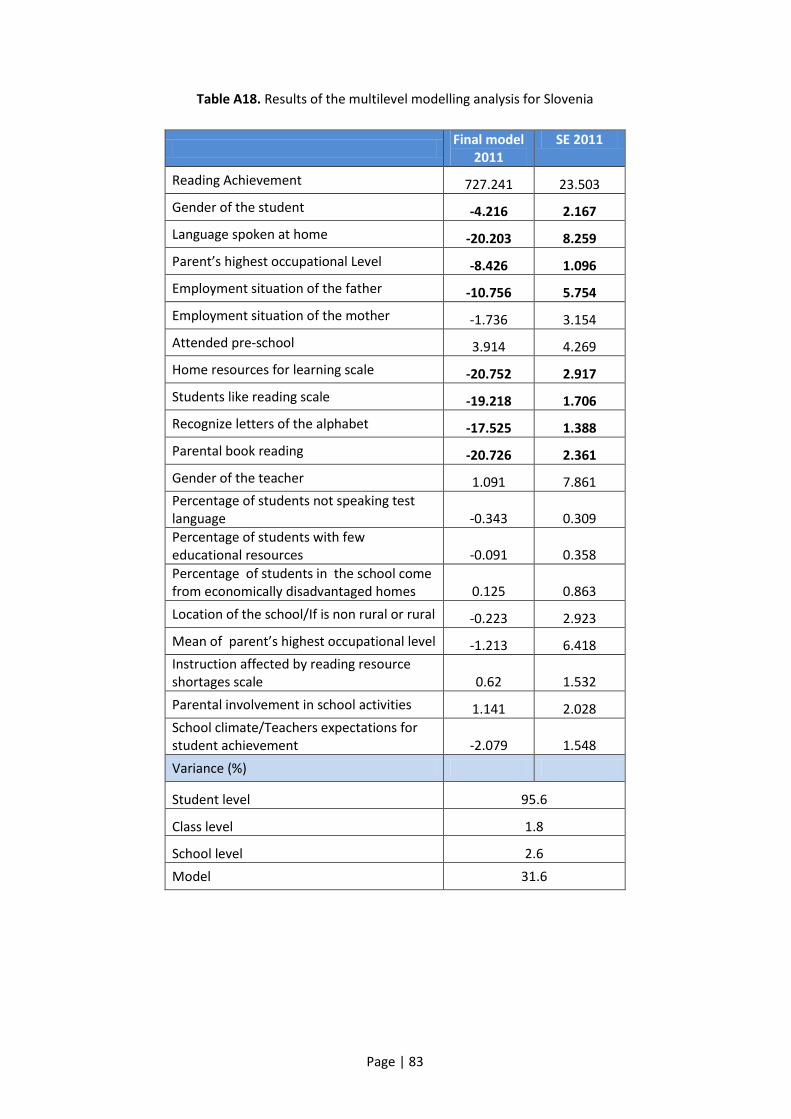
Page | 83
Table A18. Results of the multilevel modelling analysis for Slovenia
Final model
2011 SE 2011
Reading Achievement 727.241 23.503
Gender of the student -4.216 2.167
Language spoken at home -20.203 8.259
Parent’s highest occupational Level -8.426 1.096
Employment situation of the father -10.756 5.754
Employment situation of the mother -1.736 3.154
Attended pre-school 3.914 4.269
Home resources for learning scale -20.752 2.917
Students like reading scale -19.218 1.706
Recognize letters of the alphabet -17.525 1.388
Parental book reading -20.726 2.361
Gender of the teacher 1.091 7.861
Percentage of students not speaking test language -0.343 0.309
Percentage of students with few educational resources -0.091 0.358
Percentage of students in the school come from economically disadvantaged homes 0.125 0.863
Location of the school/If is non rural or rural -0.223 2.923
Mean of parent’s highest occupational level -1.213 6.418
Instruction affected by reading resource shortages scale 0.62 1.532
Parental involvement in school activities 1.141 2.028
School climate/Teachers expectations for student achievement -2.079 1.548
Variance (%)
Student level 95.6
Class level 1.8
School level 2.6
Model 31.6

Page | 84
Table A19. Results of the multilevel modelling analysis for Spain
Final model
2011 SE 2011
Reading Achievement 681.587 15.783
Gender of the student -1.147 1.671
Language spoken at home -5.34 4.062
Parent’s highest occupational Level -3.16 0.84
Employment situation of the father -1.385 1.718
Employment situation of the mother -0.491 1.038
Attended pre-school 2.979 6.953
Home resources for learning scale -17.083 2.236
Students like reading scale -14.124 1.313
Recognize letters of the alphabet -23.964 1.304
Parental book reading -9.511 1.485
Gender of the teacher -3.758 2.794
Percentage of students not speaking test language
-0.445 0.133
Percentage of students with few educational resources
0.009 0.325
Percentage of students in the school come from economically disadvantaged homes
-0.189 0.732
Location of the school/If is non rural or rural -9.369 4.165
Mean of parent’s highest occupational level -5.027 4.588
Instruction affected by reading resource shortages scale
-1.184 1.019
Parental involvement in school activities -2.172 1.72
School climate/Teachers expectations for student achievement
-0.706 1.222
Variance (%)
Student level 89.4
Class level 4.3
School level 6.3
Model 28.1

Page | 85
Table A20. Results of the multilevel modelling analysis for Sweden
Final model
2011 SE 2011
Reading Achievement 763.825 26.296
Gender of the student -4.098 2.356
Language spoken at home -20.308 5.988
Parent’s highest occupational Level -2.889 1.343
Employment situation of the father -7.66 3.73
Employment situation of the mother -3.226 2.167
Attended pre-school -7.901 8.609
Home resources for learning scale -21.432 2.837
Students like reading scale -18.552 1.872
Recognize letters of the alphabet -17.088 1.849
Parental book reading -15.408 2.55
Gender of the teacher -6.718 4.268
Percentage of students not speaking test language
-0.479 0.298
Percentage of students with few educational resources
0.018 0.516
Percentage of students in the school come from economically disadvantaged homes
-0.804 0.849
Location of the school/If is non rural or rural -5.406 3.372
Mean of parent’s highest occupational level -9.598 8.604
Instruction affected by reading resource shortages scale
0.065 3.494
Parental involvement in school activities -1.134 2.279
School climate/Teachers expectations for student achievement
0.341 1.442
Variance (%)
Student level 94.3
Class level 2.9
School level 2.8
Model 36.7

European Commission
EUR 26337 EN – Joint Research Centre – Institute for the Protection and Security of the Citizen
Title: Reading Literacy in EU Countries: Evidences from PIRLS
Authors: Patrícia Dinis da Costa, Patrícia Almeida and Luísa Araújo
Luxembourg: Publications Office of the European Union
2013 – 88 pp. – 21.0 x 29.7 cm
EUR – Scientific and Technical Research series – ISSN 1831-9424
ISBN 978-92-79-34677-4
doi: 10.2788/40816
Abstract
In this report we used data from the Progress in International Reading Literacy Study (PIRLS) 2011 in order to
identify the school, class and individual student background factors that explain reading literacy achievement.
We aim to identify the factors associated with achievement at different levels of analysis, both at the EU level
and at the individual country level using a multilevel model. Additionally, we intend to establish trends in
students reading achievement by comparing PIRLS 2006 and PIRLS 2011 cycles. For the data from 2011 we found
that our aggregated model explains 37% of the variance in students’ achievement and that the variables with the
highest impact on students´ overall reading score relate to home resources and practices, students´ attitudes
toward reading and pre-reading knowledge. Moreover, the results of the country-level analysis indicate that the
variables with the strongest influence on students’ reading performance are the same, despite of the wide
variation across countries in terms of their magnitude due to the characteristics of each country. Furthermore,
these findings are in line with the previous analysis performed for PIRLS 2006 (Araújo & Costa, 2012). Our results
have important policy implications as they show which factors can be addressed by policy measures to improve
students´ achievement.
As the Commission’s in-house science service, the Joint Research Centre’s mission is to provide
EU policies with independent, evidence-based scientific and technical support throughout the
whole policy cycle.
Working in close cooperation with policy Directorates-General, the JRC addresses key societal
challenges while stimulating innovation through developing new standards, methods and tools,
and sharing and transferring its know-how to the Member States and international community.
Key policy areas include: environment and climate change; energy and transport; agriculture
and food security; health and consumer protection; information society and digital agenda;
safety and security including nuclear; all supported through a cross-cutting and multi-
disciplinary approach.
LB
-NA
-26337-E
N-N


