

Relationship between the Number of EZ Cards (Rewards)
Gained by the Students and their Oral Assessment scores in
L2 English Speaking Environment
Afiani Astuti
Presented in ASIA TEFL24 October 2013
Ateneo de Manila UniversityPhilippines

The Study Investigated the
relationship between the number of EZ cards (rewards) gained by secondary students and their oral assessment score.
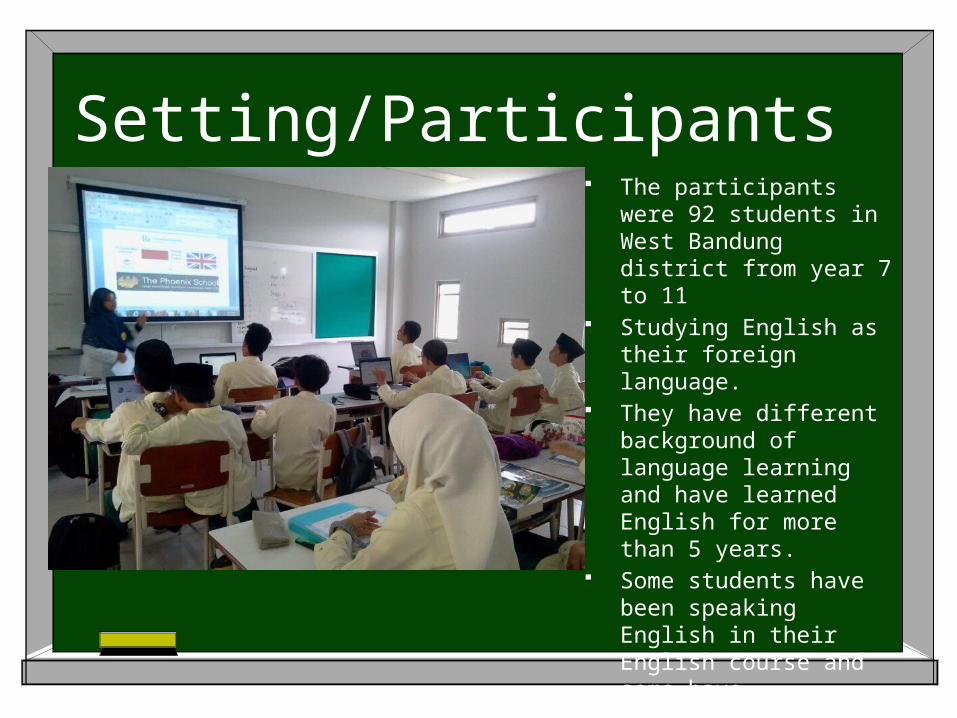
Setting/Participants The participants were
92 students in West Bandung district from year 7 to 11
Studying English as their foreign language.
They have different background of language learning and have learned English for more than 5 years.
Some students have been speaking English in their English course and some have experienced staying and living overseas in English speaking countries.

Efforts to create ESE (EZ)

English Speaking Environment
English day – once a
week
English days – three days a
week
English days-
everyday
English speaking
Environment (EZ cards as
rewards)

Reality It was tough to encourage the students
to speak English The English Speaking Environment
program had to be supported from all teachers, parents and friends.
Applications and procedures were established
Supporting the sustainability of the program

EZ Cards

EZ Cards system Worth 10% of marks Collected by students 8-10 cards per term
The students have to use English actively both in and out of the classroom
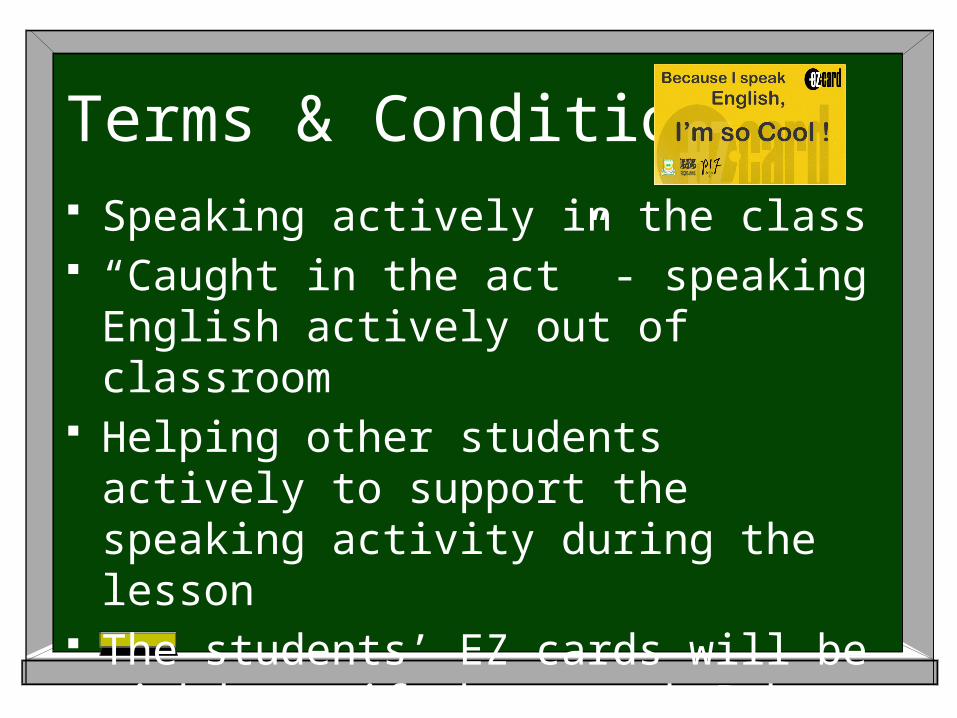
Terms & Conditions Speaking actively in the class “Caught in the act” - speaking
English actively out of classroom Helping other students actively to
support the speaking activity during the lesson
The students’ EZ cards will be withdrawn if they speak Bahasa Indonesia (L1)
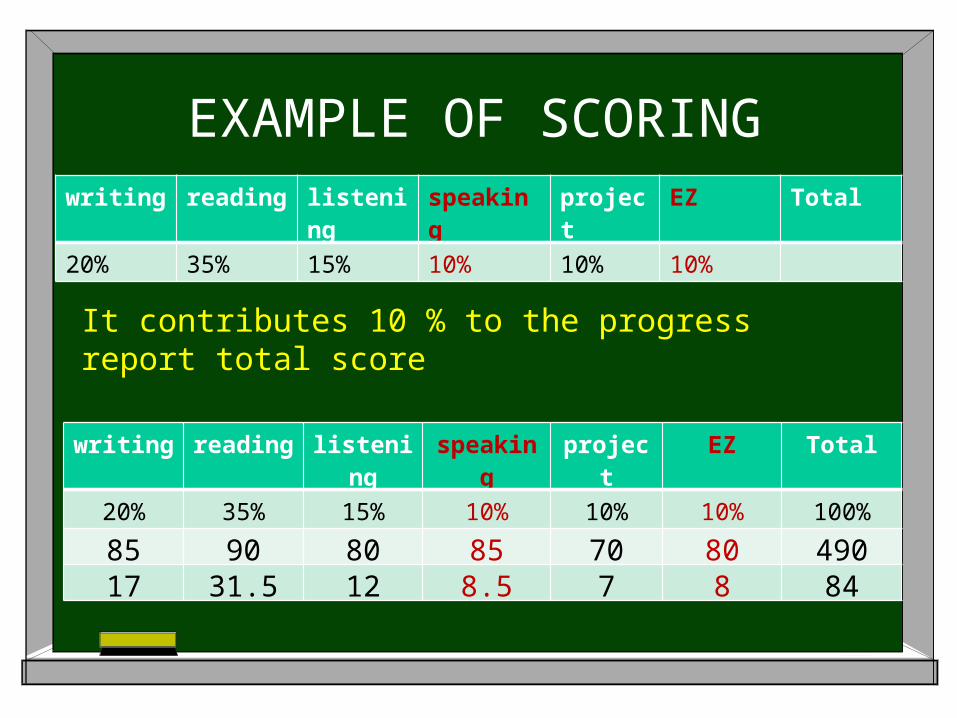
EXAMPLE OF SCORING
It contributes 10 % to the progress report total score
writing reading
listening
speaking
project
EZ Total
20% 35% 15% 10% 10% 10%
writing reading
listening
speaking
project
EZ Total
20% 35% 15% 10% 10% 10% 100%
85 90 80 85 70 80 49017 31.5 12 8.5 7 8 84

Theories Motivation (Gardner, 1981; Dornyei,
2001; de Bot et all, 2005) A genuine interest in learning the second language in
order to come closer to the other language community. (Gardner, 1981)
Motivational attribution, feedback, learner’s satisfaction, rewards and grades (Dornyei, 2001)
Learners do better when they are rewarded but the extra effort stopped when the rewards are taken away (de Bot et all, 2005)

Linguistics environment (Krashen, 1996; Long, 1999; Elllis, 1999; Swain, 2003,
Wang, 2009)
to increase practice opportunities
to improve the quality of students’ talk
to help individualising instruction
to promote a positive affective climate

EZ – Linguistic Environment
Explicit learning
controlled
Formal
classroom
ImplicitLess
controlled
Informal
Out of classroo
m

Methods Quantitative•This study applied chi-square calculation as its statistical tool to identify how the number of EZ cards gained correlated to the students’ speaking score
Data collection•by recapping all the EZ cards gained for one term•by collecting oral assessment in the end of the term

Instruments
Score Categories
EZ cards EZ cards
0 L
3 M
>6 H
Score Categories
Speaking score EZ cards
0 L
4 M
>7 H
• A recapitulation sheet of EZ cards collection
• The score of oral assessment during the oral assessment week.

HH = high number of EZ card gained with high speaking score MM = medium number of EZ card with medium speaking score LL = low number of EZ card gained with low speaking score
MH = medium number of EZ card gained with medium speaking score
LH = low number of EZ card gained with high speaking score HM = high number of EZ card gained with medium speaking
score LM= low number of EZ card gained with medium HL = high number of EZ card gained with low speaking score ML = = high number of EZ card gained with low speaking score
SPEAKING SCORE EZ card gained
HIGH MEDIUM LOW
HIGH HH HM HL
MEDIUM MH MM ML
LOW LH LM LL
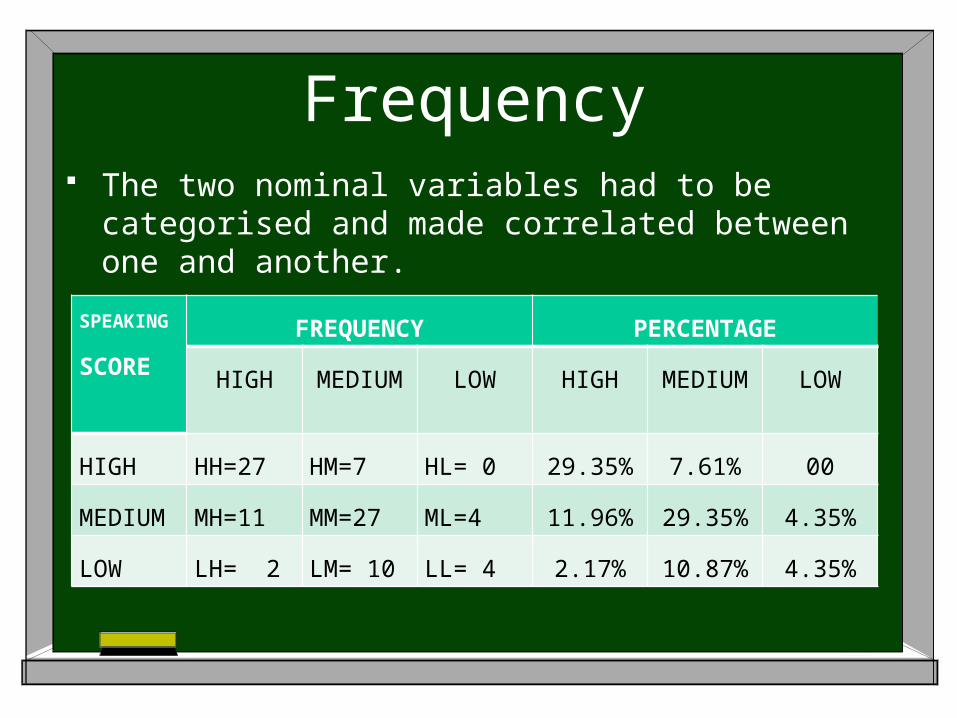
Frequency The two nominal variables had to be categorised
and made correlated between one and another.
SPEAKING
SCOREFREQUENCY PERCENTAGE
HIGH MEDIUM LOW HIGH MEDIUM LOW
HIGH HH=27 HM=7 HL= 0 29.35% 7.61% 00
MEDIUM MH=11 MM=27 ML=4 11.96% 29.35% 4.35%
LOW LH= 2 LM= 10 LL= 4 2.17% 10.87% 4.35%

Expected & ObservedOBSERVED EZ card gained TOTAL
SPEAKING SCORE HIGH MEDIUM LOW
HIGH 32 2 0 34
MEDIUM 10 28 4 42
LOW 3 5 8 16
TOTAL 45 35 12 92
EXPECTED EZ card gained TOTAL
SPEAKING SCORE HIGH MEDIUM LOW
HIGH 16.63 12.93 4.43 34
MEDIUM 20.54 15.98 5.48 42
LOW 7.83 6.09 2.09 16
TOTAL 45 35 12 92

Chi squareX2 = Ʃ (32-16.63)2 + (10-20.54) 2 + (3-7.83) 2 + (2-12.93) 2 + (28-15.98) 2 +
16.63 20.54 7.83 12.93 15.98
(5-6.09) 2
+
(0-4.43) 2
+
(4-5.48) 2 + (8 – 2.09) 2 +
6.09 4.43 5.48 2.09
X2 = 14.2 + 5.41 + 2.98 + 9.24 + 9.04 + 0.19 + 0.19 0.40 +X2 = 62.66
The number of the degree of freedom for two ways table is found by applying formula. df =(C-1) (R-1)df =(3-1) (3-1)
df = 4

Results The obtained chi-square value is 62.66
which means it is in the critical region that it exceeds the critical value of 9.488 with the degree of freedom 4. Therefore, H0 is rejected and the result is significant with X2
(4, n = 92), p < 0.05.
The relationship between the number of EZ cards gained as motivation and the speaking score on oral assessment is significant.

Conclusion
The more students practiced their English, the more EZ cards gained.
The more they practiced, the more they prepared for the oral examination.
Overall, the students have more chances for oral production in the linguistic environment
This study supported a number of research on motivation and the achievement of the English language learners.

Maraming Salamat Po


