

General rights Copyright and moral rights for the publications made accessible in the public portal are retained by the authors and/or other copyright owners and it is a condition of accessing publications that users recognise and abide by the legal requirements associated with these rights.
Users may download and print one copy of any publication from the public portal for the purpose of private study or research.
You may not further distribute the material or use it for any profit-making activity or commercial gain
You may freely distribute the URL identifying the publication in the public portal If you believe that this document breaches copyright please contact us providing details, and we will remove access to the work immediately and investigate your claim.
Downloaded from orbit.dtu.dk on: Feb 27, 2022
Removal of pharmaceuticals from hospital wastewater by staged biofilm and ozonepolishing
Tang, Kai
Publication date:2018
Document VersionPublisher's PDF, also known as Version of record
Link back to DTU Orbit
Citation (APA):Tang, K. (2018). Removal of pharmaceuticals from hospital wastewater by staged biofilm and ozone polishing.Technical University of Denmark.

i
Removal of pharmaceuticals from hospital
wastewater by staged biofilm and ozone
polishing
Kai Tang
PhD Thesis
December 2017
DTU Environment
Department of Environmental Engineering
Technical University of Denmark
ii
Removal of pharmaceuticals from hospital wastewater by staged biofilm
and ozone polishing
Kai Tang
PhD Thesis, December 2017
The synopsis part of this thesis is available as a PDF file for download from
the DTU research database ORBIT: http://www.orbit.dtu.dk
Address: DTU Environment
Department of Environmental Engineering
Technical University of Denmark
Miljoevej, Building 113
2800 Kgs. Lyngby
Denmark
Phone reception: +45 4525 1600
Fax: +45 4593 2850
Homepage: http://www.env.dtu.dk
E-mail: [email protected]
Cover: GraphicCo

iii
Preface
This PhD thesis is based on research carried out in the Department of
Environmental Engineering at the Technical University of Denmark from
January 2015 to December 2017. It was prepared as part of the Mermiss
project and performed under the main supervision of Professor Henrik
Rasmus Andersen (DTU Environment) and the co-supervision of Professor
Kai Bester (Aarhus University, Environmental Science).
The thesis is organised in two parts: the first part puts into context the
findings of the PhD in an introductive review, while the second consists of
the papers listed below. These will be referred to in the text by their paper
numbers, written with the Roman numerals I-V.
I Ooi, G.T.H., Tang, K., Chhetri, R.K., Kaarsholm, K.M.S.,
Sundmark, K., Kragelund, C., Litty, K., Christensen, A., Lindholst,
S., Sund, C., Christensson, M., Bester, K., Andersen, H.R., 2017.
Biological treatment of hospital wastewater in a pilot-scale staged
Moving Bed Biofilm Reactors (MBBRs) utilizing both nitrifying and
denitrifying processes. Manuscript to be submitted.
II Tang, K., Escola Casas, M., Ooi, G.T.H., Kaarsholm, K.M.S.,
Bester, K., Andersen, H.R., 2017. Influence of humic acid addition
on the degradation of pharmaceuticals by biofilms in effluent
wastewater. International Journal of Hygiene and Environmental
Health, 220, 604-610.
III Tang, K., Ooi, G.T.H., Litty, K., Sundmark, K., Kaarsholm, K.M.S.,
Sund, C., Kragelund, C., Christensson, M., Bester, K., Andersen,
H.R., 2017. Removal of pharmaceuticals in conventionally treated
wastewater by a polishing moving bed biofilm reactor (MBBR) with
intermittent feeding. Bioresource Technology, 236, 77-86.
IV Tang, K., Spiliotopoulou, A., Chhetri, R.K., Ooi, G.T.H.,
Kaarsholm, K.M.S., Sundmark, K., Florian, B., Kragelund, C.,
Bester, K., Andersen, H.R., 2017. Removal of pharmaceuticals,

iv
toxicity and natural fluorescence by ozonation of biological treated
hospital wastewater with further polishing by suspended biofilm.
Manuscript to be submitted.
V Tang, K., Ooi, G.T.H., Chhetri, R.K., Spiliotopoulou, A.,
Kaarsholm, K.M.S., Sundmark, K., Florian, B., Kragelund, C.,
Bester, K., Andersen, H.R., 2017. Removal of pharmaceuticals,
toxicity and natural fluorescence by ozonation in biological pre-
treated municipal wastewater in comparison to subsequent polishing
biofilm reactors. Manuscript to be submitted.
In addition, the following publications, not included in this thesis, were also
concluded during this PhD study:
Ooi, G.T.H., Tang, K., Bester, K., Andersen, H.R., 2017. Biological
treatment of municipal wastewater in a pilot-scale staged Moving
Bed Biofilm Reactors (MBBRs) and MBBRs combined with activat-
ed sludge (Hybas). Manuscript.
Tang, K., Kragelund, C., Andersen, H.R. (2017). Removal of phar-
maceuticals in conventionally treated wastewater by a polishing sand
filtration with intermittent feeding. In preparation.
Droumpali, A., Tang, K., Litty, K., Mikkelsen, N., Lindholst, S.,
Kragelund, C., Andersen, H.R. (2017). Irrigation of treated
wastewater in Samsø, Denmark. In preparation.
Furthermore, this PhD study also contributed to several international confer-
ences with the following conferences papers:
Tang, K., Escola Casas, M., Bester, K., Andersen, H.R., Influence of
dissolved organic carbon on biodegradation of pharmaceuticals by
suspended biofilms in wastewater. 2nd
Young Water Professionals
Denmark Conference and Workshop. Aarhus (Denmark), March 10-
11, 2016. Oral presentation.
Tang, K., Bester, K., Andersen, H.R., Polishing of pharmaceuticals
in conventionally treated wastewater with intermittently fed Moving
Bed Biofilm Reactors (MBBR). 8th
INTERNATIONAL WATER &
HEALTH SEMINAR. Cannes (France), June 27-29, 2016. Oral
presentation.
Tang, K., Ooi, G.T.H., Spiliotopoulou, A., Chhetri, R.K., Kaar-
sholm, K.M.S., Florian, B., Kragelund, C., Bester, K., Andersen,
H.R., Pharmaceuticals, toxicity and natural fluorescence intensity of

v
biologically treated hospital wastewater removed by pilot and labora-
tory scale ozonation. 15th
International Conference on Environmental
Science and Technology. Rhodes (Greece), August 31 to September
2, 2017. Oral Presentation.
Tang, K., Ooi, G.T.H., Litty, K., Sundmark, K., Sund, C., Krage-
lund, C., Christensson, M., Bester, K., Andersen, H.R., Removing re-
sidual pharmaceuticals from activated sludge effluent by intermit-
tently fed Moving Bed Biofilm Reactors (MBBR). 10th
Micropol &
Ecohazard Conference. Vienna (Austria), September 18-20, 2017.
Oral presentation.
Tang, K., Ooi, G.T.H., Florian, B., Sundmark, K., Sund, C., Krage-
lund, C., Bester, K., Andersen, H.R., Pilot and laboratory scale ozo-
nation of biologically treated hospital wastewater for removal of
pharmaceuticals and toxicity concurrently with natural fluorescence
intensity. 10th
Micropol & Ecohazard Conference. Vienna (Austria),
September 18-20, 2017. Oral presentation.

vi
vii
Acknowledgements
First, I would like to express my deep thanks to my supervisor Professor
Henrik Rasmus Andersen who gave me an opportunity to be in Denmark and
work on the Mermiss project. I feel so grateful always receive his nice
feedbacks and advices. He is good at perceiving my needs not only for now
but also for future. I am thankful to my co-supervisor Professor Kai Bester
for support and guidance during my PhD. I also appreciate that people
involved in the Mermiss project specially Caroline, Sabine, Kim and Alice to
make the project work very well.
Then, the big thanks go to both Dr. Kamilla M.S. Kaarsholm and Dr. Ravi K
Chhetri, without their warm-hearted and selfless help, I could not cope with
many things alone. I am very grateful to Dongah, Aikaterini, Ariadni, Argryo,
Gordon, Yuhoon and Paul, for keeping nice work atmosphere and making our
group so special. A particular thank goes to Anne Harsting for supporting
constantly during my PhD period. I also would like to say thanks to Mikael
Emil Olsson, Sinh Hy Nguyen, Hanne Bøggild, Charlotte Lind and Kim
Ryberg for their helps.
I would like to say thanks to Biao, Su, Ma, Sheng, Liguang, Liguan, Frank,
Xiaohu, Xinyu, Nannan, Weichu, Peter, Sarah, David, Junxi, Tenpeng for
having good time together in Denmark.
Finally, I want to thank the constant supports and loves from my family: my
parents Jianzhang and Hongwei, my grandparents, my uncles and aunts, and
my cousins.

viii

ix
Summary
Research on the removal of micropollutants (i.e. pharmaceuticals) has
received a lot of attention in the last few decades. Wastewater treatment
plants (WWTPs) act as the final checkpoint in controlling the quality of
wastewater before discharge into receiving water. However, conventional
WWTPs are not able to remove every pharmaceutical, including the majority
of hardly biodegradable compounds and effluents that eventually affect the
aquatic environment. Therefore, either upgrading traditional processes in
WWTPs or the onsite treatment of pharmaceuticals at the point source (i.e.
hospital wastewater), before release into the sewer system, must be
considered, in order to overcome the above issues.
Moving bed biofilm reactors (MBBRs) as an alternative to activated sludge
have been already proven highly capable of removal of pharmaceutical.
Based on 36 pharmaceuticals in hospital wastewater, the concentrations of
which are limited through DHI (Institute for Water and Environment), these
targeted compounds are investigated in this research despite no current
regulations for the presence of pharmaceuticals WWTP effluent.
Concentrations of substrate in wastewater can affect the degradation of
organic micropollutants, due to a number of involved biodegradation
mechanisms, including co-degradation and competitive inhibition. The effect
of humic acid, as a model complex organic substrate, was investigated in
relation to the biodegradation of pharmaceuticals in WWTP effluent via a
laboratory-scale polishing MBBRs. Twelve investigated pharmaceuticals
were significantly biodegradable. The biodegradation rate constants of ten of
these compounds increased in line with increased humic acid concentrations,
which shows that the presence of complex substrates stimulates degradation
via a co-metabolism-like mechanism rather than competitive inhibition.
Staged MBBRs were applied for polishing of the effluent of an activated
sludge treatment plant, in order to enhance the removal of pharmaceuticals.
To address the issue regarding effluent not containing sufficient organic
matter to sustain enough biomass, a novel feeding approach, namely
intermittent feeding to MBBRs reactor with WWTP effluent and settled raw
wastewater, was implemented for the first time. First-order rate constants for
pharmaceutical removal, normalized to biomass, were significantly higher
compared to other studies on activated sludge and suspended biofilms,
especially for diclofenac, metoprolol and atenolol. Due to intermittent
x
feeding, diclofenac degradation occurred with a half-life of only 2.1 hours
and was thus much faster than any hitherto described wastewater bioreactor
treatments.
An onsite pilot-scale of staged MBBRs, involving only the MBBR technique,
was applied to remove pharmaceuticals existing in raw hospital wastewater,
in order to achieve relevant Danish regulation standards on discharge.
Furthermore, a pilot-scale of staged MBBRs, involving MBBR and MBBR
combined with activated sludge (Hybas) techniques, was applied to treat raw
municipal wastewater, with the aim of attaining a high degree of
pharmaceutical degradation. The strategy of intermittent feeding was carried
out for both studies. In general, the majority of pharmaceuticals were
removed sufficiently compared to other biological treatment processes, and
the removal of diclofenac occurred in the reactors following the
implementation of intermittent feeding.
A pilot ozonation system was introduced to treat effluents from the staged
MBBRs that were applied to treat hospital/municipal wastewater. This was
able to attain further removal of remaining pharmaceuticals and toxicity.
Concentrations of pharmaceuticals decreased when ozone dosage increased,
and then the ozone dose reaching 90% removal of pharmaceutical was nor-
malized by DOC, following that relevant removal efficiency was comparable
to literature studies of ozonation. Natural fluorescence as an easily measura-
ble parameter for the oxidation of organic matter in wastewater appeared to
degrade quickly along with an increase in ozone doses. Microtoxicity in the
wastewater of staged MBBRs decreased along the treatment train, and ozone
was able to remove half of the remaining toxicity in MBBR effluents. Polish-
ing MBBRs applied after ozone, with the ultimate aim of reducing ozone by-
products, removed almost all water toxicity.

xi
Dansk sammenfatning
Forskning i fjernelse af mikroforureningsstoffer (f.eks. lægemidler) har fået
stor opmærksomhed de seneste årtier. Spildevandsrensningsanlæg fungerer
som den sidste barrier til at sikre kvaliteten af spildevand, før det udledes til
recipienter. Konventionelle rensningsanlæg kan imidlertid ikke fjerne alle
lægemidler, hvorved størstedelen af ikke-biologisk-nedbrydelige forbindelser
udledes sammen med det behandlede spildevand, og de kan derved i sidste
ende påvirker vandmiljøet. Derfor bør der enten ske en opgradering af tradi-
tionelle processer i rensningsanlæg eller en behandling af lægemidler ved
kilden (dvs. behandling af hospitalsspildevand) inden udledning til kloaksy-
stemet.
Moving Bed Biofilm Reactor (MBBR) som et alternativ til aktivt slam, har
allerede vist sig at være i stand til at fjerne lægemidler. For 36 lægemidler er
grænseværdier blevet foreslået i DHI (Institut for Vand og Miljø) til hospi-
talsaffald, på trods af manglende regler for tilstedeværelse af stoffer i kom-
munalt spildevand.
Koncentrationer af co-substrat i spildevand kan påvirke nedbrydningen af
organiske mikroforureningsstoffer på grund af forskellige bionedbrydnings-
mekanismer, herunder co-nedbrydning og konkurrencebetinget inhibering.
Effekten af humussyre som modelstof for et komplekst organisk substrat,
blev undersøgt i relation til biologisk nedbrydning af lægemidler i renset
spildevand via en laboratorieskala MBBR biofilm. Tolv undersøgte lægemid-
ler var signifikant bionedbrydelige. De biologiske nedbrydningshastigheds-
konstanter for ti af disse lægemidler steg med øged koncentration af humus-
syre, hvilket viser at tilstedeværelsen af komplekse substrater stimulerer ned-
brydning via en co-metabolisme-lignende mekanisme snarere end konkurren-
cepræget inhibering.
Trindelt MBBR blev anvendt til polering af spildevandet fra et aktivt slambe-
handlingsanlæg for at forbedre fjernelsen af lægemidler. For at løse proble-
met med at rense spildevand som ikke indeholder tilstrækkeligt organisk ma-
teriale til at opretholde tilfredsstillende biomasse, blev en ny fodringsmetode,
nemlig intermitterende tilførsel af behandlet spildevand blandet med råt spil-
devand, implementeret for første gang. I biofilm dyrket på denne måde var
førsteordenshastighedskonstanter for fjernelse af lægemidler, normaliseret til
biomasse, signifikant højere sammenlignet med andre undersøgelser af aktivt
slam og suspenderede biofilm, især for diclofenac, metoprolol og atenolol.
xii
På grund af intermitterende fodring forekom diclofenac nedbrydning med en
halveringstid på kun 2,1 timer hvilket var meget hurtigere end nogen tidligere
beskrevne bioreaktorbehandling af spildevand.
Et trindelt MBBR pilotskalaanlæg blev anvendt til at fjerne lægemidler i hos-
pitalsspildevand, for at opnå relevante danske reguleringsstandarder for ud-
ledning. Endvidere blev der anvendt et pilotanlæg med trindelt MBBR, der
involverer MBBR og MBBR kombineret med aktivt slam (Hybas) til behand-
ling af råt kommunalt spildevand med det formål at opnå en høj grad af ned-
brydning af lægemidler. Strategien med intermitterende fodring blev udført
for begge undersøgelser. Generelt blev størstedelen af lægemidlerne fjernet
bedre sammenlignet med andre biologiske behandlingsprocesser, og fjernel-
sen af diclofenac forekom i reaktorerne efter implementeringen af intermitte-
rende fodring.
Et pilot-ozoneringssystem blev opført til behandling af spildevand fra de
trindelte MBBR'er, der blev anvendt til behandling af hospital/kommunalt
spildevand. Dette var i stand til at opnå yderligere fjernelse af resterende læ-
gemidler og toksicitet. Koncentrationerne af lægemidler faldt med øget ozon-
doseringen. Den fundne DOC normaliseret ozondose, der er nødvendig for
90% fjernelse af lægemiddel, var sammenlignelig med litteraturværdier for
ozonering af behandlet spildevand. Naturlig fluorescens som en let målbar
parameter for oxidation af organisk stof i spildevand, viste sig at nedbrydes
hurtigt sammen med en stigning i ozon doser. Mikrotok® aktivitet i spilde-
vandet i den trindelte MBBR-anlæg faldt i takt med behandlingen, og ozon
var i stand til at fjerne halvdelen af den resterende toksicitet i MBBR-
spildevandet. Polerende MBBR, som blev anvendt efter ozonbehandling med
det formål at reducere ozonbiprodukter, fjernede næsten al toksiciteten.
xiii
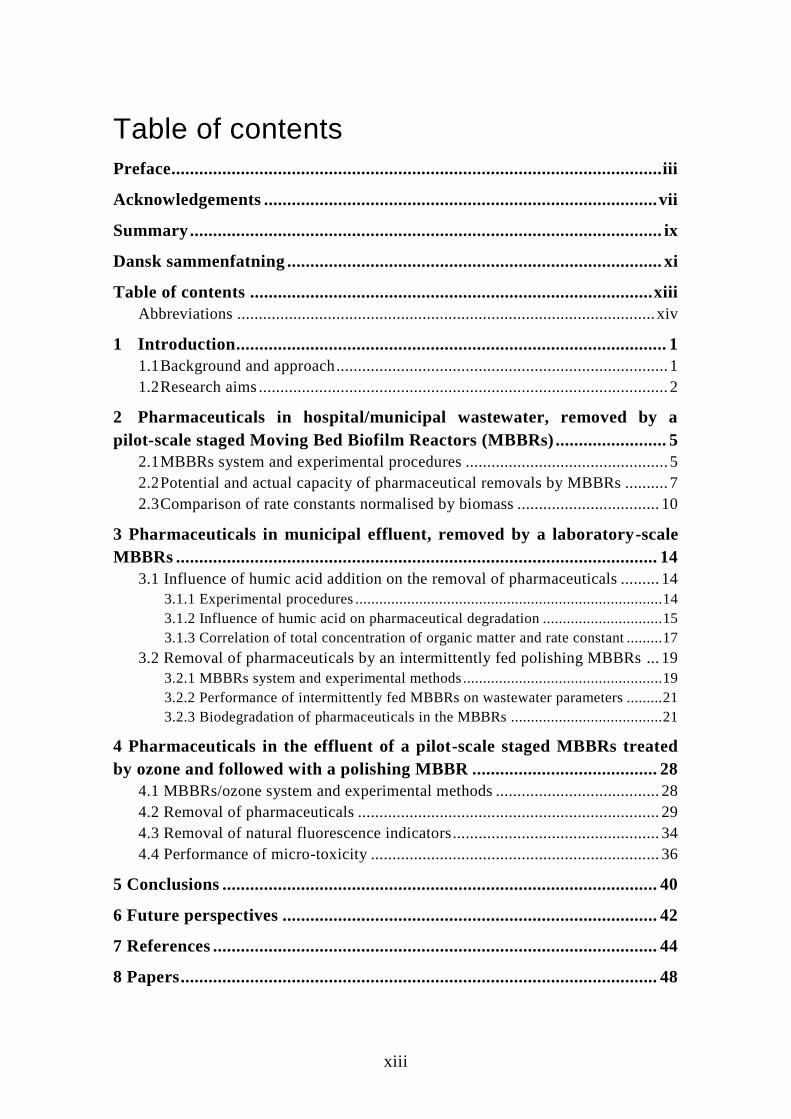
Table of contents
Preface .......................................................................................................... iii
Acknowledgements ..................................................................................... vii
Summary ...................................................................................................... ix
Dansk sammenfatning ................................................................................. xi
Table of contents ....................................................................................... xiii
Abbreviations ................................................................................................. xiv
1 Introduction ............................................................................................. 1
1.1 Background and approach ............................................................................. 1
1.2 Research aims ............................................................................................... 2
2 Pharmaceuticals in hospital/municipal wastewater, removed by a
pilot-scale staged Moving Bed Biofilm Reactors (MBBRs) ........................ 5
2.1 MBBRs system and experimental procedures ............................................... 5
2.2 Potential and actual capacity of pharmaceutical removals by MBBRs .......... 7
2.3 Comparison of rate constants normalised by biomass ................................. 10
3 Pharmaceuticals in municipal effluent, removed by a laboratory-scale
MBBRs ........................................................................................................ 14
3.1 Influence of humic acid addition on the removal of pharmaceuticals ......... 14
3.1.1 Experimental procedures ............................................................................. 14
3.1.2 Influence of humic acid on pharmaceutical degradation .............................. 15
3.1.3 Correlation of total concentration of organic matter and rate constant ......... 17
3.2 Removal of pharmaceuticals by an intermittently fed polishing MBBRs ... 19
3.2.1 MBBRs system and experimental methods .................................................. 19
3.2.2 Performance of intermittently fed MBBRs on wastewater parameters ......... 21
3.2.3 Biodegradation of pharmaceuticals in the MBBRs ...................................... 21
4 Pharmaceuticals in the effluent of a pilot-scale staged MBBRs treated
by ozone and followed with a polishing MBBR ........................................ 28
4.1 MBBRs/ozone system and experimental methods ...................................... 28
4.2 Removal of pharmaceuticals ...................................................................... 29
4.3 Removal of natural fluorescence indicators................................................ 34
4.4 Performance of micro-toxicity ................................................................... 36
5 Conclusions .............................................................................................. 40
6 Future perspectives ................................................................................. 42
7 References ................................................................................................ 44
8 Papers ....................................................................................................... 48

xiv
Abbreviations
MBBR Moving bed biofilm reactor
WWTP Wastewater treatment plant
HA Humic acid
BOD Biochemical oxygen demand
DNAS Denitrifying activated sludge
NMBBR Nitrifying MBBR
1
1 Introduction
1.1 Background and approach Due to the high consumption of pharmaceuticals in the last few decades, their
widespread presence in wastewater has attracted a great deal of attention
(Herrmann et al., 2015). However, conventional wastewater treatment plants
(WWTPs) as the last obstacle were not able to completely degrade all phar-
maceuticals before discharging into receiving water sources (Verlicchi et al.,
2012b). Thus, contaminated WWTP effluent can affect the aquatic environ-
ment (Overturf et al., 2015). Consequently, moving bed biofilm reactors
(MBBRs), as a recently biological technology, can be considered to address
this issue (Ødegaard, 2006).
MBBRs consist of flow-through wastewater and suspended plastic carriers,
on which attached biofilms can grow. Previous studies have proven that
MBBRs remove more pharmaceuticals than activated sludge (Escolà Casas et
al., 2015a; Falås et al., 2012). To upgrade conventional WWTPs and enhance
the chances of pharmaceutical removal, MBBRs can be used in two ways as
an alternative to activated sludge. On the one hand, in order to partly or fully
replace traditional wastewater treatment processes, MBBRs applied as onsite
treatment solutions for hospital wastewater are able to ease the processing
load for pharmaceutical removal for WWTPs, or fully municipal wastewater
is received by MBBRs instead of activated sludge. On the other hand,
MBBRs can be applied to polish WWTP effluent and thus remaining pharma-
ceuticals present in effluent wastewater are able to be further removed before
discharge.
For the first option, although MBBRs perform well in removing pharmaceuti-
cals, the polishing process is still demanded after MBBRs, and thus hardly
biodegradable pharmaceuticals can be removed from MBBR effluent. Ozone,
with matured experiences of operation and efficient cost, is considered as a
feasible solution to polish effluent wastewater (Hansen et al., 2016;
Hollender et al., 2009). However, ozone by-products with even higher toxici-
ty compared to original compounds cannot be avoided during ozone reaction.
Besides examining removal of pharmaceutical via treatment processes, toxici-
ty in wastewater also needs be investigated, as it would clearly reveal the en-
tirely hazardous nature of wastewater and evaluate thoroughly the perfor-
mance of treatment processes. Furthermore, fluorescence technique, with ad-
vantages of rapid analysis and non-need for reagents, has been provided a

2
tool to monitoring of DOC fraction in wastewater and determine indirectly
ozone in recirculating aquaculture systems water (Hudson et al., 2008;
Spiliotopoulou et al., 2017). While, the knowledge gap, which addresses the
correlation between fluorescence intensity and ozone dose in wastewater,
need be understood.
For the second aspect, WWTP effluent normally has a small amount of avail-
able carbon, and both biofilm growth and bacteria community certainly are
related to the concentration and type of available carbon. As such, there is
currently a lack of knowledge on how the available carbon affects the biodeg-
radation of pharmaceuticals by polishing MBBRs. Additionally, in the staged
MBBRs, less activity in relation to pharmaceutical removal occurs in the last
stage, due to the lack of sufficient carbon source to support biofilm growth.
Therefore, to enhance the capacity of pharmaceutical removal in the last
stage, along with improving the entire removal process in staged MBBRs,
issues regarding the lack of sufficient biomass need be solved.
1.2 Research aims This research is part of the Mermiss project that focuses mainly on address-
ing the issue of pharmaceutical removal in different types of wastewater, in-
cluding effluent in conventional WWTPs, raw hospital wastewater and mu-
nicipal wastewater. Degraders responsible for removing pharmaceuticals in
wastewater have been identified as less active in the last stages of MBBRs
and rely positively on available carbon source from the wastewater to support
their growth. However, effluents or the last stage of MBBRs normally contain
less carbon compared to raw wastewater and cannot provide sufficient carbon
to promote degrader growth. To have more efficient degraders in MBBRs,
and eventually to obtain a high degree of pharmaceutical removal, solutions
need to be found to solve issues about the lack of carbon. Moreover, opti-
mised ozone dosages, applied in MBBR effluents to enhance the removal of
non-biologically degradable compounds, need be understood as well. What’s
more, the removal efficiency of compounds in MBBRs followed by ozone is
not the only goal or index that needs attention, as toxicity development in
ozonated wastewater should also be examined. A feasible and efficient pro-
cess that is able to reduce the relevant toxicity of ozonated wastewater before
discharge ought to be considered.
An overview of the approach used in this research is presented in Figure 1.1.

3
Figure 1.1. Overview of the research approach in this thesis.
The detailed aims of this research are as follows:
Investigate the removal efficiency of pharmaceuticals in an onsite pilot of
staged MBBRs, which was applied for treating hospital wastewater. Eval-
uate whether intermittent feeding to M3A/M3B with M2 effluent can en-
hance the removal of pharmaceuticals in M3. (Paper I)
Investigate the effect of an additional carbon source on the removal of
pharmaceutical in effluent wastewater via a laboratory-scale MBBR. (Pa-
per II)
Evaluate whether intermittent feeding to a laboratory-scale polishing
MBBR with raw settled wastewater and effluent wastewater will enhance
the removal of pharmaceuticals in effluent wastewater. (Paper III)
Assess the effect of ozone dosage on the removal of pharmaceutical in
MBBR effluent via pilot-scale and laboratory-scale ozone. The fluores-
cence intensity of ozonated wastewater for both the pilot and the laborato-
ry experiments was measured under specific wavelengths, and the toxicity
of wastewater in the pilot treatment process, and ozonated wastewater,
was investigated. (Paper IV)
Assess the effect of ozone dosage on the removal of pharmaceutical in
MBBR effluent via pilot-scale and laboratory-scale ozone. The fluores-
cence intensity of ozonated wastewater for both the pilot and the laborato-
ry tests was measured under specific wavelengths, and the toxicity of
wastewater in the pilot treatment process, and ozonated wastewater, was
investigated. Also established whether a pilot-scale polishing MBBR ap-

4
plied after ozonation will affect toxicity and fluorescence intensity. (Pa-
per V)
5
2 Pharmaceuticals in hospital/municipal
wastewater, removed by a pilot-scale
staged Moving Bed Biofilm Reactors
(MBBRs)
2.1 MBBRs system and experimental procedures A six staged pilot-scale MBBRs, receiving raw wastewater from University
Hospital (Skejby, Denmark), was carried out to test the efficiency of remov-
ing pharmaceuticals. This MBBRs system includes six reactors in total under
anaerobic and aerobic conditions (Figure 2.1, left). M1 with 900L and M4
with 500L acted as denitrification reactors, while M2 and M3A/B with 900L,
together with M5 with 500L, and were nitrification reactors. M1 and M4 re-
sponded to the removal of nitrate, and M5 was used as a polishing process for
organic matter in denitrificated M4 effluent. The main task of M2 was to re-
move TOC, while pharmaceutical removal normally occurred in the M3A/B
reactors during the nitrification processes. Based on the good pharmaceutical
removal obtained from a novel strategy involving intermittent feeding to the
reactors, and that this strategy was applied for the first time in this study, as
described in Chapter 3, the feed flow from the M2 effluent to the third reactor
(M3) was switched twice per day, in that either the flow went M3A first and
then to M3B or the opposite way within 12 hours. Thus, biomass in the third
reactor (M3A/B) would be promoted due to interchange feeding. The inlet
flow rate and return flow rate were 800 L/h and 500 L/h, respectively.
Additionally, the same staged pilot-scale MBBRs from above, albeit with a
different treatment configuration was moved afterward to another place
(Herning, Denmark) and raw municipal wastewater treated accordingly. Ra-
ther than the case where each reactor used in Skejby was a pure MBBR tech-
nique, the staged MBBRs applied at Herning consisted of a pure MBBR and a
combination of MBBR and activated sludge (Hybas). Hence, this system, for
denitrification, included an activated sludge reactor of 900 L (M1) and an
MBBR reactor of 500 L (M4); however, for the nitrification process, it in-
cluded an activated sludge tank of 900 L (M2), Hybas reactors of 900 L
(M3A and M3B) and a MBBR reactor of 500 L (M5) (Figure 2.2, left). In-
termittent feeding to M3A/B was also applied in this study. The inlet flow
6
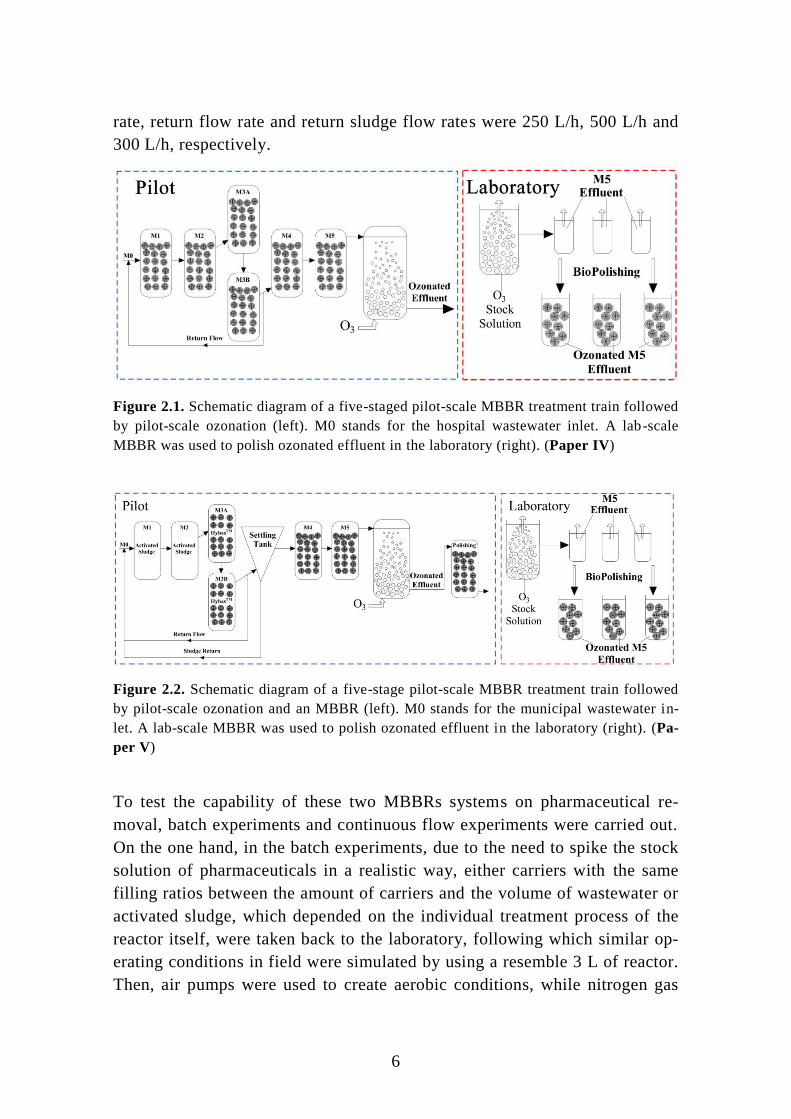
rate, return flow rate and return sludge flow rates were 250 L/h, 500 L/h and
300 L/h, respectively.
Figure 2.1. Schematic diagram of a five-staged pilot-scale MBBR treatment train followed
by pilot-scale ozonation (left). M0 stands for the hospital wastewater inlet. A lab-scale
MBBR was used to polish ozonated effluent in the laboratory (right). (Paper IV)
Figure 2.2. Schematic diagram of a five-stage pilot-scale MBBR treatment train followed
by pilot-scale ozonation and an MBBR (left). M0 stands for the municipal wastewater in-
let. A lab-scale MBBR was used to polish ozonated effluent in the laboratory (right). (Pa-
per V)
To test the capability of these two MBBRs systems on pharmaceutical re-
moval, batch experiments and continuous flow experiments were carried out.
On the one hand, in the batch experiments, due to the need to spike the stock
solution of pharmaceuticals in a realistic way, either carriers with the same
filling ratios between the amount of carriers and the volume of wastewater or
activated sludge, which depended on the individual treatment process of the
reactor itself, were taken back to the laboratory, following which similar op-
erating conditions in field were simulated by using a resemble 3 L of reactor.
Then, air pumps were used to create aerobic conditions, while nitrogen gas

7
was pumped into the reactor to maintain these anaerobic conditions. After
spiking, samples were taken over time.
On the other hand, in the continuous flow experiments, samples were taken
from the influent and reactor effluent according to hydraulic retention time,
and spiking would not execute because the actual behaviour of pharmaceuti-
cal removal in each reactor needed to be investigated in real-life conditions.
2.2 Potential and actual capacity of pharmaceutical
removals by MBBRs As the same experimental strategy was applied to both the hospital
wastewater MBBRs (Skejby) and the municipal wastewater MBBRs (Hern-
ing), besides the differences in receiving wastewater and treatment processes
applied for each reactor, the results for data treatment were similar, and
therefore the following will focus only on experiments carried out with the
hospital wastewater MBBRs as an exemplar. The targeted pharmaceuticals
investigated in this study, as well as following studies, were classified into
different groups: antibiotics (i.e. ciprofloxacin, sulfadiazine, sulfamethizole,
trimethoprim, azithromycin and the sulfadiazine metabolite acetyl-
sulfadiazine), blood pressure regulators (i.e. atenolol, metoprolol, propranolol
and sotalol), analgesics (i.e. carbamazepine, diclofenac, ibuprofen, phenazone
and tramadol), antidepressants (i.e. venlafaxine) and X-ray contrast media
(i.e. iopromide, iohexol and iopamidol). The details of pharmaceuticals in
stock solution and relevant suppliers are presented in the Supplementary In-
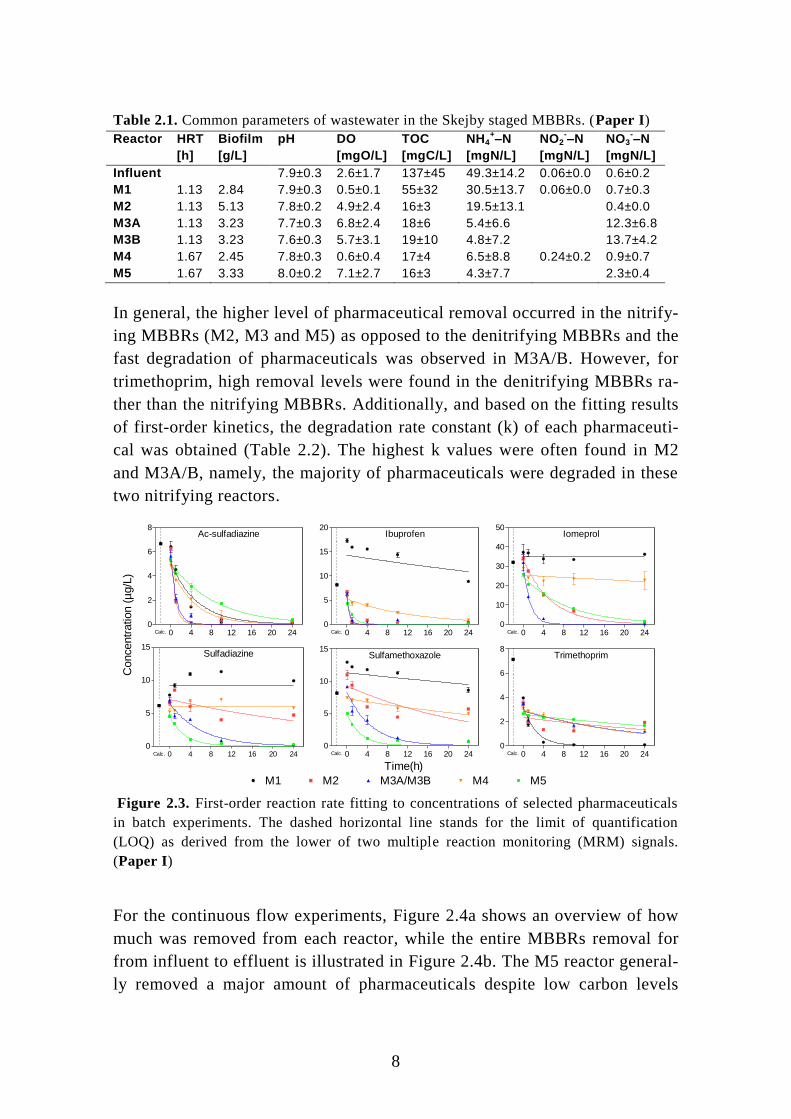
formation of Paper II. Common parameters of wastewater in the Skejby
MBBRs, along with months of operation, are illustrated in Table 2.1. The
highest biomass was observed in the first denitrifying reactor (M2), due to
sufficient carbon in the relevant influent, and yet the biomass in M3A and
M3B was identical because of interchangeable feeding to these two reactors
with M2 effluent for an equal amount of time. Almost 90% of TOC was re-
moved by the MBBRs and a high level of NH4+–N and NO2
- -N was removed
as well, which indicates good nitrification and denitrification achieved
through MBBRs treatment.
For the batch experiments, the concentrations of analysed pharmaceuticals
over time were plotted based on first-order kinetics (2.1), and six representa-
tive compounds are presented in Figure 2.3.
kteCC 0 (2.1)
8
Table 2.1. Common parameters of wastewater in the Skejby staged MBBRs. (Paper I)
Reactor HRT Biofilm pH DO TOC NH4+–N NO2
-–N NO3
-–N
[h] [g/L] [mgO/L] [mgC/L] [mgN/L] [mgN/L] [mgN/L]
Influent 7.9±0.3 2.6±1.7 137±45 49.3±14.2 0.06±0.0 0.6±0.2
M1 1.13 2.84 7.9±0.3 0.5±0.1 55±32 30.5±13.7 0.06±0.0 0.7±0.3
M2 1.13 5.13 7.8±0.2 4.9±2.4 16±3 19.5±13.1 0.4±0.0
M3A 1.13 3.23 7.7±0.3 6.8±2.4 18±6 5.4±6.6 12.3±6.8
M3B 1.13 3.23 7.6±0.3 5.7±3.1 19±10 4.8±7.2 13.7±4.2
M4 1.67 2.45 7.8±0.3 0.6±0.4 17±4 6.5±8.8 0.24±0.2 0.9±0.7
M5 1.67 3.33 8.0±0.2 7.1±2.7 16±3 4.3±7.7 2.3±0.4
In general, the higher level of pharmaceutical removal occurred in the nitrify-
ing MBBRs (M2, M3 and M5) as opposed to the denitrifying MBBRs and the
fast degradation of pharmaceuticals was observed in M3A/B. However, for
trimethoprim, high removal levels were found in the denitrifying MBBRs ra-
ther than the nitrifying MBBRs. Additionally, and based on the fitting results
of first-order kinetics, the degradation rate constant (k) of each pharmaceuti-
cal was obtained (Table 2.2). The highest k values were often found in M2
and M3A/B, namely, the majority of pharmaceuticals were degraded in these
two nitrifying reactors.
Ac-sulfadiazine
0 4 8 12 16 20 240
2
4
6
8
Calc.
Ibuprofen
0 4 8 12 16 20 240
5
10
15
20
Calc.
Iomeprol
0 4 8 12 16 20 240
10
20
30
40
50
Calc.
Sulfadiazine
0 4 8 12 16 20 240
5
10
15
Calc.
Sulfamethoxazole
0 4 8 12 16 20 240
5
10
15
Calc.
Trimethoprim
0 4 8 12 16 20 240
2
4
6
8
Calc.
M1 M2 M3A/M3B M4 M5
Time(h)
Concentr
ation (
µg/L
)
Figure 2.3. First-order reaction rate fitting to concentrations of selected pharmaceuticals
in batch experiments. The dashed horizontal line stands for the limit of quantification
(LOQ) as derived from the lower of two multiple reaction monitoring (MRM) signals.
(Paper I)
For the continuous flow experiments, Figure 2.4a shows an overview of how
much was removed from each reactor, while the entire MBBRs removal for
from influent to effluent is illustrated in Figure 2.4b. The M5 reactor general-
ly removed a major amount of pharmaceuticals despite low carbon levels
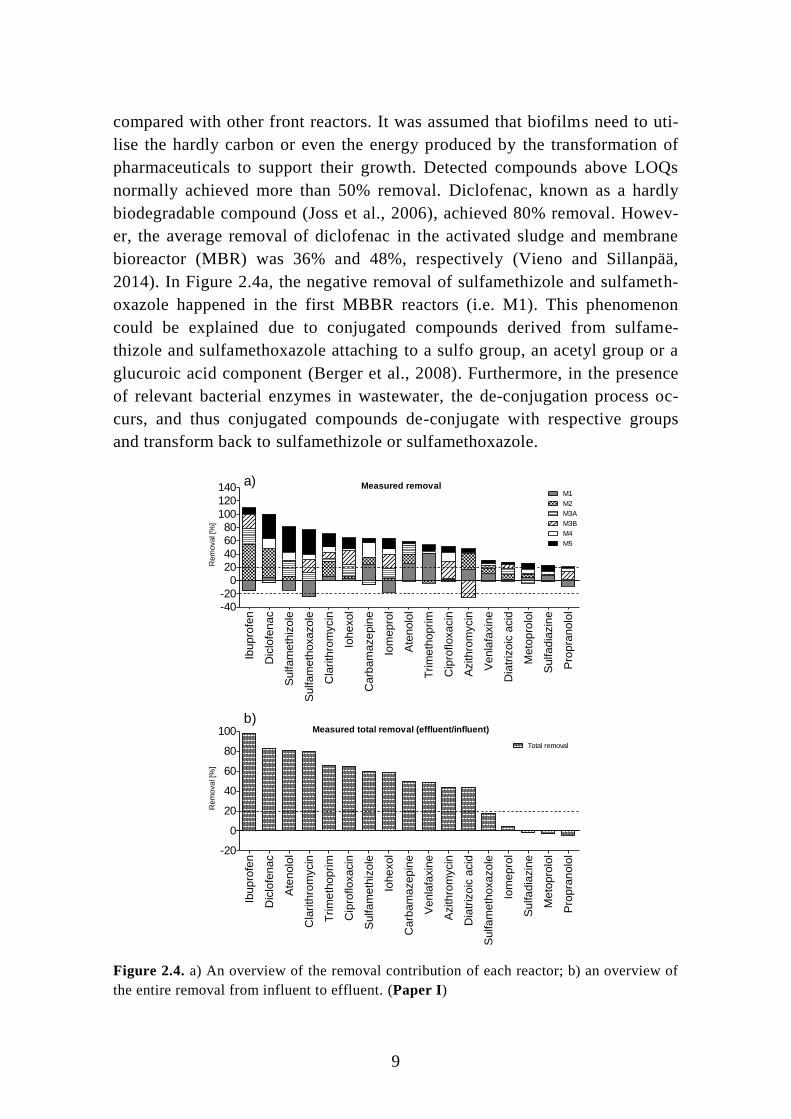
9
compared with other front reactors. It was assumed that biofilms need to uti-
lise the hardly carbon or even the energy produced by the transformation of
pharmaceuticals to support their growth. Detected compounds above LOQs
normally achieved more than 50% removal. Diclofenac, known as a hardly
biodegradable compound (Joss et al., 2006), achieved 80% removal. Howev-
er, the average removal of diclofenac in the activated sludge and membrane
bioreactor (MBR) was 36% and 48%, respectively (Vieno and Sillanpää,
2014). In Figure 2.4a, the negative removal of sulfamethizole and sulfameth-
oxazole happened in the first MBBR reactors (i.e. M1). This phenomenon
could be explained due to conjugated compounds derived from sulfame-
thizole and sulfamethoxazole attaching to a sulfo group, an acetyl group or a
glucuroic acid component (Berger et al., 2008). Furthermore, in the presence
of relevant bacterial enzymes in wastewater, the de-conjugation process oc-
curs, and thus conjugated compounds de-conjugate with respective groups
and transform back to sulfamethizole or sulfamethoxazole.
Measured removal
Ibup
rofe
n
Dic
lofe
na
c
Sulfa
meth
izo
le
Sulfa
meth
oxa
zo
le
Cla
rith
rom
ycin
Iohe
xo
l
Ca
rba
ma
ze
pin
e
Iom
ep
rol
Ate
nolo
l
Tri
me
tho
prim
Cip
rofloxa
cin
Azithro
mycin
Ven
lafa
xin
e
Dia
triz
oic
acid
Me
top
rolo
l
Sulfa
dia
zin
e
Pro
pra
nolo
l-40-20
020406080
100
120140
M2
M3A
M3B
M4
M5
M1
Rem
oval [%
]
Measured total removal (effluent/influent)
Ibup
rofe
n
Dic
lofe
na
c
Ate
nolo
l
Cla
rith
rom
ycin
Tri
me
tho
prim
Cip
rofloxa
cin
Sulfa
meth
izo
le
Iohe
xo
l
Ca
rba
ma
ze
pin
e
Ven
lafa
xin
e
Azithro
mycin
Dia
triz
oic
acid
Sulfa
meth
oxa
zo
le
Iom
ep
rol
Sulfa
dia
zin
e
Me
top
rolo
l
Pro
pra
nolo
l-20
0
20
40
60
80
100Total removal
Rem
oval [%
]
a)
b)
Figure 2.4. a) An overview of the removal contribution of each reactor; b) an overview of
the entire removal from influent to effluent. (Paper I)

10
Table 2.2. Removal rate constant, ki, of pharmaceuticals in each reactor. (Modified version from Paper I)
Compounds M1 M2 M3A/M3B M4 M5
kM1 [h-1
] r2 kM2 [h
-1] r
2 kM3 [h
-1] r
2 kM4 [h
-1] r
2 kM5 [h
-1] r
2
Acetyl-sulfadiazine 19.2±5.2 ×10⁻²
0.92 11.7±1.3 ×10⁻¹
0.99 9.1±2.1 ×10⁻¹
0.97 21.9±1.9 ×10⁻²
0.99 11.6±1.4 ×10⁻²
0.99
Atenolol 11.8±4.4 ×10⁻³
0.69 48.5±3.1 ×10⁻²
1.00 7.9±1.4 ×10⁻¹
0.98 23.0±2.3 ×10⁻²
0.99 28.4±2.0 ×10⁻²
1.00
Azithromycin 12.5±4.5 ×10⁻²
0.85 5.7±5.1 ×10⁻¹
0.30 6.0±4.3 ×10⁻²
0.53 4.8±1.3 ×10⁻¹
0.96 25.1±2.9 ×10⁻³
0.97
Carbamazepine 6.3±7.1 ×10⁻³
0.17 5.5±17.4 ×10⁻³
0.03 1.4±1.5 ×10⁻²
0.26 2.5±5.5 ×10⁻³
0.06 49.7±9.8 ×10⁻⁴
0.90
Ciprofloxacin 1.3±0.0 ×10⁻¹⁶
0.00 1.5±3.0 ×10⁻²
0.06 8.1±15.9 ×10⁻³
0.08 1.7±0.0 ×10⁻¹⁶
0.00 9.6±7.2 ×10⁻³
0.40
Clarithromycin 11.0±4.2 ×10⁻²
0.85 44.6±5.1 ×10⁻²
0.99 5.3±2.2 ×10⁻¹
0.90 49.8±2.9 ×10⁻²
1.00 71.7±6.2 ×10⁻³
0.99
Diatrizoic acid 2.2±0.0 ×10⁻¹⁶
0.00 2.68±157 ×10-4
0.00 9.5±14.1 ×10⁻³
0.13 10.1±3.7 ×10⁻³
0.73 2.8±2.8 ×10⁻³
0.26
Diclofenac 1.7±0.0 ×10⁻¹⁶
0.00 7.1±0.0 ×10⁻¹⁴
0.00 2.4±1.2 ×10⁻²
0.64 3.4±8.1 ×10⁻³
0.05 1.5±0.0 ×10⁻¹⁶
0.00
Ibuprofen 1.1±1.6 ×10⁻²
0.14 2.6±1.1 ×100
0.97 21.0±8.2 ×10⁻¹
0.95 7.7±1.3 ×10⁻²
0.97 81.5±9.2 ×10⁻²
0.99
Iohexol 1.3±0.0 ×10⁻¹⁶
0.00 22.5±1.9 ×10⁻²
1.00 111±8 ×10⁻²
1.00 67.7±8.7 ×10⁻⁴
0.96 166±4 ×10⁻³
1.00
Iomeprol 1.7±0.0 ×10⁻¹⁶
0.00 18.4±1.6 ×10⁻²
0.99 76.8±8.2 ×10⁻²
1.00 6.0±5.8 ×10⁻³
0.27 11.3±1.1 ×10⁻²
0.99
Iopamidol 2.3±2.3 ×10⁻³
0.21 2.04±168 ×10-4
0.00 2.0±1.5 ×10⁻²
0.43 4.1±2.2 ×10⁻³
0.54 4.5±2.0 ×10⁻³
0.64
Iopromide 4.2±2.2 ×10⁻¹
0.42 4.4±1.1 ×10⁻¹
0.97 14.8±4.2 ×10⁻¹
0.96 9.2±4.5 ×10⁻³
0.61 19.6±4.5 ×10⁻²
0.96
Metoprolol 2.2±0.0 ×10⁻¹⁶
0.00 11.6±3.1 ×10⁻²
0.92 8.9±3.7 ×10⁻²
0.83 2.7±3.7 ×10⁻³
0.16 15.1±2.8 ×10⁻³
0.92
Phenazone 1.8±0.0 ×10⁻¹⁶
0.00 24.9±6.7 ×10⁻²
0.94 5.1±2.6 ×10⁻²
0.67 1.5±0.0 ×10⁻¹⁶
0.00 5.1±1.5 ×10⁻³
0.79
Propranolol 3.7±2.2 ×10⁻²
0.47 2.6±2.3 ×10⁻¹
0.25 3.4±2.9 ×10⁻²
0.36 3.0±1.6 ×10⁻²
0.59 1.4±1.3 ×10⁻²
0.29
Sotalol 1.6±2.2 ×10⁻³
0.12 6.9±3.0 ×10⁻²
0.74 4.3±2.4 ×10⁻²
0.62 1.4±2.0 ×10⁻³
0.14 189±8 ×10⁻⁴
1.00
Sulfadiazine 1.7±0.0 ×10⁻¹⁶
0.00 2.6±1.6 ×10⁻²
0.51 16.6±4.6 ×10⁻²
0.94 1.9±0.0 ×10⁻¹⁶
0.00 34.3±4.5×10⁻²
0.99
Sulfamethizole 2.9±2.4 ×10⁻²
0.29 12.6±4.7 ×10⁻²
0.85 9.7±2.6 ×10⁻¹
0.96 10.0±7.8 ×10⁻³
0.36 69±3 ×10⁻²
1.00
Sulfamethoxazole 7.3±9.5 ×10⁻³
0.15 3.8±2.3 ×10⁻²
0.52 21.0±6.5 ×10⁻²
0.93 17.6±2.8 ×10⁻³
0.94 3.6±1.0 ×10⁻¹
0.94
Trimethoprim 39.8±5.1 ×10⁻²
0.98 2.3±3.2 ×10⁻²
0.14 4.4±1.9 ×10⁻²
0.74 4.7±1.2 ×10⁻²
0.89 19.2±2.0 ×10⁻³
0.97
Venlafaxine 1.7±0.0 ×10⁻¹⁶
0.00 3.2±2.6 ×10⁻²
0.35 2.4±2.4 ×10⁻²
0.29 9.5±2.8 ×10⁻³
0.81 5.0±4.9 ×10⁻³
0.26
2.3 Comparison of rate constants normalised by biomass To evaluate the differences in performance relating to pharmaceutical removal, between the currently staged MBBRs and
other bioreactor treatment studies, the rate constant of pharmaceuticals in each reactor was normalised to the correspond-
ing biomass in the respective reactor, and thus kbio was calculated (Table 2.3). High kbio values, namely the most efficient
biofilm responsible for pharmaceutical removal, were also observed in M3, which was according to the results of rate con-

11
stants of pharmaceuticals obtained from batch experiments and further strengthened the novel strategy that the intermittent
feeding to reactors fully was applicable even at the pilot stage.
Table 2.3. Removal rate constant normalised with biomass, kbio,i, of pharmaceuticals in each reactor. (Modified version from Paper I)
Compounds kbio, M1 [L h-1
g-1
] kbio, M2 [L h-1
g-1
] kbio, M3 [L h-1
g-1
] kbio, M4 [L h-1
g-1
] kbio, M5 [L h-1
g-1
] Literature Ref1 Conditions
Acetyl-sulfadiazine 6.76 × 10⁻²
2.28 × 10⁻¹
2.81 × 10⁻¹
8.94 × 10⁻²
3.48 × 10⁻²
2.79−3.75 × 10⁻²
A NMBBR
Azithromycin 4.40 × 10⁻²
1.11 × 10⁻¹
1.86 × 10⁻²
1.96 × 10⁻¹
7.54 × 10⁻³
≤4.17 × 10⁻³
A NMBBR
Ciprofloxacin 4.68 × 10⁻¹⁷
2.83 × 10⁻³
2.49 × 10⁻³
7.10 × 10⁻¹⁷
2.88 × 10⁻³
7.50−12.1 × 10⁻³
A NMBBR
Diatrizoic acid 7.82 × 10⁻¹⁷
5.22 × 10⁻⁵
2.95 × 10⁻³
4.12 × 10⁻³
8.38 × 10⁻⁴
Diclofenac 6.06 × 10⁻¹⁷
1.38 × 10⁻¹⁴
7.49 × 10⁻³
1.37 × 10⁻³
4.35 × 10⁻¹⁷
≤4.17 × 10⁻³
A DNAS
<1.67 × 10⁻³
B DNAS
4.17 × 10⁻³
C DNAS
Ibuprofen 3.98 × 10⁻³
5.13 × 10⁻¹
6.50 × 10⁻¹
3.16 × 10⁻²
2.45 × 10⁻¹
6.25 × 10⁻²
B DNAS
0.00−6.46 × 10⁻¹
D NMBBR
Iohexol 4.72 × 10⁻¹⁷
4.39 × 10⁻²
3.44 × 10⁻¹
2.76 × 10⁻³
4.98 × 10⁻²
Iomeprol 5.92 × 10⁻¹⁷
3.59 × 10⁻²
2.38 × 10⁻¹
2.44 × 10⁻³
3.39 × 10⁻²
Iopamidol 8.13 × 10⁻⁴
3.98 × 10⁻⁵
6.32 × 10⁻³
1.67 × 10⁻³
1.34 × 10⁻³
Iopromide 1.49 × 10⁻¹
8.58 × 10⁻²
4.58 × 10⁻¹
3.74 × 10⁻³
5.89 × 10⁻²
2.88−3.17 × 10⁻²
A NMBBR
≤4.17 × 10⁻³
A NMBBR
Propranolol 1.30 × 10⁻²
5.01 × 10⁻²
1.04 × 10⁻²
1.23 × 10⁻²
4.29 × 10⁻³
Sotalol 5.60 × 10⁻⁴
1.35 × 10⁻²
1.33 × 10⁻²
5.59 × 10⁻⁴
5.68 × 10⁻³
Sulfadiazine 5.88 × 10⁻¹⁷
4.99 × 10⁻³
5.14 × 10⁻²
7.92 × 10⁻¹⁷
1.03 × 10⁻¹
Sulfamethizole 1.01 × 10⁻²
2.46 × 10⁻²
3.01 × 10⁻¹
4.08 × 10⁻³
2.07 × 10⁻¹
6.25−8.33 × 10⁻³
A NMBBR
Ref1: A=Falås et al., (2013) (rate constants: L h
-1 gTS
-1); B=Suarez et al., (2010) (rate constants: L h
-1 gVSS
-1); C=Plósz et al., (2012) (rate con-
stants: L h-1
gTSS-1
); D=Falås et al., (2012) (rate constants: L h-1
gTS-1
). DNAS: Denitrifying Activated Sludge; NMBBR: Nitrifying MBBR.

12

13

14
3 Pharmaceuticals in municipal effluent,
removed by a laboratory-scale MBBRs
3.1 Influence of humic acid addition on the removal
of pharmaceuticals
3.1.1 Experimental procedures
The characteristics of bacteria from biomass in wastewater have been found
to be related to and affected by the conditions in which they grow (Cydzik-
Kwiatkowska and Zielińska, 2016). Among various wastewater parameters
ensuring living conditions for bacterial growth, the concentration and catego-
ry of the carbon source play a vital role. Mechanisms for the biodegradation
of pharmaceuticals in the presence of organic carbon can be classified in two
ways: co-metabolism and competitive inhibition.
Co-metabolism involves the transformation of a non-growth substrate (i.e.
micropollutants) while a growth substrate (i.e. available carbon source) ex-
ists. Previous studies have found that the biodegradation of 4-chlorophenol,
considered a non-growth substrate, is enhanced when introducing primary
growth substrates, for instance phenol and glucose (Tobajas et al., 2012).
However, for competitive inhibition, although the growth substrate is a pre-
requisite for the degradation of a non-growth substrate, the bacterial enzymes
which are responsible for non-growth substrate biodegradation may interact
with the growth substrate as a kind of competitor, and thus the biodegradation
rate of the non-growth substrate is inhibited and decreases. Joss et al. (2004)
found that differences in the removal rates of oestrogens, between the batch
experiment and the corresponding compartment of full-scale plants, could be
interpreted in terms of the competitive inhibition of oestrogen degradation by
the substrate.
In this study, humic acid (HA), considered a not easily degradable carbon
source, was used to simulate different concentrations of complex carbon
sources in wastewater. A laboratory-scale MBBRs mimicked a polishing step
for WWTP effluent. The experiments were performed in Erlenmeyer flasks
containing spiked pharmaceuticals, MBBR carriers and WWTP effluent, with
or without the addition of HA (blank). A 10 μL pharmaceutical stock solution
was transferred to each flask, which had initial concentrations of pharmaceu-
ticals ranging from 1.2 and 14.6 μg/L. MBBR carriers with attached biofilm
fed by wastewater effluent for three months were placed into each flask, and
15
the filling ratios of the carriers and wastewater volume were constant. Three
differently defined concentrations of HA were applied and thus gave dis-
solved organic carbon in quantities of 4.4, 11, 13 and 30 mgC/L. The Erlen-
meyer flasks were placed on a mechanical shaker (120 rpm) for a period of
two weeks, and samples were taken over time. Details of the methods em-
ployed, common wastewater parameters and pharmaceutical analysis are de-
scribed in paper II.
3.1.2 Influence of humic acid on pharmaceutical degradation
MBBR carriers in each flask had 2.5 g/L of biomass, which was lower than
the values observed from previous studies, where around 3.1 g/L was ob-
tained (Falås et al., 2013). This can be explained by the fact that the carriers
used in this study were fed by wastewater effluent containing very little car-
bon utilised for biofilm growth.
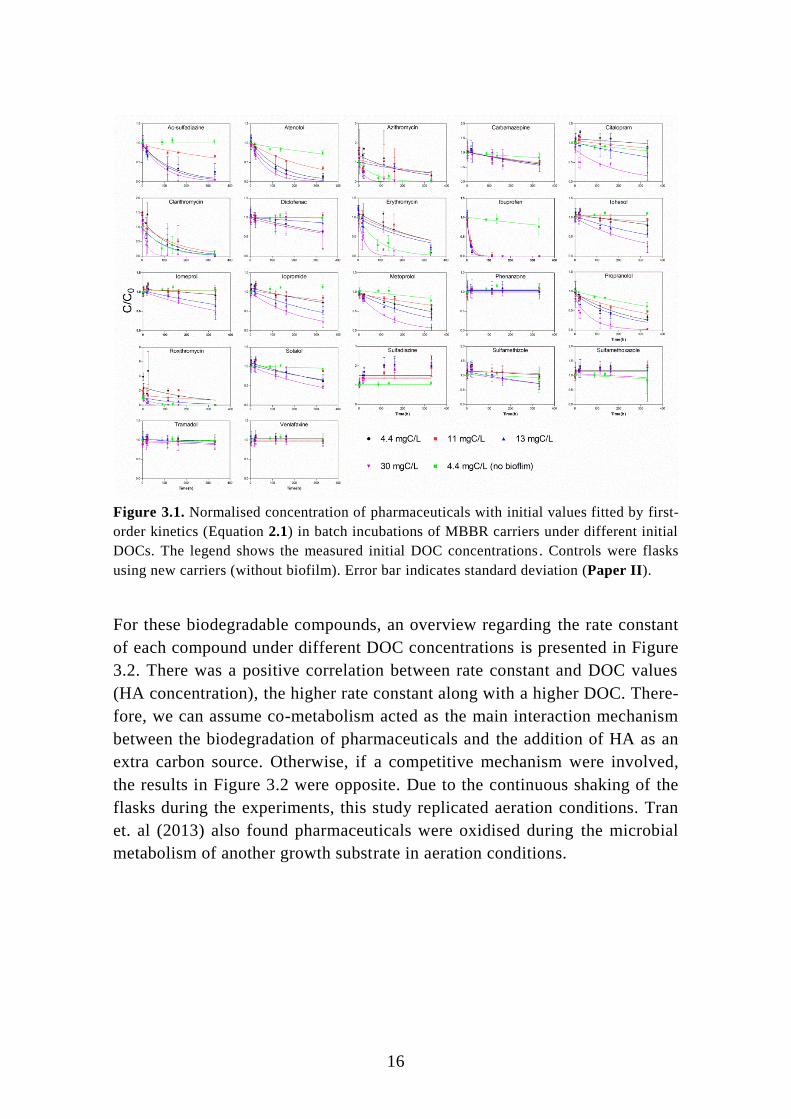
The development of pharmaceutical concentrations with different HA dosag-
es over time was plotted by first-order kinetics (Equation 2.1). All investigat-
ed compounds are presented in Figure 3.1. Thirteen out of the 22 detected
pharmaceuticals were recognised as being biodegradable by biofilm, because
the differences in pharmaceutical concentrations between the controlled ex-
periments (new carriers without biofilm) and the comparative experiments
(with attached biofilm) were clear when increasing DOC by adding HA. Spe-
cifically, there was low or no activity in relation to the removal of pharma-
ceuticals in the control experiment compared to the high extent of pharma-
ceutical removal in the comparative experiments. For the remaining pharma-
ceuticals (nine out of 22), they were considered to belong to the non-
biodegradable group. This definition can be interpreted in two ways. First,
several compounds (phenanzone, sulfadiazine, sulfamethoxazole, tramadol
and venlafaxine) were not removed in either the controlled or the compara-
tive experiments. For the second aspect, other compounds (azithromycin,
clarithromycin, erythromycin, roxithromycin), in relation to the development
of pharmaceutical concentrations, did not differ statistically from the con-
trolled or comparative experiments. Therefore, the 13 biodegradable com-
pounds above, which showed the influence of adding HA on the removal of
pharmaceuticals, were selected and are discussed in the following sections.
16
Figure 3.1. Normalised concentration of pharmaceuticals with initial values fitted by first-
order kinetics (Equation 2.1) in batch incubations of MBBR carriers under different initial
DOCs. The legend shows the measured initial DOC concentrations. Controls were flasks
using new carriers (without biofilm). Error bar indicates standard deviation (Paper II).
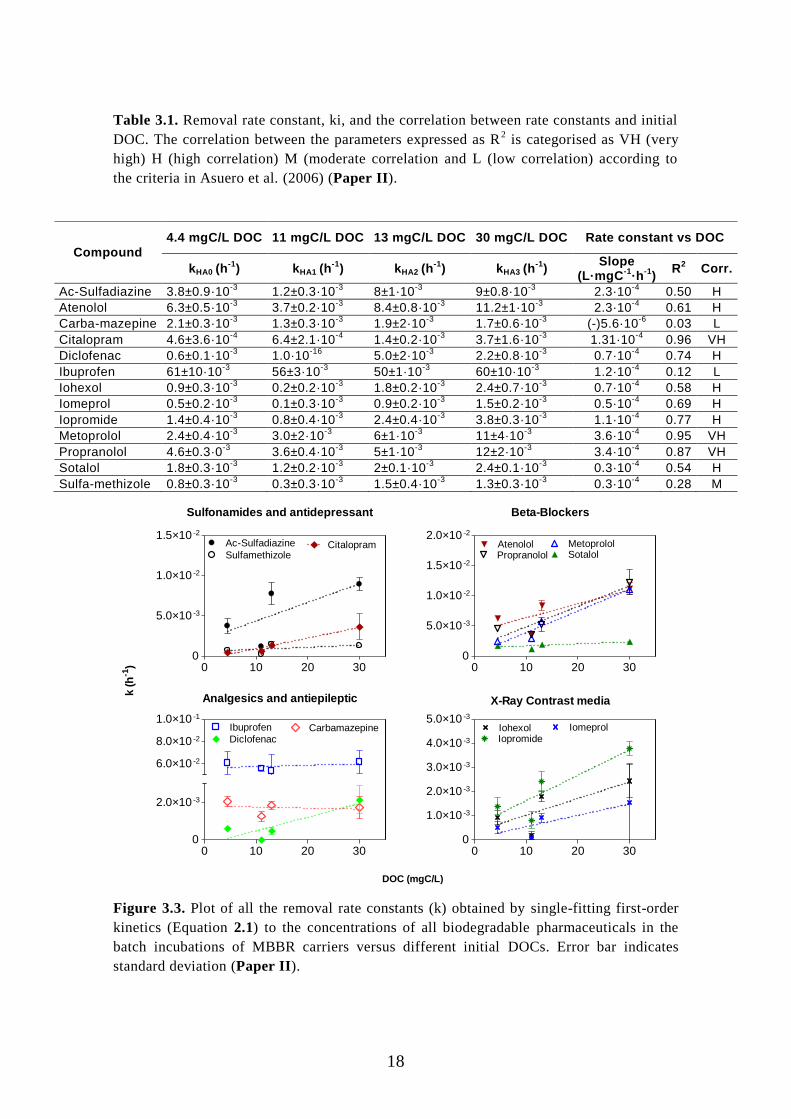
For these biodegradable compounds, an overview regarding the rate constant
of each compound under different DOC concentrations is presented in Figure
3.2. There was a positive correlation between rate constant and DOC values
(HA concentration), the higher rate constant along with a higher DOC. There-
fore, we can assume co-metabolism acted as the main interaction mechanism
between the biodegradation of pharmaceuticals and the addition of HA as an
extra carbon source. Otherwise, if a competitive mechanism were involved,
the results in Figure 3.2 were opposite. Due to the continuous shaking of the
flasks during the experiments, this study replicated aeration conditions. Tran
et. al (2013) also found pharmaceuticals were oxidised during the microbial
metabolism of another growth substrate in aeration conditions.

17
Figure 3.2. Rate constants (k) of pharmaceuticals in the batch incubations of MBBR carr i-
ers under different initial DOCs. Control stands for flasks containing carriers without bio-
film. Control flasks contained also 4.4 mgC/L of DOC. N.A. indicates that the concentra-
tion curve did not fit to Equation 2.1. Error bar indicates standard deviation (Paper II).
3.1.3 Correlation of total concentration of organic matter and rate
constant
The statistical results for the correlation of the rate constants of 13 biode-
gradable pharmaceuticals, and the initial DOC values, are presented in Table
3.1, based on the first-order kinetics fitting results taken from Figure 3.2. Ten
out of the 13 compounds (except carbamazepine, ibuprofen and sulfame-
thizole) had high or very high R2, indicating that the addition of HA had
stimulated the pharmaceutical biodegradation. Calculating the difference of
rate constants in high DOC (30 mgC/L) and low DOC (4.4 mgC/L), normal-
ised with the relevant DOC difference, the average stimulation for all biode-
gradable pharmaceuticals was 7.4% per mgC/L, and the 25%, 50% and 75%
percentiles were 2.8, 6.4 and 8.7% per mgC/L, respectively (Figure 3.3). Be-
sides, the values of the rate constant in high DOC normally were two or three
times higher than the values obtained from the controlled experiment (with-
out biofilm).
18
Table 3.1. Removal rate constant, ki, and the correlation between rate constants and initial
DOC. The correlation between the parameters expressed as R2 is categorised as VH (very
high) H (high correlation) M (moderate correlation and L (low correlation) according to
the criteria in Asuero et al. (2006) (Paper II).
Figure 3.3. Plot of all the removal rate constants (k) obtained by single-fitting first-order
kinetics (Equation 2.1) to the concentrations of all biodegradable pharmaceuticals in the
batch incubations of MBBR carriers versus different initial DOCs. Error bar indicates
standard deviation (Paper II).
Sulfonamides and antidepressant
0 10 20 300
5.0×10 -3
1.0×10 -2
1.5×10 -2
Ac-Sulfadiazine
SulfamethizoleCitalopram
Beta-Blockers
0 10 20 300
5.0×10 -3
1.0×10 -2
1.5×10 -2
2.0×10 -2
PropranololAtenolol Metoprolol
Sotalol
Analgesics and antiepileptic
0 10 20 300
2.0×10 -3
6.0×10 -2
8.0×10 -2
1.0×10 -1
CarbamazepineDiclofenac
Ibuprofen
X-Ray Contrast media
0 10 20 300
1.0×10 -3
2.0×10 -3
3.0×10 -3
4.0×10 -3
5.0×10 -3
IopromideIohexol Iomeprol
DOC (mgC/L)
k (
h-1
)
Compound
4.4 mgC/L DOC 11 mgC/L DOC 13 mgC/L DOC 30 mgC/L DOC Rate constant vs DOC
kHA0 (h-1
) kHA1 (h-1
) kHA2 (h-1
) kHA3 (h-1
) Slope
(L·mgC-1
·h-1
) R
2 Corr.
Ac-Sulfadiazine 3.8±0.9·10-3
1.2±0.3·10-3
8±1·10-3
9±0.8·10-3
2.3·10-4
0.50 H
Atenolol 6.3±0.5·10-3
3.7±0.2·10-3
8.4±0.8·10-3
11.2±1·10-3
2.3·10-4
0.61 H
Carba-mazepine 2.1±0.3·10-3
1.3±0.3·10-3
1.9±2·10-3
1.7±0.6·10-3
(-)5.6·10-6
0.03 L
Citalopram 4.6±3.6·10-4
6.4±2.1·10-4
1.4±0.2·10-3
3.7±1.6·10-3
1.31·10-4
0.96 VH
Diclofenac 0.6±0.1·10-3
1.0·10-16
5.0±2·10-3
2.2±0.8·10-3
0.7·10-4
0.74 H
Ibuprofen 61±10·10-3
56±3·10-3
50±1·10-3
60±10·10-3
1.2·10-4
0.12 L
Iohexol 0.9±0.3·10-3
0.2±0.2·10-3
1.8±0.2·10-3
2.4±0.7·10-3
0.7·10-4
0.58 H
Iomeprol 0.5±0.2·10-3
0.1±0.3·10-3
0.9±0.2·10-3
1.5±0.2·10-3
0.5·10-4
0.69 H
Iopromide 1.4±0.4·10-3
0.8±0.4·10-3
2.4±0.4·10-3
3.8±0.3·10-3
1.1·10-4
0.77 H
Metoprolol 2.4±0.4·10-3
3.0±2·10-3
6±1·10-3
11±4·10-3
3.6·10-4
0.95 VH
Propranolol 4.6±0.3·0-3
3.6±0.4·10-3
5±1·10-3
12±2·10-3
3.4·10-4
0.87 VH
Sotalol 1.8±0.3·10-3
1.2±0.2·10-3
2±0.1·10-3
2.4±0.1·10-3
0.3·10-4
0.54 H
Sulfa-methizole 0.8±0.3·10-3
0.3±0.3·10-3
1.5±0.4·10-3
1.3±0.3·10-3
0.3·10-4
0.28 M

19
3.2 Removal of pharmaceuticals by an
intermittently fed polishing MBBRs
3.2.1 MBBRs system and experimental methods
Since conventional WWTPS (i.e. activated sludge) are not able to remove all
micropollutants from wastewater, some micropollutants, such as pharmaceu-
ticals, are well-known as persistent compounds that remain detectable in
WWTP effluent (Verlicchi et al., 2012a, 2012b). Therefore, polishing treat-
ments for WWTP effluent need be carried out to upgrade and improve the
quality of effluent, in order to achieve discharge standards. In previous stud-
ies, MBBRs have been used to demonstrate that most pharmaceuticals can be
degraded to some extent and with better removal efficiency compared to acti-
vated sludge (Escolà Casas et al., 2015a). However, for refractor compounds
(i.e. diclofenac), their remove rates are still low and result in poor water qual-
ity. For diclofenac, as one of three crucial compounds in the first watch list
authority set up by the European Commission (Carvalho et al., 2015), its deg-
radation rate when treated with current wastewater purification processes is
not optimistic. Thus, it is an urgent undertaking to find a solution to this is-
sue.
A previous MBBR study was conducted by three pilot-scale static-staged
MBBRs fed by raw hospital wastewater (Escolà Casas et al., 2015a). Hence,
the first reactor in this treatment train had more nutrients for biofilm growth
compared to the two following reactors. The last reactor particularly had to
utilise hardly degradable nutrients from the second reactor’s effluent, to sup-
port biofilm activity, where mostly the thinnest biofilm was observed in the
last reactor as well as the thickness of biofilm or the amount of biomass de-
cay from the first reactor to the last reactor. Based on kbio of diclofenac in the
last reactor from a former MBBR study, although the removal degree of di-
clofenac was low, this reactor degrader was capable of degrading diclofenac
did exist, and the reason for ineffective removal could be explained by a lack
of biomass. Then, to improve the overall removal of diclofenac by staged
MBBRs, the removal control in the last reactor was very important, since this
reactor acted as the last line of defence against pharmaceuticals before dis-
charging the effluent. To elevate the amount of degrader in the last reactor,
the primary task is to achieve an amount of biomass sufficient enough to
eventually benefit degrader growth.

20
Thus, in this study, MBBRs were used for polishing wastewater effluent from
a conventional WWTP in Denmark and to overcome inactive biomass genera-
tion in the last reactor, due to low substrate concentration. For the first time,
we carried out a programme of intermittent feeding to MBBR reactors with
raw wastewater from a primary settling tank, and WWTP effluent. The de-
scription for the above feeding strategy is illustrated in Figure 3.4. Essential-
ly, three identical 3 L reactors with 50% filling ratio of carriers were used. A
two-stage MBBR treatment train (reactors 1 and 2 in positions A and B; Fig-
ure 3.4a) was fed with CAS effluent and performed as a polishing reactor.
Another MBBR treatment train with a single reactor (reactor 3 in position C)
was fed with settled raw wastewater, which we used to stimulate biomass
generation as a regenerated reactor. After two days of operation, the feeding
of reactors in these two MBBR treatment trains was changed, and thus reactor
3 was placed in position A and fed with CAS effluent, reactor 1 was then
moved to Position B and reactor 2 was switched to position C to operate as a
regeneration reactor (Figure 3.4b). Following a further two days, the feeding
programme was changed again, as outlined above. This was followed by an-
other three days of operation before changing the next feeding regime so that
the reactors returned back to their initial positions, as presented in Figure
3.4a. This feeding strategy was conducted three times per week.
Figure 3.4. Configuration of the MBBR system: (a) Operation of a two-stage MBBR
treatment train polishing effluent water from the Viby WWTP (positions A and B), while
the growth of biofilm was stimulated in another MBBR treatment train with a single reac-
21
tor (position C). (b) The change of feeding to two MBBR treatment trains was conducted
three times per week. (Paper III)
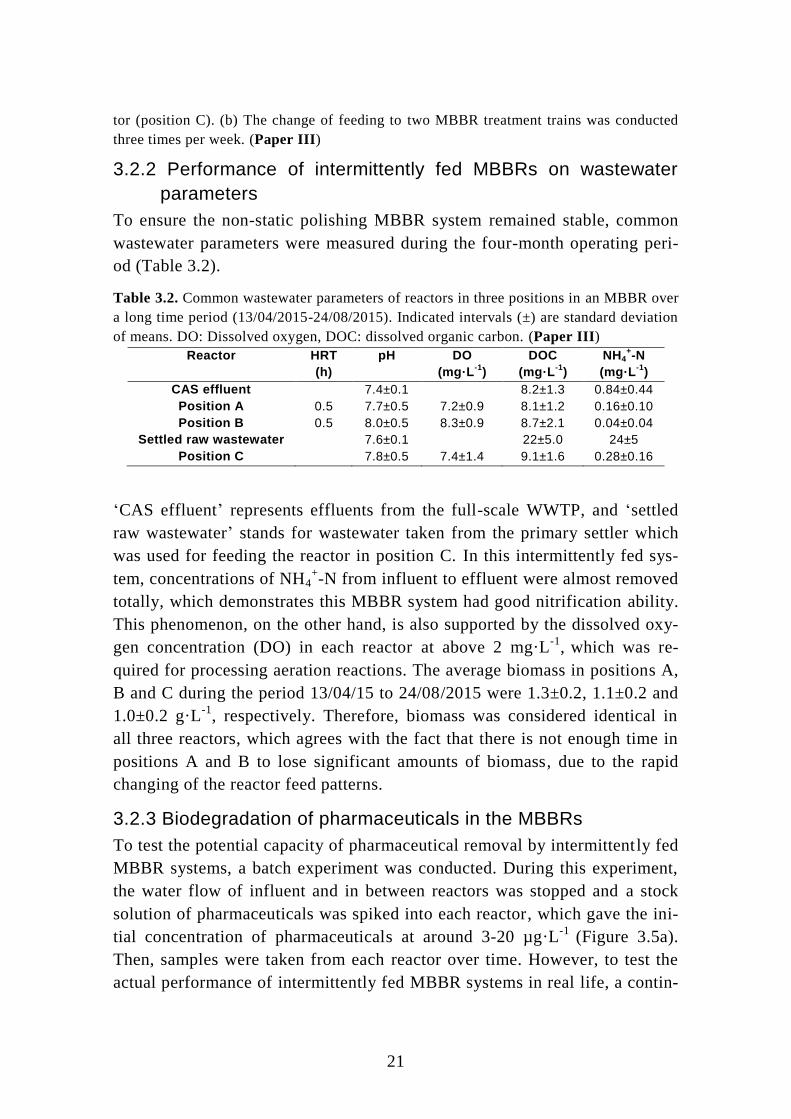
3.2.2 Performance of intermittently fed MBBRs on wastewater
parameters
To ensure the non-static polishing MBBR system remained stable, common
wastewater parameters were measured during the four-month operating peri-
od (Table 3.2).
Table 3.2. Common wastewater parameters of reactors in three positions in an MBBR over
a long time period (13/04/2015-24/08/2015). Indicated intervals (±) are standard deviation
of means. DO: Dissolved oxygen, DOC: dissolved organic carbon. (Paper III)
Reactor HRT
(h)
pH DO
(mg·L-1
)
DOC
(mg·L-1
)
NH4+-N
(mg·L-1
)
CAS effluent 7.4±0.1 8.2±1.3 0.84±0.44
Position A 0.5 7.7±0.5 7.2±0.9 8.1±1.2 0.16±0.10
Position B 0.5 8.0±0.5 8.3±0.9 8.7±2.1 0.04±0.04
Settled raw wastewater 7.6±0.1 22±5.0 24±5
Position C 7.8±0.5 7.4±1.4 9.1±1.6 0.28±0.16
‘CAS effluent’ represents effluents from the full-scale WWTP, and ‘settled
raw wastewater’ stands for wastewater taken from the primary settler which
was used for feeding the reactor in position C. In this intermittently fed sys-
tem, concentrations of NH4+-N from influent to effluent were almost removed
totally, which demonstrates this MBBR system had good nitrification ability.
This phenomenon, on the other hand, is also supported by the dissolved oxy-
gen concentration (DO) in each reactor at above 2 mg·L-1
, which was re-
quired for processing aeration reactions. The average biomass in positions A,
B and C during the period 13/04/15 to 24/08/2015 were 1.3±0.2, 1.1±0.2 and
1.0±0.2 g·L-1
, respectively. Therefore, biomass was considered identical in
all three reactors, which agrees with the fact that there is not enough time in
positions A and B to lose significant amounts of biomass, due to the rapid
changing of the reactor feed patterns.
3.2.3 Biodegradation of pharmaceuticals in the MBBRs
To test the potential capacity of pharmaceutical removal by intermittently fed
MBBR systems, a batch experiment was conducted. During this experiment,
the water flow of influent and in between reactors was stopped and a stock
solution of pharmaceuticals was spiked into each reactor, which gave the ini-
tial concentration of pharmaceuticals at around 3-20 µg·L-1
(Figure 3.5a).
Then, samples were taken from each reactor over time. However, to test the
actual performance of intermittently fed MBBR systems in real life, a contin-

22
uous flow experiment was conducted. In this experiment, the water flow was
allowed to travel through the systems without stopping or spiking (Figure
3.5b). Samples were taken from the influent and reactor effluents according
to hydraulic retention time (HRT).
Figure 3.5. Configuration of the staged MBBR during the batch and continuous flow ex-
periments: (a) the batch experiments were carried out to measure the biofilms’ capacity to
degrade pharmaceuticals, and the flow was discontinued while concentrations of spiked
pharmaceuticals were measured over time. (b) During the continuous flow experiment.
(Paper III)
For the batch experiment, pharmaceutical concentrations over time were plot-
ted and fitted with first-order kinetics and are presented in Figure 3.6. Apply-
ing first-order kinetics to describe the development of pharmaceutical con-
centration was feasible, since most of the pharmaceuticals were able to obtain
good R2
values (>0.96), except for propranolol, tramadol and venlafaxine,
and similar findings were also observed in a previous study (Escolà Casas et
al., 2015b). In Figure 3.6, all of the investigated pharmaceuticals, except car-
bamazepine, defined as a recalcitrantly biodegradable compound (Joss et al.,
2006), demonstrated the potential to be biodegradable to some degree. In
terms of diclofenac, its half-life was around 2.1 h, and within 12 h it could be
removed entirely, which was faster than any biological treatment processes
examined so far.

23
Acetyl-sulfadiazine is a conjugation product formed through the human me-
tabolism of sulfadiazine; however, rapid de-conjugation usually occurs
through relevant microorganisms in wastewater, which eventually transfer
back to sulfadiazine again. Therefore, in this study, in the first five hours of
reaction, the concentration of sulfadiazine increased due to the contribution
of the de-conjugation of ac-sulfadiazine, and so the concentration of ac-
sulfadiazine decreased and moved gradually closer to zero within the first
five hours. After five hours, sulfadiazine concentration started to decrease
until the last sampling time, while ac-sulfadiazine was barely detected and
therefore no longer contributed. Kovalova et al. (2012) also found the similar
reactions for other compounds in the sulphonamides group.
Figure 3.6. First-order reaction rate fitting to concentrations of pharmaceuticals (except
sulfadiazine) in batch experiments (reactor in position A, fed by CAS effluent, and then
effluent from position A flows into the reactor in position B. However, the reactor in pos i-
tion C is fed by settled raw wastewater. Before starting the spiking experiment, the flow of
each reactor was stopped). The dashed horizontal line stands for the limit of quant ification
(LOQ), as derived from the lower of two multiple reaction monitoring (MRM) signals.
(Paper III)
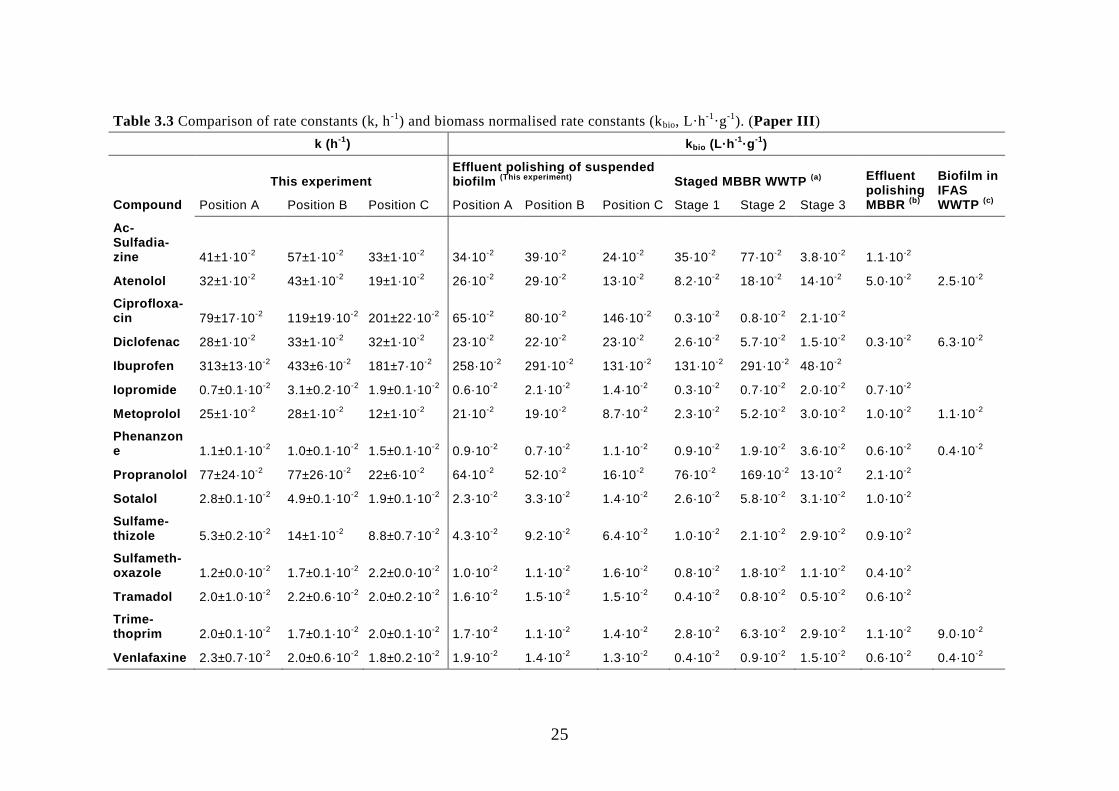
In Table 3.3, the rate constant (k) and kbio of pharmaceuticals in this study are
compared to three similar MBBR studies. For the kbio of intermittently fed

24
reactors in this study, eight out of 15 pharmaceuticals (i.e. atenolol, ciprof-
loxacin, diclofenac, iopromide, metoprolol, sulfamethizole, tramadol and
venlafaxine) for reactors in positions A and B increased in comparison to the
static staged reactors (Escolà Casas et al., 2015a, 2015b). In terms of diclo-
fenac, kbio in this study was ten times higher or even more than its values ob-
tained from previous researches. Thus, the amount of degrader response to
degrade diclofenac was promoted through the novel intermittent feeding con-
cept.
25
Table 3.3 Comparison of rate constants (k, h-1
) and biomass normalised rate constants (kbio, L·h-1
·g-1
). (Paper III)
k (h-1
) kbio (L·h-1
·g-1
)
Compound
This experiment Effluent polishing of suspended biofilm
(This experiment) Staged MBBR WWTP
(a) Effluent
polishing MBBR
(b)
Biofilm in IFAS WWTP
(c) Position A Position B Position C Position A Position B Position C Stage 1 Stage 2 Stage 3
Ac-Sulfadia-zine 41±1·10
-2 57±1·10
-2 33±1·10
-2 34·10
-2 39·10
-2 24·10
-2 35·10
-2 77·10
-2 3.8·10
-2 1.1·10
-2
Atenolol 32±1·10-2
43±1·10-2
19±1·10-2
26·10-2
29·10-2
13·10-2
8.2·10-2
18·10-2
14·10-2
5.0·10-2
2.5·10-2
Ciprofloxa-cin 79±17·10
-2 119±19·10
-2 201±22·10
-2 65·10
-2 80·10
-2 146·10
-2 0.3·10
-2 0.8·10
-2 2.1·10
-2
Diclofenac 28±1·10-2
33±1·10-2
32±1·10-2
23·10-2
22·10-2
23·10-2
2.6·10-2
5.7·10-2
1.5·10-2
0.3·10-2
6.3·10-2
Ibuprofen 313±13·10-2
433±6·10-2
181±7·10-2
258·10-2
291·10-2
131·10-2
131·10-2
291·10-2
48·10-2
Iopromide 0.7±0.1·10-2
3.1±0.2·10-2
1.9±0.1·10-2
0.6·10-2
2.1·10-2
1.4·10-2
0.3·10-2
0.7·10-2
2.0·10-2
0.7·10-2
Metoprolol 25±1·10-2
28±1·10-2
12±1·10-2
21·10-2
19·10-2
8.7·10-2
2.3·10-2
5.2·10-2
3.0·10-2
1.0·10-2
1.1·10-2
Phenanzone 1.1±0.1·10
-2 1.0±0.1·10
-2 1.5±0.1·10
-2 0.9·10
-2 0.7·10
-2 1.1·10
-2 0.9·10
-2 1.9·10
-2 3.6·10
-2 0.6·10
-2 0.4·10
-2
Propranolol 77±24·10-2
77±26·10-2
22±6·10-2
64·10-2
52·10-2
16·10-2
76·10-2
169·10-2
13·10-2
2.1·10-2
Sotalol 2.8±0.1·10-2
4.9±0.1·10-2
1.9±0.1·10-2
2.3·10-2
3.3·10-2
1.4·10-2
2.6·10-2
5.8·10-2
3.1·10-2
1.0·10-2
Sulfame-thizole 5.3±0.2·10
-2 14±1·10
-2 8.8±0.7·10
-2 4.3·10
-2 9.2·10
-2 6.4·10
-2 1.0·10
-2 2.1·10
-2 2.9·10
-2 0.9·10
-2
Sulfameth-oxazole 1.2±0.0·10
-2 1.7±0.1·10
-2 2.2±0.0·10
-2 1.0·10
-2 1.1·10
-2 1.6·10
-2 0.8·10
-2 1.8·10
-2 1.1·10
-2 0.4·10
-2
Tramadol 2.0±1.0·10-2
2.2±0.6·10-2
2.0±0.2·10-2
1.6·10-2
1.5·10-2
1.5·10-2
0.4·10-2
0.8·10-2
0.5·10-2
0.6·10-2
Trime-thoprim 2.0±0.1·10
-2 1.7±0.1·10
-2 2.0±0.1·10
-2 1.7·10
-2 1.1·10
-2 1.4·10
-2 2.8·10
-2 6.3·10
-2 2.9·10
-2 1.1·10
-2 9.0·10
-2
Venlafaxine 2.3±0.7·10-2
2.0±0.6·10-2
1.8±0.2·10-2
1.9·10-2
1.4·10-2
1.3·10-2
0.4·10-2
0.9·10-2
1.5·10-2
0.6·10-2
0.4·10-2

26
(a): a three-stage MBBR system (reactors 1, 2 and 3) fed by wastewater from the oncology
section of Aarhus University Hospital (Escolà Casas et al., 2015a).
(b): one-stage MBBR (reactor H4) which was a polishing process after treatment with act i-
vated sludge combined with MBBR (Hybas) (also fed by wastewater from the oncology
section of Århus University Hospital) (Escolà Casas et al., 2015b).
(c): One-stage IFAS (integrated fixed-film activated sludge, reactor M) stands for a 10 L
reactor filled with wastewater and carriers from a domestic WWTP in Switzerland (Falås et
al., 2013).
Additionally, similar results can also be found for sulfamethizole (an antibi-
otic). The kbio in positions A and B, especially position B, was significantly
higher than in the three reactors from the statically staged MBBR (Escolà
Casas et al., 2015a).
For continuous flow experiments, natural concentrations of pharmaceuticals
without spiking were analysed in influent and the reactors’ effluent (Figure
3.7). In reality, diclofenac concentration decreased from influent to effluent,
which in turn confirmed the potential biodegradability seen in the batch ex-
periment. Furthermore, the removal of pharmaceuticals increased in line with
an increase in HRT; for instance, atenolol was totally degraded when HRT
increased from 1 h to 4 h, and the removal of metoprolol increased from 7%
to 69%, while the removal of propranolol increased from 3% to 43%. For sul-
famethizole, removal changed from negative to 48 %.
Figure 3.7. Concentrations of selected pharmaceuticals in continuous experiments with
different HRTs. The dashed horizontal lines indicate the LOQ for each pharmaceutical ,
derived from two multiple reaction monitoring (MRM) transitions. (Paper III)

27
28
4 Pharmaceuticals in the effluent of a
pilot-scale staged MBBRs treated by
ozone and followed with a polishing
MBBR
4.1 MBBRs/ozone system and experimental
methods Although MBBRs are better at removing pharmaceuticals compared to CAS,
and thus may be considered as an alternative for conventional treatment pro-
cesses applied in most WWTPs, some hardly biodegradable pharmaceuticals
were still be detected in MBBRs effluents, as mentioned in Chapter 2, such as
X-ray contrast medias, venlafaxine, carbamazepine and so on.
To address this issue, ozone, known with matured implement experiences to
balance the sufficient removal of pharmaceuticals and operation expenses, is
a feasible technology, using as a polishing method to enhance pharmaceutical
removal (Hansen et al., 2016; Ternes et al., 2003). The oxidation of pharma-
ceuticals by ozonation results in two vital paths: a direct reaction with certain
functional groups of organic molecules (4.1) and an indirect/non-selective
reaction with strong oxidant hydroxyl radicals (4.2) (Dantas et al., 2007).
OX3 ROR (4.1)
OXROHR (4.2)
In this study, pilot-scale ozone setups, mainly consisting of an ozone genera-
tor and an ozone reaction column, were applied for polishing effluents from
two pilot-scale staged MBBRs receiving either raw hospital wastewater (Ske-
jby, Denmark) or municipal wastewater (Herning, Denmark), as described in
Chapter 2 as well. The HRT for the ozone setup connected with the staged
MBBR treating hospital wastewater was 13.1 min, based on a 1 L/min flow
rate of ozone influent and a 13 L column volume. A schematic diagram of the
treatment configuration can be found in Figure 2.1(right).
However, the HRT for the ozone setup connected with the staged MBBR
treating municipal wastewater was 9 min, according to a 2 L/min influent
flow rate and an 18 L reactor. Furthermore, in order to purify and reduce fur-
ther the effluent toxicity generated from ozone by-products, a pilot-scale

29
MBBR with a HRT of 14 min was applied for polishing ozonation effluent. A
description of the treatment configuration is illustrated in Figure 2.2 (right).
For performance tests of both of the polishing methods above, first, to opti-
mise the dosage of ozone to obtain high pharmaceutical removal efficiency,
different doses were applied into the reaction column. Furthermore, to verify
pharmaceutical removal by ozonation, the same MBBR effluents were taken
back to the laboratory and ozonation experiments carried out in a laboratory-
scale ozone setup with similar ozone doses. Meanwhile, the fluorescence in-
tensity of both ozonated wastewaters in the pilot and laboratory tests was
measured under six selected wavelengths. Second, toxicity development in
the wastewater in line with the treatment configurations in the pilot were
measured, and a toxicity test of MBBRs effluents treated with laboratory-
scale ozonation followed by a polishing MBBR were also conducted.
To determine the ozone dosage that achieved 90% removal of each pharma-
ceutical in the effluent, the correlation of degradation rate of each pharma-
ceutical and ozone dosage was fitted by equation (4.3).
)
DDO
DO(
0
3
3
10C
C
(4.3)
The remaining concentration of pharmaceutical (C) is related to its initial
concentration (C0) after a relevant reaction with a specific delivered ozone
dose (DO3) with a decadic dose of ozone (DDO3), as the compound-specific
constant describing the required ozone dosage needed to remove 90% of the
respective pharmaceutical. This was based on the fact that that the decay of
ozone is determined by the effluent matrix and is independent of pharmaceu-
tical concentration.
4.2 Removal of pharmaceuticals Normalised concentrations of pharmaceuticals with different doses of ozone
were plotted according to the above equation (4.3). Twenty-two pharmaceuti-
cals were detected in the effluent of the pre-treating MBBRs for hospital
wastewater without spiking, while 15 out of 22 compounds were above LOQs
(Figure 4.1). However, for effluents from the pre-treating MBBRs for munic-
ipal wastewater, 24 pharmaceuticals were detected, while 21 out of 24 com-
pounds were above relevant LOQs (Figure 4.2).
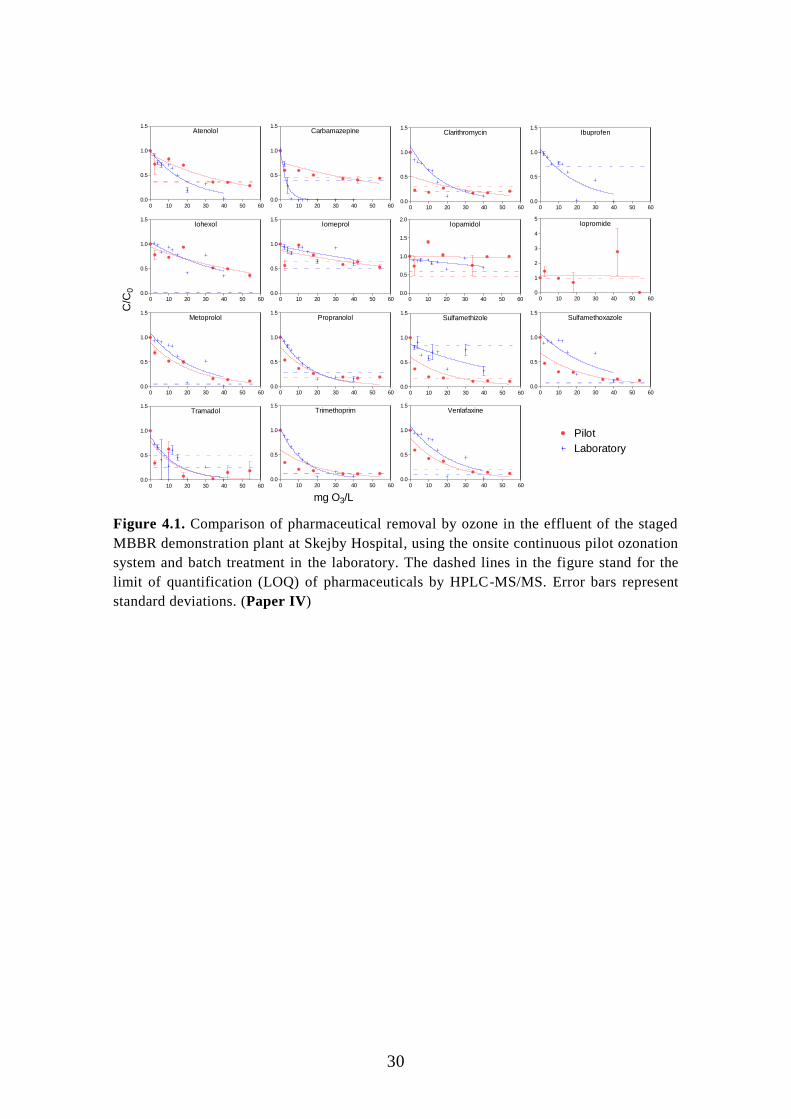
30
Atenolol
0 10 20 30 40 50 600.0
0.5
1.0
1.5Carbamazepine
0 10 20 30 40 50 600.0
0.5
1.0
1.5
Clarithromycin
0 10 20 30 40 50 600.0
0.5
1.0
1.5Ibuprofen
0 10 20 30 40 50 600.0
0.5
1.0
1.5
Iohexol
0 10 20 30 40 50 600.0
0.5
1.0
1.5Iomeprol
0 10 20 30 40 50 600.0
0.5
1.0
1.5Iopamidol
0 10 20 30 40 50 600.0
0.5
1.0
1.5
2.0Iopromide
0 10 20 30 40 50 600
1
2
3
4
5
Metoprolol
0 10 20 30 40 50 600.0
0.5
1.0
1.5Propranolol
0 10 20 30 40 50 600.0
0.5
1.0
1.5Sulfamethizole
0 10 20 30 40 50 600.0
0.5
1.0
1.5Sulfamethoxazole
0 10 20 30 40 50 600.0
0.5
1.0
1.5
Tramadol
0 10 20 30 40 50 600.0
0.5
1.0
1.5Trimethoprim
0 10 20 30 40 50 600.0
0.5
1.0
1.5Venlafaxine
0 10 20 30 40 50 600.0
0.5
1.0
1.5
C/C
0
mg O3/L
Pilot
Laboratory
Figure 4.1. Comparison of pharmaceutical removal by ozone in the effluent of the staged
MBBR demonstration plant at Skejby Hospital, using the onsite continuous pilot ozonation
system and batch treatment in the laboratory. The dashed lines in the figure stand for the
limit of quantification (LOQ) of pharmaceuticals by HPLC-MS/MS. Error bars represent
standard deviations. (Paper IV)
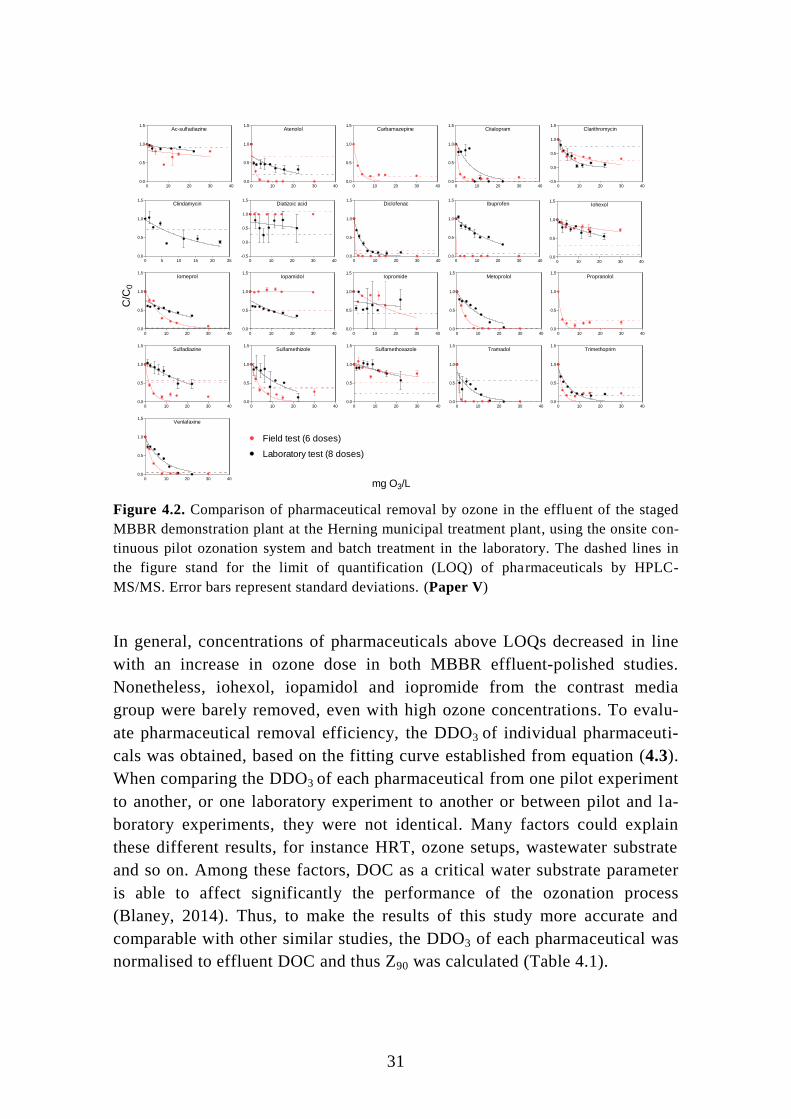
31
Ac-sulfadiazine
0 10 20 30 400.0
0.5
1.0
1.5Atenolol
0 10 20 30 400.0
0.5
1.0
1.5Carbamazepine
0 10 20 30 400.0
0.5
1.0
1.5Citalopram
0 10 20 30 400.0
0.5
1.0
1.5Clarithromycin
0 10 20 30 40-0.5
0.0
0.5
1.0
1.5
Clindamycin
0 5 10 15 20 250.0
0.5
1.0
1.5Diatizoic acid
0 10 20 30 40-0.5
0.0
0.5
1.0
1.5Diclofenac
0 10 20 30 400.0
0.5
1.0
1.5Ibuprofen
0 10 20 30 400.0
0.5
1.0
1.5Iohexol
0 10 20 30 400.0
0.5
1.0
1.5
Iomeprol
0 10 20 30 400.0
0.5
1.0
1.5Iopamidol
0 10 20 30 400.0
0.5
1.0
1.5Iopromide
0 10 20 30 400.0
0.5
1.0
1.5Metoprolol
0 10 20 30 400.0
0.5
1.0
1.5Propranolol
0 10 20 30 400.0
0.5
1.0
1.5
Sulfadiazine
0 10 20 30 400.0
0.5
1.0
1.5Sulfamethizole
0 10 20 30 400.0
0.5
1.0
1.5Sulfamethoxazole
0 10 20 30 400.0
0.5
1.0
1.5Tramadol
0 10 20 30 400.0
0.5
1.0
1.5Trimethoprim
0 10 20 30 400.0
0.5
1.0
1.5
Venlafaxine
0 10 20 30 400.0
0.5
1.0
1.5
C/C
0
mg O3/L
Laboratory test (8 doses)
Field test (6 doses)
Figure 4.2. Comparison of pharmaceutical removal by ozone in the effluent of the staged
MBBR demonstration plant at the Herning municipal treatment plant, using the onsite con-
tinuous pilot ozonation system and batch treatment in the laboratory. The dashed lines in
the figure stand for the limit of quantification (LOQ) of pharmaceuticals by HPLC-
MS/MS. Error bars represent standard deviations. (Paper V)
In general, concentrations of pharmaceuticals above LOQs decreased in line
with an increase in ozone dose in both MBBR effluent-polished studies.
Nonetheless, iohexol, iopamidol and iopromide from the contrast media
group were barely removed, even with high ozone concentrations. To evalu-
ate pharmaceutical removal efficiency, the DDO3 of individual pharmaceuti-
cals was obtained, based on the fitting curve established from equation (4.3).
When comparing the DDO3 of each pharmaceutical from one pilot experiment
to another, or one laboratory experiment to another or between pilot and la-
boratory experiments, they were not identical. Many factors could explain
these different results, for instance HRT, ozone setups, wastewater substrate
and so on. Among these factors, DOC as a critical water substrate parameter
is able to affect significantly the performance of the ozonation process
(Blaney, 2014). Thus, to make the results of this study more accurate and
comparable with other similar studies, the DDO3 of each pharmaceutical was
normalised to effluent DOC and thus Z90 was calculated (Table 4.1).

32
Table 4.1. Ozone dosage for 90% removal of pharmaceuticals in the pilot and laboratory and the normalisation of ozone dosage to the relevant
DOC condition (Z90=DDO3/DOC, DOC of this study is 40 mg O3/L). Indicated intervals represent one standard deviation. (Paper IV)
Pilot Laboratory Z90
DDO3 R2 DDO3 R
2 Pilot Laboratory A B
Ac-sulfadiazine <LOQa <LOQ
Atenolol 103±19 0.89 46±7 0.91 2.6±0.5 1.1±0.2
1.1
characterizeAzithromycin <LOQ <LOQ <LOQ <LOQ
Carbamazepine 147±53c 0.63 7.4±1.1 0.96 3.7±1.3 0.18±0.03 0.61 0.58
Ciprofloxacin <LOQ <LOQ <LOQ <LOQ
Clarithromycin <LOQ <LOQ 39±6 0.92
0.98±0.14
0.75
Diatrizoic acid <LOQ <LOQ <LOQ <LOQ
4.7
Ibuprofen <LOQ <LOQ 46±8 0.78
1.1±0.2 1.61 1.3
Iohexol 151±42 0.77 110±30 0.69 3.8±1.0 2.7±0.7
1.8
Iomeprol No fitb 0.41 No fit 0.44
1.9
Iopamidol No fit 0.01 No fit 0.34
2.6
Iopromide <LOQ <LOQ
Metoprolol 52±6 0.94 54±10 0.75 1.3±0.2 1.3±0.2 1 0.89
Phenazone <LOQ <LOQ <LOQ <LOQ
0.77
Propranolol 42±9 0.79 35±2 0.96 1.0±0.2 0.88±0.06
0.6
Sotalol <LOQ <LOQ <LOQ <LOQ
Sulfadiazine <LOQ <LOQ
0.5
Sulfamethizole 50±12 0.862 <LOQ <LOQ 1.2±0.03
0.77 0.52
Sulfamethoxazole 56±9 0.74 68±14 0.66 1.4±0.2 1.7±0.3
0.52
Tramadol 33±19 0.64 31±9 0.77 0.81±0.47 0.8±0.2
0.97
Trimethoprim 51±12 0.61 29±2 0.96 1.3±0.3 0.73±0.06 0.55 0.55
Venlafaxine 44±7 0.90 50±9 0.77 1.1±0.2 1.2±0.2 0.91 1.4 a: If concentration is below the limit of quantification (LOQ), it indicates <LOQ. b: If R2 <0.5, it indicates no fit. c: If 0.5<R2 <0.7, it is considered a poor fit and indicates Italic.
A indicates the reference (Antoniou et al., 2013).
B indicates the reference (Hansen et al., 2016).
33
Antoniou et al. (2013) investigated the influence of different effluent matri-
ces on the removal of spiked pharmaceuticals through laboratory ozonation,
while Hansen et al. (2016) studied the effect of DOC on the removal of
spiked pharmaceuticals in effluent from a staged MBBR with laboratory
ozone equipment, finding that the obtained Z90 values from effluent with dif-
ferent DOCs were comparable. When comparing the Z90 of the current two
studies with previous similar researches, corresponding Z90 values apply to
clarithromycin, ibuprofen, iomeprol, iopamidol, metoprolol, sulfamethizole,
trimethoprim and venlafaxine. Based on these findings, we may consider that
Z90 can be used as an index to evaluate the efficient removal of pharmaceuti-
cal by ozonation.

34
4.3 Removal of natural fluorescence indicators Fluorescence can be used as a tracer for the source fraction of DOC and its
transformation during ozonation (Hudson, Naomi; Baker, Andy; Reynolds,
2007). Previous research has indicated that fluorescence can be used as a
monitoring tool to determine indirectly ozone in recirculating aquaculture
system water (Spiliotopoulou et al., 2017). The detailed introductions regard-
ing fluorescence and the specific wavelengths used in this study are described
in Papers IV and V.
Hence, the same ozonated samples from the pilot and laboratory experiments
with different ozone doses were measured in six fluorescence wavelengths,
consisting of protein-like and humic-like fluorophores (Figure 4.3).
ozone at Pilot (Protein-like)
0 10 20 30 40 500
10
20
30
40
50
Ozone concentration(mg O3/L)
I (A
u)
ozone at lab after 24h (Protein-like)
0 10 20 30 40 500
10
20
30
40
50
Ozone concentration(mg O3/L)
I (A
u)
ozone at Pilot (Humic-like)
0 10 20 30 40 500
20
40
60
80
Ozone concentration(mg O3/L)
I (A
u)
ozone at lab after 24h (Humic-like)
0 10 20 30 40 500
20
40
60
80
Ozone concentration(mg O3/L)
I (A
u)
Peak B (231,315) Peak T2 (231,360) Peak A (249,450)
Peak B (275,310) Peak T1 (275,340) Peak C (335,450)
(a)
(c)
(b)
(d)
Figure 4.3. (a)-(d): comparison of remaining natural fluorescence of MBBRs effluent
treated by ozone, using the pilot or laboratory method. (Paper IV)
Generally, if looking at the trend of fluorescence intensity in these two stud-
ies, the intensity of both the protein and the humic-like fluorophores de-
creased in line with an increase in ozone concentration. This decreasing fluo-
rescence intensity can be explained by the depletion of or variation in aro-
matic structures and the increase of electron withdrawing groups such as
COOH in aromatic compounds (Świetlik and Sikorska, 2004). In the pilot
Herning study, the intensity of all protein-like fluorescent peaks decreased
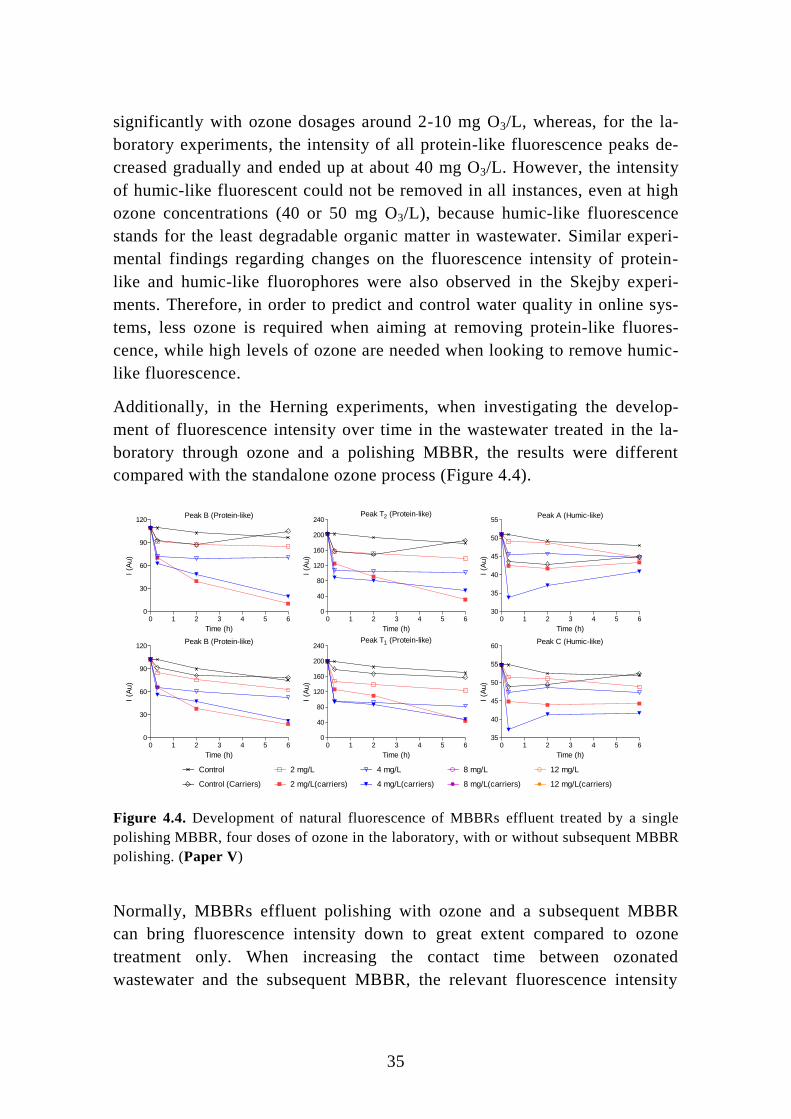
35
significantly with ozone dosages around 2-10 mg O3/L, whereas, for the la-
boratory experiments, the intensity of all protein-like fluorescence peaks de-
creased gradually and ended up at about 40 mg O3/L. However, the intensity
of humic-like fluorescent could not be removed in all instances, even at high
ozone concentrations (40 or 50 mg O3/L), because humic-like fluorescence
stands for the least degradable organic matter in wastewater. Similar experi-
mental findings regarding changes on the fluorescence intensity of protein-
like and humic-like fluorophores were also observed in the Skejby experi-
ments. Therefore, in order to predict and control water quality in online sys-
tems, less ozone is required when aiming at removing protein-like fluores-
cence, while high levels of ozone are needed when looking to remove humic-
like fluorescence.
Additionally, in the Herning experiments, when investigating the develop-
ment of fluorescence intensity over time in the wastewater treated in the la-
boratory through ozone and a polishing MBBR, the results were different
compared with the standalone ozone process (Figure 4.4).
Peak B (Protein-like)
0 1 2 3 4 5 60
30
60
90
120
Time (h)
I (A
u)
Peak T2 (Protein-like)
0 1 2 3 4 5 60
40
80
120
160
200
240
Time (h)
I (A
u)
Peak A (Humic-like)
0 1 2 3 4 5 630
35
40
45
50
55
Time (h)
I (A
u)
Peak B (Protein-like)
0 1 2 3 4 5 60
30
60
90
120
Time (h)
I (A
u)
Peak T1 (Protein-like)
0 1 2 3 4 5 60
40
80
120
160
200
240
Time (h)
I (A
u)
Peak C (Humic-like)
0 1 2 3 4 5 635
40
45
50
55
60
Time (h)
I (A
u)
4 mg/L
4 mg/L(carriers)
8 mg/L
8 mg/L(carriers)
Control 2 mg/L
2 mg/L(carriers)Control (Carriers)
12 mg/L
12 mg/L(carriers)
Figure 4.4. Development of natural fluorescence of MBBRs effluent treated by a single
polishing MBBR, four doses of ozone in the laboratory, with or without subsequent MBBR
polishing. (Paper V)
Normally, MBBRs effluent polishing with ozone and a subsequent MBBR
can bring fluorescence intensity down to great extent compared to ozone
treatment only. When increasing the contact time between ozonated
wastewater and the subsequent MBBR, the relevant fluorescence intensity

36
gradually decreased. However, for humic-like fluorescent, the intensity of
ozonated wastewater with a subsequent MBBR slowly increased until termi-
nation of the experiment, because during the MBBR polishing process, the
attached biofilm started to detach and eventually dissolved in the wastewater,
thereby contributing some fluorescence intensity. Overall, based on this la-
boratory test, ozone followed by a polishing MBBR is able to purify
wastewater further and improve the quality of any discharge into receiving
water.
4.4 Performance of micro-toxicity Microtoxicity tests at 15 min of exposure time were carried out to investigate
wastewater characteristics for the Herning staged MBBRs process and onsite
continuous ozonation (Figure 4.5). Basically, the inhibition of toxicity was
reduced on a tank by tank basis. The inhibitions of toxicity in ozonated
wastewater first decreased and then increased again in both studies when
ozone dosage increased. In this case, we can assume that highly toxic ozone
by-products, compared to original substances, gradually generated when in-
creasing ozone up to high concentrations. However, low concentrations of
ozone were able to reduce half of the toxicity from MBBRs effluent.
MicroTox15 min (Pilot)
M0/
RF/R
SM
1M
2M
3AM
3B M4
M5
0
10
20
30
40
50
Staged MBBR
Return flow
Return sludge
Inhib
itio
n(%
)
MicroTox15 m (Pilot)
0 2 4 8 120
10
20
30
Ozone concentration(mg/L)
a) b)
Figure 4.5. Toxicity measured with a MicroTox® test with 15 min exposure time in a pi-
lot-scale MBBR treatment train (a) and onsite continuous pilot ozonation (b). M0: munici-
pal influent fed into the pilot-scale MBBR treatment train. RF: return flow from M3B,
marked with a black circle. RS: return sludge flow from a settling tank after M3B, marked
with a blue triangle. M5: effluent from the MBBR treatment train, which was also the ini-
tial inlet for ozonation (O3 =0 mg/L). (Paper V)
In the Herning study, a pilot polishing MBBR was applied in order to purify
the ozonation effluent further. A comparison of toxicity inhibition between

37
ozonated wastewater and ozonated wastewater with a polishing MBBR is
presented in Figure 4.6. In Figure 4.6a, the MBBR effluent was treated with
different concentrations of ozone followed by a pilot polishing MBBR. Inhi-
bitions decreased in line with increasing ozone concentrations, from 2 to 4
mg O3/L, while they increased again when the applied ozone concentration
reached 8 to 12 mg O3/L, before gradually decreasing from 15 to 30 mg O3/L.
In the first stage, toxic DOC in ozonated effluent was reduced when increas-
ing ozone concentration, while in the second stage, DOC was gradually re-
duced down close to zero. Simultaneously, ozone by-products were the main
source of toxicity, and so the higher amount of ozone applied in the effluent,
the higher the toxic ozone by-products produced, which led to an increase in
inhibition. In the last stage, with ozone concentrations, inhibition decreased
again, due to existing ozone by-products removed by a sufficient amount of
ozone. For each ozone concentration applied, the subsequent polishing
MBBR was able to bring down the remaining toxicity in ozonated effluent to
almost zero, indicating that polishing MBBRs offer a very important and effi-
cient way of enhancing the purification of ozonated effluent.
MicroTox15 m (Pilot)
0 32O
+MBBR
32O
34O
+MBBR
34O
38O
+MBBR
38O
3
12O
+MBBR
3
12O
3
15O
+MBBR
3
15O
3
30O
+MBBR
3
30O
0
10
20
30MicroTox15 m (Lab)
0 2 4 6 8 12 15 20 300
10
20
30
40
0.3 h
2 h
6 h
Ozone concentration(mg/L)
MicroTox15 m (Lab)
0
0+M
BBR 3
2O
+MBBR
32O
34O
+MBBR
34O
38O
+MBBR
38O
3
12O
+MBBR
3
12O
0
10
20
30
400.3 h
2 h
Inhib
itio
n(%
)
a) b) c)
Figure 4.6. Comparison of MicroTox® with 15 min exposure time with different concen-
trations of ozone from the pilot and the laboratory experiments, followed by relevant pilot-
scale or lab-scale MBBR polishing over time. (a) Staged MBBR effluent treated by onsite
continuous pilot-scale ozone with various doses and a subsequent pilot MBBR polishing
tank, (b) staged MBBR effluent treated by eight doses of ozone in the laboratory, (c)
wastewater effluent treated by a single polishing MBBR, four doses of ozone in the labora-
tory, with or without subsequent MBBR polishing. (Paper V)
To understand further the features of microtoxicity development in ozonated
wastewater, with or without polishing MBBR afterwards, the same MBBR
effluent was ozonated with various doses in the laboratory, and the inhibition
of individually ozonated samples decreased over time (Figure 4.6b). Over a
2-hour ozone reaction time, the inhibition of ozonated samples first decreased

38
and then increased when ozone concentration increased, which fitted to the
first and second stages mentioned above. In Figure 4.6c, MBBR effluent was
treated with different concentrations of ozone followed with a polishing
MBBR in the laboratory. Over 2 hours’ contact time, each ozonated sample
treated with a polishing MBBR was less inhibited compared to the ozone-
only samples, which again verified that the polishing MBBR is able to reduce
further the toxicity of ozonated effluent.

39

40
5 Conclusions
The main findings of this thesis can be concluded as follow:
A pilot-scale staged MBBRs with both denitrification and nitrification pro-
cesses, was proven as a feasible and effective solution to easing the effects of
hospital wastewater on the environment. On the one hand, general parameters
of wastewater, such as TOC, NH4+–N and NO2
--N, were removed to a high
extent, and thus this onsite MBBRs system was able to reduce treatment load-
ing in conventional WWTPs, as the treated MBBRs effluents eventually dis-
charge into the municipal sewer system. On the other hand, the higher kbio of
the majority of pharmaceuticals was observed for either denitrification or ni-
trification when compared to other similar researches on activated sludge and
MBBRs. More than 50% of pharmaceuticals above LOQ in continuous flow
experiments were removed. For diclofenac as a refractory compound, through
intermittent feeding into the M3A/B reactors, its removal at 80% was two
times higher compared to average removal in activated sludge or MBR.
Humic acid, simulating an externally complex carbon source, can affect the
biodegradation rates of pharmaceutical in effluent treated by a laboratory-
scale polishing MBBR as a tertiary treatment process. Twelve out of 24 in-
vestigated pharmaceuticals discovered as biodegradable compounds degraded
faster with an increase in TOC derived from humic acid addition, thereby in-
dicating that co-metabolism plays an important role, rather than competitive
mechanisms, during pharmaceutical biodegradation. Similar conclusions have
also been reached in previous research, where pharmaceuticals were oxidised
by an enzyme or a co-factor produced during the metabolism of another
growth substrate. The average stimulation of the first-order rate constant for
biodegradable pharmaceuticals was 5% per mg DOC. 30 mgC/L by humic
acid addition enhanced about three times the biodegradation performance of
the laboratory-scale MBBRs.
By implementing the intermittent feeding of laboratory-scale MBBR reactors
with raw settled wastewater and WWTP effluent for the first time, not only
can MBBRs purify wastewater in relation to the high removal of ammonia,
but degraders with the ability to biodegrade diclofenac present in wastewater
are also promoted through an increase in biomass. Thus, the 2.1 h half-life of
diclofenac, discovered in the intermittent feeding MBBRs system, was short-
er than any wastewater bioreactor treatments to date, and its kbio was more
than ten times higher than in other similar studies. Moreover, for beta blocker

41
compounds such as those found in atenolol and metoprolol, their kbio was also
significantly higher compared to previous studies.
Ozonation was a feasible enforcement method for polishing the effluent of
staged MBBRs and most pharmaceuticals remaining in MBBR effluent were
removed when increasing ozone levels. Z90, deriving from the normalisation
of ozone doses with DOC, was used as a measuring index to compare the re-
moval efficiency of pharmaceuticals in different ozonation experiments, and
it can be considered to evaluate ozone performance for pharmaceutical re-
moval. Fluorescence intensity, positively relating to BOD in wastewater, can
also be considered as an index of water quality when using ozonation to puri-
fy wastewater. Based on experimental results, less ozone was needed when
looking to reduce the fluorescence intensity of protein-like fluorophores;
however, high amounts of ozone were required when reducing the fluores-
cence intensity of humic-like fluorophores. Pilot-scale staged MBBRs were
capable of reducing toxicity inhibitions in wastewater, reactor by reactor, and
subsequent ozone further reduced by half any toxicity remaining in MBBRs
effluent. A polishing MBBR as a tertiary treatment solution, conjugated with
ozone, was used to purify ozone effluent, and its toxicity caused by ozone by-
products was entirely removed. Accordingly, ozonated wastewater treated
with the polishing MBBR afterwards generally had the lowest intensity of
protein-like fluorescence.

42
6 Future perspectives
The issue of a lack of sufficient biomass in effluents was addressed for the
first time through the novel approach, which is intermittent feeding to labora-
tory-scale MBBRs with raw settled wastewater and WWTP effluent. There-
fore, diclofenac a hardly degradable compound in effluent has achieved a
half-time of degradation shorter than resulting from other biological reactors.
Then, if the experimental methodology were scaled up from the laboratory to
full scale, where the conditions and matrices of wastewater are much more
complicated, it’s interesting to know whether short half-life time of diclo-
fenac can be still achieved or not if the novel feeding approach above could
carry out in a full scale polishing MBBR.
In this study, an on-site pilot of staged MBBRs was carried out to treat raw
hospital wastewater, and generally it was able to remove investigated phar-
maceuticals to a high degree along with an overall reduction in wastewater
toxicity. Implementing an on-site MBBR to treat wastewater, resulting in
ease further loading process of WWTPs, can also be promote to treat other
types of wastewater (i.e. wastewater in pharmaceutical factory) rather than
only hospital wastewater in this study.
Natural fluorescence intensity in wastewater is character trait of BOD. The
relationship between ozone dosage and natural fluorescence intensity was
understood in this study by conducting off-line experiments in the laboratory,
and thus fluorescence intensity could be recognised as a parameter/index of
wastewater quality during ozonation. For technicians working in WWTPs,
off-line experiments measuring fluorescence intensity for ozonated samples
are feasible, but they are quite time-consuming. Hence, if an online sensor for
detecting fluorescence intensity could be developed, wastewater quality dur-
ing ozonation could be controlled based real-time data for fluorescence inten-
sity. Furthermore, an optimised dose of ozone, achieving discharge standards
for BOD, namely a higher ozone dose and less fluorescence intensity. Addi-
tionally, the relationship between fluorescence intensity and pharmaceutical
concentration in wastewater is also interesting to interpret. If there were a
coherent relationship, basic concentrations of pharmaceuticals will be able to
indirectly calculate based on fluorescence intensity, and subsequent tradition-
al analysis of pharmaceuticals could be omitted.
In this study, the MBBRs were generally run over a year or even more, and
the effect of temperature on performance of MBBRs can’t omit, especially

43
there is big temperature difference in summer and winter in Denmark. There
were 5℃ differences in previous operation of MBBRs, which could affect
performances of MBBRs on removal of pharmaceuticals, reduction of toxici-
ty and fluorescence intensity. Therefore, in future, clear differences regarding
the above performances in summer and winter need to be understood.

44
7 References Antoniou, M.G., Hey, G., Rodríguez Vega, S., Spiliotopoulou, A., Fick, J., Tysklind, M.,
la Cour Jansen, J., Andersen, H.R., 2013. Required ozone doses for removing
pharmaceuticals from wastewater effluents. Sci. Total Environ. 456–457, 42–49.
doi:10.1016/j.scitotenv.2013.03.072
Asuero, A.G., Sayago, A., González, A.G., 2006. The Correlation Coefficient: An
Overview. Crit. Rev. Anal. Chem. 36, 41–59. doi:10.1080/10408340500526766
Berger, K., Petersen, B., Buening-Pfaue, H., 2008. Persistence of drugs occurrring in liquid
manure in the food chain. Arch. fuer Leb. (Germany, F.R.).
Blaney, L., 2014. Ozone Treatment of Antibiotics in Water, Water Reclamation and
Sustainability. doi:10.1016/B978-0-12-411645-0.00012-2
Carvalho, R.N., Ceriani, L., Ippolito, A., 2015. Development of the first Watch List under
the Environmental Quality Standards Directive water policy. doi:10.2788/101376
Cydzik-Kwiatkowska, A., Zielińska, M., 2016. Bacterial communities in full -scale
wastewater treatment systems. World J. Microbiol. Biotechnol. 32, 1–8.
doi:10.1007/s11274-016-2012-9
Dantas, R.F., Canterino, M., Marotta, R., Sans, C., Esplugas, S., Andreozzi, R., 2007.
Bezafibrate removal by means of ozonation: Primary intermediates, kinetics, and
toxicity assessment. Water Res. 41, 2525–2532. doi:10.1016/j.watres.2007.03.011
Escolà Casas, M., Chhetri, R.K., Ooi, G., Hansen, K.M.S., Litty, K., Christensson, M.,
Kragelund, C., Andersen, H.R., Bester, K., 2015a. Biodegradation of pharmaceuticals
in hospital wastewater by staged Moving Bed Biofilm Reactors (MBBR). Water Res.
83, 293–302. doi:10.1016/j.watres.2015.06.042
Escolà Casas, M., Chhetri, R.K., Ooi, G., Hansen, K.M.S., Litty, K., Christensson, M.,
Kragelund, C., Andersen, H.R., Bester, K., 2015b. Biodegradation of pharmaceuticals
in hospital wastewater by a hybrid biofilm and activated sludge system (Hybas). Sci.
Total Environ. 530–531, 383–392. doi:10.1016/j.scitotenv.2015.05.099
Falås, P., Baillon-Dhumez, A., Andersen, H.R., Ledin, A., la Cour Jansen, J., 2012.
Suspended biofilm carrier and activated sludge removal of acidic pharmaceuticals.
Water Res. 46, 1167–1175. doi:10.1016/j.watres.2011.12.003
Falås, P., Longrée, P., la Cour Jansen, J., Siegrist, H., Hollender, J., Joss, A., 2013.
Micropollutant removal by attached and suspended growth in a hybrid biofilm-
activated sludge process. Water Res. 47, 4498–4506.
doi:10.1016/j.watres.2013.05.010
Hansen, K.M.S., Spiliotopoulou, A., Chhetri, R.K., Escolà Casas, M., Bester, K.,
Andersen, H.R., 2016. Ozonation for source treatment of pharmaceuticals in hospital
wastewater – Ozone lifetime and required ozone dose. Chem. Eng. J. 290, 507–514.
doi:10.1016/j.cej.2016.01.027
Herrmann, M., Olsson, O., Fiehn, R., Herrel, M., Kümmerer, K., 2015. The significance of
different health institutions and their respective contributions of act ive
pharmaceutical ingredients to wastewater. Environ. Int. 85, 61–76.
doi:10.1016/j.envint.2015.07.020
Hollender, J., Zimmermann, S.G., Koepke, S., Krauss, M., Mcardell, C.S., Ort, C., Singer,
45
H., Von Gunten, U., Siegrist, H., 2009. Elimination of organic micropollutants in a
municipal wastewater treatment plant upgraded with a full-scale post-ozonation
followed by sand filtration. Environ. Sci. Technol. 43, 7862–7869.
doi:10.1021/es9014629
Hudson, Naomi; Baker, Andy; Reynolds, D., 2007. Fluorescence analysis of dissolved
organic matter in natural, waste and polluted waters—a review. River Res. Appl. 23,
631–649. doi:10.1002/rra.1005
Hudson, N., Baker, A., Ward, D., Reynolds, D.M., Brunsdon, C., Carliell-Marquet, C.,
Browning, S., 2008. Can fluorescence spectrometry be used as a surrogate for the
Biochemical Oxygen Demand (BOD) test in water quality assessment? An example
from South West England. Sci. Total Environ. 391, 149–158.
doi:10.1016/j.scitotenv.2007.10.054
Joss, A., Andersen, H., Ternes, T., Richle, P.R., Siegrist, H., 2004. Removal of estrogens
in municipal wastewater treatment under aerobic and anaerobic conditions:
Consequences for plant optimization. Environ. Sci. Technol. 38, 3047–3055.
doi:10.1021/es0351488
Joss, A., Zabczynski, S., Göbel, A., Hoffmann, B., Löffler, D., McArdell, C.S., Ternes,
T.A., Thomsen, A., Siegrist, H., 2006. Biological degradation of pharmaceuticals in
municipal wastewater treatment: Proposing a classification scheme. Water Res. 40,
1686–1696. doi:10.1016/j.watres.2006.02.014
Kovalova, L., Siegrist, H., Singer, H., Wittmer, A., McArdell, C.S., 2012. Hospital
wastewater treatment by membrane bioreactor: Performance and efficiency for
organic micropollutant elimination. Environ. Sci. Technol. 46, 1536–1545.
doi:10.1021/es203495d
Ødegaard, H., 2006. Innovations in wastewater treatment: The moving bed biofilm
process. Water Sci. Technol. 53, 17–33. doi:10.2166/wst.2006.284
Overturf, M.D., Anderson, J.C., Pandelides, Z., Beyger, L., Holdway, D. a., 2015.
Pharmaceuticals and personal care products: A critical review of the impacts on fish
reproduction. Crit. Rev. Toxicol. 45, 469–491. doi:10.3109/10408444.2015.1038499
Plósz, B.G., Langford, K.H., Thomas, K. V., 2012. An activated sludge modeling
framework for xenobiotic trace chemicals (ASM-X): Assessment of diclofenac and
carbamazepine. Biotechnol. Bioeng. 109, 2757–2769. doi:10.1002/bit.24553
Spiliotopoulou, A., Martin, R., Pedersen, L., Andersen, H.R., 2017. Use of fl uorescence
spectroscopy to control ozone dosage in recirculating aquaculture systems. Water
Res. 111, 357–365. doi:10.1016/j.watres.2016.12.036
Suarez, S., Lema, J.M., Omil, F., 2010. Removal of Pharmaceutical and Personal Care
Products (PPCPs) under nitrifying and denitrifying conditions. Water Res. 44, 3214–
3224. doi:10.1016/j.watres.2010.02.040
Świetlik, J., Sikorska, E., 2004. Application of fluorescence spectroscopy in the studies of
natural organic matter fractions reactivity with chlorine dioxide and ozone. Water
Res. 38, 3791–3799. doi:10.1016/j.watres.2004.06.010
Ternes, T. a., Stüber, J., Herrmann, N., McDowell, D., Ried, A., Kampmann, M., Teiser,
B., 2003. Ozonation: A tool for removal of pharmaceuticals, contrast media and musk
fragrances from wastewater? Water Res. 37, 1976–1982. doi:10.1016/S0043-
1354(02)00570-5
46
Tobajas, M., Monsalvo, V.M., Mohedano, A.F., Rodriguez, J.J., 2012. Enhancement of
cometabolic biodegradation of 4-chlorophenol induced with phenol and glucose as
carbon sources by Comamonas testosteroni. J. Environ. Manage. 95, S116–S121.
doi:10.1016/j.jenvman.2010.09.030
Tran, N.H., Urase, T., Ngo, H.H., Hu, J., Ong, S.L., 2013. Insight into metabolic and
cometabolic activities of autotrophic and heterotrophic microorganisms in the
biodegradation of emerging trace organic contaminants. Bioresour. Technol. 146,
721–731. doi:10.1016/j.biortech.2013.07.083
Verlicchi, P., Al Aukidy, M., Galletti, a., Zambello, E., Zanni, G., Masotti, L., 2012a. A
project of reuse of reclaimed wastewater in the Po Valley, Italy: Polishing sequence
and cost benefit analysis. J. Hydrol. 432–433, 127–136.
doi:10.1016/j.jhydrol.2012.02.024
Verlicchi, P., Al Aukidy, M., Zambello, E., 2012b. Occurrence of pharmaceutical
compounds in urban wastewater: Removal, mass load and environmental risk after a
secondary treatment-A review. Sci. Total Environ. 429, 123–155.
doi:10.1016/j.scitotenv.2012.04.028
Vieno, N., Sillanpää, M., 2014. Fate of diclofenac in municipal wastewater treatment plant
- A review. Environ. Int. 69, 28–39. doi:10.1016/j.envint.2014.03.021

47

48
8 Papers
I Ooi, G.T.H., Tang, K., Chhetri, R.K., Kaarsholm, K.M.S.,
Sundmark, K., Kragelund, C., Litty, K., Christensen, A., Lindholst,
S., Sund, C., Christensson, M., Bester, K., Andersen, H.R., 2017.
Biological treatment of hospital wastewater in a pilot-scale staged
Moving Bed Biofilm Reactors (MBBRs) utilizing both nitrifying and
denitrifying processes. Manuscript to be submitted.
II Tang, K., Escola Casas, M., Ooi, G.T.H., Kaarsholm, K.M.S.,
Bester, K., Andersen, H.R., 2017. Influence of humic acid addition
on the degradation of pharmaceuticals by biofilms in effluent
wastewater. International Journal of Hygiene and Environmental
Health, 220, 604-610.
III Tang, K., Ooi, G.T.H., Litty, K., Sundmark, K., Kaarsholm, K.M.S.,
Sund, C., Kragelund, C., Christensson, M., Bester, K., Andersen,
H.R., 2017. Removal of pharmaceuticals in conventionally treated
wastewater by a polishing moving bed biofilm reactor (MBBR) with
intermittent feeding. Bioresource Technology, 236, 77-86.
IV Tang, K., Spiliotopoulou, A., Chhetri, R.K., Ooi, G.T.H.,
Kaarsholm, K.M.S., Sundmark, K., Florian, B., Kragelund, C.,
Bester, K., Andersen, H.R., 2017. Removal of pharmaceuticals,
toxicity and natural fluorescence by ozonation of biological treated
hospital wastewater with further polishing by suspended biofilm.
Manuscript to be submitted.
V Tang, K., Ooi, G.T.H., Chhetri, R.K., Spiliotopoulou, A.,
Kaarsholm, K.M.S., Sundmark, K., Florian, B., Kragelund, C.,
Bester, K., Andersen, H.R., 2017. Removal of pharmaceuticals,
toxicity and natural fluorescence by ozonation in biological pre-
treated municipal wastewater in comparison to subsequent polishing
biofilm reactors. Manuscript to be submitted.


