
8/4/2019 Removal of Trichloroethylene Using ZnO_Al2O3 Catalyst
http://slidepdf.com/reader/full/removal-of-trichloroethylene-using-znoal2o3-catalyst 1/9
Journal of Hazardous Materials 142 (2007) 88–96
Preparation and application of granular ZnO/Al2O3 catalystfor the removal of hazardous trichloroethylene
Jyh-Cherng Chen ∗, Chun-Tien Tang
Department of Environmental Engineering, Hung-Kuang University, No. 34, Chung-Chie Road, Shalu, Taichung County, Taiwan 43302, ROC
Received 9 January 2006; received in revised form 26 June 2006; accepted 27 July 2006
Available online 31 July 2006
Abstract
Trichloroethylene (TCE) is a volatile and nerve-toxic liquid, which is widely used in many industries as an organic solvent. Without propertreatment, it will be volatilized into the atmosphere easily and hazardous to the human health and the environment. This study tries to prepare
granular ZnO/Al2O3 catalyst by a modified oil-drop sol–gel process incorporated the incipient wetness impregnation method and estimates its
performance on the catalytic decomposition of TCE. The effects of different preparation and operation conditions are also investigated.
Experimental results show that the granular ZnO/Al2O3 catalyst has good catalytic performance on TCE decomposition and the conversion of
TCE is 98%. ZnO/Al2O3(N) catalyst has better performance than ZnO/Al2O3(O) at high temperature. Five percent of active metal concentration
and 550 ◦C calcination temperature are the better and economic preparation conditions, and the optimum operation temperature and space velocity
are 450 ◦C and 18,000 h−1, respectively. The conversions of TCE are similar and all higher than 90% as the oxygen concentration in feed gas
is higher than 5%. By Fourier transform infrared spectrography (FT-IR) analyses, the major reaction products in the catalytic decomposition of
TCE are HCl and CO2. The Brunauer–Emmett–Teller (BET) surface areas of catalysts are significantly decreased as the calcination temperature
is higher than 550 ◦C due to the sintering of catalyst materials, as well as the reaction temperature is higher than 150 ◦C due to the accumulations
of reaction residues on the surfaces of catalysts. These results are also demonstrated by the results of scanning electron micrography (SEM) and
energy disperse spectrography (EDS).
© 2006 Elsevier B.V. All rights reserved.
Keywords: Catalysis; Trichloroethylene; Zinc oxide; Sol–gel; FT-IR
1. Introduction
The widespread presence of chlorinated volatile organic com-
pounds (VOCs) in the environment poses a serious environmen-
tal challenge because most of them are carcinogenic, toxic and
extremely persistent in the environment. In this study, TCE is
chosen as the probe contaminant because its emissions are asso-
ciated to a wide range of industrial processes and its vapor is
of great environmental concern, as it represents one of the most
commonly detected pollutants in hazardous waste sitesand land-
fills in many countries [1–4].
Heterogeneous catalytic oxidation has been demonstrated as
an efficient abatement technology for the removal of VOCs
[1–7]. The activity and performance of catalyst are influenced
∗ Corresponding author. Tel.: +886 4 26318652x4109; fax: +886 4 26525245.
E-mail address: [email protected](J.-C. Chen).
by their chemical compositions and preparation method. Cat-
alysts reported for destructive oxidation of chlorinated VOCs
mostly consist of transition metal oxides (titanium, vanadium,
manganese, ferric, nickel, copper and zinc) and noble metals
(platinum, palladium and rhodium) on acidic supports [3,7,8].
Noble metals have better catalytic activities but they are expen-
sive and easily poisoned by the acid gases (SO2 and HCl) in the
exhaust. On the other hand, the catalytic activities of transition
metal oxides are lower but they are cheaper and have higher tol-
erances to the acid gases [5,9]. The supports of catalysts include
alumina, silica, zeolite, activated carbon, molecular sieve and so
on.Luetal. [10] compared the activities of ZnOcoated on differ-
ent supports, the conversions of methylbenzene by ZnO/MCM-
41 was higher than that by ZnO/ -Al2O3 at 383 ◦C, and also
higher than that by ZnO/ -zeolite and ZnO/SiO2 at 361 ◦C. Kim
[11] also compared the activities of CuO coated on different sup-
ports and their performances followed the sequence of CuO/ -
Al2O3 > CuO/TiO2 (rutile) > CuO/TiO2 (anatase) > CuO/SiO2.
0304-3894/$ – see front matter © 2006 Elsevier B.V. All rights reserved.
doi:10.1016/j.jhazmat.2006.07.061
8/4/2019 Removal of Trichloroethylene Using ZnO_Al2O3 Catalyst
http://slidepdf.com/reader/full/removal-of-trichloroethylene-using-znoal2o3-catalyst 2/9
J.-C. Chen, C.-T. Tang / Journal of Hazardous Materials 142 (2007) 88–96 89
The performances of catalysts are not only influenced by
their chemical compositions but also influenced by the oper-
ation conditions such as operating temperature, space velocity,
and the types and concentrations of air pollutants [9]. Higher
operating temperature promotes the decomposition efficiency of
organic pollutants, but over temperature (>700 ◦C) may cause
the catalyst sintered or volatilized. Takemoto et al. [12] f ound
that the conversion of CH2O by Cu–ZnO/Al2O3 catalyst was
increased with the increase of operating temperature. Nearly
100% CH2O was converted at 150–200 ◦C. Space velocity is
the reciprocal of retention time of a pollutant flowing through
the catalyst reactor. With small space velocity, the retention time
of pollutant in the catalyst reactor is long and the conversions
of VOCs are increased. The types and characteristics of pol-
lutants also have significant influences on the performances
of catalysts. Kim [11] used a Cu/ -Al2O3 catalyst to study
the decompositions of different volatile organic compounds.
The removal efficiency of toluene was the highest, the next
was xylene, and benzene was the lowest. In addition, the per-
formance of catalyst was decreased as the concentrations of pollutants were increased. Although TCE can be completely
decomposed into CO2 and HCl with the aids of catalysts, but
some undesirable toxic byproducts may be formed in the cat-
alytic reactions [1]. Driessen et al. [2] addressed that phosgene,
dichloroacetic acid (DCAA), monochloroacetic acid (MCAA),
and dichloroacetylchloride (DCAC) can be formed in the cat-
alytic decomposition of TCE.
ZnO is one of the photo catalysts with a similar band gap
of TiO2, which has shown to be, in some cases, a more active
catalyst. Even more importantly, ZnO possess the selectivity
for complete mineralization of chlorinated waste [1]. Moreover,
ZnO can be used as a support and coated with copper to serveas a Cu–Zn catalyst for the synthesis of methanol [10].
Most researches reported the application of semiconductor
metal oxide ZnO for the photo catalysis of organic pollutants;
however, less study investigates the catalytic incinerations of
chlorinated VOCs with ZnO/Al2O3 catalyst. This study tries
to prepare granular ZnO/Al2O3 catalyst by modified oil-drop
sol–gel process incorporated with incipient wetness impreg-
nation method and estimates its performance on the catalytic
decomposition of TCE. The effects of different preparation and
operation conditions are also investigated.
2. Experimental methods
2.1. Preparation of granular catalyst
The granular support -Al2O3 of catalyst was prepared by a
modified oil-drop sol–gel process [13,14]. The starting material
of -Al2O3 granules was high-concentration (1.8 M) boehmite
sol (from SASOL). The 1.8 M boehmite sol was first mixed with
a small amount of 1 M HNO3 (the volume ratio of acid/sol was
1:5). The modified sol was stirred for 15 min at 70 ◦C by a mag-
netic stirrer. A dramatic decrease of the pH of the sol by adding
HNO3 substantially accelerated the gelation process.Afteraging
forhalfanhourat60–70 ◦C,the pure1.8 M boehmitesol became
very viscous and it could not be stirred by the magnetic stirrer
even at themaximum power. The very viscous solwas then trans-
ferred to a dropper as the starting material for the granulation
process.
The granulation process included the generation of sol
droplets by the dropper, shaping, partially gelating the droplets
into spherical wet-gel granules in a paraffin oil layer (color:
white; density: 0.7864 g/cm3; kinematic viscosity: 34.5 cs at
40 ◦C, from J.T. Baker) and consolidating the structure of the
wet-gel granules in a 8 wt.% ammonia solution layer. The paraf-
fin oil layer and ammonia solution layer were kept at room
temperature. The interface between the oil and ammonia solu-
tion was slowly stirred to facilitate the transport of wet granules
across the interface. After aging in the ammonia layer for at
least 45 min, the spherical wet-gel granules (about 1–2 mm in
diameter) were removed from the ammonia solution, carefully
washed with water and alcohol sequentially, dried at 40 ◦C for
48 h, and finally calcined in air at 450 ◦C for 6 h.
The active metal ZnO was coated by incipient wetness
impregnation method [9]. The volume of impregnation solu-
tion was estimated to equal to the volume of granular support.The precursors of zinc oxide were then weighed and mixed with
distilled water to prepare the impregnation solution. The concen-
trationofzincinthecatalystwassetat1,5and10%,respectively.
The granular Al2O3 support was then put into the impregnation
solution and stirred at room temperature for 8 h. After the incip-
ient wetness impregnation process, the granular catalysts were
dried at 120 ◦C for 12h and calcinedin air at550 ◦Cfor6h.Two
types of zinc oxide precursors were used in this study to compare
the differences. The first one was commercial zinc oxide pow-
der with the average particle diameter of 100 nm. The second
one was zinc nitride which is very soluble and can transform to
zinc oxide by thermal calcinations. For easy expression, the cat-alysts prepared from different zinc oxide precursors are named
as ZnO/Al2O3(O) and ZnO/Al2O3(N), respectively hereafter. It
has to state that the precursor Zn(NO3)2 for ZnO/Al2O3(N) cat-
alyst can transform into ZnO completely after calcination in air
at 550 ◦C for 6 h. There is no Zn3N2 or Zn(NO3)2 in the catalyst
and that can be proved from the analyses results that no N peak
was found in SEM/EDS spectra and no Zn3N2 or Zn(NO3)2
peak was found in XRPD spectra.
2.2. Test of catalyst activity
A catalysis reaction system was set up to measure the activ-
ity of granular ZnO/Al2O3 catalyst. As shown in Fig. 1, theexperimental equipments are composed of pure gas cylinders,
mass flow meters, a generator of volatile TCE gas, a quartz
reaction tube, an electric heater, and a programmable tempera-
ture controller. The on-line gas analyzers of Fourier transform
infrared spectrograph (FT-IR, Perkin-Elmer: Spectrum One) and
Gas chromatograph-flame ionization detector (GC-FID, Varian:
CP-3800) were used to monitor the concentrations of reac-
tion produces in the effluent. The concentration and flow rate
of volatile TCE gas were accurately controlled by mass flow
meters. The total flow rate and concentration of TCE gas were
controlled at 500ml min−1 and 450 ppm, respectively. The flow
rates of air and N2 were controlled at 480 and 0 ml min−1
as the

8/4/2019 Removal of Trichloroethylene Using ZnO_Al2O3 Catalyst
http://slidepdf.com/reader/full/removal-of-trichloroethylene-using-znoal2o3-catalyst 3/9
90 J.-C. Chen, C.-T. Tang / Journal of Hazardous Materials 142 (2007) 88–96
Fig. 1. Diagram of experimental apparatus.
influent O2 concentration was 21%. The other 20 ml min−1 N2
was used to evaporate pure TCE liquid (from J.T. Baker) to gen-
erate TCE gas. The temperature of water bath in the generator
of TCE gas was controlled at 40 ◦C. The concentration of gener-
ated TCE gas was rechecked by FT-IR gas analyzer and required
to keep steady at least for 5 min before performing every test.
After that, 0.67 g ZnO/Al2O3 catalysts were put in the middle
of quartz tube and fixed from both sides by quartz fibers. As the
reaction temperature was preheated to the required value and
kept steady for 25 min, the generated TCE gas was introduced
into the quartz tube and the gas analyzer FT-IR was turned on.
The compositions and concentrations of reaction products in the
effluent of catalyst reactor were continuously scanned and moni-
tored. The scanning range of FT-IR spectra was 450–4000 cm−1
and the instrument resolution was 4 cm−1. Theconcentrationsof
TCEand other compounds were also analyzed and rechecked by
GC-FID. The operation temperatures of GC-FID were 200◦C at
injector, 180 ◦C at column (equity-5) and 200 ◦C at detector. To
confirm the conversion of TCE was complete and stable, each
test was performed for at least 50 min. After the catalyst test was
finished, the flow meters and electric heater were shut down and
the reacted catalyst was taken out for further analyses. Table 1
lists the experimental conditions of every test.
2.3. Characteristic analyses of catalyst
The surface areas of catalysts were measured at 77 K by the
gravimetric methods with a vacuum microbalance (Micromerit-
ics: Gemini 2360). Theses results provide a comparison of
the surface area between fresh and reacted catalysts. N2
adsorption–desorption procedure was used to determine the
textural properties. The Brunauer–Emmett–Teller (BET) sur-
face area was calculated from the adsorption isotherm. The
average pore diameter was obtained from the pore size distri-
bution. An X-ray powder diffractometer (XRPD, SIEMENS:
D5000) with a Cu K radiation was used to identify the crys-
talline species of zinc and aluminum on the catalyst. Diffraction
patterns were manually analyzed with JCPDS card (standard
patterns). The scanning range of 2θ was 20–80◦ in steps of
0.04◦. The scanning speed was 4 ◦ min−1. The surface struc-
ture and the accumulation of contaminants on the surface of
reacted catalyst were observed by a scanning electron micro-
scope (SEM, TOPCON: ABT-150S) at the Regional Instrument
Center in National Chung-Hsing University (Taichung City, Tai-
wan). The accelerationvoltage was0.5–40 kV and theresolution
was 4 nm. The samples used for SEM micrography needed dry-
ing for 8h at 105◦
C in an oven and stored in a desiccator
Table 1
List of experimental conditions
Run Catalyst Impregnation concentration
of Zn (wt.%)
Calcinations
temperature (◦C)
Operation
temperature (◦C)
Oxygen
concentration (%)
Space velocity
(h−1)
1–5 – – – 30, 150, 250, 350, 450 21 36000
6–10 ZnO/Al2O3(N) 10 550 30, 150, 250, 350, 450 21 36000
11–15 ZnO/Al2O3(O) 10 550 30, 150, 250, 350, 450 21 36000
16–18 ZnO/Al2O3(N) 10 550 450 5, 10, 15 36000
19–21 ZnO/Al2O3(N) 10 550 450 21 12000, 18000, 72000
22–24 ZnO/Al2O3(N) 1, 5, 10 550 450 21 36000
25–27 ZnO/Al2O3(N) 10 450, 650, 750 450 21 36000

8/4/2019 Removal of Trichloroethylene Using ZnO_Al2O3 Catalyst
http://slidepdf.com/reader/full/removal-of-trichloroethylene-using-znoal2o3-catalyst 4/9
J.-C. Chen, C.-T. Tang / Journal of Hazardous Materials 142 (2007) 88–96 91
to prevent the interference of moisture. The compositions and
relative amounts of elements on the surface of catalyst were
determined by an energy dispersive spectroscopy (EDS, LINK:
exLII) with a Kevex superdry detector. In addition, the prepared
catalysts were also analyzed by the electron spectroscopy for
chemical analysis system (ESCA, VG Scientific: ESCALAB
250) using Mg K (hν = 1253.6 eV) as the radiation source to
confirm their chemical compositions.
3. Results and discussions
3.1. Characteristics of granular ZnO/Al2O3 catalyst
The characteristics of granular ZnO/Al2O3 catalyst prepared
by modified oil-drop sol–gel process and incipient wetness
impregnation method was measured before the activity test.
Table 2 indicates that the BET surface areas of fresh Al2O3
support, ZnO/Al2O3(O) and ZnO/Al2O3(N) catalysts are 386.8,
Table 2
BET surface area of ZnO/Al2O3 catalyst
Catalyst BET surface area (m2 /g)
Al2O3 (support) 386.8
ZnO/Al2O3(O) (fresh) 297.0
1% ZnO/Al2O3(N) (fresh) 209.3
5% ZnO/Al2O3(N) (fresh) 201.0
ZnO/Al2O3(N) (30 ◦C reacted) 368.0
ZnO/Al2O3(N) (150 ◦C reacted) 173.3
ZnO/Al2O3(N) (250 ◦C reacted) 187.5
ZnO/Al2O3(N) (350 ◦C reacted) 187.9
ZnO/Al2O3(N) (450 ◦C reacted) 171.3
297 and 209.3 m2 g−1, respectively. The surface area of fresh
Al2O3 support is greater than that of general commercial sup-
port, but is decreasedafter the impregnation of active metal ZnO.
The surface area of ZnO/Al2O3(O) catalyst is greater than that
of ZnO/Al2O3(N), implying that using nano-ZnO powder as
the precursor of active metal is better than Zn(NO 3)2 for the
preparation of ZnO/Al2O3 catalyst. This result can be illus-trated by the SEM micrographs of fresh ZnO/Al2O3(N) and
ZnO/Al2O3(O) catalysts (Fig. 2). The surface and pore distribu-
tions of fresh ZnO/Al2O3(N) catalyst are smooth and clogged,
while the surface of fresh ZnO/Al2O3(O) catalyst is porous and
uniform. Fig. 3 shows the EDS spectra of fresh Al2O3 support,
ZnO/Al2O3(N) and ZnO/Al2O3(O) catalysts. The result illus-
trates that aluminum and zinc are the major elements in the
ZnO/Al2O3(N) and ZnO/Al2O3(O) catalysts, and indicates that
the catalysts are not contaminated with other elements during
the preparation processes.
To confirm the chemical composition of active metals in the
ZnO/Al2O3 catalyst, the electron spectroscopy spectra of gran-
ular catalysts are provided in Fig. 4. The binding energies of Zn 2p3/2, Zn 2p1/2 and O 1s are 1019.9, 1042.70 and 530.5 eV,
respectively. They are identical to the standard spectra of Zn2+
and O2− [15–17]. ZnO is therefore proved to be the major active
species in the catalyst. There is no peaks for N 1s (398.8 eV) and
Zn3N2 observed in the XPS spectra of ZnO/Al2O3(N) catalyst,
because the catalyst is prepared at low nitride concentrations (1,
5 and 10%) and the corresponding N concentrations are very low
(0.34, 1.7 and 3.4%) and the catalyst is calcined in air at 550 ◦C
for 6 h to completely convert the zinc nitride into zinc oxide.
This can be proved from the analyses results that no N peak is
found in SEM/EDS spectra and no Zn3N2 or Zn(NO3)2 peak
Fig. 2. SEM micrographs of ZnO/Al2O3(N) and ZnO/Al2O3(O) catalysts (fresh and reacted).

8/4/2019 Removal of Trichloroethylene Using ZnO_Al2O3 Catalyst
http://slidepdf.com/reader/full/removal-of-trichloroethylene-using-znoal2o3-catalyst 5/9
92 J.-C. Chen, C.-T. Tang / Journal of Hazardous Materials 142 (2007) 88–96
Fig. 3. EDS spectra of fresh Al2O3 support and ZnO/Al2O3 catalysts.
is found in XRPD spectra. On the other hand, the O 1s peak in
the XPS spectra is smooth, symmetrical and locates at 530.5 eV
for ZnO/Al2O3(O) and 531.0eV for ZnO/Al2O3(N). The O 1s
peak at 530.5 eV for ZnO/Al2O3(O) is attributed to Zn–O bonds
because this value is in good agreement with previous refer-
ences [16–18]. The O 1s peak at 531.0 eV for ZnO/Al2O3(N)
shifts 0.5 eV toward higher binging energy side from the O 1s
peak for Zn–O bonds. This shows that few O–H bonds may beformed due to absorbed H2O molecules on the catalyst [18].
3.2. Effect of different catalyst preparation conditions
3.2.1. Different active metal precursors
Fig. 5 shows the conversions of TCE by different
ZnO/Al2O3(N) and ZnO/Al2O3(O) catalysts at different oper-
ation temperature. The other operation conditions were identi-
cal: TCE 450 ppm, oxygen 21%, operation temperature 450◦C
and space velocity 36,000 h−1. Without catalyst (blank test),
the conversion of TCE is slightly increased with the increase
of operation temperature and is only 13% at 450◦
C. As the
ZnO/Al2O3(N) and ZnO/Al2O3(O) catalysts are present, the
conversions of TCE are improved, especially at the opera-
tion temperature of 450 ◦C. The performance of ZnO/Al2O3(N)
catalyst is slightly better than that of ZnO/Al2O3(O) as the
operation temperature is higher than 250 ◦C. The best con-
version of TCE by ZnO/Al2O3(N) catalyst is 94% at 450 ◦C.
From the FT-IR spectra of reaction products (Fig. 6), the
peaks of CO and HCl can be observed besides the majorcompound TCE. The peak of CO emitted from the catalytic
incineration of TCE at 450◦C by ZnO/Al2O3(O) is higher
than that by ZnO/Al2O3(N). Because CO is a major byprod-
uct of incomplete oxidation of hydrocarbons, the higher con-
centration of CO means a lower catalytic activity. Therefore,
both ZnO/Al2O3(N) and ZnO/Al2O3(O) catalysts have catalytic
activities for TCE decomposition and ZnO/Al2O3(N) is better
than ZnO/Al2O3(O).
3.2.2. Different concentrations of active metal
Fig. 7 shows the conversions of TCE by ZnO/Al2O3(N) cata-
lyst with different concentrations of active metal (1, 5 and 10%).

8/4/2019 Removal of Trichloroethylene Using ZnO_Al2O3 Catalyst
http://slidepdf.com/reader/full/removal-of-trichloroethylene-using-znoal2o3-catalyst 6/9
J.-C. Chen, C.-T. Tang / Journal of Hazardous Materials 142 (2007) 88–96 93
Fig. 4. ESCA spectra of ZnO/Al2O3(O) catalyst: (a) Zn 2p and (b) O 1s.
Fig. 5. Conversions of TCE by ZnO/Al2O3(O) catalysts at different operation
temperatures.
Fig. 6. FT-IR spectra for the effluent reaction products.
Fig. 7. Conversions of TCE by ZnO/Al2O3(N) catalysts with different concen-
trations of active metal.
The operation temperature and space velocity were all controlled
at 450 ◦C and 36,000 h−1, respectively. The conversions of TCE
by granular catalysts coated with 5 and 10% active metal (ZnO)
aresimilar andboth arehigher than 96%. The conversion of TCE
by the catalyst coated with 1% ZnO is lower than 60%. More
active metal coated on the support of catalyst is supposed to pro-
vide more reaction sites for catalytic decomposition of TCE gas.On the other hand, the BET surface areas of the ZnO/Al2O3(N)
catalysts coated with 1, 5 and 10% ZnO are 209.3, 201 and
195.5 m2 g−1, respectively. The BET surface area of catalyst is
slightly decreased as the concentration of active metal increased.
Catalyst coated with too much active metal will block its sur-
face area and is more expensive. Therefore, the granular catalyst
coated with 5% active metal is considered to be the effective and
economic one in our experiment.
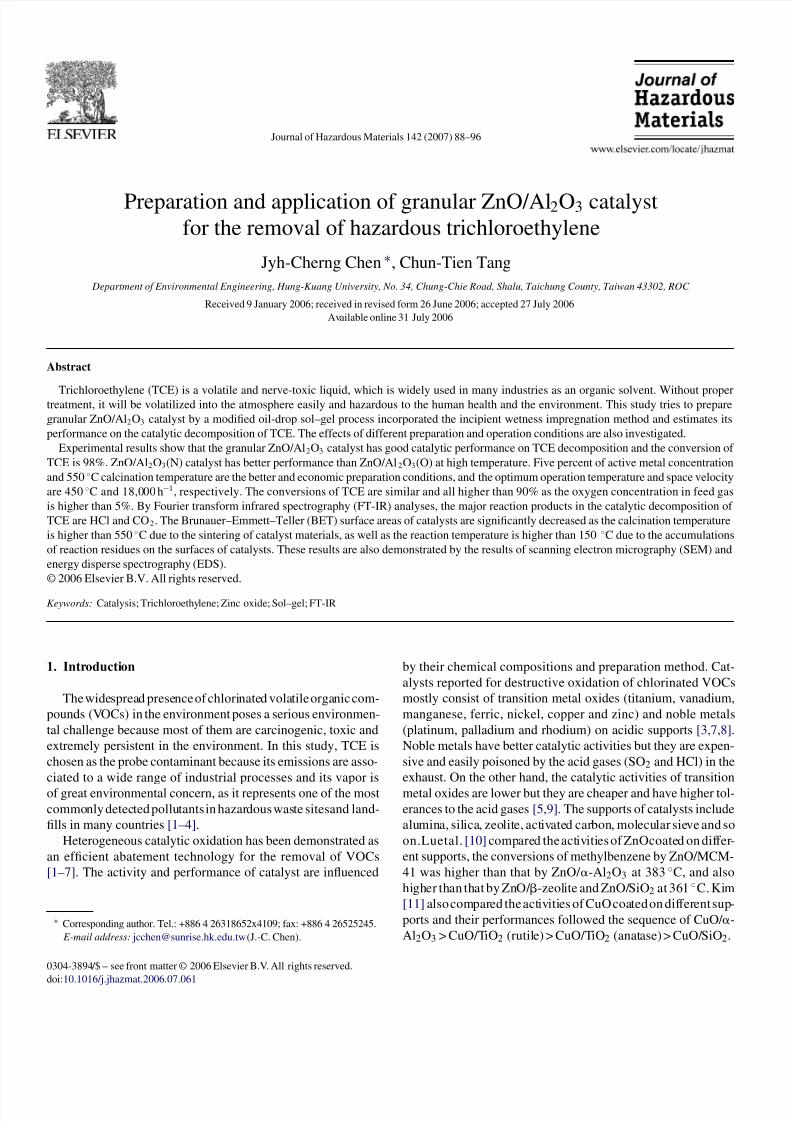
3.2.3. Different calcination temperatures
Fig. 8 shows the conversions of TCE by ZnO/Al2O3(N) cat-
alyst prepared at different calcination temperatures (450, 550,650 and 750 ◦C). The other operation conditions are identical.
ZnO/Al2O3(N) catalyst prepared at the calcination temperature
of 550 ◦C has better performance. Calcination temperature can
influence the characteristic of active metal, and the porosity and
surface areas of catalysts [10,13,14,17]. This result can also be
illustrated by the SEM micrographs in Fig. 9. The surface mor-
phology of ZnO/Al2O3(N) catalyst calcined at 550 ◦C has more
and uniform porosity than that at 450 and 650 ◦C. Moreover,
the surface of ZnO/Al2O3(N) catalyst is sintered and melted at
higher calcination temperatures 650 and 750 ◦C.
Fig. 8. Conversions of TCE by ZnO/Al2O3(N) catalysts prepared at different
calcination temperatures.
8/4/2019 Removal of Trichloroethylene Using ZnO_Al2O3 Catalyst
http://slidepdf.com/reader/full/removal-of-trichloroethylene-using-znoal2o3-catalyst 7/9
94 J.-C. Chen, C.-T. Tang / Journal of Hazardous Materials 142 (2007) 88–96
Fig. 9. SEM micrographs of ZnO/Al2O3(N) catalysts prepared at different calcinations temperatures.
3.3. Effect of different catalytic reaction conditions
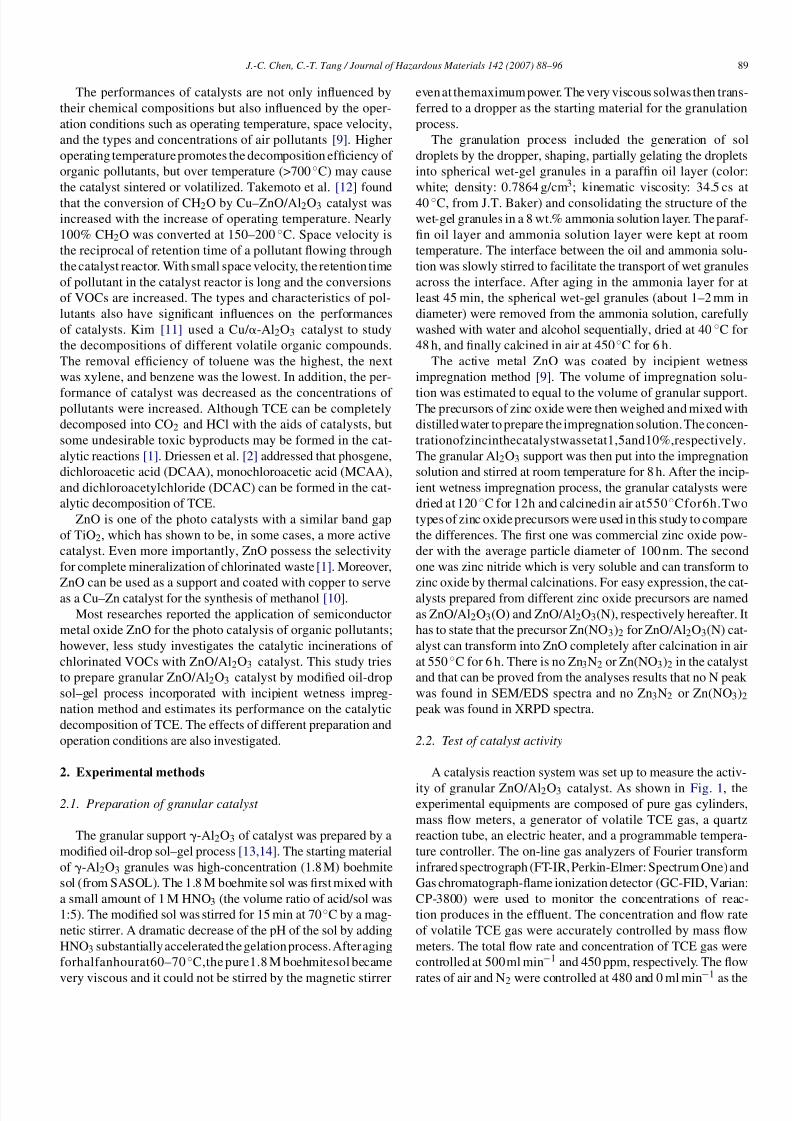
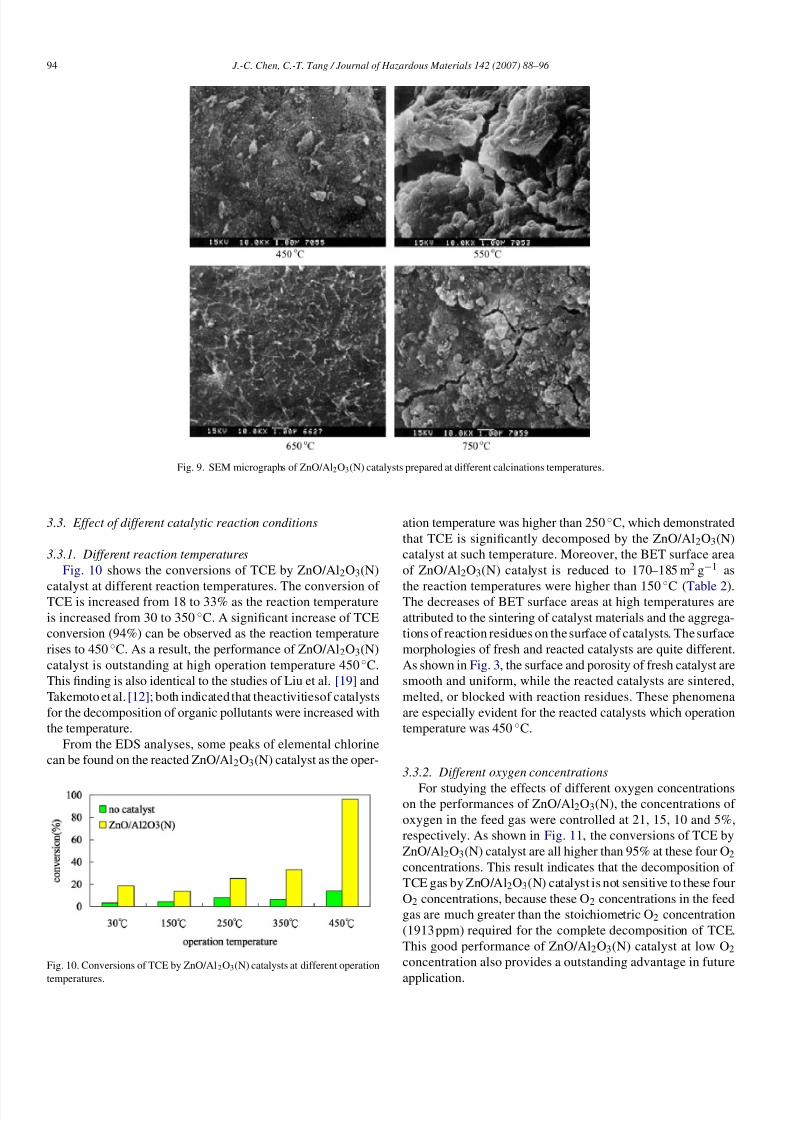
3.3.1. Different reaction temperatures
Fig. 10 shows the conversions of TCE by ZnO/Al2O3(N)
catalyst at different reaction temperatures. The conversion of TCE is increased from 18 to 33% as the reaction temperature
is increased from 30 to 350 ◦C. A significant increase of TCE
conversion (94%) can be observed as the reaction temperature
rises to 450 ◦C. As a result, the performance of ZnO/Al2O3(N)
catalyst is outstanding at high operation temperature 450 ◦C.
This finding is also identical to the studies of Liu et al. [19] and
Takemoto et al. [12]; both indicated that theactivitiesof catalysts
for the decomposition of organic pollutants were increased with
the temperature.
From the EDS analyses, some peaks of elemental chlorine
can be found on the reacted ZnO/Al2O3(N) catalyst as the oper-
Fig. 10. Conversions of TCE by ZnO/Al2O3(N) catalysts at different operation
temperatures.
ation temperature was higher than 250 ◦C, which demonstrated
that TCE is significantly decomposed by the ZnO/Al2O3(N)
catalyst at such temperature. Moreover, the BET surface area
of ZnO/Al2O3(N) catalyst is reduced to 170–185 m2 g−1 as
the reaction temperatures were higher than 150◦
C (Table 2).The decreases of BET surface areas at high temperatures are
attributed to the sintering of catalyst materials and the aggrega-
tions of reaction residues on the surface of catalysts. The surface
morphologies of fresh and reacted catalysts are quite different.
As shown in Fig. 3, the surface and porosity of fresh catalyst are
smooth and uniform, while the reacted catalysts are sintered,
melted, or blocked with reaction residues. These phenomena
are especially evident for the reacted catalysts which operation
temperature was 450 ◦C.
3.3.2. Different oxygen concentrations
For studying the effects of different oxygen concentrationson the performances of ZnO/Al2O3(N), the concentrations of
oxygen in the feed gas were controlled at 21, 15, 10 and 5%,
respectively. As shown in Fig. 11, the conversions of TCE by
ZnO/Al2O3(N) catalyst are all higher than 95% at these four O2
concentrations. This result indicates that the decomposition of
TCE gas by ZnO/Al2O3(N) catalyst is not sensitive to these four
O2 concentrations, because these O2 concentrations in the feed
gas are much greater than the stoichiometric O2 concentration
(1913 ppm) required for the complete decomposition of TCE.
This good performance of ZnO/Al2O3(N) catalyst at low O2
concentration also provides a outstanding advantage in future
application.

8/4/2019 Removal of Trichloroethylene Using ZnO_Al2O3 Catalyst
http://slidepdf.com/reader/full/removal-of-trichloroethylene-using-znoal2o3-catalyst 8/9
J.-C. Chen, C.-T. Tang / Journal of Hazardous Materials 142 (2007) 88–96 95
Fig. 11. Conversions of TCE by ZnO/Al2O3(N) catalyst at different oxygen
concentrations.
Fig. 12. Conversions of TCE by ZnO/Al2O3(N) catalysts at different space
velocities.
3.3.3. Different space velocities
The conversions of TCE at different space velocities (72,000,
36,000, 18,000 and 12,000h−1) are shown in Fig. 12. The
best conversion of TCE (98%) is occurred at space velocity
18,000 h−1, the next is 72,000 h−1 (97%), 36,000 h−1 (96%),
and the last is 12,000 h−1 (85%). Decreasing space velocityincreases the retention time of TCE gas in the catalyst bed and
the conversion of TCE increases, but our results show that the
conversion of TCEat space velocity 12,000 h−1 is the least. This
phenomenon can be interpreted from the FT-IR spectra of reac-
tion products. As shown in Fig. 13, the peak intensities of CO
and HCl become higher and lower, respectively, as the space
Fig. 13. FT-IR spectra for the effluent reaction products at differentspace veloc-
ities.
velocities are decreased from 72,000 to 12,000 h−1. The higher
concentrations of CO in the effluent gas indicate that the cat-
alytic decomposition of TCE is not complete. Some residues
are accumulated on the surface of catalyst and the performance
of catalyst decreases.
4. Conclusion
This study tries to prepare granular ZnO/Al2O3 catalysts for
the catalytic incineration of hazardous TCE gas. The effects
of different preparation and operation conditions on the perfor-
mances of catalysts are also investigated. Experimental results
show that the granular ZnO/Al2O3 catalyst has good catalytic
activities on TCE decomposition and the conversion of TCE
is 98%. ZnO/Al2O3(N) catalyst has better performance than
ZnO/Al2O3(O) at high operation temperature. Five percent of
active metal concentration and 550 ◦C calcination temperature
are the better and economic preparation conditions, and the opti-
mum operation temperature and space velocity are 450 ◦C and
18,000 h−1, respectively. The conversions of TCE are similar
and all higher than 90% at these four O2 concentrations in the
feed gas. By FT-IR measurement, the major reaction products
during catalytic decomposition of TCE are HCl and CO2. The
BET surface areas of catalysts are significantly decreased as
the calcinations temperature is higher than 550 ◦C due to the
sintering of catalyst materials and as the reaction temperature is
higher than 150◦C due to the accumulations of reaction residues
on the surfaces of catalysts. These results are also demonstrated
by SEM micrographs and EDS spectra.
References
[1] P.B. Amama, K. Itoh, M. Murabayashi, Photocatalytic oxidation of
trichloroethylene in humidified atmosphere, J. Mol. Catal. A 176 (2001)
165–172.
[2] M.D. Driessen, T.M. Miller, V.H. Grassian, Photocatalytic oxidation of
trichloroethylene on zincoxide: characterization of surface-boundand gas-
phase products and intermediates with FT-IR spectroscopy, J. Mol. Catal.
A 131 (1998) 149–156.
[3] J.R. GonzaAlez-Velasco, A. Aranzabal, J.I. GutieArrez-Ortiz, R. LoApez-
Fonseca, M.A. GutieArrez-Ortiz, Activity and product distribution of alu-
minasupportedplatinumand palladiumcatalysts in the gas-phaseoxidative
decomposition of chlorinated hydrocarbons, Appl. Catal. B 19 (1998)
189–197.
[4] S. Kawi, M. Te, MCM-48 supported chromium catalyst for trichloroethy-
lene oxidation, Catal. Today 44 (1998) 101–109.[5] P.B. Amama, K. Itoh, M. Murabayashi, Gas-phase photocatalytic degra-
dation of trichloroethylene on pretreated TiO2, Appl. Catal. B 37 (2002)
321–330.
[6] G.A. Atwooda, H.L. Greenea, P. Chintawarb, R. Rachapudib, B.
Ramachandranb, C.A. Vogelc, Trichloroethylene sorption and oxidation
using a dual function sorbent/catalyst in a falling furnace reactor, Appl.
Catal. B 18 (1998) 51–61.
[7] M.M.R. Feijen-Jeurissen, J.J. Jorna, B.E. Nieuwenhuys, G. Sinquin,
C. Petit, J.P. Hindermann, Mechanism of catalytic destruction of 1,2-
dichloroethane and trichloroethylene over-Al2O3 and-Al2O3 supported
chromium and palladium catalysts, Catal. Today 54 (1999) 65–79.
[8] C. Lahousse, A. Bernier, P. Grange, B. Delmon, P. Papaefthimiou, T. Ioan-
nides, X. Verykios, Evaluation of -Al2O3–MnO2 as a VOC removal
catalyst: comparison with a noble metal catalyst, J. Catal. 178 (1998)
214–225.

8/4/2019 Removal of Trichloroethylene Using ZnO_Al2O3 Catalyst
http://slidepdf.com/reader/full/removal-of-trichloroethylene-using-znoal2o3-catalyst 9/9
96 J.-C. Chen, C.-T. Tang / Journal of Hazardous Materials 142 (2007) 88–96
[9] J.C. Chen, M.Y. Wey, C.L. Yeh, Y.S. Liang, Simultaneous treatment of
organic compounds, CO and NO x in the incineration flue gas by three-way
catalyst, Appl. Catal. B 48 (2004) 25–35.
[10] W. Lu, G.Z. Lu, Y. Luo, A. Chen, A novel preparation method of
ZnO/MCM-41 for hydrogenation of methyl benzoate, J. Mol. Catal. A
188 (2002) 225–231.
[11] S.C. Kim, The catalytic oxidation of aromatic hydrocarbons
over supported metal oxide, J. Hazard. Mater. 91 (2002) 285–
299.[12] T.Takemoto, D. He, Y. Teng,A. Nakayama,K. Tabata, E. Suzuki, Enhance-
ment of methanol selectivity in the products of direct selective oxidation
of methane in CH4−O2–NO with Cu–ZnO/Al2O3, J. Catal. 198 (2001)
109–115.
[13] Z.M. Wang, Y.S. Lin, Sol–gel synthesis of pure and copper oxide
coated mesoporous alumina granular particles, J. Catal. 174 (1998)
43–51.
[14] G. Buelna, Y.S. Lin, Preparation of spherical alumina and copper oxide
coated alumina sorbents by improved sol–gel granulation process, Micro-
por. Mesopor. Mater. 42 (2001) 67–76.
[15] C.D. Wagner, W.M. Riggs, J.F. Moulder, G.E. Muilenberg, Handbook of
X-ray Photoelectron Spectroscopy, Perkin-Elmer Corporation, Physical
Electronic Division, USA, 1979, p. 321.
[16] L. Jing, B. Wang, B. X, S. Li, K. Shi, W. Cai, H. Fu, Investigations on the
surface modification of ZnO nanoparticle photocatalyst by depositing Pd,
J. Solid State Chem. 177 (2004) 4221–4227.[17] Y. Liu, Z. Liu, G. Wang, Synthesis and characterization of ZnO nanorods,
J. Cryst. Growth 252 (2003) 213–218.
[18] M. Futsuhara, K. Yoshioka, O. Takai, Optical properties of zinc oxynitride
thin films, Thin Solid Films 317 (1998) 322–325.
[19] Y. Liu, Z. Wei, Z. Feng, M. Luo, P. Ying, C. Li, Oxidative destruc-
tion of chlorobenzene and o-dichlorobenzene on a highly active catalyst:
MnO x /TiO2–Al2O3, J. Catal. 202 (2001) 200–204.


