
Report: Assessing the San Juan Bay Estuary Program’s Vulnerabilities to Climate Change
September 2013

Assessing the San Juan Bay Estuary Program’s Vulnerabilities to Climate Change
Report Prepared by:
Kasey R. Jacobs and Angela Isabel Pérez
September 30, 2013
Photo Credits: San Juan Bay Estuary Program, multiple years
Acknowledgements:
We would like to express our special thanks of gratitude to all that helped complete the vulnerability
assessment from initial stages to review. Because of the in-depth discussions during formal and
informal meetings and workshops we were able to provide a level of detail not anticipated nor required
by the Climate Ready Estuaries Workbook. A big thanks to Club Nautico, Corporación Piñones Se
Integra Integrates (COPI), and the Coliseum of Puerto Rico for hosting the community meetings. We
greatly appreciate the help of Michael Craghan and Ashley Brosius at the EPA’s National Estuary
Program, Dr. Pablo Mendez-Lazaro of the University of Puerto Rico, Gladys Rivera of the EPA’s
Caribbean Environmental Protection Division, and others. And finally, thank you to the San Juan Bay
Estuary Program and staff for your determination to be an organization at the forefront of helping
communities confront climate change.
Contents Introduction ............................................................................................................................................. 4
Methods ................................................................................................................................................... 7
Guidebook steps ..................................................................................................................................... 8
Workshops .............................................................................................................................................. 9
Peer-Review .......................................................................................................................................... 10
Additions to EPA’s Draft CRE Guidebook ........................................................................................... 11
Results from Steps 1 to 5 of the CRE Guidebook ............................................................................ 12 CRE Guidebook Step 1: Communication and Consultation ............................................................... 12
CRE Guidebook Step 2: Establishing the Context .............................................................................. 14 CRE Guidebook Step 3: Risk Identification ....................................................................................... 16 CRE Guidebook Step 4: Risk Analysis ............................................................................................... 28
CRE Guidebook Step 5: Risk Evaluation/Risk Matrices .................................................................... 28
Risk Matrices for Step 5
POLLUTION CONTROL: Point Source and Non-Point Source ................................................... 29
ESTUARY HABITAT: Habitat, Fish & Wildlife ............................................................................ 33
ANIMALS & PLANTS: Habitat, Fish & Wildlife ......................................................................... 36
HUMAN USES ............................................................................................................................... 39
Introduction
The San Juan Bay Estuary is a coastal area where freshwater flowing from rivers and streams mixes
with salt water in the Estuary’s bays, lagoons, and channels, and ultimately, the ocean. The Estuary co-
vers a 242 square kilometer area, and includes nine major water bodies, namely: San Juan Bay,
Condado Lagoon, San Jose Lagoon, Los Corozos Lagoon (connects directly to San Jose Lagoon), La
Torrilla or Torrecilla Lagoon, the Martin Pena and San Antonia(o) Channels, the Suarez Canal, and
Piñones Lagoon. The San Juan Bay Estuary provides valuable resources to the region and the island of
Puerto Rico.
The Estuary supports a busy port, and is home to attractive beaches, parks, natural areas, and recrea-
tional fishing resources. The Estuary is also uniquely tropical, having features including coral commu-
nities, seagrass beds, and mangrove forests. However, the needs of an increasing population and a
growing economy have resulted in degradation and destruction of many components of the San Juan
Bay Estuary. As a result of its uniqueness and the threats to its health, the Governor of Puerto Rico
nominated the San Juan Bay Estuary to the United States Environmental Protection Agency’s (EPA)
National Estuary Program (NEP). The Estuary was recognized as an Estuary of National Significance
and added to NEP by EPA in 1992. A Comprehensive Conservation and Management Plan (CCMP)
that focuses on problems and potential actions to improve the quality of the Estuary was signed by the
Governor and EPA Administrator in 1993, the CCMP was updated in 2000 and most recently in 2013.
The Comprehensive Conservation and Management Plan (CCMP) for the San Juan Bay Estuary
(SJBE) have identified several goals and approaches to achieve better environmental health within this
estuary. Among the proposed activities, cleanup and dredging of the Martín Peña Channel (CCMP Ac-
tion WS-5), filling of the deep holes in San Jose and Condado Lagoons caused by dredging (CCMP
Actions HW-2 and WS-6), and minimization of untreated sewage inputs from point and non-point
sources (CCMP Actions WS-1, WS-3, and WS-4) emerge as some of the priorities of the CCMP. It is
expected that the combined effects of these measures will enhance the water quality of the SJBE.
As highlighted in the 2013 update, the threats to the San Juan Bay Estuary and the SJBE Program’s
objectives might be exacerbated due to the new challenge of climate change. Globally, the past three
decades have been the warmest since temperatures started being measured systematically in 1850 and
reliable records maintained, reflecting an average increase of 1° C (5° F) for the period between 1900
and 2010. According to the Intergovernmental Panel on Climate Change (IPCC) global temperatures
have increased an average of 0.74° C (1.35 ° F) since 1906 and are expected to rise another 1.4° C (1.8
- 7.2 ° F) at the end of the 21st century, depending on the amount of greenhouse gas emissions released
into the atmosphere by energy and land use practices in the future. Temperature increases and changes
in carbon dioxide concentrations in the atmosphere are causing rainfall patterns to change, the oceans
are becoming more acidic, sea levels are rising and extreme events are occurring more frequently
(PRCCC 2013).
Climate Ready Estuaries is a program that works with the National Estuary Programs (NEP) assessing
how the nation’s estuaries will respond to these climate changes and works to develop and implement
adaptation strategies, engage and educate stakeholders. The Climate Ready Estuaries (CRE) Program
provides information on climate change impacts in different estuaries in the region, provides the

platform for access to tools and resources to monitor changes, information to help people with
decision-making power to develop adaptation strategies for estuaries and coastal communities.
The NEP was established under Section 320 of the 1987 Clean Water Act (CWA) Amendments as a U.S.
Environmental Protection Agency (EPA) place-based program to protect and restore the water quality
and ecological integrity of estuaries of national significance. 2012 was the 25th anniversary of the
National Estuary Program (NEP) and marked the fifth year that EPA’s Climate Ready Estuaries has
supported climate change adaptation activities in NEP study areas.
CRE is currently in the process of developing a new tool, a CRE Workbook, titled: Climate Change
Risk Management: Preparing Vulnerability Assessments and Action Plans for Climate Adaptation.
The CRE Workbook helps meet the need for guidance on conducting vulnerability assessments,
provides decision-support tools, helps to address climate change adaptation, and builds the capacity of
local environmental managers. Creating the CRE Workbook helps EPA to fulfill the commitments that
the agency made to assist local organizations to effectively plan for climate change impacts. The CRE
Guidebook is designed as a step by step approach that will guide environmental managers through the
development of a broad assessment of climate change risks in their own places.
The objective of this project was to implement the draft protocol workbook for completing the San
Juan Bay Estuary Program’s climate change vulnerability assessment as a pilot project for the EPA
Office of Water. Throughout the process of working through the CRE guidance, recommendations were
sent to the EPA Office of Water through email and phone correspondences as well as through a
workshop with other NEP managers in Washington, DC in February 2013.
Climate change will bring more challenges to places and ecosystems that are already under
environmental pressures. The expected climate changes will worsen existing problems and bring new
problems too. The process described in the draft CRE Workbook leads you to take a broad look at how
climate change will affect your environmental system and your organization. The creation of a high
level, risk – based vulnerability assessment will help you develop an action plan that considers
cooperative solutions that your stakeholders and partners can help implement.
Managers who realize that climate change will affect the ability of their organization to meet its goals
will be incorporating climate change risks into their planning. The audience for this CRE Guidebook is
environmental professionals at organizations that look after environmental resources, especially
organizations with a coastal or watershed focus. The CRE Workbook presents an approach to climate
change adaptation planning based on EPA’s experience with watershed management, the National
Estuary Program, and the Climate Ready Estuaries program.
Planning for climate change impacts is a two-part process. In the first part—vulnerability
assessment—managers identify and assess the climate change risks that may be a threat to their
organizational goals. Part I is what the San Juan Bay Estuary Program piloted. The second part—
developing an action plan—uses the vulnerability assessment to set priorities and develop responses.
Ideally, adaptation responses will eliminate or reduce risks from climate change.
This Project was meant to start the SJBEP on the path to becoming a Climate Ready Estuary. The long-
term objective is to develop and implement climate change adaptation strategies. While not within the
scope of this Project the recommendations found at the end of this report offer a few related to
adaptation strategies based off the findings of this vulnerability assessment (Phase I of the CRE
Workbook). Conduct Phase II of the CRE Workbook would be one way of achieving a more

comprehensive review of adaptation options for the SJBEP.
The San Juan Bay Estuary Program (SJBEP) pays special attention to climate change impacts such as
erosion, invasive species, and floods among other impacts that affect estuarine communities. The
SJBEP has coordinated with scientists to inform citizens about the impacts of climate change. It is also
important to know what the perception of communities to these changes is why it's vital conducting a
vulnerability analysis to assess these risks before possible adaptation strategies. The SJBEP has a few
initiatives to inform the community about climate change for example educational display about
climate change, scientific investigations about sea level rise, water quality monitoring program and
climate change citizen guide. In 2008 this NEP conducted a face-to-face poll on this topic with over
800 participants, and launched the first climate-change public service campaign, for which several ads
were placed without cost through the Island’s newspapers and TV stations. In 2011, the SJBEP
joined the Sierra Club in its “Cool Cities” campaign, and printed a Spanish manual geared towards
reducing the carbon footprint of municipalities. Most recently, the SJBEP revised its Comprehensive
Conservation Management Plan to include several new actions on climate change and submitted a
proposal to join the NEP/USEPA Climate Ready Estuary1 (CRE) initiative. The proposal was approved
and the San Juan Bay Estuary chosen as the site to field test steps 1 through 5 of the new CRE
workbook.
1 Resources of CRE:
http://water.epa.gov/type/oceb/nep/index.cfm
http://water.epa.gov/type/oceb/cre/index.cfm
http://water.epa.gov/type/oceb/cre/upload/CRE_2012Report_122612a.pdf

Methods The methods used to complete this Pilot Project were to run through the CRE Workbook Steps 1-5
(described in next section), conduct workshops and meeting with stakeholders of the SJBEP, and
specifically consult and inform environmental justice communities of the estuary through workshops.
Here’s an outline of the steps and who took the lead for each.
Step 1: Communication and Consultation (SJBEP Staff and KJacobs)
o September 2012 Technical Stakeholder Workshop
o Informal meetings about process
Step 2: Establishing the context for the vulnerability assessment (KJacobs)
Step 3: Risk Identification
o Conduct Workshops (A.Isabel Pares with assistance of KJacobs)
o Compile table of identified risks, organized by SJBEP’s organizational goals and
objectives (KJacobs)
o Review of risk identification table with SJBEP staff, CRE staff, and other NEP Programs
(KJacobs)
o Provide recommendations to CRE
Step 4: Risk Analysis (KJacobs)
o Expand CREWorkbook Risk Analysis spreadsheet for SJBEP purposes
o Assess consequence, likelihood, spatial extent, and time scale for each identified risk
o Provide recommendations to CRE
o Review of risk analyses with researchers from University of Puerto Rico, SJBEP staff
and STAC, and Puerto Rico Climate Change Council members
Risk Evaluation/Comparing Risks (KJacobs, SJBEP Staff, A. Isabel Pares)
o Create consequence/probability matrix for all organizational goals and individual
matrices for each organizational goal
o Review of vulnerability assessment with researchers from University of Puerto Rico,
SJBEP staff and STAC, stakeholders, environmental justice communities, and Puerto
Rico Climate Change Council members
Guidebook steps Part 1: Vulnerability Assessments
Step 1: Communication and Consultation
Informing Key people about the vulnerability assessments and asking for input
Step 2: Establishing the context for the vulnerability assessment
Identifying organizational goals and objectives that are susceptible to climate change
Step 3: Risk Identification
Brainstorming about how climate stressors will impact with your goals and objectives
Step 4: Risk analysis
Developing an initial characterization of consequence and likelihood for each risk
Step 5: Risk Evaluation / Comparing Risks
Using a consequence/ probability matrix to reach consensus about each risk
Part2: Action Plan and Implementation
Step 6: Establishing the context for the action plan
Identifying the criteria you will use to make adaptation decisions
Step 7: Risk evaluation/ Deciding on a course
Deciding at a high level whether you will mitigate, transfer, avoid or accept each risk.
Step 8a: Develop a short list of adaptation actions
Scanning potential mitigating actions to identify ones of interest for further investigation
Step 8b: Asses effectiveness of adaptation action
Answering questions about the mitigating actions identified in step 8a
Step 9: Prepare and implement action plan
Creating a plan track mitigating actions and which risks they address
Step 10: Monitoring and review
Keeping track of the effectiveness of your adaptation actions

Workshops
An invitational workshop, Climate Change Vulnerability Assessment-San Juan Bay Estuary, was
conducted with 26 invited specialists from federal and local agencies, international and local non-
governmental organizations, university programs, a neighboring National Estuarine Research Reserve,
and the private sector in September 2012. The workshop described the CRE program, the draft
guidebook, and then through a hands-on workshop participants helped the SJBEP begin Step 3 – the
Risk Identification Process. The participants also provided recommendations to the SJBEP staff for the
continuation of the vulnerability assessment.
Three workshops with communities surrounding the estuary were
conducted to determine community values, concerns, observations and
insights of climate change-related issues. Two of the workshops were
specific to environmental justice communities living around the estuary.
The workshop programs included the following:
Climate Change 101 presentation describing the science, the
global impacts, the island-wide Puerto Rico impacts, and se-
lected risks to the estuary area as determined by the initial risk
identification (Step 3).
Open discussion questions to collect pre-determined information
from the participants to inform Step 4 of the CRE Guidebook.
“Live polling” where each participant was given a handset and the opportunity to vote in-
stantly on a number of specific questions to assist with the Step 4 of the CRE Guidebook.
The results of the live polling were immediately presented to the group in order to encour-
age more in-depth group discussions.
The presentation’s agenda was:
1)Welcome and explanation of Climate Ready Estuaries initiative
2) Presentation- Current and Future Climate Risks in Puerto Rico and San Juan Bay Estuary Program
3)Section of questions to identify risks and vulnerabilities
4)Collective Discussion (set concerns and perceptions about how climate change affects the community)
One-on-one consultations with conducted throughout the process. The expert list to consult was
comprised of members from the Puerto Rico Climate Change Council (PRCCC) and from relevant
agencies and university programs.
Some of the questions that were conducted at community meetings were:
1) What event affects your business activities or your daily life? The majority of people answered that
stronger precipitation events affects business and everyday lifestyle.
2) Most people agree that the beach erosion is affecting daily activities and business
3) The main concern people have as an individual to the impacts of climate change is private property
and yet the main concern for the community are the natural barriers.
Community meetings helped us know how the communities perceive the impacts of climate change on
their community and also give us information about their concerns as a community and as individuals.
A flyer from one of the SJBEP workshops
(in Spanish).
Translation: Workshop for the Evaluation
of Risks in the Communities of the San
Juan Bay Estuary

Questions used for open discussion questions and “live polling” were:
What assets are the most important to your community? (a) value of the coast; (b) community identity;
(c) culture; (d) economy; (e) health
Which of these impacts caused by climate change would cause major economic loss, social or
environmental? (a) effects on flora and fauna; (b) infrastructure loss; (c) effects on the coast; (d) effects
on public health
What environmental problems already exist in your community?
(a) Wastewater discharges
(b) Erosion
(c) Floods
(d) Contamination
(e) Waste management
(f) Health
(g) Infrastructure maintenance
(h) Drinking water services
(i) Electric services
(j) Other(s)?
Are the following events already occurring or going to occur in the future?
Fish kills; Water contamination; Days with intense heat affecting your activities or businesses;
Desirable fish species moving out of the area for more suitable habitat; Coastal erosion affecting your
business or activities; More common occurrences of jellyfish.
Choose the principal concern that you have for your home, community or business with climate change
impacts. Impacts to:
natural characteristics that protect the coast; wildlife in the estuary; private property structures; public
buildings and facilities; transportation (bridges, roads, ports); energy generation infrastructure; water
storage and services; historical and cultural resources.
Peer-Review Each step of the process included consultation before moving on to the next step, but the most intensive
peer-review came after the risk analysis. With 167 risks identified a peer review for each individual
analysis was not possible, however, the analyses with the lowest confidence or the organizational
objectives with the highest engaged reviewers received an in-depth peer review through one-on-review
sessions. After completion of this report it is planned to have a formal review with the full SJBEP
Scientific and Technical Advisory Committee before determining distribution and outreach of the
vulnerability assessment results.
Additions to EPA’s Draft CRE Guidebook
The SJBEP process we went through were the same as laid out in the CRE Guidebook (steps 1-5) with
a few modifications we adopted and communicated to the EPA CRE office throughout the process via
email, phone calls and in-person workshop in Washington, DC with National Estuary Program staff and
managers from the other NEP programs.
The principal modification made was to put a strong emphasis on engaging the environmental justice
communities that live and work around the bay, lagoons, and canals of the estuary system. Engaged
occurred via the workshops and individual conversations, including field visits to Caño Martin Peña
Communities, fishermen in the lagoons, and forest managers in the Piñones State Forest. These
discussions with the estuary communities were particularly productive as we were able to listen and
learn from the experiences and opinions of those who live in different parts of the estuary system. All
communities reported that contaminated water and inundations were already greatly affecting the
activities of families and businesses. Some were able to tell stories of past hurricane events and how
their communities were isolated due to flooding or did not have electricity for as much as six months.
This information was then used to inform the risk analysis and risk evaluation steps.
In the original draft CRE it was not advised to look for and utilize if possible previously conducted
state or regional vulnerability assessments. Because of the SJBEP’s active participation in the Puerto
Rico Climate Change Council (PRCCC) we drew heavily from the State of the Climate Report 2010-
20132 for the risk identification and analysis. In the supplemental risk analysis excel spreadsheet each
risk analysis identifies whether the risk came from the EPA guidebook, the PRCCC or one of the
workshops. And for certain risks, the scientific source/ confidence level cites the PRCCC report.
Additionally, we added three columns to risk analysis spreadsheet that were not included in the CRE
Workbook: “where was risk identified?”, “mentioned in community workshops (Y/N)”, “notes”, and
we changed source/confidence to “scientific source/confidence”.
2 http://drna.gobierno.pr/oficinas/arn/recursosvivientes/costasreservasrefugios/pmzc/prccc/prccc

Results from Steps 1 to 5 of the CRE Guidebook
CRE Guidebook Step 1: Communication and Consultation
Objective of this step
The objective of this step is to list your key stakeholders and their particular interest or concerns
regarding climate change risks and the vulnerability assessment process. This step will also help you
identify communication schedules.
At the beginning of the risk management process, it is important to communicate to stakeholders the
purpose of the vulnerability assessment and the level of involvement you are requesting of them. It is
also important that decision makers within your organization understand what you are trying to
accomplish and the expected outcomes of this process. Some groups may be involved throughout the
entire process, while others may have a particular interest in a single step or area of focus.
Stakeholder Issue/Area of Focus When should/did they
become involved?
Angel Dieppa, Jobos
Bay NERR
September workshop
Benito Pinto, La
Regata
Recreational/Navigation/Fishing September workshop
Craig Lilyestrom,
DNER
Marine Resources/Fisheries September workshop
David Cuevas, EPA Water resources September workshop
Ernesto Diaz, DNER-
PRCZMP
Coastal hazards, development,
nonpoint and point sources of
pollution, public access
September workshop
Ernesto Olivares,
SJBEP
Enforcement September workshop
Evelyn Huertas, EPA September workshop
Gustavo Garcia,
SJBEP and DNER
Assistant to Secretary
Public Policy September workshop
Jorge Bauza, SJBEP ALL September workshop
Jose Rivera, NOAA September workshop
Jose Seguinot Barbosa Public health, water quality September workshop
Julio Morell,
CariCOOS
Monitoring, modeling and data
management
September workshop
Katia Aviles, Proyecto
ENLACE
Environmental justice communities,
health, water quality, recreation,
fisheries, marine resources
September workshop

Luis Jorge Herrera,
IDS
September workshop
Luis Soler, USGS September workshop
Pablo Mendez,
UPR/SJBEP
September workshop
Pedro Diaz, USGS Monitoring September workshop
Pedro Gelabert,
SJBEP
ALL September workshop
Pedro Guevara, JCA Water quality September workshop
Ray David Rodriguez,
Fideicomiso
September workshop
Raimundo Espinosa,
TNC
September workshop
Vance Vicente September workshop
Jorge Ortiz Zayas,
UPR-ITES
September workshop
Ernesto Otero,
RUM_CIMA
September workshop
Angel Melendez, JCA Water quality September workshop
Jose Juan Terrasa,
Turismo
Recreation, coastal hazards, marine
resources
September workshop

CRE Guidebook Step 2: Establishing the Context
Objective of this step
The objective of this step is to identify your organizational objectives to establish the context of your
vulnerability assessment.
Source: San Juan Bay Estuary Program’s Management Plan July 2000
Notes – relevant to CRE Guidebook
Goals of the Program:
Establish a comprehensive water quality policy. This policy will ensure the integrity of marine
resources and terrestrial ecosystems while supporting human activities in the SJBE system.
Develop an effective administrative and regulatory framework for the SJBE system that will
serve as a model for other estuary systems, especially for tropical systems.
Optimize the social, economic, and recreational benefits, which have been associated with the
SJBEP system
Prevent further degradation and improve the system’s water quality to help ensure healthy ter-
restrial and aquatic communities and social well-being
Minimize the health risks associated with direct human contact with the surface waters and the
consumption of fish and shellfish
Objectives of the SBJEP:
Identify the major stressors impacting the system and establish their relative importance
Develop action plans to remediate the problems identified in the system
Conserve and enhance the integrity of the known, highly valuable natural resources in the SJBE
system, and restore, to the extent
possible, those areas which have
been adversely impacted
Address the major concerns of the
citizens and user groups have regard-
ing the quality of the system
Promote the public’s awareness re-
garding estuarine resources and in-
volvement in the development of an
effective management plan for the
system
Develop a hydrological model of the system to determine effective alternatives to improve cir-
culation and predict hdydrological impacts of future development (pg. 15)
Themes of Clean Water Act §320, and
the Estuary and Clean Waters Act of
2000 (from CRE Guidebook)
Control point and nonpoint sources
of pollution and clean up of pollu-
tion
Maintain and improve estuarine hab-
itat
Protect and propagate fish, shellfish,
and wildlife, including control of
nonnative species
Protect public water supplies and
recreational activities, in and on the
water.
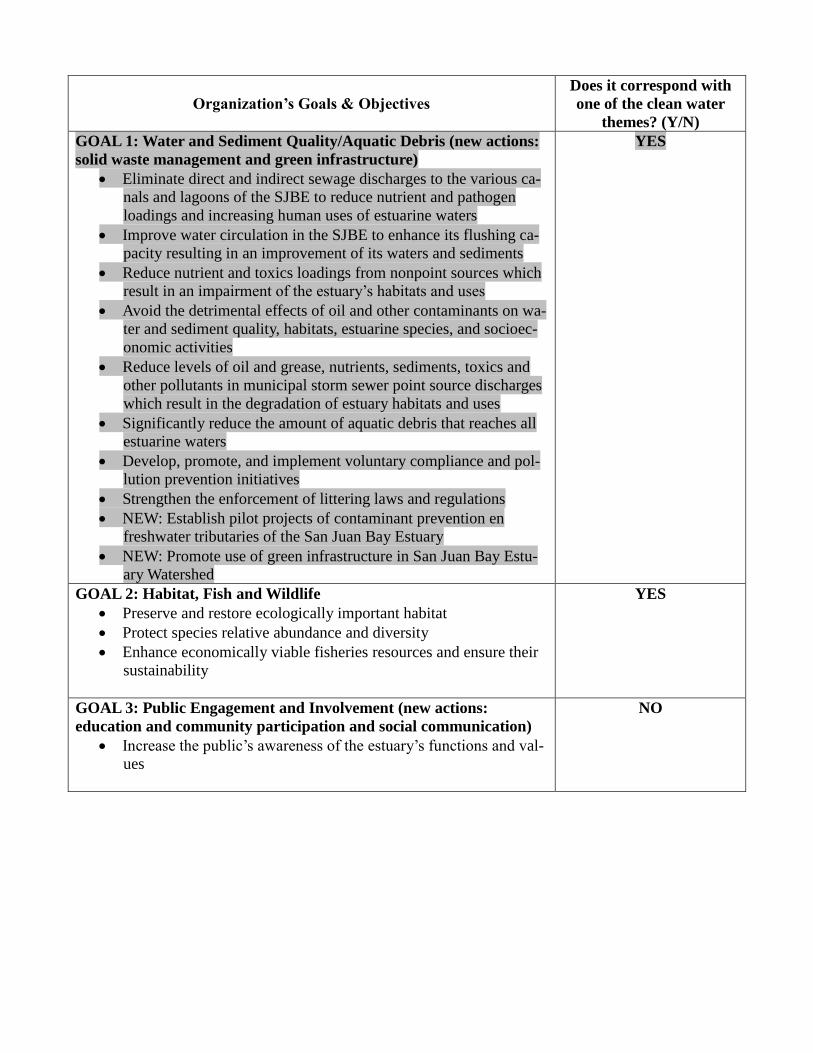
Organization’s Goals & Objectives
Does it correspond with
one of the clean water
themes? (Y/N)
GOAL 1: Water and Sediment Quality/Aquatic Debris (new actions:
solid waste management and green infrastructure)
Eliminate direct and indirect sewage discharges to the various ca-
nals and lagoons of the SJBE to reduce nutrient and pathogen
loadings and increasing human uses of estuarine waters
Improve water circulation in the SJBE to enhance its flushing ca-
pacity resulting in an improvement of its waters and sediments
Reduce nutrient and toxics loadings from nonpoint sources which
result in an impairment of the estuary’s habitats and uses
Avoid the detrimental effects of oil and other contaminants on wa-
ter and sediment quality, habitats, estuarine species, and socioec-
onomic activities
Reduce levels of oil and grease, nutrients, sediments, toxics and
other pollutants in municipal storm sewer point source discharges
which result in the degradation of estuary habitats and uses
Significantly reduce the amount of aquatic debris that reaches all
estuarine waters
Develop, promote, and implement voluntary compliance and pol-
lution prevention initiatives
Strengthen the enforcement of littering laws and regulations
NEW: Establish pilot projects of contaminant prevention en
freshwater tributaries of the San Juan Bay Estuary
NEW: Promote use of green infrastructure in San Juan Bay Estu-
ary Watershed
YES
GOAL 2: Habitat, Fish and Wildlife
Preserve and restore ecologically important habitat
Protect species relative abundance and diversity
Enhance economically viable fisheries resources and ensure their
sustainability
YES
GOAL 3: Public Engagement and Involvement (new actions:
education and community participation and social communication)
Increase the public’s awareness of the estuary’s functions and val-
ues
NO

CRE Guidebook Step 3: Risk Identification
Objective of this step
To generate a comprehensive list of climate change risks that might affect (positively or negatively) the
ability of your organization to achieve its objectives. This Step will develop that list.


CRE Guidebook Step 4: Risk Analysis
Objective of this step
The objective of this step is to qualitatively determine the spatial scale of the impact, likelihood,
consequence, and the time until a problem begins for the climate change risks identified in Step 3 -
Risk Identification, so they can be sorted into high, medium, and low categories of impact.
For risk analysis results see supplemental excel spreadsheet.
CRE Guidebook Step 5: Risk Evaluation
Objective of this step
The objective of this step is to develop a consequence/probability matrix and review it with stakeholder
input to help determine which risks the SJBEP organization will address in future adaptation planning.
Results of this step are below through a series of risk matrices. The matrices are a categorization of all
foreseeable climate related risks based on their likeliness of occurrence and consequence to the SJBEP’
organization’s goals and objectives. The risks identified in red are the highest risk because their
consequence and likelihood were identified as high in Step 4, those in yellow are medium risk, and
those in green are low risk. Those risks that were identified to have a positive outcome for the SJBEP
are clearly marked “POSITIVE”. All others are considered negative outcomes.
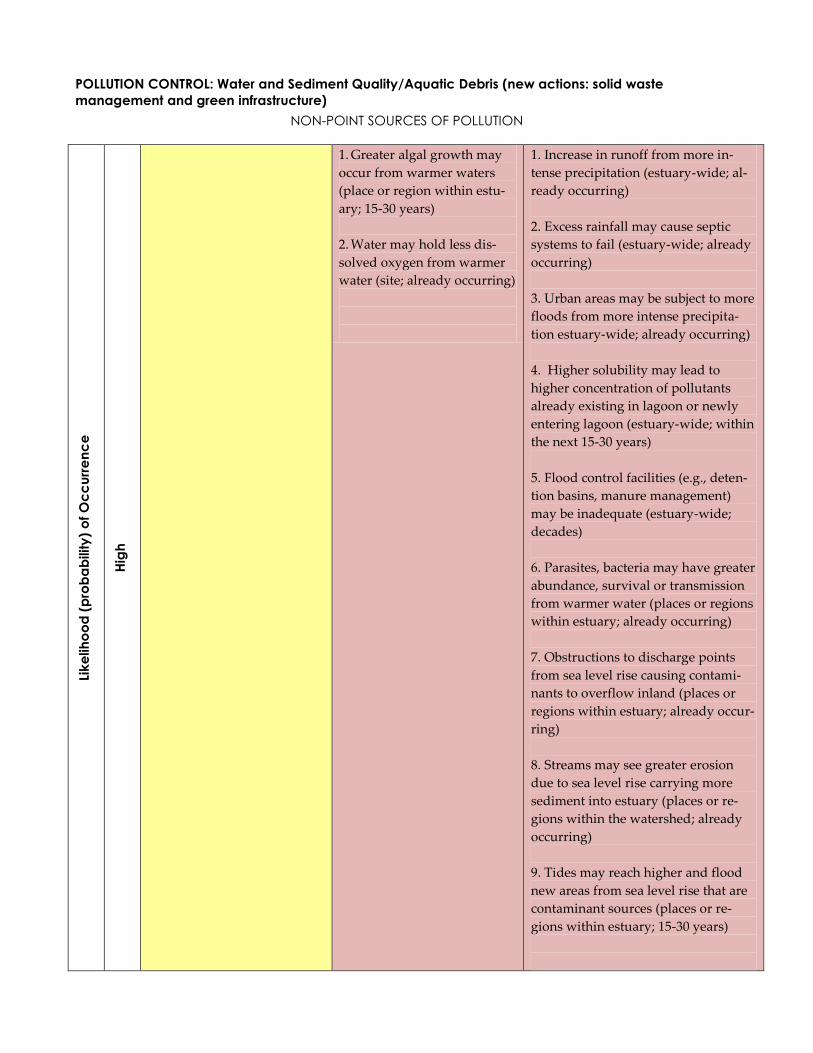
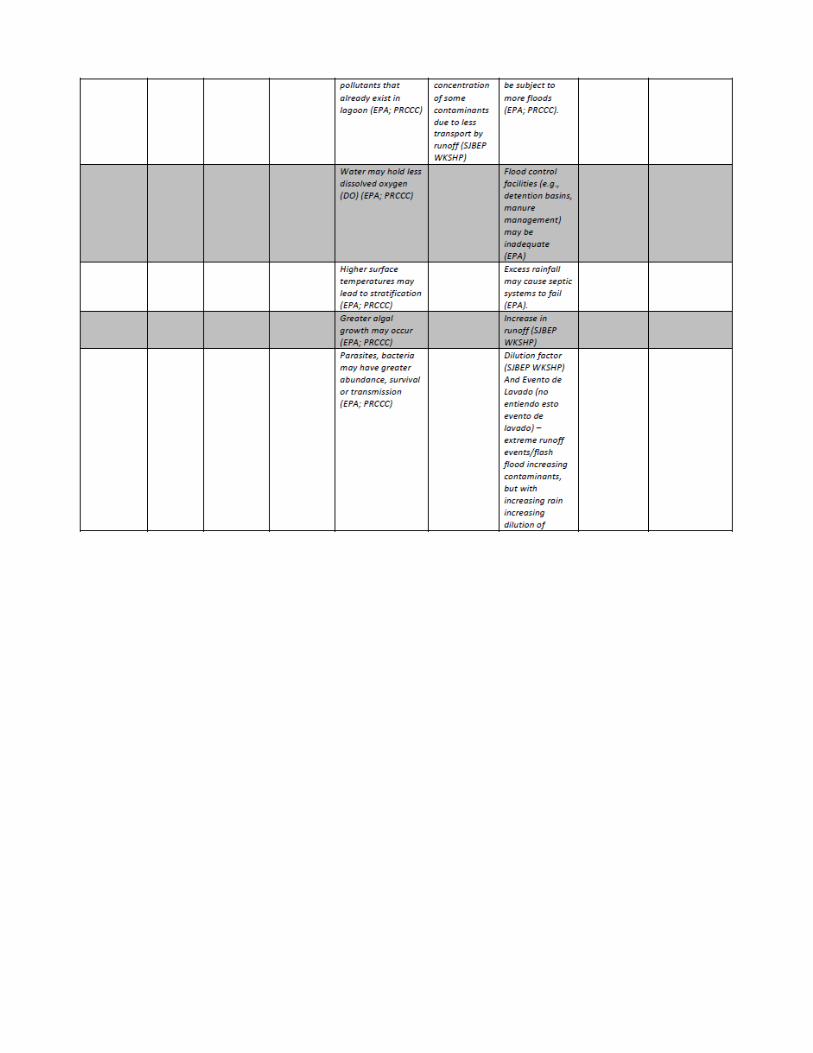
POLLUTION CONTROL: Water and Sediment Quality/Aquatic Debris (new actions: solid waste
management and green infrastructure)
NON-POINT SOURCES OF POLLUTION
Lik
elih
oo
d (
pro
ba
bility
) o
f O
cc
urr
en
ce
Hig
h
1. Greater algal growth may
occur from warmer waters
(place or region within estu-
ary; 15-30 years)
2. Water may hold less dis-
solved oxygen from warmer
water (site; already occurring)
1. Increase in runoff from more in-
tense precipitation (estuary-wide; al-
ready occurring)
2. Excess rainfall may cause septic
systems to fail (estuary-wide; already
occurring)
3. Urban areas may be subject to more
floods from more intense precipita-
tion estuary-wide; already occurring)
4. Higher solubility may lead to
higher concentration of pollutants
already existing in lagoon or newly
entering lagoon (estuary-wide; within
the next 15-30 years)
5. Flood control facilities (e.g., deten-
tion basins, manure management)
may be inadequate (estuary-wide;
decades)
6. Parasites, bacteria may have greater
abundance, survival or transmission
from warmer water (places or regions
within estuary; already occurring)
7. Obstructions to discharge points
from sea level rise causing contami-
nants to overflow inland (places or
regions within estuary; already occur-
ring)
8. Streams may see greater erosion
due to sea level rise carrying more
sediment into estuary (places or re-
gions within the watershed; already
occurring)
9. Tides may reach higher and flood
new areas from sea level rise that are
contaminant sources (places or re-
gions within estuary; 15-30 years)
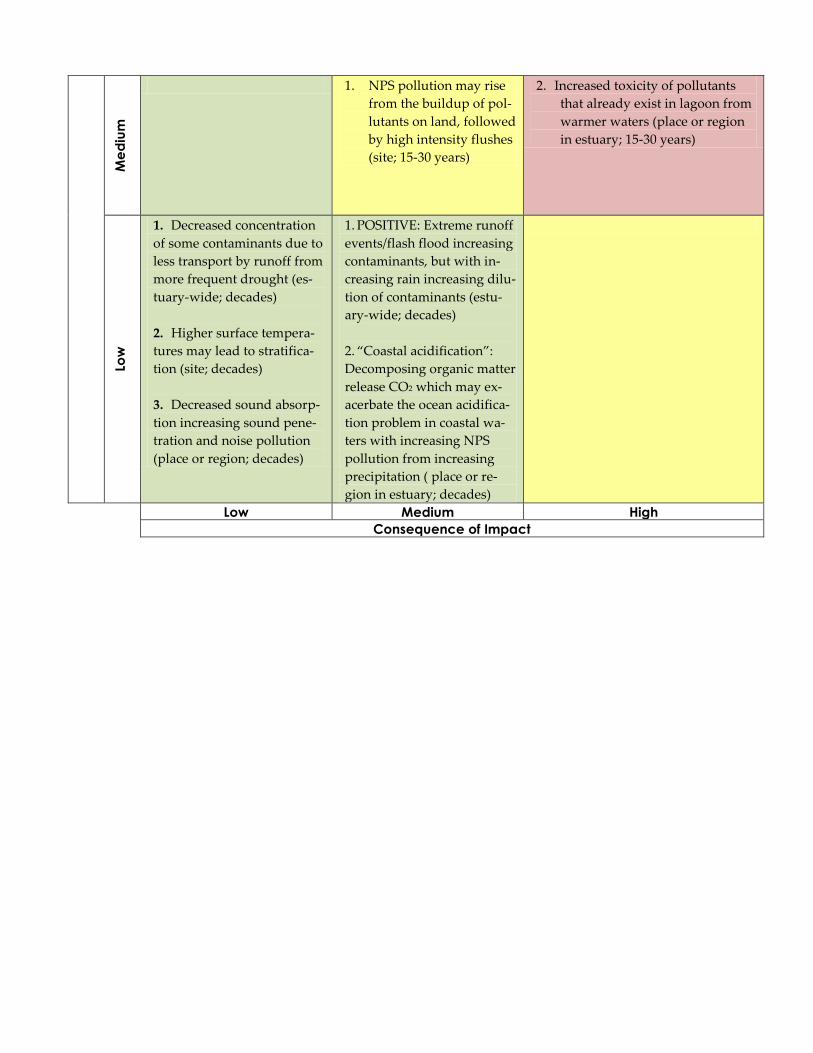
Me
diu
m
1. NPS pollution may rise
from the buildup of pol-
lutants on land, followed
by high intensity flushes
(site; 15-30 years)
2. Increased toxicity of pollutants
that already exist in lagoon from
warmer waters (place or region
in estuary; 15-30 years)
Low
1. Decreased concentration
of some contaminants due to
less transport by runoff from
more frequent drought (es-
tuary-wide; decades)
2. Higher surface tempera-
tures may lead to stratifica-
tion (site; decades)
3. Decreased sound absorp-
tion increasing sound pene-
tration and noise pollution
(place or region; decades)
1. POSITIVE: Extreme runoff
events/flash flood increasing
contaminants, but with in-
creasing rain increasing dilu-
tion of contaminants (estu-
ary-wide; decades)
2. “Coastal acidification”:
Decomposing organic matter
release CO2 which may ex-
acerbate the ocean acidifica-
tion problem in coastal wa-
ters with increasing NPS
pollution from increasing
precipitation ( place or re-
gion in estuary; decades)
Low Medium High
Consequence of Impact

POINT SOURCES OF POLLUTION
Lik
elih
oo
d (
pro
ba
bility
) o
f O
cc
urr
en
ce
Hig
h
1. Increased demand for
air conditioning, in-
creased use of power
plants. More thermal
discharge into the es-
tuary due to warmer
“winters” (and in-
creasing CO2 into the
atmosphere) (site; al-
ready occurring)
2. Temperature criteria
for discharges may be
exceeded due to
warmer water (ther-
mal pollution) (site;
15-30 years)
1. Combined sewage overflows
may increase due to more in-
tense precipitation (estuary-
wide; already occurring)
2. Sewers may have more inflow
(floods) or infiltration (higher
watertable) due to sea level
rise (estuary-wide; 15-30
years)
3. Seawater may enter combined
sewer systems (estuary-wide;
15-30 years)
4. Pollutant concentrations may
increase if sources stay the
same and flow diminishes
due to more frequent drought
(estuary-wide; decades)
5. Obstructions to discharge
points from sea level rise
causing contaminants to over-
flow inland (place or region;
already occurring)
6. Treatment plants may go of-
fline during intense floods
(site; already occurring)
7. Treatment plants may not be
able to discharge via gravity
at higher water levels (site;
decades)
Me
diu
m
1. Treatment infrastruc-
ture may be suscep-
tible to coastal flood-
ing due to sea level
rise (site; 15-30years)
1. Critical low-flow criteria for
discharging may not be meet
due to more frequent
drought (estuary-wide; dec-
ades)
2. Contaminated sites may flood
or have shoreline erosion
due to sea level rise (site;
decades)
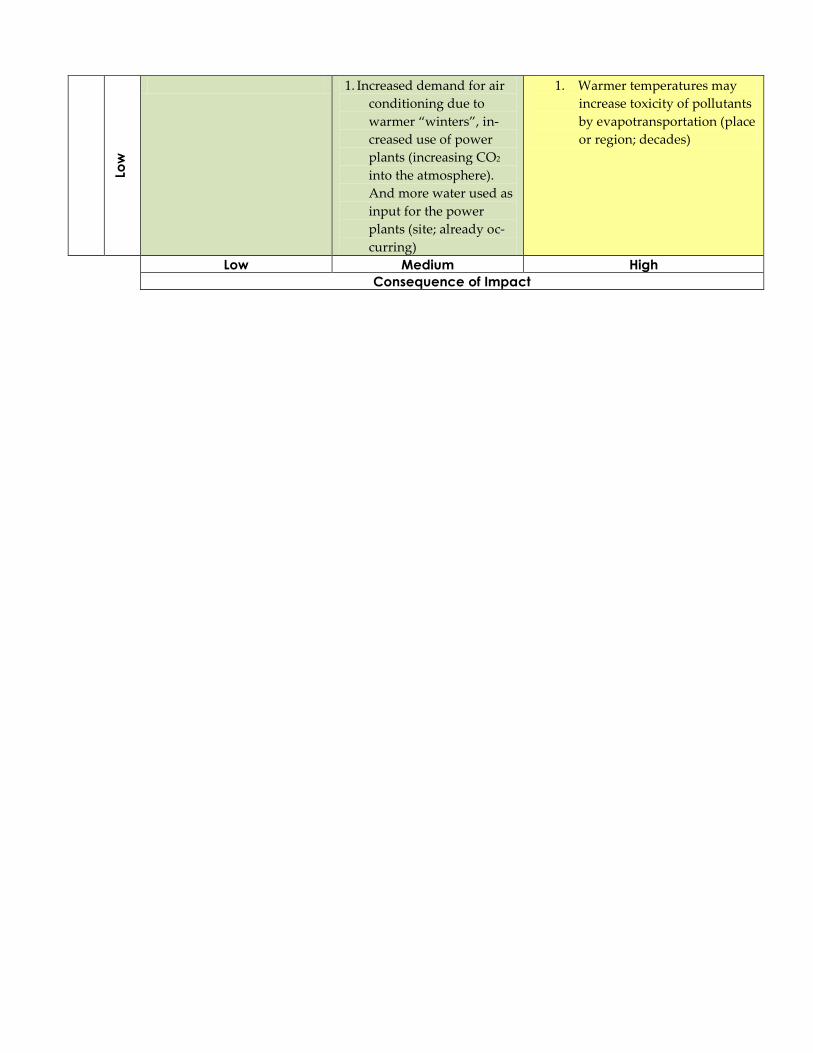
Low
1. Increased demand for air
conditioning due to
warmer “winters”, in-
creased use of power
plants (increasing CO2
into the atmosphere).
And more water used as
input for the power
plants (site; already oc-
curring)
1. Warmer temperatures may
increase toxicity of pollutants
by evapotransportation (place
or region; decades)
Low Medium High
Consequence of Impact

ESTUARY HABITAT: Habitat, Fish & Wildlife
PHYSICAL & HYDROLOGICAL FEATURES
Lik
elih
oo
d (
pro
ba
bility
) o
f O
cc
urr
en
ce
Hig
h
1. Increased intensity of
precipitation may
yield less infiltration
(estuary-wide; al-
ready occurring)
2. Switching between
surface and ground-
water sources for
public water supplies
may affect the integ-
rity of estuaries (aka
More consumption of
water because of heat
and less freshwater to
the lagoon and more
land subsidence,
saltwater intrusion,
etc). (estuary-wide;
decades)
3. Loss of plant cover
(site; decades)
4. Change in Forest
Structure (Piñones)
(site; decades)
5. Increased water con-
sumption will lead to
increased water
withdrawals, reduc-
ing the ecological
flow (estuary-wide;
decades)
1. Bulkheads, sea walls
and revetments may
become more wide-
spread (sites; already
occurring)
2. Tidal influence/saline
water may more far-
ther upstream (sites;
decades)
3. Coastal overwash or
breaching of barriers
may occur…changes
in geomorphology
(estuary-wide; al-
ready occurring)
4. Increase in salinity of
water bodies, affect-
ing the toxicity of
metals and pH (place
or region; decades)
5. Runoff decreases thus
decreasing sediment
(estuary-wide; within
the next 15-30 years)
1. Reduction in the thickness of the
freshwater lens (estuary-wide;
already occurring)
2. Stronger storms may cause
more intense flooding nd runoff, es-
pecially from oversaturated storm
drains (estuary-wide; already occur-
ring)
3. Eutrophication and hypoxia
(place or region; already occurring)
4. Increase in nutrients in estu-
ary as a consequence of vegetation
die-off (eutrophication) (place or re-
gion; already occurring)
5. Shoreline erosion may lead to
loss of beaches, wetlands and salt
marshes (extensive; already occur-
ring)
6. The number of storms reach-
ing an intensity that cause problems
may increase (estuary-wide; within
the next 15-30 years)
7. Downed trees and other vege-
tation may close off small channels of
SJBE (place or region; within the next
15-30 years)
8. Stream water may become
warmer because depth decreases
(place or region; decades)
9. Groundwater table may drop
(extensive; decades)
10. Base flow in streams may de-
crease (place or region; decades)
11. Higher temperatures may
lead to greater evaporation and low-
er groundwater tables (aka ground-
water depletion leading to land sub-
sidence and saltwater intru-
sion)(places or regions; decades)
Me
diu
m
1. Warmer water may
lead to greater likeli-
hood of estuarine
stratification (site;
decades)
2. Reduced salinity (lagoons and
canals; places or regions)

Low
4. Freshwater habitat may
become brackish (site; dec-
ades)
Low Medium High
Consequence of Impact

CONSTRUCTION OF REEFS TO PROMOTE FISH AND SHELLFISH Li
ke
lih
oo
d (
pro
ba
bility
) o
f O
cc
urr
en
ce
Hig
h
Me
diu
m
3. Long-term shellfish
sustainability may be
an open question
(site; within the next
15-30 years)
4. Lower salinity may
depress growth rates
of Mangrove Oyster
(site; within the next
15-30 years)
1. Stream erosion may
lead to high turbidi-
ty and greater sedi-
mentation (place or
region; within the
next 15-30 years)
2. Higher temperatures
may “bleach” the
coral that settles on
artificial reefs (site;
within the next 15-30
years)
3. Fish may be adverse-
ly affected (place or
region; decades)
4. Warmer water may
promote invasive
species or decease
(place or region; al-
ready occurring)
1. Desired fish may not stay
around (place or region;
within the next 15 to 30
years)
Low
5. Light may not penetrate
through deeper water (site;
decades)
6. Higher salinity may kill
targeted shellfish species
(site; within the next 15-30
years)
7. Lower salinity may kill
targeted shellfish species
(site; within the next 15-30
years)
8. Higher temperatures may
kill targeted shellfish species
(site; within the next 15-30
years)
1. Lower pH from NPS
pollution may affect
target species (place
or region; decades)
1. Higher salinity may kill tar-
geted reef species (estuary-
wide; decades)
Low Medium High
Consequence of Impact

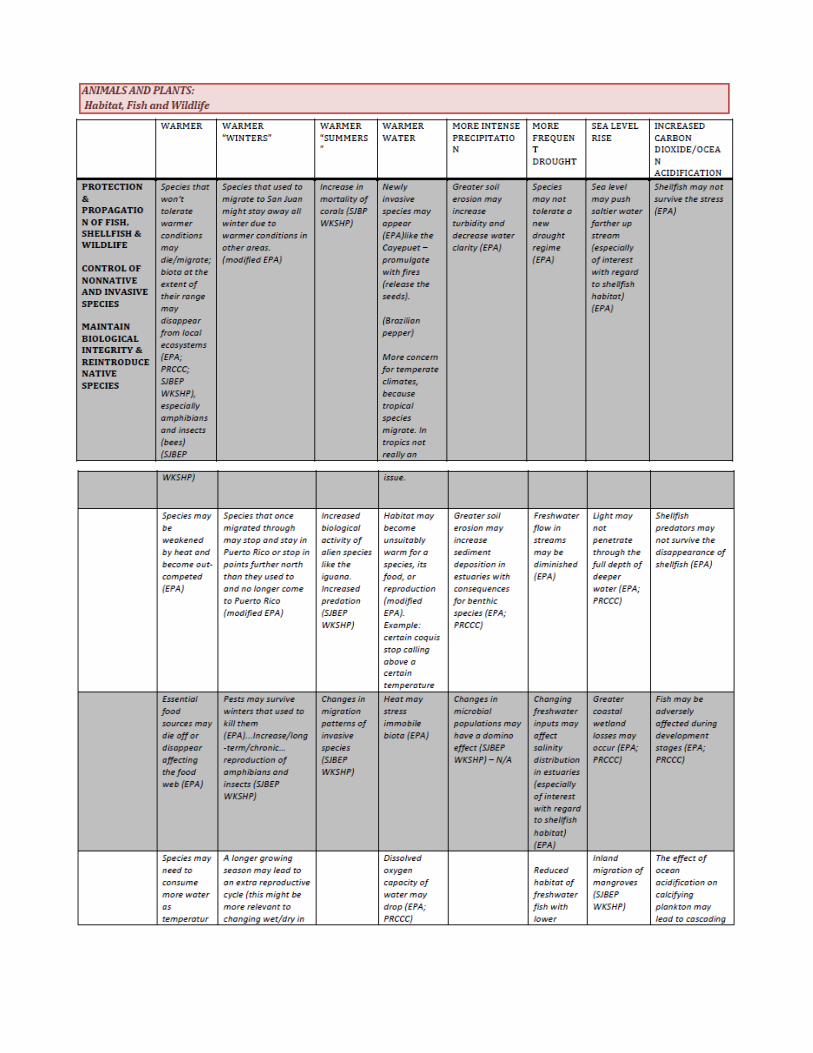
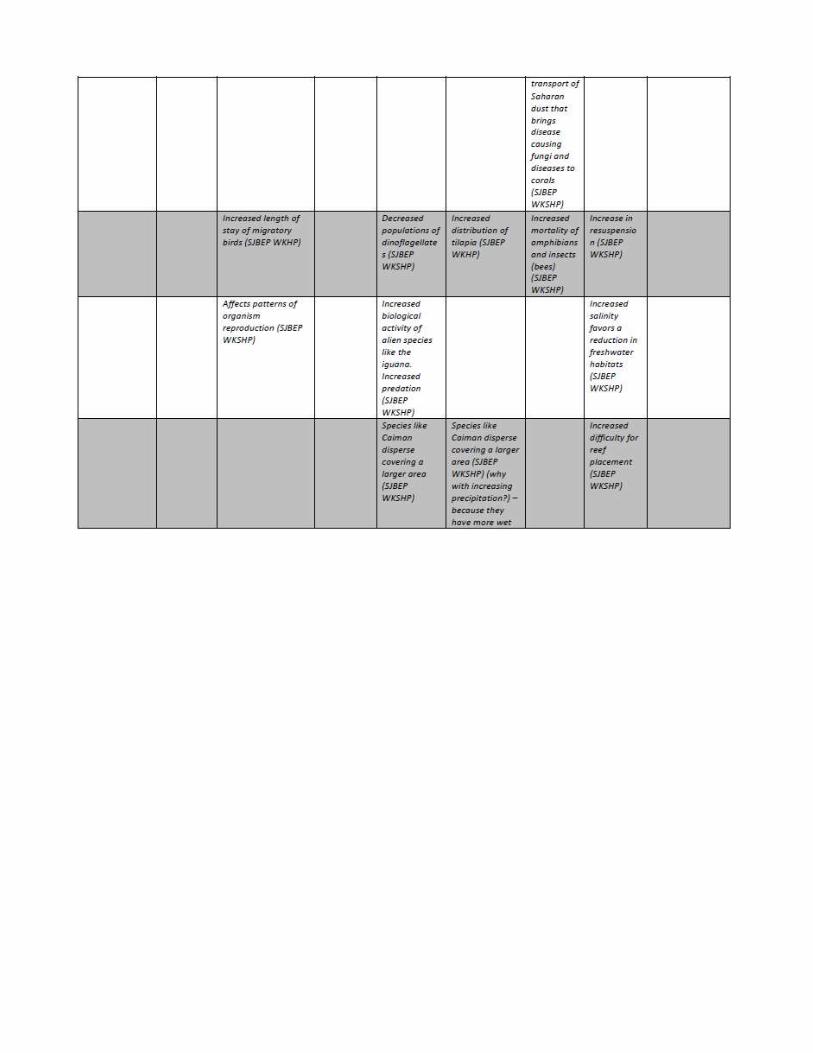
Animals & Plants: Habitat, Fish & Wildlife
PROTECTION & PROPAGATION OF FISH, SHELLFISH & WILDLIFE
CONTROL OF NONNATIVE AND INVASIVE SPECIES
MAINTAIN BIOLOGICAL INTEGRITY & REINTRODUCE NATIVE SPECIES
Lik
elih
ood
(p
rob
ab
ilit
y)
of
Occ
urre
nce
Hig
h
1. Coral bleaching episodes
may increase (place or
region; already occur-
ring)
2. Increase in mortality of
corals (place or region;
already occurring)
3. Disease more prevalent
in corals and organisms
(place or region; within
the next 15-30 years)
1. Species like Caiman disperse
covering a larger area because
they have more wet freshwa-
ter habitat (place or region;
already occurring)
2. Increased salinity favors a re-
duction in freshwater habitats
(place or region; already oc-
curring)
3. Altered populations (quanti-
ty) of dinoflagellates and dia-
toms (place or region; already
occurring or soon to occur)
4. Greater soil erosion may in-
crease turbidity and decrease
water clarity affecting prima-
ry production, coral and
seagrass growth (estuary-
wide; already occurring)
5. Greater soil erosion may in-
crease sediment deposition in
estuaries with consequences
for benthic species (estuary-
wide; already occurring or
soon to occur)
6. Harmful algal blooms may be
more likely (estuary-wide;
within the next 15-30 years)
7. Decreased calcification (reefs
and other organisms) (estu-
ary-wide; within the next 15-
30 years)
8. Dissolved oxygen capacity of
water may drop leading to
more fish kills (estuary-wide;
within the next 15-30 years)
9. Greater coastal wetland losses
may occur (estuary-wide;
within the next 15-30 years)
10. Freshwater flow in streams
may be diminished (estuary-
wide; decades)

Med
ium
1. Increased vertical
growth of mangroves
(place or region; dec-
ades)
2. Food supplies and
migrating birds may
get mis-timed (site;
decades)
3. Reduced habitat of
freshwater fish with
lower water levels
(site; soon)
4. Species that once mi-
grated through may
stop and stay in Puer-
to Rico or stop in
points further north
than they used to and
no longer come to
Puerto Rico (place or
region; within the
next 15-30 years)
5. Species may need to
consume more water
as temperature rises
(place or region; dec-
ades)
6. Sea level may push
saltier water farther
upstream (especially
of interest with re-
gard to shellfish habi-
tat) (site; within the
next 15-30 years)
7. Species that used to
migrate to San Juan
might stay away all
winter due to warmer
conditions in other
areas (site; within the
next 15-30 years)
1. Increased biological
activity of alien spe-
cies like the iguana
leading to increased
predation (place or
region; within the
next 15-30 years)
2. Fish may adversely
affected during de-
velopment stages
(place or region; dec-
ades)
3. Species may be
weakened by heat
and become out-
competed (place or
region; decades)
4. Newly invasive spe-
cies may appear like
the Cayeput – prom-
ulgate with fires (ex-
tensive; decades)
1. Mangrove productivity in-
creases (POSITIVE) (site; soon
to occur)
2. Mangrove productivity de-
creases (NEGATIVE) (site;
decades)
3. Increased difficulty for reef
placement (place or region;
decades)
4. Increased distribution of ti-
lapia (place or region; within
the next 15-30 years)
5. Increased drought in Sahara
desert produces increased
transport of Saharan dust that
brings disease causing fungi
and diseases to corals (place
or region; within the next 15-
30 years)
6. Parasites and diseases are en-
hanced by warmer water
(place or region; within the
next 15-30 years)
7. Difficult to introduce native
species (site; decades)
8. The effect of ocean acidifica-
tion on calcifying plankton
may lead to cascading effects
in the food chain (estuary-
wide; within the next 15-30
years)
9. Species may not tolerate a
new drought regime (estuary-
wide; decades)
10. Shellfish may not survive the
stress (estuary-wide; decades)
11. Shellfish predators may not
survive the disappearance of
shellfish (place or region; dec-
ades)
12. Species that won’t tolerate
warmer conditions may
die/migrate; biota at the ex-
tent of their range may disap-
pear from local ecosystems
(place or region; within the
next 15-30 years)
13. A longer growing season may
lead to an extra reproductive
cycle (this might be more rel-
evant to changing wet/dry in
tropics). Reproduction of in-
sects, plants, amphibians, but-
terflies in wet season. More
dry – decrease reproduction;

Low
1. Temperature driven
increased biological
activity may act to
raise pH in estuaries
(counter to the ocean
trend) (place or re-
gion; within the next
15-30 years)
2. Heat may stress im-
mobile biota (site;
decades) Pests may
survive winters that
used to kill them
(site; decades)
3. Light may not pene-
trate through the full
depth of deeper wa-
ter due to sea level
rise (place or region;
decades)
1. Habitat may become
unsuitably warm for a
species, its food, or re-
production (ex. Cer-
tain coquis stop calling
above a certain tem-
perature) (extensive;
within the next 15-30
years)
1. Species like Caiman disperse
covering a larger area due to
warmer water (place or re-
gion; decades)
2. Inland migration of man-
groves (extensive; decades)
3. Essential food sources may
die off or disappear affecting
the food web (place or region;
decades)
Low Medium High
Consequence of Impact

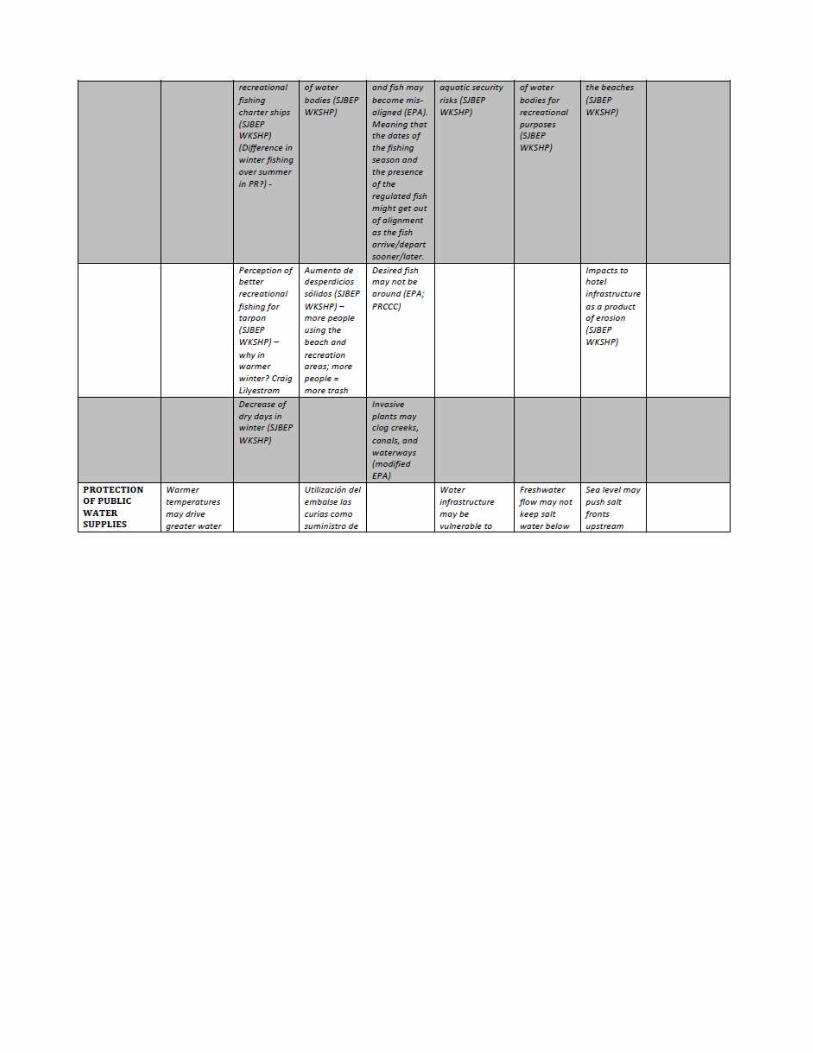
Human Uses
RECREATIONAL ACTIVITIES IN AND ON THE WATER
Lik
elih
oo
d (
pro
ba
bility
) o
f O
cc
urr
en
ce
Hig
h
1. Open seasons and
fish may become
misaligned (place
ore region; decades)
1. Increased occurrence
of Ciguatera fish poi-
soning (extensive; al-
ready occurring or
soon to occur)
2. Desired fish may not
be around (exten-
sive; decades)
3. More frequent or
more intense bad
weather may de-
crease recreational
opportunities and
reduce the activity
of bathers (place or
region; within the
next 15-30 years)
4. Increased recreational
fishing charter ships
(place or region;
decades)
5. Critical clearance un-
der bridges may de-
crease (site; decades)
1. Increase in solid waste – more
people using the beach and
recreational activities (exten-
sive; already occurring)
2. Greater NPS pollution may
impair recreation as a result
of bacterial contamination
(extensive; already occurring)
3. Beaches or public access sites
may be threatened by coastal
erosion or inundation (place
or region; already occurring)
4. Impacts to hotel infrastruc-
ture as a product of erosion
(site; already occurring)
5. Increased aquatic security
risks (place or region; within
the next 15-30 years)
6. Harmful algal blooms may be
more likely (extensive; within
the next 15-30 years)
7. Increase in nautical activities
(place or region; within the
next 15-30 years)

Me
diu
m
1. Decrease of dry days
in winter impacting
tourism industry
(place or region;
within the next 15-30
years)
2. Freshwater flows in
streams may not
support recreational
uses like boating,
kayaking, fishing or
stand-up
paddleboarding
(SUP) (place or re-
gion; decades)
3. Less tourism due to
northern areas being
warmer, less recrea-
tional use of water
bodies (place or re-
gion; already occur-
ring or soon to occur)
4. Too hot for enjoy-
ment of outdoor rec-
reational activities
(place or region; al-
ready occurring or
soon to occur)
1. Eco-tourism resources or
attractions may be de-
graded (e.g., birding,
diving, fishing) (exten-
sive; decades)

Low
1. Recreational shellfish
harvesting may be
lost (place or region;
decades)
1. Increased estuary sa-
linity may drive away
targeted recreational
fish (place or region;
decades)
1. Invasive plants may clog
creeks, canals and waterways
reducing public access (exten-
sive; decades)
2. Jellyfish may be more com-
mon (place or region; within
the next 15-30 years)
3. Increased use of vessels (place
or region; decades)
Low Medium High
Consequence of Impact
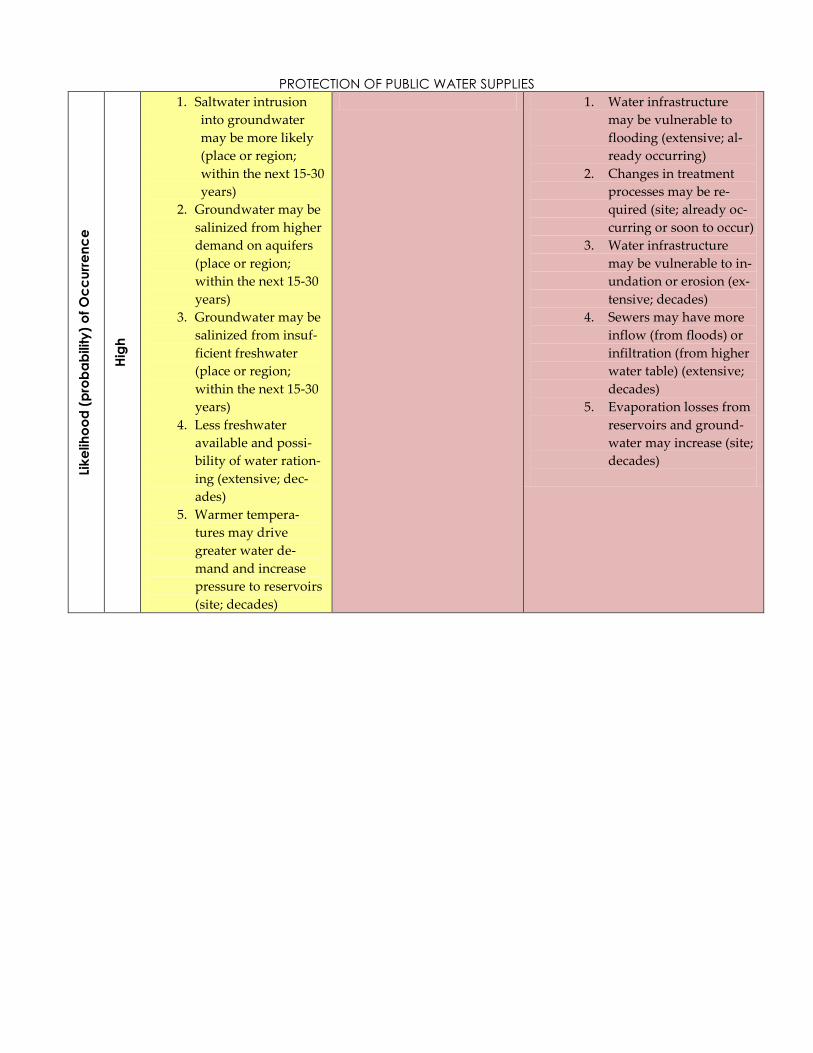
PROTECTION OF PUBLIC WATER SUPPLIES Li
ke
lih
oo
d (
pro
ba
bility
) o
f O
cc
urr
en
ce
Hig
h
1. Saltwater intrusion
into groundwater
may be more likely
(place or region;
within the next 15-30
years)
2. Groundwater may be
salinized from higher
demand on aquifers
(place or region;
within the next 15-30
years)
3. Groundwater may be
salinized from insuf-
ficient freshwater
(place or region;
within the next 15-30
years)
4. Less freshwater
available and possi-
bility of water ration-
ing (extensive; dec-
ades)
5. Warmer tempera-
tures may drive
greater water de-
mand and increase
pressure to reservoirs
(site; decades)
1. Water infrastructure
may be vulnerable to
flooding (extensive; al-
ready occurring)
2. Changes in treatment
processes may be re-
quired (site; already oc-
curring or soon to occur)
3. Water infrastructure
may be vulnerable to in-
undation or erosion (ex-
tensive; decades)
4. Sewers may have more
inflow (from floods) or
infiltration (from higher
water table) (extensive;
decades)
5. Evaporation losses from
reservoirs and ground-
water may increase (site;
decades)
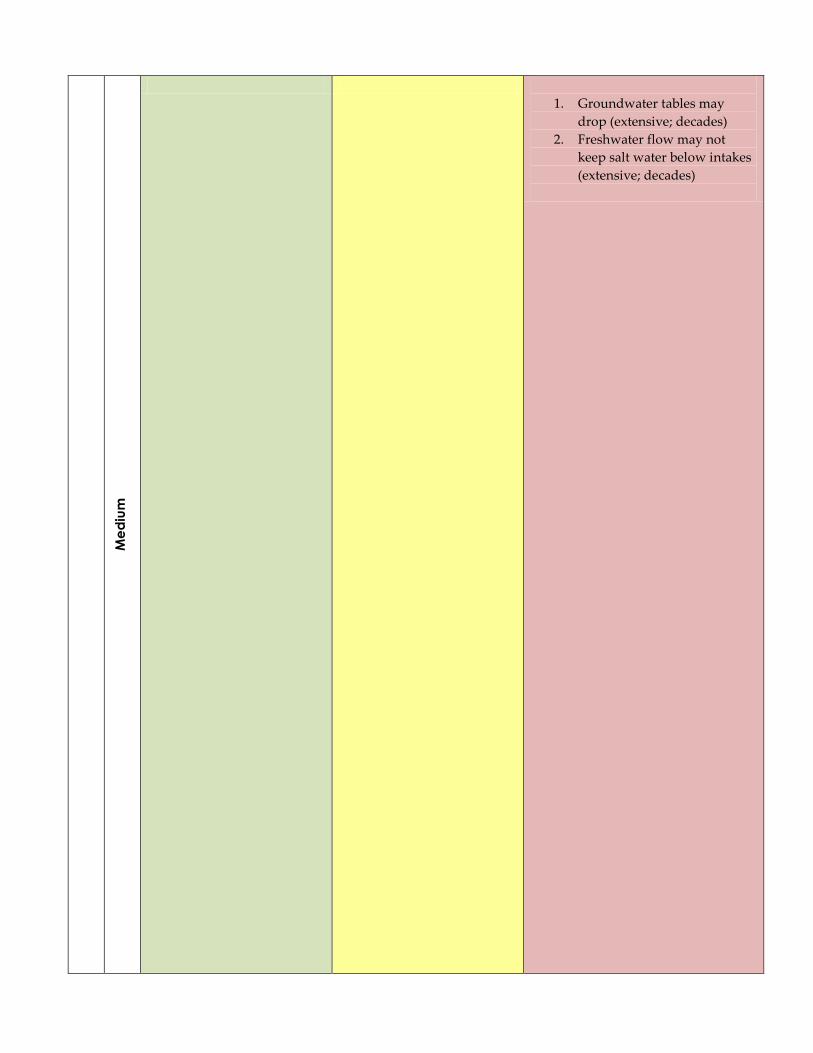
Me
diu
m
1. Groundwater tables may
drop (extensive; decades)
2. Freshwater flow may not
keep salt water below intakes
(extensive; decades)

Low
1. Because of increased
water demand, using
the old Las Curias res-
ervoir as water sup-
ply, thus reducing
freshwater input to the
estuary (place or re-
gion; decades)
1. Less freshwater available
and possibility of use of
desalinization plants (ex-
tensive; decades)
2. Increased growth of algae
and microbes may affect
drinking water quality
(site; decades)
3. Sea level may push salt
fronts up stream past wa-
ter diversions (site; dec-
ades)
Low Medium High
Consequence of Impact
COASTAL & ESTUARINE TRADITIONAL RESOURCE USE
Lik
elih
oo
d (
pro
ba
bility
) o
f O
cc
urr
en
ce
Hig
h
1. Reduced access
to coastal re-
sources for fish-
ing, traditional
products, etc.
(site; decades)
Me
diu
m
Low
Low Medium High
Consequence of Impact


