

17/11/2015
1
Ministry of Fishery and Mineral Resources, KiribatiMinistry of Land, KiribatiSPC-GSD
• Request for technical assistance sent to SPC’s Geoscience Division (GSD) by the Kiribati Ministry of Fisheries and Marine Resources Development,
• Identifying vulnerable low lying areas in planning for future developments.
17/11/2015
2
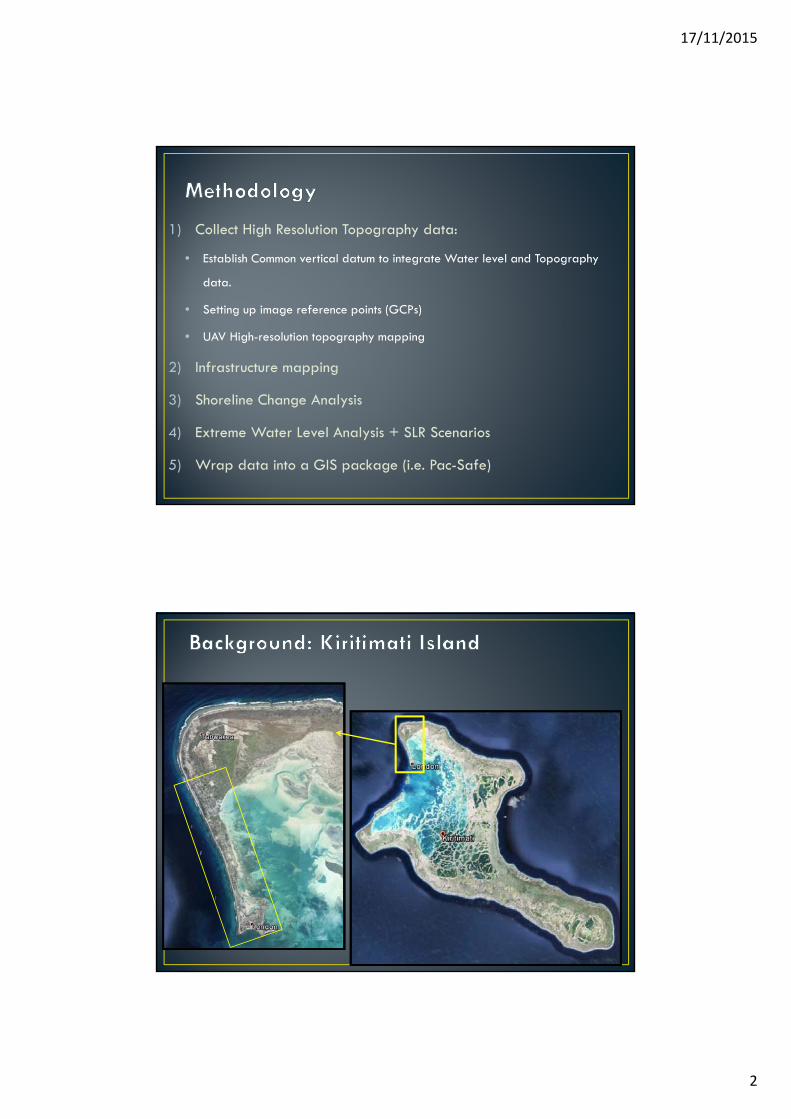
1) Collect High Resolution Topography data:
• Establish Common vertical datum to integrate Water level and Topography
data.
• Setting up image reference points (GCPs)
• UAV High-resolution topography mapping
2) Infrastructure mapping
3) Shoreline Change Analysis
4) Extreme Water Level Analysis + SLR Scenarios
5) Wrap data into a GIS package (i.e. Pac-Safe)

17/11/2015
3
• Temporary Tide Gauge:• A minimum of 35 days record• 25 hours manual observation
• 7 Bench Marks• Each BM to be surveyed 2 x 6 hrs
• Common Vertical Datum achieved by Levelling between BM and Tide Gauge
• Using an unmanned aircraft system, TRIMBLE UX5
• UAV flying at 75m above ground with 90% overlap, collecting data at a 2.4cm resolution.
• Ground Control Points minimum of 5 per flight
• Data output using TBC : Ortho-photo, Point clouds and a Digital Surface model (DSM)

17/11/2015
4

17/11/2015
5
• Extent: Kiritimati Urban Centerincluding the villages of:
- Tabwakea- Tenessy- London
Resolution: 1m
17/11/2015
6
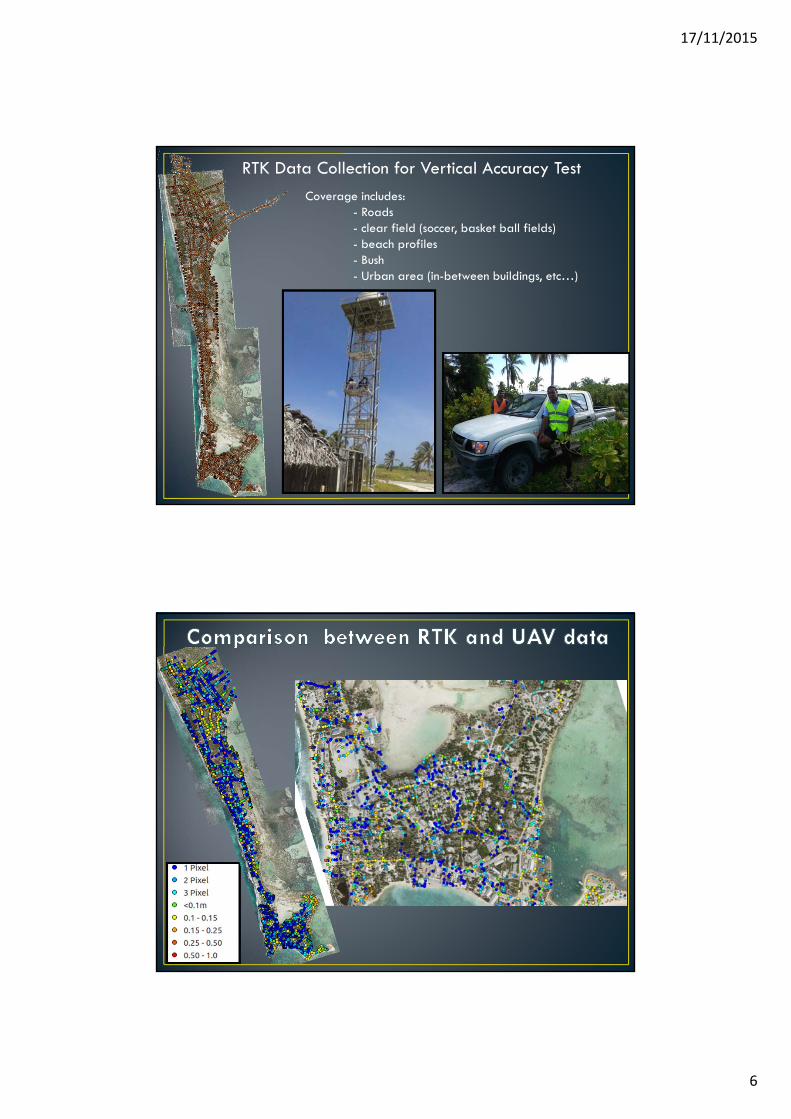
RTK Data Collection for Vertical Accuracy TestCoverage includes:
- Roads- clear field (soccer, basket ball fields)- beach profiles- Bush- Urban area (in-between buildings, etc…)
17/11/2015
7
0 0.5 1 1.5 2 2.50
1
2
3
4
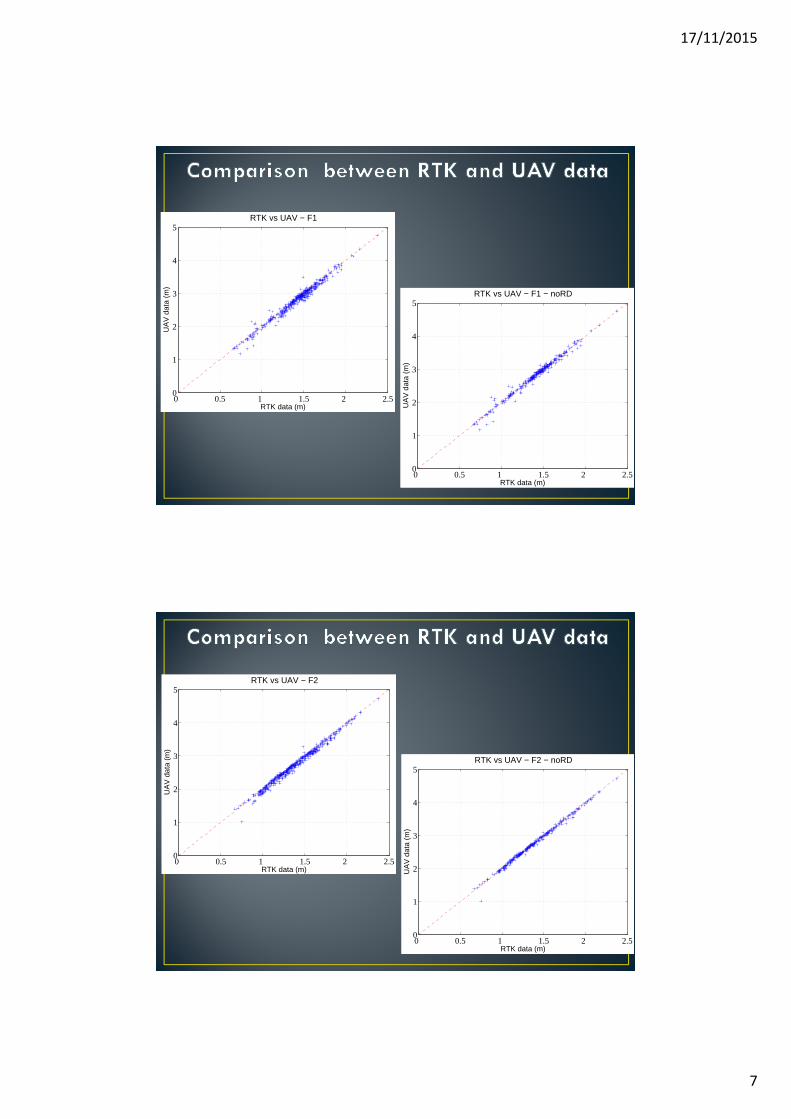
5RTK vs UAV − F1
RTK data (m)
UA
V d
ata
(m)
0 0.5 1 1.5 2 2.50
1
2
3
4
5RTK vs UAV − F1 − noRD
RTK data (m)
UA
V d
ata
(m)
0 0.5 1 1.5 2 2.50
1
2
3
4
5RTK vs UAV − F2
RTK data (m)
UA
V d
ata
(m)
0 0.5 1 1.5 2 2.50
1
2
3
4
5RTK vs UAV − F2 − noRD
RTK data (m)
UA
V d
ata
(m)

17/11/2015
8
0 0.2 0.4 0.6 0.8 1 1.2 1.40
10
20
30
40
50
60
70RTK vs UAV − F1 − noRD
RTK data (m)
UA
V d
ata
(m)
0 0.2 0.4 0.6 0.8 1 1.2 1.40
10
20
30
40
50
60RTK vs UAV − F2 − noRD
RTK data (m)
UA
V d
ata
(m)
Abs( RTK Height –UAV Height)
Abs( RTK Height –UAV Height)
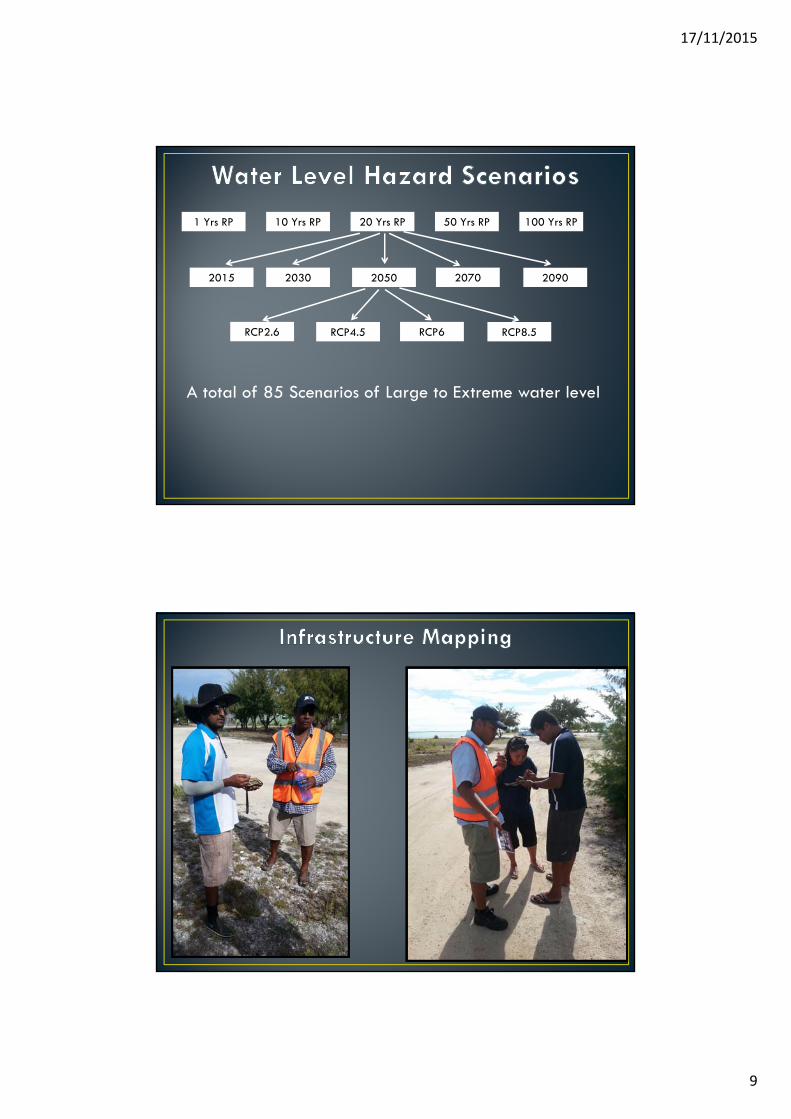
Based on the 41 years ofwater level record from theNOAA tide gauge, Kiritimati
17/11/2015
9
1 Yrs RP 20 Yrs RP10 Yrs RP 50 Yrs RP 100 Yrs RP
20902015 2030 20702050
RCP8.5RCP2.6 RCP6RCP4.5
A total of 85 Scenarios of Large to Extreme water level
17/11/2015
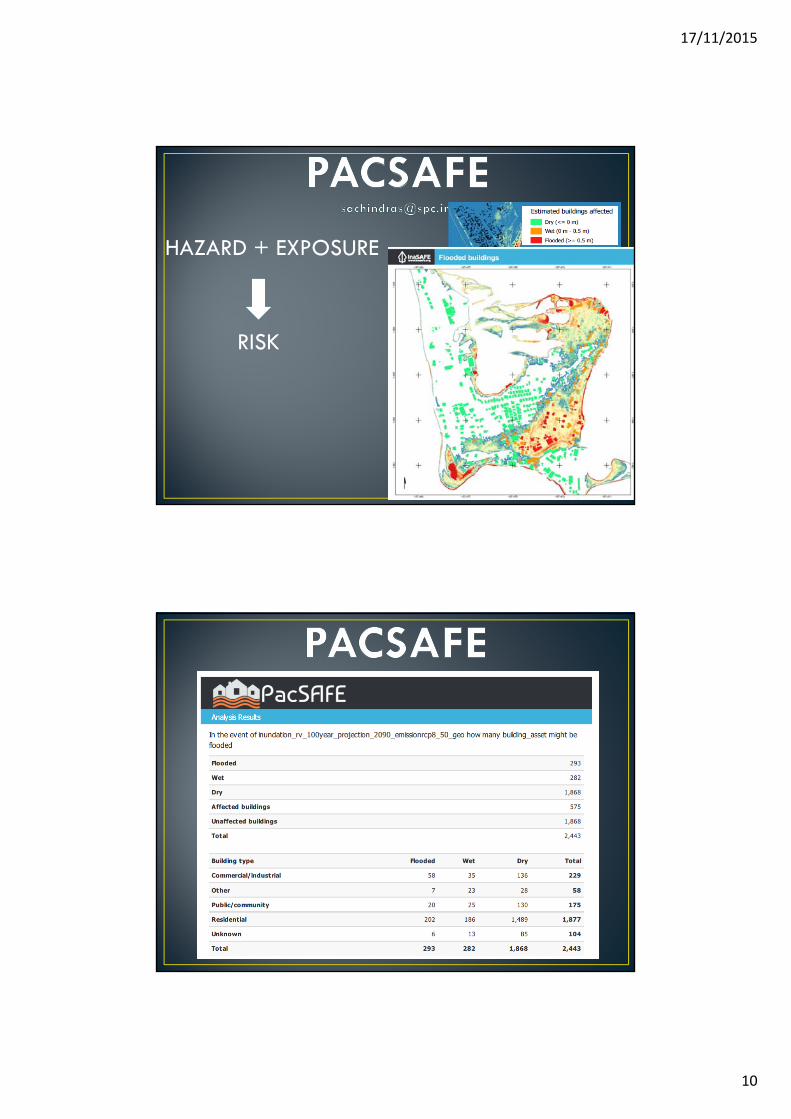
10
HAZARD + EXPOSURE
RISK

17/11/2015
11
• Include Population as Exposure data• Include SetBack Zone Layer
• Keep progressing on PACSAFE
• Critical Issue with Tide Gauge Reference Datum.
• Hazard layer do not consider shoreline response from SLR.
• PHASE 2 – Bathymetry Mapping, Wave Inundation Modeling.

17/11/2015
12
Other Tasks: Shoreline Change Analysis
17/11/2015
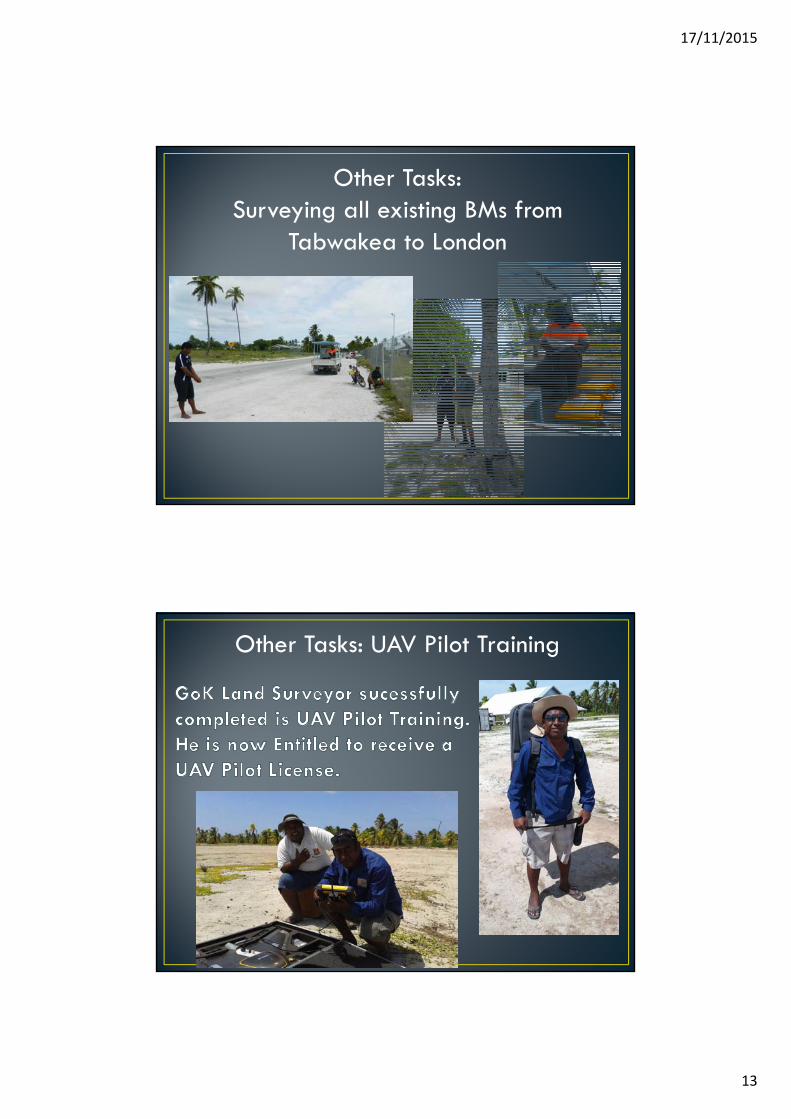
13
Other Tasks: Surveying all existing BMs from
Tabwakea to London
Other Tasks: UAV Pilot Training
17/11/2015
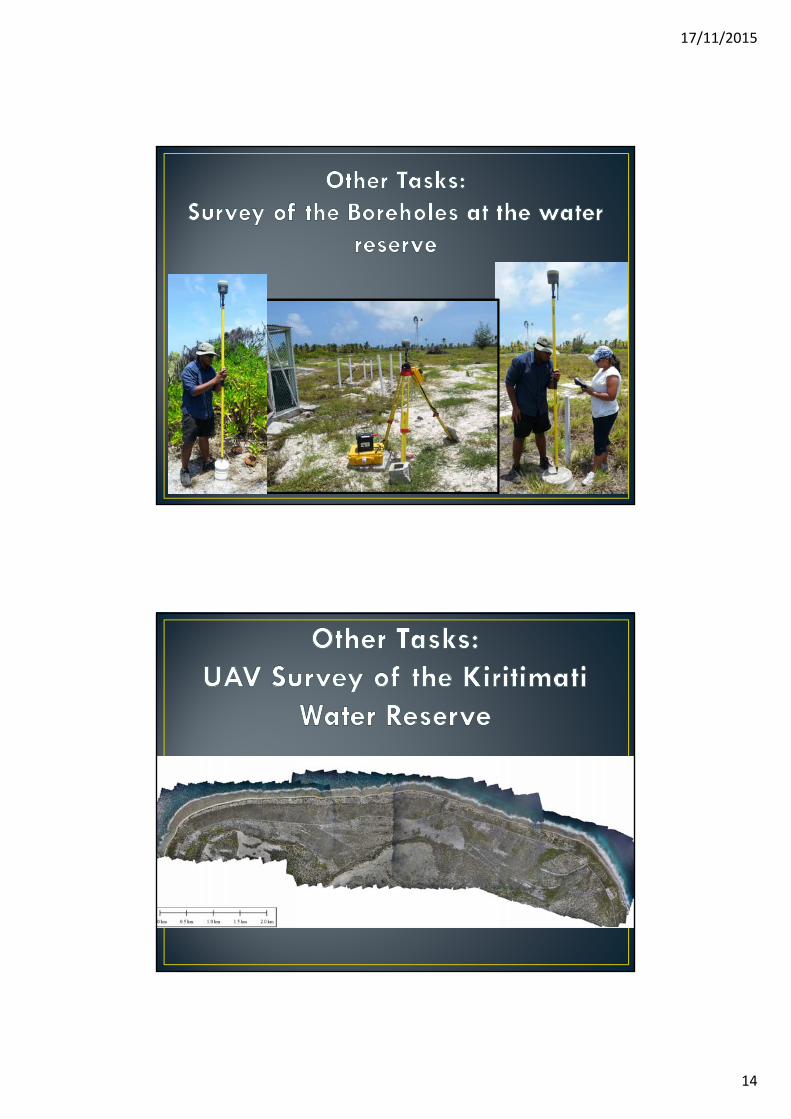
14
17/11/2015
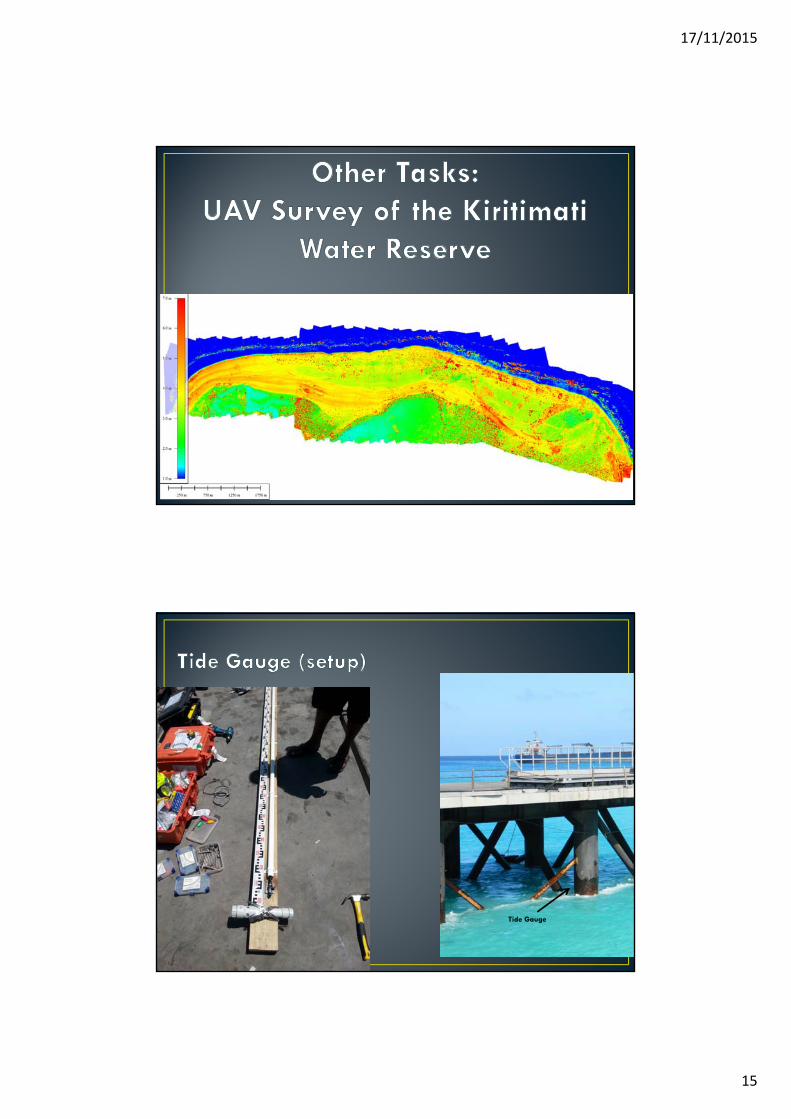
15
Tide Gauge

17/11/2015
16

17/11/2015
17
• Established a control network for London • 6 new BM observed twice for 6 hours • Data send to AUSPOS Online Processing Service. • BM used to collect Ground Control Point for flights and for RTK
survey.• RTK points collected is further used to verify accuracy of cloud
points produced by photogrammetry.

17/11/2015
18
GCP


