

RESTATEMENT OF INTERIM FINANCIAL STATEMENTS
for the six months ended December 2017

3RESILIENT REIT LIMITED RESTATEMENT OF INTERIM FINANCIAL STATEMENTS FOR THE SIX MONTHS ENDED DECEMBER 20172 RESILIENT REIT LIMITED RESTATEMENT OF INTERIM FINANCIAL STATEMENTS FOR THE SIX MONTHS ENDED DECEMBER 2017
The Resilient board has revisited the accounting treatment of The Siyakha Education Trust (“Siyakha”), The Siyakha 1 Education Trust (“Siyakha 1”) and The Siyakha 2 Education Trust (“Siyakha 2”) (collectively referred to as the “Siyakha Trusts”) in terms of IFRS 10: Consolidated Financial Statements. We have, during this process, engaged and consulted with various parties and have obtained a legal opinion on the interpretation of the trust deeds and certain board decisions taken in the past in relation to the Siyakha Trusts. The board has reached the conclusion that Resilient has power over the Siyakha Trusts, exposure or rights to variable returns from its involvement with the Siyakha Trusts and further has the ability to influence the returns earned from the Siyakha Trusts. The definition of control as provided in IFRS 10 is therefore met. This constitutes a prior period error in terms of IAS 8: Accounting Policies, Changes in Accounting Estimates and Errors and as such the decision has been taken to restate the group’s results.
The trust deed of Siyakha provides Resilient Properties (Pty) Ltd, a wholly-owned subsidiary of Resilient, as founder of Siyakha, with the right to remove any trustee and to fill any resulting vacancy. The board had previously waived this right as it related to Siyakha and as such Siyakha was not consolidated. A legal opinion was obtained by Resilient that confirmed that the waiver adequately removed these rights provided by the Siyakha trust deed. A separate legal opinion was recently obtained by our auditors that disagreed with the opinion. With two conflicting legal opinions, the board decided not to recognise the waiver of rights which resulted in the conclusion that Resilient has power over Siyakha.
Siyakha 1 and Siyakha 2 were established in 2016. As a result of a detailed assessment the board had previously concluded that Resilient did not have exposure or rights to variable returns as a result of its involvement with Siyakha 1 and Siyakha 2. During the review of the accounting treatment of the Siyakha Trusts this assessment was revisited and Resilient engaged and consulted with its auditors and external accounting consultants. The conclusion reached was that Resilient does have exposure and rights to variable returns and as such Siyakha 1 and Siyakha 2 are consolidated.
The full restatement in terms of IAS 8 will be disclosed in the June 2018 annual financial statements which will include the consolidation of Siyakha from the 2013 financial year onwards and the consolidation of Siyakha 1 and Siyakha 2 from 2017. Prior to 2013 the impact of Siyakha was not material. The opening balance of reserves for the period has been adjusted for the cumulative effect of the consolidation of the Siyakha Trusts as it relates to the prior periods.
The restatement increases the IFRS accounted net asset value per share by 6% and has the following impact on the consolidated statement of financial position at December 2017:
• Total assets increase by R3,7 billion, being the recognition of the Siyakha Trusts’ investments in Fortress A and Fortress B shares of R7,2 billion and the elimination of Resilient’s loan of R3,5 billion;
• Total liabilities increase by R6,8 billion, being the Siyakha Trusts’ loans from Fortress of R3,6 billion and the Siyakha Trusts’ bank borrowings of R3,2 billion;
• Total equity attributable to equity holders reduces by R3,1 billion mainly because of the recognition of the cost of the Siyakha Trusts’ investment in Resilient of R4,4 billion as treasury shares.
As a result of the restatement the IFRS compliant consolidated statement of comprehensive income recognises R695 million of profits for the six months ended December 2017 and basic earnings per share and headline earnings per share increase by 23% and 29% respectively.
Previously, Resilient calculated its dividend to be declared by including the amount of interest it earned on the loans it advanced to the Siyakha Trusts. This was in the context of the Siyakha Trusts having positive net asset values, which amounted to R4,9 billion at December 2017. For so long as the Siyakha Trusts’ total liabilities exceed the value of its total assets Resilient will, for purposes of calculating its distributable earnings, recognise interest accrued on its loans advanced to the Siyakha Trusts only to the extent that the accrued interest is matched by dividends declared for the same period.
The restated consolidated statement of financial position, consolidated statement of comprehensive income, consolidated statement of changes in equity and consolidated statement of cash flows have further been adjusted by the following items:
• Trade and other receivables as previously reported included R84,3 million related to currency derivatives and R162,1 million related to interest rate derivatives that are long-term in nature. These have been reclassified to non-current assets.
• Trade and other payables as previously reported included R0,5 million related to currency derivatives and R36,1 million related to interest rate derivatives that are long-term in nature. These have been reclassified to non-current liabilities.
• The line item “Income from investments”, as previously reported, has been renamed to “Revenue from investments” with no change to the amount previously reported. The consolidated statement of comprehensive income has been re-ordered in order to reflect total revenue which includes revenue from direct property operations and revenue from investments.
• The statement of cash flows will include a restatement to adjust for the non-cash effect of loans issued to staff in terms of the share incentive scheme. This adjustment is not applicable to the statement of cash flows for the six months ended December 2017 as there were no share issues to staff during this period. This is, however, applicable to prior periods and will be disclosed in the annual financial statements at June 2018.
This SENS announcement deals with the effects of the restatements on the December 2017 interim results, being the latest published financial results. The preparation of the information related to the restatements is the sole responsibility of the directors and has been prepared for illustrative purposes only, to show the impact on the condensed unaudited consolidated interim financial statements for the six months ended 31 December 2017. This information has not been reviewed or reported on by Resilient’s auditors.
Shareholders’ attention is drawn to the following events that have taken place since December 2017:
• Resilient distributed the B shares it held in Fortress REIT Limited to its shareholders on 7 May 2018 and as a result the remaining holding in Fortress B shares is 5 309 515 shares; and
• The current market value of the shares held by Resilient is as follows:
Number of shares
Fair value R'000
Fortress B (FFB) 5 309 515 77 519
NEPI Rockcastle (NRP) 75 140 000 9 392 500
Greenbay (GRP) 2 052 361 996 2 668 071
12 138 090
RESTATEMENT OF INTERIM FINANCIAL STATEMENTS for the six months ended December 2017

5RESILIENT REIT LIMITED RESTATEMENT OF INTERIM FINANCIAL STATEMENTS FOR THE SIX MONTHS ENDED DECEMBER 20174 RESILIENT REIT LIMITED RESTATEMENT OF INTERIM FINANCIAL STATEMENTS FOR THE SIX MONTHS ENDED DECEMBER 2017
SUMMARY OF FINANCIAL PERFORMANCE
Unaudited
Previouslyreported
Dec 2017RestatedDec 2017
% changeDec 2017
Dividend (cents per share) 306,46 306,46
Shares in issue 424 954 000 424 954 000
Shares used for dividend per share calculation 424 954 000 371 771 496 (13%)
Shares held in treasury – 53 182 504
Weighted average shares in issue 416 702 969 365 411 122 (12%)
Basic earnings per share (cents) 2 153,18 2 645,73 23%
Headline earnings per share (cents) 1 308,43 1 682,40 29%
Management account information
Net asset value per share (R) 105,35 105,35
Loan-to-value ratio* (%) 20,1 20,1
Net property expense ratio (%) 18,5 18,5
Gross property expense ratio (%) 36,1 36,1
Net total expense ratio (%) 15,7 15,7
Gross total expense ratio (%) 28,3 28,3
IFRS accounting
Net asset value per share (R) 100,75 106,75 6%
* The loan-to-value ratio is calculated by dividing total interest-bearing borrowings adjusted for cash on hand by the total of investments in property, listed securities and loans advanced.
Previouslyreported
unauditedDec 2017
R’000
AdjustmentsunauditedDec 2017
R’000
RestatedunauditedDec 2017
R’000
ASSETS
Non-current assets 54 490 520 3 905 985 58 396 505
Investment property 21 719 718 21 719 718
Straight-lining of rental revenue adjustment 379 515 379 515
Investment property under development 761 508 761 508
Investment in and loans to associates and joint venture 3 980 363 3 980 363
Investments 23 315 396 7 185 7291 30 501 125
Resilient Share Purchase Trust loans 557 373 557 373
Loans to BEE vehicles 3 526 150 (3 526 150) –
Loans to co-owners 250 497 250 497
Other receivables – 246 406 246 406
Current assets 1 654 617 (217 562) 1 437 055
Resilient Share Purchase Trust loans 16 297 16 297
Trade and other receivables 1 058 845 (217 566) 841 279
Hammerson equity derivative 68 860 68 860
Cash and cash equivalents 510 615 4 510 619
Total assets 56 145 137 3 688 423 59 833 560
EQUITY AND LIABILITIES
Total equity attributable to equity holders 42 814 771 (3 127 526) 39 687 245
Stated capital 16 504 668 – 16 504 668
Treasury shares – (4 398 919)2 (4 398 919)
Currency translation reserve 44 624 44 624
Reserves 26 265 479 1 271 393 27 536 872
Non-controlling interests 54 873 54 873
Total equity 42 869 644 (3 127 526) 39 742 118
Total liabilities 13 275 493 6 815 949 20 091 442
Non-current liabilities 11 120 186 6 850 927 17 971 113
Interest-bearing borrowings 9 219 251 6 773 1513 15 992 402
Deferred tax 939 508 939 508
Amounts owing to non-controlling shareholders 961 427 961 427
Other payables – 77 776 77 776
Current liabilities 2 155 307 (34 978) 2 120 329
Trade and other payables 451 500 (34 978) 416 522
Interest-bearing borrowings 1 703 807 1 703 807
Total equity and liabilities 56 145 137 3 688 423 59 833 560
Notes: 1 Fair value of the Fortress REIT Limited A ordinary shares and Fortress REIT Limited B ordinary shares held by the Siyakha Trusts. 2 Cost of the Resilient shares held by the Siyakha Trusts. 3 Represents R3,2 billion of bank borrowings and R3,6 billion of funding obtained from Fortress REIT Limited.
CONDENSED CONSOLIDATED STATEMENT OF FINANCIAL POSITION

7RESILIENT REIT LIMITED RESTATEMENT OF INTERIM FINANCIAL STATEMENTS FOR THE SIX MONTHS ENDED DECEMBER 20176 RESILIENT REIT LIMITED RESTATEMENT OF INTERIM FINANCIAL STATEMENTS FOR THE SIX MONTHS ENDED DECEMBER 2017
CONDENSED CONSOLIDATED STATEMENT OF COMPREHENSIVE INCOME
Income statement
Previouslyreported
unauditedfor the
six monthsended
Dec 2017R’000
Adjustmentsunaudited
for thesix months
endedDec 2017
R’000
Restatedunaudited
for the six months
endedDec 2017
R’000
Recoveries and contractual rental revenue 1 292 063 1 292 063
Straight-lining of rental revenue adjustment 26 684 26 684
Revenue from direct property operations 1 318 747 – 1 318 747
Revenue from investments 517 219 183 853 701 072
Total revenue 1 835 966 183 853 2 019 819
Fair value gain on investment property, investments and currency derivatives 4 264 044 1 108 270 5 372 314
Adjustment resulting from straight-lining of rental revenue (26 684) (26 684)
Fair value gain on investments 4 308 043 1 108 270 5 416 313
Fair value loss on currency derivatives (17 315) (17 315)
Property operating expenses (472 543) (472 543)
Administrative expenses (53 099) (7 028) (60 127)
Foreign exchange losses (36 558) (36 558)
Profit on sale of interest in associate 3 538 393 3 538 393
Loss from associates and joint venture (5 036) – (5 036)
– distributable 108 569 108 569
– non-distributable (113 605) (113 605)
Profit before net finance costs 9 071 167 1 285 095 10 356 262
Net finance costs (71 269) (589 659) (660 928)
Finance income 413 200 (222 475) 190 725
Interest received: cross-currency swaps 142 717 142 717
Interest received: loans 259 793 (220 098) 39 695
Fair value adjustment on interest rate derivatives 10 690 (2 377) 8 313
Finance costs (484 469) (367 184) (851 653)
Interest on borrowings (513 150) (367 184) (880 334)
Capitalised interest 28 681 28 681
Profit before income tax 8 999 898 695 436 9 695 334
Income tax (27 781) (27 781)
Profit for the period 8 972 117 695 436 9 667 553
Previouslyreported
unauditedfor the
six monthsended
Dec 2017R’000
Adjustmentsunaudited
for thesix months
endedDec 2017
R’000
Restatedunaudited
for thesix months
endedDec 2017
R’000
Other comprehensive loss net of tax
Items that may subsequently be reclassified to profit or loss
Exchange differences on translation of foreign operations (9 789) (9 789)
Total comprehensive income for the period 8 962 328 695 436 9 657 764
Profit for the period attributable to:
Equity holders of the company 8 972 369 695 436 9 667 805
Non-controlling interests (252) – (252)
8 972 117 695 436 9 667 553
Total comprehensive income for the period attributable to:
Equity holders of the company 8 969 814 695 436 9 665 250
Non-controlling interests (7 486) – (7 486)
8 962 328 695 436 9 657 764
Basic earnings per share (cents) 2 153,18 2 645,73

9RESILIENT REIT LIMITED RESTATEMENT OF INTERIM FINANCIAL STATEMENTS FOR THE SIX MONTHS ENDED DECEMBER 20178 RESILIENT REIT LIMITED RESTATEMENT OF INTERIM FINANCIAL STATEMENTS FOR THE SIX MONTHS ENDED DECEMBER 2017
CONDENSED CONSOLIDATED STATEMENT OF CHANGES IN EQUITY
Unaudited
StatedcapitalR’000
Treasury sharesR’000
Currencytranslation
reserveR’000
ReservesR’000
Equityattributable
to equityholders
R’000
Non-controlling
interestsR’000
TotalequityR’000
Balance at Jun 2017– previously reported 13 521 054 – 59 380 18 531 400 32 111 834 120 311 32 232 145
Adjustment for the retrospective consolidation of the Siyakha Trusts – (3 881 621) – 419 169 (3 462 452) (3 462 452)
Restated balance at Jun 2017 13 521 054 (3 881 621) 59 380 18 950 569 28 649 382 120 311 28 769 693
Issue of shares 2 983 614 – – 2 983 614 2 983 614
– Issue of 21 814 791 shares on 29 Aug 2017 2 733 841 2 733 841 2 733 841
– Issue of 1 879 000 shares on 1 Nov 2017 249 773 249 773 249 773
Resilient shares held by the Siyakha Trusts (517 298) 4 177 (513 121) (513 121)
Acquisition of additional interest in subsidiaries (8) (8) (34 348) (34 356)
Exchange differences realised on disposal of associate 6 346 6 346 6 346
Exchange differences on translation of foreign operations (2 555) (2 555) (7 234) (9 789)
Restated profit for the period 9 667 805 9 667 805 (252) 9 667 553
Profit for the period 8 972 369 8 972 369 (252) 8 972 117
Profit for the period – adjustment for consolidation of the Siyakha Trusts 695 436 695 436 695 436
Restated dividend paid (1 104 218) (1 104 218) (23 604) (1 127 822)
Dividend paid (1 256 829) (1 256 829) (23 604) (1 280 433)
Dividend paid to the Siyakha Trusts 152 611 152 611 152 611
Transfer to currency translation reserve (18 547) 18 547 – –
Restated balance at Dec 2017 16 504 668 (4 398 919) 44 624 27 536 872 39 687 245 54 873 39 742 118

11RESILIENT REIT LIMITED RESTATEMENT OF INTERIM FINANCIAL STATEMENTS FOR THE SIX MONTHS ENDED DECEMBER 201710 RESILIENT REIT LIMITED RESTATEMENT OF INTERIM FINANCIAL STATEMENTS FOR THE SIX MONTHS ENDED DECEMBER 2017
CONDENSED CONSOLIDATED STATEMENT OF CASH FLOWS
Previouslyreported
unauditedfor the
six monthsended
Dec 2017R’000
Unauditedadjustments
for thesix months
endedDec 2017
R’000
Restatedunaudited
for thesix months
endedDec 2017
R’000
Operating activities
Cash generated from operations 864 213 148 358 1 012 571
Interest received 402 510 (220 098) 182 412
Interest paid (513 150) (367 184) (880 334)
Dividends paid (1 280 433) 152 611 (1 127 822)
Cash outflow from operating activities (526 860) (286 313) (813 173)
Investing activities
Development and improvement of investment property (289 092) (289 092)
Increase of interest in associates (788 035) (788 035)
Loans to joint venture repaid 1 701 1 701
Share purchase trust loans repaid 54 179 54 179
Loans repaid by BEE vehicles 51 078 (51 078) –
Co-owner loans advanced (38 001) (38 001)
Acquisition of investments (276 941) (8 899) (285 840)
Cash flow on currency derivatives (652 148) (652 148)
Proceeds on disposal of investments 948 516 305 517 253
Cash flow on Hammerson equity derivative 45 447 45 447
Cash outflow from investing activities (1 890 864) 456 328 (1 434 536)
Financing activities
Decrease in interest-bearing borrowings (876 742) 343 167 (533 575)
Acquisition of additional interest in subsidiaries (34 356) (34 356)
Acquisition of treasury shares – (273 192) (273 192)
Proceeds on disposal of treasury shares – 9 979 9 979
Raising of stated capital 2 983 614 (249 908) 2 733 706
Cash inflow from financing activities 2 072 516 (169 954) 1 902 562
Decrease in cash and cash equivalents (345 208) 61 (345 147)
Cash and cash equivalents at beginning of the period 855 823 (57) 855 766
Cash and cash equivalents at end of the period 510 615 4 510 619
Cash and cash equivalents consist of:
Current accounts 510 615 4 510 619
Previouslyreported
unauditedfor the
six monthsended
Dec 2017R’000
Adjustmentsunaudited
for thesix months
endedDec 2017
R’000
Restatedunaudited
for thesix months
endedDec 2017
R’000
Reconciliation of profit for the period to dividend declared
Profit for the period 8 972 117 695 436 9 667 553 Fair value gain on investments (4 308 043) (1 108 270) (5 416 313)– investments of Resilient (4 308 043) (4 308 043)– investments of the Siyakha Trusts – (1 108 270) (1 108 270)Fair value loss on currency derivatives 17 315 17 315 Foreign exchange losses 36 558 36 558 Profit on sale of interest in associates (3 538 393) (3 538 393)Non-distributable loss from associates 113 605 113 605 Fair value adjustment on interest rate derivatives (10 690) 2 377 (8 313)– interest rate derivatives of Resilient (10 690) (10 690)– interest rate derivatives of the Siyakha Trusts – 2 377 2 377 Income tax 27 781 27 781 Non-controlling interests (11 865) (11 865)Antecedent dividend 25 449 25 449 Income hedging adjustment of Nigeria and Portugal
performance (989) (989)Dividends accrued (20 531) (20 531)Amount available for distribution under best practice 1 302 314 (410 457) 891 857 Effect of consolidating the Siyakha Trusts(1) 247 474 247 474– relating to Resilient 134 546 134 546– relating to Fortress 112 928 112 928Dividend declared – interim (1 302 314) 162 983 (1 139 331)– total share register (1 302 314) (1 302 314)– shares held in treasury 162 983 162 983
– – –
Reconciliation of profit for the period to headline earnings
Basic earnings – profit for the period attributable to equity holders 8 972 369 695 436 9 667 805
Adjusted for: (3 520 121) (3 520 121)– fair value loss on investment property 26 684 26 684 – profit on sale of interest in associates (3 538 393) (3 538 393)– income tax effect (8 412) (8 412)
Headline earnings 5 452 248 695 436 6 147 684
Headline earnings per share (cents) 1 308,43 1 682,40
(1) This is the amount by which the expenses of the Siyakha Trusts exceeded the dividends it received during the period.
SEGMENTAL REPORTING

13RESILIENT REIT LIMITED RESTATEMENT OF INTERIM FINANCIAL STATEMENTS FOR THE SIX MONTHS ENDED DECEMBER 201712 RESILIENT REIT LIMITED RESTATEMENT OF INTERIM FINANCIAL STATEMENTS FOR THE SIX MONTHS ENDED DECEMBER 2017
MANAGEMENT ACCOUNTS
BASIS OF PREPARATIONIn order to provide information of relevance to investors these management accounts, which comprise financial information extracted from the restated unaudited interim financial statements for the six months ended December 2017, have been prepared and are presented to provide users with the position:
• Had the Siyakha Trusts not been consolidated as required by IFRS;
• Had the equity investment in Hammerson held through derivative products been accounted for on a grossed-up basis instead of only accounting for the margin;
• Had the group’s listed investment in Greenbay that was accounted for using the equity method for IFRS, been fair valued;
• Had the group’s interest in Locaviseu, the joint venture in Portugal, accounted for using the equity method for IFRS, been proportionately consolidated; and
• Had the group accounted for its share of the assets, liabilities and results of partially-owned subsidiaries (Resilient Africa and the indirect investments in Arbour Crossing, The Galleria and Mahikeng Mall) on a proportionately consolidated basis instead of consolidating it.
The pro forma financial information (management accounts) have been prepared in terms of the JSE Listings Requirements and the SAICA Guide on pro forma financial information.
The pro forma financial information has not been reviewed or reported on by Resilient auditors.
DIRECTORS’ RESPONSIBILITY STATEMENT
The preparation of the management accounts is the sole responsibility of the directors and have been prepared on the basis stated, for illustrative purposes only, to show the impact on the condensed consolidated statement of financial position and the condensed consolidated statement of comprehensive income. Due to their nature the management accounts may not fairly present the financial position and results of the group in terms of IFRS.
Adjustment 4This adjustment proportionately consolidates the indirect investments in partially-owned subsidiaries (Resilient Africa and the indirect investments in Arbour Crossing, The Galleria and Mahikeng Mall) previously consolidated. It uses the management accounts for the six months ended December 2017 of Resilient Africa, Resilient Africa Managers, Arbour Town and Southern Palace Investments 19 to reverse the non-controlling interests to reflect the group’s interest in the assets, liabilities and results of operations from these investments.
MANAGEMENT ACCOUNT ADJUSTMENTS
Consolidation of the Siyakha TrustsResilient has no entitlement to or share in the assets of the Siyakha Trusts. Furthermore, the external debt of the Siyakha Trusts is ring-fenced to the Siyakha Trusts and as such the board does not believe that this debt should impact the loan-to-value ratio of Resilient. It is for these reasons that management removes the consolidation of the Siyakha Trusts in the preparation of the management accounts. The intention of the management accounts is to provide a true reflection of the assets under management of Resilient.
Adjustments 1 to 4 remained unchanged from those previously reported.
Adjustment 1The Hammerson equity derivative is grossed-up by multiplying the 6 260 000 shares held by the quoted closing price of Hammerson shares at December 2017. This more accurately reflects the group’s assets and liabilities.
Adjustment 2The investment in Greenbay is reflected at its fair value by multiplying the 1 981 300 000 shares held by the quoted closing price of Greenbay shares at December 2017. All entries recorded to account for this investment using the equity method are reversed. This more accurately reflects the group’s assets and liabilities.
Adjustment 3This adjustment proportionately consolidates the indirect investments in Forum Coimbra and Forum Viseu that are held through Locaviseu, accounted for using the equity method. It effectively discloses the group’s interest in the assets, liabilities and results of operations from these investments by disclosing the consolidated management accounts for the six months ended December 2017 on a line-by-line basis. Resilient is satisfied with the quality of the financial information contained in the management accounts of Locaviseu.

15RESILIENT REIT LIMITED RESTATEMENT OF INTERIM FINANCIAL STATEMENTS FOR THE SIX MONTHS ENDED DECEMBER 201714 RESILIENT REIT LIMITED RESTATEMENT OF INTERIM FINANCIAL STATEMENTS FOR THE SIX MONTHS ENDED DECEMBER 2017
CONDENSED CONSOLIDATED STATEMENT OF FINANCIAL POSITION
RestatedIFRS
unauditedDec 2017
R’000
Consolidationof the
SiyakhaTrusts
unauditedDec 2017
R’000
Restatedpreviously
reportedIFRS
unauditedDec 2017
R’000
Adjustment 1Hammerson
equityderivativegross-up
unauditedDec 2017
R’000
Adjustment 2Fair value
accounting forinvestment
in GreenbayunauditedDec 2017
R’000
Adjustment 3Proportionate
consolidation ofinvestment in
Portuguesejoint venture
unauditedDec 2017
R’000
Adjustment 4Proportionateconsolidation
of partially-owned
subsidiariesunauditedDec 2017
R’000
Restatedmanagement
accountsunauditedDec 2017
R’000
ASSETS
Non-current assets 58 396 505 (3 659 579) 54 736 926 567 657 1 954 235 941 014 (1 256 180) 56 943 652
Investment property 21 719 718 21 719 718 1 678 558 (1 315 563) 22 082 713
Straight-lining of rental revenue adjustment 379 515 379 515 (16 926) 362 589
Investment property under development 761 508 761 508 761 508
Investment in and loans to associates and joint venture 3 980 363 3 980 363 (3 098 080) (882 283) –
Investments 30 501 125 (7 185 729) 23 315 396 567 657 5 052 315 28 935 368
Goodwill – – 144 739 144 739
Resilient Share Purchase Trust loans 557 373 557 373 557 373
Loans to BEE vehicles – 3 526 150 3 526 150 3 526 150
Loans to co-owners 250 497 250 497 76 309 326 806
Other receivables 246 406 246 406 246 406
Current assets 1 437 055 (28 844) 1 408 211 – – 87 302 (16 125) 1 479 388
Resilient Share Purchase Trust loans 16 297 16 297 16 297
Trade and other receivables 841 279 (28 840) 812 439 26 670 (8 276) 830 833
Hammerson equity derivative 68 860 68 860 (68 860) –
Cash and cash equivalents 510 619 (4) 510 615 68 860 60 632 (7 849) 632 258
Total assets 59 833 560 (3 688 423) 56 145 137 567 657 1 954 235 1 028 316 (1 272 305) 58 423 040
EQUITY AND LIABILITIES
Total equity attributable to equity holders 39 687 245 3 127 526 42 814 771 – 1 954 235 – – 44 769 006
Stated capital 16 504 668 16 504 668 16 504 668
Treasury shares (4 398 919) 4 398 919 – –
Currency translation reserve 44 624 44 624 44 624
Reserves 27 536 872 (1 271 393) 26 265 479 1 954 235 28 219 714
Non-controlling interests 54 873 54 873 (54 873) –
Total equity 39 742 118 3 127 526 42 869 644 – 1 954 235 – (54 873) 44 769 006
Total liabilities 20 091 442 (6 815 949) 13 275 493 567 657 – 1 028 316 (1 217 432) 13 654 034
Non-current liabilities 17 971 113 (6 814 358) 11 156 755 567 657 – 967 925 (1 196 426) 11 495 911
Interest-bearing borrowings 15 992 402 (6 773 151) 9 219 251 567 657 752 116 (235 012) 10 304 012
Deferred tax 939 508 939 508 215 809 13 1 155 330
Amounts owing to non-controlling shareholders 961 427 961 427 (961 427) –
Other payables 77 776 (41 207) 36 569 36 569
Current liabilities 2 120 329 (1 591) 2 118 738 – – 60 391 (21 006) 2 158 123
Trade and other payables 416 522 (1 591) 414 931 60 391 (21 006) 454 316
Interest-bearing borrowings 1 703 807 1 703 807 1 703 807
Total equity and liabilities 59 833 560 (3 688 423) 56 145 137 567 657 1 954 235 1 028 316 (1 272 305) 58 423 040
17RESILIENT REIT LIMITED RESTATEMENT OF INTERIM FINANCIAL STATEMENTS FOR THE SIX MONTHS ENDED DECEMBER 201716 RESILIENT REIT LIMITED RESTATEMENT OF INTERIM FINANCIAL STATEMENTS FOR THE SIX MONTHS ENDED DECEMBER 2017
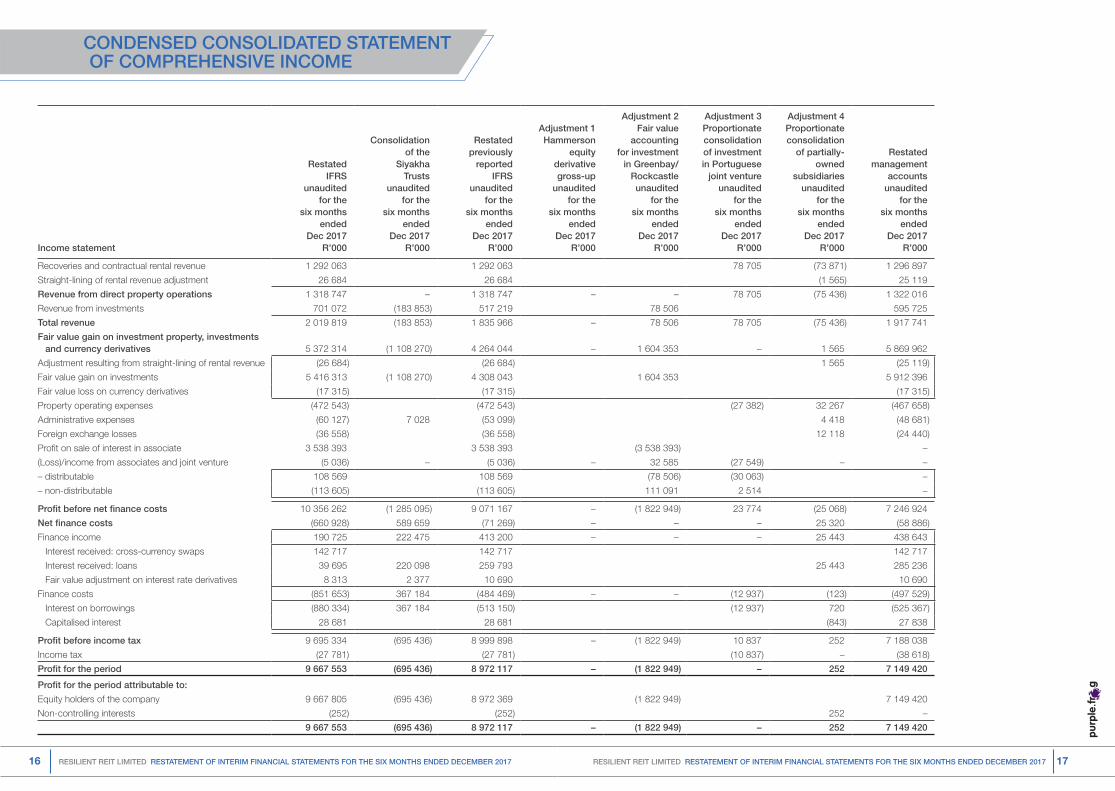
CONDENSED CONSOLIDATED STATEMENT OF COMPREHENSIVE INCOME
Income statement
RestatedIFRS
unauditedfor the
six monthsended
Dec 2017R’000
Consolidationof the
SiyakhaTrusts
unauditedfor the
six monthsended
Dec 2017R’000
Restatedpreviously
reportedIFRS
unauditedfor the
six monthsended
Dec 2017R’000
Adjustment 1Hammerson
equityderivativegross-up
unaudited for the
six monthsended
Dec 2017R’000
Adjustment 2Fair value
accountingfor investment
in Greenbay/Rockcastleunaudited
for thesix months
endedDec 2017
R’000
Adjustment 3Proportionateconsolidationof investmentin Portuguese
joint ventureunaudited
for thesix months
endedDec 2017
R’000
Adjustment 4Proportionateconsolidation
of partially-owned
subsidiariesunaudited
for thesix months
endedDec 2017
R’000
Restatedmanagement
accountsunaudited
for thesix months
endedDec 2017
R’000
Recoveries and contractual rental revenue 1 292 063 1 292 063 78 705 (73 871) 1 296 897
Straight-lining of rental revenue adjustment 26 684 26 684 (1 565) 25 119
Revenue from direct property operations 1 318 747 – 1 318 747 – – 78 705 (75 436) 1 322 016
Revenue from investments 701 072 (183 853) 517 219 78 506 595 725
Total revenue 2 019 819 (183 853) 1 835 966 – 78 506 78 705 (75 436) 1 917 741
Fair value gain on investment property, investments and currency derivatives 5 372 314 (1 108 270) 4 264 044 – 1 604 353 – 1 565 5 869 962
Adjustment resulting from straight-lining of rental revenue (26 684) (26 684) 1 565 (25 119)
Fair value gain on investments 5 416 313 (1 108 270) 4 308 043 1 604 353 5 912 396
Fair value loss on currency derivatives (17 315) (17 315) (17 315)
Property operating expenses (472 543) (472 543) (27 382) 32 267 (467 658)
Administrative expenses (60 127) 7 028 (53 099) 4 418 (48 681)
Foreign exchange losses (36 558) (36 558) 12 118 (24 440)
Profit on sale of interest in associate 3 538 393 3 538 393 (3 538 393) –
(Loss)/income from associates and joint venture (5 036) – (5 036) – 32 585 (27 549) – –
– distributable 108 569 108 569 (78 506) (30 063) –
– non-distributable (113 605) (113 605) 111 091 2 514 –
Profit before net finance costs 10 356 262 (1 285 095) 9 071 167 – (1 822 949) 23 774 (25 068) 7 246 924
Net finance costs (660 928) 589 659 (71 269) – – – 25 320 (58 886)
Finance income 190 725 222 475 413 200 – – – 25 443 438 643
Interest received: cross-currency swaps 142 717 142 717 142 717
Interest received: loans 39 695 220 098 259 793 25 443 285 236
Fair value adjustment on interest rate derivatives 8 313 2 377 10 690 10 690
Finance costs (851 653) 367 184 (484 469) – – (12 937) (123) (497 529)
Interest on borrowings (880 334) 367 184 (513 150) (12 937) 720 (525 367)
Capitalised interest 28 681 28 681 (843) 27 838
Profit before income tax 9 695 334 (695 436) 8 999 898 – (1 822 949) 10 837 252 7 188 038
Income tax (27 781) (27 781) (10 837) – (38 618)
Profit for the period 9 667 553 (695 436) 8 972 117 – (1 822 949) – 252 7 149 420
Profit for the period attributable to:
Equity holders of the company 9 667 805 (695 436) 8 972 369 (1 822 949) 7 149 420
Non-controlling interests (252) (252) 252 –
9 667 553 (695 436) 8 972 117 – (1 822 949) – 252 7 149 420

4th Floor, Rivonia Village, Rivonia Boulevard, Rivonia, 2191 PO Box 2555, Rivonia, 2128 | Tel: +27 (0) 11 612 6800 | Fax: +27 (0) 11 612 6869
www.resilient.co.za


