
DCN 97.21321001.08
Results of High Velocity Tests atTampa Electric Company’s
Big Bend 4 FGD System
Topical Report
DE-AC22-92PC91338
Prepared for:
U.S. Department of EnergyPittsburgh Energy Technology Center
P.O. Box 10940Pittsburgh, PA 15236
Prepared by:
David P. DeKrakerRadian International LLC
P.O. Box 201088Austin, TX 78720-1088
October 15, 1997

iii
Disclaimer
This report was prepared as an account of work sponsored by an agency of the United
States Government. Neither the United States Government nor any agency thereof, nor any of
their employees, makes any warranty, express or implied, or assumes any legal liability or
responsibility for the accuracy, completeness, or usefulness of any information, apparatus,
product, or process disclosed, or represents that its use would not infringe privately owned rights.
Reference herein to any specific commercial product, process, or service by trade name,
trademark, manufacturer, or otherwise does not necessarily constitute or imply its endorsement,
recommendation, or favoring by the United States Government or any agency thereof. The views
and opinions of authors expressed herein do not necessarily state or reflect those of the United
State Government or any agency thereof.

v
Table of Contents
1.0 Introduction ........................................................................................................................1-1
2.0 Summary .............................................................................................................................2-1
3.0 Test Conditions and Results ..............................................................................................3-1
3.1 Test Approach ..................................................................................................................3-13.2 Test Measurements...........................................................................................................3-5
3.2.1 Flue Gas Sampling ...................................................................................................3-53.2.2 Slurry Sampling and Chemical Analyses .................................................................3-6
3.3 Test Results ......................................................................................................................3-63.3.1 Mist Eliminator ........................................................................................................3-63.3.2 FGD System Performance Tests...............................................................................3-83.3.3 Analytical Results for Slurry Samples ....................................................................3-103.3.4 Other Process Data ................................................................................................3-173.3.5 Long-Term High Velocity Testing ..........................................................................3-18
APPENDIX A: ANALYTICAL DATA ................................................................................................ A-1

vii
List of Figures
Figure 3-1. Recycle Slurry Pump Configuration..........................................................................3-2
Figure 3-2. Mist Eliminator Gas Velocity and Carryover Measurement Locations ....................3-4
Figure 3-3. Effect of Gas Velocity on SO2 Removal .................................................................3-11
Figure 3-4. Effect of DBA Concentration on SO2 Removal ......................................................3-12
Figure 3-5. Effect of pH on Quench Calcium Sulfite Relative Saturation.................................3-14
Figure 3-6. Effect of pH on Limestone Utilization ....................................................................3-16
List of Tables
Table 3-1. High-Velocity Test Plan...............................................................................................3-3
Table 3-2. Slurry Sampling and Chemical Analyses ...................................................................3-6
Table 3-3. Mist Eliminator Velocity and Carryover Results........................................................3-7
Table 3-4. SO2 Removal Efficiency Test Results ........................................................................3-8
Table 3-5. Comparison of Radian and TECo Calcium Carbonate Analyses .............................3-18
Table 3-6. Settling Test Results .................................................................................................3-18

1-1
1.0 Introduction
Based on the results of DOE-sponsored testing of DBA additive at Big Bend Station during
November, 1992, Tampa Electric Company (TECo) has successfully completed modifications to
treat flue gas from 445 MW Unit 3 as well as that from 485 MW Unit 4 in the original Unit 4 flue
gas desulfurization (FGD) system. Currently, the integrated Unit 3 and 4 FGD system is treating
twice the design amount of flue gas by operating all four modules (instead of three) at a maximum
flue gas velocity of about 10 to 11 ft/s. This velocity is about 50% greater than the original design
velocity.
Recent tests at EPRI’s Environmental Control Technology Center (ECTC) and by others
have shown that operation at higher flue gas velocity improves mass transfer effectiveness. EPRI is
currently evaluating an advanced limestone FGD system that is designed to operate at an absorber
velocity of 18 ft/s. Tampa Electric is now considering scrubbing flue gas from 445 MW Unit 2 as
well as Units 3 and 4 in the existing FGD system. Integrating Unit 2 into the FGD system would
increase the absorber flue gas velocity to about 16 ft/s, or about double the original design value.
In order to evaluate the feasibility of integrating Unit 2 into the Big Bend FGD system,
TECo has modified a single module of the FGD system to permit operation at flue gas velocities as
high as 17 ft/s. This report describes results of additional tests to evaluate the SO2 removal
capability of the modified test module at high flue gas velocity.
Two sections follow this introduction: Section 2 provides a summary of the test results,
and Section 3 provides details of the testing and results. Lab data are presented in Appendix A.

2-1
2.0 Summary
Tests were conducted at the Big Bend Station on May 27 through June 6, 1997, to determine
the feasibility of scrubbing gas from an additional boiler (Unit 2) in the existing FGD system.
Testing was accomplished by increasing the gas flow through the D absorber tower and measuring
the performance of this module. Key performance aspects evaluated during the testing include mist
eliminator performance, SO2 removal efficiency, oxidation of absorbed SO2, and limestone
utilization (and its impact on gypsum purity). Oxidation and limestone utilization performance
characteristics are especially important at Big Bend, since the station sells its gypsum byproduct
commercially and must meet gypsum purity specifications.
Mist eliminator performance was assessed using a Phase Doppler Particle Analyzer (PDPA)
probe to measure gas velocity and carryover through the mist eliminator. These tests showed that
the existing mist eliminators could handle a gas velocity of up to 13.5 ft/s without excessive
carryover. This falls short of the 16.5 ft/s which would occur if gas from Unit 2 was scrubbed in the
existing absorbers. However, mist eliminator vendors reportedly have more advanced mist
eliminator designs which are capable of handling the increased gas velocity. The advanced mist
eliminator designs have not been tested at Big Bend, but assuming they perform as well as vendors
claim, mist eliminator performance should not be an obstacle to scrubbing the flue gas from an
additional unit in the existing FGD system absorbers.
SO2 removal performance was measured during short-term tests at gas velocities up to 15
ft/s and in longer-term tests at gas velocities up to 13.5 ft/s. Dibasic acid (DBA) was added to the
test module as a performance additive during all of these tests. The results of these tests indicate that
it is possible to achieve high SO2 removal efficiencies at the higher gas velocities. Removal
efficiency tended to increase as gas velocity increased, a result that is consistent with other data
from laboratory- and full-scale testing. In particular, a removal efficiency of 99% was measured at
the highest gas velocity tested, 15 ft/s. Thus the ability to achieve adequate SO2 removal while
scrubbing flue gas from an additional unit should not be a problem.
The FGD system at Big Bend operates in a forced oxidation mode to produce a gypsum
byproduct that is used as a feedstock for producing wallboard. Achieving compete oxidation of
the SO2 removed is an important part of meeting the gypsum purity specifications. Oxidation
efficiency is normally determined by measuring the composition of the solids produced in the FGD
system. However, the tests performed were mostly short-term, and did not allow time for the solids

2-2
composition to come to steady state. Oxidation was instead assessed by looking at liquid phase
chemistry, specifically, the calcium sulfite relative saturation. The calcium sulfite relative saturation
was consistently less than 1.0 in the upper loop; this is an indicator of complete oxidation in this
loop. On the other hand, in the lower loop the calcium sulfite relative saturation frequently increased
to above 1.0. This indicates that a mixture of calcium sulfite hemihydrate and gypsum solids could
be precipitated within this loop, and that oxidation was not complete. The high relative saturations
occurred only at high lower loop pH. This suggests that complete oxidation could be achieved in the
lower loop if the pH consistently remained low. Maintaining lower pH values would require
minimizing the amount of calcium carbonate carried into the lower loop from the upper loop.
Additional testing would be required to determine how to best do this on an ongoing basis. One
possible solution would be absorber modifications to reduce slurry carry-up from the lower loop to
the upper loop, thus minimizing the amount of upper-loop slurry that has to be feed to the lower
loop to maintain slurry levels. Another would be to operate the upper loop with less excess calcium
carbonate (higher limestone utilization) in the recirculating slurry.
Calcium carbonate concentration, especially in the lower loop, is also important because of
its direct impact on gypsum byproduct purity. Calcium carbonate concentration is commonly
reported in terms of limestone utilization: high limestone utilization indicates a low calcium
carbonate concentration. The limestone utilization was generally high during the testing. However,
during three tests (Tests 3, 7 and 8) the limestone utilizations were low enough that the lower loop
calcium carbonate concentrations exceeded the value allowed by the gypsum purity specification
(1.5% CaCO3 maximum). During Tests 7 and 8, the low utilization was thought to be due to a
blinding episode induced by the rapid addition of DBA to the absorber. Though the mechanism for
this blinding is not well understood, blinding has been observed at other FGD systems when
DBA is added to a scrubber rapidly. Since rapid addition of DBA was related to this short-term
testing and would not typically occur during normal operation, the blinding which occurred during
these two tests should not be a concern. The cause of the low utilization during Test 3 was not
obvious, although plant personnel indicated that incidents of low limestone utilization recur
occasionally during normal operation. Further testing is warranted to determine if it is possible to
consistently avoid a repeat of the low utilization observed during this test.
Results from this program suggest that the analytical accuracy of the on-site calcium
carbonate measurements should be verified: these measurements are important because they are
used to determine if the gypsum byproduct meets its purity specification. A comparison of the test
sample analyses conducted off site and the daily on-site analyses showed that the on-site analyses
consistently measured higher calcium carbonate concentrations. Since these two types of samples

2-3
were collected at different times during the day, some differences are to be expected. However, the
consistently higher results obtained in the daily on-site analyses suggest that there could be some
bias in the measurement method. This could easily be checked by splitting samples for comparison
of results with one or more outside labs.
In summary, this test program did not conclusively determine whether or not gas from Unit
2 could be successfully scrubbed in the existing FGD system on a continuing basis. The ability to
achieve sufficient SO2 removal, perhaps the most important aspect of scrubber performance, does
not appear to be a concern. However, the sulfite oxidation and limestone utilization performance
did not consistently meet the requirements of the gypsum byproduct purity specifications.
Operational changes to improve the oxidation and limestone utilization performance were
identified, but there was not sufficient time during the test program to make and test these
changes.

3-1
3.0 Test Conditions and Results
3.1 Test ApproachThe Big Bend FGD system uses dual-loop, countercurrent absorbers with packing in the
upper loop. The system was originally configured with the upper-loop slurry recycle pumps
feeding a common manifold to deliver slurry to three internal spray levels (see Figure 3-1). Two
of the upper-loop pumps were in service during normal operation; they delivered a total slurry
flow of approximately 30,000 gpm to give an upper-loop liquid to gas (L/G) ratio of 65 (gpm per
thousand acfm treated) and an overall L/G of 87.
The FGD system was subsequently modified to scrub both Units 3 and 4. To scrub this
additional flue gas, all four absorber modules are operated (no spare now), DBA is used as a
performance additive (DBA is a mixture of adipic, glutaric, and succinic acids), and the absorber
slurry piping was modified. The latter included revisions so that all three pumps would be in
service, with pumps #1 and #3 providing slurry to the header above the packing and pump #2
providing slurry below the packing. This revision is also shown in Figure 3-1.
Prior to this most recent test program, additional modifications were made to one
absorber module (Module D) to permit the scrubbing of additional gas. These included:
• Installing a larger booster fan motor and fan rotor;
• Replacing the upper-loop nozzles to increase liquid flow, to maintain liquid-to-gasratio (L/G) at the high gas velocity conditions;
• Improving the upper-loop drain bowl capacity by installing a vortex breaker andextending the depth of the drain in the recycle tank;
• Upgrading the upper-loop hydrocyclones to control upper-loop density;
• Increasing the capacity of the upper-loop oxidation air headers; and
• Increasing the flow rate of the mist eliminator wash system.
Based on pump power calculations and pump performance curves, each of the three upper-
loop recycle pumps provides a flow of about 15,000 gpm. The lower-loop recycle pumps and piping
were not modified. The total slurry flow to the lower loop was previously measured at about 10,000
gpm. With these changes, the overall L/G for the scrubber would be approximately 56 at the gas

Upper-Loop Pumps Lower-Loop Pumps
Upper-Loop Pumps Lower-Loop Pumps
Figure 3-1. Recycle Slurry Pump Configuration
Original Configuration
Current Configuration
3-2

3-3
flow expected if the FGD system were modified to scrub Unit 2 as well (16.5 ft/sec gas velocity).
This L/G is about 35% lower than the original design value.
Some changes were also made to the Module D operating and control strategy. Previously,
the upper-loop recycle tank level was fixed by overflow into the lower-loop tank and the upper-loop
density was controlled by directing the hydroclone underflow either back to the upper loop or to the
lower loop. With the higher oxidation air flow, the upper-loop recycle tank operating level had to be
decreased from the normal overflow level of 26 ft to 21 ft. The tank level is no longer fixed by
overflow, and is now controlled by directing all of the hydroclone underflow to the lower loop, and
opening or closing the hydroclone feed valve to control level. The upper-loop density is not
controlled and is allowed to vary with the amount of SO2 removal.
Table 3-1 shows the test plan for the high-velocity tests. The tests began with two days of
mist eliminator performance measurements. Mist eliminator performance was expected to be the
limiting factor in high-velocity absorber operation. At high velocity, mist droplets that are collected
on the chevron mist eliminator blades can be stripped from the blades and reentrained by the flue
gas before they can drain back into the absorber.
Table 3-1. High-Velocity Test Plan
Test Objective Duration Velocity (ft/s) DBA (mg/L)ME-1 Traverse mist eliminator to locate high-velocity
areas1 day 12 Normal (1000)
ME-2 Measure reentrainment to establish maximumsustainable operating velocity
1 day Variable Normal
ME-3 Measure reentrainment at maximum sustainableoperating velocity
4 hrs. 13.5 Normal
1 Measure system performance at normal velocity 2 days Normal (10.5) Normal2, 3, 4 Measure SO2 removal versus velocity 2 hrs. 10.5, 13, 16 Normal
5 Measure FGD system performance at maximumsustainable velocity
2 days 13.5 Normal
6, 7, 8 Measure SO2 removal versus DBA concentration 2 hrs. 13.5 1000, 1500, 2000
Mist eliminator performance was monitored by a test crew from Koch Engineering using
their Phase Doppler Particle Analyzer (PDPA), which measures mist droplet size and velocity using
an optical laser technique. The PDPA probe was traversed along two cables suspended about two
feet above the upper mist eliminator stage. Figure 3-2 shows the location of the test cables relative
to the absorber module cross section.

2 ft
5 ft
8 ft
11 ft
14 ft
17 ft
Figure 3-2. Mist Eliminator Gas Velocity and Carryover Measurement Locations
3-4

3-5
During the first test day (Test ME-1), the module was operated at a nominal flue gas
velocity of 12 ft/s, and the module was traversed using the PDPA. The objective of this test was to
examine the velocity profile through the mist eliminator to locate areas of locally high velocity.
During the second test day (Test ME-2), the PDPA probe was fixed at the highest-velocity
location and the flue gas velocity was increased incrementally until reentrained droplets were
detected. During the third test day (Test ME-3), the absorber module was operated at the highest
velocity that could be sustained without reentrainment during the previous test, and the module
was traversed with the PDPA probe to verify the single-point results.
Following the mist eliminator testing, the remaining tests were designed primarily to
examine the effects of absorber flue gas velocity on system performance. Two types of tests were
done. Three two-day tests were done to enable complete evaluation of absorber performance and
slurry chemistry at different steady-state conditions. The first two-day test (Test 1) was run at
normal operating conditions (11 ft/s absorber velocity, 1000 mg/L DBA, 4.5 to 4.7 lb/mm Btu
inlet SO2). For the second two-day test (Test 5), the absorber flue gas velocity was increased to
about 13.5 ft/s, which was the maximum sustainable operating velocity with the existing mist
eliminator configuration. For the third two-day test, the velocity was maintained at 13.5 ft/s, and
the inlet SO2 was increased from the normal 4.5 lb/mm Btu to 6.1 lb/mm Btu by switching the
coal fired in the boilers. These conditions were intended to evaluate absorber chemistry under the
higher SO2 loading that would be encountered with the normal fuel at velocities of 16 ft/sec or
greater.
Two groups of three two-hour tests were done to measure changes in absorber SO2
removal efficiency with changes in either flue gas velocity or DBA concentration. For Tests 2, 3,
and 4, the absorber flue gas velocity was set at 10, 13, and 16 ft/s, respectively, with other
conditions remaining constant. For Tests 6, 7, and 8, the velocity was maintained at 13.5 ft/s and
the DBA concentration was set at 1000, 1500, and 2000 mg/L, respectively.
3.2 Test MeasurementsTest measurements included flue gas sampling and analyses, slurry sampling and
analyses, and process data obtained from on-line monitors.
3.2.1 Flue Gas SamplingSO2 removal efficiency for the absorber module was measured by continuous emissions
monitors (CEMs). A certified monitor was already in place to measure inlet SO2 concentration
for the Unit 4 FGD system. Results from this CEM were available on line through the plant data

3-6
acquisition system. The SO2 concentration at the absorber outlet was measured by a crew from
TECo’s Central Testing Laboratory using a portable CEM. The absorber module outlet duct was
traversed with the CEM probe and the results for the 24 points were averaged to calculate the
outlet SO2 concentration.
3.2.2 Slurry Sampling and Chemical AnalysesTable 3-2 summarizes the slurry sampling and analytical schedule for the tests. Each of
the samples designated in the table includes a sample from both the lower-loop and upper-loop
slurry tanks. For each sample, slurry pH was measured at the sample points using a portable pH
meter. For the two-day tests, the two sets of samples were taken during the afternoon of the
second test day.
Table 3-2. Slurry Sampling and Chemical Analyses
Test Performance IndicatorsNumber of
Samples Liquid Analyses Solid Analyses1 SO2 removal, utilization oxidation,
gypsum R.S., chloride balance,solids properties
2 pH, Ca, Mg, Na, Cl,SO3, SO4, CO3, DBA
Wt.% solids, acidinsolubles, Ca, Mg, SO3,SO4, CO3, SEM
2, 3, 4 SO2 removal 1 pH, DBA Wt.% solids, CO3
5 SO2 removal, utilization oxidation,gypsum R.S., chloride balance,solids properties
2 pH, Ca, Mg, Na, Cl,SO3, SO4, CO3, DBA
Wt.% solids, acidinsolubles, Ca, Mg, SO3,SO4, CO3, SEM
6, 7, 8 SO2 removal 1 pH, DBA Wt.% solids, CO3
Complete liquid and solid analyses were done for samples from the two-day tests. Results
were used to calculate important process performance parameters including limestone utilization,
sulfite oxidation and gypsum relative saturation. Settling tests were also done with samples from
the two-day tests, and scanning electron microscopy was used to examine the size and shape of
the gypsum byproduct.
For the short-term tests, during which SO2 removal efficiency was measured, samples
were analyzed only for liquid-phase DBA concentration and solid-phase carbonate (limestone)
content, both of which affect removal efficiency.
3.3 Test Results
3.3.1 Mist EliminatorThe mist eliminator tests were performed to determine the maximum velocity at which
the D absorber could be operated without experiencing excessive carryover. This was determined

3-7
through flue gas velocity and mist carryover measurements made by Koch Engineering using the
Phase Doppler Particle Analyzer (PDPA); results from the testing are summarized in Table 3-3.
Table 3-3. Mist Eliminator Velocity and Carryover Results
Test DatePDPA Lens
(mm)Distance from
Wall (ft)Traverse
LineVelocity
(ft/s)Carryover
(gr/acf)
ME1 5/28/97 100 2 Center 11.9 0.00031ME1 5/28/97 100 5 Center 11.6 0.01628ME1 5/28/97 100 8 Center 11.8 0.00057ME1 5/28/97 100 11 Center 12.0 0.00034ME1 5/28/97 100 14 Center 13.0 0.01746ME1 5/28/97 100 17 Center 14.0 0.00038ME1 5/28/97 100 2 Left 11.4 0.00373ME1 5/28/97 100 5 Left 11.6 0.00351ME1 5/28/97 100 8 Left 11.0 0.02094ME1 5/28/97 100 11 Left 11.2 0.00074ME1 5/28/97 100 14 Left 11.3 0.00127ME1 Averages 11.9 0.006ME2 5/29/97 300 17 Center 13.6 2.02e-6ME2 5/29/97 300 17 Center 13.6 1.10e-5ME2 5/29/97 300 17 Center 14.0 0.00189ME2 5/29/97 300 17 Center 16.0 0.03114
ME3 5/30/97 300 5 Center 12.0 4.71e-5ME3 5/30/97 300 8 Center 13.4 0.00039ME3 5/30/97 300 11 Center 12.6 2.68e-6ME3 5/30/97 300 14 Center 14.0 0.00920ME3 5/30/97 300 17 Center 15.2 9.82e-5ME3 Averages 13.4 0.00195
The first series of tests (Test Series ME1) was designed to obtain an average velocity and
carryover rate for the tower and also to identify the location of the highest flue gas velocity.
Measurement data collected along two traverse lines in the tower (Figure 3-2) showed an average
carryover rate of 0.006 gr/acf at an average superficial velocity of 11.9 ft/s at the mist eliminator,
resulting in a unit rate of about 9 x 10⁻⁵ gpm/ft2. These tests also showed that the highest velocity
within the tower occurred at the center, where the velocity was roughly 20% higher than the
average.
The second series of tests (Test Series ME2) was designed to determine the average flue
gas velocity at which carryover became excessive. For this test series, the PDPA probe was
located at the center of the tower (the highest velocity location), and measurements were then
made at a several gas velocities. These tests showed that increased carryover rates began to occur

3-8
at average velocities greater than 13.5 ft/s. The test data also indicated that large droplets
(indicative of mist eliminator reentrainment) began to be seen at velocities exceeding 13.5 ft/s.
Allowing for a 15% area reduction due to support structure and wash headers, and assuming that
the center velocity was 20% higher than the average velocity, this limit corresponds to a mist
eliminator “breakthrough” velocity of about 19 ft/s, which agrees well with the expected
performance of this mist eliminator type (Munters T272/T271).
The third series of tests (Test Series ME-3) was a partial traverse of the mist eliminator
with the flue gas velocity set at about 13.5 ft/s. This series of tests was intended to confirm the
results of test ME2, that the mist eliminators do have satisfactory performance at a gas velocity
of 13.5 ft/s. Results of this test series showed that an average carryover rate of 0.0019 gr/acf
occurred at a gas velocity of 13.4 ft/s. This performance was considered to be right at the “edge”
at which carryover becomes significant (based on carryover rate and the presence of large
diameter droplets which are suggestive of re-entrainment from the mist eliminators) and was thus
selected as the highest velocity at which any subsequent long-term test could be performed.
It is important to note that the mist eliminator tests reflect the current mist eliminator
performance; different mist eliminators may be able to handle higher gas velocities. In particular,
discussions with vendors suggest that newer mist eliminator designs could accommodate the gas
velocities that would occur if all of the gas from Unit 2 was scrubbed in the existing FGD
system.
3.3.2 FGD System Performance TestsThe objective of the FGD system performance tests was to determine the SO2 removal
efficiency of the D tower as a function of gas velocity and DBA concentration. Tests were
performed at gas velocities ranging from 10.3 to 15.1 ft/s and at DBA concentrations ranging
from 1470 to 3850 ppm. A summary of the removal efficiency test results is shown in Table 3-4.
Table 3-4. SO2 Removal Efficiency Test Results
Test Date TimeVelocity
(ft/s) pHUpper LoopDBA (mg/L)
SO2 In(lb/mm Btu)
SO2 Out(lb/mm Btu)
Eff.(%)
1 6/2 1447-1613 10.3 5.56 1470 4.8 0.116 97.62 6/3 1147-1349 10.5 5.39 1570 4.6 0.124 97.33 6/3 1505-1647 12.9 5.26 1860 4.5 0.074 98.44 6/3 1746-1927 15.1 5.24 1910 4.5 0.039 99.15 6/5 1019-1201
1300-144013.613.5
5.315.12
20602310
4.454.45
0.1140.101
97.497.7
6 6/6 1002-1145 13.5 5.35 1530 4.8 0.264 94.57 6/6 1233-1417 13.5 5.45 2860 4.85 0.117 97.68 6/6 1455-1638 13.5 5.27 3850 4.4 0.060 98.6

3-9
Operating conditions for performance Test 1 were established at 1800 on Saturday,
5/31/97, but steady-state operation was not achieved until Tuesday morning, 6/3/97, because the
pH set point had been lowered during the night of 6/1/97. After operating at the correct pH
setpoint (5.4) during the day on Monday, 6/2/97, the SO2 removal efficiency measurement was
completed that afternoon. The inlet SO2 concentration was 4.75 lb/mm Btu (2040 ppmv), and the
outlet concentration averaged 0.116 lb/mm Btu, for a removal efficiency of 97.6%. The absorber
flue gas velocity for Test 1 was 10.3 ft/s. Steady-state samples for chemical analyses were taken
early in the morning of 6/3/97.
Test 2 was conducted during the morning of 6/3/97. Because the absorber gas velocity for
Test 1 was close to the desired velocity for Test 2, conditions were not changed for Test 2. The
measured SO2 removal efficiency for Test 2 was 97.3% (4.6 lb/mm Btu inlet, 0.124 lb/mm Btu
outlet). This result was close to that for Test 1, indicating good reproducibility for the tests.
After samples were collected at Test 2 conditions, the absorber flue gas velocity was
increased to 12.9 ft/s for Test 3. All other operating conditions remained the same. However, it
was observed on the control-room recorder that the lower-loop slurry pH increased somewhat
because of reagent carryover from the upper loop into the lower-loop recycle tank. SO2 removal
efficiency for Test 3 increased to 98.4% (4.66 lb/mm Btu inlet, 0.074 lb/mm Btu outlet).
Test 4, the final test in the series at increasing flue gas velocity was conducted at 15.1 ft/s
(also on 6/3/97). Again, all other operating conditions remained the same. For this test, SO2
removal efficiency increased to 99.1% (4.5 lb/mm Btu inlet, 0.039 lb/mm Btu outlet).
Following Test 4, the absorber flue gas velocity was decreased to 13.5 ft/s, which was the
maximum allowable for sustained operation, and Test 5 began (6/3/97). This was a two-day test
to evaluate steady-state performance. Two successive measurements of SO2 removal efficiency
performed on 6/5/97 for this test yielded 97.4 % and 97.7 % removal. Two sets of slurry samples
were collected concurrently with the SO2 removal measurements.
Tests 6, 7, and 8 were conducted on the final day of testing, 6/6/97. These three two-hour
tests were done to measure the effect of increasing DBA concentration on SO2 removal
efficiency. Test 6 was conducted at the DBA concentration that was present in the test module as
a result of normal operations. For Tests 7 and 8, about 200 gallons of 50% DBA solution were
added to the upper-loop recycle tank of the test module prior to each test. All other test
conditions remained the same during these three tests.

3-10
The most important result of these tests is demonstrating that it is possible to achieve
97% removal (or higher) over a range of gas velocities and DBA concentrations. Only one test
(Test 6) recorded an SO2 removal of less than 97 percent.
The effect of gas velocity on SO2 removal for Tests 1-4 is shown in Figure 3-3. These
data indicate that the SO2 removal increases as a function of velocity. Measured SO2 removals
ranged from slightly over 97% at approximately 10 ft/s gas velocities to roughly 99% at a gas
velocity of 15 ft/s. The DBA concentration also trended slightly higher with the higher gas
velocities; however it does appear that the primary factor leading to the increase in removal is the
increase in gas velocity.
The effect of DBA concentration on SO2 removal for Test 3 and Tests 5 through 8 (all
tests at ~13 ft/s gas velocity) is shown in Figure 3-4. The most noticeable aspect of this figure is
that the measured removal for Test 6 is surprisingly low compared to the other data obtained at
~13 ft/s. Some decrease in removal is expected at lower DBA concentrations, but the SO2
removal measured during Test 6 is lower than expected, considering that removals measured
during all other tests exceed 97 percent. The reason that the measured removal was low during
Test 6 is not known; a review of the chemistry and operational data from the test did not provide
any obvious explanations.
Excluding the Test 6 results, the data in Figure 3-4 suggest that SO2 removal is fairly
insensitive to DBA concentration over this range. Specifically, even at very high DBA
concentrations (3850 ppm), the maximum removal that was achieved with DBA alone was
98.6%. Since a very high SO2 removal (99.1%) was achieved at a comparatively low DBA
concentration (1910 ppm) during Test 4, it seems clear that the primary factor leading to the high
SO2 removal was the high velocity.
With almost all of the data falling within the 97% to 99% removal range, it is possible
that a substantial portion of the variability among the measured removals is a result of
measurement inaccuracy and normal process variability. However, with almost all of the data
showing removal above 97%, it is clear that the scrubbers are capable of achieving a high level
of SO2 removal when operating at increased gas velocities.
3.3.3 Analytical Results for Slurry SamplesThe slurry analyses provide insights into a number of important aspects of operating with
increased gas velocities. These include the ability to oxidize the slurry, maintaining high

Figure 3-3. Effect of Gas Velocity on SO2 Removal
Gas Velocity (ft/s)
8 10 12 14 16
SO
2 R
emov
al (%
)
95
96
97
98
99
100
3-11

Figure 3-4. Effect of DBA Concentration on SO2 Removal
DBA Concentration (ppm)
1000 1500 2000 2500 3000 3500 4000
SO
2 R
emov
al (%
)
94
95
96
97
98
99
100
3-12

3-13
limestone utilizations in both the upper loop and lower loop, and the increased amount of slurry
carry-up that occurs at higher gas velocities. The liquid- and solid-phase analyses are presented
in Appendix A. Important results are discussed below.
One of the most important issues associated with increasing the amount of gas treated by
the scrubbers is the ability to oxidize all of the SO2 absorbed. In normal operation, this would be
evaluated by looking at the solids oxidation results. However, since most of the tests were short
term tests, there was usually not sufficient time to allow the solids to come to steady state at the
operating conditions. So for these tests, oxidation is instead being evaluated based on liquid
phase analyses, which respond much more quickly to changes in operating conditions.
The liquid-phase result that is most important for evaluating oxidation percentage is the
calcium sulfite relative saturation. As long as the calcium sulfite relative saturation is below 1.0,
calcium sulfite solids will not form, and under these conditions the oxidation will be close to or
equal to 100 percent. If the calcium sulfite relative saturation exceeds 1.0, calcium sulfite solids
will form and the oxidation percentage will be less than 100.
The calcium sulfite relative saturation in the upper loop was less than 1.0 for all tests.
This indicates that the oxidation in the upper loop was adequate for the full range of the test
conditions. On the other hand, the calcium sulfite relative saturation in the lower loop was often
above 1.0. As shown in Figure 3-5, this generally occurred when the pH of the lower-loop slurry
exceeded 4.0. However, because the high lower-loop pH levels corresponded with the high
velocity tests, it may be that the increased sulfur loading and greater SO2 removal also
contributed to the difficulty in achieving complete oxidation. Because several variables changed
at once, it is not possible to determine how each of these factors affects the oxidation. Additional
testing would be required to confirm that complete oxidation in the lower loop can be achieved
by maintaining the pH at 4.0 or lower. Since the pH in the lower loop is largely dependent on the
amount of calcium carbonate carried over from the upper loop, this would entail minimizing the
amount of calcium carbonate carried over from the upper loop.
The amount of carry-up from the lower loop to the upper loop is another aspect of
performance that can be determined from the chemical analyses. In particular, the chloride
concentration in the upper loop is an indication of the amount of carry-up that is occurring in the
absorber. Chloride concentrations in the upper loop ranged from about 8300 ppm to over 14,000
ppm, roughly 70% to 80% of the lower loop concentrations. Since the primary way in which
chloride enters the upper loop is through carry-up from the lower loop, the amount of carry-up

Figure 3-5. Effect of pH on Quench Calcium Sulfite Relative Saturation
pH
3.5 4.0 4.5 5.0 5.5
CaS
O3
Rel
ativ
e S
atur
atio
n
0
2
4
6
8
3-14

3-15
must be substantial. For comparison purposes, during the 1992 performance testing, conducted at
~7.5 ft/s gas velocities, upper-loop chloride concentrations were typically 20% to 30% of the
lower-loop concentrations. During the month prior to the June performance tests, with the tower
operated at ~10.5 ft/s, the upper-loop chloride concentrations were typically 55% to 70% of the
lower-loop concentrations. The actual chloride concentrations are not a concern, since the
absorber materials are capable of handling chloride concentrations as high as 20,000 ppm.
However, the impact of carry-up on the absorber material balance is a concern.
Specifically, the concern caused by increased carry-up from the lower loop to the upper
loop is that this carry-up must be balanced by feeding slurry from the upper loop to the lower
loop to maintain slurry levels in the two recycle tanks. Feeding slurry from the upper loop to the
lower loop is a problem in that the upper-loop slurry has a comparatively high calcium carbonate
concentration. This increases the amount of carbonate in the lower loop, which increases the pH.
This causes difficulty in maintaining complete oxidation and may also increase the carbonate
concentration (potentially making the gypsum byproduct unsuited for reuse). Minimizing the
amount of carbonate fed from the upper loop to the lower loop will thus be a key part of
scrubbing gas from an additional unit. Possible ways this might be accomplished include
operating the upper loop at lower excess carbonate concentration and/or making mechanical
changes in the absorber to reduce the amount of slurry carry-up from the lower loop to the upper
loop. Further evaluation would be required to determine how to best address the problems
associated with this carry-up.
Another important performance indicator is limestone utilization measured in the upper-
loop and lower-loop solids. Maintaining high limestone utilization (low excess calcium
carbonate concentration) is especially important in the lower loop, since high calcium carbonate
concentrations can make the gypsum unsuitable for reuse. High limestone utilizations are also
important in the upper loop, since upper-loop slurry added to the lower loop to maintain recycle
tank levels can lead to excessive calcium carbonate concentrations in the lower loop.
The limestone utilizations for both the upper- and lower-loop sections are plotted as a function of
pH in Figure 3-6. With the exception of Tests 3, 7, and 8, the lower-loop utilization values are
over 98% (and CaCO3 concentrations are less than 1.0%). During Test 3, a slightly lower
utilization of ~97% (CaCO3 concentration of 1.9%) was measured in the lower loop. The lower
utilization of Test 3 appears to be caused by the addition of relatively high calcium carbonate
content slurry from the upper loop to the lower loop to maintain level. However, the reason for
the relatively high calcium carbonate content in the upper loop in Test 3 is not known.
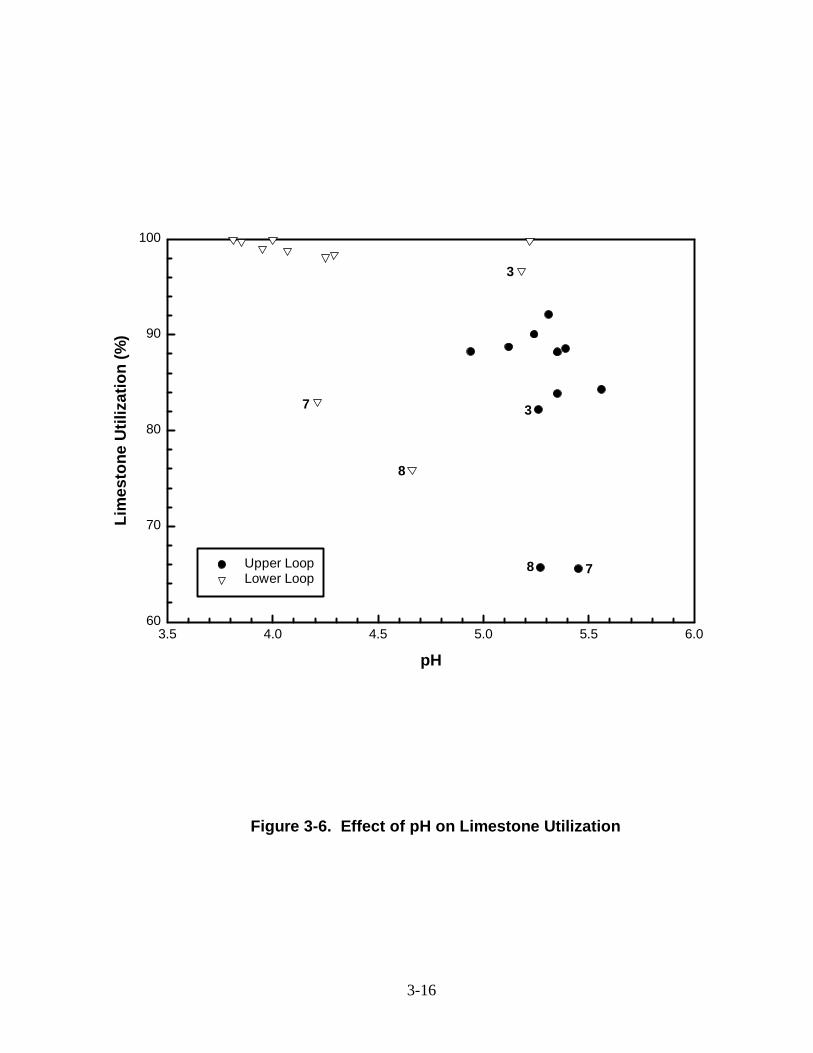
Figure 3-6. Effect of pH on Limestone Utilization
pH
3.5 4.0 4.5 5.0 5.5 6.0
Lim
esto
ne U
tiliz
atio
n (%
)
60
70
80
90
100
Upper LoopLower Loop
8 7
8
7
3
3
3-16

3-17
During Tests 7 and 8, the upper-and lower-loop sections each experienced limestone
blinding, apparently resulting from the very rapid addition of DBA to the test absorber. Though
the mechanism for this blinding is not well understood, this is a relatively common occurrence
when DBA is added to a scrubber rapidly. The blinding led to very low utilization and high
calcium carbonate concentrations for both of these tests. Because DBA was added to the test
absorber at such a rapid rate only to facilitate these short-term tests, this blinding is not
representative of what might be seen under normal conditions.
The solids analyses therefore indicate that it should be possible to meet the gypsum
byproduct purity specifications while operating with the increased gas flows. Long-term
operation at high gas velocities would be desirable to determine if it is possible to avoid the
recurrence of the low utilization that was encountered during Test 3.
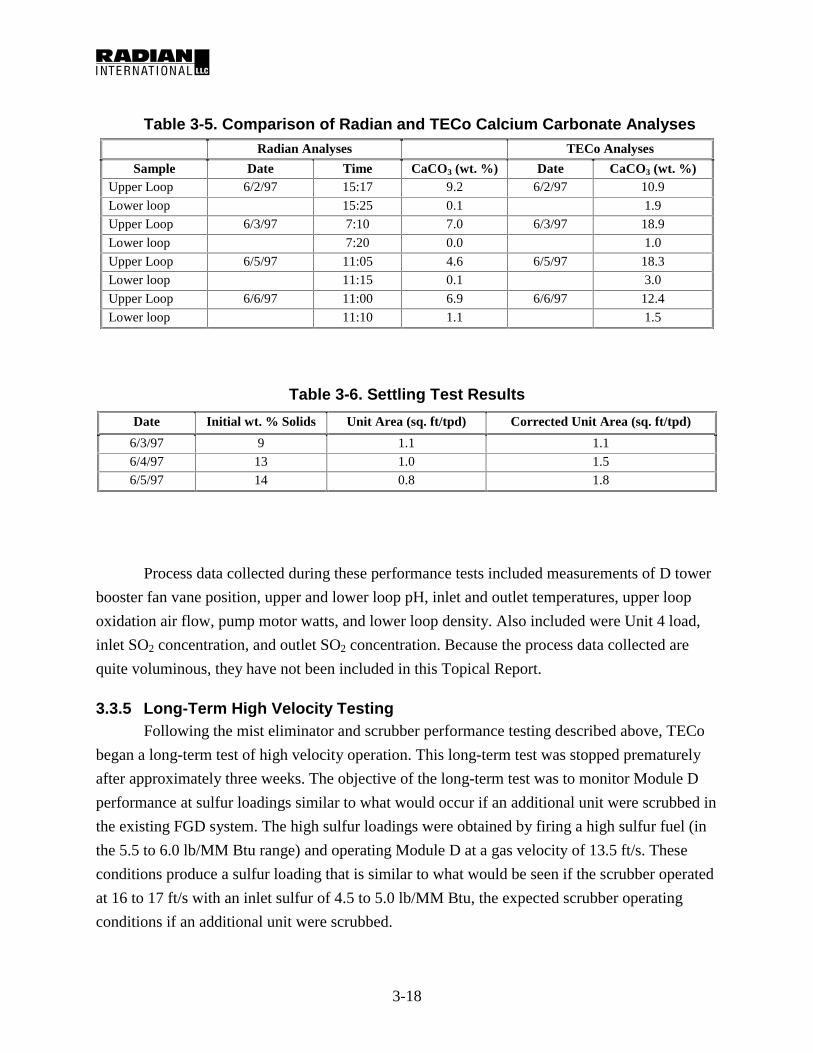
Comparison of the test data to the daily lab analyses also yield some interesting results. A
summary of the calcium carbonate concentrations (wt. %) measured by Radian and by TECo is
presented in Table 3-5. First, it is important to note that the samples being compared were not
collected at the same time, so some variation between the analyses is to be expected. However,
the analyses reported by TECo are consistently higher than those measured by Radian during the
test runs. This tends to suggest that there may be some bias in the analytical methods. Because of
the importance of accurate calcium carbonate analyses (which are used to assess whether or not
the gypsum meets its purity specification), it may be worthwhile to perform comparative
analyses on splits of the same sample to verify that accurate calcium carbonate measurements are
being obtained.
3.3.4 Other Process DataOther data collected during the high velocity performance tests include settling test
measurements and process data. Settling test data were collected daily, with the objective of
detecting gross changes in the solids properties. Settling test results are summarized in the Table
3-6. Results are presented in terms of unit areas; the unit area represents the amount of thickener
area (in square feet) that would be required to settle one ton per day of solids to a concentration
of 30 wt. %. The corrected unit areas are adjusted to account for the difference in initial weight
percent solids; in this case they are all adjusted to an initial concentration of 9 wt. % solids.
The differences between tests in the measured unit areas are relatively small; they are
comparable to the “scatter” seen in previous settling test data from this site. The data thus
indicate that the high velocity testing did not produce any substantial changes in solids
properties.
3-18
Table 3-5. Comparison of Radian and TECo Calcium Carbonate AnalysesRadian Analyses TECo Analyses
Sample Date Time CaCO3 (wt. %) Date CaCO3 (wt. %)Upper Loop 6/2/97 15:17 9.2 6/2/97 10.9
Lower loop 15:25 0.1 1.9
Upper Loop 6/3/97 7:10 7.0 6/3/97 18.9
Lower loop 7:20 0.0 1.0
Upper Loop 6/5/97 11:05 4.6 6/5/97 18.3
Lower loop 11:15 0.1 3.0
Upper Loop 6/6/97 11:00 6.9 6/6/97 12.4
Lower loop 11:10 1.1 1.5
Table 3-6. Settling Test Results
Date Initial wt. % Solids Unit Area (sq. ft/tpd) Corrected Unit Area (sq. ft/tpd)
6/3/97 9 1.1 1.1
6/4/97 13 1.0 1.5
6/5/97 14 0.8 1.8
Process data collected during these performance tests included measurements of D tower
booster fan vane position, upper and lower loop pH, inlet and outlet temperatures, upper loop
oxidation air flow, pump motor watts, and lower loop density. Also included were Unit 4 load,
inlet SO2 concentration, and outlet SO2 concentration. Because the process data collected are
quite voluminous, they have not been included in this Topical Report.
3.3.5 Long-Term High Velocity TestingFollowing the mist eliminator and scrubber performance testing described above, TECo
began a long-term test of high velocity operation. This long-term test was stopped prematurely
after approximately three weeks. The objective of the long-term test was to monitor Module D
performance at sulfur loadings similar to what would occur if an additional unit were scrubbed in
the existing FGD system. The high sulfur loadings were obtained by firing a high sulfur fuel (in
the 5.5 to 6.0 lb/MM Btu range) and operating Module D at a gas velocity of 13.5 ft/s. These
conditions produce a sulfur loading that is similar to what would be seen if the scrubber operated
at 16 to 17 ft/s with an inlet sulfur of 4.5 to 5.0 lb/MM Btu, the expected scrubber operating
conditions if an additional unit were scrubbed.
3-19
Results of these tests showed that at the high sulfur loadings in the test absorber, the
oxidation air rate available was inadequate. This apparently led to high liquid-phase sulfite
concentrations, and limestone blinding became a recurrent problem. As a result, calcium
carbonate concentrations in the lower loop section were frequently above the 1.5% level in the
gypsum byproduct specification. According to TECo personnel, the limestone blinding was
severe enough that continuing the high sulfur loading tests became difficult, so the long term
testing was suspended.
Limestone blinding is reportedly a recurring problem even under the current, normal
operating conditions, but the high sulfur loading to Module D made the problem significantly
worse. Although no other problems were reported during these three weeks of operation, a longer
duration test would be desirable to assure that scaling does not occur at the high sulfur loadings.
Because of the limestone blinding problem which caused the testing to be discontinued
after three weeks, it was not conclusively determined whether the Big Bend Unit 4 FGD system
can operate successfully at the high gas velocities required to also scrub flue gas from Unit 2.
Further testing is warranted to determine if it is possible to consistently avoid limestone blinding
episodes. Potential solutions to this problem include increasing the oxidation air rate available in
each loop, reducing the amount of slurry carry-up from the lower loop to the upper loop, and
operating at higher limestone utilization in the upper loop.

A-1
Appendix A
Analytical Data

Table A-1. Liquid-Phase Analyses
Description
Test 1SO2
Upper Loop
Test 1SO2
Lower Loop
Test 1Run 1
Upper Loop
Test 1Run 1
Lower Loop
Test 1Run 2
Upper Loop
Test 1Run 2
Lower Loop
Test 2UpperLoop
Test 2LowerLoop
Test 3UpperLoop
Test 3LowerLoop
Test 4UpperLoop
Test 4LowerLoop
Date 6-2-97 6-2-97 6-3-97 6-3-97 6-3-97 6-3-97 6-3-97 6-3-97 6-3-97 6-3-97 6-3-97 6-3-97Time 15:17 15:25 07:10 07:20 07:40 07:55 12:45 13:00 16:05 16:15 18:30 18:40
Ca, mm/L 37.1 34.9 36.8 36.2 33.9 39.0 36.8 35.4 37.9 44.6Mg, mm/L 138.3 169.1 141.1 168.2 138.2 177.8 148.0 190.2 165.3 196.8Na, mm/L 81.7 101.7 82.9 99.6 82.0 104.5 86.7 112.2 96.3 115.8Cl, mm/L 236.7 307.5 251.3 310.2 235.1 325.4 253.7 348.6 280.8 355.7CO3, mm/L 2.6 2.5 3.0 2.4 3.2 2.7 3.2 3.3 4.3 3.6SO3, mm/L 0.1 5.7 0.2 9.1 0.2 9.6 0.4 19.5 1.0 24.4SO4, mm/L 63.8 61.7 58.8 60.6 55.7 62.6 55.7 61.0 60.8 61.1Succinic, mm/L 2.3 3.3 2.1 3.2 2.8 3.2 2.6 3.6 3.7 4.0 3.7 4.2Glutaric, mm/L 7.2 7.5 7.1 7.3 6.6 7.4 7.8 8.4 8.6 9.5 8.9 9.9Adipic, mm/L 1.7 1.7 1.6 1.6 1.4 1.6 1.7 1.8 2.0 2.2 2.0 2.2
pH 5.56 4.00 5.35 3.81 4.94 3.85 5.39 3.95 5.26 5.18 5.24 4.29Temp, C 55.4 55.2 54.0 54.3 54.1 54.1 54.8 54.6 54.8 54.6 54.8 54.9
Ca, mg/L 1487 1399 1476 1451 1358 1565 1475 1418 1519 1787Mg, mg/L 3362 4111 3429 4088 3359 4321 3598 4623 4019 4784Na, mg/L 1879 2338 1905 2289 1885 2403 1994 2580 2215 2663Cl, mg/L 8390 10901 8910 10998 8336 11534 8994 12356 9955 12611CO3, mg/L 158 147 181 146 193 160 193 195 256 218SO3, mg/L 12 455 13 731 13 770 35 1562 81 1956SO4, mg/L 6128 5928 5645 5818 5352 6010 5352 5857 5839 5866Succinic, mg/L 277 390 244 376 331 376 310 429 434 476 442 493Glutaric, mg/L 947 986 932 970 871 972 1024 1116 1139 1258 1173 1309Adipic, mg/L 245 249 229 235 205 238 242 262 290 317 299 321
Relative SaturationGypsum 1.23 1.05 1.14 1.06 1.01 1.13 1.04 0.89 1.08 1.14CaSO3*0.5H2O 0.05 0.07 0.03 0.12 0.06 0.17 0.13 4.17 0.27 1.01CaCO3 0.01 0.00 0.00 0.00 0.02 0.00 0.01 0.01 0.01 0.00
A-3

Table A-1 (continued)
Description
Test 5Run 1
Upper Loop
Test 5Run 1
Lower Loop
Test 5Run 2
Upper Loop
Test 5Run 2
Lower Loop
Test 6UpperLoop
Test 6LowerLoop
Test 7UpperLoop
Test 7LowerLoop
Test 8UpperLoop
Test 8LowerLoop
Date 6-5-97 6-5-97 6-5-97 6-5-97 6-6-97 6-6-97 6-6-97 6-6-97 6-6-97 6-6-97Time 11:05 11:15 13:45 13:55 11:00 11:10 13:25 13:35 15:45 15:55
Ca, mm/L 37.4 43.0 39.2 42.0 34.3 38.9 41.2 45.9 44.9 61.3Mg, mm/L 224.7 265.1 229.8 270.3 185.9 238.4 204.8 274.4 224.3 293.2Na, mm/L 129.1 155.4 133.2 159.2 109.7 137.7 118.9 160.4 131.0 169.6Cl, mm/L 403.8 497.6 407.0 494.4 315.3 421.4 359.8 510.9 393.9 546.3CO3, mm/L 3.8 3.6 4.0 3.3 3.7 2.9 4.4 3.0 4.4 4.7SO3, mm/L 1.3 24.6 1.2 20.4 0.5 19.8 1.0 31.5 0.4 65.2SO4, mm/L 72.9 75.9 72.8 79.0 68.5 74.1 68.6 75.4 67.6 64.7Succinic, mm/L 3.9 4.5 4.3 4.9 2.8 3.7 5.4 6.0 7.3 8.0Glutaric, mm/L 9.4 11.2 10.7 12.1 6.9 9.0 13.1 14.7 17.7 19.3Adipic, mm/L 2.5 2.5 2.6 2.6 2.0 2.0 3.4 3.3 4.4 4.4
pH 5.31 5.22 5.12 4.07 5.35 4.25 5.45 4.21 5.27 4.66Temp, C 55.3 55.1 55.4 55.4 55.5 55.5 55.5 56.1 55.4 56.4
Ca, mg/L 1501 1723 1571 1683 1373 1560 1652 1838 1798 2456Mg, mg/L 5463 6445 5586 6571 4520 5796 4979 6670 5452 7129Na, mg/L 2968 3573 3062 3661 2521 3165 2735 3688 3011 3899Cl, mg/L 14315 17641 14429 17528 11178 14939 12756 18112 13965 19366CO3, mg/L 227 215 240 196 223 175 267 183 263 280SO3, mg/L 104 1972 99 1635 43 1589 79 2521 36 5221SO4, mg/L 7001 7288 6991 7593 6582 7115 6587 7244 6491 6215Succinic, mg/L 456 536 510 574 330 435 632 712 865 949Glutaric, mg/L 1240 1484 1414 1594 913 1185 1735 1947 2340 2552Adipic, mg/L 365 363 384 384 291 294 492 479 641 636
Relative SaturationGypsum 1.03 1.06 1.07 1.15 1.03 1.09 1.10 1.16 1.09 1.17CaSO3*0.5H2O 0.36 6.10 0.25 0.45 0.16 0.63 0.38 1.02 0.13 7.00CaCO3 0.02 0.01 0.01 0.00 0.02 0.00 0.04 0.00 0.02 0.00
A-4

Table A-2. Solid-Phase Analyses
Description
Test 1SO2
Upper Loop
Test 1SO2
Lower Loop
Test 1Run 2
Upper Loop
Test 1Run 1
Lower Loop
Test 1Run 2
Upper Loop
Test 1Run 2
Lower Loop
Test 2UpperLoop
Test 2LowerLoop
Test 3UpperLoop
Test 3LowerLoop
Test 4UpperLoop
Test 4LowerLoop
Date 6-2-97 6-2-97 6-3-97 6-3-97 6-3-97 6-3-97 6-3-97 6-3-97 6-3-97 6-3-97 6-3-97 6-3-97Time 15:17 15:25 07:10 07:20 07:40 07:55 12:45 13:00 16:05 16:15 18:30 18:40
Ca, mm/g 6.25 6.05 6.35 5.93 6.24 5.98 6.18 6.01 6.34 5.98 6.04 6.07Mg, mm/g 0.02 0.00 0.02 0.00 0.01 0.00 0.01 0.00 0.02 0.01 0.01 0.00SO3, mm/g 0.01 0.01 0.01 0.01 0.00 ND 0.01 0.01 0.01 0.02 ND 0.01SO4 total, mm/g 4.95 5.65 5.05 5.67 5.27 5.66 5.26 5.66 5.03 5.57 5.32 5.60SO4, mm/g 4.95 5.65 5.05 5.66 5.27 5.66 5.25 5.65 5.02 5.56 5.32 5.58CO3, mm/g 0.92 0.01 0.97 0.00 0.70 0.02 0.68 0.06 1.09 0.19 0.59 0.09
Inerts, Wt. % 1.24 1.08 1.36 1.12 1.20 1.16 1.24 1.32 1.32 1.28 0.88 1.04Solids, Wt. % 10.65 10.72 8.81 7.87 12.30 9.02 9.50 10.68 11.01 11.50 12.00 13.00
pH 5.56 4 5.35 3.81 4.94 3.85 5.39 3.95 5.26 5.18 5.24 4.29Temp, C 55.4 55.2 54 54.3 54.1 54.1 54.8 54.6 54.8 54.6 54.8 54.9
Reagent util, % 84.3 99.9 83.9 99.9 88.3 99.7 88.5 99.0 82.2 96.7 90.0 98.4Reagent ratio 1.19 1.00 1.19 1.00 1.13 1.00 1.13 1.01 1.22 1.03 1.11 1.02Oxidation, % 99.9 99.9 99.9 99.9 100.0 100.0 99.8 99.8 99.8 99.7 100.0 99.8
Solid solution, Wt.% 0.1 0.1 0.1 0.1 0.0 0.0 0.2 0.2 0.2 0.2 0.0 0.2Gypsum, Wt. % 85.1 97.1 86.8 97.4 90.6 97.4 90.2 97.2 86.3 95.5 91.5 96.0CaCO3, Wt. % 9.2 0.1 9.7 0.0 7.0 0.2 6.8 0.6 10.9 1.9 5.9 0.9Inerts, Wt. % 1.2 1.1 1.4 1.1 1.2 1.2 1.2 1.3 1.3 1.3 0.9 1.0
ClosuresWeight, % -2.8 -0.1 -0.7 -0.3 -0.1 -0.1 -0.6 0.4 -0.4 -0.2 -1.2 -0.3Molar, % 3.2 3.4 2.8 2.3 2.3 2.6 2.1 2.5 2.0 1.9 1.2 3.3Acceptable, % 6.6 7.1 6.6 7.1 6.7 7.1 6.7 7.0 6.5 6.9 6.7 7.0
A-5

Table A-2 (continued)
Description
Test 5Run 1
Upper Loop
Test 5Run 1
Lower Loop
Test 5Run 2
Upper Loop
Test 5Run 2
Lower Loop
Test 6UpperLoop
Test 6LowerLoop
Test 7UpperLoop
Test 7LowerLoop
Test 8UpperLoop
Test 8LowerLoop
Date 6-5-97 6-5-97 6-5-97 6-5-97 6-6-97 6-6-97 6-6-97 6-6-97 6-6-97 6-6-97Time 11:05 11:15 13:45 13:55 11:00 11:10 13:25 13:35 15:45 15:55
Ca, mm/g 6.28 5.96 6.19 6.02 6.27 5.92 6.83 6.36 6.90 6.52Mg, mm/g 0.01 0.00 0.02 0.00 0.01 0.00 0.04 0.02 0.04 0.03SO3, mm/g 0.01 0.01 0.01 0.01 0.01 0.02 0.02 0.02 0.02 0.08SO4 total, mm/g 5.39 5.65 5.27 5.62 5.16 5.62 4.30 5.04 4.34 4.79SO4, mm/g 5.39 5.63 5.26 5.60 5.15 5.60 4.28 5.02 4.32 4.71CO3, mm/g 0.46 0.01 0.67 0.07 0.69 0.11 2.26 1.03 2.27 1.52
Inerts, Wt. % 0.68 0.80 0.48 0.68 0.68 0.36 0.80 0.76 0.52 0.76Solids, Wt. % 13.13 14.46 14.01 15.16 12.33 14.54 17.75 20.51 20.48 25.13
pH 5.31 5.22 5.12 4.07 5.35 4.25 5.45 4.21 5.27 4.66Temp, C 55.3 55.1 55.4 55.4 55.5 55.5 55.5 56.1 55.4 56.4
Reagent util, % 92.1 99.8 88.7 98.8 88.2 98.1 65.5 83.0 65.7 75.9Reagent ratio 1.09 1.00 1.13 1.01 1.13 1.02 1.53 1.20 1.52 1.32Oxidation, % 99.9 99.8 99.8 99.8 99.8 99.7 99.5 99.6 99.5 98.3
Solid solution, Wt.% 0.1 0.2 0.1 0.2 0.2 0.2 0.3 0.3 0.3 1.3Gypsum, Wt. % 92.6 96.8 90.5 96.3 88.5 96.3 73.5 86.3 74.3 80.7CaCO3, Wt. % 4.6 0.1 6.7 0.7 6.9 1.1 22.6 10.3 22.7 15.2Inerts, Wt. % 0.7 0.8 0.5 0.7 0.7 0.4 0.8 0.8 0.5 0.8
ClosuresWeight, % -0.2 -0.9 -1.1 -0.7 -2.0 -1.2 -1.6 -1.1 -0.9 -1.1Molar, % 3.7 2.6 2.1 2.9 3.6 1.7 2.3 2.5 2.4 1.8Acceptable, % 6.8 7.1 6.7 7.0 6.7 7.0 6.2 6.6 6.2 6.4
A-6


