

Retrospective Study of Closed Leaking Underground Storage Tank (UST) Sites in Wisconsin
A.M. Pelayo*, T.A. Evanson, J.M. Bahr and M.E. Gordon
*Wisconsin Department of Natural ResourcesBureau for Remediation & Redevelopment
GSA, Oct. 7, 2008

What is “Closure?”
State regulator agrees with request from responsible party that NO FURTHER ACTION is necessary.
Closure involves proper abandonment (i.e., filling and sealing) of all monitoring wells.

Brief Administrative History Affecting WI UST Closures
• Nov. 1996: Allowed “flexible closure” for sites that may still exceed state cleanup standards
• May 2001: Implemented web-based “GIS Registry of Closed Remediation Sites” (http://dnrmaps.wi.gov/imf/imf.jsp?site=brrts2)
1999-2000: Huge influx of closures (1,378 now in GIS Registry)

Retrospective Study
1. Database– Devised a stratified random sampling to select sites
for review– Compiled site-specific information (133 site reviews)– Evaluated collective data for metric(s) to determine
effectiveness of NA as a remedy
2. Post-closure fieldwork at 10 sites– Did forecast prove to be true?
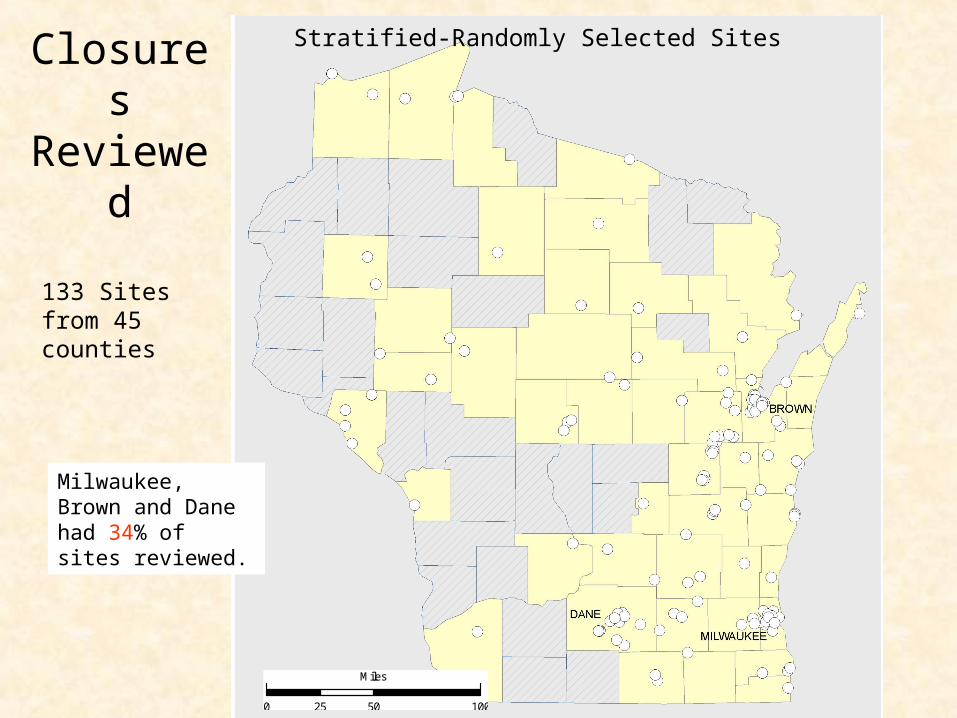
ClosuresReviewed
133 Sites from 45 counties
0 50 10025
Miles
Milwaukee, Brown and Dane had 34% of sites reviewed.
Stratified-Randomly Selected Sites

DB QueriesMonitoring
Wells Total number of wells with GW data Median: 7 wells
Remediation
Soil Excavation? 85 Yes Pump and Treat? 33 Yes
38 sites (or 29%) implemented NO remediation.

Depth to Groundwater
Count
91
20
83 0 0 0 1 0 0
0
10
20
30
40
50
60
70
80
90
100
≤ 0
> 0
. to
≤ 1
0.
> 1
0. to
≤ 2
0.
> 2
0. to
≤ 3
0.
> 3
0. to
≤ 4
0.
> 4
0. to
≤ 5
0.
> 5
0. to
≤ 6
0.
> 6
0. to
≤ 7
0.
> 7
0. to
≤ 8
0.
> 8
0.
Median6.5 ft
Mean9.3 ft
# of Sites in database with information: 123
Minimum depth to Water (ft)
≤10’

Highest Concentrations in GW Samples from the Database Sites
102
10.
1.
0.1
103
104
105
106
107
Ma
xim
umC
onc
ent
ratio
n(u
g/l)
fro
mS
iteG
rou
nd
wat
er
Sa
mp
les
Naphthalene(31)
Benzene(1,790)
MTBE(51,000)
Increasing Solubility in Water (Sw)
Xylene(160)(Sw, mg/l)
Ethylbenzene(170)
102
10.
1.
0.1
103
104
105
106
107
Ma
xim
umC
onc
ent
ratio
n(u
g/l)
fro
mS
iteG
rou
nd
wat
er
Sa
mp
les
Naphthalene(31)
Benzene(1,790)
MTBE(51,000)
Increasing Solubility in Water (Sw)
Xylene(160)(Sw, mg/l)
Ethylbenzene(170)
1% Sw
8.5% Sw
2% Sw
1% Sw
10% Sw
102
10.
1.
0.1
103
104
105
106
107
Ma
xim
umC
onc
ent
ratio
n(u
g/l)
fro
mS
iteG
rou
nd
wat
er
Sa
mp
les
Naphthalene(31)
Benzene(1,790)
MTBE(51,000)
Increasing Solubility in Water (Sw)
Xylene(160)(Sw, mg/l)
Ethylbenzene(170)
1% Sw
8.5% Sw
2% Sw
1% Sw
10% Sw
29Sites
21Sites 16
Sites
8Sites
0 Site37 Sites (or 28%) have NO Naphthalene
data!
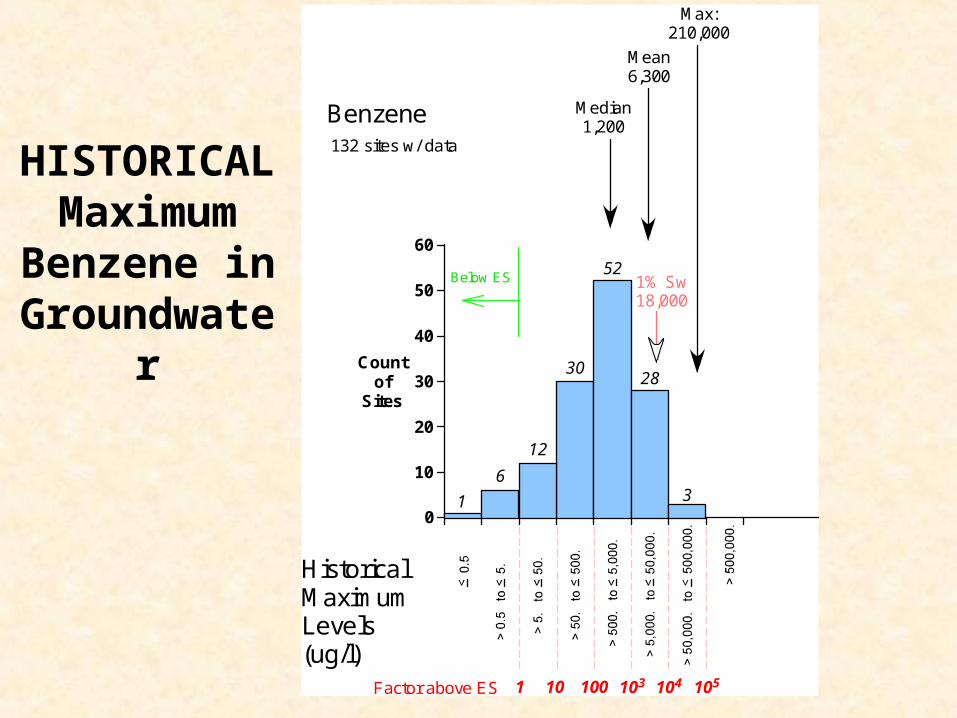
HISTORICAL Maximum
Benzene in Groundwater
132 sites w/ data
1
6
12
30
52
28
3
1 10 100 103 104Factor above ES 105
10
20
30
40
50
60
0
Countof
Sites
Benzene
HistoricalMaximumLevels(ug/l)
Max:210,000
Mean6,300
Median1,200
1% Sw18,000
Below ES
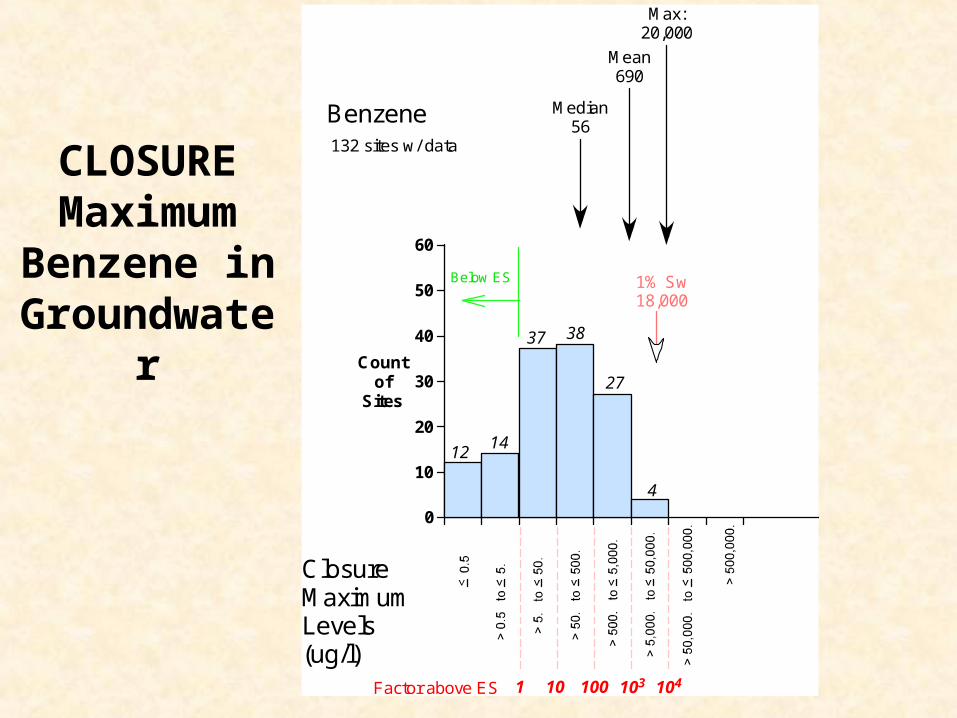
CLOSURE Maximum
Benzene in Groundwater
132 sites w/ data
1 10 100 103 104Factor above ES
10
20
30
40
50
60
0
Countof
Sites
Benzene
ClosureMaximumLevels(ug/l)
Max:20,000
Mean690
Median56
1% Sw18,000
Below ES
37 38
27
4
1412
0
>0
.0to
0.5
>0
.5to
1.0
>1
.0to
1.5
>1
.5to
2.0
>2
.0to
2.5
>2
.5to
3.0
>3
.0to
3.5
>3
.5to
4.0
>4
.0to
4.5
>4
.5to
5.0
>5
.0to
5.5
>5
.5to
6.0
>6
.0to
6.5
>6
.5to
7.0
>7
.0to
7.5
>7
.5to
8.0
>8
.0to
8.5
>8
.5to
9.0
>9
.0to
9.5
>9
.5to
10
.0
>1
0.0
to1
0.5
>1
0.5
5
10
15
0
Countof
Sites
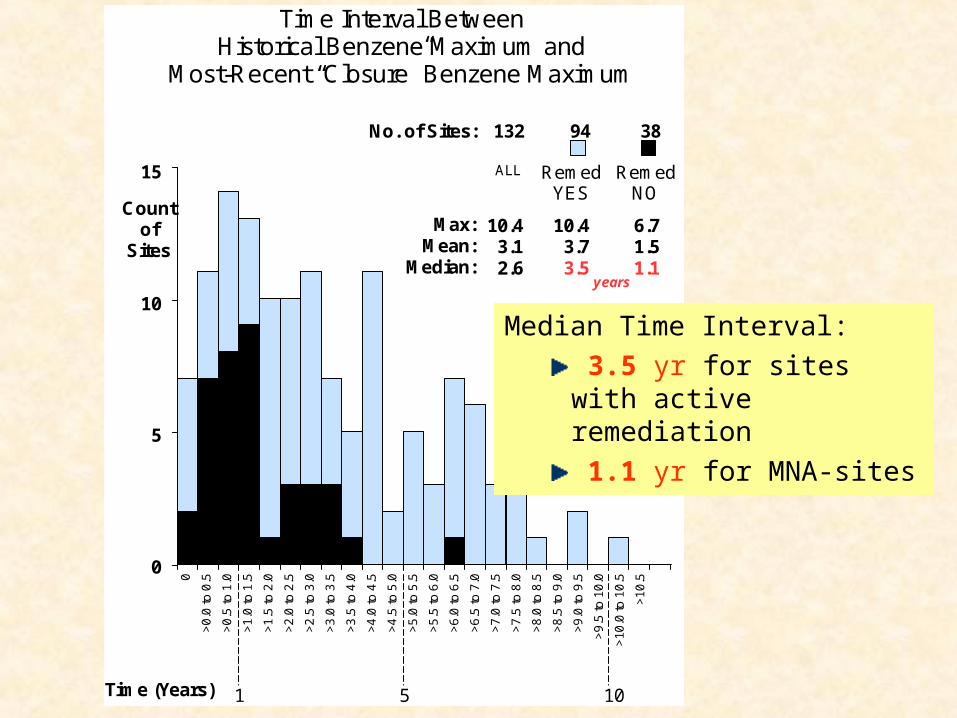
Time (Years)
Time Interval BetweenHistorical Benzene Maximum and
Most-Recent “Closure” Benzene Maximum
Max:Mean:
Median:
10.43.12.6
ALL RemedYES
RemedNO
10.43.73.5
6.71.51.1
5 101
No. of Sites: 132 94 38
years
Median Time Interval:
3.5 yr for sites with active remediation
1.1 yr for MNA-sites

Synopsis – Database Study
• Collectively, a factor of 10 reduction in maximum benzene concentration
• Short monitoring period, even shorter for sites that were not remediated
Will we see similar decrease 5 years post closure?

10 Field Sites in the WI Closure Protocol
Study
Former Retail Station
Non-Commercial Site
Post-Closure Field Study

Post-Closure Investigation
• Installed monitoring wells:– Near locations where previous site
investigation (SI) detected benzene– Further downgradient than SI
• Used GeoProbe, except at 2 of the 10 sites. PC water-table wells had screens as long as SI wells.

Total BTEX
Plumes
Closure (Blue) Outline
Post Closure Outline
[Keller, 2005][Greve, 2007]
Closure
Post-Closure

Groundwater flow variabilityTotal BTEX Plume [Greve, 2007 ]
1998 20052000
Former Grandma’s Restaurant site’s plume axis Former Grandma’s Restaurant site’s plume axis shifted roughly 40°. shifted roughly 40°.
0 100 ft
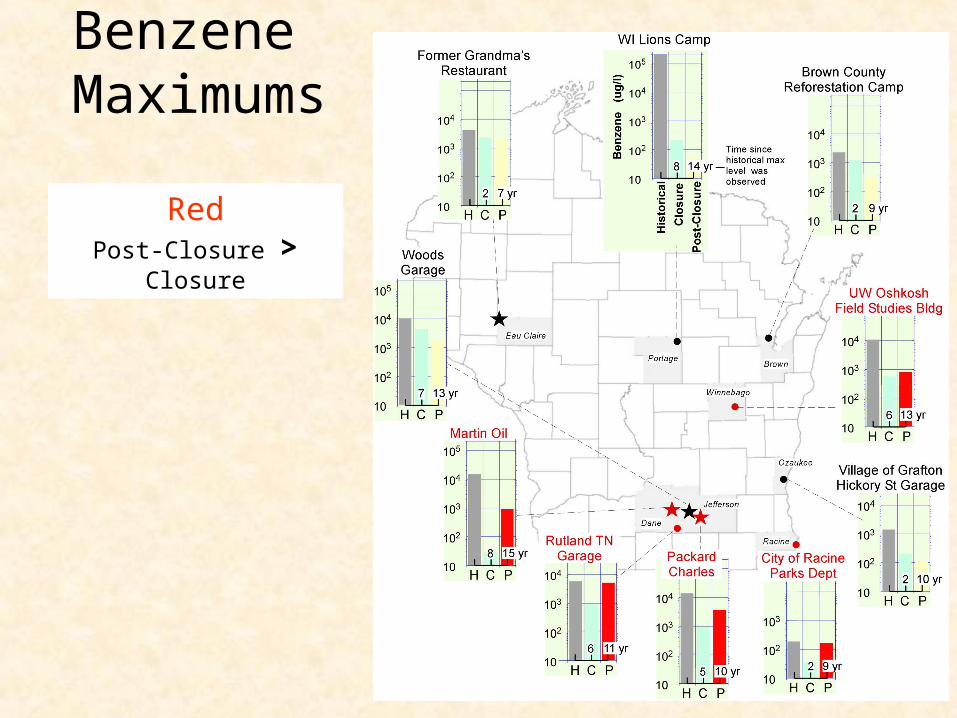
Benzene Maximums
RedPost-Closure > Closure

Out of the 10 Field Sites ...
• We found 5 sites with benzene levels higher than their respective closure maximums.
• BUT ... We did not find benzene in as many wells as previously found for all 10 sites.

SI0 200 Ft100
20 40 60 80 1000 150 Ft
UtilityPole
UtilityPole
UtilityPole
YellowR/W Post
OldMW-2
Garage
House
PrivateWater SupplyWell
WoodenShed
Asphalt Shoulder
PrivateGravel
Driveway
ApproximateLocation of
Former DispenserIsland
ApproximateLocation of
Former USTs
PrivateGravel
Driveway
PrivateGravel
DrivewayAsphalt Shoulder
Asphalt Shoulder
Asphalt Shoulder
Concrete
Concrete
MW-1
MW-3
MW-6MW-7
SI benzene detection (1991 to 1999)
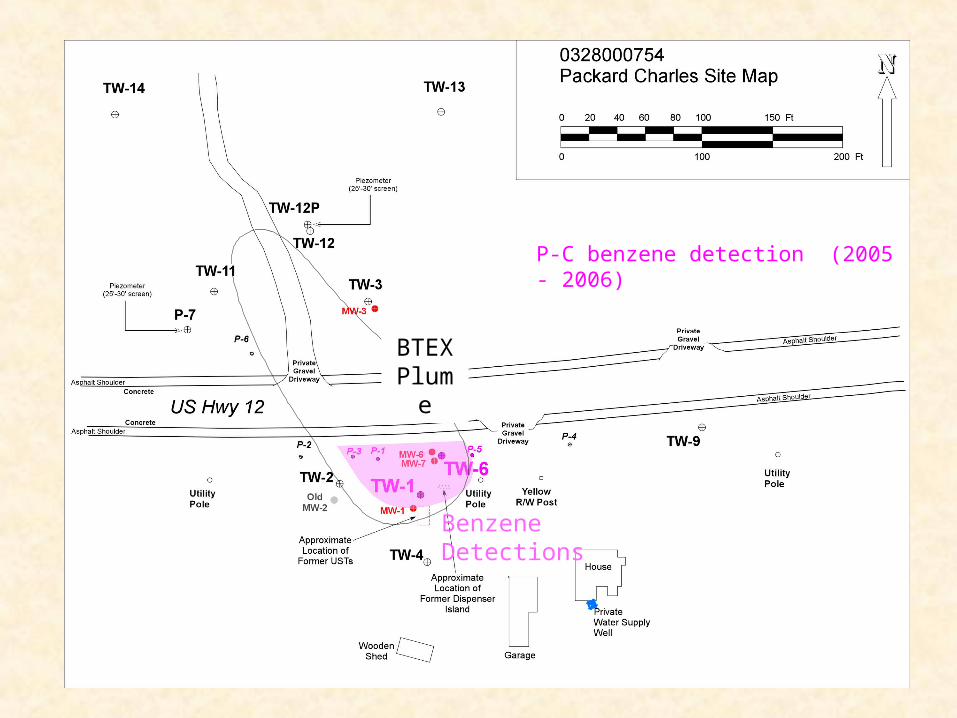
Post-Closure
P-C benzene detection (2005 - 2006)
BenzeneDetections
BTEXPlume

Q: Did we miss the B plume in our Post-Closure investigation?
• A: Perhaps. But if we missed B, why are we finding TEX at locations farther than previously found?
• Let’s look further at the Naphthalene data.

Naphthalene Detections (at Water-Table Monitoring Wells)
Previous Site Investigation
Site NameNo. of SI W-T
WellsWells w/ N
detectsDetection
Frequency
Brown County Reforestation Camp
4 1 25 %
Martin Oil 12 2 17 %
Town of Rutland Garage
5 2 40 %
Woods Garage 10 4 40 %
Grandma's Restaurant & Truck Stop
11 4 36 %
Charles Packard Property
8 4 50 %
Grafton DPW 6 2 33 %
WI Lions Camp 15 12 80 %
City of Racine Parks Dept
7 1 14 %
UW Oshkosh Field Studies Building
12 11 92 %
Post-Closure Investigation
No. of P-C W-T Wells
Wells w/ N detects
Detection Frequency
9 3 33 %
9 4 44 %
12 5 42 %
9 5 56 %
12 6 50 %
10 6 60 %
10 5 50 %
10 3 30 %
12 3 25 %
10 3 30 %
Post-Closure Investigation
No. of P-C W-T Wells
Wells w/ N detects
Detection Frequency
9 3 33 %
9 4 44 %
12 5 42 %
9 5 56 %
12 6 50 %
10 6 60 %
10 5 50 %
10 3 30 %
12 3 25 %
10 3 30 %

Naphthalene Improvement?
RedPost-Closure > Historical Max
YellowImprovement, but not by a
factor of 10!

Post-Closure VOC Plume
• Characteristic has changed over time
– P-C benzene levels at the source wells about as high as closure max, but benzene plume more spatially constrained, tending to remain near the source.
– P-C naphthalene levels at the source wells as high as historical max, and plume extended farther from the source.

Post-Closure0 200 Ft100
20 40 60 80 1000 150 Ft
P-1P-2
P-3
UtilityPole
UtilityPole
UtilityPole
YellowR/W Post
OldMW-2
TW-2
TW-4
TW-9
TW-3
Garage
House
PrivateWater SupplyWell
WoodenShed
Asphalt Shoulder
PrivateGravel
DrivewayP-4
P-5
P-6
P-7
Piezometer(25‘-30’ screen)
TW-11
TW-12P
TW-14 TW-13
TW-12
Piezometer(25‘-30’ screen)
ApproximateLocation of
Former DispenserIsland
ApproximateLocation of
Former USTs
PrivateGravel
Driveway
PrivateGravel
DrivewayAsphalt Shoulder
Asphalt Shoulder
Asphalt Shoulder
Concrete
Concrete
MW-1
MW-3
MW-6MW-7
Post-Closure BENZENE detection

Post-Closure0 200 Ft100
20 40 60 80 1000 150 Ft
P-1P-2
P-3
UtilityPole
UtilityPole
UtilityPole
YellowR/W Post
OldMW-2
TW-2TW-6
TW-1
TW-4
TW-9
TW-3
Garage
House
PrivateWater SupplyWell
WoodenShed
Asphalt Shoulder
PrivateGravel
DrivewayP-4
P-5
P-6
P-7
Piezometer(25‘-30’ screen)
TW-11
TW-12P
TW-14 TW-13
TW-12
Piezometer(25‘-30’ screen)
ApproximateLocation of
Former DispenserIsland
ApproximateLocation of
Former USTs
PrivateGravel
Driveway
PrivateGravel
DrivewayAsphalt Shoulder
Asphalt Shoulder
Asphalt Shoulder
Concrete
Concrete
MW-1
MW-3
MW-6MW-7
Post-Closure NAPHTHALENE detections
BTEXPlume

Conclusion/Recommendation After the Study
• Contaminant concentrations in source zones are relatively unchanged 5 – 6 years post-closure.
• Unable to make realistic projections of when standards will be met in groundwater. (Monitoring ~ < 5 yrs; Time to reach standards ~ 10s of Decades or Longer)
• Effective land use controls are needed far into the future to account for the long period of time contaminants are likely to remain in soil and groundwater.


