
1
Review of ‘Heterogenous CO2 and CH4 content of glacial meltwater of the Greenland Ice Sheet
and implications for subglacial carbon processes’
We thank the reviewer for his comments and have addressed them in detail below. We
see that the review describes three major issues. One is based on the hydrologic
characteristics of our field sampling sites (and field site names as mentioned in other
reviews). This issue is linked to a second issue related to atmospheric-stream water
exchange between subglacial outlets and the stream water. The final issue is our
presentation of effects of sub-glacial processes on production and consumption of
methane and CO2. We agree that many of these points are important to expand upon in
our discussion while simultaneously recognizing and evaluating potential speculation.
However, regardless of these unknown factors associated with the field sampling and
locations, we think the data presented here still yield important information concerning
the heterogeneity of greenhouse gas production and consumption caused by multiple sub-
glacial processes, which we discuss, and that the heterogeneity complicates assessments
of impacts to atmospheric compositions during glacial retreat, for example since the Last
Glacial Maximum and into the future in a rapidly warming Arctic with continued ice
sheet retreat.
The authors measured CO2 and CH4 concentrations and C stable isotopic signatures in
meltwater samples from three marginal catchments of the Greenland ice sheet (GrIS) to evaluate
sources and sinks of these important greenhouse gases under the fast melting ice sheet. The study
is timely, wellstructured and -written, and uses adequate methods (with exceptions described
below). However, interpretation of some of the results (especially the CH4 part) relies on
incorrect assumptions and/or is unsupported by data, and is therefore too speculative at best. The
issues listed below need to be carefully addressed before the study can be published.
First, the authors misunderstand and/or misrepresent the regional hydrology of the
Kangerlussuaq area. The large outlet Isunnguata Sermia drains into the Isortoq River/Isortup
Kuua (N of the Watson River catchment); its catchment is indeed quite large and extends deep
into the ice sheet (probably to the ice divide). However, the water samples collected in this study
did not originate from this large catchment and using the name Isunnguata Sermia is erroneous.
Rather, the authors’ IS site falls into the Point660 subcatchment sensu Lindbäck et al 2015 (as
the authors admit at line 88), with an area of ca 30-60 km2 . This is part of the Russell Glacier
catchment system (sometimes treated as part of the Leverett Glacier catchment, eg in Lindbäck
et al. 2015), which is complicated, but likely does not reach far into the ice sheet. Calculating the
Russell catchment area (for the RU site) as the difference between two individual and
independent estimates of the Leverett catchment is incorrect (for example, some authors
estimated the Leverett catchment at >1000 km2 ); the catchment feeding the Russell river is
likely much smaller than 300 km2 (see eg van de Wal and Russell 1994). Figure 2b attributes the
name Watson River to the river system originating at Point 660 and joining the larger river
discharging from Leverett Glacier, which is problematic. Whereas the river terminology in the
area is indeed somewhat confused, Watson River usually refers to the last short section of the
river formed by the confluence of Akuliarusiarsuup Kuua and Qinnguata Kuussua which then
enters Kangerlussuaq where the hydrology data used in the study (from van As et al 2018) were
taken.
2
We agree these suggested changes are important to be consistent with previous
geographic naming schemes. However, our assessments do not include flux calculations
or specific yield estimates, which would depend on the catchment area of the glaciers
studied, and proglacial processes are not in the scope of these manuscript. We will make
the changes suggest as outlined below, but the changes in nomenclature will not greatly
impact the presentation or interpretation of results or our findings, which show
differences in subglacial carbon processes that result in heterogeneous concentrations of
CO2 and CH4 in subglacial discharge.
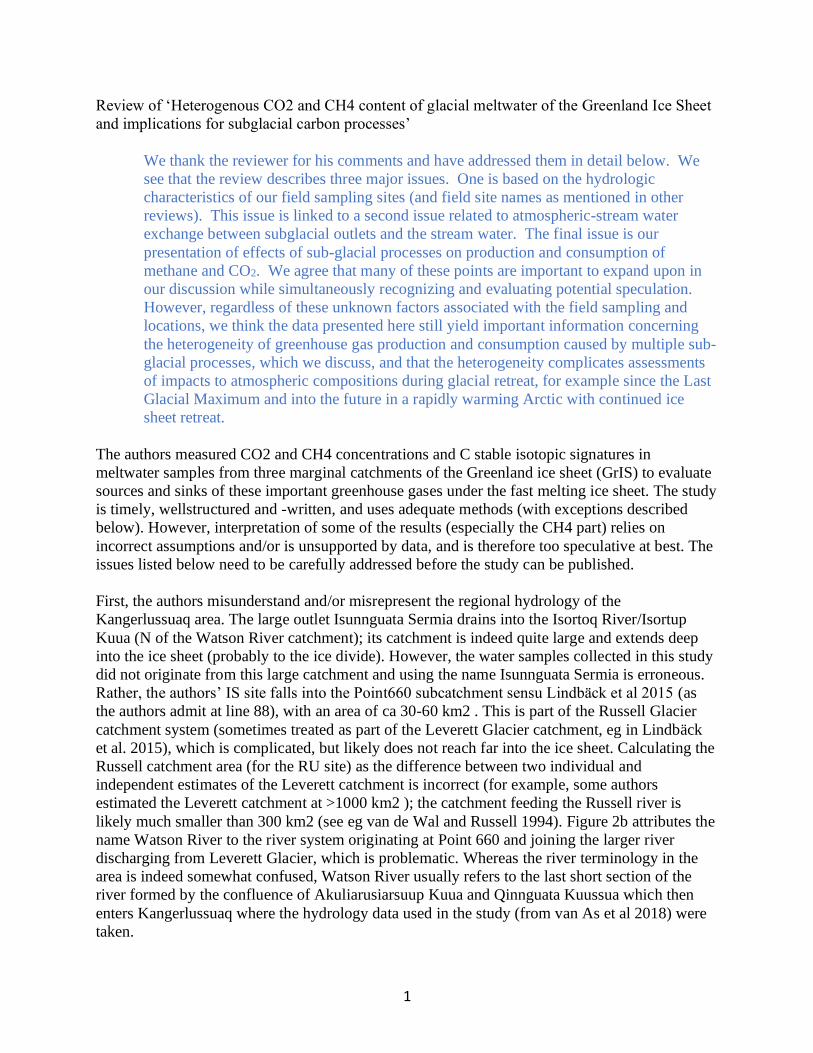
The Isunnguata (IS) catchment we refer to is named as such because the watershed lies in
between the Isunnguata and Russell (RU) glaciers, as described in delineations by
Rennermalm et al. (2013) and the IS site is located at the southern edge of the Isunnguata
Glacier. Previous work at the IS and RU sites in this study suggest differences in the
subglacial lithology resulting from a geological contact in this area between the
Nagssugtoqidian Mobile Belt (NMB) and Archaean Block (AB; Deuerling et al., 2019).
These data indicate that our IS site predominantly drains a subglacial environment with a
lithology more like the main Isunnguata Sermia catchment, which is believed to be
mostly NMB, while our site at the Russell Glacier (as well as Leverett Glacier) drains
mostly AB rocks (Fig. R1; Deuerling et al., 2019). We will include in revisions the
uncertainties mentioned in the catchment size of the Russell but believe that the
Isunnguata catchment in this study is appropriately named. We will also include a more
thorough description of the tributaries to the Watson River, with an updated map to
indicate the differently named segments of the river.
Figure R1. Map indicating location of IS and RU sampling points (red stars) and
the approximate lithologic boundary between the Nagssugtoqidian Mobile Belt
(NMB) and Archaean Block (AB) (dotted red line). Figure modified from Dawes
(2009) and Deuerling et al. (2019).
IS
RU
3
Moreover, it is difficult to compare the study sites with previous works as the authors neither
give details of their positions nor show any pictures. I assume the IS site is identical to the site
used in Christiansen & Jørgensen (2018). The CH4 supersaturation referred to at lines 107-108
was measured in the air, with respect to atmospheric concentration, not in the water. The stream
itself is very small (discharge at the portal was ca 1 m3 /s at peak melt in July 2018) and
partly/mostly of supraglacial origin (a supraglacial/marginal stream can be found flowing into
the ice margin several hundred meters above the portal). In terms of the RU site, it is not clear
whether the authors sampled the main stem of the Russell Glacier river or one of the short
subglacial tributaries flowing into it from the Russell Glacier margin (as depicted eg in Dieser et
al 2014). The Russell Glacier river in this area has already flowed through a number of lakes and
the CH4 signal would be difficult to interpret as purely subglacial. The order of magnitude
difference in CH4 concentrations reported here and in Dieser et al (2014) is not discussed in the
text but suggests that indeed samples were collected from the main stem of the river. A better
description of the sampling sites is essential for an adequate assessment of the authors’
interpretation.
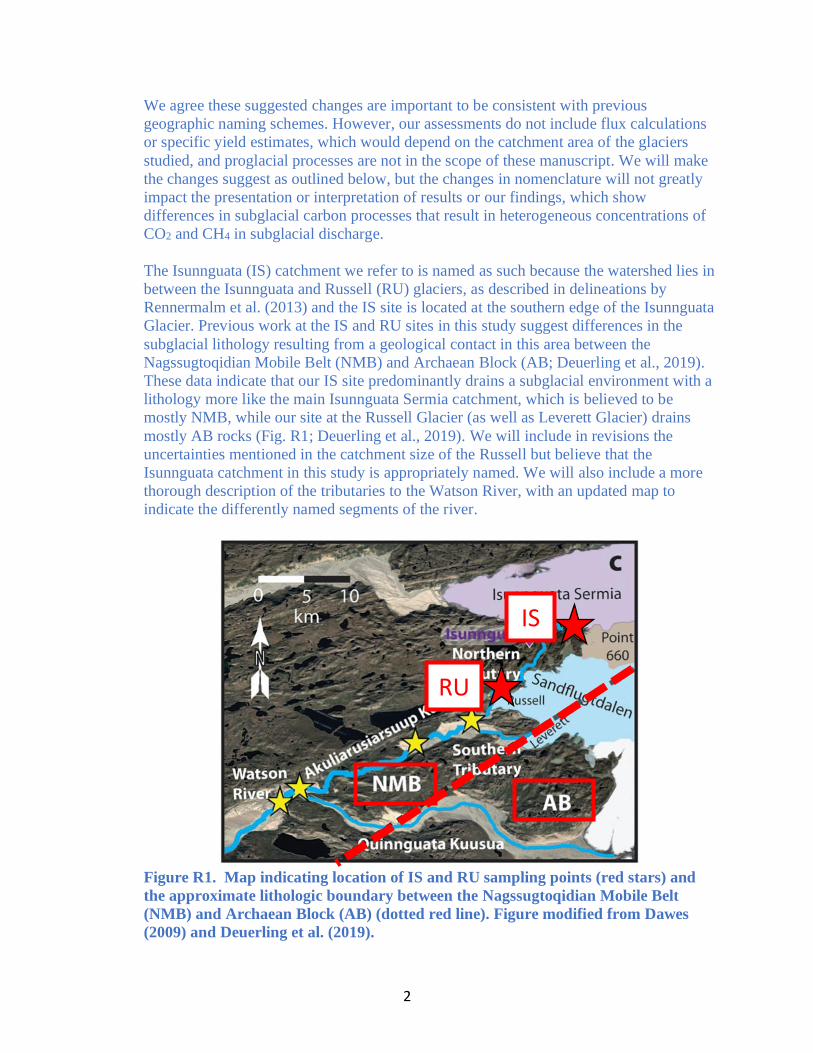
All samples were collected from the respective main river stem as close as possible to the
subglacial discharge site. Water did not flow through lakes directly in between glacial
outlet sites and sampling sites at Isunnguata and Russell sites, though lakes are present
further upstream of the Russell site and a broad and slow-flowing river channel was
present between the glacial outlet and sampling point at Kiagtut Sermiat (referred to as a
lake in this review). However, in all cases, dissolved CO2 and/or CH4 were out of
equilibrium with respect to atmospheric concentrations, indicating that subglacial
processes altered concentrations and that exchange with the atmosphere between the
glacial outlet and sampling site did not erase (but we acknowledge may have altered) the
subglacial carbon signal. While exchange would impact gas concentrations and isotopic
compositions, there are multiple lines of evidence that suggest the observed chemical
signals are predominantly controlled by subglacial processes, which we discuss further
throughout this review (e.g. p. 9).
We agree that in addition to the GPS coordinates that were provided in the original
manuscript, better descriptions, including the inclusion of pictures of sampling sites,
would be valuable to maximize inter-comparisons between this and other nearby studies.
We include pictures and more detailed site descriptions below.

4
Figure R2. IS sampling site (photo taken July 15th, 2018)
Isunnguata samples were collected from a site downstream of Point 660 where water
flows from a subglacial discharge site that produced a visible boil at high discharge. No
flow occurred further upslope of the boil, which was most clearly observed during the
peak melt season (photo taken July 15th, 2018), suggesting it is the principal water source
to the stream. As indicated by the photo, the water contains high concentrations of
suspended sediment and is predominantly subglacial, with only minor observed
contributions of supraglacial meltwater. This location is very close to the site discussed in
Christiansen and Jørgensen (2018), where high atmospheric CH4 concentrations were
interpreted to reflect CH4 supersaturation of the subglacial meltwater discharged at this
site, which we now document in this manuscript.
Figure R3. RU sampling site, photo taken on July 22nd, 2018
Water boil
5
Russell Glacier water samples were collected just downstream of the above pictured ice
wall (Fig. R3) and thus water did not flow through any lakes directly in between the
glacial outlet and the sampling location in this segment of the stream. While sampled
water is a combination of recently discharged subglacial meltwater from under the
Russell Glacier and proglacial discharge from further upstream (contributions from the
Isunnguata at point 660 and other subglacial outlet sites as this segment of the river flows
long the toe of the Russell glacier), gas concentrations are out of equilibrium with respect
to atmospheric concentrations, suggesting the gas signal reflects subglacial processes
because sites just upstream of this site are close to equilibrium with respect to
atmospheric CO2 and CH4, with distinct increases in CH4 concentrations downstream of
the ice wall, indicating subglacial water contributions. While we did not include sites
upstream of the RU glacial discharge site in this paper, gas concentrations at upstream
locations can be found at doi:10.18739/A2PC2T94. If appropriate, we will present these
data in a revised manuscript or supplemental information.
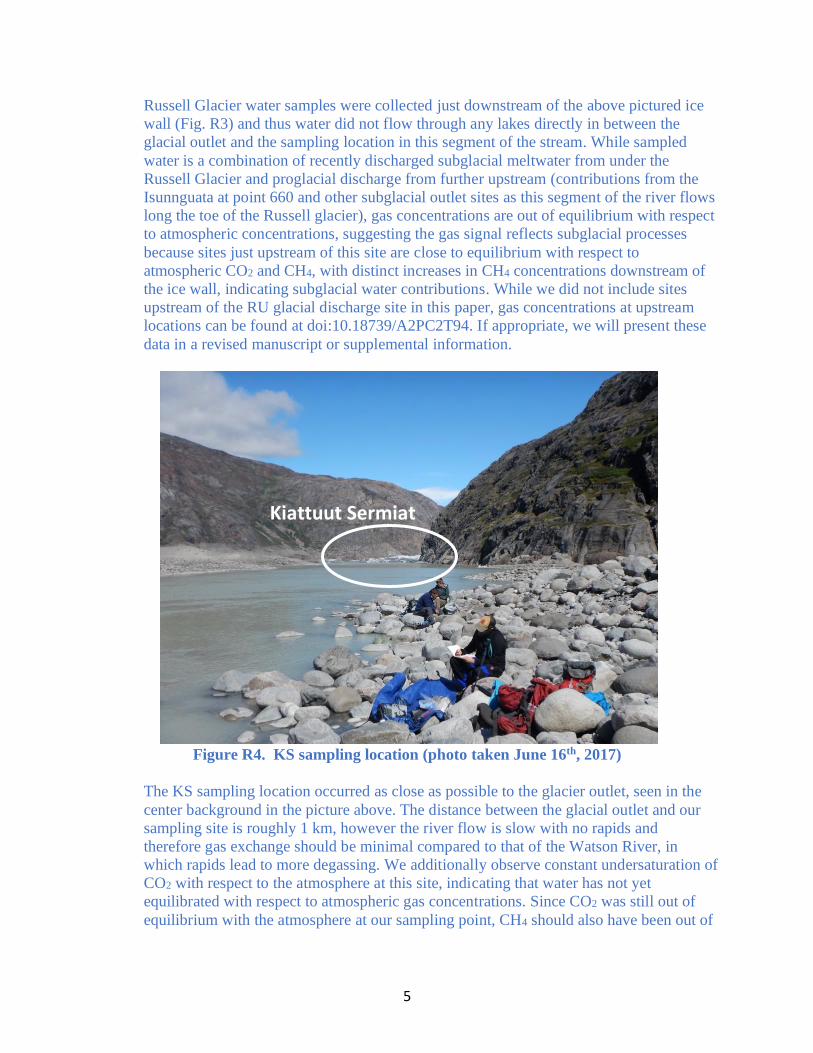
Figure R4. KS sampling location (photo taken June 16th, 2017)
The KS sampling location occurred as close as possible to the glacier outlet, seen in the
center background in the picture above. The distance between the glacial outlet and our
sampling site is roughly 1 km, however the river flow is slow with no rapids and
therefore gas exchange should be minimal compared to that of the Watson River, in
which rapids lead to more degassing. We additionally observe constant undersaturation of
CO2 with respect to the atmosphere at this site, indicating that water has not yet
equilibrated with respect to atmospheric gas concentrations. Since CO2 was still out of
equilibrium with the atmosphere at our sampling point, CH4 should also have been out of
Kiattuut Sermiat
6
equilibrium if it was considerably different from atmospheric concentrations in the
subglacial environment.
While the inaccuracies in the description of the regional hydrology are easy to fix, they led the
authors to a more problematic aspect of the study: correlating the CH4 and CO2 concentrations
and isotopic signals from the IS and RU sites with discharge data from the Watson River. While
both the Russell Glacier and Watson rivers show clear diurnal variations in discharge, large scale
dynamics (including subglacial outbursts) observed in the large rivers is missing in the smaller
Russell Glacier river, possibly due to the buffering effect of the lakes along the course of the
river, as illustrated in the figure below comparing unpublished discharge data in m3 /s from LG
(Leverett Glacier river), RU (Russell Glacier river), and IS (Isunnguata Sermia river/Isortup
Kuua) in the summer 2018. The Watson River discharge dynamics may be further complicated
by the unaccounted for Qinnguata Kuussua, which provides more than half of its water. This is in
contrary to the authors’ assumptions (line 217).
To my knowledge, this dataset has been made available to the authors, and it might be beneficial
for the authors to use it for their correlations. Maybe it was not used because there were just 2
and 3 samples collected at RU and IS, respectively, in 2018 (as shown in Figures 3, 4, 6, 7, 9)?
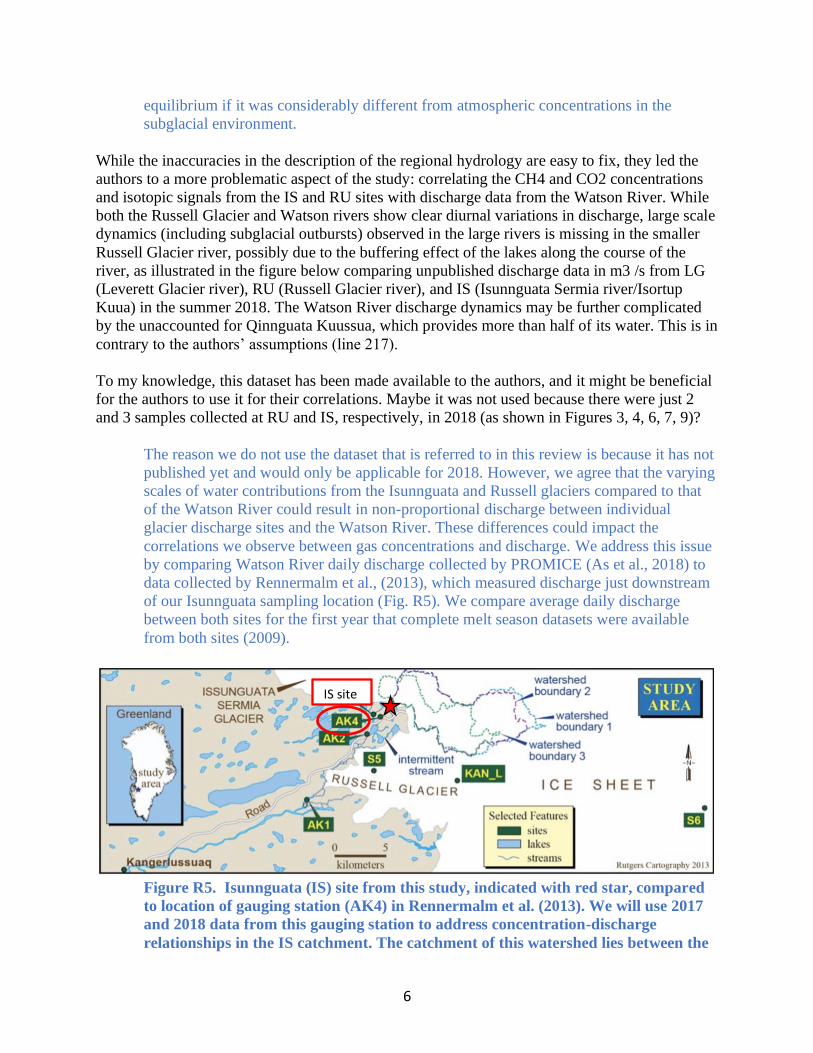
The reason we do not use the dataset that is referred to in this review is because it has not
published yet and would only be applicable for 2018. However, we agree that the varying
scales of water contributions from the Isunnguata and Russell glaciers compared to that
of the Watson River could result in non-proportional discharge between individual
glacier discharge sites and the Watson River. These differences could impact the
correlations we observe between gas concentrations and discharge. We address this issue
by comparing Watson River daily discharge collected by PROMICE (As et al., 2018) to
data collected by Rennermalm et al., (2013), which measured discharge just downstream
of our Isunnguata sampling location (Fig. R5). We compare average daily discharge
between both sites for the first year that complete melt season datasets were available
from both sites (2009).
Figure R5. Isunnguata (IS) site from this study, indicated with red star, compared
to location of gauging station (AK4) in Rennermalm et al. (2013). We will use 2017
and 2018 data from this gauging station to address concentration-discharge
relationships in the IS catchment. The catchment of this watershed lies between the
IS site
7
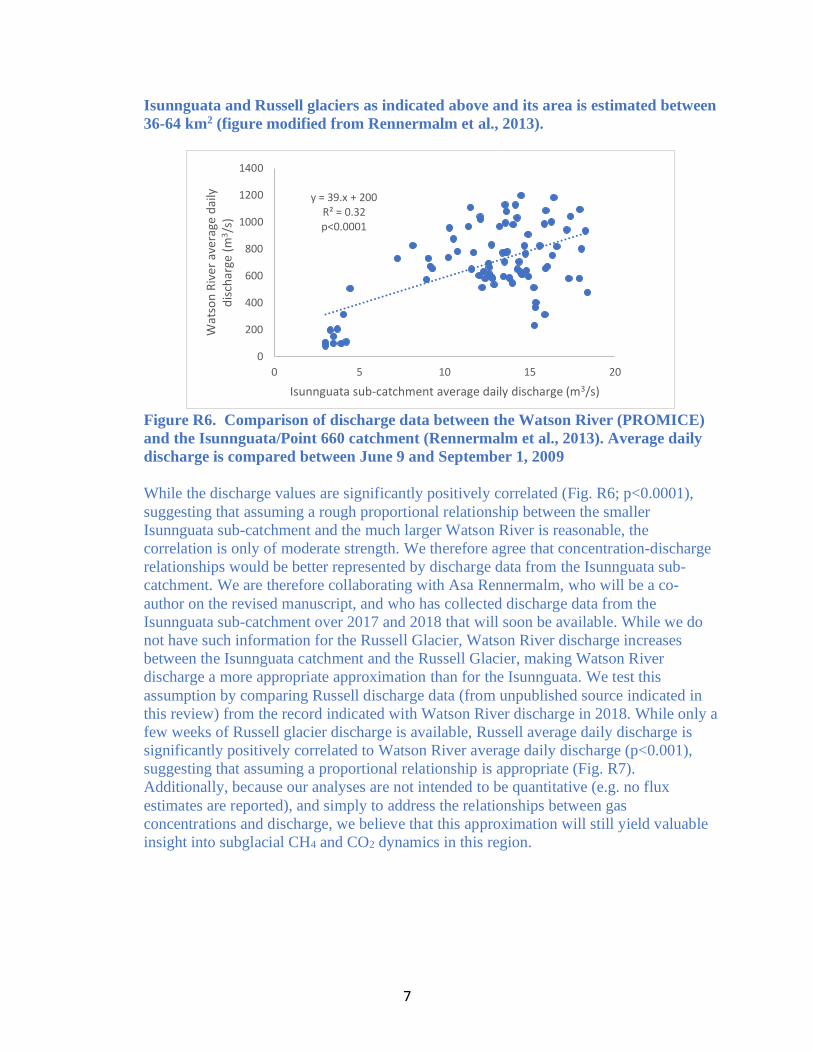
Isunnguata and Russell glaciers as indicated above and its area is estimated between
36-64 km2 (figure modified from Rennermalm et al., 2013).
Figure R6. Comparison of discharge data between the Watson River (PROMICE)
and the Isunnguata/Point 660 catchment (Rennermalm et al., 2013). Average daily
discharge is compared between June 9 and September 1, 2009
While the discharge values are significantly positively correlated (Fig. R6; p<0.0001),
suggesting that assuming a rough proportional relationship between the smaller
Isunnguata sub-catchment and the much larger Watson River is reasonable, the
correlation is only of moderate strength. We therefore agree that concentration-discharge
relationships would be better represented by discharge data from the Isunnguata sub-
catchment. We are therefore collaborating with Asa Rennermalm, who will be a co-
author on the revised manuscript, and who has collected discharge data from the
Isunnguata sub-catchment over 2017 and 2018 that will soon be available. While we do
not have such information for the Russell Glacier, Watson River discharge increases
between the Isunnguata catchment and the Russell Glacier, making Watson River
discharge a more appropriate approximation than for the Isunnguata. We test this
assumption by comparing Russell discharge data (from unpublished source indicated in
this review) from the record indicated with Watson River discharge in 2018. While only a
few weeks of Russell glacier discharge is available, Russell average daily discharge is
significantly positively correlated to Watson River average daily discharge (p<0.001),
suggesting that assuming a proportional relationship is appropriate (Fig. R7).
Additionally, because our analyses are not intended to be quantitative (e.g. no flux
estimates are reported), and simply to address the relationships between gas
concentrations and discharge, we believe that this approximation will still yield valuable
insight into subglacial CH4 and CO2 dynamics in this region.
y = 39.x + 200R² = 0.32p<0.0001
0
200
400
600
800
1000
1200
1400
0 5 10 15 20
Wat
son
Riv
er
aver
age
dai
ly
dis
char
ge (
m3/s
)
Isunnguata sub-catchment average daily discharge (m3/s)

8
Figure R7. Watson River compared to Russell Glacier average daily discharge
between June 20 and July 15, 2018 (cite source), during which interval both records
are available. Watson River discharge information is from (van As et al., 2018) and
Russell Glacier discharge is unpublished (personal communication).
The low number of samples and the fact they come from two different years, 2017 and 2018, is
another weakness of the study. Figures 3, 4, 6, 7, 9 appear as though they show time series
(suggested by the lines connecting the dots), which is not the case. I suggest the authors redraw
the figure so it’s clear the data come from two independent seasons. This should also be
acknowledged in the text, and the possible differences in hydrology and the potential impact on
the export of gases discussed more in detail. For example, Hawkings et al (2015) showed large
interannual variations in total discharge and solute and particulate fluxes from the Leverett
catchment between 2009-2012. Also, no statistical analysis of the results was done and it’s
unclear whether the differences in water chemistry were significant between the streams – was
this due to the low number of samples?
Because our intention was to capture changes in water chemistry between disparate
locations and throughout the melt season, with a primary goal of identifying differences
between glacial discharge sites, logistical constraints did not allow us to sample any
individual subglacial discharge site throughout the melt season. While not included in our
original manuscript, we conducted statistical analysis through one-way ANOVA, which
indicated that both CH4 and CO2 concentrations differ between sites (p<0.0001),
supporting the principal findings stated in this manuscript. Dissolved gas isotopic
compositions, however, do not significantly differ. We will include these statistical tests
in the results and discussion of a revised manuscript. We will additionally redraw the
figures to clarify that samples were collected over multiple years, which also addresses a
comment by Reviewer 1.
This should also be acknowledged and/or explained. Analysis of stable isotopic signatures of C
in CH4 and CO2 is a powerful tool for determining the origin of the respective gases; however,
caution must be exercised when interpreting the results for glacial meltwater samples. Glacial
y = 15.68x - 89R² = 0.38p<0.001
200
250
300
350
400
450
500
550
600
650
20.00 25.00 30.00 35.00 40.00
Wat
son
Riv
er a
vera
ge d
aily
dis
char
ge
(m3/s
)
Russell average daily discharge (m3/s)

9
meltwater is a very dynamic mixture consisting of several components with different origins: the
water mostly comes from the surface and so has been in direct contact with the atmosphere (and
its CO2); the sediment is predominantly of subglacial origin. Dissolved CH4 also likely
originates from the subglacial environment, while CO2 has multiple sources -- as the authors
show and discuss throughout the ms. The isotopic separation factor εC (ie δ 13CCO2 - δ
13CCH4), used in this study to assess the sources and sinks of CH4, is suitable for closed
systems (as defined in Whiticar 1999), but caution must be exercised when using it for glacial
meltwater and the limitations should be acknowledged and discussed in the text. The authors also
calculate the fraction of oxidised methane (fox) using a number of assumptions, some of which
might not be substantiated. For example, Michaud et al (2017) modelled the kinetic isotopic
fractionation factor αox beneath the West Antarctic Ice Sheet, an environment likely to be more
representative of the bed of the GrIS, at 1.004. The authors use a value of 1.049, which may lead
to an underestimation of microbial oxidation of CH4 in the GrIS subglacial system. More
importantly, outgassing, as a major process affecting meltwater gas concentrations, should not be
ignored. In the turbulent flow of glacial rivers, most CH4 will likely outgas very quickly: for
example, in the Leverett Glacier river, virtually all CH4 is gone after ca 2 km (Lamarche-
Gagnon et al 2019). Moreover, outgassing affects not only the concentrations, but also the
isotopic composition of gases due to fractionation (see eg Banks et al 2017), driving the
remaining dissolved gas to more positive (heavier) values. This may result in an overestimation
of CH4 oxidation. While outgassing was probably less significant at IS (as the authors sampled
only 10 m from the subglacial outlet), it may have affected gas concentrations at RU (100 m) and
definitely would have at KS (>1 km and a proglacial lake; see below). Much more attention
should be paid to the possible effects of this process in the discussion. Moreover, it should be
pointed out that outgassing is likely enhanced in glacial systems by considering the large
pressure differentials between the subglacial environment where the CH4 is produced and the
atmosphere, and the rapid depressurisation that results from pressurised subglacial waters exiting
the ice. Such depressurisation effect is likely to also influence the isotopic signature of the
sampled gases in runoff (Banks et al 2017). While accounting for outgassing/depressurisation
and their effects on isotopic fractionation might be difficult, if not impossible, the authors should
at least discuss the limitations and biases of not doing so, and whether or not the assumptions
from their oxidation model would still hold true.
We agree that outgassing could occur between the subglacial outlet portals and our
sampling locations. However, our discussion of subglacial methanogenesis sites focuses
on the Isunnguata and Russell sites, where CH4 supersaturation was observed, and from
which samples were collected in close proximity to the glacial discharge site. While some
outgassing certainly occurs during water transit from the subglacial environment to the
sampling location, the extent of outgassing should be relatively constant over the melt
season, and thus would not explain temporal trends in fox or c. Additionally, if fox and c
were predominantly reflective of outgassing processes, the isotopic compositions of CH4
from the Russell would lead to consistently higher estimates and fox and lower c,
however both variables are nearly identical between Russell and Isunnguata sites
(manuscript Fig. 4), suggesting that isotopic compositions reflect similar subglacial
processes between the two proximal sites. Nevertheless, the reviewer makes an important
point here, which we agree with, and we will include additional discussion of how
10
possible outgassing may affect our interpretations and highlight the expected impacts on
isotopic compositions.
Our calculations of CH4 oxidation were intended to provide a minimum estimate of the
amount of subglacial CH4 oxidation that would be implicated by the observed CH4
isotopic compositions. To do this, we used the upper limit of CH4 oxidation fractionation
factors in the literature. Since we do not have enough information to constrain the actual
fractionation factor, we believe that presenting a minimum value, even if it is likely to be
an underestimate, provides a valuable constraint on the inferred role of subglacial CH4
oxidation. While other fractionation factors, such as that presented in the cited Antarctic
study, may be closer to the value of the true fractionation factor under the Greenland Ice
Sheet, using this value introduces more assumptions than our current approach.
Assuming similar subglacial environments between Antarctica and Greenland may
additionally not be appropriate because subglacial conditions differ between these
settings. For instance, while supraglacial meltwater flows from the surface to the base of
the Greenland ice sheet and provides biologically relevant material such as labile organic
matter, oxygen, and nutrients in dust debris or imparted through atmospheric deposition,
no such supraglacial meltwater transfer has been observed in Antarctic settings and
surface water production in Greenland is currently much higher than in Antarctica (Bell
et al., 2018). While subglacial liquid water may be present, in Antarctica, the glacial
history is significantly different from Greenland and the time since atmospheric contact
in Antarctic subglacial lakes can be thousands to millions of years.
Despite the uncertainty in CH4 oxidation fractionation factors, revisions could include a
range of CH4 oxidation estimates using the range spanned in the literature, if appropriate.
The KS site is additionally problematic as there is a large proglacial lake right by the portal, with
an estimated water residence time in the order of 24 hours at peak discharge (Hatton et al 2019).
This may significantly change the concentrations and isotopic signatures of the dissolved gases
exported further downstream via outgassing (and possibly also microbial processes in the lake
bottom sediment), and may be the reason why the CH4 concentrations at KS are near
atmospheric equilibrium. This should also be mentioned when discussing the results from KS.
We agree with this assessment. However, flow at KS through the glacial lake is slow with
very little turbulence, which should minimize the extent of outgassing. Additionally,
since CO2 is out of equilibrium with respect to atmospheric concentrations, we believe
that the lack of CH4 supersaturation is not due to outgassing. However, because
outgassing is a possible contributing factor, we will discuss this in the text more clearly.
In the discussion, the authors interpret the observed orders of magnitude variability in dissolved
gas concentrations in the meltwater samples as differences in the sources and sinks of the gases
(lines 290-291). However, some of the explanations of CH4 variability are unnecessarily
speculative and unsupported by data, and some rest on incorrect assumptions. First, the
variability in subglacial OM substrates is invoked (312). This is certainly a factor affecting
subglacial C cycling and export rates, but no supporting OC data are presented. Permafrost
reservoirs, suggested based on the study by Ruskeeniemi et al (2018), are unlikely to be of
11
importance (and were not alluded to in LamarcheGagnon et al 2019, as suggested at line 314), as
they extend only a few km into the ice sheet bed. Moreover, Ruskeeniemi et al (2018) only
focused on the thermal state of the sediments/soils, rather than the nature of OC. I agree the
Holocene ice margin fluctuations were probably important in providing fresh OC substrate that
could have been metabolised into CH4 that is currently being exported. Older (Eemian) OC
sources are however also present and exported in the meltwater (Kohler et al 2017) and may
have been used as methanogenesis substrates.
We do not include DOC or POC data in this manuscript because delineating OC sources
(as subglacial versus supraglacial, for instance), which may have very different
concentrations and reactivities between sites and over time, is outside the scope of this
manuscript and data set. We do not believe that DOC data would substantially impact the
results presented in this manuscript, as many other indicators of OC remineralization
(CO2, CH4, 13C-CO2, and NH4) all indicate that OC remineralization occurs under the
ice sheet but to varying extents, and DOC concentration information is not needed to
make this inference.
We will modify the text regarding the formation and nature of the subglacial OC deposits
that may be implicated by our results. We acknowledge that we have no data regarding
these deposits, which are as of now poorly constrained in both their nature and
distribution. However, the lack of information regarding subglacial OC deposits does not
impact the interpretation of our results, which all indicate that varying OC
remineralization (and mineral weathering) occurs and contributes to heterogeneous
greenhouse gas content of subglacial discharge.
Reservoirs of old CH4 are not considered in the study. Second, a direct effect of oxygen supply
to the ice sheet bed by surface meltwater on methane production/oxidation is proposed, based on
the negative correlation of CH4 concentrations at RU and Watson River discharge (319-327). As
explained above, linking gas concentrations and isotopic signatures at IS and RU to discharge
data from the Watson River is misleading. In addition, the authors only consider live
methanogenesis and ignore potential old CH4 storage/leakage (see above). Dilution by meltwater
is only acknowledged at lines 328-329 as an alternative explanation, although it plays a
significant role. The local subglacial sources of CH4 are probably limited to microbial activity
(Lamarche-Gagnon et al 2019), which takes place in anoxic sediments buried under the ice.
Whether it’s recent activity or reservoirs of ancient CH4, its export is dependent on meltwater
tapping and flushing pockets of produced gas. As a result, CH4 concentrations in the meltwater
are necessarily discharge-dependent. This is indeed complicated by outburst events; however,
these are limited to large outlets (lakes form at much higher altitudes further into the ice sheet
than those to which this subcatchment extends), and explaining the lack of discharge-CH4
concentration relationship at IS by outbursts (330-332) is therefore is not justified. Last, CH4
oxidation, discussed at lines 350-361, is certainly an important process controlling the amount of
CH4 that will be exported from under the ice to the atmosphere. However, in addition to the
uncertainty in determining the degree of CH4 oxidation, the authors’ interpretation of the data
again relies on correlating the CH4 concentrations at IS and RU with Watson River discharge
and on treating the 2017 and 2018 data as a time series, both of which are flawed (see above).
12
We acknowledge that our interpretations assume that most CH4 is produced actively,
though leakage of “old” CH4 may occur, and will therefore include this as a possibility.
However, particularly in the peak melt season when subglacial residence time should be
shortest, our measured 13C-CH4 values closely match those measured by live
methanogenic communities by Dieser et al. (2014), supporting (but not confirming)
active methanogenesis under these portions of the Greenland Ice Sheet.
We disagree that dilution by meltwater is not presented as a key mechanism explaining
the discharge-concentration relationship of CH4 as it is one of only two mechanisms
presented for the Russell Glacier that are given approximately equivalent amounts of
discussion (Lines 325-327: higher methanogenesis during low flow resulting from greater
subglacial residence time. Lines 327-328: dilution of methanogenic subglacial drainage
by supraglacial meltwater). These mechanisms are additionally not mutually exclusive.
Our modified manuscript using discharge data from the Isunnguata sub-catchment (called
Isunnguata in this study) will likely somewhat change the discharge-concentration
relationship at the Isunnguata. In our revised manuscript, we will more clearly describe
the lack of relationships between discharge and concentration that invoke heterogeneous
CH4 distributions in distributed portions of the subglacial drainage network, which we
will distinguish more clearly from potential impacts from outburst events.
In summary, I recommend the authors revisit their local hydrology description and interpretation,
rename their sampling sites accordingly, avoid correlating their small stream data with the
Watson River discharge record, and properly acknowledge the limitations and uncertainties of
the used geochemical calculations for interpretation of the subglacial gas sinks and sources,
especially for CH4
This review has provided valuable feedback regarding information needed for better
clarity of our sampling sites and their hydrological settings, which we will heavily
incorporate in manuscript revisions. Many of the criticisms regarding hydrology and use
of Watson River discharge to assess concentration-discharge relationships will be
addressed by new discharge information for our study site (Isunnguata sub-catchment,
referred to as Isunnguata in this study) provided by Asa Rennermalm. Our interpretations
may shift somewhat following these modifications although we think based on the small
watershed correlation with Watson River discharge, our primary findings will be robust.
Specifically, CO2 and CH4 concentrations exhibit a high degree of heterogeneity between
glacial discharge sites of the Greenland Ice Sheet, and that variations likely occur due to
disparate levels of subglacial organic carbon remineralization. We think it is important to
demonstrate not only that this heterogeneity exists, but also that it represents a large
range of greenhouse gas fluxes from subglacial systems that are controlled by various
processes, including weathering reactions and hydrologic and microbial processes. The
significance of this finding is to point out the potential range of greenhouse gas fluxes in
a warming world with retreating ice sheets, such is occurring now, as well as occurred
since the Last Glacial Maximum. These results could significantly impact upscaling
efforts of greenhouse gas fluxes from GrIS melt, which will be an increasingly import
carbon flux in the coming decades.
13
Specific comments
53: please specify if Graly et al 2017a or b
This refers to Graly 2017b and will be modified in the revised manuscript.
58-60: relevant work should be cited here, eg the recent review by Wadham et al (2019)
This citation will be added.
66: Musilova et al (2017) did not study subglacial microbial activity; this reference is irrelevant
here
This will be removed.
107-110: methanogens have also been identified in Russell Glacier basal ice (Stibal et al 2012)
and Leverett Glacier river suspended sediment (Lamarche-Gagnon 2019); CH4 supersaturation
in meltwater was also measured by Dieser et al (2014) but not by Christiansen & Jørgensen
(2019)
Thank you for these corrections, we will revise our statements to reflect this.
14
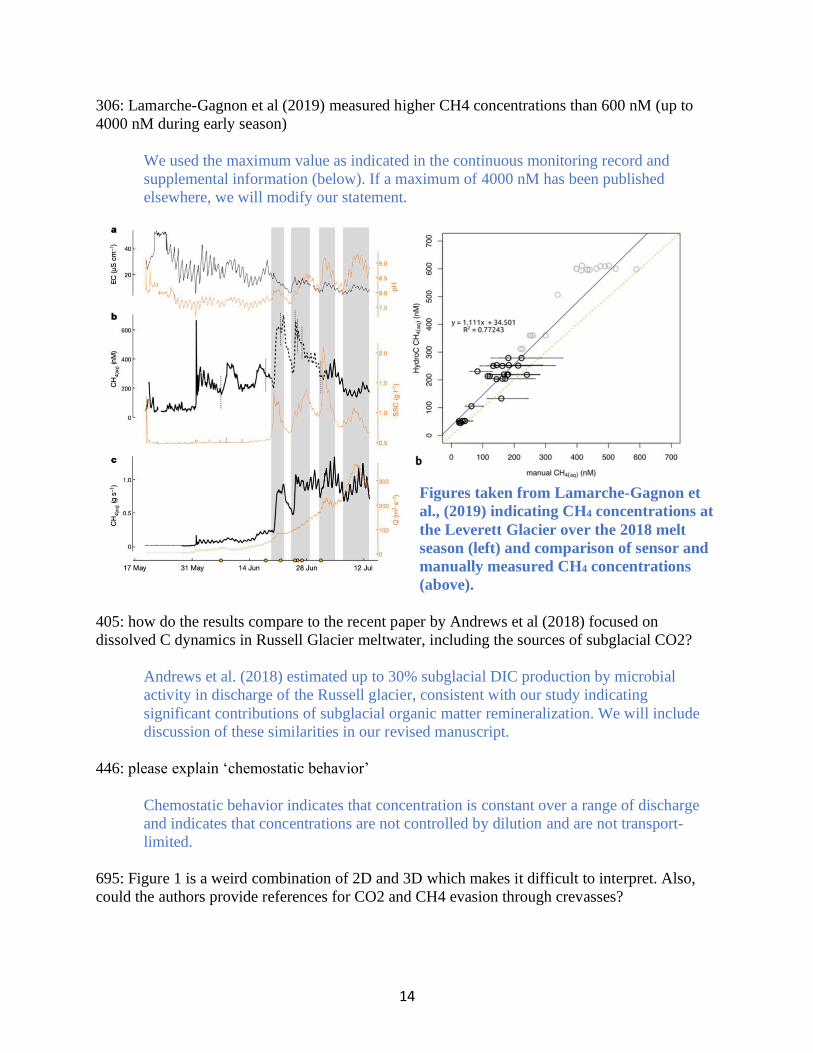
306: Lamarche-Gagnon et al (2019) measured higher CH4 concentrations than 600 nM (up to
4000 nM during early season)
We used the maximum value as indicated in the continuous monitoring record and
supplemental information (below). If a maximum of 4000 nM has been published
elsewhere, we will modify our statement.
Figures taken from Lamarche-Gagnon et
al., (2019) indicating CH4 concentrations at
the Leverett Glacier over the 2018 melt
season (left) and comparison of sensor and
manually measured CH4 concentrations
(above).
405: how do the results compare to the recent paper by Andrews et al (2018) focused on
dissolved C dynamics in Russell Glacier meltwater, including the sources of subglacial CO2?
Andrews et al. (2018) estimated up to 30% subglacial DIC production by microbial
activity in discharge of the Russell glacier, consistent with our study indicating
significant contributions of subglacial organic matter remineralization. We will include
discussion of these similarities in our revised manuscript.
446: please explain ‘chemostatic behavior’
Chemostatic behavior indicates that concentration is constant over a range of discharge
and indicates that concentrations are not controlled by dilution and are not transport-
limited.
695: Figure 1 is a weird combination of 2D and 3D which makes it difficult to interpret. Also,
could the authors provide references for CO2 and CH4 evasion through crevasses?
15
The exchange through crevasses is drawn to indicate the semi-closed nature of the
subglacial system, whereby gas exchange may occur. While no studies have directly
measured this exchange to our knowledge, atmospheric gas exchange in the subglacial
environment has been implicated (Graly et al., 2017) and contact between the atmosphere
and the subglacial environment invokes exchange in moulins or fractures that allow
exchange of atmospheric gases to depth.
700: Figure 2 needs redrawing to correct the river network names and to better indicate the
sampling sites; please also use the newer transcription ‘Kiattut’, to be consistent with the text.
This correction will be made.
740: the regression line in Figure 8b doesn’t look right – were some points omitted?
No points were omitted, however there is one point in the CO2-atm series that falls below
the other points but is partially obscured by a point in CO2-OM, which may have resulted
in confusion. The regression includes all points in the data series.
References
Andrews, M. G., Jacobson, A. D., Osburn, M. R. and Flynn, T. M.: Dissolved carbon dynamics
in meltwaters from the Russell Glacier, Greenland Ice Sheet, J. Geophys. Res. Biogeosciences,
doi:10.1029/2018JG004458, 2018.
As, D. Van, Hasholt, B., Ahlstrøm, A. P., Box, J. E., Cappelen, J., Colgan, W., Fausto, R. S.,
Mernild, S. H., Bech, A., Noël, B. P. Y., Petersen, D., Broeke, M. R. Van Den, As, D. Van,
Hasholt, B., Ahlstrøm, A. P., Box, J. E., Colgan, W., Fausto, R. S., Mernild, S. H. and
Mikkelsen, A. B.: Reconstructing Greenland Ice Sheet meltwater discharge through the Watson
River ( 1949 – 2017 ) Reconstructing Greenland Ice Sheet meltwater discharge through the
Watson, Arctic, Antarct. Alp. Res., 50(1), doi:10.1080/15230430.2018.1433799, 2018.
Bell, R. E., Banwell, A. F., Trusel, L. D. and Kingslake, J.: Antarctic surface hydrology and
impacts on ice-sheet mass balance, Nat. Clim. Chang., 8, 1044–1052, 2018.
Christiansen, J. R. and Jørgensen, C. J.: First observation of direct methane emission to the
atmosphere from the subglacial domain of the Greenland Ice Sheet, Sci. Rep., 8(1), 2–7,
doi:10.1038/s41598-018-35054-7, 2018.
Dawes, P. R.: The bedrock geology under the Inland Ice: The next major challenge for
Greenland mapping, Geol. Surv. Denmark Greenl. Bull., (17), 57–60,
doi:10.34194/geusb.v17.5014, 2009.
Deuerling, K. M., Martin, J. B., Martin, E. E., Abermann, J., Myreng, S. M., Petersen, D. and
Rennermalm, A. K.: Chemical weathering across the western foreland of the Greenland Ice
Sheet, Geochim. Cosmochim. Acta, 245(245), 426–440, doi:10.1016/j.gca.2018.11.025, 2019.
16
Graly, J. A., Drever, J. I. and Humphrey, N. F.: Calculating the balance between atmospheric
CO2 drawdown and organic carbon oxidation in subglacial hydrochemical systems, Global
Biogeochem. Cycles, 31(4), 709–727, doi:10.1002/2016GB005425, 2017.
Lamarche-Gagnon, G., Wadham, J. ., Sherwood Lollar, B., Arndt, S., Fietzek, P., Beaton, A. D.,
Tedstone, A. J., Telling, J., Bagshaw, E. A., Hawkings, J. R., Kohler, T. J., Zarsky, J. D.,
Mowlem, M. C., Anesio, A. M. and Stibal, M.: Greenland melt drives continuous export of
methane from the ice-sheet bed, Nature, 565(7737), 73–77,
doi:http://dx.doi.org/10.1038/s41586-018-0800-0, 2019.
Rennermalm, A. K., Smith, L. C., Chu, V. W., Box, J. E., Forster, R. R., Broeke, M. R. Van Den
and As, D. Van: Evidence of meltwater retention within the Greenland ice sheet, Cryosph.,
1433–1445, doi:10.5194/tc-7-1433-2013, 2013.


