
Review of Turbidity and Suspended Sediment Monitoring at Horizons Regional Council
May 2011
Review of Turbidity and Suspended Sediment Monitoring at Horizons Regional Council
Prepared for Horizons Regional Council
May 2011

Authors/Contributors: D M Hicks Principal Scientist Sediment Processes +64-3-343 7872 [email protected]
National Institute of Water & Atmospheric Research Ltd
10 Kyle Street
Riccarton
Christchurch 8011
PO Box 8602, Riccarton
Christchurch 8440
New Zealand
Phone +64-3-348 8987
Fax +64-3-348 5548
NIWA Client Report No: CHC2011-021 Report date: May 2011 NIWA Project: ELF11215 Prepared for: Jon Roygard May 2011 Science Manager Report No. 2011/EXT/1151 Horizons Regional Council ISBN No. 978-1-877556-69-2 Palmerston North

4
1. Executive summary This report provides a peer review of procedures used in Horizons Regional
Council‟s turbidity and suspended sediment monitoring network, which is currently
being expanded and upgraded with state-of-the-art instrumentation. The review is to
help ensure that the network is operated to best-practice standards and delivers
information useful for answering management questions relating to river water
quality, sediment loads, and initiatives to mitigate catchment erosion.
In scope, the review covers the protocols and methodologies for future measurement
and processing of continuous turbidity time series data, for deriving suspended
sediment concentration series data from the turbidity record, and for processing
existing data.
The review results are given in terms of comments on existing practice,
recommendations for improvements, and an outline of the next steps.
Overall, the current Horizons field and data-processing approaches are thorough and
reflect the experience gained and the investment made over the past decade.
The main issues requiring improvement relate to the documentation of data editing
procedures, quantification of uncertainty in synthetic/derived data records, laboratory
procedures for analysing suspended sediment concentration, and field sampling
strategies for collecting data to calibrate relations between turbidity and suspended
sediment concentration (SSC).
Specific recommendations are:
To replace the Total Suspended Solids (TSS) laboratory analysis method for
SSC analysis with one that analyses the full sample retrieved from the field.
The TSS method can substantially under-represent the coarser fractions of the
suspended load.
To use event sampling to ensure the relation between turbidity and SSC is
adequately sampled across the range of SSC that delivers the bulk of the river
sediment load. Regularly-scheduled sampling programs that typically intersect
base-flows (such as SOE water quality monitoring) are inefficient for this
purpose.
To better document and illustrate procedures for editing turbidity data, filling
record gaps with turbidity proxy data, and deriving calibration relations. As
well as providing clear instruction, this will archive the rich reservoir of
experience that Horizons has accumulated over the past decade.
To use existing datasets to evaluate the hypotheses underpinning the
methods to remove turbidity record noise.
To complete data reviews/audits with summary statistics classifying the record
duration (or derived results such as sediment load) by QC code.
To quantify and include in record Comments the uncertainty in the functions
used to patch/adjust turbidity records from proxy signals and to convert
5
turbidity through into cross-section SSC. These error statistics should be
related to QC codes associated with the edited series data so that errors can
be estimated on derived results such as annual and mean annual sediment
load.
As well as acting on these recommendations, a priority for Horizons should be to
more clearly specify the sampling strategy and standards/expectations required of
the monitoring network so that it delivers results useful to the various intended
purposes. For example, for the purpose of validating maps of predicted mean annual
sediment yield and expectations of erosion control measures, it will be necessary to
set minimum monitoring periods and accuracy requirements for mean annual
sediment load. Options for SS particle size analysis also need to be investigated.
6
Contents
1. Executive summary .......................................................................................... 4
2. Introduction ....................................................................................................... 7
2.1 Background ................................................................................................ 7
2.2 Aim and objectives ...................................................................................... 7
2.3 Work program and report outline ................................................................ 8
3. Preliminary note on turbidity instruments and standards ............................ 9
4. Turbidity monitoring program ........................................................................ 10
4.1 Instrumentation and standards ................................................................. 10
4.2 Data editing .............................................................................................. 10
4.3 Turbidity data editing since 2005 .............................................................. 11
5. Suspended sediment monitoring program ................................................... 16
5.1 SS sampling for turbidity vs SSC calibration at-a-point ............................. 16
5.2 Calibration to cross-section mean SSC .................................................... 18
6. Site inspections ............................................................................................... 20
7. Recommendations for improving practice ................................................... 21
8. Next Steps........................................................................................................ 22
9. Conclusions ..................................................................................................... 23
10. Acknowledgements ........................................................................................ 24
11. References ....................................................................................................... 25
Reviewed by Approved for release by
Jeremy Walsh Charles Pearson

7
2. Introduction
2.1 Background
Turbidity monitoring is an integral, multi-use component of Horizons Regional
Council‟s water quality monitoring network (Roygard et al., 2010). Low range
turbidity, typical during normal flows, relates to values such as the suitability for
swimming and river clarity, while high range turbidity during floods and freshes
provides a proxy for suspended sediment concentration and so enables
determination of sediment load.
The water quality monitoring network has several purposes including state of
environment (SOE) monitoring, identifying causes of observed degraded water
quality, and monitoring effectiveness of regulatory and non-regulatory initiatives. In
the latter case, the key programme benefiting from turbidity and sediment monitoring
is Horizons‟ Sustainable Land Use Initiative, which is addressing sediment loss from
highly erodible land.
Over the past decade, Horizons has invested in moving from the more typical
discrete sampling techniques for turbidity and sediment monitoring to continuous,
sensor-based monitoring. Over this period, the number of sites being monitored has
increased, instrumentation has improved in capability and reliability, and valuable
experience has been gained in field operations and in data processing. Now, their
current network is in the midst of a major upgrade that will, by June 2011, have state-
of-the-art 0-4000 Formazin Nepholometric Unit (FNU) sensors established at 16
hydrometric/water quality sites across the region to measure turbidity every 5
minutes. As a part of this upgrade, nine sites are also being fitted with automatic
samplers to assist in full coverage of both turbidity and sediment sampling, while
manual sediment gaugings and particle size analysis will provide further information.
At this turning point (which can be viewed as the transition from the „learning curve‟
to mature monitoring with established protocols), Horizons have sought a peer review
of their current procedures in order to ensure best practice underpins their turbidity
and suspended sediment data. This report provides that review.
The work was funded by an Envirolink small advise grant ("Continuous turbidity
measurement in rivers", Project ELF11215, Support No 930-HZLC78).
2.2 Aim and objectives
The review aims to provide initial feedback on the turbidity and sediment monitoring
programme, past and future, by:
1. Reviewing the protocols and methodologies for future measurement and
processing of continuous turbidity time series data and derivation of
suspended sediment series.
2. Reviewing the protocols and methodologies employed to process existing data
from Horizons monitoring of continuous turbidity time series data and
derivation of suspended sediment series.
8
3. Recommending any improvements to measurement techniques and quality
assurance protocols and identify the next steps to ensure best practice is
followed.
2.3 Work program and report outline
The bulk of the work involved a visit to the Horizons office to interview Horizons
technical staff regarding field and office methodologies, instrumentation limitations,
and lessons learnt over the past decade. This report proceeds by reviewing what has
been and is being done, with comment and recommendations for change inserted
where appropriate. Turbidity monitoring is considered first, followed by suspended
sediment monitoring, then comments are given on the field sites visited. The
recommendations and the next steps are then summarised. While the comments are
directed largely towards current/future procedures, they typically apply also to the re-
processing of existing data.

9
3. Preliminary note on turbidity instruments and standards
It is useful to begin with a brief overview on turbidity instruments, units, and
standards. This is necessary because while in general turbidity is a measure of the
amount of light scattering from a solution, the response of a given instrument over a
given range of variously turbid reference solutions is dependent on the instrument
design, notably the angle between the light source and detector (e.g. whether
attenuation, side-scatter or back-scatter) and the wavelength and bandwidth of the
incident light (e.g., near infrared monochrome or broad-spectrum white light). Thus,
different instruments measure different things and produce numbers that may not be
equivalent or even inter-converted. For this reason, standards are adopted for
instruments with a limited range of specifications. Also, whereas previously the same
units (e.g., Nephelometric Turbidity Units or NTU) were often assigned to a range of
instruments, in recent years it has become conventional to associate standards with
unique units. While this proliferates the number of turbidity units, it at least avoids
false assumptions about instrument and data equivalence. A commonly used
standard has been EPA 180.1, which was established by the US Environmental
Protection Agency in 1993. Measurements complying with this standard are reported
in Nephelometric Turbidity Units (NTU). An alternative standard, favoured in Europe,
is ISO 7027. This specifies a different light source and detector geometry, and
measurements are reported in Formazin Nephelometric Units (FNUs).
Problems can arise when different types of instrument are used to compile a turbidity
record. For example: (i) a portable hand-held instrument, calibrated in the laboratory,
is used to check for drift in a field instrument of different type; (ii) different instrument
types are used to measure high and low turbidity ranges; (iii) the instrument type is
changed during an upgrade; (iv) a relationship between suspended sediment
concentration (SSC) and turbidity is established off samples taken to a laboratory
instrument but is then applied to a turbidity record from a different type of field
instrument.
For these reasons, it is essential to record instrument type and standard in metadata
documents and it is best practice to adopt and sustain a given standard. In the case
of existing records from non-standard instruments, tables such as provided in USGS
(2004) may assist with assigning appropriate units.

10
4. Turbidity monitoring program
4.1 Instrumentation and standards
Horizon‟s turbidity monitoring program commenced in 1999 using in-situ Analite
sensors in King Country mudstone catchments such as the Ohura. While meeting the
EPA 180.1 standard (and so delivering turbidity readings in formal NTU), these
instruments were found to be unreliable.
In 2005, the sensors were upgraded to Greenspan sensors (TS100, TS1200). While
the more recent (post 2008) Greenspan sensors now meet the EPA 180.1 standard,
it was later appreciated that the earlier vintage Greenspan sensors did not and so
provided turbidity information that was inconsistent with laboratory instruments.
In 2010, the ISO 7027 standard was adopted by Horizons and WTW sensors
(meeting this standard) were installed as the primary in-situ sensors at 6 sites. The
WTW sensors have dual ranges (0-40 and 0-4000 FNU), outputting a dual record,
and have sapphire-glass lenses and built-in ultrasonic vibration to inhibit lens bio-
fouling.
As well as these in-situ sensors, various sites currently have secondary, in-line
sensors that measure turbidity in a water circuit continuously pumped from the river.
Also, some sites have secondary in-situ sensors of various types. These secondary
sensors are typically used to provide a back-up record for times when the primary
sensor fails.
4.2 Data editing
4.2.1 Why it is needed
Data records from permanently deployed in-situ turbidity sensors are invariably
patchy in quality and usually require considerable editing. Typical problems include
calibration drift, over-ranging, lens bio-fouling, light-beam obstruction, and occasional
instrument failure.
For turbidity monitoring, calibration drift (in instrument gain and/or offset) needs to be
checked on a regular basis – either by checking the sensor with standard solutions,
by comparing the sensor reading against check measurements made in situ with
portable sensors, or by analysing water samples with lab instruments. In the latter
cases, it is important that the checks follow the same standard.
Over-ranging occurs when the water is more turbid than can be detected by the
sensors, and is an issue particularly when the turbidity record is intended as a proxy
for SSC. This was a common problem during floods and freshes with early vintage
sensors with relatively low ranges. Depending on the sensor, over-range conditions
can result in an error value, flat-lining at the peak-of-range, or apparent reduced
turbidity (due to scattering being reduced through attenuation). The latter case may
be hard to distinguish in a time-series from a real reduction in turbidity.
Lens bio-fouling, due to algal growth on the lens (often compounded by silt
embedding in the biofilm), is the most common cause of poor turbidity data. It is
typically manifest as an increasingly noisy record that eventually begins to ramp

11
upwards, but disappears when the lens is cleaned. Ways to inhibit bio-fouling include
wipers, micro-water jets, special lens-coatings, and ultrasonic vibration.
Beam obstruction occurs when light is reflected off plant debris that collects around
the sensor and/or its housing, but may also be caused by living stream biota (e.g.
fish, macrophytes).
Segments of record affected by these problems need to be identified and either
corrected or else deleted and the gap replaced with synthetic data.
Comment
While Horizons staff report that the new WTW sensors have superior capability to
avoid bio-fouling, it should not be assumed that the sensors are perfect. Thus,
procedures are still required to check for the onset of fouling during data collection.
With telemetry, this can be checked by regular visual inspection of the record, which
may need to be done every few days through the vulnerable summer period. If
significant fouling is identified, it is better to manually clean the sensor than to rely on
data editing.
4.2.2 Turbidity data editing up to 2005
Prior to 2005, data editing at Horizons followed a set of staged procedures to clean
bio-fouled turbidity records. For fouling on turbidity recession trends, the noisy record
was simply smoothed, but for upward-ramping trends the record was deleted until
such time as the sensor was cleaned and the gap was bridged by linear interpolation.
No attempt was made to convert informal NTU records (from non-standard sensors)
to formal records.
Comment
These editing steps are prone to over-representing the correct turbidity, thus I agree
with the decision to discard data editing using such methods and to re-process the
data using the current editing protocols.
4.3 Turbidity data editing since 2005
Since 2005, improved turbidity data editing procedures have been developed. These
provide the foundation for the current/future editing protocols (documented in
Horizons 2010), and are also now being used to re-edit the pre 2005 data. A key
feature is that the data editing proceeds to completion in yearly batches. This is a
good approach because it enables the person editing the data to remain familiar with
the events over the year under analysis. The main steps are as follows.
4.3.1 Drift-checking
Sensor drift is checked by comparing sensor turbidity (FNU for the modern fleet of
WTW instruments) with the lab-measured FTU of the monthly water-quality samples.
Agreement within 10% is considered acceptable.

12
Comment
This 10% agreement is pragmatic as in situ measurements will not always agree
exactly with the turbidity of samples collected nearby, due to in-river mixing and lab
sub-sampling effects.
4.3.2 Data Cleaning
Data cleaning is undertaken by a multi-stage process:
Spikes (single-point high values) are removed with a numerical filter.
If fouling/noise is apparent, 1-hour, 3-hour, 6-hour, and if necessary 12-hour
averaging filters are used to remove noise peaks, with values replaced
typically by the minimum observed over the averaging period. An operator
based decision is made before the averaging period is increased, and a
diagnostic quality code is assigned to each edited data value.
The filtered turbidity record is compared visually with concurrent
hydraulic/hydrologic records and/or the records of secondary sensors (e.g. in-
line sensors or in-situ sediment sensors), auto-samples or manual samples. A
decision is made as to whether the turbidity record being examined is real (i.e.,
hydrologically driven) or should be deleted and a gap inserted. Upward-
ramping fouled records are generally deleted.
Event records are inspected for signs of sensor over-ranging (e.g., see 5.2.1).
Suspect spans of record are deleted and commented.
Comment
This stage is a key one for data quality and depends substantially on operator
judgement, which draws on all available information for the period of record being
considered. I agree that this the best way to do this, but it requires the editor to be
highly skilled, experienced, and diligent. Thus, some certified (at least in-house)
training program would be appropriate. It is also important that methods are applied
consistently, thus it is important to have these well documented and illustrated with
examples. I note that the editing procedures have been documented (Horizons,
2010), but these are not illustrated graphically (with case example data) and more
flow charts (like the existing one for data cleaning) would be helpful. There is possibly
too much reliance at present on the knowledge of one key staff member (Senior data
delivery coordinator, Brent Watson).
The use of minimum-value filters to clean-out bio-fouling noise is based on the
assumption that the noise „troughs‟ are for times when the measurement is not fouled
by algal fronds. I recommend that this be tested by running an experiment with two
WTW sensors side by side, with the ultrasonic vibration turned off on one and the
other kept clean either with the ultrasonic vibration or manual cleaning if necessary.
4.3.3 Merging sensor records
With multiple sensors suited to different turbidity ranges or with the modern WTW
dual range sensors, it is necessary to merge or “bolt together” the multiple records
into one. Cross-over to the higher range record(s) is made at an appropriate

13
threshold turbidity, and the higher ranged record needs to be merged with the lower
range. For several reasons (e.g., different sensor types, different physical locations
on the bank with associated differences in SSC and mixing, differential sensor drift),
the two signals may not overlie, thus it is necessary to merge the two.
Comment
The documented procedure is vague on how this should be done, although Brent
noted that what is usually done is simply a vertical shift of the high range record to
align it at the cross-over turbidity. Generally, the low range sensor should be taken as
the reference record, so it is the high-range record that should be shifted. It is also
important that when relating SSC from auto- or manual samples to in-situ turbidity (i)
this relation is made to the merged turbidity record and (ii) the samples should be
collected as physically close as possible to the reference sensor (usually the low
range sensor).
With the new WTW dual-range sensors, differential drift between the two ranges
should not be an issue. However, the low range is preferred for the standard since
this has higher resolution and will actually be used for most of the time.
4.3.4 Patching gaps
Horizons patch gaps (i.e., replace deleted/missing turbidity record with synthetic
data), particularly during events with either no data or with over-ranged sensors,
using an expedient proxy record with which turbidity correlates. Options available at
various Horizons sites include suspended sediment sensors (essentially, these tend
to be short-path attenuation-type sensors that output a voltage or current that is
empirically correlated with SSC), secondary (e.g., in-line) turbidity sensors, auto-
samples providing lab-based turbidity measures, and hydraulic variables based on
the rated stage record.
With all of these, it is necessary to establish relations (ratings) between the proxy
record and the reference turbidity record from periods of concurrent record. Which is
preferred will depend on what is available, their record quality, and their
measurement interval, but a general rule would be to choose sediment/turbidity
sensors over hydraulic proxies. While turbidity-SSC and turbidity-turbidity
relationships are sensitive to sediment character and size-grade, they tend to show
less variance than do turbidity-discharge relations, which are strongly influenced also
by sediment supply.
The above dependencies on suspended sediment size grade and supply mean that
the ratings of any sort can shift within floods and freshes (e.g., between rising and
falling stages) and between events. For these reasons, it is preferred to look for
separate rising/falling stage relations and to develop, if possible, relations “on-the-fly”
from data close to the period being patched rather than use a long-term average
relation. All of this benefits from accumulated knowledge of the site characteristics.
The patched records and their origin are flagged with an appropriate QC code.
14
Comment
While “filling missing record” is mentioned briefly in Horizons data editing procedures
documentation (Horizons, 2010), my observation was that the procedures and
protocols for this were still “work in progress”. Thus, this is an area that would benefit
from more attention. Example protocols to develop would be the order of preference
for the various proxies available at each site and when use of separate rising-/falling-
stage relations were justified.
Consideration could be given to parameterising turbidity recessions (e.g., by defining
the constant in an exponential decay function, such as T/Tp = e-kt where Tp is peak
turbidity, t is time since turbidity peak, and k is an empirically determined
characteristic of the site).
With regard to using hydraulic data as a turbidity proxy, I have two comments. First,
while a preference was stated for using velocity rather than discharge for a hydraulic
proxy (because velocity often tends to asymptote to a maximum while discharge
increases), in reality there should be little significant difference unless the site also
has a direct velocity record (e.g., from a side-looking acoustic-doppler instrument).
Without a direct velocity record, a velocity record has to be generated from the
discharge record anyway via a hydraulic geometry relation based on discharge
gaugings. Second, I would be cautious about using hydraulic data as a proxy for
filling anything but short gaps – such as bridging bio-fouled episodes or over-ranged
segments of high turbidity events – and even then only when adequate calibration
data were available. This is because, in my experience, turbidity responds
substantially to fine sediment supply factors (affecting both SSC and size grade) that
relate only indirectly to the local hydraulic variables. There comes a point when it
might be best to leave the gap, rather than fill it with the delusion of something
meaningful.
From the perspective of using the turbidity record as a proxy for SSC and (thence to
compute suspended sediment load), an alternative approach to patching the turbidity
record with SSC data would be to leave at least some gaps in the turbidity records
unfilled and to fill the gaps in the SSC time-series at the stage when this was
generated off the turbidity series. In practice, there would be no difference in the
derived SSC record so long as the same relations were used to convert synthetic
turbidity back to SSC in cases where actual SSC data were used to patch the
turbidity record. Perhaps the decision to follow this approach could be based on
whether or not the gap in the turbidity record extended into flood flows (which carry
the bulk of the sediment load) – if it did, and if SSC data were available, then the gap
over the flood event could be left to be patched within the SSC record.
The QC tagging of all turbidity data values is, therefore, an essential procedure,
particularly if the aim is to have – after data editing – a gapless record. This will also
enable easy summaries of data quality and help estimates of uncertainty in derived
results (e.g., suspended sediment loads). A tabulation of % record by QC code
should complete the editing or auditing process.

15
4.3.5 Quality assurance
Internal (i.e., within Horizons) auditing of edited turbidity data is done by visually
overlaying and comparing annual plots of the raw and edited data.
Comment
It is important that the auditing is done by a person familiar with the editing process
and experienced with processing turbidity data – this is because the editing process
is far from trivial, integrates threads of data and information from multiple sources,
and – to some degree – requires subjective judgement. The auditing procedure
should be documented, and a flow chart summarising the auditing pathway and
decision points would be helpful.

16
5. Suspended sediment monitoring program Horizons‟ general strategy is to use turbidity time series data as a proxy for SSC,
which can then be combined with water discharge to derive suspended sediment
load (SSL). The rationale is that (i) the variance in the SSC-turbidity relationship is
less than that in the traditional SSC-discharge relationship and (ii) an instrument
based record captures greater temporal detail more efficiently than does auto- or
manual sampling. Key components of this strategy are the relationships between (i)
SSC and turbidity at the point of turbidity measurement and (ii) between this point
SSC and the cross-section mean SSC, which is required to compute the suspended
sediment load. With sediment load as the sampling purpose, it is important that these
relations are well established for the high flow range since typically this transports the
bulk of the long-term average sediment load. Hicks et al. (2004) show that typically in
New Zealand rivers flows less than the mean flow transport only a few % of the long-
term average suspended sediment yield.
5.1 SS sampling for turbidity vs SSC calibration at-a-point
5.1.1 Field Sampling
To date, Horizons have collected SS samples in three ways: using auto-samplers
during floods and freshes, bankside dip samples during regular State-of-the-
Environment (SOE) water quality sampling runs, and using depth-integrating
samplers at gauging cable-ways and bridges during floods and freshes. The bulk of
the samples collected are associated with the SOE runs, with ~ 95% of these having
been collected at base flows. While these may have been collected at the same
general location as Horizons in-situ turbidity sensors, they have often not been
collected directly beside the sensors. A basic assumption has been that suspended
sediment is uniformly mixed at the monitoring sites over all discharges.
To date, auto-samplers are located at only a few sites and are generally triggered at
fixed time intervals above a stage-threshold.
Comment
It is recommended that SS sampling at all sites being operated for sediment
objectives includes auto-sampling during high-flow events. This sampling should be
scheduled to provide an adequate distribution of samples across the
expected/encountered range of turbidity as well as to inform on the dynamics of the
turbidity-SSC relationship during events (the latter depends primarily on changes in
the size grading of the suspended load passing the turbidity sensor, which depends
both on sediment supply dynamics and mixing).
For this purpose, auto-sampling is better triggered on a flow-proportional basis (using
a data-logger to accumulate flow past the monitoring site) or at fixed intervals of
turbidity change. Sampling simulations with existing stage or turbidity series data can
be used to optimise sampling thresholds and intervals (my understanding is that
Horizons already have this simulation capability).
If at all possible, the auto-sampler intake point should be located beside the in-situ
turbidity sensor (since, at least from perspective of sediment load determination, the

17
main purpose of auto-sampling is to collect data to relate measured turbidity to SSC).
This intake-siting requirement is not so important for SOE sampling for dissolved
constituents, since these are well mixed through the flow. Thus, Horizons should be
wary about the compromises involved when using auto-samplers or hand samples
for both SOE and sediment load purposes.
5.1.2 Lab analysis
SSC has been analysed in the laboratory in recent years using the Total Suspended
Solids (TSS) method. In brief, this involves pipetting or pouring a sub-sample from
the (shaken) original sample and then passing the sub-sample through a glass-fibre
filter.
Comment
While the TSS method‟s sub-sampling allows parallel analysis of multiple
constituents in the original sample and so has become a standard for water quality
analyses, it under-catches the coarser fractions of the suspended load, particularly
those in the sand grades, thus it variously underestimates the true SSC of the full
sample depending on the sediment size grade (Guo, 2006). Since the sand
component of suspended sediment loads from western North Island rivers draining
Tertiary sedimentary and Mesozoic greywacke terrain is typically about 25-30% and
can dominate the suspended load from tephra catchments (Hicks et al., 2004), the
TSS method can reasonably be assumed to be providing an underestimate of the
true SSC for samples from Horizons‟ region. On that basis, I recommend that SSC
analyses to service Horizons SS program be confined to whole-sample analyses (as
per ASTM, 2002). Also, Comments should be added to records and turbidity-SSC
ratings to capture the method used in SSC analysis and to flag the associated
uncertainty in load estimates.
5.1.3 Turbidity vs SSC relations
Current Horizons procedures are to hand-draw turbidity-SSC relations. These are
then entered into the Hilltop Ratings software package as rating tables, which are
then used to convert turbidity to SSC (in the same way as stage-discharge ratings
are used to convert stage series data to discharge series). As with stage-discharge
ratings, the turbidity-SSC ratings are time-stamped and updated ratings can be
merged with old ones over a transition period if there is an observed shift in the
relationship. This is a good system, because the rating data provides an audit trail
and can be updated easily.
Horizons current practice also examines the turbidity-SSC rating data for rising/falling
stage separation. If this is identified, separate functions may be defined for rising and
falling stages; alternatively, a “happy average” line is drawn.
Since much if the existing calibration data are derived from SOE sampling, the
turbidity-SSC relations to date are typically data-poor (or lack any data) at the high
turbidity end and often require extrapolation.

18
Comment:
As discussed in 5.1.1, it is important that the overall monitoring programme includes
SS sampling that is focussed on developing and then maintaining turbidity-SSC
relations. The investment being made is too large to rely on compromise samples
such as collected from the SOE program.
The present rating-fitting approach tends to be subjective and could be improved
through the use of statistics. Key information to record on a running basis are the
standard error of the rating fit, any trend in the magnitude of the residuals as turbidity
increases (which shows whether the error is linear, factorial, or a more complex
function of turbidity), and the turbidity range over which the calibration has been
established. Such information will assist in decisions to change ratings (e.g., by
testing if the most recent data plot a statistically significant “distance” from the current
rating), to use multiple ratings (e.g., by testing if an improved standard-error results
from a time-stratified or dQ/dt-stratified dataset), and finally in helping estimate the
error on sediment yield calculations.
Generally, the fitted turbidity-SSC rating and also its quality-of-fit (i.e., calibration
range and standard error of fit) will change simply as more data is added. However,
as with stage-discharge ratings, it is quite possible (indeed, is to be expected) that
the turbidity-SSC relations will shift with time. This can arise, for example, when an
extreme erosion event activates large new sources of sediment that changes the
typical size grading of the suspended sediment. Such effects can persist anywhere
from several months to years. Staff should be alert for such shifts (particularly after
large floods) and will need to decide if a new turbidity-SSC rating needs to be
established. When a turbidity-SSC rating is “retired”, its final accuracy statistics
should be filed in Comments.
While the ratings are fitted within Hilltop Ratings, it may be expedient to export the
rating data to other software packages in order to extract these statistics (a tailored
VB macro in Excel would suffice). It would be useful to summarise the accuracy
statistics in annual audit reports.
As mentioned previously (section , where the turbidity record has been patched from
SSC data, the conversion back to SSC should be made with the inverse function.
Alternatively, it may be better that the derived SSC record is simply patched with the
original SSC data.
It will be important to carry through the quality codes (QC) on the edited turbidity
series data to the generated SSC data. For example, to capture the SSC estimates
proxied originally from discharge records.
I recommend that whenever SS loads are calculated that the load total over the
period of interest is broken down by quality code. Ideally, each QC could have an
uncertainty level associated with it which could be propagated through into the
uncertainty of the total load.
5.2 Calibration to cross-section mean SSC
The final step before determining the SS load from turbidity is to relate the point SSC
beside the turbidity sensor to the discharge-weighted cross-section mean SSC

19
(which is not the same as the spatially-averaged SSC). This is best done by doing a
full suspended sediment gauging, using depth-integrating samplers at multiple
verticals, and taking concurrent point samples (e.g., with an auto-sampler). The
relation will depend on the degree of mixing, which depends on the turbulence and
the size grading of the suspended load.
To date, Horizons appear to have generally assumed perfect mixing and have not
applied any adjustment.
Comment
It is my understanding that Horizons now intend that a point to section-mean SSC
relation be established for all sites in the network (past and future) that are to be
used for SS load information. The suggested approach is to collect depth-integrated
samples during a single event over a range of discharge and define the mixing ratio
(i.e., the ratio of section-mean to point SSC) as a function of discharge. This function
can be included in Hilltop TIDEDA as another rating to be applied during the process
of converting edited turbidity to SS load. As with the turbidity-SSC relations, it is
recommended that this mixing rating be filed with comments that quantify its
uncertainty (e.g. standard error, relationship of error to discharge).
Fortunately, since at least the turbulence characteristics of a site are unlikely to
change much over time, (i) present and future point to section-mean SSC relations
may reasonably be applied to past records, and (ii) once established for a site there
is little reason to continue monitoring the relation unless there is evidence that the
size grading of the suspended load has changed.
During manual sediment gaugings, it is recommended that depth-integrated samples
are also collected for particle-size grading because (i) this informs about the
expected degree of mixing, (ii) informs about the expected relationship between
turbidity and SSC (for a given SSC, a higher turbidity results from a smaller
grainsize), and (iii) provides a basis for estimating the size-grading of suspended
sediment load over events or on a mean annual basis.
Further work is required to settle on procedures for sampling for particle size
analysis. One option to consider is whether full size gradings are required or whether
a sand/mud split would be adequate. Full size gradings are required if particular
grainsize statistics (such as the mean or median size and sorting) are required –
such as for use in sediment transport/dispersion calculations or modelling. The mud
fraction (i.e., silt and clay grades finer than 0.063 mm) is typically well-mixed in river
flows and has a dominant influence on turbidity (since the back-scattering of light is
greatest from particles sized similarly to the light wavelength), thus it is of particular
interest for water clarity issues. It also tends to dominate floodplain deposition. The
sand fraction (0.063 – 2 mm) tends to be less well mixed and concentrates near the
channel bed. It is of greater interest to issues such as riverbed aggradation (i.e.,
rising bed levels) and coastal stability (since river sands nourish beaches adjacent to
river mouths). A mud/sand spilt can be achieved by pouring the sample through a
small-diameter 0.063 mm mesh sieve, then back-washing the sand off the sieve.
20
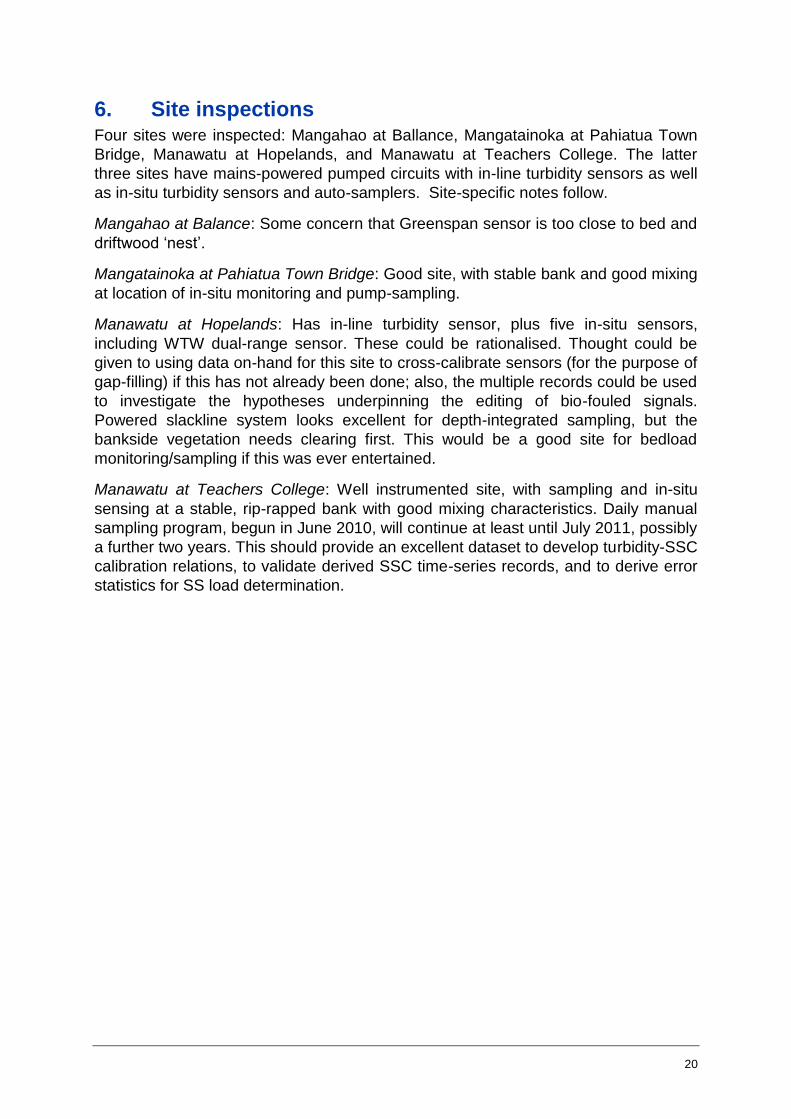
6. Site inspections Four sites were inspected: Mangahao at Ballance, Mangatainoka at Pahiatua Town
Bridge, Manawatu at Hopelands, and Manawatu at Teachers College. The latter
three sites have mains-powered pumped circuits with in-line turbidity sensors as well
as in-situ turbidity sensors and auto-samplers. Site-specific notes follow.
Mangahao at Balance: Some concern that Greenspan sensor is too close to bed and
driftwood „nest‟.
Mangatainoka at Pahiatua Town Bridge: Good site, with stable bank and good mixing
at location of in-situ monitoring and pump-sampling.
Manawatu at Hopelands: Has in-line turbidity sensor, plus five in-situ sensors,
including WTW dual-range sensor. These could be rationalised. Thought could be
given to using data on-hand for this site to cross-calibrate sensors (for the purpose of
gap-filling) if this has not already been done; also, the multiple records could be used
to investigate the hypotheses underpinning the editing of bio-fouled signals.
Powered slackline system looks excellent for depth-integrated sampling, but the
bankside vegetation needs clearing first. This would be a good site for bedload
monitoring/sampling if this was ever entertained.
Manawatu at Teachers College: Well instrumented site, with sampling and in-situ
sensing at a stable, rip-rapped bank with good mixing characteristics. Daily manual
sampling program, begun in June 2010, will continue at least until July 2011, possibly
a further two years. This should provide an excellent dataset to develop turbidity-SSC
calibration relations, to validate derived SSC time-series records, and to derive error
statistics for SS load determination.

21
7. Recommendations for improving practice The key recommendations from this review are to:
1. Analyse SSC using full samples
It is strongly recommended that the TSS laboratory analysis method be
discarded for SSC analysis and replaced with one that analyses the full
sample retrieved from the field (e.g., ASTM, 2002). The TSS method is a
compromise one that might be suitable for WQ analyses of well mixed
constituents, but if suspended sediment flux is one of the monitoring
purposes then it should not be used.
2. Focus SS sampling particularly across the high flow range
Suspended sediment loads are carried mainly during high flow events,
thus proxy records like turbidity need to be calibrated to SSC across the
full range of SSC encountered. This requires event-sampling with a
schedule that provides a good distribution of points across the calibrated
range. Regularly-scheduled sampling programs that typically intersect
base-flows (such as SOE monitoring) are inefficient for this purpose.
3. Better document turbidity data-editing and turbidity-SSC calibration
procedures
These need to be robustly documented. The reality is that at present
these procedures remain a „black art‟, and (from a broader perspective
than Horizons operations) what is done depends very much on the
experience of those editing the data and the level of resources provided
to get the job done. In this context, while Horizons have a relatively rich
reservoir of experience, this is vulnerable to being lost until it is well
documented. While a start has been made on this, this existing
documentation needs to contain greater detail and be illustrated with
examples.
4. Use existing datasets to test hypotheses underpinning the cleaning of
bio-fouled sensor data
A key hypothesis underpinning the method to remove turbidity record
noise due to bio-fouling is that a minimum-value filter is appropriate. This
can be tested with existing datasets from parallel sensors.
5. Include summary QC statistics with data audits
Data reviews/audits should include summary statistics classifying the
record duration (or derived results such as sediment load) by QC code.
6. Error/reliability statistics should be determined and filed with calibration
relations
This should be done both for the functions used to patch/adjust turbidity
records from proxy signals and for those used to convert turbidity through
into cross-section SSC. The error statistics should be related to QC
22
codes associated with the edited series data so that errors can be
estimated on derived results such as annual and mean annual sediment
load.
8. Next Steps The recommended next steps would be to:
1. Act on the above recommendations (in the priority order given above).
2. More clearly specify the sampling strategy and standards/expectations
required of the monitoring network so that it delivers results useful to the
purpose. For example, for the Sustainable Landuse Initiative, Horizons‟
strategy is to use the SEDNET model to map potential mean annual
sediment yield in order to focus soil conservation efforts and predict their
effectiveness. The expectation is that the sediment monitoring network
will assist this by validating the spatial distribution of sediment yield and
the effectiveness of land-treatment measures. For this to succeed, the
monitoring duration will need to be adequate to enable comparison of
actual and expected mean annual yield. Alternatively, consideration
could be given to validating off event yields – providing SEDNET can be
operated at the event scale.
3. Further explore the options for SS particle size analysis, including in-situ
sensors and in-line systems.

23
9. Conclusions Overall, the current Horizons field and data-processing approaches for continuous
turbidity data are thorough and reflect the experience gained and the investment
made over the past decade.
The adoption of well recognised standards for instrumentation is a key factor in
turbidity monitoring generally and underpins the existing and future Horizons turbidity
monitoring network.
The new generation of in-situ sensors being deployed meet the strict ISO 7027
standard and go some distance towards mitigating operational issues such as bio-
fouling and over-ranging. However, their performance is unlikely to be perfect and so
the monitoring program will still need care and attention and a substantial investment
in data editing and auditing.
It is appropriate that past records of turbidity data are reprocessed using current
methods, although this may mean that some of these data are unrecoverable.
Deriving continuous series data on suspended sediment concentration from turbidity
records requires adoption of field, laboratory, and analysis procedures designed
specifically for suspended sediment sampling, rather than compromising by using
procedures developed for analysis of well-mixed water quality constituents.
Key recommendations for improvement are to:
analyse SSC using full sample, rather than using the TSS method
focus SS sampling particularly across the high flow range
better document turbidity data editing and turbidity-SSC calibration procedures
use existing datasets to test/improve hypotheses underpinning data cleaning
procedures
include summary QC statistics with data audits
determine and file error/reliability statistics.
The next steps should be to apply these recommendations, to more clearly specify
the sampling strategy and standards/expectations required of the monitoring network
so that it delivers results useful to the various purpose, and to investigate options for
SS particle size analysis.

24
10. Acknowledgements Thanks to Jon Roygard, Jeff Watson, and Maree Clark for providing background
information on the applications of the Horizons‟ water quality monitoring network.
Special thanks to Brent Watson for explaining the details of the turbidity and
suspended sediment monitoring. The project was funded by an Envirolink Fund small
advice grant (No 930-HZLC78).

25
11. References ASTM (2002). Standard test methods for determining sediment concentration in
water samples. West Conshohockenm PA, ASTM International: 3977-3997.
Guo, Q. (2006). Correlation of Total Suspended Solids (TSS) and Suspended
Sediment Concentration (SSC) test methods. Report prepared for New Jersey
Department of Environmental Protection Division of Science, Research, and
Technology, Trenton New Jersey. 52 p.
Hicks, M.; Quinn, J.; Trustrum, N. (2004). Sediment load and organic matter. Chapter
12. In: Freshwaters of New Zealand. Harding, J.S.; Mosley, M.P.; Pearson,
C.P.; Sorrell, B.K. (Eds.). New Zealand Hydrological Society and New Zealand
Limnological Society, Wellington, 764 p.
Horizons (2010). Catchment data: data validation, version 2010-3, Horizons Regional
Council internal document.
Roygard, J.; Hurndell, R.; Clark, M.; Nicholson, C. (2010). Overview of Horizons‟
surface water monitoring programmes. Horizons Regional Council, Palmerston
North, June 2010.
USGS (2004). U.S. Geological Survey Implements New Turbidity Data-Reporting
Procedures. U.S. Geological Survey Information Sheet:
water.usgs.gov/owq/turbidity/TurbidityInfoSheet.pdf.

26

27


