

Richard Rawson Ph.D.
U.C.L.A. Integrated Substance Abuse Programs (I.S.A.P.)The MTP Site InvestigatorsFunded by the Center for Substance Abuse Treatment
The CSAT Methamphetamine Treatment Project
A Multi-site Trial of a Manualized Psychosocial Protocol for the Treatment of Methamphetamine
Dependence

• Powerfully addictive stimulant that dramatically affects the central nervous system
• Made easily in clandestine labs with OTC ingredients
What Is Methamphetamine?
Methamphetamine comes in many forms and can be:
• Smoked• Snorted• Orally Ingested• Injected
How Is Methamphetamine Taken?

Scope of the Methamphetamine Problem Worldwide
According to surveys and estimates by WHO and UNDCP, methamphetamine is the most widely used illicit drug in the world except for cannabis.
World wide it is estimated there are over 35 million regular users of methamphetamine, as compared to approximately 15 million heroin users and 10 million cocaine users

Scope of Methamphetamine Use in the United States
Methamphetamine abuse, long reported as the dominant drug problem in Honolulu, Hawaii and San Diego, CA, has become a substantial drug problem in other sections of the West, Midwest & Southwest, as well.
Indications that it is spreading to rural and urban sections of the South and East coast.
Once traditionally associated with white, male, blue-collar workers.
Now is being used by more diverse population groups that change over time and differ by geographic area.

Groups with High Rates of Meth Use
Women Residents in Western/Midwestern Rural
Areas and Small/Medium Cities Predominantly Caucasian, Increasing
Numbers of Hispanics Gay Men
CSAT MTP Project Goals:
To study the clinical effectiveness of the Matrix Model
To compare the effectiveness of the Matrix model to other locally available outpatient treatments
To establish the cost and cost effectiveness of the Matrix model compared to other outpatient treatments
To explore the replicability of the Matrix model and challenges involved in technology transfer

Manuals in Psychosocial Treatment
Reduce therapist differences
Ensure uniform set of services
Can more easily be evaluated
Enhance training capabilities
Facilitate research to practice

Matrix Model ofOutpatient Treatment
Organizing Principles of Matrix Treatment Program components based upon scientific
literature on promotion of behavior change.
Program elements and schedule selected based on empirical support in literature and application.
Program focus is on current behavior change in the present and not underlying “causes” or presumed “psychopathology”.
Matrix “treatment” is a process of “coaching”, educating, supporting and reinforcing positive behavior change.
Matrix Model ofOutpatient Treatment
Organizing Principles of Matrix Treatment Non-judgemental, non-confrontational
relationship between therapist and patient creates positive bond which promotes program participation.
Therapist as a “coach”
Positive reinforcement used extensively to promote treatment engagement and retention.
Verbal praise, group support and encouragement other incentives and reinforcers.

Matrix Model ofOutpatient Treatment
Organizing Principles of Matrix Treatment
Accurate, understandable, scientific information used to educate patient and family members
Effects of drugs and alcohol
Addiction as a “brain disease”
Critical issues in “recovering” from addiction
Matrix Model ofOutpatient Treatment
Organizing Principles of Matrix Treatment Behavioral strategies used to promote
cessation of drug use and behavior change
Scheduling time to create “structure”
Educating and reinforcing abstinence from all drugs and alcohol
Promoting and reinforcing participation in non- drug-related activities

Matrix Model ofOutpatient Treatment
Organizing Principles of Matrix Treatment Cognitive-Behavioral strategies used to
promote cessation of drug use and prevention of relapse.
Teaching the avoidance of “high risk” situations
Educating about “triggers” and “craving”
Training in “thought stopping” technique
Teaching about the “abstinence violation effect”
Reinforcing application of principles with verbal praise by therapist and peers
Matrix Model ofOutpatient Treatment
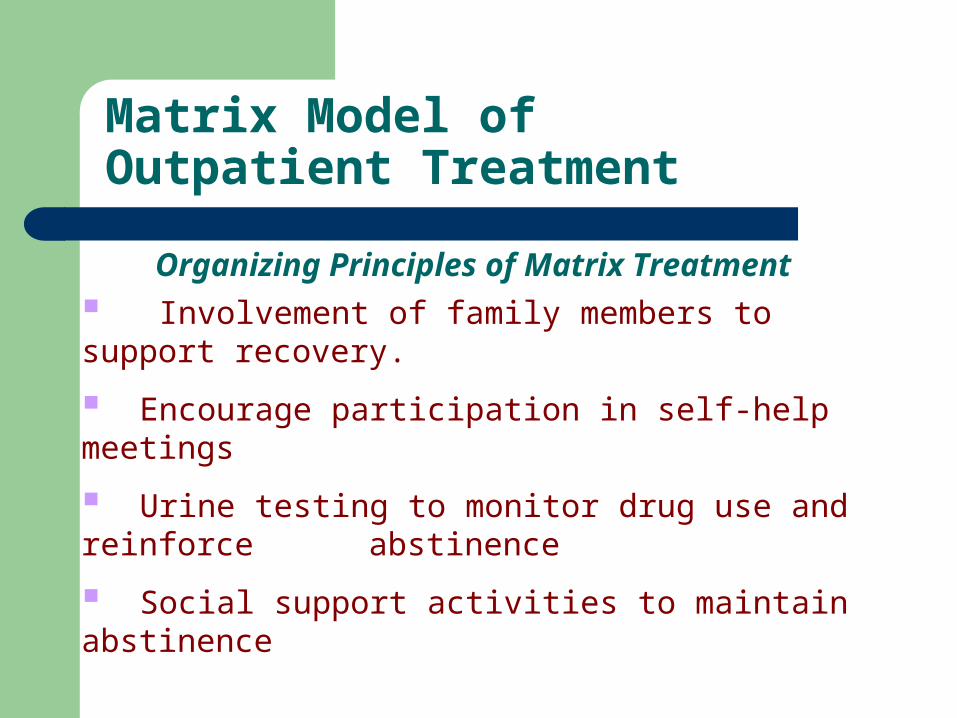
Organizing Principles of Matrix Treatment Involvement of family members to support
recovery.
Encourage participation in self-help meetings
Urine testing to monitor drug use and reinforce abstinence
Social support activities to maintain abstinence

Matrix ModelAn Integrated, Empirically-based, Manualized Treatment Program
Relapse Prevention Family and Group Therapy
Motivational Interviewing
12- Step Involvement
Psychoeducation Social Support
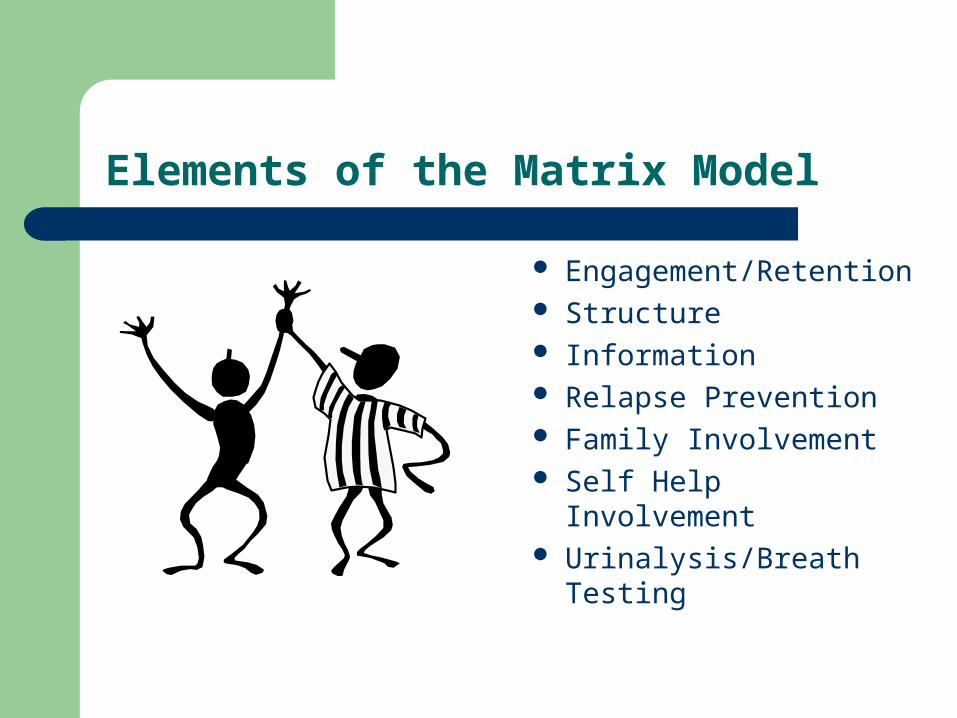
Elements of the Matrix Model
Engagement/Retention Structure Information Relapse Prevention Family Involvement Self Help Involvement Urinalysis/Breath Testing
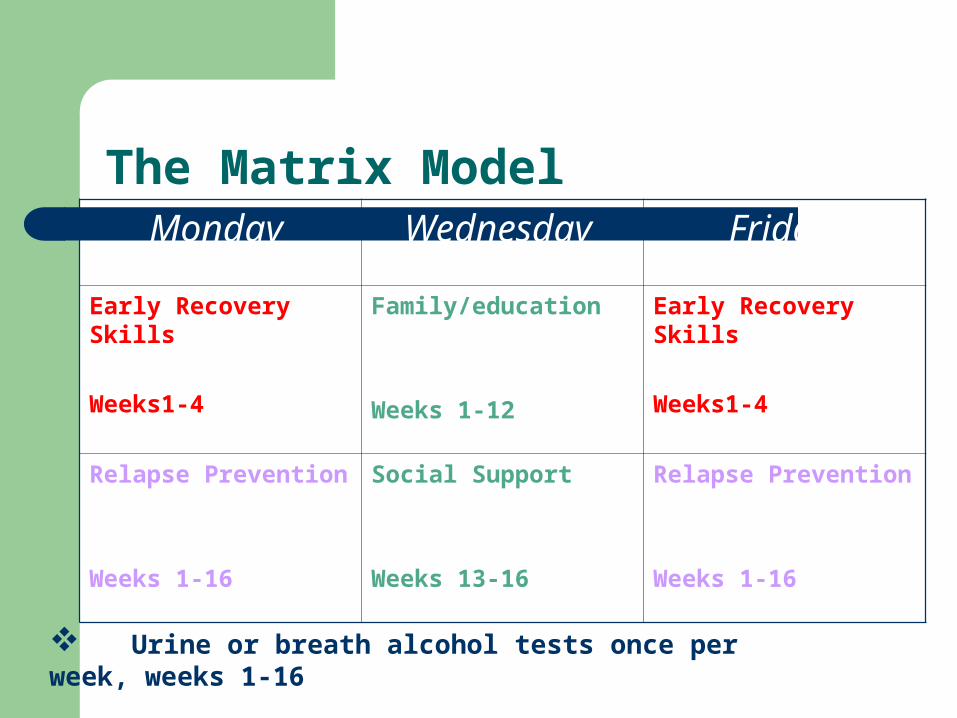
The Matrix ModelMonday Wednesday Friday
Early Recovery Skills
Weeks1-4
Family/education
Weeks 1-12
Early Recovery Skills
Weeks1-4
Relapse Prevention
Weeks 1-16
Social Support
Weeks 13-16
Relapse Prevention
Weeks 1-16
Urine or breath alcohol tests once per week, weeks 1-16
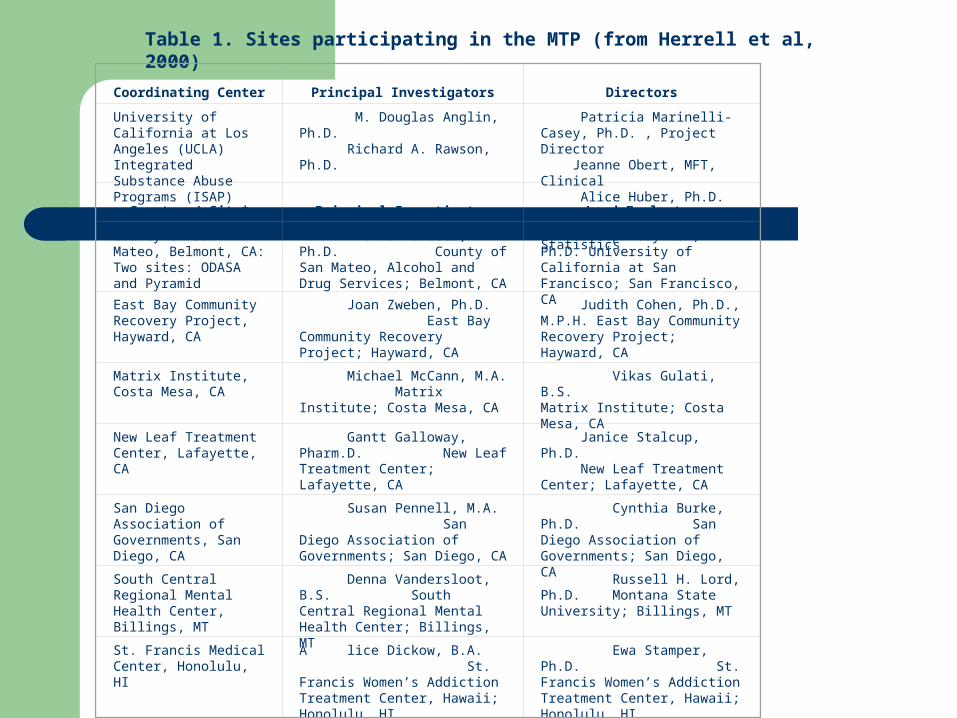
Table 1. Sites participating in the MTP (from Herrell et al, 2000)
Coordinating Center Principal Investigators
Directors
University of California at Los Angeles (UCLA) Integrated Substance Abuse Programs (ISAP)
M. Douglas Anglin, Ph.D. Richard A. Rawson, Ph.D.
Patricia Marinelli-Casey, Ph.D. , Project Director Jeanne Obert, MFT, Clinical Alice Huber, Ph.D. Research Chris Reiber, Ph.D. Statistics
Grantee / Site* Principal Investigator Lead Evaluator
County of San Mateo, Belmont, CA:Two sites: ODASA and Pyramid
Yvonne Frazier, Ph.D. County of San Mateo, Alcohol and Drug Services; Belmont, CA
Joseph Guydish, Ph.D. University of California at San Francisco; San Francisco, CA
East Bay Community Recovery Project, Hayward, CA
Joan Zweben, Ph.D. East Bay Community Recovery Project; Hayward, CA
Judith Cohen, Ph.D., M.P.H. East Bay Community Recovery Project; Hayward, CA
Matrix Institute, Costa Mesa, CA
Michael McCann, M.A. Matrix Institute; Costa Mesa, CA
Vikas Gulati, B.S. Matrix Institute; Costa Mesa, CA
New Leaf Treatment Center, Lafayette, CA
Gantt Galloway, Pharm.D. New Leaf Treatment Center; Lafayette, CA
Janice Stalcup, Ph.D. New Leaf Treatment Center; Lafayette, CA
San Diego Association of Governments, San Diego, CA
Susan Pennell, M.A. San Diego Association of Governments; San Diego, CA
Cynthia Burke, Ph.D. San Diego Association of Governments; San Diego, CA
South Central Regional Mental Health Center, Billings, MT
Denna Vandersloot, B.S. South Central Regional Mental Health Center; Billings, MT
Russell H. Lord, Ph.D. Montana State University; Billings, MT
St. Francis Medical Center, Honolulu, HI
A lice Dickow, B.A. St. Francis Women’s Addiction Treatment Center, Hawaii; Honolulu, HI
Ewa Stamper, Ph.D. St. Francis Women’s Addiction Treatment Center, Hawaii; Honolulu, HI

Site Duration of Treatment Intensive
Phase
Individual Sessions
Group Sessions12-Step Program
Involvement
Site 1
8 wks 1x/wk x 4-8 wks, 30-50 min each
4x/wk x 4-8 wks, 3hr each, families
attend 1x/wk
required; 1x/wk x 4-8 wks
Site 2
12 wks 1x/wk x 12 wks, 1 hr each
5x/wk x 2wk,3x/wk x 2wks, 2x/wk x 8 wks
recommended
Site 3
12 wks 1x/wk x 12 wks, 1 hr each
none recommended
Site 4
16 wks 1x/wk x 16 wks, 10-15 min each
3x/wk x 16 wks, 1 hr each
required; 3x/wk x 16 wks
Site 5
12 wks 1x/wk x 12 wks, 30-60 min each
3x/wk x 12 wks, 90 min each and
2x/wk x 12 wks, 60-90 min each
required; 1x/wk x 12 wks
Site 6
12 wks 1x/wk – 2x/mo x 12 wks, 1 hr each
2x/wk x 12 wks, 90 min each,
families attend 1x/2 wks
recommended
Site 7
16 wks 1x/wk x 16 wks, 1 hr each
2x/wk x 16 wks, 2 hrs each
recommended
Site 8
12 wks 2x/wk x 12 wks,1 hr each
1x/wk x 12 wks, 2 hrs each
required; 6 meetings
Table 2. Treatment-As-Usual: Elements of Treatment
Site
TAU (n)
Matrix 16-week (n)
Total
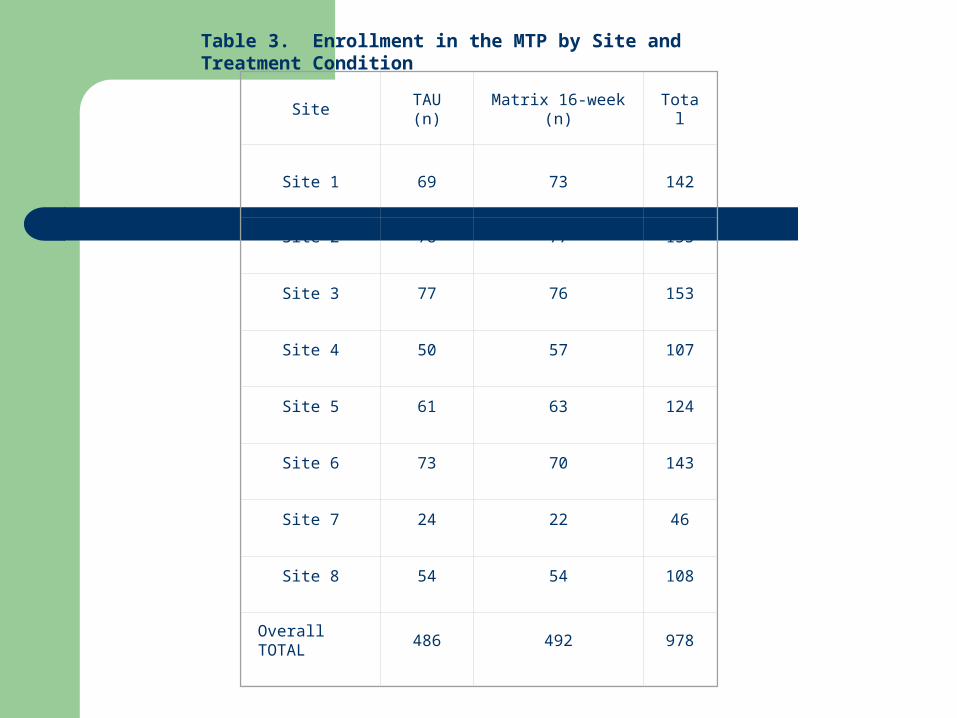
Site 1
69
73
142
Site 2 78 77 155
Site 3 77 76 153
Site 4 50 57 107
Site 5 61 63 124
Site 6 73 70 143
Site 7 24 22 46
Site 8 54 54 108
Overall TOTAL
486 492 978
Table 3. Enrollment in the MTP by Site and Treatment Condition

Characteristic Summary
% Male 45
Age (Yrs.), mean (sd) 32.8 (8.0)
Ethnicity (%)
Caucasian 60
African-American 2
American Indian 3
Asian/Pacific Islander 17
Hispanic 18
Educational Attainment Level (yrs.), mean (sd) 12.2 (1.7)
% Employed 69
% Married (and not separated) 16
Overall Substance Use Patterns-Lifetime (yrs.), mean (sd)
Methamphetamine 7.54 (6)
Alcohol 7.6 (8.5)
Cocaine 1.75 (3.5)
Cannabis 7.15 (8)
Overall Substance Use Patterns—Days in Past 30, mean (sd)
Methamphetamine 11.53 (9.6)
Alcohol 4.72 (7.3)
Cocaine 0.21 (1)
Cannabis 4.38 (8.3)
Preferred Route of Administration of MA (%)
Oral 0
Nasal 11
Smoked 65
IV- injection 24
Table 4. MTP Participant Characteristics (taken from baseline ASI)
Sample Description

Baseline Demographics
Participants Served (n) 1016
Age (mean) 32.8 years
Education (mean) 12.2 years
Methamphetamine Use (mean)
7.5 years
Marijuana Use (mean) 7.2 years
Alcohol Use (mean) 7.6 years
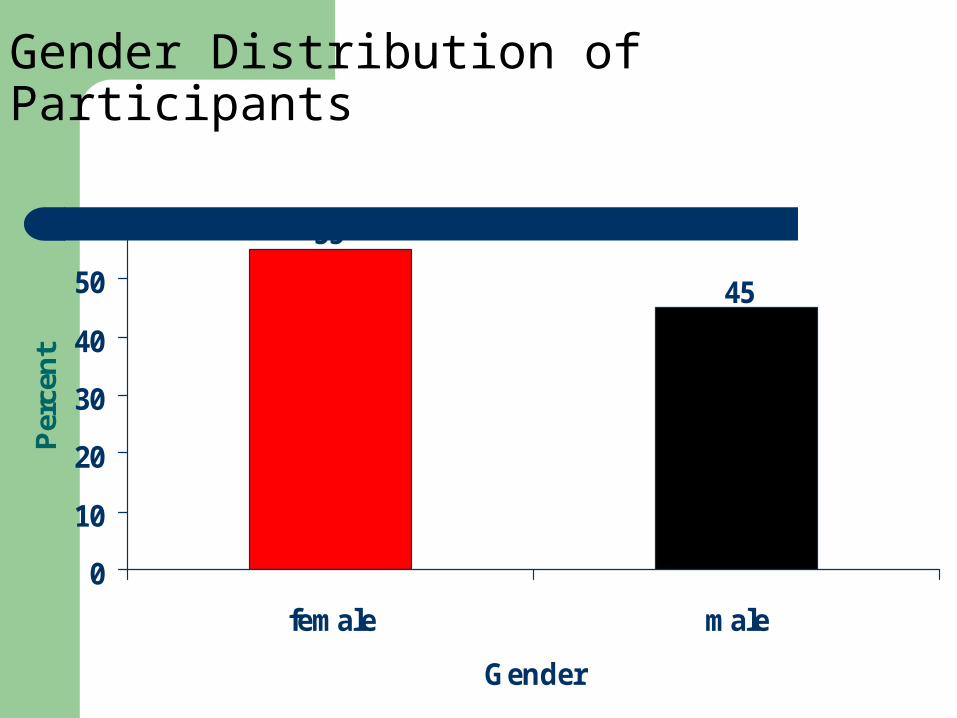
Gender Distribution of Participants
45
55
0
10
20
30
40
50
60
female male
Gender
Per
cen
t
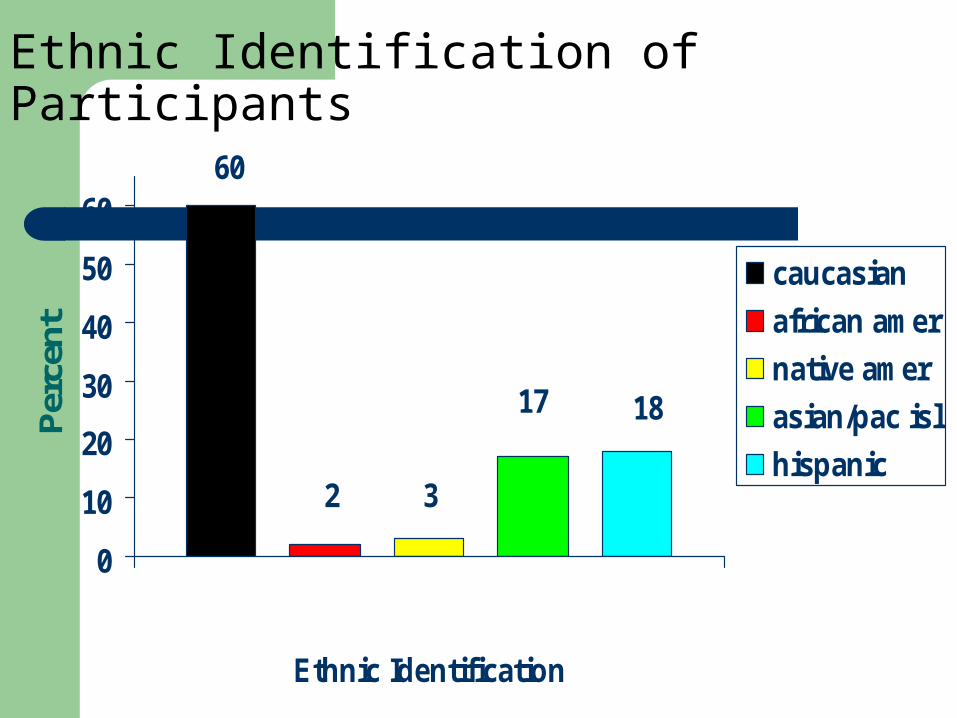
Ethnic Identification of Participants60
2 3
17 18
0
10
20
30
40
50
60
Ethnic Identification
Per
cent
caucasian
african amer
native amer
asian/pac isl
hispanic
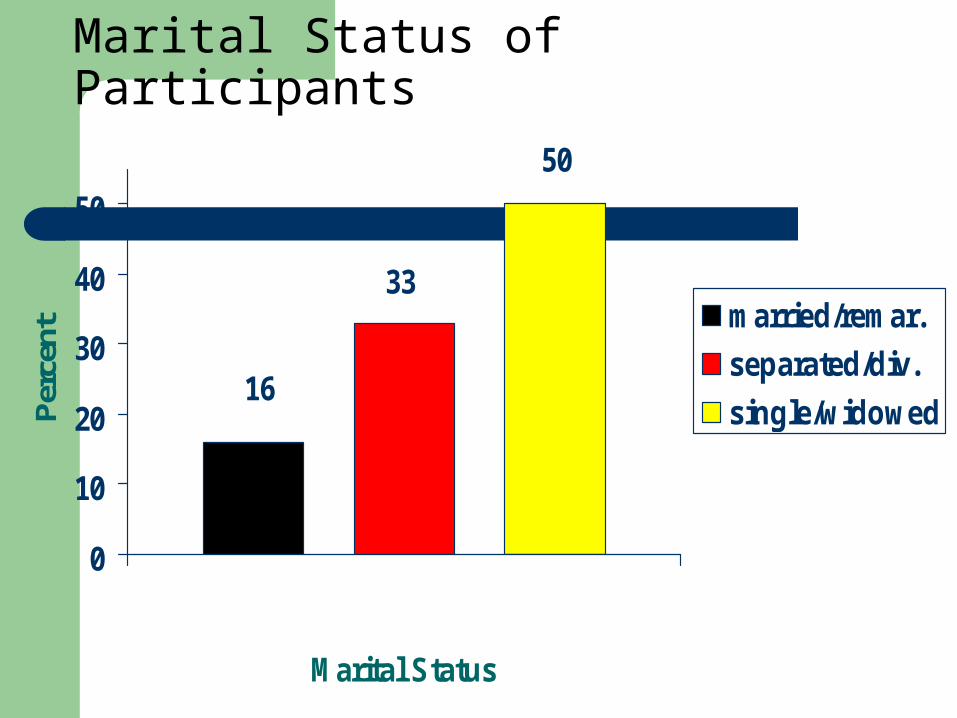
Marital Status of Participants
16
33
50
0
10
20
30
40
50
Marital Status
Per
cent
married/remar.
separated/div.
single/widowed
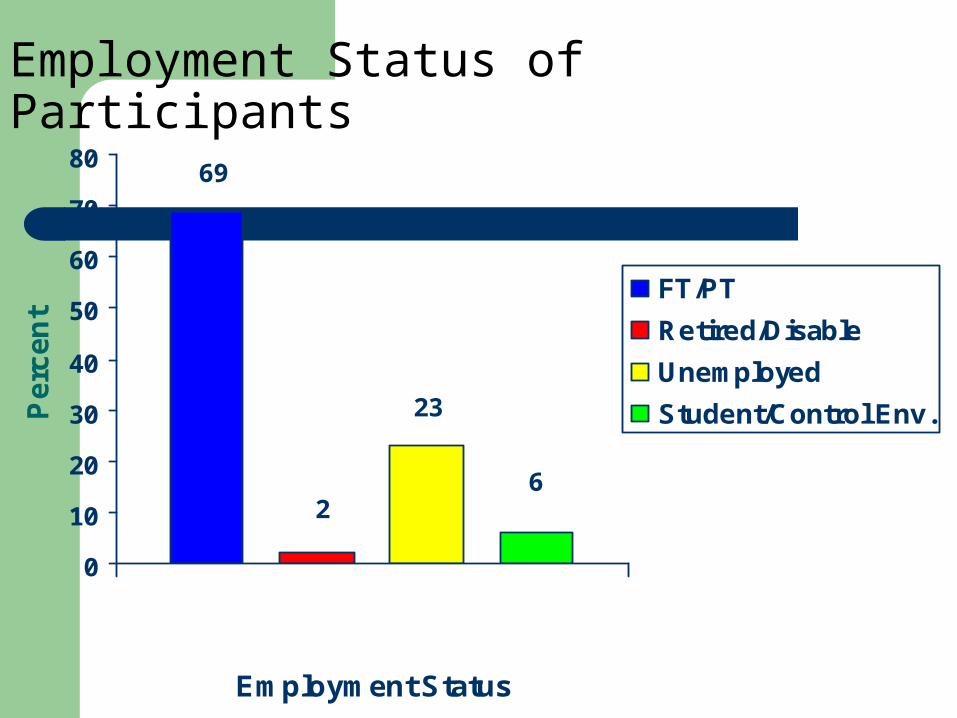
Employment Status of Participants69
2
23
6
0
10
20
30
40
50
60
70
80
Employment Status
Pe
rce
nt
FT/PT
Retired/Disable
Unemployed
Student/Control Env.
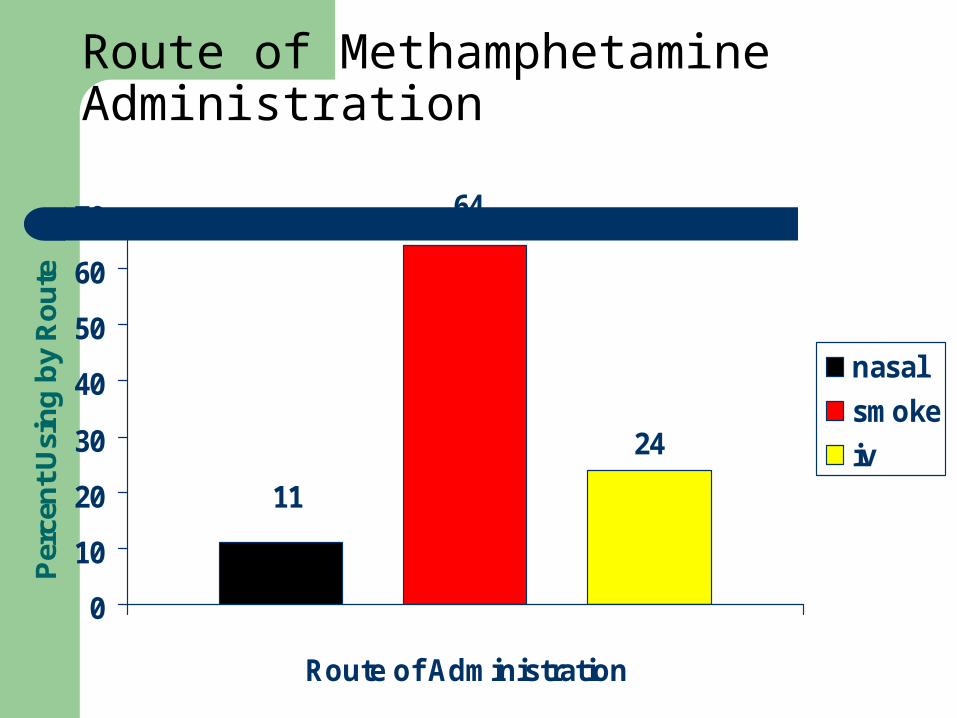
Route of Methamphetamine Administration
24
11
64
0
10
20
30
40
50
60
70
Route of Administration
Per
cen
t U
sin
g b
y R
ou
te
nasal
smoke
iv

Changes from Baseline to Treatment-end

Days Paid for Work in Past 30
10.4
8.2
0
2
4
6
8
10
12
BL Tx end
Mea
n D
ays
Pai
d
Possible is 0-30; tpaired=6.01; p-value<0.000 (highly sig.)

Total Income (Past 30 days)of Participants
1211
1096
1000
1200
1400
BL Tx end
Mea
n To
tal I
ncom
e ($
)
tpaired=2.34; p-value=0.02 (sig.)

0.53
0.230.260.24
0.21
0.11
0.21 0.220.19
0.10
0.15
0.08
0.49
0.21
0.0
0.1
0.2
0.3
0.4
0.5
0.6
Me
an
Co
mp
os
ite
Sc
ore
BL
Tx end
ASI Composite Scores
Possible is 0-1;
Higher : worse problemtpaired: *p-value<0.03 (sig.),
**p-value<0.000 (highly sig.)
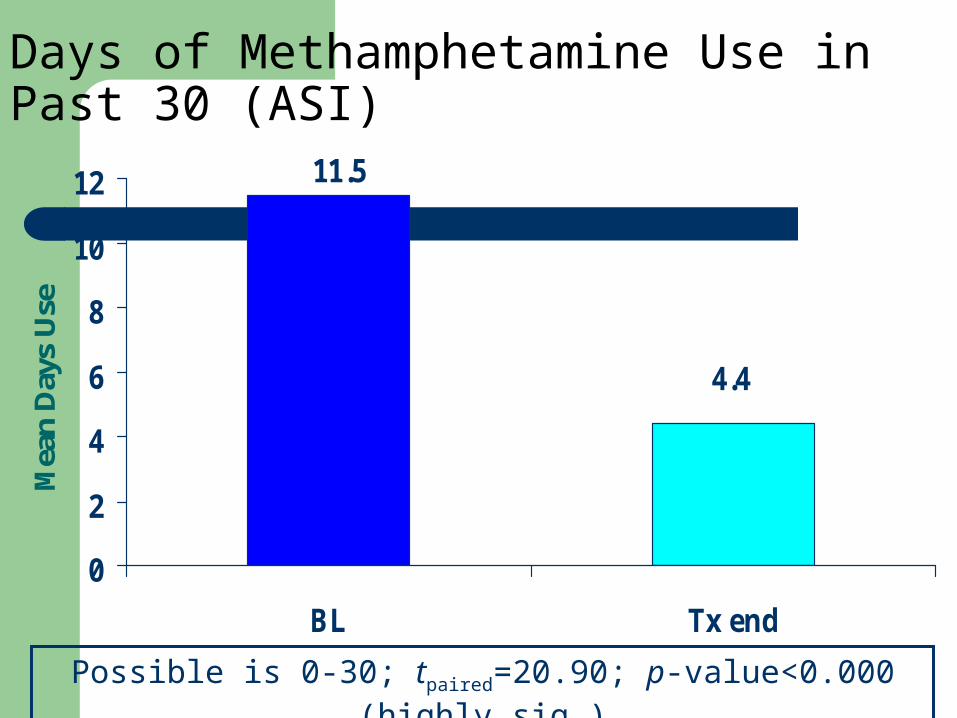
Days of Methamphetamine Use in Past 30 (ASI)
4.4
11.5
0
2
4
6
8
10
12
BL Tx end
Mea
n D
ays
Use
Possible is 0-30; tpaired=20.90; p-value<0.000 (highly sig.)

Days of Marijuana Use in Past 30 (ASI)
2.4
4.5
0
2
4
6
8
10
12
BL Tx end
Mea
n D
ays
Use
Possible is 0-30; tpaired=8.02; p-value<0.000 (highly sig.)
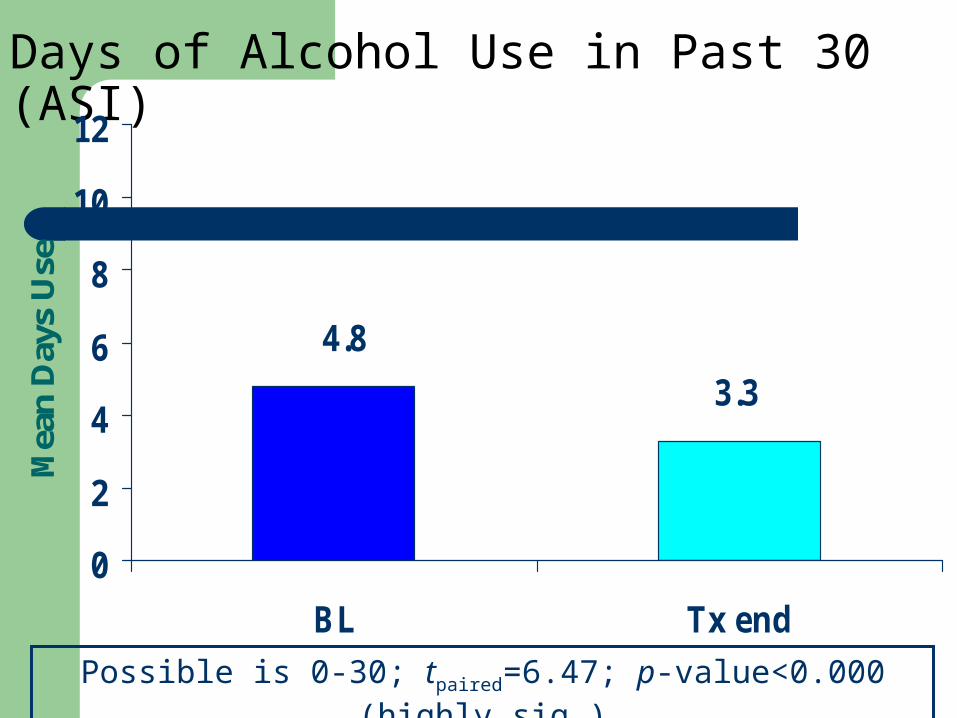
Days of Alcohol Use in Past 30 (ASI)
3.3
4.8
0
2
4
6
8
10
12
BL Tx end
Mea
n D
ays
Use
Possible is 0-30; tpaired=6.47; p-value<0.000 (highly sig.)
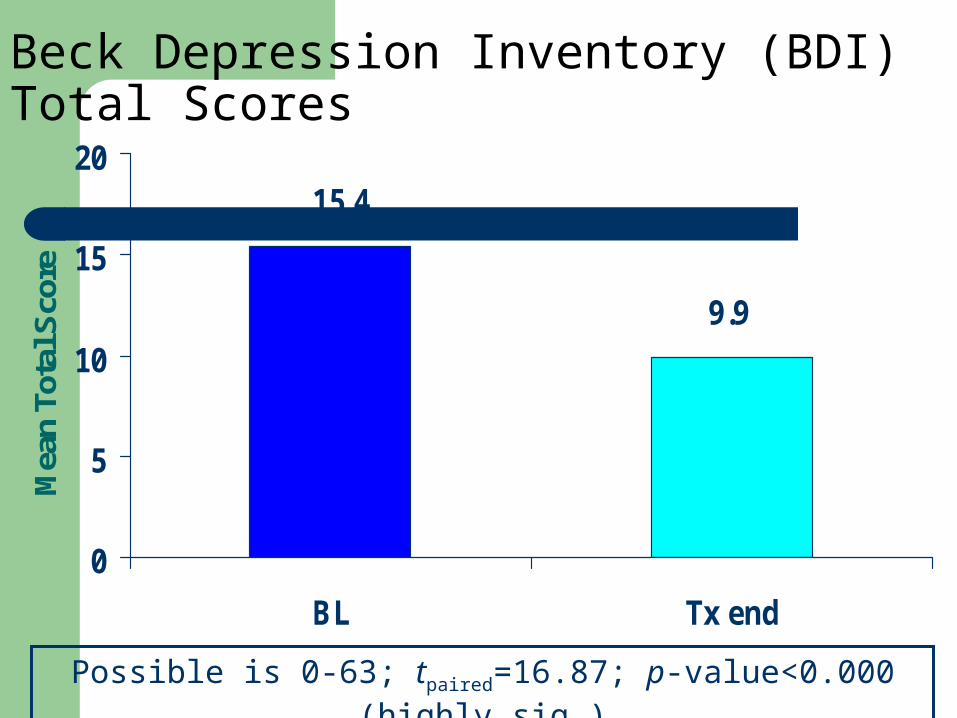
Beck Depression Inventory (BDI) Total Scores
9.9
15.4
0
5
10
15
20
BL Tx end
Mea
n To
tal S
core
Possible is 0-63; tpaired=16.87; p-value<0.000 (highly sig.)

BSI Scores (mean)
BL1 Tx-endPaired t
*
Somatization 0.7 0.5 7.67
Obsessive-Compulsive 1.2 0.9 11.40
Interpersonal Sensitivity 1.0 0.7 11.40
Depression 1.2 0.8 11.98
Anxiety 0.9 0.6 11.24
Hostility 0.8 0.6 9.39
Phobic Anxiety 0.6 0.4 8.47
Paranoid Ideation 1.1 0.7 11.49
Psychoticism 0.9 0.6 10.70
1Possible, all scores, is 0-4; *all p-values<0.000 (highly sig.)

Positive Symptom Total (PST) from Brief Symptom Inventory (BSI)
18
26
0
10
20
30
BL Tx end
Mea
n #
sym
ptom
s
Possible is 0-53; tpaired=14.33; p-value<0.000 (highly sig.)
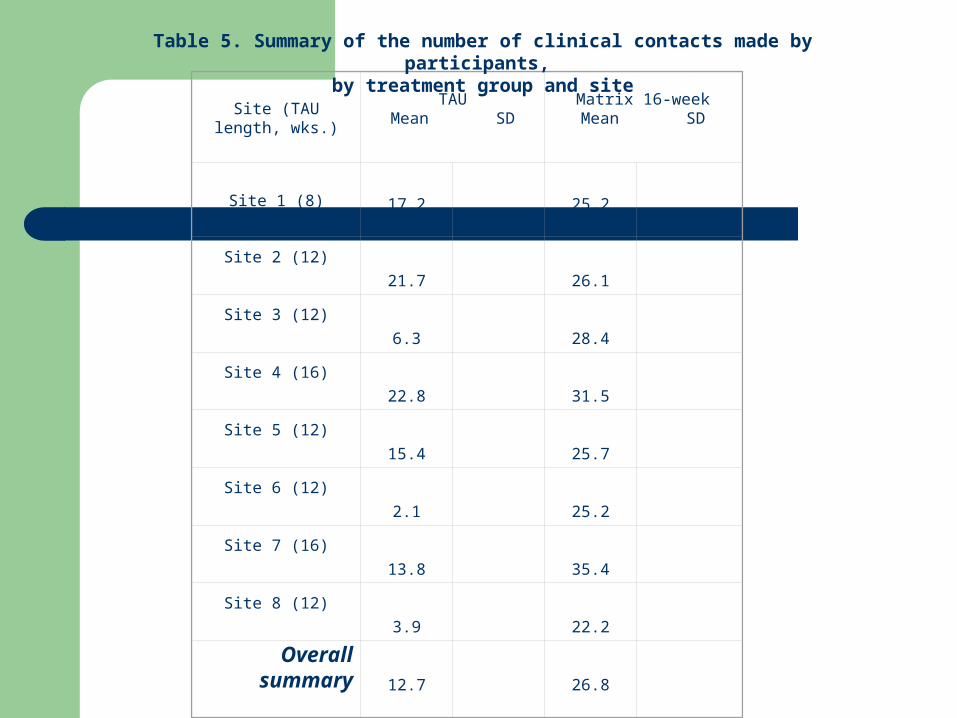
Site (TAU length,
wks.)
TAUMean SD
Matrix 16-weekMean SD
Site 1 (8) 17.2 25.2
Site 2 (12)
21.7 26.1
Site 3 (12)
6.3 28.4
Site 4 (16)
22.8 31.5
Site 5 (12)
15.4 25.7
Site 6 (12)
2.1 25.2
Site 7 (16)
13.8 35.4
Site 8 (12)
3.9 22.2
Overall summary 12.7 26.8
Table 5. Summary of the number of clinical contacts made by participants, by treatment group and site

Figure 3. Participant retention throughout treatment, by site and treatment group

Site
TAU length (wks.)
Log-rank
Chi-square
p
Site 1
8
-20.07
33.17
<0.0001
Site 2 12 -9.49 4.98 0.026
Site 3 12 -8.39 3.68 0.055
Site 4 16 1.64 0.26 0.610
Site 5 12 -22.30 28.74 <0.0001
Site 6 12 -17.46 17.87 <0.0001
Site 7 16 -5.01 3.34 0.067
Site 8 12 -10.59 7.99 0.005
Table 7. Comparison of retention between groups within sites, with Matrix truncated to the length of TAU at each site

65.8459.15Not Completer
34.1640.85Completer
TAUMatrix 16
x2=4.68, p=0.031
Figure 4. Percent completing treatment, by group

3.75 4.29
8.04
3.38 3.29
7.28
0
2
4
6
8
10
8-wk 12-wk 16-wk
Tx-Length Group
mea
n nu
mbe
r of M
A-fre
e ur
ines
Matrix16
TAU
Figure 5. Mean number of MA-free urine samples, by treatment length and treatment group (Matrix group data truncated to the length of TAU)

Site (TAU length, wks.)
Raw Data Truncated Data
Matrix16 TAU Matrix16 TAU
t pmean SD mean SD mean SD mean SD
Site 1 (8)
6.23 3.383.75 3.38
-0.76 0.45
Site 2 (12)
6.25 4.194.86 4.19
-0.94 0.35
Site 3 (12)
5.75 3.624.61 3.62
-1.52 0.13
Site 4 (16)
8.44 8.68.44 8.6
0.13 0.89
Site 5 (12)
5.19 1.724.30 1.72
-3.70 0.0003
Site 6 (12)
4.24 3.273.3 3.27
-0.04 0.97
Site 7 (16)
7.0 4.547.0 4.54
-1.50 0.14
Site 8 (12)
5.39 3.304.28 3.30
-1.23 0.22
Table 8. Summary of the number of MA-free urine samples provided by participants, by treatment group and site

Site (TAU length, wks.)
Raw Data Truncated Data
Matrix16 TAU Matrix16 TAU
t pmean SD mean SD mean SD mean SD
Site 1 (8)3.575 2.754 2.877 2.754
-0.982 0.328
Site 2 (12)3.753 2.474 3.377 2.474 -1.47 0.144
Site 3 (12)3.197 1.805 3.013 1.805 -2.16 0.033
Site 4 (16)6.140 5.560 6.140 5.560
-0.546 0.586
Site 5 (12)3.889 1.279 3.429 1.279
-3.393 0.001
Site 6 (12)2.429 2.342 2.314 2.342 0.2 0.841
Site 7 (16) 4.682 2.542 4.682 2.542
-1.586 0.121
Site 8 (12) 2.833 2.130 2.519 2.130
-0.551 0.583
Table 9. Longest MA abstinent period by treatment group and site
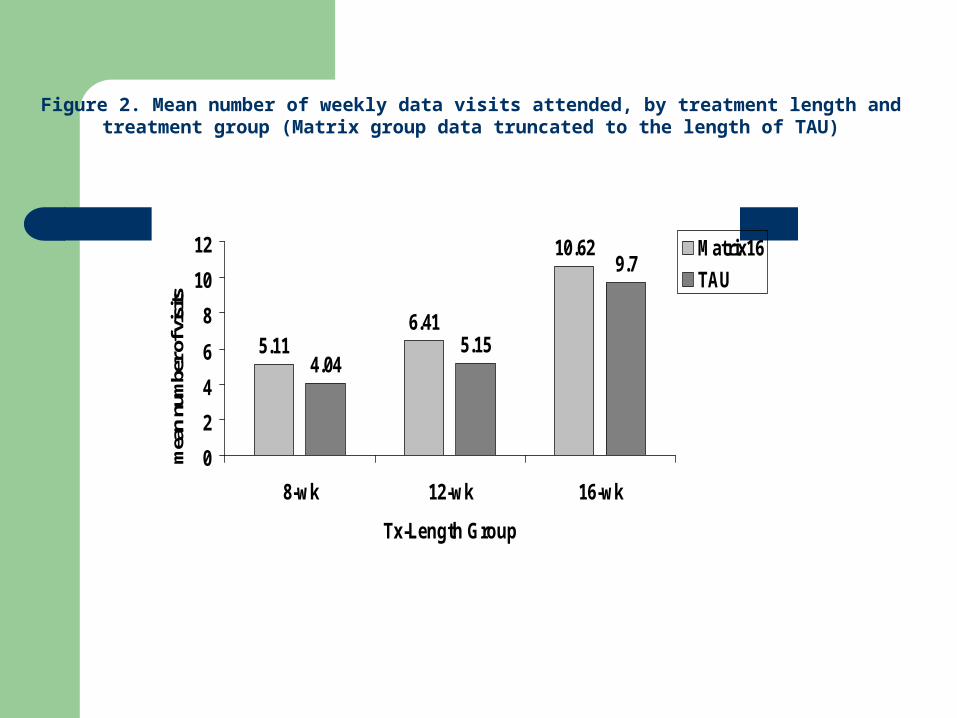
5.116.41
10.62
4.045.15
9.7
0
2
4
6
8
10
12
8-wk 12-wk 16-wk
Tx-Length Group
mea
n nu
mbe
r of v
isits
Matrix16
TAU
Figure 2. Mean number of weekly data visits attended, by treatment length and treatment group (Matrix group data truncated to the length of TAU)
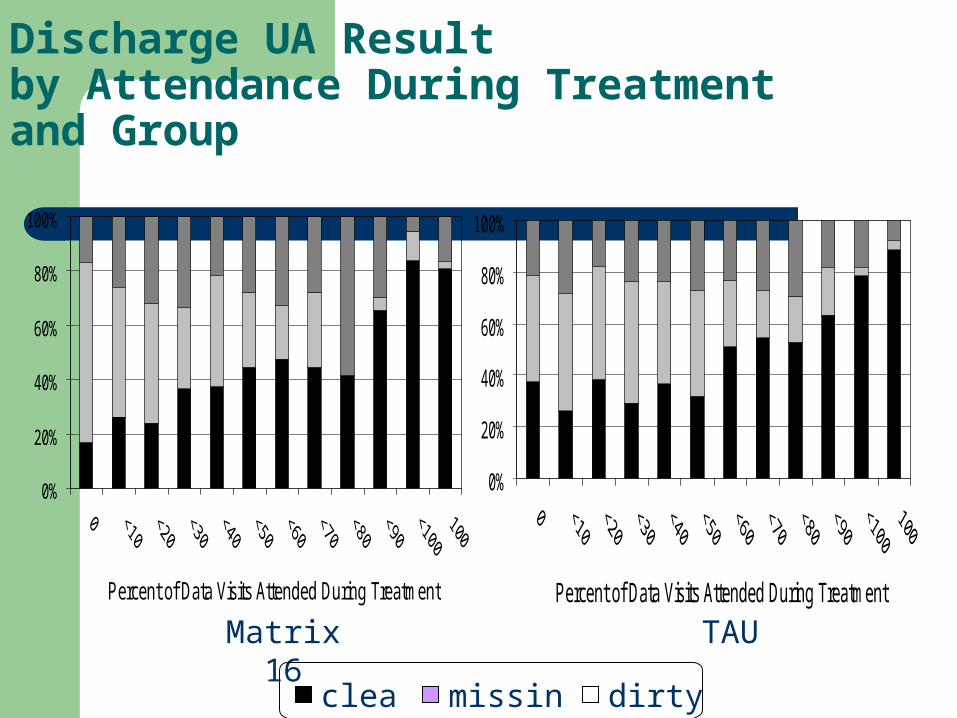
Discharge UA Resultby Attendance During Treatmentand Group
0%
20%
40%
60%
80%
100%
Percent of Data Visits Attended During Treatment
0%
20%
40%
60%
80%
100%
Percent of Data Visits Attended During Treatment
Matrix 16 TAU
clean missing dirty

4 9 2 4 8 6
4 0 1 3 9 74 2 1 4 2 0
M a tr ix 1 6 -w k . T A U
nu
mb
er
of
pa
rtic
ipa
nts
B a s e l in eD is c h a rg e6 -m o n th F U
Figure 1. Overall participant follow-up by treatment condition and time point
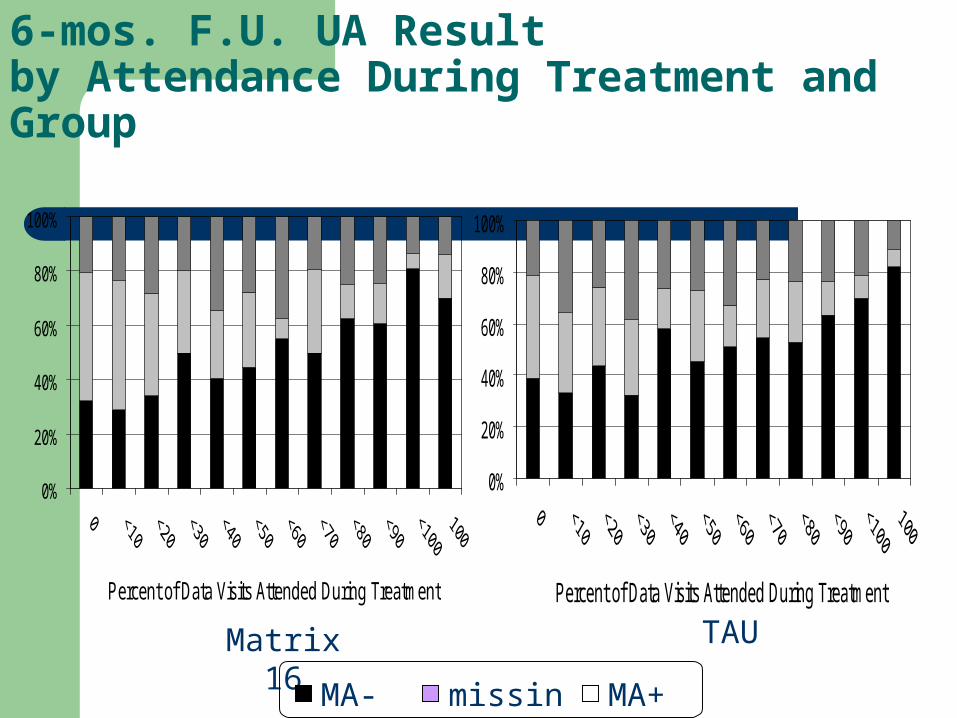
6-mos. F.U. UA Resultby Attendance During Treatment and Group
0%
20%
40%
60%
80%
100%
Percent of Data Visits Attended During Treatment
0%
20%
40%
60%
80%
100%
Percent of Data Visits Attended During Treatment
Matrix 16 TAU
MA- missing MA+

68%66%6 Month Follow-up
66%69%Discharge
TAUMatrix 16
x2=4.68, p=0.031
Figure 5. Urinalysis Results: %Meth Negative

11.3 11.8
4 .3 4 .44 .4 4 .0
0
2
4
6
8
10
12
M atrix 16-w k. TAUmea
n n
um
ber
of
day
s o
f M
A u
se
Baseline
Discharge
6-m onth FU
Figure 6. Participant self-report of MA use (number of days during the past 30) at enrollment, discharge, and 6-month follow-up, by treatment condition
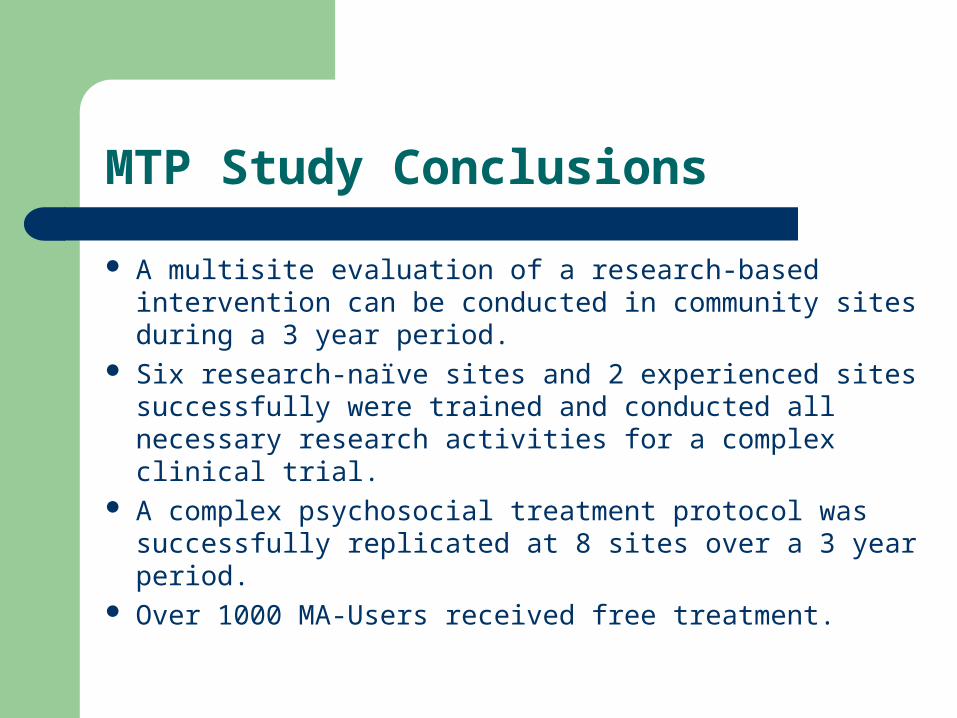
MTP Study Conclusions
A multisite evaluation of a research-based intervention can be conducted in community sites during a 3 year period.
Six research-naïve sites and 2 experienced sites successfully were trained and conducted all necessary research activities for a complex clinical trial.
A complex psychosocial treatment protocol was successfully replicated at 8 sites over a 3 year period.
Over 1000 MA-Users received free treatment.

MTP Study Conclusions
Treatment for MA dependence associated with improvements in many domains including drug use, mj use, mood, Income
Matrix treatment results in longer retention, more sessions attended, more treatment completers, more MA-negative Uas, longer periods of MA abstinence
* Except for drug court site

MTP Study Conclusions
Outcomes at discharge and follow-up demonstrated comparable results between Matrix and TAU
Program compliance associated with superior urinalysis results at discharge and follow-up
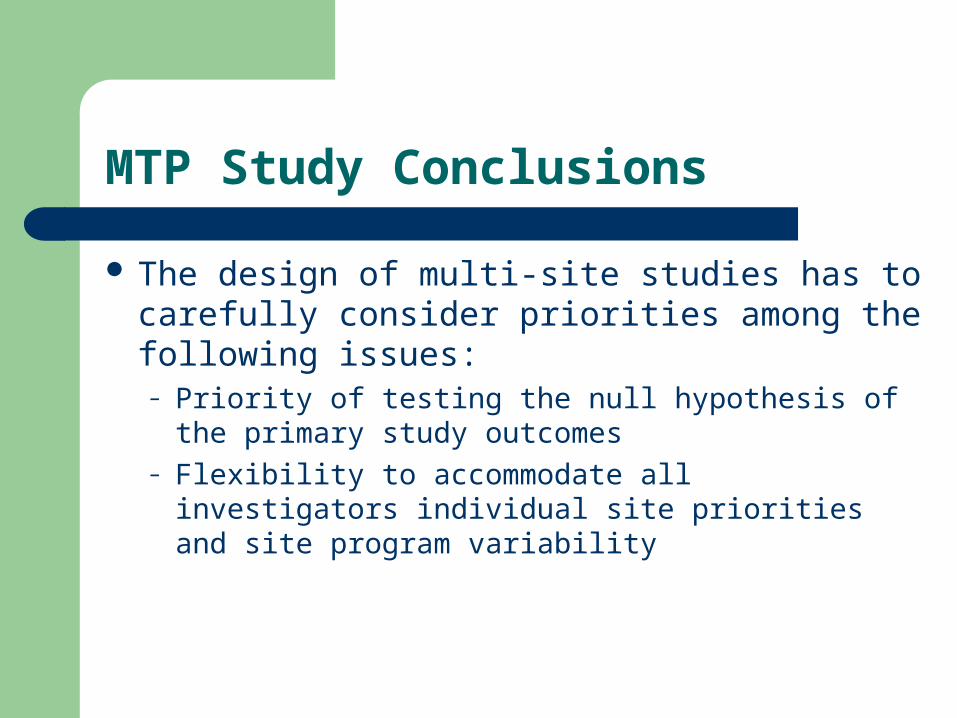
MTP Study Conclusions
The design of multi-site studies has to carefully consider priorities among the following issues:– Priority of testing the null hypothesis of the primary
study outcomes– Flexibility to accommodate all investigators
individual site priorities and site program variability


