

RIIO-ED1 RIGs Environment and Innovation Commentary, version 3.0
2016/17
UK Power Networks

Contents
Summary – Information Required 1
Worksheet by worksheet commentary 1
E1 – Visual Amenity 2
E2 – Environmental Reporting 2
E3 –BCF 5
E4 – Losses Snapshot 15
E5 – Smart Metering 15
E6 – Innovative Solutions 27
E7 – LCTs 80

Environment and Innovation Commentary 1
Summary – Information Required One Commentary document is required per DNO Group. Respondents should
ensure that comments are clearly marked to show whether they relate to all the
DNOs in the group or to which DNO they relate.
Commentary is required in response to specific questions included in this
document. DNO’s may include supporting documentation where they consider it
necessary to support their comments or where it may aid Ofgem’s understanding.
Please highlight in this document if additional information is provided.
The purpose of this commentary is to provide the opportunity for DNOs to set out
further supporting information related to the data provided in the Environment
and Innovation Reporting Pack. It also sets out supporting data submissions that
DNOs must provide to us.
Worksheet by worksheet commentary
At a worksheet by worksheet level there is one standard question to address,
where appropriate, as follows:
Allocation and estimation methodologies: DNOs should detail
estimates, allocations or apportionments used in reaching the numbers
submitted in the worksheets.
This is required for all individual worksheets (ie not an aggregate level),
where relevant. Not all tables will have used allocation or estimation
methods to reach the numbers. Where this is the case simply note “NA”.
Note: this concerns the methodology and assumptions and not about the
systems in place to check their accuracy (that is for the NetDAR). This
need to be completed for all worksheets, where an allocation or estimation
technique was used.
In addition to the standard commentary questions, some questions specific to
each worksheet are asked.

Environment and Innovation Commentary 2
E1 – Visual Amenity
Allocation and estimation methodologies: detail any estimations, allocations
or apportionments to calculate the numbers submitted.
Direct costs: For the allocation and estimation methodologies for direct costs
please refer to this section for C3 – Physical Security (to avoid repetition across
all the direct cost tables)
Explanation of the increase or decrease in the total length of OHL inside
designated areas for reasons other than those recorded in worksheet E1. For
example, due to the expansion of an existing, or creation of a new, Designated
Area.
The only change in the total length of OHL inside designated areas is as a result
of the reasons recorded in the E1 table.
Here is a summary of the E1 table for 2016/17:
E2 – Environmental Reporting
Allocation and estimation methodologies: detail any estimations, allocations
or apportionments to calculate the numbers submitted.
Direct costs: For the allocation and estimation methodologies for direct costs
please refer to this section for C3 – Physical Security (to avoid repetition across
all the direct cost tables)
DNOs must provide some analysis of any emerging trends in the environmental
data and any areas of trade-off in performance.
n/a
Where reported in the Regulatory Year under report, DNOs must provide
discussion of the nature of any complaints relating to Noise Pollution and the
nature of associated measures undertaken to resolve them.
UK Power Networks received 26 Enquiries/Complaints about noise during the
regulatory period. The majority relate to low frequency noise associated with
transformers and substations as in previous years.
We continue to use the Salford University Low Frequency Noise Rating
2016/17 LV HV 33/66kV LV HV 33/66kV
Kent Downs AONB 0.01 1.35 1.83 - - 1.86
Dedham Vale AONB 0.93 0.54 1.18 0.61
OHL removed UG cable installed
Environment and Innovation Commentary 3
Methodology, which gives an accurate reflection of whether the noise is likely to
cause a statutory nuisance. We are trying to engage proactively with local
authorities to highlight the issue of low frequency noise and ensure that it is
considered when giving planning consent.
UK Power Networks is in the process of designing and fitting acoustic screens to
Noak Hill primary substation and Moscow Road main substation; the latter is a
new style screen that works by matching the peaks and troughs of the wave
length to cancel the noise. This screen is being employed due to the high
temperatures that would be created by the use of a conventional screen.
Where reported in the Regulatory Year under report, DNOs must provide details
of any Non-Undergrounding Visual Amenity Schemes undertaken.
N/A
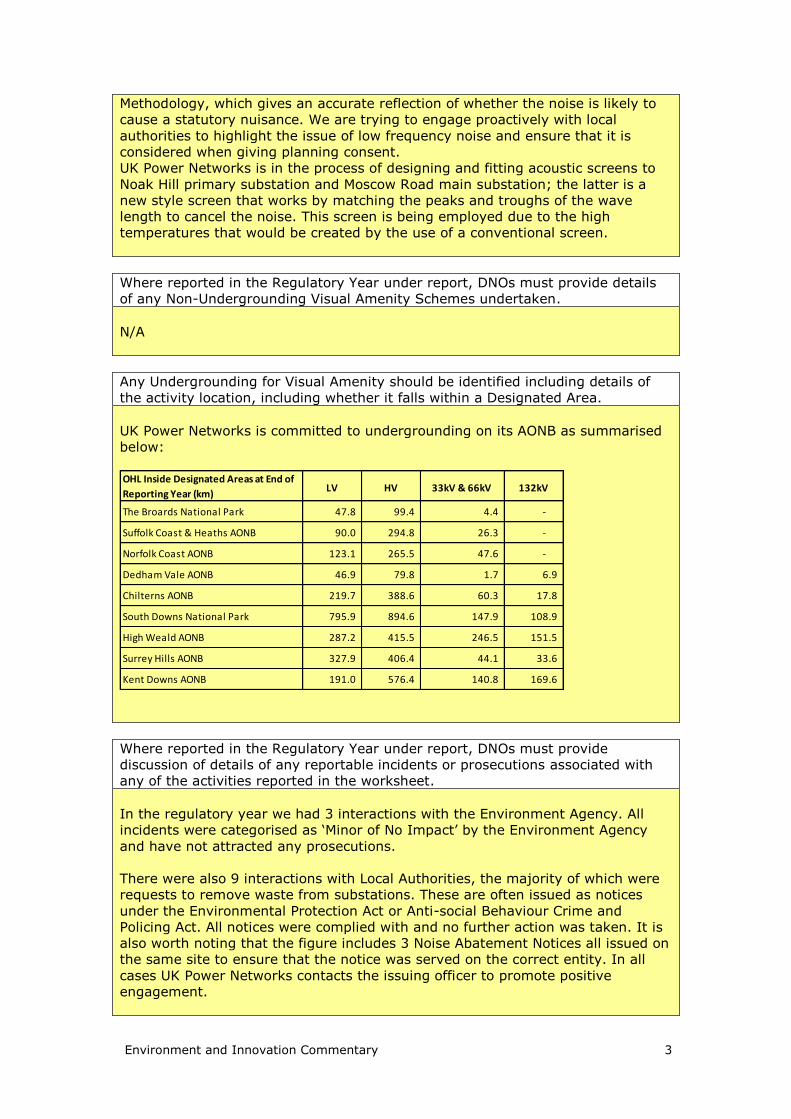
Any Undergrounding for Visual Amenity should be identified including details of
the activity location, including whether it falls within a Designated Area.
UK Power Networks is committed to undergrounding on its AONB as summarised
below:
Where reported in the Regulatory Year under report, DNOs must provide
discussion of details of any reportable incidents or prosecutions associated with
any of the activities reported in the worksheet.
In the regulatory year we had 3 interactions with the Environment Agency. All
incidents were categorised as ‘Minor of No Impact’ by the Environment Agency
and have not attracted any prosecutions.
There were also 9 interactions with Local Authorities, the majority of which were
requests to remove waste from substations. These are often issued as notices
under the Environmental Protection Act or Anti-social Behaviour Crime and
Policing Act. All notices were complied with and no further action was taken. It is
also worth noting that the figure includes 3 Noise Abatement Notices all issued on
the same site to ensure that the notice was served on the correct entity. In all
cases UK Power Networks contacts the issuing officer to promote positive
engagement.
OHL Inside Designated Areas at End of
Reporting Year (km) LV HV 33kV & 66kV 132kV
The Broards National Park 47.8 99.4 4.4 -
Suffolk Coast & Heaths AONB 90.0 294.8 26.3 -
Norfolk Coast AONB 123.1 265.5 47.6 -
Dedham Vale AONB 46.9 79.8 1.7 6.9
Chilterns AONB 219.7 388.6 60.3 17.8
South Downs National Park 795.9 894.6 147.9 108.9
High Weald AONB 287.2 415.5 246.5 151.5
Surrey Hills AONB 327.9 406.4 44.1 33.6
Kent Downs AONB 191.0 576.4 140.8 169.6

Environment and Innovation Commentary 4
Where reported in the Regulatory Year under report, DNOs must provide
discussion of details of any Environmental Management System (EMS) certified
under ISO or other recognised accreditation scheme.
UK Power Networks has maintained its ISO 14001 Accreditation through the
regulatory period.
DNOs must provide a brief description of any permitting, licencing, registrations
and permissions, etc related to the activities reported in this worksheet that you
have purchased or obtained during the Regulatory Year.
UK Power Networks continues to operate the 7 SR2012 No.15 Standards Rules
Permits for the storage of waste insulating oil. No additional permits have been
applied for at this time.
A variation of our Falconwood permitted facility was submitted to the
Environment Agency to allow the storage of acidic oil on site. This variation has
been granted ref no. EPR/PP3690VN/V002
DNOs must include a description of any SF6 and Oil Pollution Mitigation Schemes
undertaken in the Regulatory Year including the cost and benefit implications and
how these were assessed.
Retro Bunding to 2 Transformer Bays was completed at Houghton Regis in
2016/17, which had been identified as a medium pollution risk due to proximity
to surface and ground water systems. The bunds were designed to accommodate
the full transformer oil volume in order to contain it in the event of a catastrophic
failure and will also prevent the contamination of the ground within the site
boundary and beyond.
Previously contaminated earth was also removed from a site in Chertsey.
Noise protection measures were installed at Hatchard Road to reduce noise
pollution from transformers to local residents.
Circuit Breaker 405 at Kemsley Grid is a 132kV AIS type Brush DB145 circuit
breaker, situated outdoor. It is a feeder breaker that feeds Grovehurst Grid
132kV substation.
This circuit breaker was a known leaker, with total SF6 topped-up of 5kg in 2016,
making it the most significant SF6 leaking asset in SPN.
The most cost-effective solution was deemed to be replacement of the circuit
breaker stacks on all three phases. This intervention was completed on
13/10/2016 and resolved the issue with SF6 leakage on this breaker as we have
had no reported leaks on this asset since the intervention.
In 2016/17 we carried out the following refurbishments of transformers to
reduce/stop significant oil leaks.
EPN
Old Welwyn Primary (2 x 33/11kV Tx)
Ilmer Primary (2 x 33/11kV Tx)
LPN
Wimbledon Grid C (1 x 132/33k Tx)
Bromley Grid (1 x 132/33kV Tx)

Environment and Innovation Commentary 5
SPN
Canterbury South Grid (1 x 132/33kV Tx, 2 x 33kV reactors also refurbished but
not specifically to address oil leaks)
Purley Grid (2 x 132/33kV Tx)
Bolney Grid (1 x 132/33kV Tx)
Three Bridges Grid (1 x 132/33kV Tx)
Crawley Industrial East Primary (2 x 33/11kV TX)
Woking Primary (1 x 33/11kV Tx)
The transformer refurbishment at Wimbledon Grid C included the use of a Belzona
compound to seal around the leaking gaskets without having to remove the main
lid. This allowed for a faster completion and less invasive work at a better cost
than a traditional re-gasketting job. This was preferred because the transformer
is likely to be replaced in ED2 after the completion of ongoing works on site to
replace the 132kV switchgear and reactors in conjunction with National Grid. This
is the first time we have used this solution. The remainder of the refurbishments
all included re-gasketting to cure the oil leaks. In addition to re-gasketting, the
cooler was replaced on one of the transformers at Ilmer Primary due to severe
corrosion.
E3 –BCF
Allocation and estimation methodologies: detail any estimations, allocations
or apportionments to calculate the numbers submitted.
The following commentary details the processes used to calculate the BCF for UK
Power Networks specific to our three licensed distribution networks; Eastern
Power Networks plc (EPN), London Power Networks plc (LPN) and South Eastern
Power Networks plc (SPN).
All data in this commentary that is indicated with a yellow box as shown in the
example below corresponds with the completed E3 summary tables returned to
Ofgem.
Example:
Where data is only collected centrally this is apportioned between UK Power
Networks three DNOs based on headcount as of March 2017. These
apportionments are covered in the detailed commentary for the individual areas.
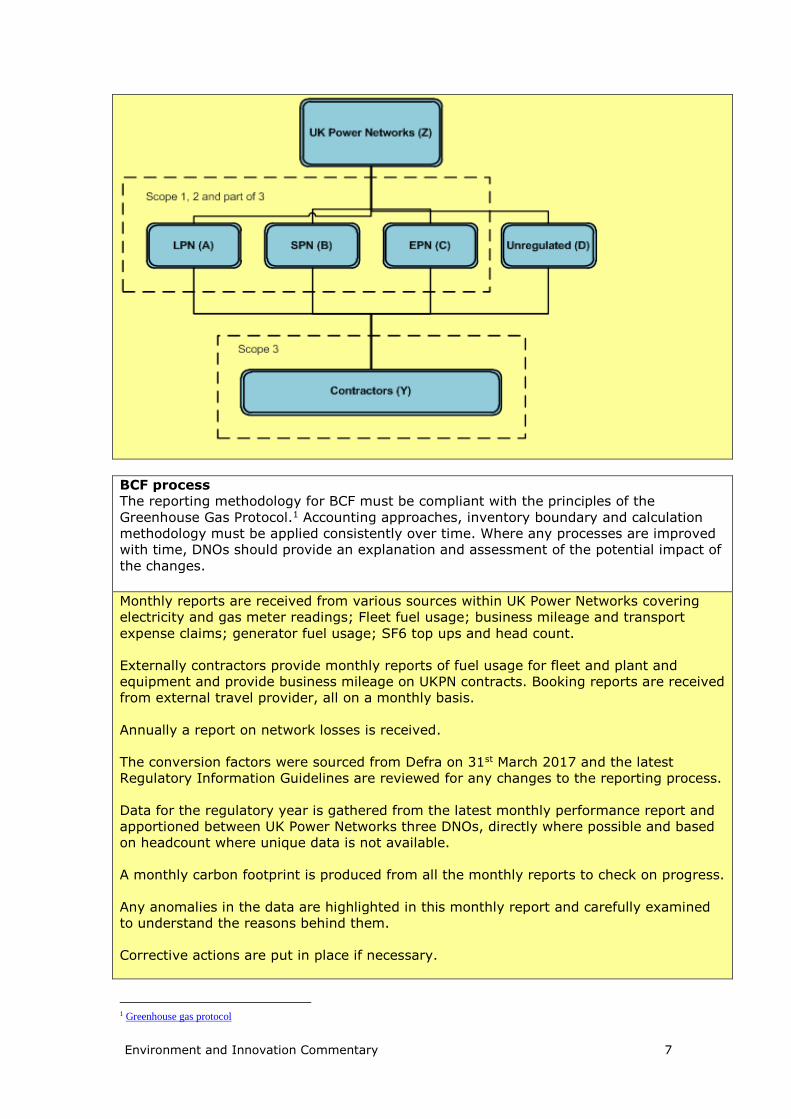
BCF reporting boundary and apportionment factor
DNOs that are part of a larger corporate group must provide a brief introduction outlining
the structure of the group, detailing which organisations are considered within the
reporting boundary for the purpose of BCF reporting.
Any apportionment of emissions across a corporate group to the DNO business units must
be explained and, where the method for apportionment differs from the method proposed

Environment and Innovation Commentary 6
in the worksheet guidance, justified.
All data provided is for the Regulatory reporting year (April 2016 to March 2017) unless
stated otherwise.
In all calculations the Defra conversion factors in place on March 31st 2017 - as
recommended in the reporting guidelines from Ofgem - have been used unless stated
otherwise. The 2015/16 figures which had used the Defra conversion factors released on
June 1st 2016 have been replaced with the factors in place on March 31st 2016. No change
was necessary to the 2014/15 baseline year data as this already used the factors in place
on March 31st 2015.
The Greenhouse Gas (GHG) Protocol categorises direct and indirect emissions into three
broad scopes:
Scope 1: Direct GHG emissions from sources owned or controlled by UK Power
Networks.
Scope 2: Indirect GHG emissions from consumption of purchased electricity, heat
or steam.
Scope 3: Other indirect emissions, such as the extraction and production of
purchased materials and fuels, transport-related activities in vehicles not owned or
controlled by UK Power Networks, electricity-related activities (e.g. T&D losses)
not covered in Scope 2, outsourced activities, waste disposal, etc.
UK Power Networks is a parent company Z that has full ownership and financial control of
operations A, B, C and D Unregulated. Data indicated with an X in our submission is
inclusive of data from subsidiaries; A, B, and C unless stated otherwise.
Data defined as D refers to our unregulated business and is excluded from the tables.
Data indicated with a Y is from our main contractors and their sub-contractors for the
regulated activities.
Environment and Innovation Commentary 7
BCF process
The reporting methodology for BCF must be compliant with the principles of the
Greenhouse Gas Protocol.1 Accounting approaches, inventory boundary and calculation
methodology must be applied consistently over time. Where any processes are improved
with time, DNOs should provide an explanation and assessment of the potential impact of
the changes.
Monthly reports are received from various sources within UK Power Networks covering
electricity and gas meter readings; Fleet fuel usage; business mileage and transport
expense claims; generator fuel usage; SF6 top ups and head count.
Externally contractors provide monthly reports of fuel usage for fleet and plant and
equipment and provide business mileage on UKPN contracts. Booking reports are received
from external travel provider, all on a monthly basis.
Annually a report on network losses is received.
The conversion factors were sourced from Defra on 31st March 2017 and the latest
Regulatory Information Guidelines are reviewed for any changes to the reporting process.
Data for the regulatory year is gathered from the latest monthly performance report and
apportioned between UK Power Networks three DNOs, directly where possible and based
on headcount where unique data is not available.
A monthly carbon footprint is produced from all the monthly reports to check on progress.
Any anomalies in the data are highlighted in this monthly report and carefully examined
to understand the reasons behind them.
Corrective actions are put in place if necessary.
1 Greenhouse gas protocol
Environment and Innovation Commentary 8
The entire Business Carbon footprint process has been examined for the last three years
by UK Power Networks own internal audit team.
Elements of the reporting process have also been examined on an annual basis by
external auditors DNV, as part of our ISO 14001 accreditation.
Commentary required for each category of BCF
For each category of BCF in the worksheet (ie Business Energy Usage, Operation
Transport etc) DNOs must, where applicable, provide a description of the following
information, ideally at the same level of granularity as the Defra conversion factors: the methodology used to calculate the values, outlining and explaining any specific
assumptions or deviations from the Greenhouse Gas Protocol
the data source and collection process
the source of the emission conversion factor (this shall be Defra unless there is a
compelling case for using another conversion factor. Justification should be
included for any deviation from Defra factors. )
the Scope of the emissions ie, Scope 1, 2 or 3
whether the emissions have been measured or estimated and, if estimated the
assumptions used and a description of the degree of estimation
any decisions to exclude any sources of emissions, including any fugitive
emissions which have not been calculated or estimated
any tools used in the calculation
where multiple conversion factors are required to calculate BCF (eg, due to use of
both diesel and petrol vehicles), DNOs should describe their methodology in
commentary
where multiple units are required for calculation of volumes in a given BCF
category (eg, a mixture of mileage and fuel volume for transport), DNOs should
describe their methodology in commentary, including the relevant physical units,
eg miles.
DNOs may provide any other relevant information here on BCF, such as commentary on
the change in BCF, and should ensure the baseline year for reference in any description
of targets or changes in BCF is the Regulatory Year 2014-15. DNOs should make clear
any differences in the commentary that relate to DNO and contractor emissions.
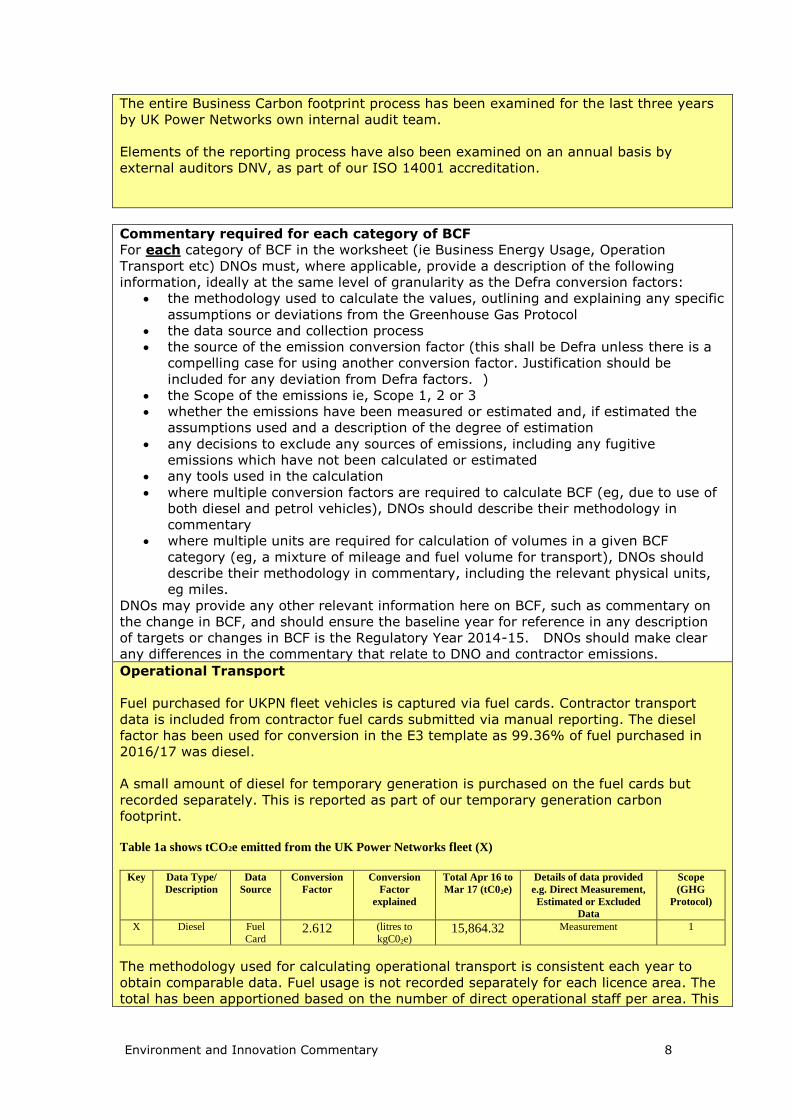
Operational Transport
Fuel purchased for UKPN fleet vehicles is captured via fuel cards. Contractor transport
data is included from contractor fuel cards submitted via manual reporting. The diesel
factor has been used for conversion in the E3 template as 99.36% of fuel purchased in
2016/17 was diesel.
A small amount of diesel for temporary generation is purchased on the fuel cards but
recorded separately. This is reported as part of our temporary generation carbon
footprint.
Table 1a shows tCO2e emitted from the UK Power Networks fleet (X)
Key Data Type/
Description
Data
Source
Conversion
Factor
Conversion
Factor
explained
Total Apr 16 to
Mar 17 (tC02e)
Details of data provided
e.g. Direct Measurement,
Estimated or Excluded
Data
Scope
(GHG
Protocol)
X Diesel Fuel
Card 2.612 (litres to
kgC02e) 15,864.32 Measurement 1
The methodology used for calculating operational transport is consistent each year to
obtain comparable data. Fuel usage is not recorded separately for each licence area. The
total has been apportioned based on the number of direct operational staff per area. This

Environment and Innovation Commentary 9
year’s operational staff split was 43.5% in EPN, 29.7% in LPN and 26.7% in SPN. This
compares with 37.0% EPN, 30.3% LPN and 32.7% in SPN in 2014/15. This method was
favoured over geographic area as a split based on km2 shows that our London network
accounts for only 2% of the total km2 across our three areas and this would be a
disproportionate split of CO2e from our transport fleet. The significant increase in EPN’s
apportionment is a result of bringing both the tree trimming and streetworks contracts in-
house.
This represents an increase of 2,152 tCO2e in our Scope 1 operational transport fleet fuel
figures against the baseline year of 2014/15. However, this has to be seen in conjunction
with the related decrease in Scope 3 contractor fleet fuel emissions. Overall Operational
Transport emissions have reduced from 30,948.23 tCO2e in 2014/15 to 25,883.47 tCO2e
in 2016/17. This represents a 16.4% decrease, mainly due to continued modernisation of
our operational fleet.
Table 1b shows the breakdown and the final submitted figures to Ofgem per licence area.
Key Area Direct op. staff Percentage of staff tC02e
A LPN 797 29.7% 4,715.89 B SPN 717 26.7% 4,242.32 C EPN 1167 43.5% 6,906.11
Business Transport
This section refers primarily to employee’s mileage and public transport (attending
meetings etc.) which constitutes our indirect operational emissions. Some of the
emissions included will be directly related to our operational work (such as visits to
projects) due to the data being combined. Any source data available as costs only, has
been converted into kms or litres using best available methodologies before applying the
Defra conversion factors.
Transport records for shared services such as IT, HR, etc. relating to the unregulated
business (D) as well is not recorded separately and all data is included within the
calculations. This is consistent with previous submissions.
The data is captured from four different sources:
1) SAP (financial management system): mileage and travel claimed through expenses
2) Clarity Travel: our approved travel provider
3) Corporate credit card (CCC): travel purchased through company credit cards
4) Fuel cards: fuel purchased through company fuel cards (Private mileage by those using
fuel cards is declared in miles so this is deducted from the mileage expense claims in
SAP)
The data is recorded by type of travel e.g. air, rail and road.
Table 2a shows a breakdown of the amount of tCO2e emitted by our employees (X)
Business Transport - Passenger ROAD
Key Data Type/
Description
Data
Source
Conversion
Factor
Conversion
Factor
explained
Total Apr
16 to Mar
17 (tC02e)
Details of data provided
e.g. Direct
Measurement,
Estimated or Excluded
Data
Scope
(GHG
Protocol)
X Business Kms
(UKPN company
cars)
SAP 0.118 (Kms to
kgCO2e)
(weighted average)
1063.03 Measurement and
Estimation
3
X Business Kms
(Non UKPN
SAP 0.187 (Kms to
kgCO2e) 340.75 Measurement and
estimation
3

Environment and Innovation Commentary
10
owned
cars/taxis)
(average car
factor)
X Diesel Fuel Card
and fuel
expense claims
2.612 (litres to
kgC02e) 1987.52 Measurement and
estimation
3
Total 3391.3
Business Transport - Passenger RAIL
Key Data Type/
Description
Data Source Conversion
Factor
Conversion
Factor
explained
Total Apr
16 to Mar
17 (tC02e)
Details of data provided
e.g. Direct Measurement,
Estimated or Excluded
Data
Scope
(GHG
Protocol)
X Rail Travel SAP;
corporate
card and Clarity
0.04885 (£ to kms to
kgC02e)
(Clarity data is already in kms)
302.34 Estimate and measurement 3
Business Transport - Passenger AIR
Key Data Type/
Description
Data Source Conversion
Factor
Conversion Factor
explained
Total Apr
16 to Mar
17 (tC02e)
Details of data
provided e.g. Direct
Measurement,
Estimated or Excluded
Data
Scope
(GHG
Protocol)
X Air Travel Corporate Credit Card
and Clarity
0.19452
(£ to kms) to kgC02e (weighted factor -
proportional to % of
long haul, short haul or domestic travel)
112.95 Estimate and Measurement
3
Total 3806.59
Business travel data is not recorded by each licence area; therefore the total business
mileage has been apportioned based on the number of indirect staff employed per area.
In 2016/17 this was LPN 30%, EPN 38% and SPN 33% compared to LPN 23%, EPN 50%
and SPN 27% in 2014/15. Vehicles owned by UK Power Networks or bought through the
business needs self-purchase scheme use the actual CO2 rating to improve the quality
and accuracy of data while for privately owned vehicles the DEFRA unknown vehicle
average conversion factor has been used.
Business kilometres are based on actual kilometres claimed. Fuel card usage is based on
actual litres used. Private mileage by fuel card users is reported and paid back. These
kilometres are deducted from the overall business mileage figures. Fuel expense claims
are a monetary value converted into litres based on the average price of a litre of fuel
over the reporting period. Taxi data is in monetary value only. A cost per mile calculation
is ascertained using best available methodologies and applied to the SAP and credit card
data. There has been a push towards those with company cards using fuel cards. This
provides a more accurate measure from a carbon footprinting perspective as it provides a
figure in litres of fuel which eliminates the wide variations between cars and drivers in
actual carbon used per km.
Air and rail travel data is provided by our external travel provider Clarity as actual
kilometres; however the air and rail travel data from SAP and corporate credit cards is in
monetary value only. A cost per kilometre calculation is ascertained using the Clarity data
and applied to the SAP and credit card data. This includes an assumption that the cost of
air and rail transport from SAP data will be the similar to the cost of air and rail transport
from Clarity data.
The provision and encouragement of teleconferencing facilities and a business wide
attempt to reduce travel generally are measures introduced to reduce business mileage.
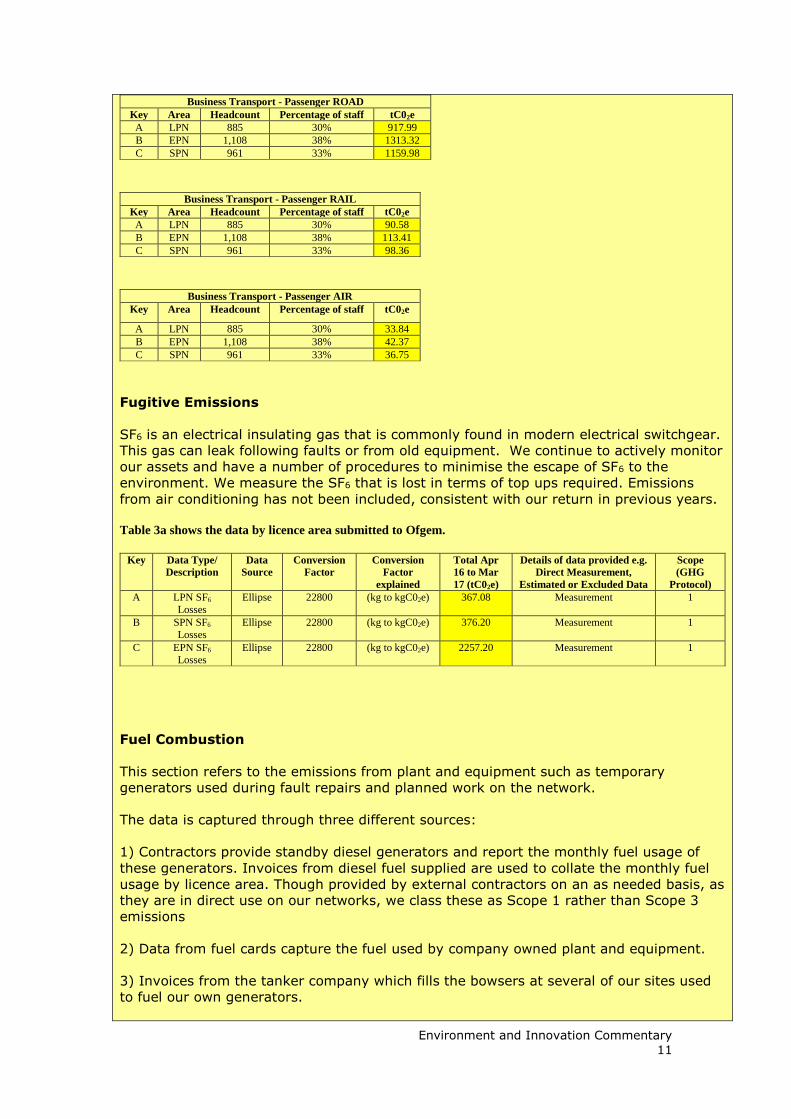
Table 2b shows the breakdown and the final figures per licence area submitted to Ofgem.
Environment and Innovation Commentary
11
Business Transport - Passenger ROAD
Key Area Headcount Percentage of staff tC02e
A LPN 885 30% 917.99
B EPN 1,108 38% 1313.32
C SPN 961 33% 1159.98
Business Transport - Passenger RAIL
Key Area Headcount Percentage of staff tC02e
A LPN 885 30% 90.58
B EPN 1,108 38% 113.41
C SPN 961 33% 98.36
Business Transport - Passenger AIR
Key Area Headcount Percentage of staff tC02e
A LPN 885 30% 33.84
B EPN 1,108 38% 42.37
C SPN 961 33% 36.75
Fugitive Emissions
SF6 is an electrical insulating gas that is commonly found in modern electrical switchgear.
This gas can leak following faults or from old equipment. We continue to actively monitor
our assets and have a number of procedures to minimise the escape of SF6 to the
environment. We measure the SF6 that is lost in terms of top ups required. Emissions
from air conditioning has not been included, consistent with our return in previous years.
Table 3a shows the data by licence area submitted to Ofgem.
Key Data Type/
Description
Data
Source
Conversion
Factor
Conversion
Factor
explained
Total Apr
16 to Mar
17 (tC02e)
Details of data provided e.g.
Direct Measurement,
Estimated or Excluded Data
Scope
(GHG
Protocol)
A LPN SF6
Losses
Ellipse 22800
(kg to kgC02e) 367.08 Measurement 1
B SPN SF6
Losses
Ellipse 22800
(kg to kgC02e) 376.20 Measurement 1
C EPN SF6
Losses
Ellipse 22800
(kg to kgC02e) 2257.20 Measurement 1
Fuel Combustion
This section refers to the emissions from plant and equipment such as temporary
generators used during fault repairs and planned work on the network.
The data is captured through three different sources:
1) Contractors provide standby diesel generators and report the monthly fuel usage of
these generators. Invoices from diesel fuel supplied are used to collate the monthly fuel
usage by licence area. Though provided by external contractors on an as needed basis, as
they are in direct use on our networks, we class these as Scope 1 rather than Scope 3
emissions
2) Data from fuel cards capture the fuel used by company owned plant and equipment.
3) Invoices from the tanker company which fills the bowsers at several of our sites used
to fuel our own generators.

Environment and Innovation Commentary
12
The source data is separated by area so no headcount conversion needs to be applied.
This is consistent with previous years.
Table 4a details our generator and bowser usage.
Key Data Type/
Description
Data Source Conversion
Factor
Conversion
Factor
explained
Total
Apr 16 to
Mar 17
(tC02e)
Details of data
provided e.g.
Direct
Measurement,
Estimated or
Excluded Data
Scope
(GHG
Protocol)
X Stand-by Diesel generators; Plant and
Equipment
Invoices; Deliveries to
bowsers; fuel
cards
2.966
(red diesel litres to
kgC02e)
10507.72 Measurement 1
Table 4b shows the final figures per licence area submitted to Ofgem.
Key Area tC02e
A LPN 724.71
B SPN 5,516.29
C EPN 4,266.72
Losses
These calculations measure units exiting our distribution network compared to units
entering from Grid Supply Points and any other sources.
Please note the final data for 2016/17 is expected to deteriorate as future reconciliations
are received. The current position should therefore not be taken as a forecast of future
performance.
Table 5a shows the data by licence area submitted to Ofgem.
Key Data Type/
Description
Data Source Conversion
Factor
Conversion
Factor
explained
Total Apr 16
to Mar 17
(tC02e)
Details of data
provided e.g.
Direct
Measurement,
Estimated or
Excluded Data
Scope
(GHG
Protocol)
A LPN Losses Billing for
each site 0.412
(kWh to
tC02e) 779,598.60 Measurement
B SPN Losses Billing for
each site 0.412
(kWh to
tC02e) 541,021.65 Measurement
C EPN Losses Billing for each site
0.412
(kWh to tC02e)
1,016,939.40 Measurement
Contractors
When reporting BCF emissions due to contractors in the second half of the worksheet
please:
Explain, and justify, the exclusion of any contractors and any thresholds used for
exclusion.
Provide an indication of what proportion of contractors have been excluded. This
figure could be calculated based on contract value.
Please provide a description of contractors’ certified schemes for BCF where a breakdown
of the calculation for their submitted values is not provided in the worksheet.
If a DNO’s accredited contractor is unable to provide a breakdown of the calculation and
has entered a dummy volume unit of ‘1’ in the worksheet please provide details of the
applicable accredited certification scheme which applies to the reported values. Contractor Definition
Contractors were originally selected for inclusion by the size of the financial contract
(above a £250k spend) and the scope of work i.e. activities involved in developing and
Environment and Innovation Commentary
13
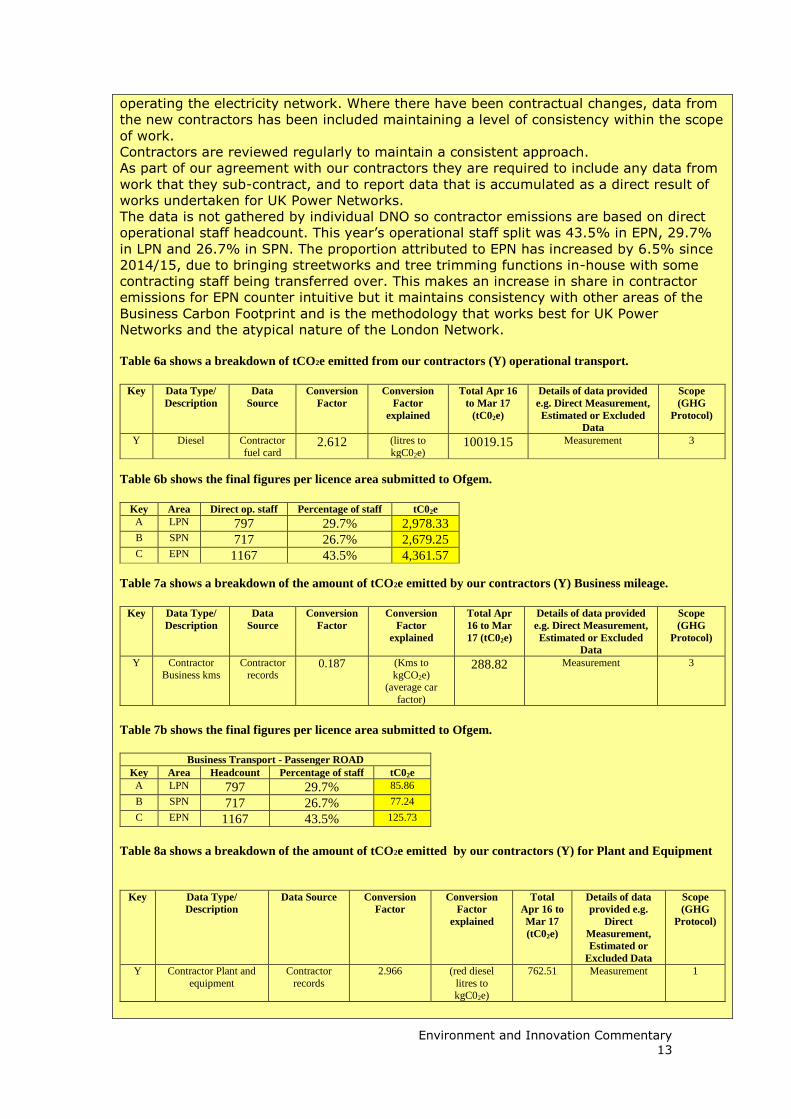
operating the electricity network. Where there have been contractual changes, data from
the new contractors has been included maintaining a level of consistency within the scope
of work.
Contractors are reviewed regularly to maintain a consistent approach.
As part of our agreement with our contractors they are required to include any data from
work that they sub-contract, and to report data that is accumulated as a direct result of
works undertaken for UK Power Networks.
The data is not gathered by individual DNO so contractor emissions are based on direct
operational staff headcount. This year’s operational staff split was 43.5% in EPN, 29.7%
in LPN and 26.7% in SPN. The proportion attributed to EPN has increased by 6.5% since
2014/15, due to bringing streetworks and tree trimming functions in-house with some
contracting staff being transferred over. This makes an increase in share in contractor
emissions for EPN counter intuitive but it maintains consistency with other areas of the
Business Carbon Footprint and is the methodology that works best for UK Power
Networks and the atypical nature of the London Network.
Table 6a shows a breakdown of tCO2e emitted from our contractors (Y) operational transport.
Key Data Type/
Description
Data
Source
Conversion
Factor
Conversion
Factor
explained
Total Apr 16
to Mar 17
(tC02e)
Details of data provided
e.g. Direct Measurement,
Estimated or Excluded
Data
Scope
(GHG
Protocol)
Y Diesel Contractor
fuel card 2.612 (litres to
kgC02e) 10019.15 Measurement 3
Table 6b shows the final figures per licence area submitted to Ofgem.
Key Area Direct op. staff Percentage of staff tC02e
A LPN 797 29.7% 2,978.33 B SPN 717 26.7% 2,679.25 C EPN 1167 43.5% 4,361.57
Table 7a shows a breakdown of the amount of tCO2e emitted by our contractors (Y) Business mileage.
Key Data Type/
Description
Data
Source
Conversion
Factor
Conversion
Factor
explained
Total Apr
16 to Mar
17 (tC02e)
Details of data provided
e.g. Direct Measurement,
Estimated or Excluded
Data
Scope
(GHG
Protocol)
Y Contractor
Business kms
Contractor
records 0.187 (Kms to
kgCO2e) (average car
factor)
288.82 Measurement 3
Table 7b shows the final figures per licence area submitted to Ofgem.
Business Transport - Passenger ROAD
Key Area Headcount Percentage of staff tC02e
A LPN 797 29.7% 85.86
B SPN 717 26.7% 77.24
C EPN 1167 43.5% 125.73
Table 8a shows a breakdown of the amount of tCO2e emitted by our contractors (Y) for Plant and Equipment
Key Data Type/
Description
Data Source Conversion
Factor
Conversion
Factor
explained
Total
Apr 16 to
Mar 17
(tC02e)
Details of data
provided e.g.
Direct
Measurement,
Estimated or
Excluded Data
Scope
(GHG
Protocol)
Y Contractor Plant and
equipment
Contractor
records
2.966
(red diesel
litres to kgC02e)
762.51 Measurement 1

Environment and Innovation Commentary
14
Table 8b shows the final figures per licence area submitted to Ofgem.
Key Area Direct op. staff Percentage of staff tC02e
A LPN 797 29.7% 226.67 B SPN 717 26.7% 203.90 C EPN 1167 43.5% 331.94
Building energy usage
Natural gas, Diesel and other fuels are all categorised as fuel combustion and must be
converted to tCO2e on either a Gross Calorific Value (Gross CV) or Net Calorific Value (Net
CV) basis. The chosen approach should be explained, including whether it has been adapted
over time. Substation Electricity must be captured under Buildings Energy Usage. Please explain the
basis on which energy supplied has been assessed.
Building Energy Usage data is collated from electricity and gas bills received for each
location. Staff for the unregulated business are predominantly concentrated on two sites,
Chatham depot and Newington House. Half of the electricity consumption at each of these
sites is deducted to allow for the unregulated business (D). Offices at the airports for
example, where all staff are part of the unregulated business are excluded entirely.
Data is measured in kWh then converted into tCO2e. In shared buildings overall UK Power
Networks headcount is used as a factor to determine energy used per DNO. The split used
this year is EPN 40%, LPN 30%, SPN 30%. This headcount split is only a slight change on
that used for the 2014/15 baseline carbon footprint of EPN 41%, LPN 29%, SPN 30%. Large
offices, containing many staff with centralised functions are designated as shared offices as
opposed to belonging to the DNO in which they are geographically located and their energy
usage divided between all 3 DNOs.
We use the Gross CV conversion factor for gas as recommended by Defra, as it represents
the CO2 content of gas as it is delivered to buildings. Gas is a very minor element of our
overall footprint.
Savings have been introduced through consolidation of staff into fewer building and energy
saving initiatives such as the introduction of LED lighting in many offices.
Table 9a shows a breakdown by energy type and licence area submitted to Ofgem.
Key Data Type/ Description Data Source Conversion
Factor
Conversion
Factor
explained
Total Apr
16 to Mar
17 (tC02e)
Details of data
provided e.g.
Direct
Measurement,
Estimated or
Excluded Data
Scope
(GHG
Protocol)
A LPN Electricity Usage Energy Bills 0.412
(kWh to kgC02e)
1,550.06 Measurement 2
B SPN Electricity Usage Energy Bills 0.412
(kWh to
kgC02e) 1,160.97 Measurement 2
C EPN Electricity Usage Energy Bills 0.412
(kWh to
kgC02e) 1,731.46 Measurement 2
Total 4,442.48
A LPN Gas Usage Energy Bills 0.184 (Gross
CV)
(kWh to
kgC02e) 51.32
Measurement 2
B SPN Gas Usage Energy Bills 0.184 (Gross
CV)
(kWh to
kgC02e) 81.87
Measurement 2
C EPN Gas Usage Energy Bills 0.184 (Gross
CV)
(kWh to kgC02e)
130.36 Measurement 2
Total 263.55

Environment and Innovation Commentary
15
A detailed project to analyse electricity usage in our substations is the basis of the reporting
and billing of our unmetered supply. Substations were separated into Grid, Primary and
Secondary substations and comprehensive analysis of the energy usage of each type
undertaken. Typical energy usage on aspects like heating, lighting and security were
determined and then applied across the business based on the numbers of unmetered
substations of that type in operation. Annual consumption of energy used in unmetered
substations has been assessed based on the number and type of plant installed in each
licence area. This method has been consistent with that used in previous years.
In 2014/15 an estimated figure was used for our metered substations due to the large
number with unread meters. However, after a drive to get meters read and a major push on
any properties more than 90 days in arrears on a meter reading, actual data from all
metered substations is included in the data for the RIIO ED1 period. This has had the
biggest impact in LPN where the majority of substations are metered. On the few occasions
where it has not been possible to obtain a reading for the latest month at the time of
submission an average reading based on all previous readings this year has been inserted.
Table 9b shows the substation electricity usage for metered and unmetered sites by licence area.
Key Data Type/
Description
Data
Source
Conversion
Factor
Conversion
Factor
explained
Total Apr 16
to Mar 17
(tC02e)
Details of data provided
e.g. Direct Measurement,
Estimated or Excluded
Data
Scope
(GHG
Protocol)
A LPN Metered
and Unmetered
Energy
Bills and
Assessed
0.412
(kWh to
kgC02e) 6345.02 Measurement 2
B SPN Metered
and Unmetered
Energy
Bills and
Assessed
0.412
(kWh to
kgC02e) 4,014.87 Measurement 2
C EPN Metered and Unmetered
Energy Bills and
Assessed
0.412
(kWh to kgC02e)
9,322.46 Measurement 2
Total 19682.35
E4 – Losses Snapshot
Allocation and estimation methodologies: detail any estimations, allocations
or apportionments to calculate the numbers submitted.
Since our previous E4 submission it has become apparent that our previous
reporting methodology, in relation to transformers, does not align with Ofgem’s
guidance. As ECO2015 specifications are now mandatory, and therefore represent
the baseline scenario, claiming benefits solely attributable to the installation of
ECO2015 specification is no longer justified. Instead, only transformer activities
that deliver energy improvements, have an incremental cost over the baseline
scenario and demonstrate a positive CBA are now included within our submission.
EPN
Transformer replacement
Recent CBA analyses have demonstrated that the following secondary
transformer size increments are economically justifiable from a losses
perspective:
GMTs, upsize 315kVA to 500 kVA, and 800kVA to 1000kVA.
This approach yielded a loss improvement of 34.9MWh in EPN (10 GMTs, no PMTs

Environment and Innovation Commentary
16
reported).
Prices for different transformer sizes were obtained from UKPN’s Compatible Units
price list, and the costs of the various upgrades were determined using this
information. This approach yielded a total cost increment of £18.2k for the above-
mentioned secondary transformers.
In order to report the RIGs volumes in the required format the split between work
activities was taken from the ratio of work reported elsewhere in our RIGs tables,
with ‘Asset Replacement’, Reinforcement’ and ‘Other’ being the three reportable
categories. These percentages have been applied to the GMT volumes that deliver
loss improvements in EPN and are reported in column O.
Column J of E4 relates to unit costs, and these unit costs were taken as the
average of the last five years’ values reported in CV7.
Column W values are determined by multiplying the volumes and the unit costs to
provide the Estimated Total Cost. Column AE multiplies Ofgem’s value of losses
at £48.42/MWh by the estimated energy loss improvements in column AM to
provide the Justified Cost.
Column AM shows the loss reductions for each category and activity.
As mentioned earlier, in EPN £18.2k was spent installing 10 larger GMTs. The cost
of these upgrades is shown in column AT, split according to volumes of work
reported.
In summary, the loss improvement given the revised methodology stands at
34.9MWh for secondary transformers.
Using our previous reporting methodology, detailed in the section below entitled
‘Earlier approach’, a total of 610 secondary transformers were installed which
delivered improvements in network losses relative to the units that they replaced.
Overall, an improvement of 2321.3 MWh related to secondary network
transformers was achieved. In addition, five grid transformers were replaced
which realised improvements of 2335MWh. These values are not included within
our RIGs return but are highlighted in this commentary for information purposes
only. A supplementary E4 snapshot is also included for information purposes.
LV Cables
LV cable size increases aimed at decreasing network energy losses were reviewed
and subjected to continued CBA assessment in the past year, and it was found
that these upgrades still stand justified.
Costs to increase cable sizes were calculated based on the price differentials
between cables of various sizes (95mm = £6.17, 185mm = £11.00 and 300mm =
£13.84 per metre in 12/13 monetary values). Across all three licence areas in
2015, 625km of LV cable was used with a split of 45% as 95mm, 35% as 185mm
and 20% as 300mm. In 2016/17 a total of 576 km of LV cable was utilised but it
was noted that there has been a shift toward larger sizes following the
amendment of associated LV Engineering Design Standards. The percentage split
is now 31% of 95mm, 41% of 185mm and 28% of 300mm.
This change means that the use of 95mm cable was reduced by 80.7km in total,
while we saw corresponding increments of 33.1km for 185mm and 47.6km for
300mm respectively. As the geographical split is known, values have been
calculated across the licence areas. In EPN, the total improvement equates to

Environment and Innovation Commentary
17
1614.8 MWh at a cost of £174k (in 12/13 money). This cost was further
apportioned according to volumes stated for the various work categories and
entered into column AT of the losses snapshot E4. The loss benefits (MWh) were
accounted for in column AM.
As mentioned above, cable-related activities saved 1614.8 MWh in EPN.
Combining this with the above-mentioned reportable transformer activity yields
1649.7 MWh and represents UK Power Networks’ 2016/17 E4 submission for
EPN.
Earlier approach2
In EPN a total of 834 secondary network transformers were replaced in 2016/17.
Using UK Power Networks’ asset register, details of the sites where transformers
were installed have been identified. These were cross referenced with units that
were removed from site.
Using the age and capacity, and referring to a number of generic transformer
specifications (pre 1955, 1971, 1979, 1984 & ECO 2015), enabled us to quantify
the iron and copper losses associated with the various transformers . Using an
assumed loading level and load loss factor, and assuming that the load on the
transformer remains constant even if a larger unit is installed, the old and new
copper losses were estimated. Subtracting the sum of new losses from the old
yields the loss-related differential benefit of the work undertaken on a site-by-site
basis. UK Power Networks recognise that where a larger transformer has been
installed it likely corresponds with a load-related increase. However, in the
interest of comparing losses on a like-for-like basis, a constant load has been
assumed.
To identify work that delivered improvements in losses the transformer
replacements that didn’t deliver benefits were dismissed. This meant that in EPN
610 of the 834 transformers have been considered. The 610 transformers
mentioned here consist of 201 PMTs and 409 GMTs. Amongst the 610
transformers that delivered benefits were 233 units of increased capacity. The
233 transformers further consist of 113 PMTs and 120 GMTs.
To calculate the incremental cost associated with this work the volumes
associated with like-for-like replacement were dismissed as the cost of an ECO
2015 specification transformer is accepted as equal to the previous specification
that was used.
To calculate the incremental cost of installing larger units, we used information
from our “Compatible Units” price list, which is ordinarily used to estimate quotes
for new installations. Overall, calculations revealed a total price increment of
£471.3k to upsize the above-mentioned 233 units (PMT’s and GMT’s combined, in
12/13 monetary values).
In EPN, based on the information above, an overall improvement in network
losses of 2,321.3 MWh per annum was achieved at a total incremental cost of
£471.3k. Columns AT & AM were populated accordingly.
The energy savings associated with Grid and Primary transformers were
calculated using half-hourly average currents and transformer test certificate
information. In instances where there were no transformers previously installed,
we compared loss performance against a 1984 specification equivalent unit to
establish an energy loss differential (given that ECO 2015 transformers are used
2 Earlier approach aligns with E4 Losses Snapshot described as “Losses Snapshot E4 (Earlier Approach)”.

Environment and Innovation Commentary
18
at present). In brief, the methodology was as follows:
1. Obtain iron and copper loss specifications along with the transformers’ MVA
and voltage ratings.
2. Obtain half-hourly loads over the course of a full year, and obtain the
maximum load within this period.
3. Using the above-mentioned information, calculate a Load Loss Factor (LLF) for
each site in question to account for the nonlinear characteristics of copper losses
(I2R).
4. Calculate the annual copper losses by multiplying the copper loss at peak load
by the LLF and 8760 hours.
5. Multiply the iron loss value by 8760 hours to calculate annual iron losses.
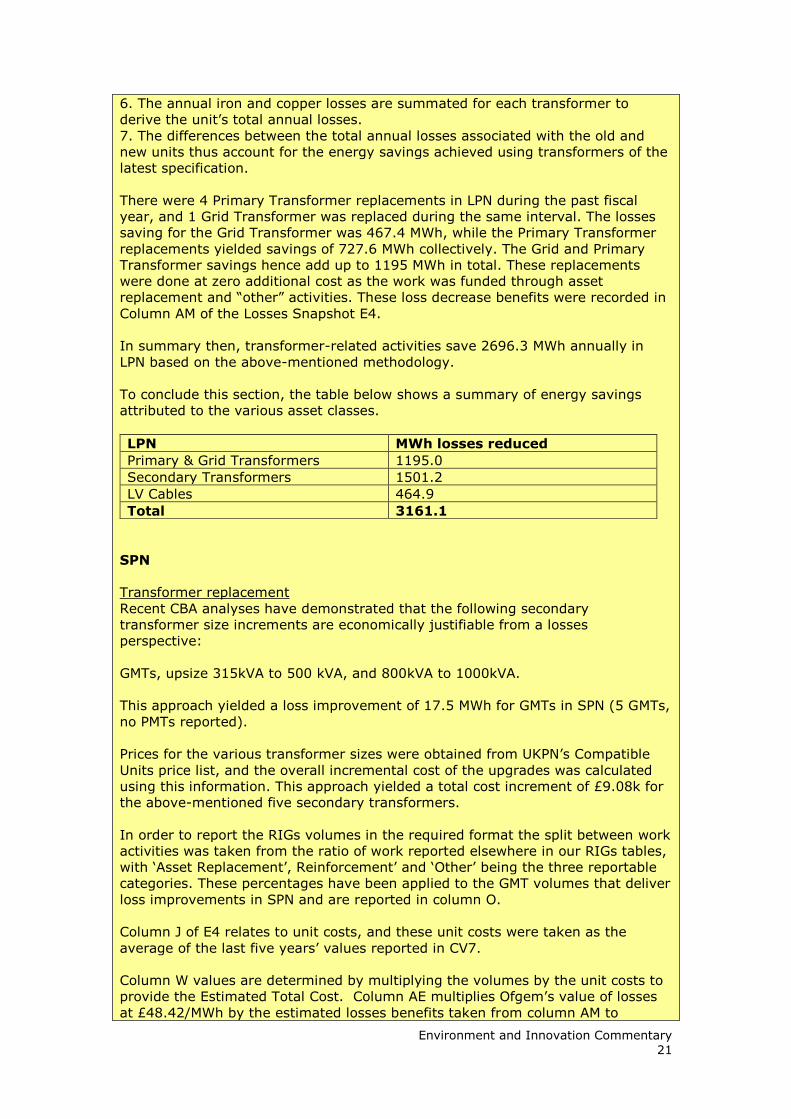
6. The annual iron and copper losses are summated for each transformer to
derive the unit’s total annual losses.
7. The differences between the total annual losses associated with the old and
new units thus account for the energy savings achieved using transformers of the
latest specification.
There has been no Primary Transformer replacement in EPN during the past fiscal
year, but five Grid Transformers were replaced during the interval. The losses
saving for each Grid Transformer was 467 MWh on average, which summates to
a total of of 2,335 MWh. These replacements were done at zero additional cost
as the work was funded through “Other” funded activities. This loss decrease
benefit was recorded in Column AM of the Losses Snapshot E4.
To conclude this section, the table below shows a summary of energy savings
attributed to the various asset classes.
EPN MWh losses reduced
Primary & Grid Transformers 2335.0
Secondary Transformers 2321.3
LV Cables 1614.8
Total 6271.1
LPN
Transformer replacement
Recent CBA analyses have demonstrated that the following secondary
transformer size increments are economically justifiable from a losses
perspective:
GMTs, upsize 315kVA to 500 kVA, and 800kVA to 1000kVA.
This approach yielded a loss improvement of 24.4 MWh in LPN (7 GMTs, no PMTs
reported).
Prices for the various transformer sizes were obtained from our Compatible Units
price list, and the overall cost of the above-mentioned upgrades was calculated
using this information. This approach yielded a total cost increment of £12.7k for
the above-mentioned secondary transformers.
In order to report the RIGs volumes in the required format the split between work
activities was taken from the ratio of work reported elsewhere in our RIGs tables,
with ‘Asset Replacement’, Reinforcement’ and ‘Other’ being the three reportable
categories. These percentages have been applied to the GMT volumes that deliver
loss improvements in LPN and are reported in column O.
Environment and Innovation Commentary
19
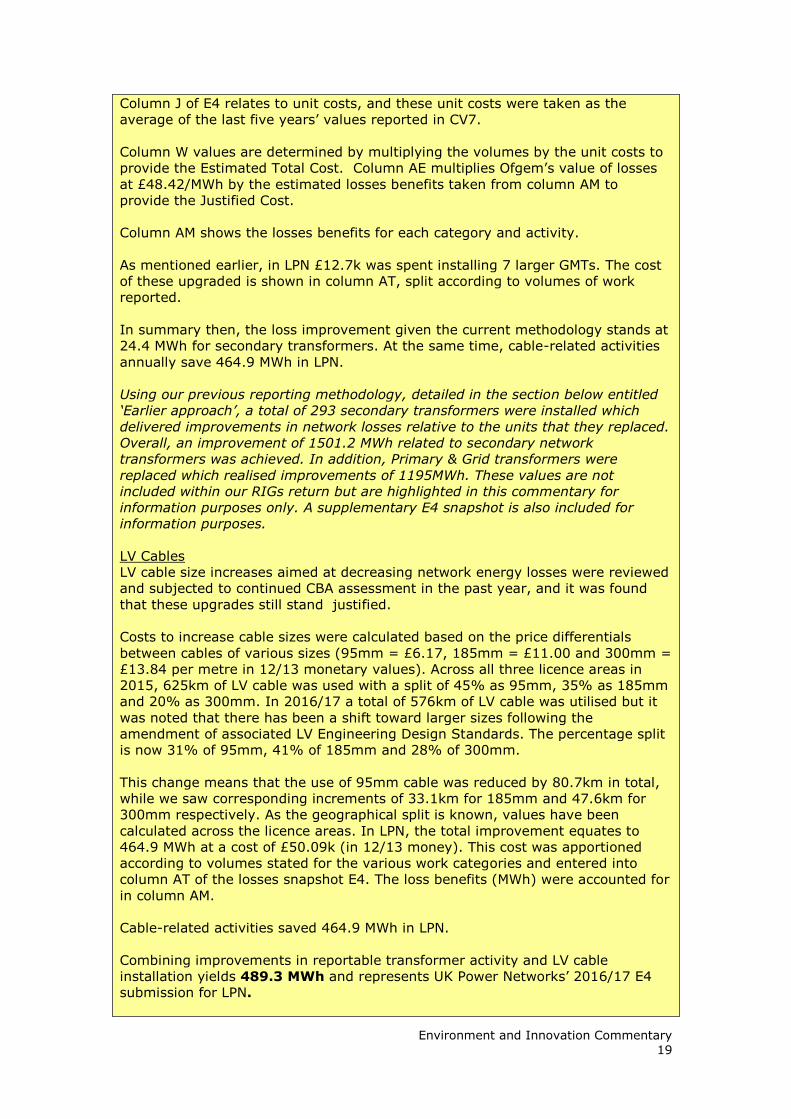
Column J of E4 relates to unit costs, and these unit costs were taken as the
average of the last five years’ values reported in CV7.
Column W values are determined by multiplying the volumes by the unit costs to
provide the Estimated Total Cost. Column AE multiplies Ofgem’s value of losses
at £48.42/MWh by the estimated losses benefits taken from column AM to
provide the Justified Cost.
Column AM shows the losses benefits for each category and activity.
As mentioned earlier, in LPN £12.7k was spent installing 7 larger GMTs. The cost
of these upgraded is shown in column AT, split according to volumes of work
reported.
In summary then, the loss improvement given the current methodology stands at
24.4 MWh for secondary transformers. At the same time, cable-related activities
annually save 464.9 MWh in LPN.
Using our previous reporting methodology, detailed in the section below entitled
‘Earlier approach’, a total of 293 secondary transformers were installed which
delivered improvements in network losses relative to the units that they replaced.
Overall, an improvement of 1501.2 MWh related to secondary network
transformers was achieved. In addition, Primary & Grid transformers were
replaced which realised improvements of 1195MWh. These values are not
included within our RIGs return but are highlighted in this commentary for
information purposes only. A supplementary E4 snapshot is also included for
information purposes.
LV Cables
LV cable size increases aimed at decreasing network energy losses were reviewed
and subjected to continued CBA assessment in the past year, and it was found
that these upgrades still stand justified.
Costs to increase cable sizes were calculated based on the price differentials
between cables of various sizes (95mm = £6.17, 185mm = £11.00 and 300mm =
£13.84 per metre in 12/13 monetary values). Across all three licence areas in
2015, 625km of LV cable was used with a split of 45% as 95mm, 35% as 185mm
and 20% as 300mm. In 2016/17 a total of 576km of LV cable was utilised but it
was noted that there has been a shift toward larger sizes following the
amendment of associated LV Engineering Design Standards. The percentage split
is now 31% of 95mm, 41% of 185mm and 28% of 300mm.
This change means that the use of 95mm cable was reduced by 80.7km in total,
while we saw corresponding increments of 33.1km for 185mm and 47.6km for
300mm respectively. As the geographical split is known, values have been
calculated across the licence areas. In LPN, the total improvement equates to
464.9 MWh at a cost of £50.09k (in 12/13 money). This cost was apportioned
according to volumes stated for the various work categories and entered into
column AT of the losses snapshot E4. The loss benefits (MWh) were accounted for
in column AM.
Cable-related activities saved 464.9 MWh in LPN.
Combining improvements in reportable transformer activity and LV cable
installation yields 489.3 MWh and represents UK Power Networks’ 2016/17 E4
submission for LPN.

Environment and Innovation Commentary
20
Earlier approach3
In LPN a total of 346 secondary network transformers were replaced in 2016/17.
Using UK Power Networks’ asset register, details of the sites where transformers
were installed have been identified. These were cross referenced with units that
were removed from site.
Using the age and capacity of the units that were replaced, and referring to a
number of generic transformer specifications (pre 1955, 1971, 1979, 1984 & ECO
2015), enabled us to quantify the iron and copper losses associated with the
various transformers . Using an assumed loading level and load loss factor, and
assuming that the load on the transformer remains constant even if a larger unit
is installed, the old and new copper losses were estimated. Subtracting the sum
of new losses from the old yields the differential loss benefit for the work
undertaken on a site-by-site basis. UK Power Networks recognise that where a
larger transformer has been installed it likely corresponds with a load-related
increase. However, in the interest of comparing losses on a like-for-like basis, a
constant load has been assumed.
To identify work that delivered improvements, transformer replacements that
didn’t deliver benefits were dismissed. This meant that in LPN 293 of the 346
transformers have been considered. The 293 transformers mentioned here were
all GMTs. Amongst the 293 transformers that delivered benefits were 86 units of
increased capacity.
To calculate the incremental costs associated with this work the volumes
associated with like-for-like replacement were dismissed as the cost of an ECO
2015 spec transformer is accepted as equal to the previous specification that was
used.
To calculate the incremental cost of installing larger units, we used information
from our “Compatible Units” price list, which we ordinarily use to estimate quotes
for new installations. Overall, we calculated a total price increment of £267.9k to
upsize the above-mentioned 86 units (in 2012/13 monetary values).
In LPN, based on the information above, an overall improvement in network
losses of 1501.2 MWh per annum was achieved at a total incremental cost of
£267.9k. Columns AT & AM were populated accordingly.
The energy savings associated with Grid and Primary transformers were
calculated using individual half-hourly average currents and transformer test
certificate information. In instances where there were no transformers previously
installed, we compared loss performance against a 1984 specification equivalent
unit to establish an energy loss differential (given that ECO 2015 transformers
are used at present). In brief, the methodology was as follows:
1. Obtain iron and copper loss specifications along with the transformers’ MVA
and voltage ratings.
2. Obtain half-hourly loads over the course of a full year, and obtain the
maximum load within this period.
3. Using the above-mentioned information, calculate a Load Loss Factor (LLF) for
each site in question to account for the nonlinear characteristics of copper losses
(I2R).
4. Calculate the annual copper losses by multiplying the copper loss at peak load
by the LLF and 8760 hours.
5. Multiply the iron loss value by 8760 hours to calculate annual iron losses.
3 Earlier approach aligns with E4 Losses Snapshot described as “Losses Snapshot E4 (Earlier Approach)”.
Environment and Innovation Commentary
21
6. The annual iron and copper losses are summated for each transformer to
derive the unit’s total annual losses.
7. The differences between the total annual losses associated with the old and
new units thus account for the energy savings achieved using transformers of the
latest specification.
There were 4 Primary Transformer replacements in LPN during the past fiscal
year, and 1 Grid Transformer was replaced during the same interval. The losses
saving for the Grid Transformer was 467.4 MWh, while the Primary Transformer
replacements yielded savings of 727.6 MWh collectively. The Grid and Primary
Transformer savings hence add up to 1195 MWh in total. These replacements
were done at zero additional cost as the work was funded through asset
replacement and “other” activities. These loss decrease benefits were recorded in
Column AM of the Losses Snapshot E4.
In summary then, transformer-related activities save 2696.3 MWh annually in
LPN based on the above-mentioned methodology.
To conclude this section, the table below shows a summary of energy savings
attributed to the various asset classes.
LPN MWh losses reduced
Primary & Grid Transformers 1195.0
Secondary Transformers 1501.2
LV Cables 464.9
Total 3161.1
SPN
Transformer replacement
Recent CBA analyses have demonstrated that the following secondary
transformer size increments are economically justifiable from a losses
perspective:
GMTs, upsize 315kVA to 500 kVA, and 800kVA to 1000kVA.
This approach yielded a loss improvement of 17.5 MWh for GMTs in SPN (5 GMTs,
no PMTs reported).
Prices for the various transformer sizes were obtained from UKPN’s Compatible
Units price list, and the overall incremental cost of the upgrades was calculated
using this information. This approach yielded a total cost increment of £9.08k for
the above-mentioned five secondary transformers.
In order to report the RIGs volumes in the required format the split between work
activities was taken from the ratio of work reported elsewhere in our RIGs tables,
with ‘Asset Replacement’, Reinforcement’ and ‘Other’ being the three reportable
categories. These percentages have been applied to the GMT volumes that deliver
loss improvements in SPN and are reported in column O.
Column J of E4 relates to unit costs, and these unit costs were taken as the
average of the last five years’ values reported in CV7.
Column W values are determined by multiplying the volumes by the unit costs to
provide the Estimated Total Cost. Column AE multiplies Ofgem’s value of losses
at £48.42/MWh by the estimated losses benefits taken from column AM to

Environment and Innovation Commentary
22
provide the Justified Cost.
Column AM shows the loss reductions for each category and activity.
As mentioned earlier, in SPN £9.08k was spent installing 5 larger GMTs. The cost
of these upgrades is shown in column AT, split according to volumes of work
reported.
In summary then, the loss improvement given the current methodology stands at
17.5 MWh for secondary transformers.
Using our previous reporting methodology, detailed in the section below entitled
‘Earlier approach’, a total of 336 transformers were installed which delivered
improvements in network losses relative to the units that they replaced. Overall,
an improvement of 1340.2 MWh related to secondary network transformers was
achieved. In addition, Primary & Grid Transformer replacements realised
improvements of 557.3 MWh. These values are not included within our RIGs
return but are highlighted in this commentary for information purposes only. A
supplementary E4 snapshot is also included for information purposes.
LV Cables
LV cable size increases aimed at decreasing network energy losses were also
reviewed and subjected to continued CBA assessment in the past year, and it was
found that these upgrades still stand justified.
Costs to increase cable sizes were calculated based on the price differentials
between cables of various sizes (95mm = £6.17, 185mm = £11.00 and 300mm =
£13.84 per metre in 12/13 monetary values). Across all three licence areas in
2015, 625km of LV cable was used with a split of 45% as 95mm, 35% as 185mm
and 20% as 300mm. In 2016/17 a total of 576km of LV cable was utilised but it
was noted that there has been a shift toward larger sizes following the
amendment of associated LV Engineering Design Standards. The percentage split
is now 31% of 95mm, 41% of 185mm and 28% of 300mm.
This change means that the use of 95mm cable was reduced by 80.7km in total,
while we saw corresponding increments of 33.1km for 185mm and 47.6km for
300mm respectively. As the geographical split is known, values have been
calculated across the licence areas. In SPN, the total improvement equates to
660.6 MWh at a cost of £71.2k (in 12/13 money). This cost was apportioned
according to volumes stated for the various work categories and entered into
column AT of the losses snapshot E4. The loss benefits (MWh) were accounted for
in column AM.
Combining the above improvements due to transformer-related activity with LV
cable-related loss reductions yields 678 MWh and represents UK Power Networks’
2016/17 E4 submission for SPN.
Earlier approach4
In SPN a total of 452 secondary network transformers were replaced in 2016/17.
Using UK Power Networks’ asset register, details of the sites where transformers
were installed have been identified. These were cross referenced with units that
were removed from site.
Using the age and capacity of the units that were replaced, and referring to a
4 Earlier approach aligns with E4 Losses Snapshot described as “Losses Snapshot E4 (Earlier Approach)”.

Environment and Innovation Commentary
23
number of generic transformer specifications (pre 1955, 1971, 1979, 1984 & ECO
2015), enabled us to quantify the iron and copper losses associated with the
various transformers . Using an assumed loading level and load loss factor, and
assuming that the load on the transformer remains constant even if a larger unit
is installed, the old and new copper losses were estimated. Subtracting the sum
of new losses from the old yields the differential loss benefit of the work
undertaken on a site-by-site basis. UK Power Networks recognise that where a
larger transformer has been installed it likely corresponds with a load-related
increase. However, in the interest of comparing losses on a like-for-like basis, a
constant load has been assumed.
To identify work that delivered improvements in losses the transformer
replacements that didn’t deliver benefits were dismissed. This meant that in SPN
336 of the 452 transformers have been considered. The 336 transformers
mentioned here consist of 96 PMTs and 240 GMTs. Amongst the 336 transformers
that delivered benefits were 124 units of increased capacity.
To calculate the incremental cost associated with this work the volumes
associated with like-for-like replacement were dismissed as the cost of an
ECO2015 spec transformer is accepted as equal to the previous specification that
was used.
To calculate the incremental cost of installing larger units, we used information
from our “Compatible Units” price list, which we ordinarily use to estimate quotes
for new installations. Overall, we calculated a total price increment of £266.5k to
upsize the above-mentioned 124 units (PMT’s and GMT’s combined, in 2012/13
monetary values).
In SPN, based on the information above, an overall improvement in network
losses of 1,340.2 MWh per annum was achieved at a total incremental cost of
£266.5k. Columns AT & AM were populated accordingly.
The energy savings associated with Grid and Primary transformers were
calculated using individual half-hourly average currents and transformer test
certificate information. In instances where there were no transformers previously
installed, we compared loss performance against a 1984 specification equivalent
unit to establish an energy loss differential (given that ECO 2015 transformers
are used at present). In brief, the methodology was as follows:
1. Obtain iron and copper loss specifications along with the transformers’ MVA
and voltage ratings.
2. Obtain half-hourly loads over the course of a full year, and obtain the
maximum load within this period.
3. Using the above-mentioned information, calculate a Load Loss Factor (LLF) for
each site in question to account for the nonlinear characteristics of copper losses
(I2R).
4. Calculate the annual copper losses by multiplying the copper loss at peak load
by the LLF and 8760 hours.
5. Multiply the iron loss value by 8760 hours to calculate annual iron losses.
6. The annual iron and copper losses are summated for each transformer to
derive the unit’s total annual losses.
7. The differences between the total annual losses associated with the old and
new units thus account for the energy savings achieved by using transformers of
the latest specification.
There has been 1 Primary Transformer replacement in SPN during the past fiscal
year, and 2 Grid Transformers were replaced during the same interval. The losses

Environment and Innovation Commentary
24
saving for the Grid Transformers amounted to 518.2 MWh, while the Primary
Transformer brought about a loss improvement of 39.1 MWh. Combined, these
two figures add up to 557.3 MWh. These replacements were done at zero
additional cost as the work was funded through asset replacement and “other”
activities. These loss decreasses were recorded in Column AM of the Losses
Snapshot E4.
In summary then, transformer-related activities save 1,897.5 MWh annually in
SPN based on the above-mentioned methodology.
To conclude this section, the table below shows a summary of energy savings
attributed to the various asset classes.
SPN MWh losses reduced
Primary & Grid Transformers 557.3
Secondary Transformers 1340.2
LV Cables 660.6
Total 2558.1
Programme/Project Title
Please provide a brief summary and rationale for each of the activities in column
C which you have reported against.
As we work through the activities detailed within our losses strategy we currently
are tackling areas where data is available. As more data becomes available the
number of topics that we report will correspondingly increase. We will proactively
seek to obtain the relevant data to enable us to report further areas in future
RIGs submissions.
Currently we are able to report loss improvements associated with cables and
transformers. These activities are split between Asset Replacement,
Reinforcement and ‘Other’. Distribution transformers are split further between
PMT and GMT categories.
Primary driver of activity
If, in column E, you have selected ‘Other’ as the primary driver of the activity,
please provide further explanation.
The “Other” category mentioned above captures volumes associated with:
Diversions, Quality of Supply, OHL Clearance, Faults, Legal + Safety,
Environmental and Connections i.e those associated with volumes from V3 and
V5.
Baseline Scenario
Please provide a brief description of the ‘Baseline Scenario’ inputted in column K
for each activity.
The baseline scenario captures the unit cost to do work in the ‘business as usual’
mode. The unit costs of work undertaken to improve network losses are detailed
in the respective CBA worksheets.
Use of the RIIO-ED1 CBA Tool

Environment and Innovation Commentary
25
DNOs should use the latest version of the RIIO-ED1 CBA Tool for each of the
activities reported in column C. Where the RIIO-ED1 CBA Tool cannot be used to
justify an activity, DNOs should explain why and provide evidence for how they
have derived the equivalent figures for the worksheet. The most up-to-date CBA
for each activity reported in the Regulatory Year under report must be submitted.
Environment and Innovation Commentary
26
Changes to CBAs
If, following an update to the CBA used to originally justify the activity in column
C, the updated CBA shows:
a negative net benefit for an activity, but the DNO decides it is in the best
interests of consumers to continue the activity, or
a substantively different NPV from that used to justify an activity that has
already begun.
the DNO should include an explanation of what has changed and why the DNO is
continuing the activity.
For example, where the carbon price used in the RIIO-ED1 CBA Tool has changed
from that used to inform the decision such that the activity no longer has a
positive NPV.
Cost benefit analysis additional information
Please include a reference to the file name and location of any additional relevant
evidence submitted to support the costs and benefits inputted into this
worksheet. This should include the most recent CBA for each activity reported in
column C in the Regulatory Year under report.
E5 – Smart Metering
Allocation and estimation methodologies: detail any estimations, allocations
or apportionments to calculate the numbers submitted.
n/a
Actions to deliver benefits
Detail what activities have been undertaken in the relevant regulatory year to
produce benefits of smart metering where efficient and maximise benefits overall
to consumers. At a minimum this should include:
A description of what the expenditure reported under Smart Meter
Information Technology Costs is being used to procure and how it expects
this to deliver benefits for consumers.
A description of the benefits expected from the non-elective data procured
as part of the Smart Meter Communication Licensee Costs. The DNO
should set out how it has used this data.
A description of the Elective Communication Services being procured, how
it has used these services, and a description of the benefits the DNO
expects to achieve.
n/a
Environment and Innovation Commentary
27
Calculation of benefits
Explain how the benefits have been calculated, including all assumptions used
and details of the counterfactual scenario against which the benefits are
calculated.
n/a
Use of the RIIO-ED1 CBA Tool
DNOs should use the latest version of the RIIO-ED1 CBA Tool for each solution
reported in the worksheet in the Regulatory Year under report. Where the RIIO-
ED1 CBA Tool cannot be used to justify a solution, DNOs should explain why and
provide evidence for how they have derived the equivalent figures for the
worksheet. The most up-to-date CBA for each activity reported in the Regulatory
Year under report which are used to complete the worksheet must be submitted.
n/a
Cost benefit analysis additional information
Please include a reference to the file name and location of any additional relevant
evidence submitted to support the costs and benefits inputted into this
worksheet. This should include the most recent CBA for each solution reported in
the Regulatory Year under report.
n/a
E6 – Innovative Solutions
Automated Power Restoration System
Allocation and estimation methodologies: detail any estimations, allocations
or apportionments to calculate the numbers submitted.
The following section details the high level assumptions made in the calculations
for this solution.
Benefits are calculated for each individual outage actually occurring in the
reporting period on the APRS-enabled circuits, including the number of
affected customers on the specific network.
The number of CIs that would not have been restored without APRS in less
than 3 minutes is estimated as a percentage of the total CIs saved
For outages with a counterfactual that would not have restored supplies in
less than 3 minutes (incurring a CI) an outage duration and corresponding
CML impact is conservatively assumed at 4 minutes.

Environment and Innovation Commentary
28
General
For each of the solutions please explain:
In detail what the solution is, linking to external documents where
necessary.
How this is being used, and how it is delivering benefits.
What the volume unit is and what you have counted as a single unit.
How each of the impacts have been calculated, including what
assumptions have been relied upon.
What is the solution?
The Automated Power Restoration System (APRS) is a module of PowerOn. It is
an algorithm triggered when an ‘unexpected’ open is received via SCADA where it
is deployed. The Algorithm traces the circuit, polls SCADA on circuit, identifies
fault from FPIs and or Protection devices. It uses the current running conditions,
isolates identified fault, restores healthy network after checking loads.
How is the solution being used?
APRS is currently been applied on the 11kV & 6.6kV network in all three UK
Power Network’s licences.
How is the solution delivering benefits?
CI Impact
CI’s are reduced by enabling the control system to restore suppliers in less than 3
minutes by automatically fault switching via SCADA , in many cases faster than a
human operator.
CML Impact
For those outage events where CIs are saved, there is a corresponding
improvement in CMLs due to the longer restoration time that would have
occurred without the APRS solution.
What is the volume unit and what has been counted as a single unit?
Addition Unit: “1 APRS scheme, or instance of the algorithm, commissioned on
the distribution network”
Disposal Unit: 1 APRS scheme decommissioned.
CI Impact
The volume unit for CI is “1 interruption per 100 customers”
CML Impact
The volume unit for CML is “1 minute lost”
How have each of the impacts been calculated?
Impacts have been calculated as CI and CML reduction benefits. See the
“Calculation of Benefits” section below.
What assumptions have been relied upon?
See the “Calculation of Benefits” box below for details of the calculation

Environment and Innovation Commentary
29
methodology and assumptions.
Use of the RIIO-ED1 CBA Tool
DNOs should use the latest version of the RIIO-ED1 CBA Tool for each solution
reported in the Regulatory Year under report. Where the RIIO-ED1 CBA Tool
cannot be used to justify a solution, DNOs should explain why and provide
evidence for how they have derived the equivalent figures for the worksheet. The
most up-to-date CBA for each solution reported in the Regulatory Year under
report which are used to complete the worksheet must be submitted.
The standard RIIO-ED1 CBA Tool has been used.
Changes to CBAs
If, following an update to the CBA used to originally justify the activity in column
C, the updated CBA shows a negative net benefit for an activity, but the DNO
decides it is in the best interests of consumers to continue the activity, the DNO
should include an explanation of what has changed and why the DNO is
continuing the activity.
No changes to the Ofgem CBA template have been made.
Calculation of benefits
Explain how the benefits have been calculated, including all assumptions used
and details of the counterfactual scenario against which the benefits are
calculated.
Counterfactual
Now based on less than 3 minute restoration performance (CIs saved) in the last
3 years. 2014 – 2015 used as baseline
CI Impact
The benefit is calculated as the reduction in number of customers interrupted per
100 customers using the solution compared to not using the solution for each
specific outage. (Number of customers interrupted per 100 customers, ∆ between
counterfactual and baseline) x £/interruption
The percentage of APRS interventions that could otherwise have been prevented
from incurring CIs through traditional means is assumed to be as outlined below.
This is based on a sample of 180 events in LPN taken in 2015/16.
a. LPN: 25%
b. SPN: 25%
c. EPN: 25%
CML Impact
The benefit is calculated as the reduction in Customer Minutes Lost using APRS
compared to not using ARPS for each specific outage. Customer minutes lost (∆
between counterfactual and baseline) x £/minute. A minimum 4 minutes outage
is conservatively assumed for those events reported where CMLs were avoided.
Cost: Ongoing and Investment

Environment and Innovation Commentary
30
The costs are captured as the APRS deployment project costs, including
development, testing, deployment of the software solution and license costs.
Cost benefit analysis additional information
Please include a reference to the file name and location of any additional relevant
evidence submitted to support the costs and benefits inputted into this
worksheet. This should include the most recent CBA for each solution reported in
the Regulatory Year under report.
Automated Power Restoration System_2016-17 E6 CBA_v1.0
CNAIM (ARP)
Allocation and estimation methodologies: detail any estimations, allocations
or apportionments to calculate the numbers submitted.
Benefits are only calculated when there is sufficient data (i.e. if there is no data
life expectancy for 2010/11 or 2014/15 then benefits aren’t calculated.
It is assumed that assets whose current life at the time of the introduction of
Asset Risk Prioritisation (ARP) is within 1 standard deviation of the average life
will not be impacted by the solution. This removes assets that are already at the
end of the useful life at the time of the introduction of ARP from being included in
the benefits as it is unlikely that ARP would extend their lives.
It is assumed that there are 3 parts to the profile of replacements. These are as
follows:
a) Where the number of replacements follows the baseline profile
b) Where the number of replacements is zero (because they are deferred)
c) Where the number of replacements follows the evaluation case profile with
the extended lifespan of assets.
The modelling assumes all assets are replaced, none are disposed of.
General
For each of the solutions please explain:
In detail what the solution is, linking to external documents where
necessary.
How this is being used, and how it is delivering benefits.
What the volume unit is and what you have counted as a single unit.
How each of the impacts have been calculated, including what
assumptions have been relied upon.
What is the solution?
The introduction in ED1 of the Common Network Asset Indices Methodology
(CNAIM) for DNOs to report information relating to asset health and criticality
provides the capability to trade off the financial and technical consequences of
future decisions to replace assets, refurbish assets or introduce an enhanced
maintenance regime.

Environment and Innovation Commentary
31
Are there any external documents to link to?
DNO COMMON NETWORK ASSET INDICES METHODOLOGY - Health & Criticality -
Version 1.1
(30/01/2017 )
How is the solution being used?
UK Power Networks is considered to be actively managing a pool of health indices
4 and 5 assets which are closer to service failure than may be the case for other
DNOs with different asset replacement methodologies where assets could
potentially be retired too early.
The CNAIM models are another example of modelling innovation. These models
use a combination of information relating to an asset’s age, environment, duty
and specific condition and performance information to calculate network risk. This
can inform investment decisions as to when an asset requires intervention
(replacement, refurbishment, retrofit or other appropriate action) and how to
prioritise the order of such interventions to ensure value for money.
How is the solution delivering benefits?
Gross Avoided Costs
Costs of replacement are deferred as the life of assets is increased.
What is the volume unit and what has been counted as a single unit?
Gross Avoided Costs
Avoided Replacement Costs – The volume unit for Avoided Replacement Cost is 1
asset.
How have each of the impacts been calculated?
The impacts are considered jointly with benefits in the “Calculation of Benefits”
box below.
What assumptions have been relied upon?
The assumptions behind the impacts are considered jointly with benefits in the
“Calculation of Benefits” box below.
Use of the RIIO-ED1 CBA Tool
DNOs should use the latest version of the RIIO-ED1 CBA Tool for each solution
reported in the Regulatory Year under report. Where the RIIO-ED1 CBA Tool
cannot be used to justify a solution, DNOs should explain why and provide
evidence for how they have derived the equivalent figures for the worksheet. The
most up-to-date CBA for each solution reported in the Regulatory Year under
report which are used to complete the worksheet must be submitted.
The standard RIIO-ED1 CBA Tool has been used.

Environment and Innovation Commentary
32
Changes to CBAs
If, following an update to the CBA used to originally justify the activity in column
C, the updated CBA shows a negative net benefit for an activity, but the DNO
decides it is in the best interests of consumers to continue the activity, the DNO
should include an explanation of what has changed and why the DNO is
continuing the activity.
No changes to the CBA template have been made
Calculation of benefits
Explain how the benefits have been calculated, including all assumptions used
and details of the counterfactual scenario against which the benefits are
calculated.
Counterfactual
The counterfactual assumed is the based on the assumed lifespan of assets prior
to the implementation of CNAIM modelling in 2016.
Gross Avoided Costs
The benefit is calculated as the sum the deferred costs of replacement of assets
for all assets modelled by CNAIM.
Assumptions: It is assumed that only assets younger than 1 standard deviation of
age less than the average age are impacted by this solution. This removes the
benefits from assets already at the end of their useful life.
Cost:
Costs reported for the reporting period are calculated using the UK Power
Networks ED1 asset specific unit cost allowances ( CV3) and the population of
assets aged beyond the CNAIM-based life expectancy.
Cost benefit analysis additional information
Please include a reference to the file name and location of any additional relevant
evidence submitted to support the costs and benefits inputted into this
worksheet. This should include the most recent CBA for each solution reported in
the Regulatory Year under report.
CNAIM (ARP)_2016-17 E6 CBA_v1.0
Demand Side Response
Allocation and estimation methodologies: detail any estimations, allocations
or apportionments to calculate the numbers submitted.
The following section details the high level assumptions made in the calculations
for this solution.
The solution has been implemented on a substation within UKPN’s EPN
network.

Environment and Innovation Commentary
33
The approach to calculating Totex is to refer to the Submission Asset
Management Plan for the baseline Totex and the Current Asset
Management Plan forecast for the evaluation Totex. This allows the
evaluation case to consider changes to both expenditure levels and timing
of reinforcement due to DSR deployment as opposed to the alternate
approach of time-shifting the baseline Totex to derive the evaluation
Totex.
Within the CBA, where actual cost data is available (i.e. for the current
reporting year) the model overwrites forecast expenditure in the
evaluation case.
General
For each of the solutions please explain:
In detail what the solution is, linking to external documents where
necessary.
How this is being used, and how it is delivering benefits.
What the volume unit is and what you have counted as a single unit.
How each of the impacts have been calculated, including what
assumptions have been relied upon.
What is the solution?
Demand Side Response (DSR) can be delivered either from a reduction in
demand from demand customers, or by generators generating for a contracted
period. It can address occasional shortfalls in capacity on the network and
thereby avoid reinforcement.
The solution is qualified as an innovative solution as it was developed through UK
Power Networks’ LCNF Tier 2 funded project “Low Carbon London”.
Are there any external documents to link to?
http://innovation.ukpowernetworks.co.uk/innovation/en/research-area/demand-
side-response/
How is the solution being used?
The solution has been developed through a number of UK Power Networks
innovation projects and is now integrated into business as usual for deployment.
Low Carbon London – trial program that contracted with industrial and
commercial (I&C) customers to reduce their peak loads (through either
reducing demand or using local generation) in exchange for payments and
also deployed a dynamic time-of-use (ToU) tariff with early smart
metering customers.
Smarter Network Storage – LCNF-funded project that is demonstrating
a multi-purpose application of 6MW/10MWh of energy storage at Leighton
Buzzard primary substation.
Vulnerable Customers and Energy Efficiency – UKPN is trialing DSR
and service improvement opportunities with vulnerable customers through
specialised ToU tariffs
How is the solution delivering benefits?

Environment and Innovation Commentary
34
The solution delivers benefits by reducing load on the system during peak hours,
thus allowing UKPN to avoid or defer reinforcement projects.
What is the volume unit and what has been counted as a single unit?
Addition Unit: “deployment of 1 DSR scheme”
Disposal Unit: “cancellation of 1 DSR scheme”
Benefit Categories:
The volume unit for Total MVA Released is: “1 MVA of capacity released”
The volume unit for Gross Avoided Costs is: “£ of deferred cost”
Cost Categories:
The volume unit for solution Costs is: “£ of deployment cost”. In the previous
submission, the timing of the DSR service contract milestones resulted in no
invoiced costs being incurred in the first year of deployment. In this submission
no DSR service costs has been incurred. DSR service costs for the reported
scheme will be included in the next reporting year.
How have each of the impacts been calculated?
The impacts are considered jointly with benefits in the “Calculation of Benefits”
box below.
What assumptions have been relied upon?
The assumptions behind the impacts are considered jointly with benefits in the
“Calculation of Benefits” box below.
Use of the RIIO-ED1 CBA Tool
DNOs should use the latest version of the RIIO-ED1 CBA Tool for each solution
reported in the Regulatory Year under report. Where the RIIO-ED1 CBA Tool
cannot be used to justify a solution, DNOs should explain why and provide
evidence for how they have derived the equivalent figures for the worksheet. The
most up-to-date CBA for each solution reported in the Regulatory Year under
report which are used to complete the worksheet must be submitted.
The standard RIIO-ED1 CBA Tool has been used.
Changes to CBAs
If, following an update to the CBA used to originally justify the activity in column
C, the updated CBA shows a negative net benefit for an activity, but the DNO
decides it is in the best interests of consumers to continue the activity, the DNO
should include an explanation of what has changed and why the DNO is
continuing the activity.
No changes to the CBA template have been made

Environment and Innovation Commentary
35
Calculation of benefits
Explain how the benefits have been calculated, including all assumptions used
and details of the counterfactual scenario against which the benefits are
calculated.
Benefit: MVA Released
The benefit is calculated as the amount of MVA released using the summation of
the DSR contracted from each DSR service provider against each supported
network site.
Benefit: Gross Avoided Costs
The benefit is calculated as the amount of Gross Avoided Cost is calculated by
summing the costs of the avoided reinforcement projects as a result of the
solution.
The CBA model will include apportioned costs across the UK Power Networks
forecast RIIO-ED1 DSR programme:
Cost: Total Program Implementation Cost
The cost of implementing the program (system and process change related) is
considered in total.
Cost: Initial Substation Monitoring and Contract Telecom Cost
The initial cost of monitoring substations implemented with DSR solutions. This is
calculated as the initial substation monitoring and contract telecom cost per DSR
solution x the number of DSR solutions implemented.
Cost: Ongoing Substation Monitoring and Contract Telecom Cost
The ongoing cost of monitoring substations implemented with DSR solution. This
is calculated as the ongoing substation monitoring and contract telecom cost per
DSR solution x the number of DSR solutions implemented.
Counterfactual
The counterfactual is the case where the innovative solution is not implemented
and the existing, traditional reinforcement is deployed at full cost. MVA released
will be reported as a gross figure, not the net difference between MVA released by
the innovative and traditional solutions.
Cost benefit analysis additional information
Please include a reference to the file name and location of any additional relevant
evidence submitted to support the costs and benefits inputted into this
worksheet. This should include the most recent CBA for each solution reported in
the Regulatory Year under report.
Demand Side Response_2016-17 E6 CBA_v1.0

Environment and Innovation Commentary
36
Distribution Network Visibility (DNV)
Allocation and estimation methodologies: detail any estimations, allocations
or apportionments to calculate the numbers submitted.
All investment costs incurred prior to this regulatory year, hence no
investment costs are reported in 2016/17.
The baseline Totex has been calculated based on the below:
The London Power Networks (LPN) Distribution Planning department have quoted
that on average they save 8hrs/week on new connection referral assessments
using the DNV application. The baseline scenario therefore assumes the without
the application, the Planners would have to spend 8hrs more per week on
referrals.
To calculate the cost of the extra worked hours, the hourly rate for the
LPN planners has been used (source: UK Power Networks’ Finance
department) and the number of working days within 2016/17.
General
For each of the solutions please explain:
In detail what the solution is, linking to external documents where
necessary.
How this is being used, and how it is delivering benefits.
What the volume unit is and what you have counted as a single unit.
How each of the impacts have been calculated, including what
assumptions have been relied upon.
What is the solution?
The DNV application is a web-based application that enables the integration of
multiple data sources (including Ellipse, PowerOn Fusion, analogues outputs from
secondary and primary RTUs, weather stations etc.), and makes it available to
users through an easy to use visual interface.
Links to external documents:
i) Link to close down report for the Distribution Network Visibility project through
which the application was developed:
http://www.smarternetworks.org/Files/Distribution_Network_Visibility_17020114
3749.pdf
ii) Link to the registration document for the Distribution Network Visibility project
through which the application was developed:
http://www.smarternetworks.org/Files/Distribution_Network_Visibility_13011611
3540.xls
How is the DNV application being used?
The DNV application has been used as business as usual since late 2012, early
2013. It is primarily used to inform network planning decisions and proactively
manage UK Power Networks’ distribution network.

Environment and Innovation Commentary
37
How is the DNV application delivering benefits?
The DNV application has delivered several benefits to date. It is used by UK
Power Networks’ Distribution Planners to assess connection referrals and it saves
them approximately 8hrs/week.
Benefits not reported in 2016/17 as realised in past years:
It is also used to proactively manage UK Power Networks’ distribution network.
Benefits were realised in past years from identifying early problems at primary
substations by spotting high voltages at secondary substations supplied by these
primary substations.
The DNV application has also been informing planning decisions. In two historic
cases, the DNV application provided enough information to prevent network
reinforcement triggered by Maximum Demand Indicator readings.
What is the volume unit and what has been counted as a single unit?
Units for Additions / Disposals: N/A to this solution as DNV is a process-based
initiative.
Benefits Categories
The volume unit is “the cost of 1 LPN Distribution Planner man-hour (hourly
rate)” spent on assessing connection referrals.
Single unit in this case is “1 man-hour saved” by a LPN Distribution Planner using
the DNV application.
Cost Categories
Not applicable for this year’s submission as no costs incurred in 2016/17.
How has each of the impacts been calculated?
The impacts are considered jointly with benefits in the “Calculation of Benefits”
box below.
What assumptions have they been relied upon?
The assumptions behind the impacts are considered jointly with benefits in the
“Calculation of Benefits” box below.
Use of the RIIO-ED1 CBA Tool
DNOs should use the latest version of the RIIO-ED1 CBA Tool for each solution
reported in the Regulatory Year under report. Where the RIIO-ED1 CBA Tool
cannot be used to justify a solution, DNOs should explain why and provide
evidence for how they have derived the equivalent figures for the worksheet. The
most up-to-date CBA for each solution reported in the Regulatory Year under
report which are used to complete the worksheet must be submitted.
The standard RIIO-ED1 CBA Tool has been used.
Environment and Innovation Commentary
38
Changes to CBAs
If, following an update to the CBA used to originally justify the activity in column
C, the updated CBA shows a negative net benefit for an activity, but the DNO
decides it is in the best interests of consumers to continue the activity, the DNO
should include an explanation of what has changed and why the DNO is
continuing the activity.
No changes to the CBA template have been made
Calculation of benefits
Explain how the benefits have been calculated, including all assumptions used
and details of the counterfactual scenario against which the benefits are
calculated.
Benefit: Labour Cost Savings
The benefit was calculated as follows:
1. The main DNV application users (LPN Distribution Planners) were
contacted and quoted that as a team the DNV application saves them
8hrs/week on average when assessing new connection referrals.
8hrs/week equals 1.6hrs/working day.
2. The number of working days in 2016/17 were then calculated (days with
the regulatory year excluding bank holidays and weekends). Based on the
number of working days within the regulatory year and the number of
hours/working day saved by using the DNV application, the total number
of hours saved within the year was calculated.
3. The hourly rate for the LPN Distribution Planners was then used to
quantify benefits in financial terms. Using the rate and total hours saved
within the regulatory year, the total labour costs savings realised in
2016/17 were calculated.
Counterfactual Scenario
The counterfactual scenario assumes that the LPN Distribution Planners assess
connection referrals in the conventional way, without the use of the DNV
application. In this case, they would have to spend on average 8hrs/week more
on assessing new connection referrals.
Cost benefit analysis additional information
Please include a reference to the file name and location of any additional relevant
evidence submitted to support the costs and benefits inputted into this
worksheet. This should include the most recent CBA for each solution reported in
the Regulatory Year under report.
DNV_2016-17 E6 CBA_v1.0

Environment and Innovation Commentary
39
Energy Storage (SNS)
Allocation and estimation methodologies: detail any estimations, allocations
or apportionments to calculate the numbers submitted.
The following section details the high level assumptions made in the calculations
for this solution.
Operating Costs and Revenue:
Operating costs and revenue have been extrapolated out to 15 years,
operating from 2016 to 2030 regulatory year based on latest year of
actuals data. This time period reflects the upper bound estimate of the life
of the storage asset.
Ancillary services revenue treated as a reduction of ongoing storage
operating costs.
Actual operating costs and revenues up to March 2017; the rest is a
forecast of enduring costs and revenues.
Deferred Reinforcement Expenditure:
Leighton Buzzard project defers need for reinforcement investment and
associated O&M costs by 6 years.
Storage Analysis:
MVA release timing aligned with start of ancillary services revenue and
storage operating costs. MVA release reported once, not ongoing to be
consistent with CBA guidance document.
CO2 emission reduction associated with a 6MW storage facility was sourced
from Poyry emissions model. See Appendix G - Cost Benefit Analysis
vFinal2 (RE-SUBMISSION, Clean) p.6.
General
For each of the solutions please explain:
In detail what the solution is, linking to external documents where
necessary.
How this is being used, and how it is delivering benefits.
What the volume unit is and what you have counted as a single unit.
How each of the impacts have been calculated, including what
assumptions have been relied upon.
What is the solution?
This solution involves the deployment of utility-scale batteries for providing
ancillary services (i.e. load following) as well as peak loping to reduce distribution
reinforcement need. The implementation of this solution is being considered
under two mechanisms: (1) enrolment of a third party storage device in DSR
program or (2) deployment of a UKPN-owned device onto the distribution system.
Batteries used for bulk storage (i.e. load shifting) are separate from this solution
and should instead be included in the DSR solution line item.
Are there any external documents to link to?
• Project Funding Submission Bid
http://innovation.ukpowernetworks.co.uk/innovation/en/Projects/tier-2-

Environment and Innovation Commentary
40
projects/Smarter-Network-Storage-(SNS)/Project-
Documents/SNS+Full+Re-Submission+Proforma+%28Clean%29.pdf
How is the solution being used?
A 6MW energy storage device has been implemented at one primary substation
(Leighton Buzzard to defer reinforcement schemes).
How is the solution delivering benefits?
This solution delivers the following benefits: the deferral of reinforcement
projects, MVA, and avoided CO2 emissions as a result of increased network
flexibility utilisation.
What is the volume unit and what has been counted as a single unit?
Addition Unit: “1 storage unit commissioned on network”
Disposal Unit: “1 storage unit decommissioned from network”
Benefit Categories:
The volume unit for Total MVA released is: “1 MVA released”
The volume unit for Gross Avoided Cost is: “£ of deferred cost”
The volume unit for Avoided Emissions is: “tonnes CO2 emissions avoided from
one 6MW storage unit”
Cost Categories:
The volume unit for Trial Cost is: “1 trial project”
The volume unit for Ongoing O&M costs is: “1 trial project”
How have each of the impacts been calculated?
The impacts are considered jointly with benefits in the “Calculation of Benefits”
box below.
What assumptions have been relied upon?
The assumptions behind the impacts are considered jointly with benefits in the
“Calculation of Benefits” box below.
Use of the RIIO-ED1 CBA Tool
DNOs should use the latest version of the RIIO-ED1 CBA Tool for each solution
reported in the Regulatory Year under report. Where the RIIO-ED1 CBA Tool
cannot be used to justify a solution, DNOs should explain why and provide
evidence for how they have derived the equivalent figures for the worksheet. The
most up-to-date CBA for each solution reported in the Regulatory Year under
report which are used to complete the worksheet must be submitted.
The standard RIIO-ED1 CBA Tool has been used.

Environment and Innovation Commentary
41
Changes to CBAs
If, following an update to the CBA used to originally justify the activity in column
C, the updated CBA shows a negative net benefit for an activity, but the DNO
decides it is in the best interests of consumers to continue the activity, the DNO
should include an explanation of what has changed and why the DNO is
continuing the activity.
No changes to the CBA template have been made
Calculation of benefits
Explain how the benefits have been calculated, including all assumptions used
and details of the counterfactual scenario against which the benefits are
calculated.
Counterfactual
It is assumed in the counterfactual that without energy storage devices on the
distribution network, UKPN proceeds with plans to implement reinforcement
projects where necessary.
MVA Released
The benefit is calculated as the amount of MVA released based on the summation
of MVA rating of the storage device installed at the Leighton Buzzard primary
substation.
Gross Avoided Costs
The benefit is calculated as the amount of Gross Avoided Cost is calculated by
summing the costs of the avoided reinforcement projects as a result of the
solution.
Emissions Impact
The benefit is the amount of emissions avoided as a result the displacing
traditional generation from peaking plants and reducing curtailment of renewable
generation. This value is determined from a Poyry study that determines the
annual CO2 emissions benefit from a storage device such as the device installed
at Leighton Buzzard.
Trial Cost:
The total cost of running the SNS trial program is determined from the
summation of Labour, Equipment, Contractor, IT, Travel & Expenses, Contingency
and Other Trial costs from the start to the end of the trial program (2013-2017).
Ongoing Cost:
The ongoing cost of operating and maintaining the storage device at Leighton
Buzzard. This is calculated as the ongoing operating cost per annum minus
ancillary services revenue per annum. Asset life assumed to be 15 years from
2016 (when the storage unit is fully operational) to end of 2030 regulatory year.
Environment and Innovation Commentary
42
Cost benefit analysis additional information
Please include a reference to the file name and location of any additional relevant
evidence submitted to support the costs and benefits inputted into this
worksheet. This should include the most recent CBA for each solution reported in
the Regulatory Year under report.
Energy Storage_2016-17 E6 CBA_v1.0
Flex DG Connections
Allocation and estimation methodologies: detail any estimations, allocations
or apportionments to calculate the numbers submitted.
The methodology for determining costs where the non-contestable portion
of the connection work was completed by UK Power Networks is as
follows: Where connection costs were for the non-contestable portion of
the connection work only, the connection work was subject to tender and
serviced by an alternate provider. Total costs were provided for about 15
connections from 2016. Using these total figures, an average ratio of
Flexible Distributed Generation (FDG) to BAU costs (about 18%) was
determined. This ratio was then applied to all non-contestable costs
figures, whether for BAU or FDG connection, in order to estimate the total
connection cost.
Reduction in output should vary by connection. However, in lieu of data,
3.13% is assumed for all connections.
Annual production estimates were derived using the nameplate capacity of
each connection multiplied by 8760 hours multiplied by capacity factors
referenced off Flexible Plug & Play (FPP) SDRC 9.7. Wind – 30%, PV –
11.6%, CHP – 100%
A power factor of 0.95 was used to convert nameplate capacity (in MW) to
MVA.
Emissions conversion factor: 0.41205 tCO2e per MWh generated
(Government Greenhouse Gas Reporting Conversion Factors 2016)
1007 tCO2e avoided per annum per MW of CHP installed (POWERFuL-CB NIC Full
Bid Submission Benefits Calculation, prepared by Navigant Consulting)
General
For each of the solutions please explain:
In detail what the solution is, linking to external documents where
necessary.
How this is being used, and how it is delivering benefits.
What the volume unit is and what you have counted as a single unit.
How each of the impacts have been calculated, including what
assumptions have been relied upon.
What is the solution?
A technical and commercial agreement where customers’ DG devices are subject
to temporary UKPN control to reduce power export in order to ensure network
voltages and currents are kept within operational limits. This solution is required
when the network is experiencing reverse power issues. Flexible Distributed
Generation – Connections (FDG-C is) operated by an Active Network Management

Environment and Innovation Commentary
43
(ANM) solution, and is open on the basis of Last-In, First-out (LIFO) principle –
each generator is assigned a position within a global priority stack. When new
generators apply for a connection in the area, they are given a position at the
bottom of the priority stack and are curtailed first during a constraint event. This
solution was initially implemented through UKPN's "Flexible Plug & Play" Program.
The Business as usual solution deployed is now called Flexible Distributed
Generation (FDG)
Are there any external documents to link to?
https://www.gov.uk/government/publications/greenhouse-gas-reporting-
conversion-factors-2016
FDG High Level Process:
http://www.ukpowernetworks.co.uk/internet/en/our-
services/documents/FDG_high_level_process(Jan-17).pdf
FDG FAQs: http://www.ukpowernetworks.co.uk/internet/en/our-
services/documents/FDG_FAQs_v0.4.pdf
LIFO Connection Agreement:
http://www.ukpowernetworks.co.uk/internet/en/our-
services/documents/PR_CN_FLEX_002X_Connection_Agreement_-
_FDG%20LIFO_-_01122016.pdf
How is the solution being used?
The solution is being used to connect DG customers to the grid through a lower
connection cost that allows for these customers to be curtailed at times of
network stress. Without FDG-C, these customers would only have had the option
of a more expensive traditional connection costs that allow for the cost of the
reinforcement projects that may be required to connect the customer to the
network. The FDG-C also has a shorter lead time and allows DG customers to
connect to the network earlier (by 29 weeks on average).
How is the solution delivering benefits?
General Comment:
Potentially as a result of changes to the feed-in tariff, the update of distributed
generation has slowed considerably. This year, only 2 flexible DG connections
were installed, compared to 6 the year before. As such, the quantity of benefits
delivered through FDG has been lower in the 2016/17 year than it was in
2015/16.
Gross Avoided Costs:
Avoided Connection Costs – this assumes a counterfactual where all DG that has
connected under a flexible DG connection agreement would have connected
through a more expensive traditional connection agreement in the absence of a
flexible DG connection alternative. The benefit is that consumers are able to
connect their DG to the network through a much lower connection cost.
MVA Connected:
MVA reduction – this assumes a counterfactual where no DG that has connected
under a flexible DG connection agreement would have connected through a more
expensive traditional connection agreement in the absence of a flexible DG
connection alternative. By enabling this DG generation to connect to the network,
MVA is released.

Environment and Innovation Commentary
44
The total renewables connected due to FDG connections in the 2016/17
regulatory year is 9.5 MVA.
These values have not been included in the E6 table as these relate to specific
customer connections, not a release of capacity available to the market..
Emissions Impact
Avoided Emissions – this assumes a counterfactual where all DG that has
connected under a flexible DG connection agreement would have connected
through a more expensive traditional connection agreement in the absence of a
flexible DG connection alternative. The benefit is the amount of emissions saved
as a result of being able to connect these DG consumers on average 29 weeks
earlier.
Avoided Emissions – this assumes a counterfactual where no DG that has
connected under a flexible DG connection agreement would have connected
through a more expensive traditional connection agreement in the absence of a
flexible DG connection alternative. This benefit is for the savings in emissions as a
result of the DG connecting that would not have connected in the counterfactual.
The overall emissions this year are also lower - as was the overall number of
schemes energised in the year – though one of the flexible DG connections was
for a CHP with a much higher total energy output assumed due to its dispatchable
nature.
What is the volume unit and what has been counted as a single unit?
Addition Unit: “1 Flexible DG connection energised”
Disposal Unit: “1 Flexible DG connection decommissioned”
Benefit Categories:
The volume unit for Avoided Connection Cost is: “1 DG Connection under a
flexible connection agreement”
The volume unit for Avoided Emissions is “tCO2e”.
How have each of the impacts been calculated?
The impacts are considered jointly with benefits in the “Calculation of Benefits”
box below.
What assumptions have been relied upon?
The assumptions behind the impacts are considered jointly with benefits in the
“Calculation of Benefits” box below.
Environment and Innovation Commentary
45
Use of the RIIO-ED1 CBA Tool
DNOs should use the latest version of the RIIO-ED1 CBA Tool for each solution
reported in the Regulatory Year under report. Where the RIIO-ED1 CBA Tool
cannot be used to justify a solution, DNOs should explain why and provide
evidence for how they have derived the equivalent figures for the worksheet. The
most up-to-date CBA for each solution reported in the Regulatory Year under
report which are used to complete the worksheet must be submitted.
The standard RIIO-ED1 CBA Tool has been used.
Changes to CBAs
If, following an update to the CBA used to originally justify the activity in column
C, the updated CBA shows a negative net benefit for an activity, but the DNO
decides it is in the best interests of consumers to continue the activity, the DNO
should include an explanation of what has changed and why the DNO is
continuing the activity.
No changes to the CBA template have been made
Calculation of benefits
Explain how the benefits have been calculated, including all assumptions used
and details of the counterfactual scenario against which the benefits are
calculated.
Counterfactual 1:
All DG that has connected under a flexible DG connection agreement would have
connected through a more expensive traditional connection agreement in the
absence of a flexible DG connection alternative.
Gross Avoided Costs
Avoided Connection Costs – Consumers are able to connect their DG to the
network through a much lower connection cost. The benefit is calculated by:
(Traditional Connection Cost – Flexible Connection Cost) x Number of DG
Connections under a Flexible connection agreement.
Counterfactual 2:
No DG that has connected under a flexible DG connection agreement would have
connected through a more expensive traditional connection agreement in the
absence of a flexible DG connection alternative.
Emissions Impact
Avoided Emissions – The benefit is the amount of emissions saved as a result of
being able to connect these DG consumers. This is calculated as MWh Produced *
(1 + % T&D Losses) * Emissions Rate * 1 year, for each DG connection.

Environment and Innovation Commentary
46
Cost benefit analysis additional information
Please include a reference to the file name and location of any additional relevant
evidence submitted to support the costs and benefits inputted into this
worksheet. This should include the most recent CBA for each solution reported in
the Regulatory Year under report.
Flex DG Connections_2016-17 E6 CBA_v1.0
FUN-LV
Allocation and estimation methodologies: detail any estimations, allocations
or apportionments to calculate the numbers submitted.
The following section details the high level assumptions made in the calculations
for this solution:
The reinforcement solution was assumed to occur based on the load growth
forecasts predicted by the Element Energy model.
Assume that conventional reinforcement is required in the year where
Method Costs are incurred i.e. 2015/2016. In reality the majority of sites
were not sufficiently constrained to require immediate reinforcement but
were highly loaded to demonstrate the impact of the project methods.
Method Costs are those estimated from the trial and therefore are higher
than expected for any future replication.
The only schemes included in the E6 reporting are those determined to be
capable of continuous operations and providing net financial benefits (this
relates to a subset of 13 from the original 36 trial schemes).
General
For each of the solutions please explain:
In detail what the solution is, linking to external documents where
necessary.
How this is being used, and how it is delivering benefits.
What the volume unit is and what you have counted as a single unit.
How each of the impacts have been calculated, including what
assumptions have been relied upon.
What is the solution?
The overarching aim of the Flexible Urban Networks – Low Voltage (FUN-LV)
project was to explore the use of power electronics to enable the deferment of
reinforcement and facilitate the connection of low carbon technologies and
distributed generation in urban areas. This was achieved by meshing existing
networks, which are not meshed, and by breaking down boundaries within
existing meshed networks.
The FUN-LV project trials demonstrated three different methods with increasing
levels of capacity sharing functionality. Method 1 (M1) used remote control Circuit
Breakers and Link Box Switches developed by TE Connectivity and supplied under
licence by EA Technology Ltd. The Link Box Switch replaces a solid link in the link
box. This equipment joins substations together providing uncontrolled levels of
current flow. This equipment was already approved for use on the LV network.
However, joining two radial circuits required an additional tripping unit, which
monitored reverse power flow through the transformer, to send a trip signal to
the circuit breakers should a HV fault or transformer fault occur to prevent

Environment and Innovation Commentary
47
continued fault current flow from the donor circuit.
Method 2 (M2) and Method 3 (M3) consist of two or three back-to-back power
inverters, respectively, with a common DC busbar. The inverters were controlled
by an autonomous control system (developed by project partner Imperial College
London) that takes measurements from various points in the system and
calculates the level of power flow required across the DC busbar. Each inverter is
able to import or export real and reactive power between different AC LV
networks and the DC busbar, dependent on how the inverter is switched. M1 and
M3 are installed within distribution substations whereas M2 is installed as a piece
of street furniture.
Link to external documentsDetails of the solution are illustrated on the
project innovation site. The methodology is outlined well in the Close
Down, SDRC 9.2 and SDRC 9.4 reports.
http://innovation.ukpowernetworks.co.uk/innovation/en/Projects/tier-2-
projects/Flexible-Urban-Networks-Low-Voltage/
How is the solution being used?
The three trial Methods are being used to mesh previously radial or
interconnected networks. The FUN-LV methods were trialled in 36 installations in
London and Brighton. Twelve installations of each of the three methods was
demonstrated across three different network types:
1. London Radial LV networks
2. London Interconnected LV networks
3. Brighton Radial LV networks.
How is the solution delivering benefits?
The primary benefit arising from the solution is the ability to defer and reduce the
need for network reinforcement by making use of neighbouring substations with
spare capacity. This results from transferring power between substations to
balance loads and release MVA headroom.
Secondary potential benefits for the technology that are not captured in this
report include:
- Controlling fault levels on the network through the use of power electronics
and thereby meshing the network whilst protecting assets;
- Controlling voltage to ensure continued compliance with standards and reduce
losses;
- Collecting granular information on the performance of the LV network;
- Providing a network upgrade option with fewer logistical and disruption issues
for customers (e.g. reduced carriageway works and road closures); and
- Providing capacity in a shorter timescale for new connections and reconnection
following building redevelopment.
What is the volume unit and what has been counted as a single unit?
Categories:
The volume unit for Total MVA Released is: “1 MVA of capacity released”
The volume unit for Baseline and Evaluation Totex is: “£m of deferred cost”
The volume unit for additions is: “one FUN-LV scheme”
How have each of the impacts been calculated?

Environment and Innovation Commentary
48
Impacts have been calculated as load-related investment reduction or deferral
and in capacity released. See the “Calculation of Benefits” section below.
What assumptions have been relied upon?
See the “Calculation of Benefits” box below for details of the calculation
methodology and assumptions.
Use of the RIIO-ED1 CBA Tool
DNOs should use the latest version of the RIIO-ED1 CBA Tool for each solution
reported in the Regulatory Year under report. Where the RIIO-ED1 CBA Tool
cannot be used to justify a solution, DNOs should explain why and provide
evidence for how they have derived the equivalent figures for the worksheet. The
most up-to-date CBA for each solution reported in the Regulatory Year under
report which are used to complete the worksheet must be submitted.
The standard RIIO-ED1 CBA Tool has been used.
Changes to CBAs
If, following an update to the CBA used to originally justify the activity in column
C, the updated CBA shows a negative net benefit for an activity, but the DNO
decides it is in the best interests of consumers to continue the activity, the DNO
should include an explanation of what has changed and why the DNO is
continuing the activity.
No changes to the CBA template have been made
Calculation of benefits
Explain how the benefits have been calculated, including all assumptions used
and details of the counterfactual scenario against which the benefits are
calculated.
Benefit: MVA Released
The benefit is calculated as the amount of MVA released using the summation of
MVA released for each site with FUN-LV methods installed. The amount of MVA
released is equal to the additional apparent power headroom created through
transformer equalisation (matching % utilisation) on the connected substations.
Cost: Baseline Totex
The total cost of the counterfactual solution to connect additional capacity of
200kVA, 240kVA or 400kVA (equivalent to Method 1, Method 2 or Method 3
respectively).
Cost: Evaluation Totex
The total cost of installing FUN-LV Methods to each site in addition to traditional
reinforcement after the number of years of deferral.
Years of Deferral
The number of years that a reinforcement can be deferred is calculated according
to the current headroom divided by the assumed annual load growth for the
secondary substation in line with Element Energy model.
Headroom

Environment and Innovation Commentary
49
The amount of capacity available in a scheme before exceeding the rating of
connected transformers, for distribution transformers this is 120% (radial) and
80% (interconnected) of the name plate rating.
Counterfactual
The counterfactual is the case where the innovative solution is not implemented
and the minimum traditional reinforcement is to achieve the required additional
capacity.
Cost benefit analysis additional information
Please include a reference to the file name and location of any additional relevant
evidence submitted to support the costs and benefits inputted into this
worksheet. This should include the most recent CBA for each solution reported in
the Regulatory Year under report.
FUNLV_2016-17 E6 CBA_v1.0
Innovative Bunding
Allocation and estimation methodologies: detail any estimations, allocations
or apportionments to calculate the numbers submitted.
It has been assumed that for every 1000kg of excavation avoided by the
innovative solution has led to a saving of 2kg of CO2e. This is noted in the DEFRA
emission guidelines.
It has been conservatively estimated that the excavation depth required with a
traditional concrete bund is 50cm.
The cost of avoiding an outage for a transformer at every site where the
Omnibund or Bundsep was installed has been estimated as follows:
Cost of a senior authorised person is £550 per day as noted in the May
2017 CU catalogue CU-LAB171-EA
Cost of a planner to arrange the outage is £43/hr CU catalogue CU-LAB146-LA
and the average time to complete an outage is 0.5 hours for a primary site and 2
hours for a grid site.
General
For each of the solutions please explain:
In detail what the solution is, linking to external documents where
necessary.
How this is being used, and how it is delivering benefits.
What the volume unit is and what you have counted as a single unit.
How each of the impacts have been calculated, including what
assumptions have been relied upon.
The solution is polymer-based bunding equipment which replaces the traditional
concrete and sump pump systems. They are introduced in EDS 07-0110
It is being used to bund large transformers in a way that costs less and results in
fewer emissions than the base case. These have been assessed and are included
in the E6 table.
Volumes

Environment and Innovation Commentary
50
Addition Units:
Omnibund volume unit: “1 Omnibund bund system installed”
Bundsep volume unit “1 Bundsep installed”
Disposal Units: Removal of “1 Omnibund bund system” or “1 bundsep”
Benefits
Cost saving: the difference between the base case and evaluation case
plus the cost of avoiding an outage at each site
Emissions saving: 2kgCO2 avoided per tonne of excavated aggregate
avoided
Cost saving: the difference between the base case and evaluation case
plus the cost of avoiding an outage at each site
Emissions saving: 2kgCO2 avoided per tonne of excavated aggregate avoided
Use of the RIIO-ED1 CBA Tool
DNOs should use the latest version of the RIIO-ED1 CBA Tool for each solution
reported in the Regulatory Year under report. Where the RIIO-ED1 CBA Tool
cannot be used to justify a solution, DNOs should explain why and provide
evidence for how they have derived the equivalent figures for the worksheet. The
most up-to-date CBA for each solution reported in the Regulatory Year under
report which are used to complete the worksheet must be submitted.
The standard RIIO-ED1 CBA Tool has been used.
Changes to CBAs
If, following an update to the CBA used to originally justify the activity in column
C, the updated CBA shows a negative net benefit for an activity, but the DNO
decides it is in the best interests of consumers to continue the activity, the DNO
should include an explanation of what has changed and why the DNO is
continuing the activity.
No changes to the CBA template have been made
Calculation of benefits
Explain how the benefits have been calculated, including all assumptions used
and details of the counterfactual scenario against which the benefits are
calculated.
Counterfactual scenario:
Cost of work: known from prior installations or installations at similar sites
Cost of outage: estimated as per section 1.
Excavation: calculated based on known average size of bund and assumed
depth of 50cm.
Evaluation scenario:
Cost: as from Service Order
Excavation: 4 inch surface dig to prepare area for each Omnibund. No
excavation for Bundsep.

Environment and Innovation Commentary
51
Cost benefit analysis additional information
Please include a reference to the file name and location of any additional relevant
evidence submitted to support the costs and benefits inputted into this
worksheet. This should include the most recent CBA for each solution reported in
the Regulatory Year under report.
Innovative Bunding _2016-17 E6 CBA_v1.0
Joint Shell
Allocation and estimation methodologies: detail any estimations, allocations
or apportionments to calculate the numbers submitted.
The cost of replacing an LV lead cable ‘T’ joint is detailed in the table included in
the “calculation of benefits” section. The cost is different in three licence areas of
UK Power Networks, the split is shown in the table below which is taken into
calculation. These costs assumptions are based on the approved internal
‘compatible units’ planning values for completing the traditional solution work.
The innovative joint shell that has been developed as part of this project will be
installed on LV joints identified to be in slightly poor condition during cable pit
inspections. The shell is designed to protect the joint from water ingress due to
cracking of the original lead casing that could potentially trigger its failure.
It is estimated the cost of putting the shell on the joints including the associated
labour cost is approximately £1100 per joint. These are based on the actual
costs incurred purchasing the materials, approved internal labour rates, and a
baseline of hours effort required. The cost is different in three licence areas, the
split between licence areas is shown in the table below and is considered in
calculation. The new shell will increase the estimated life of the joint allowing us
to defer our investment on joint replacement. It will also allow us to save costs by
not having the fault on joints, saving on CIs and CMLs and improving public
health and safety.
General
For each of the solutions please explain:
In detail what the solution is, linking to external documents where
necessary.
How this is being used, and how it is delivering benefits.
What the volume unit is and what you have counted as a single unit.
How each of the impacts have been calculated, including what
assumptions have been relied upon.
LV lead cable ‘T’ joints that are identified during cable pit inspections as in poor
health that could potentially become weaker from water ingress will have the new
shell applied together with associated earthing improvements, filled with resin
that will give these joints an extra layer of protection that will reduce the
probability of failure.
The extra layer of mechanical shell protection on joints will stop any ingress of
water potentially triggering a failure. Using this activity will extend the life of a
joint, as previously the only option available was to undertake a replacement of
the joint asset. This innovative approach will allow UK Power Networks to defer
our asset replacement investment policy and save on customer interruptions and
associated customer minutes loss by not having joint failures.

Environment and Innovation Commentary
52
In the regulatory year 2016/2017, we have installed approximately 108 units on
the network since developing the solution. As we continue with cable pit
inspections and other maintenance & inspection activities on our underground
cable assets, any poor condition LV lead ‘T’ joint identified will have the new joint
shell installed to avoid their failure due to water ingress.
The estimated cost of saving per joint calculated is different in three licence areas
based on savings on CIs and CMLs that could have occurred due to joint failure.
See the “calculation of benefits” section for more detail.
Addition Units: “1 joint shell installed on network”
Disposal Units: “1 joint shell removed from network”
Benefit Categories: “£ cost saved”
Cost Categories: The costs considered include cost of joint, excavation and
installation of the joint shell on top of an existing joint. Counterfactual cost
categories include cost of joint, excavation and installation of a new traditional
joint.
Use of the RIIO-ED1 CBA Tool
DNOs should use the latest version of the RIIO-ED1 CBA Tool for each solution
reported in the Regulatory Year under report. Where the RIIO-ED1 CBA Tool
cannot be used to justify a solution, DNOs should explain why and provide
evidence for how they have derived the equivalent figures for the worksheet. The
most up-to-date CBA for each solution reported in the Regulatory Year under
report which are used to complete the worksheet must be submitted.
The standard RIIO-ED1 CBA Tool has been used.
Changes to CBAs
If, following an update to the CBA used to originally justify the activity in column
C, the updated CBA shows a negative net benefit for an activity, but the DNO
decides it is in the best interests of consumers to continue the activity, the DNO
should include an explanation of what has changed and why the DNO is
continuing the activity.
No changes to the CBA template have been made
Calculation of benefits
Explain how the benefits have been calculated, including all assumptions used
and details of the counterfactual scenario against which the benefits are
calculated.
The saving on joint failure is different in all three different licence areas. The
saving is from avoiding joint failure, reducing CIs and CMLs and improving safety
for member of staff and public. The split between three licence areas is shown in
the table below:
Counterfactual: Traditional Cost of repairing an LV joint
Region Labour Contractor Material Generator Other £ Total
EPN 924 1,652 170 84 33 2,863

Environment and Innovation Commentary
53
SPN 870 1,508 170 84 23 2,655
LPN 1,571 1,606 191 324 228 3,919
Baseline: Cost of putting a new Joint shell per DNO and savings
Region Cost Of Putting a
Joint Shell Savings per joint
(£)
EPN 833 2,030
SPN 833 1,822
LPN 1100 2,819
Number of Joint shells Installed:
Region Number of Joint shells
Installed in 2016/2017: Total Savings per
DNO(£)
EPN 30 60,900
SPN 30 54,660
LPN 48 135,312
Cost benefit analysis additional information
Please include a reference to the file name and location of any additional relevant
evidence submitted to support the costs and benefits inputted into this
worksheet. This should include the most recent CBA for each solution reported in
the Regulatory Year under report.
Joint Shell_2016-17 E6 CBA_v1.0
LIDAR Vegetation Management
Allocation and estimation methodologies: detail any estimations, allocations
or apportionments to calculate the numbers submitted.
The following section details the high level assumptions made in the calculations
for this solution.
LiDAR will be carried out approximately every two years
It is assumed that LiDAR-enabled approaches to vegetation management
have no material impact on CI and CML rates. This will be reassessed for
future submissions.
LiDAR has primarily been carried out on the HV, EHV and 132kV Overhead
line networks.
The average Opex spend rate for the submission year baseline was
assumed to be the average annual cost from DPCR5 actuals.
The Opex spend rate within the RIIO-ED1 allowances was assumed for the
forecast post-2017 evaluation case. The ED1 Business Plan Submission
tables were used to develop the post 2017 baseline case.
This performance improvement has been enabled by the LIDAR solution by
removing the need to conduct large scale ground surveys of OHL routes and by
categorising risk for all our OHL spans, thus enabling more efficient prioritisation
and targeting of cutting effort.
The benefits achieved in the CBA forecasts are conservative assumptions
compared to our year 1 actual performance, acknowledging that the new
contracts were only implemented in September 2015 and followed a considerable

Environment and Innovation Commentary
54
period of the year where no cutting took place. It should also be noted that this
methodology does not quantify secondary effects of implementing the solution,
such as equipment and small tools costs moving into the evaluation case
embedded within the new contractor costs where they were previously separated
into indirect Opex costs.
This methodology may then lead to higher spend levels and thus lower benefits in
future years, though we remain confident that the LIDAR-based approach will
continue to deliver improved cost performance.
General
For each of the solutions please explain:
In detail what the solution is, linking to external documents where
necessary.
How this is being used, and how it is delivering benefits.
What the volume unit is and what you have counted as a single unit.
How each of the impacts have been calculated, including what
assumptions have been relied upon.
What is the solution?
Using helicopters or light aircraft equipped with LiDAR (i.e. aerial laser
imaging/surveying) to identify critical clearances, danger and hazard vegetation,
and abnormal line states along the right-of-way (ROW) of the distribution system.
This then leads to more complete visibility of relative risks posed by vegetation
growth on OHL routes and thus enables more targeted vegetation cutting.
How is the solution being used?
The solution is being used to provide greater confidence in using the allocated
budget in the most targeted and priority manner to minimize the impact of tree
related faults. It should also help to reduce the amount of cutting required to
achieve at least equivalent levels of fault prevention.
How is the solution delivering benefits?
UK Power Networks (UKPN) saves surveying and cutting costs by using LiDAR or
similar techniques to produce an intelligent risk-based cutting program.
What is the volume unit and what has been counted as a single unit?
Addition units: “1km of overhead line surveyed”
Disposal units: will not be reported as it is not applicable to this solution, which is
process-based.
Benefit Categories
The volume unit for Reduced Cutting and Surveying Costs is: “1 km of OHL line”
Cost Categories
Additional cost of surveying

Environment and Innovation Commentary
55
How have each of the impacts been calculated?
Impacts have been calculated as cost reductions in total cutting and surveying
costs. See the “Calculation of Benefits” section below.
What assumptions have been relied upon?
See the “Calculation of Benefits” box below for details of the calculation
methodology and assumptions.
Use of the RIIO-ED1 CBA Tool
DNOs should use the latest version of the RIIO-ED1 CBA Tool for each solution
reported in the Regulatory Year under report. Where the RIIO-ED1 CBA Tool
cannot be used to justify a solution, DNOs should explain why and provide
evidence for how they have derived the equivalent figures for the worksheet. The
most up-to-date CBA for each solution reported in the Regulatory Year under
report which are used to complete the worksheet must be submitted.
The standard RIIO-ED1 CBA Tool has been used.
Changes to CBAs
If, following an update to the CBA used to originally justify the activity in column
C, the updated CBA shows a negative net benefit for an activity, but the DNO
decides it is in the best interests of consumers to continue the activity, the DNO
should include an explanation of what has changed and why the DNO is
continuing the activity.
No changes to the CBA template have been made
Calculation of benefits
Explain how the benefits have been calculated, including all assumptions used
and details of the counterfactual scenario against which the benefits are
calculated.
Benefit: Avoided Costs of Surveying
The benefit is calculated as the “km of line surveyed“ x (“£/surveyed km” ∆
between evaluation and baseline)
Assumptions: baseline surveying costs are based on the average of 2010-2014
surveying costs. For CBA and forecast years the baseline costs are those from
the UK Power Networks ED1 Business Plan submission.
Benefit: Avoided Costs of Cutting
The benefit is calculated as the “km of line cut“ x (“£/cut km” ∆ between
evaluation and baseline)
Assumptions: For the current year, baseline cutting costs are based on the
average of 2010-2014 cutting costs. For CBA and forecast years the baseline
costs are those from the UK Power Networks ED1 Business Plan submission.
Cost: Increased analysis costs for LiDAR data
The solution cost is included as the total cost of procuring the LiDAR survey data.

Environment and Innovation Commentary
56
A volume unit for the Cost of LiDAR data analysis, representing any additional
scaling or Opex costs associated with LiDAR analysis, is not considered.
Assumptions: LiDAR data analysis costs are the same as baseline data analysis
costs.
Counterfactual
The counterfactual is the case where the solution is not implemented and the
amount of line cut is determined by the use of standard on-the-ground surveying
methods to identify overgrown vegetation.
Cost benefit analysis additional information
Please include a reference to the file name and location of any additional relevant
evidence submitted to support the costs and benefits inputted into this
worksheet. This should include the most recent CBA for each solution reported in
the Regulatory Year under report.
LIDAR_2016-17 E6 CBA_v1.0
Load Blinding Relays
Allocation and estimation methodologies: detail any estimations, allocations
or apportionments to calculate the numbers submitted.
No reported volumes or costs in 2016/17
The following section details the high level assumptions made in the calculations
for this solution.
It is assumed that in the absence of the load blinding relay solution for
releasing DG connection capacity on the network, customers benefiting
from the solution would have connected at the full traditional cost without
the benefit of load blinding relays.
General
For each of the solutions please explain:
In detail what the solution is, linking to external documents where
necessary.
How this is being used, and how it is delivering benefits.
What the volume unit is and what you have counted as a single unit.
How each of the impacts have been calculated, including what
assumptions have been relied upon.
What is the solution?
This solution uses ModNovel Protection Relays with “load blinding” functionality to
manage constraints and maximise network utilisation. Load blinding relays allow
greater volumes of DG to be connected to the network, producing greater reverse
power flows because these relays can discriminate between acceptable reverse
power flows and an upstream fault, which traditional protection would need to
operate to clear fault infeed.
Load blinding is useful in the cases such as of heavily loaded lines or where

Environment and Innovation Commentary
57
quadrature characteristics are used for the distance zone reaches. If the current
increases and its angle is within the expected the load area, the distance relay
will be restrained from operating. This scheme will have the benefit of removing
the protection-related constraints on reverse power flow whilst maintaining
relatively simple tried and tested philosophy for the protection settings.
How is the solution being used?
The solution is being used to connect DG customers to the grid through a lower
connection cost. Without load blinding relays, these customers would only have
had the option of a more expensive traditional connection that allows for the cost
of the reinforcement projects that may be required to connect the customer to
the network.
How is the solution delivering benefits?
Gross Avoided Costs:
Avoided Connection Costs – The benefit is that consumers are able to connect
their DG to the network through a much lower connection cost.
What is the volume unit and what has been counted as a single unit?
Benefit Categories:
The volume unit Additions is: “1 DG Connection energised under a Load Blinding
Relay connection agreement”
The volume unit for Disposals is: “1 DG Connection decommissioned under a Load
Blinding Relay connection agreement removed”
How have each of the impacts been calculated?
The impacts are considered jointly with benefits in the “Calculation of Benefits”
box below.
What assumptions have been relied upon?
The assumptions behind the impacts are considered jointly with benefits in the
“Calculation of Benefits” box below.
Use of the RIIO-ED1 CBA Tool
DNOs should use the latest version of the RIIO-ED1 CBA Tool for each solution
reported in the Regulatory Year under report. Where the RIIO-ED1 CBA Tool
cannot be used to justify a solution, DNOs should explain why and provide
evidence for how they have derived the equivalent figures for the worksheet. The
most up-to-date CBA for each solution reported in the Regulatory Year under
report which are used to complete the worksheet must be submitted.
The standard RIIO-ED1 CBA Tool has been used.

Environment and Innovation Commentary
58
Changes to CBAs
If, following an update to the CBA used to originally justify the activity in column
C, the updated CBA shows a negative net benefit for an activity, but the DNO
decides it is in the best interests of consumers to continue the activity, the DNO
should include an explanation of what has changed and why the DNO is
continuing the activity.
No changes to the CBA template have been made
Calculation of benefits
Explain how the benefits have been calculated, including all assumptions used
and details of the counterfactual scenario against which the benefits are
calculated.
All DG enabled by a load blinding relay would have connected through a more
expensive reinforcement connection costs in the absence of a load blinding relay
solution.
Gross Avoided Costs
Avoided Connection Costs – Consumers are able to connect their DG to the
network through a much lower connection cost. The benefit is calculated by:
(Traditional Connection Cost – Load Blinding Relay Connection Cost) x Number of
DG Connections under a Load Blinding Relay connection agreement.
Cost benefit analysis additional information
Please include a reference to the file name and location of any additional relevant
evidence submitted to support the costs and benefits inputted into this
worksheet. This should include the most recent CBA for each solution reported in
the Regulatory Year under report.
n/a
LPN Interconnection
Allocation and estimation methodologies: detail any estimations, allocations
or apportionments to calculate the numbers submitted.
The following section details the high level assumptions made in the calculations
for this solution.
The benefits methodology is based on the design policy of limiting an HV
feeder group utilisation to be able to support group demand following a
single feeder outage. Thus by adding an additional feeder to an existing
feeder group with 2 feeders, utilisation can increase from 50% to 67% and
with 4 feeders, utilisation can increase to 75%. The reported benefit is the
additional utilisation above a traditional, two feeder design at 50%
utilisation.
It is assumed that the avoided cost benefits are directly proportional to
the increased utilisation percentage benefit.

Environment and Innovation Commentary
59
The average number of feeders in an LPN 11kV feeder group has been
calculated and used as the percentage benefits ratio for all schemes
eligible for reporting.
Individual reinforcement projects were selected as eligible for inclusion in
the innovative solutions table based on load-related driver for the project
and based on the level of interconnection operated in that specific
network.
General
For each of the solutions please explain:
In detail what the solution is, linking to external documents where
necessary.
How this is being used, and how it is delivering benefits.
What the volume unit is and what you have counted as a single unit.
How each of the impacts have been calculated, including what
assumptions have been relied upon.
What is the solution?
This solution is the advanced design philosophy for interconnected 11kV feeder
groups in the LPN network. Including a relatively high number of feeders per
feeder group to support higher utilisation while maintaining N-1 resilience such
that in the event of a loss of one 11kV feeder from the group due to a fault, all
the substations supplied by that feeder can be energised through multiple 11kV
interconnection points (normally open). By designing the network with larger
numbers of 11kV feeders connected in this way as a feeder group, resilience can
be maintained with significant benefits in the percentage utilisation of each
individual feeder.
This arrangement allows these higher circuit utilisation levels, since each 11kV
circuit (for a four feeder group) can be loaded to 75% of its thermal capacity (or
80% for a five-feeder group) as opposed to 50% for a conventional radial
network single points of interconnection between two feeders.
Are there any external documents to link to?
https://library.ukpowernetworks.co.uk/library/en/RIIO/Main_Business_Pla
n_Documents_and_Annexes/UKPN_Smart_Grid_Strategy.pdf
How is the solution being used?
UK Power Network’s LPN LV-interconnected HV system has continually evolved
and enables significantly higher levels of HV and LV asset utilisation than
conventional HV and LV distribution systems.
How is the solution delivering benefits?
MVA Released – linked to data reported in CV2, no MVA has been released for the
relevant reinforcement projects reported in this table.
Gross Avoided Costs – due to the increased utilisation of the network, future
network reinforcement is deferred and the £ per MVA cost of reinforcement in the
Environment and Innovation Commentary
60
HV network is reduced.
What is the volume unit and what has been counted as a single unit?
Gross Avoided Costs:
Avoided Reinforcement Costs – The volume unit for Avoided Reinforcement Costs
is “1 project deferred”.
How have each of the impacts been calculated?
The impacts are considered jointly with benefits in the “Calculation of
Benefits” box below.
What assumptions have been relied upon?
The assumptions behind the impacts are considered jointly with benefits in
the “Calculation of Benefits” box below.
Use of the RIIO-ED1 CBA Tool
DNOs should use the latest version of the RIIO-ED1 CBA Tool for each solution
reported in the Regulatory Year under report. Where the RIIO-ED1 CBA Tool
cannot be used to justify a solution, DNOs should explain why and provide
evidence for how they have derived the equivalent figures for the worksheet. The
most up-to-date CBA for each solution reported in the Regulatory Year under
report which are used to complete the worksheet must be submitted.
The standard RIIO-ED1 CBA Tool has been used.
Changes to CBAs
If, following an update to the CBA used to originally justify the activity in column
C, the updated CBA shows a negative net benefit for an activity, but the DNO
decides it is in the best interests of consumers to continue the activity, the DNO
should include an explanation of what has changed and why the DNO is
continuing the activity.
No changes to the CBA template have been made
Calculation of benefits
Explain how the benefits have been calculated, including all assumptions used
and details of the counterfactual scenario against which the benefits are
calculated.
Counterfactual
It is assumed in the baseline case that there can only be a maximum of 2 feeders
per feeder group, as per a traditional network arrangement. This means that
feeder groups can only be loaded up to a maximum of 50% capacity to maintain
n-1 security of supply.
Gross Avoided Costs
The amount of Gross Avoided Cost is calculated by considering reinforcement
costs incurred in this reporting period reinforcing those sections of the LPN
network with a high number of interconnected feeders within the feeder group

Environment and Innovation Commentary
61
(greater than 2). Counterfactual costs are determined as what would have been
spent reinforcing an equivalent, large number of two feeder groups.
Assumption: to calculate the amount that would have been spent in the
counterfactual scenario, a multiplier has been for each feeder group, based on the
average number of feeders in an LPN feeder group, calculated using the formula:
= (1 − 𝑀𝑒𝑠ℎ𝑒𝑑 𝑈𝑡𝑖𝑙𝑖𝑠𝑎𝑡𝑖𝑜𝑛
𝐶𝑜𝑛𝑣𝑒𝑛𝑡𝑖𝑜𝑛𝑎𝑙 𝑈𝑡𝑖𝑙𝑖𝑠𝑎𝑡𝑖𝑜𝑛 ) × £𝑠𝑝𝑒𝑛𝑡𝑒𝑣𝑎𝑙𝑢𝑎𝑡𝑖𝑜𝑛 𝑐𝑎𝑠𝑒
Assumption: A feeder group under the counterfactual is assumed only to be able
to reach 50% utilisation for n-1 supply. The evaluation case assumes that for a 3
feeder group, utilisation can reach 67%, while a 4 feeder group can reach 75%
and a 5 feeder group can reach 80% utilisation.
Cost benefit analysis additional information
Please include a reference to the file name and location of any additional relevant
evidence submitted to support the costs and benefits inputted into this
worksheet. This should include the most recent CBA for each solution reported in
the Regulatory Year under report.
LPN Interconnection_2016-17 E6 CBA_v1.0
LV Re-energising Devices
Allocation and estimation methodologies: detail any estimations, allocations
or apportionments to calculate the numbers submitted.
The following section details the allocations and high level assumptions made in
the calculations for this solution.
The solution has been implemented across UK Power Networks’ EPN, LPN
and SPN networks.
The reported additions total has been taken to be the average of the
number of Bidoyngs and ALVIN Reclose devices deployed on a monthly
basis
Benefits
This model uses Ofgem’s societal benefit £/interruption rates.
o CI (£s per interruption) £15.44
o CML (£s per minute lost) £0.38
No O&M impacts result from installing and operating LV Re-energising
Devices have been assumed or calculated. These benefits will be reviewed
in future submissions.
Benefits are calculated for each individual outage actually occurring in the
reporting period on the circuits equipped with either Bidoyngs or ALVIN
Reclose devices, including
o Number of affected customers
o Identification of those incidents with a beneficial expected outcome

Environment and Innovation Commentary
62
compared to without the solution (i.e. for Bidoyngs those
operations where the second fuse did not operate and restored
supplies and for the ALVIN Reclose devices, those operations were
the ALVIN Reclose has successfully auto-reclosed)
Flat forecast Customer Interruption (CI) and Customer Minute Lost (CML)
benefits rate assumed to end of reporting period, based on most recent
year’s performance.
Costs
Costs reported include those for the purchase and service provision (where
relevant) for equipment. Operational costs deploying and utilising the equipment
are considered to be the same in both the evaluation and the baseline case and
thus not presented in the net CBA.
The Fault Centre service for the Bidoyng was largely paid for in advance for the
period 2014 to 2019. Renewal and ongoing Bidoyng Fault Centre costs start again
in 2019 and is valued at £750/Bidoyng/annum.
General
For each of the solutions please explain:
In detail what the solution is, linking to external documents where
necessary.
How this is being used, and how it is delivering benefits.
What the volume unit is and what you have counted as a single unit.
How each of the impacts have been calculated, including what
assumptions have been relied upon.
What is the solution reported?
In this submission period two different types of LV re-energising devices have
been operated on the network:
i) The Bidoyng
ii) The ALVIN Reclose
A Bidoyng uses two fuses (i.e., Primary and Secondary) in parallel as a single
shot auto recloser. The Primary fuse operates first in the event of an intermittent
fault. Then, after a programmed delay (less than 3 minutes), the Secondary fuse
is switched in causing the network to re-energise. For sustained faults, the
Secondary fuse will also operate and customers will remain off supply until a UK
Power Networks’ crew manually fixes the fault.
An ALVIN Reclose is a solid state Low Voltage (LV) Circuit Breaker. When a fault
occurs the Circuit Breaker will operate and open. The ALVIN Reclose will then test
the power cable (using modulated power pulses) for the presence of a sustained
fault before attempting to energise the circuit again. If the fault has been cleared
(i.e. the fault was not a sustained but an intermittent one), the ALVIN Reclose will
automatically reclose restoring supply to customers.
Both LV Re-energising Devices included in this year’s submission contribute
towards reducing CIs and CMLs.

Environment and Innovation Commentary
63
Are there any external documents to link to?
i) Bidoyngs:
https://www.ofgem.gov.uk/sites/default/files/docs/2010/12/enwt1001_0.
xls
http://www.kelvatek.com/bidoyng.php
ii) ALVIN Reclose:
https://www.eatechnology.com/products/low-voltage-alvin-range/alvin-
reclose/
How is the solution being used?
Both types of LV Re-energising Devices are used at secondary substations across
all three UK Power Networks’ DNO areas in order to reduce CIs and CMLs. They
are both installed on LV boards, directly replacing fuses.
In 2016/17, 1,108 LV Re-energising Devices were deployed and are operating on
UK Power Networks’ distribution network, 34 of which are ALVIN Reclose devices
and the rest Bidoyngs.
How is the solution delivering benefits?
The solution is being used to reduce CIs and CMLs from momentary outages by
allowing the system to re-energise.
What is the volume unit and what has been counted as a single unit?
Addition Units: “1 device installed on the network for the duration of 1 year” This
number has been calculated by taking the average of devices installed on the
network over the year.
Disposal Units
Will not be reported for this solution.
Benefits Categories
The volume unit for Customer Interruptions is “1 interruption per 100 customers
connected”.
The volume unit for Customer Minutes Lost is “1 minute lost”.
Cost Categories
The volume unit for costs associated with the purchase of goods is “Price for 1
device”.
The volume unit for costs associated with the provision of services in relation to
the LV Re-energising Devices is “annual license fee for 1 device”.
Please note that only costs associated with the purchase of goods has been
included in the current submission. Services were largely paid for in advance for
the period 2014 to 2019.
How have each of the impacts been calculated?

Environment and Innovation Commentary
64
The impacts are considered jointly with benefits in the “Calculation of Benefits”
box below.
What assumptions have been relied upon?
The assumptions behind the impacts are considered jointly with benefits in the
“Calculation of Benefits” box below.
Use of the RIIO-ED1 CBA Tool
DNOs should use the latest version of the RIIO-ED1 CBA Tool for each solution
reported in the Regulatory Year under report. Where the RIIO-ED1 CBA Tool
cannot be used to justify a solution, DNOs should explain why and provide
evidence for how they have derived the equivalent figures for the worksheet. The
most up-to-date CBA for each solution reported in the Regulatory Year under
report which are used to complete the worksheet must be submitted.
The standard RIIO-ED1 CBA Tool has been used.
Changes to CBAs
If, following an update to the CBA used to originally justify the activity in column
C, the updated CBA shows a negative net benefit for an activity, but the DNO
decides it is in the best interests of consumers to continue the activity, the DNO
should include an explanation of what has changed and why the DNO is
continuing the activity.
No changes to the CBA template have been made
Calculation of benefits
Explain how the benefits have been calculated, including all assumptions used
and details of the counterfactual scenario against which the benefits are
calculated.
Benefit: Reduced CIs
The benefit is calculated as follows:
1. Number of customer interruptions = (Number of CIs per 100 customers
connected, ∆ between counterfactual and baseline) x (Total number of
customers connected on network in relevant DNO area)/100
2. Societal Benefit (£m) from reduced CIs = Number of customer
interruptions x £/interruption
Assumptions
The CBA forecast benefits assume constant CI benefit into the future once all LV
Re-energising Devices are installed.
Benefit: Reduced CMLs
The benefit is calculated as Customer minutes lost (∆ between counterfactual and
baseline) x £/minute
Assumptions: Assumes i) length of avoided outage (based on average restoration
time for each DNO area), and ii) constant CML benefit into the future once all LV

Environment and Innovation Commentary
65
Re-energising Devices are installed.
Counterfactual
The counterfactual assumes that no LV Re-energising Devices are installed on the
system. Thus, no intelligent devices (fuses or circuit breakers) are available to re-
energise the system in the event of a momentary outage.
Cost benefit analysis additional information
Please include a reference to the file name and location of any additional relevant
evidence submitted to support the costs and benefits inputted into this
worksheet. This should include the most recent CBA for each solution reported in
the Regulatory Year under report.
LV Re-energising_2016-17 E6 CBA_v1.0
Oil Regeneration
Allocation and estimation methodologies: detail any estimations, allocations
or apportionments to calculate the numbers submitted.
The following section details the high level assumptions made in the calculations
for this solution.
It is assumed that the solution extends the life of transformers by 16
years.
It is assumed that there is no change in the required, on-going operations
and maintenance costs for transformers kept in service through the use of
this innovative solution
It should be noted that this methodology does not typically produce
financial benefits within the RIIO-ED1 benefits, as the replacement
investment counterfactual is typically in ED2.
No financial value has been assigned to the health risk improvement benefits
delivered in by the solution and the E6 table does not provide for reporting HI
benefits.
General
For each of the solutions please explain:
In detail what the solution is, linking to external documents where
necessary.
How this is being used, and how it is delivering benefits.
What the volume unit is and what you have counted as a single unit.
How each of the impacts have been calculated, including what
assumptions have been relied upon.
What is the solution?
Oil Regeneration extends the life of transformers by regenerating oil in
transformers where the oil has high moisture and acidity. By regenerating the oil,
not only does this improve the moisture and acidity condition, but also removes
sludge from transformer oil, additionally resulting in an ‘as new’ oil condition
which will extend the expected lifetime of the transformer. Oil regeneration
involves circulating the oil through bauxite pillars in order to remove acidity and
sludge from the transformer oil, as well as remove the moisture from the winding

Environment and Innovation Commentary
66
papers. On top of this, the regeneration also helps to remove sludge deposits in
the transformer and cooler. By restoring the transformer oil to its original new
condition, oil regeneration can provide a minimum extension of serviceable life of
16 years.
Are there any external documents to link to?
None to note
How is the solution being used?
Oil regeneration is being used on primary system transformers to improve the
overall asset health risk on the network (e.g. provide HI improvement from HI4
to HI2) and to extend the expected lifetime of the assets.
How is the solution delivering benefits?
Gross Avoided Costs:
Avoided Replacement Costs – The costs saved by deferring the replacement of
transformers.
What is the volume unit and what has been counted as a single unit?
Additions Unit: “regeneration of oil for 1 transformer”
Disposals Unit: N/A for this solution as it is action-based
Gross Avoided Costs:
Avoided Replacement Costs – The volume unit for Avoided Replacement Cost is 1
transformer with Oil Regeneration applied.
How have each of the impacts been calculated?
The impacts are considered jointly with benefits in the “Calculation of Benefits”
box below.
What assumptions have been relied upon?
The assumptions behind the impacts are considered jointly with benefits in the
“Calculation of Benefits” box below.
Note that there were no new regeneration activities completed this period.
Use of the RIIO-ED1 CBA Tool
DNOs should use the latest version of the RIIO-ED1 CBA Tool for each solution
reported in the Regulatory Year under report. Where the RIIO-ED1 CBA Tool
cannot be used to justify a solution, DNOs should explain why and provide
evidence for how they have derived the equivalent figures for the worksheet. The
most up-to-date CBA for each solution reported in the Regulatory Year under
report which are used to complete the worksheet must be submitted.
The standard RIIO-ED1 CBA Tool has been used.

Environment and Innovation Commentary
67
Changes to CBAs
If, following an update to the CBA used to originally justify the activity in column
C, the updated CBA shows a negative net benefit for an activity, but the DNO
decides it is in the best interests of consumers to continue the activity, the DNO
should include an explanation of what has changed and why the DNO is
continuing the activity.
No changes to the CBA template have been made
Calculation of benefits
Explain how the benefits have been calculated, including all assumptions used
and details of the counterfactual scenario against which the benefits are
calculated.
No benefits claimed in 16/17 reg. year
Counterfactual
The counterfactual solution is when UKPN would choose not to apply Oil
Regeneration and the transformers would be left to degrade to a point where the
only option would be to replace the transformer at an earlier date.
Gross Avoided Costs
The benefit is calculated as sum of the time value of money saving as a result of
deferral of the investment in new transformers. It is assumed that the solution
extends the life of transformers by 16 years.
Cost: Implementation of Oil Regeneration
The cost of the implementation of Oil Regeneration for 11 transformers is taken
as the full project cost to complete oil regeneration for the reported volume of
transformers.
Cost benefit analysis additional information
Please include a reference to the file name and location of any additional relevant
evidence submitted to support the costs and benefits inputted into this
worksheet. This should include the most recent CBA for each solution reported in
the Regulatory Year under report.
n/a
PFT
Allocation and estimation methodologies: detail any estimations, allocations
or apportionments to calculate the numbers submitted.
Based on a sample of leak-location outcomes across our three networks, it
has been determined that PFT is successfully used to locate leaks with the
following frequency:
EPN: 60% (based on a sampling of actual leak-location events)
LPN: 15% (conservatively estimated)
SPN: 60% (based on a sampling of actual leak-location events)
Hourly Costs for labour across the networks are taken from the 2017

Environment and Innovation Commentary
68
Activity Rates Model provided from Finance:
EPN LPN SPN
Staff £44.69 £58.55 £48.30
Engineer £55.97 £57.08 £64.10
Fluid Filled cable leak location is not a clear-cut process or a simple choice
between the leak location methods available. Different methods are used
and often a successful location is an amalgamation of all methods. For our
CBA calculation, we have assumed the following:
PFT is the 1st choice for locating a leak
If PFT alone is not able to locate the leak, the Freezing method is
also used
General
For each of the solutions please explain:
In detail what the solution is, linking to external documents where
necessary.
How this is being used, and how it is delivering benefits.
What the volume unit is and what you have counted as a single unit.
How each of the impacts have been calculated, including what
assumptions have been relied upon.
Solution & Benefits Explanation:
Fluid filled cable leaks have been traditionally been difficult and costly to
locate. The Perfluorocarbon tracer (PFT) fluid-filled cable leak location
method allows cable leaks to be found faster and at lower cost than other
methodologies. The detection technique is based upon introducing a small
amount of PFT into cable fluid, which is detectable by a mobile unit. PFTs
are man-made, non-toxic, non-flammable, non-corrosive, chemically
stable material which have been proven to cause no environmental or
health issues. Additionally, it has been shown that PFT does not lead to
degradation of premature ageing of our assets.
For the benefits calculation methodology, please see section 5 below
Volume Units:
Addition unit: “1 fluid-filled cable leak”
Disposal unit: Will not be reported for this solution as it is process-based
Scenarios:
Evaluation Case: Leaks are located with PFT when possible, using other
methods to assist when necessary. Freezing is the highest cost alternative
method.
Counterfactual Case: Freezing with N2 is used to locate the leak.
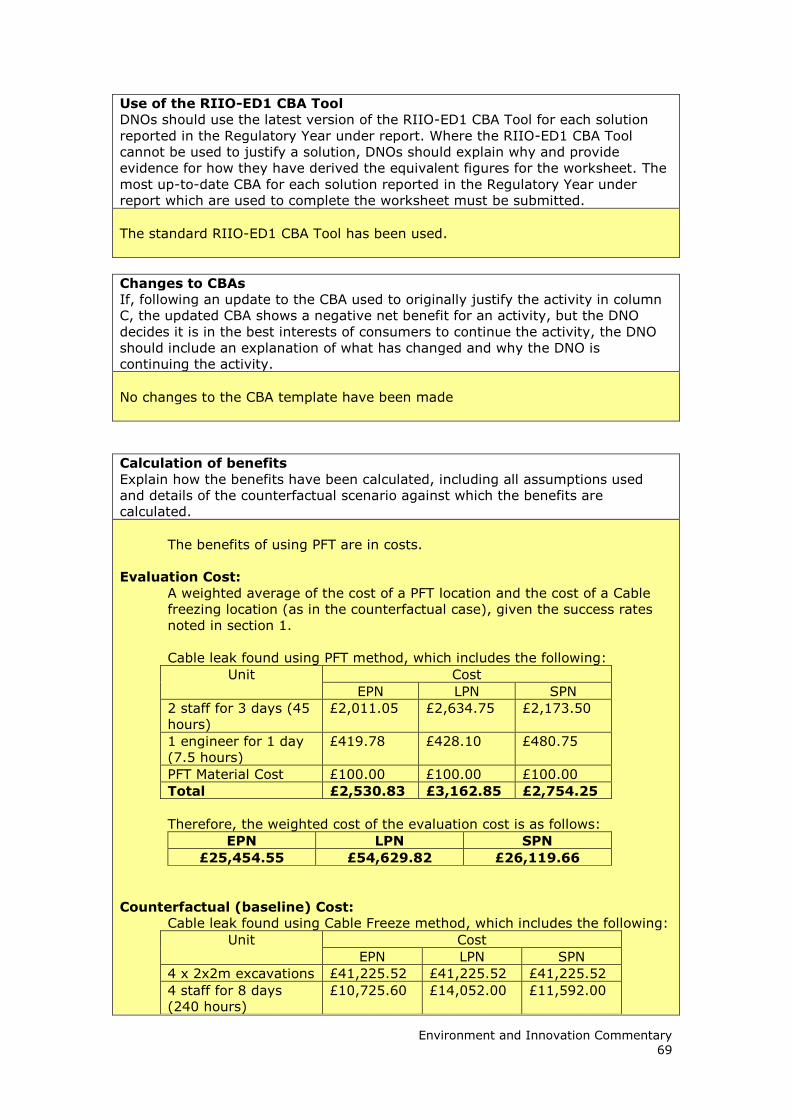
Environment and Innovation Commentary
69
Use of the RIIO-ED1 CBA Tool
DNOs should use the latest version of the RIIO-ED1 CBA Tool for each solution
reported in the Regulatory Year under report. Where the RIIO-ED1 CBA Tool
cannot be used to justify a solution, DNOs should explain why and provide
evidence for how they have derived the equivalent figures for the worksheet. The
most up-to-date CBA for each solution reported in the Regulatory Year under
report which are used to complete the worksheet must be submitted.
The standard RIIO-ED1 CBA Tool has been used.
Changes to CBAs
If, following an update to the CBA used to originally justify the activity in column
C, the updated CBA shows a negative net benefit for an activity, but the DNO
decides it is in the best interests of consumers to continue the activity, the DNO
should include an explanation of what has changed and why the DNO is
continuing the activity.
No changes to the CBA template have been made
Calculation of benefits
Explain how the benefits have been calculated, including all assumptions used
and details of the counterfactual scenario against which the benefits are
calculated.
The benefits of using PFT are in costs.
Evaluation Cost:
A weighted average of the cost of a PFT location and the cost of a Cable
freezing location (as in the counterfactual case), given the success rates
noted in section 1.
Cable leak found using PFT method, which includes the following:
Unit Cost
EPN LPN SPN
2 staff for 3 days (45
hours) £2,011.05 £2,634.75 £2,173.50
1 engineer for 1 day
(7.5 hours) £419.78 £428.10 £480.75
PFT Material Cost £100.00 £100.00 £100.00
Total £2,530.83 £3,162.85 £2,754.25
Therefore, the weighted cost of the evaluation cost is as follows:
EPN LPN SPN
£25,454.55 £54,629.82 £26,119.66
Counterfactual (baseline) Cost:
Cable leak found using Cable Freeze method, which includes the following:
Unit Cost
EPN LPN SPN
4 x 2x2m excavations £41,225.52 £41,225.52 £41,225.52
4 staff for 8 days
(240 hours) £10,725.60 £14,052.00 £11,592.00

Environment and Innovation Commentary
70
1 engineer for 8 days
(60 hours) £3,358.20 £3,424.80 £3,846.00
Nitrogen and material
costs £2,000.00 £2,000.00 £2,000.00
Total £57,309.32 £60,702.32 £58,663.52
Cost benefit analysis additional information
Please include a reference to the file name and location of any additional relevant
evidence submitted to support the costs and benefits inputted into this
worksheet. This should include the most recent CBA for each solution reported in
the Regulatory Year under report.
PFT_2016-17 E6 CBA_v1.0
Point of Connection (POC)
Allocation and estimation methodologies: detail any estimations, allocations
or apportionments to calculate the numbers submitted.
The cost and benefits data used in the CBA have been built up from either project
actual costs or using Compatible Units (CUs), each of which gives the cost of
carrying out a particular activity. These CUs have been created following
consultation with contractors who are part of the UK Power Networks Alliance.
These CUs have been used to build up the tower replacement costs.
General
For each of the solutions please explain:
In detail what the solution is, linking to external documents where
necessary.
How this is being used, and how it is delivering benefits.
What the volume unit is and what you have counted as a single unit.
How each of the impacts have been calculated, including what
assumptions have been relied upon.
Summary
The POC mast and underslung air brake switch disconnector (ABSD) mast are
both new methodologies that can be used for customer cable connections at 33kV
suspension towers where other traditional solutions are not technically possible.
They provide an additional cost effective option for customers wishing to connect
to the network and avoid the expensive and complicated option of complete tower
replacement.
Both consist of steel poles located to the side or underneath the tower being
connected to and have jumpers connected to the tower circuit. An ABSD and
cable termination are located on the steel pole and the signal, the point of
connection for the customer.
The POC mast design includes a hinge at the bottom of the mast so that work can
be done at ground level before erecting the mast. This allows the outage work to
be kept to a minimum as the only work required will be to connect the jumpers
between the mast and the tower.

Environment and Innovation Commentary
71
Benefits
The POC mast and underslung ABSD mast add additional options to the hierarchy
of solutions available to UK Power Networks for making connections to overhead
tower lines. Although they won’t be used as the first option for all connections it
does offer a lower-cost alternative on occasions where an expensive tower
replacement would otherwise be required.
Volumes
Addition Units: “1 connection energised using POC Mast technology”
Disposal Units: “Decommissioning of 1 connection which has used POC Mast
technology”
Use of the RIIO-ED1 CBA Tool
DNOs should use the latest version of the RIIO-ED1 CBA Tool for each solution
reported in the Regulatory Year under report. Where the RIIO-ED1 CBA Tool
cannot be used to justify a solution, DNOs should explain why and provide
evidence for how they have derived the equivalent figures for the worksheet. The
most up-to-date CBA for each solution reported in the Regulatory Year under
report which are used to complete the worksheet must be submitted.
The standard RIIO-ED1 CBA Tool has been used.
Changes to CBAs
If, following an update to the CBA used to originally justify the activity in column
C, the updated CBA shows a negative net benefit for an activity, but the DNO
decides it is in the best interests of consumers to continue the activity, the DNO
should include an explanation of what has changed and why the DNO is
continuing the activity.
No changes to the CBA template have been made
Calculation of benefits
Explain how the benefits have been calculated, including all assumptions used
and details of the counterfactual scenario against which the benefits are
calculated.
If the solution was not available then in the majority of cases the connecting
tower would need to be replaced with a new tower with cable connections
included. The cost of this replacement has been used as the counterfactual
scenario.
All projects within the business are costed using Compatible Units (CUs), each of
which gives the cost of carrying out a particular activity. These CUs have been
created following consultation with contractors who are part of the UK Power
Networks Alliance. These CUs have been used to build up the tower replacement
costs.

Environment and Innovation Commentary
72
Cost benefit analysis additional information
Please include a reference to the file name and location of any additional relevant
evidence submitted to support the costs and benefits inputted into this
worksheet. This should include the most recent CBA for each solution reported in
the Regulatory Year under report.
POC_2016-17 E6 CBA_v1.0
Dynamic Transformer Rating
Allocation and estimation methodologies: detail any estimations, allocations
or apportionments to calculate the numbers submitted.
The following section details the high level assumptions made in the calculations
for this solution.
The solution has been implemented at 2 substations, 1 each on UK Power
Networks’ London (LPN) and Southern (SPN) networks.
Where actual spend for traditional reinforcement and the cost of the
solution are available (i.e. for this reporting year) these have been used
instead of forecast values in the E6 table and in the lifetime CBA.
The amount of capacity released varies per substation and is calculated
through a technical study for each substation. The rating at Lithos Road
has been maintained due to other site constraints. Using accurate
Dynamic Transformer Rating monitoring it was possible to safely avoid de-
rating and associated costs incurred with this derating effect on the
network. The transformers at Weybridge were uprated to an asset rating
of 25MVA using the DTR solution, we expect to confirm the overall site
rating subject to replacement of switch boards by 2020 which are the next
most limiting factor.
The benefits calculation is based on the originally planned traditional
reinforcement schemes with expenditures shown in regulatory year 15/16
which were not incurred are then deferred to following years after present
(e.g., 2018, if 2017 is the current year).
General
For each of the solutions please explain:
In detail what the solution is, linking to external documents where
necessary.
How this is being used, and how it is delivering benefits.
What the volume unit is and what you have counted as a single unit.
How each of the impacts have been calculated, including what
assumptions have been relied upon.
What is the solution?
Dynamic Transformer Rating (DTR) allows additional capacity to be made
available from existing assets and defer reinforcement by three years or more. It

Environment and Innovation Commentary
73
is estimated that transformers can be loaded up to 20% above static seasonal
rating.
Changes in environmental conditions have a dramatic effect on transformer
loading and in urban areas due to rise in air conditioning installations, existing
summer or winter firm ratings may not be fully representative of the situation at
particular sites. This seasonal increase in loading may be leading to premature
network reinforcement decisions.
Benefits from DTR are achieved by retrofitting Transformer Management System
(TMS) onto existing assets to provide real-time monitoring of the transformer's
health, and continuously calculate the transformer thermal capacity, thereby
safely loading the transformer close to the maximum top oil temperature less 2°
Celsius allowed by design nameplate.
An increase in capacity is achieved by carrying out the following:
Installation of an active TMS, monitoring ambient & top / bottom oil
temperatures;
Installation of additional fans, modification to cooling set-points and
enabling pre-cooling;
Initiate pre-cooling in the event of a loss of one transformer (N-1
scenario);
Use the TMS to continuously ensure design limits are not exceeded and
calculate impact on degradation.
A greater understanding, visibility in asset performance leads to a reduction in
assets replacement, facilitating the connection of additional loads and low carbon
technologies.
Are there any external documents to link to?
http://www.smarternetworks.org/NIA_PEA_PDF/NIA_UKPN0001_4644.pdf
https://library.ukpowernetworks.co.uk/library/en/RIIO/Main_Business_Pla
n_Documents_and_Annexes/UKPN_Smart_Grid_Strategy.pdf
How is the solution being used?
TMSs have been implemented at two substations (on a total of six transformers)
to defer reinforcement schemes.
How is the solution delivering benefits?
This solution delivers the following benefits: the deferral of reinforcement projects
and MVA released as a result of increased transformer utilisation.
Note that the DTR solution continues to be under development and trialing as an
innovative solution, with these two sites the trial locations for the NIA-funded
project ‘ Power Transformer Real-Time Thermal Rating’ identified above. While
the solution is still under trial the deployment costs reported here are linked to
those in CV36 as eligible NIA project costs. The benefits reported are those of
the expected deferral period of the traditional reinforcement solution from the UK
Power Networks ED1 Business Plan. For Lithos Road the reinforcement is
expected to begin in 2019 and for Weybridge new analyses is being conducted to
confirm the overall site rating, this will update the Totex profile (based on current
Investment pan).
What is the volume unit and what has been counted as a single unit?

Environment and Innovation Commentary
74
Additions units: TMS commissioned at 1 transformer
Disposal units: TMS decommissioned from 1 transformer
Benefit Categories
The volume unit for Total MVA Released is: “1 MVA of capacity released”
The volume unit for Gross Avoided Costs is: “£ of deferred cost”
Cost Categories
The volume unit for solution Costs is: “£ of deployment cost”
How have each of the impacts been calculated?
Impacts have been calculated as load-related investment reduction or deferral
and in capacity released. See the “Calculation of Benefits” section below.
What assumptions have been relied upon?
See the “Calculation of Benefits” box below for details of the calculation
methodology and assumptions
Use of the RIIO-ED1 CBA Tool
DNOs should use the latest version of the RIIO-ED1 CBA Tool for each solution
reported in the Regulatory Year under report. Where the RIIO-ED1 CBA Tool
cannot be used to justify a solution, DNOs should explain why and provide
evidence for how they have derived the equivalent figures for the worksheet. The
most up-to-date CBA for each solution reported in the Regulatory Year under
report which are used to complete the worksheet must be submitted.
The standard RIIO-ED1 CBA Tool has been used.
Changes to CBAs
If, following an update to the CBA used to originally justify the activity in column
C, the updated CBA shows a negative net benefit for an activity, but the DNO
decides it is in the best interests of consumers to continue the activity, the DNO
should include an explanation of what has changed and why the DNO is
continuing the activity.
No changes to the CBA template have been made
Calculation of benefits
Explain how the benefits have been calculated, including all assumptions used
and details of the counterfactual scenario against which the benefits are
calculated.
Benefit: MVA Released
The benefit is calculated as the amount of MVA released using the summation of
MVA released for each transformer with DTR installed.
Benefit: Gross Avoided Costs

Environment and Innovation Commentary
75
The Gross Avoided Cost is the cost of traditional reinforcement in the
counterfactual case.
Cost: Total Pilot Project Cost
The cost of the phase one of pilot project is accounted.
Cost: Total DTR Cost
The total cost of installing DTR devices to each transformer. This is calculated as
the total cost per DTR installed x the number of DTR installations implemented.
Counterfactual
The counterfactual is the case where the innovative solution is not implemented
and the existing, traditional reinforcement is deployed at full cost. MVA released
will be reported as a gross figure, not the net difference between MVA released by
the innovative and traditional solutions.
Cost benefit analysis additional information
Please include a reference to the file name and location of any additional relevant
evidence submitted to support the costs and benefits inputted into this
worksheet. This should include the most recent CBA for each solution reported in
the Regulatory Year under report.
Power Transformer Real Time Thermal Rating_2016-17 E6 CBA_v1.0
Public Safety
Allocation and estimation methodologies: detail any estimations, allocations
or apportionments to calculate the numbers submitted.
Aggregate cost information was provided, as was the list of events
attended/articles published. An average cost per item was:
Cost Item Type Number attended Cost per Item
£4,000 County Shows 3 £1,333.33
£3,000 Articles 32 £93.75
The value of printing costs was spread over small events as well as county shows.
To calculate a per/event cost, this was done in the following way:
Total cost of printing £12,000
Events where printed material was used, and attendance in all:
o Education Initiatives (95)
o Events (7,326)
o Shows (5,350)
Total attendance =12,771
Therefore cost of printing per person reached = £0.9396
Cost of printing per event = £0.9396*event attendance
The wage cost of the team which organises and attends these events is
£174,000. Assume that 50% of this cost is dedicated to each EPN and SPN.

Environment and Innovation Commentary
76
As such, the total annual cost for public safety is £190,555.49
The total population reached in the EPN and SPN public safety campaigns comes
to just over 300,000 in the 2016/17 regulatory year.
General
For each of the solutions please explain:
In detail what the solution is, linking to external documents where
necessary.
How this is being used, and how it is delivering benefits.
What the volume unit is and what you have counted as a single unit.
How each of the impacts have been calculated, including what
assumptions have been relied upon.
The solution is targeted safety efforts in the EPN and SPN agricultural areas to
prevent injuries to members of the public by coming into contact with live
overhead equipment.
This is delivering benefits by reducing the number of incidents.
Volumes
Addition Units: “1 event”
The volume unit is 1 Event, and it can be any one of the following:
Article in a journal
E-Article
Attending a trade fair
Any other specific safety event
Working with agricultural colleges.
Where an article or e-article has been published and it is not region specific, a
50/50 split between EPN/SPN audience has been assumed.
Disposal Units: will not be reported, as this solution is an action
Use of the RIIO-ED1 CBA Tool
DNOs should use the latest version of the RIIO-ED1 CBA Tool for each solution
reported in the Regulatory Year under report. Where the RIIO-ED1 CBA Tool
cannot be used to justify a solution, DNOs should explain why and provide
evidence for how they have derived the equivalent figures for the worksheet. The
most up-to-date CBA for each solution reported in the Regulatory Year under
report which are used to complete the worksheet must be submitted.
The standard RIIO-ED1 CBA Tool has been used.

Environment and Innovation Commentary
77
Changes to CBAs
If, following an update to the CBA used to originally justify the activity in column
C, the updated CBA shows a negative net benefit for an activity, but the DNO
decides it is in the best interests of consumers to continue the activity, the DNO
should include an explanation of what has changed and why the DNO is
continuing the activity.
No changes to the CBA template have been made
Calculation of benefits
Explain how the benefits have been calculated, including all assumptions used
and details of the counterfactual scenario against which the benefits are
calculated.
Benefit Methodology:
We believe that the efforts from the dedicated team regarding public safety will
lead to a reduction of 1 fatality over the duration of ED1. This is a conservative
estimate based on the large audience reached with our public safety campaign.
We also assume that this will lead to a reduction of 5.67 injuries to members of
the public over the duration of ED1. This preserves the current ratio of public
safety injuries to fatalities.
According to the HSE, the cost of a fatal injury to a member of the public is
£1,570,000 and a non-fatal injury is £7,400. The current ratio of public fatalities
to injuries at UK Power Networks is 3:17.
As such, the public safety spend is justified as (cost of incidents avoided) >
(spend)
(1,570,000+ 5.67x7,400) – (8x190,555.40) = £87,514.80
Cost benefit analysis additional information
Please include a reference to the file name and location of any additional relevant
evidence submitted to support the costs and benefits inputted into this
worksheet. This should include the most recent CBA for each solution reported in
the Regulatory Year under report.
Public Safety_2016-17 E6 CBA_v1.0
Timed Connections
Allocation and estimation methodologies: detail any estimations, allocations
or apportionments to calculate the numbers submitted.
It is assumed that if customers had preferred to pay for a full (ie non-timed)
connection, the associated reinforcement costs to enable the connection would
have taken three months.
It is assumed that the average MVA connected is equal to a time-weighted
average

Environment and Innovation Commentary
78
General
For each of the solutions please explain:
In detail what the solution is, linking to external documents where
necessary.
How this is being used, and how it is delivering benefits.
What the volume unit is and what you have counted as a single unit.
How each of the impacts have been calculated, including what
assumptions have been relied upon.
What is the solution?
Offering customers time-dependent connections which allow a higher MVA level to
be taken in periods of reduced network demand.
Are there any external documents to link to?
Timed Connections Standard:
http://library.ukpowernetworks.co.uk/library/asset/3634a9c6-d825-44bd-a5ac-
12a068401d0N/EDS+08-5021+Timed+Connections.pdf
How is the solution being used?
Timed connections have been taken at two customer sites in LPN.
Waterloo Bus Garage: 0.5 MVA during the day, 1.9 overnight (until UK
Power Networks’ reinforcement job in the area is complete, at which point
they will transition to 2.5 MVA all the time)
Camberwell Road: 1.5 MVA during the day, 2 MVA overnight
(permanently)
How is the solution delivering benefits?
Lower connection cost for Camberwell Road
Faster connection times for both locations
MVA released much faster than if a non-timed connection (at the max
load) was sought. *Note: this has not been listed in E6 tables. See section
5 for further explanatnion.
What is the volume unit and what has been counted as a single unit?
Benefit Categories
The volume unit for Gross Avoided Costs is: “£ of avoided cost”
Addition Units
The volume unit is: “1 Timed Connection energised”
Disposal Units
The volume unit for this is “1 timed connection decommissioned ”
How have each of the impacts been calculated?
The impacts are considered jointly with benefits in the “Calculation of Benefits”
box below.
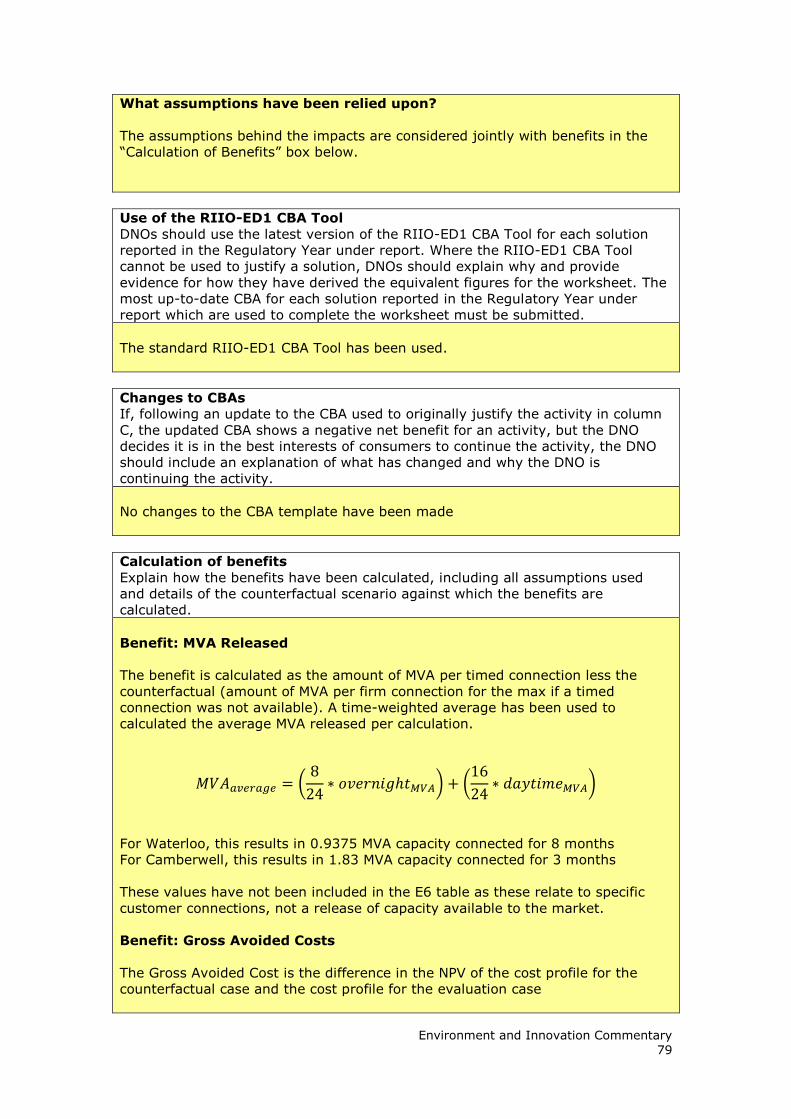
Environment and Innovation Commentary
79
What assumptions have been relied upon?
The assumptions behind the impacts are considered jointly with benefits in the
“Calculation of Benefits” box below.
Use of the RIIO-ED1 CBA Tool
DNOs should use the latest version of the RIIO-ED1 CBA Tool for each solution
reported in the Regulatory Year under report. Where the RIIO-ED1 CBA Tool
cannot be used to justify a solution, DNOs should explain why and provide
evidence for how they have derived the equivalent figures for the worksheet. The
most up-to-date CBA for each solution reported in the Regulatory Year under
report which are used to complete the worksheet must be submitted.
The standard RIIO-ED1 CBA Tool has been used.
Changes to CBAs
If, following an update to the CBA used to originally justify the activity in column
C, the updated CBA shows a negative net benefit for an activity, but the DNO
decides it is in the best interests of consumers to continue the activity, the DNO
should include an explanation of what has changed and why the DNO is
continuing the activity.
No changes to the CBA template have been made
Calculation of benefits
Explain how the benefits have been calculated, including all assumptions used
and details of the counterfactual scenario against which the benefits are
calculated.
Benefit: MVA Released
The benefit is calculated as the amount of MVA per timed connection less the
counterfactual (amount of MVA per firm connection for the max if a timed
connection was not available). A time-weighted average has been used to
calculated the average MVA released per calculation.
𝑀𝑉𝐴𝑎𝑣𝑒𝑟𝑎𝑔𝑒 = (8
24∗ 𝑜𝑣𝑒𝑟𝑛𝑖𝑔ℎ𝑡𝑀𝑉𝐴) + (
16
24∗ 𝑑𝑎𝑦𝑡𝑖𝑚𝑒𝑀𝑉𝐴)
For Waterloo, this results in 0.9375 MVA capacity connected for 8 months
For Camberwell, this results in 1.83 MVA capacity connected for 3 months
These values have not been included in the E6 table as these relate to specific
customer connections, not a release of capacity available to the market.
Benefit: Gross Avoided Costs
The Gross Avoided Cost is the difference in the NPV of the cost profile for the
counterfactual case and the cost profile for the evaluation case

Environment and Innovation Commentary
80
Cost: Total Connection Cost
The cost of each connection is considered in total.
Counterfactual Cost
The counterfactual is the case where the customer would have paid for a firm
connection, whereby they could take their maximum demand any time of day.
Cost benefit analysis additional information
Please include a reference to the file name and location of any additional relevant
evidence submitted to support the costs and benefits inputted into this
worksheet. This should include the most recent CBA for each solution reported in
the Regulatory Year under report.
Timed Connections_2016-17 E6 CBA_v1.0
E7 – LCTs
Allocation and estimation methodologies: detail any estimations, allocations
or apportionments to calculate the numbers submitted.
Heat Pump Data
Where the MPAN is omitted for a record it has been allocated to a DNO in
accordance with its postcode. Where the postcode is also unavailable records
have been spread across the three DNOs in accordance with the proportions
observed among records successfully mapped to a DNO.
Where installed capacity is omitted for a given record, the size has been
estimated to be equal to the average size of systems with known capacity.
Electric Vehicle Charge Point Data
In the event of the system size being indeterminable or unclear for a given
record it was either estimated on the basis of other available information or
assumed to be the most common (Ie mode) system size (32A).
For the purpose of conversion from kVA to kW the voltage was assumed to be
230V and the power factor 0.96.
Where the installation date is unavailable, in the absence of evidence to the
contrary the installation date is assumed to fall in the regulatory year in which
it was received.
Charge points of 16A or less have been reported as slow charge. Charge points
of greater than 16A have been reported as fast charge.
The National Chargepoint Registry (NCR), which contains data relating to
public chargepoints, does not specify the installation date. The installation date
has been estimated based on the creation date of the record. The installation
history implied by the estimation methodology is in line with UKPN’s
expectations. It was considered better to reflect the NCR data in the table with
an approximation of the installation date rather than exclude this data.
Distributed Generation
Sites less than or equal to 11.04kW have been treated as G83 and sites
greater than 11.04kW have been treated as non-G83.
In the absence of evidence to the contrary it has been assumed that sites less

Environment and Innovation Commentary
81
than or equal to 1MW are connected to the secondary network and sites
greater than 1MW are connected to the primary network.
As some of the data sources are overlapping and it is expected that the data
relating to some sites may not be precisely accurate. If two records are
sufficiently similar they have been considered to relate to the same site and
the data believed to be most reliable has been used in all calculations. It was
necessary to apply an element of judgment in this review process.
In the case of an unpopulated or incomplete data field for records believed to
represent true sites not represented elsewhere, the missing field has been
estimated based on the best available information. The most common missing
fields were postcode and generation type. Such estimation was not frequently
necessary.
LCT – Processes used to report data
(i) Please explain processes used to calculate or estimate the number and size of
each type of LCT.
(ii) If any assumptions have been made in calculating or estimating either of
these values, these must be noted and explained.
Update to 2015/16 Generation Volumes and Capacities
(i)
Heat Pump Data
1. Obtain Renewable Heat Incentive data for UKPN’s licence areas from
Ofgem in accordance with the Data Sharing Agreement signed on 30th May
2017.
2. Use MPAN and/or postcode to map each unique record to the
corresponding DNO (EPN, LPN or SPN).
3. Determine regulatory year of installation based on the commissioning
date.
4. Calculate the quantity and aggregate capacity of installed systems by DNO
and regulatory year.
Electric Vehicle Charge Point Data
1. Review data, identify and remove duplicates.
2. For each entry in the UKPN EV Charge Point database, convert the charge
point size (specified in amps or volt-amps) to kilowatts in accordance with
voltage and power factor assumptions outlined under Allocation and
Estimation Methodologies above.
3. For all unique sites appearing in the UKPN EV Charge Point database and
the National Chargepoint Registry (NCR) use UKPN postcode-DNO
mapping to map each record to the corresponding DNO.
4. Determine the charge speed category (fast or slow) in accordance with the
assumptions outlined under Allocation and Estimation Methodologies
above.
5. Determine the regulatory year of installation from the installation date.
6. Calculate the quantity and aggregate capacity of installed charge points by
DNO, charge speed and regulatory year.
Distributed Generation

Environment and Innovation Commentary
82
1. Obtain FiT Installation Report parts 1 and 2 from
https://www.ofgem.gov.uk/environmental-programmes/feed-tariff-fit-
scheme/feed-tariff-reports-and-statistics/installation-reports.
2. Obtain Renewables Obligation Accredited Stations Public Report from
https://www.renewablesandchp.ofgem.gov.uk/Public/ReportManager.aspx
?ReportVisibility=1&ReportCategory=0.
3. For each of the above databases use UKPN postcode-DNO mapping to map
each site to the corresponding DNO.
4. Determine regulatory year of installation from commissioned date.
5. Using the available technology type data, classify each site as Photovoltaic
or Non-Photovoltaic.
6. Classify each site as G83 (<11.04kW) or non-G83.
5. Classify each site as being connected to the primary or secondary grid in
accordance with the assumptions outlined under Allocation and Estimation
Methodologies above.
7. Calculate the number of sites and aggregate capacity installed in the
2016/17 regulatory year by DNO, including all data outlined in the
preceding steps.
(ii)
Assumptions made in the calculation and estimation of quantities are outlined in
the previous section of this commentary.
LCT - Uptake
Please explain how the level of LCT uptake experienced compares to the forecast
in your RIIO-ED1 Business Plan and the DECC low carbon scenarios. This must
also include any expectation of changes in the trajectory for each LCT over the
next Regulatory Year in comparison to actuals to date.
In the BPDT we expected 33,217 PV units to connect to the secondary network
whereas 3,241 units actually connected. We highlighted last year that the
changes in both the Feed-in Tariff and Renewables Obligation schemes would
result in lower volumes. We have seen a significant reduction from 2015/16 to
2016/17 reflecting those changes. This is particularly true in the small scale
generation market where volumes have decreased by 89%. We expect volumes
in 2017/18 to be lower than in 2016/17.
In our original business plan we expected 28,300 heat pumps to connect in
2016/17 whereas 1,088 actually connected. As we highlighted last year, the
BPDT assumption was that in 2016 the Zero Carbon Homes policy would have
been implemented which would have kick started the heat pump deployment.
The Committee On Climate Change has highlighted that the UK heat
decarbonisation policy needs to be rethought if the 2050 heat decarbonisation
targets are to be achieved. In 2016/17 we have been able to source heat pump
data from the Renewable Heat incentive database. This has shown that UK
Power Networks were not informed about 736 heat pumps which connected to
our three networks in 2015/16. We do not expect to see significant growth,
above historic levels, in the amount of heat pumps connecting to our networks in
2017/18.
In the BPDT we predicted 6,781 charge points connecting in 2016/17 whereas our
records shows that 988 actually connected. However, the volume of electric
vehicles registered in 2016/17 was over 11,000, an increase of 21% on 2015/16.
This growth is being driven by a focus on air quality in urban areas as well as
increasing popularity of electric vehicles. Consequently we expect the number of

Environment and Innovation Commentary
83
electric vehicle charge points to increase in 2017/18. For example, in London the
GLA are looking to install an additional 300 charge points by 2020 and have
mandated that all new private hire taxis from 2018 should be zero emission
capable. We are also working with the Office of Low Emission Vehicles (OLEV) to
compare their information on charge points to ours.
In February 2017, streetlights connected to UK Power Networks electricity
network in Kensington and Chelsea have been converted into charge points for
electric vehicles – a first for central London.
The trial by the Royal Borough of Kensington and Chelsea, UK Power Networks,
and Ubitricity has started with the conversion of the first three Kensington street
lights into electric vehicle (EV) charge points. This installation allows two local
residents to charge their vehicles from a street light near their front door, and
receive accurate bills for their electricity use via their smart phone or home PC.
In the trial in Onslow Gardens, Kensington, drivers who previously charged their
EV at a nearby shopping centre now park and plug in at one of the street lights
that have been retro-fitted with charging technology. Access to the charge points
is managed with smart charging cables. This way the amount of electricity being
used can be accurately determined, so it can be paid for.
The trial which started in November could pave the way for greater EV use and
tackle air pollution in London by allowing drivers to conveniently charge their
vehicles closer to home over-night. In outer London, 33% of households have no
access to off-street parking to charge an EV, and in inner London this rises to
46%.
This solution means we can monitor how much electricity is being used in order to
maintain reliable electricity supplies as more EVs connect to our networks. It
should also release more parking spaces currently set aside as dedicated EV
charging bays, result in less street furniture and fewer excavations to install new
charging points. It is another example of how our business is supporting the
transition to a low carbon future.


