

1
Int. J. Pharm. Med. & Bio. Sc. 2014 Sanjay D Bhalerao et al., 2014
RISK FACTORS FOR TYPE 2 DIABETES MELLITUSIN RURAL POPULATION OF NORTH KARNATAKA:A COMMUNITY-BASED CROSS-SECTIONAL STUDY
Sanjay D Bhalerao1*, Manjunath Somannavar2, Sunil S Vernekar1,Rajashree Ravishankar1 and Shivprasad S Goudar1
Research Paper
Background: Diabetes Mellitus is emerging as a major health problem owing to its seriouscomplications. It is important to assess the various factors contributing to the occurrence of thediseases so that by limiting these factors the progression of the disease in patients can becontrolled. Hence, the present study was undertaken to determine the risk factors for T2DMamongst adults aged above 30 years in rural population of North Karnataka. Methods: Communitybased cross sectional study was carried out at three Primary Health Centers of Handignur,Vantamoori and Kinnaye under administrative control of Jawaharlal Nehru Medical College,Belgaum, Karnataka, India. Statistical analysis: Logistic regression analysis was used to studythe association of different risk factors with prevalence of type 2 DM. P values <0.05 wasconsidered as statistically significant. Results: Age, occupation, Body Mass Index, diet, smoking,alcohol, truncal obesity and family history of DM were significantly associated with prevalenceof T2DM whereas gender and literacy were not. Interpretation and conclusion: The prevalenceof T2DM was influenced by predictors such as age, occupation, BMI, diet, Smoking, alcoholconsumption, truncal obesity and family history of diabetes.
Keywords: Sociodemogrpahic correlates, Type 2 diabetes mellitus, Risk factors
*Corresponding Author: Sanjay D Bhalerao [email protected]
INTRODUCTIONDiabetes mellitus (DM) is becoming a pandemic
disease worldwide. As per World Health
Organization (WHO), DM is a heterogeneous
metabolic disorder characterized by common
features of chronic hyperglycemia with
ISSN 2278 – 5221 www.ijpmbs.comVol. 3, No. 1, January 2014
© 2014 IJPMBS. All Rights Reserved
Int. J. Pharm. Med. & Bio. Sc. 2014
1 Department of Physiology, KLE University’s Jawaharlal Nehru Medical College, Belgaum, Karnataka, India.2 Department of Biochemistry, KLE University’s Jawaharlal Nehru Medical College, Belgaum, Karnataka, India.
disturbance of carbohydrate, fat and protein
metabolism. Multicentric study in 2004 showed
prevalence of DM as 5.4% and 3.4% in urban and
rural parts of India respectively (Ramchanran,
2000; Wild, 2004). The difference in the
prevalence of diabetes mellitus among urban –
2
Int. J. Pharm. Med. & Bio. Sc. 2014 Sanjay D Bhalerao et al., 2014
rural population within the same ethnic group
(Indians) can be attributed primarily to the
‘modern’ lifestyle of urban Indians compared to
the ‘traditional’ lifestyle of rural Indians. The
differences in lifestyle factors in urban-rural India
include dietary pattern, physical activity and
mental stress. The prevalence of diabetes
mellitus differs not only across the rural-urban
divide but also across the different States o India.
This is because different Indian states are at
different stages of demographic transition (Mohan
et al., 2008 and Ramchandran et al., 2004). In
2008, The World Health Organization has
stressed on the importance of studies related to
diabetes epidemiology which in turn, would be
helpful in carrying out appropriate interventions
(World Health Organization, 2008).
DM requires continuing medical care and
patient education to prevent acute complications
and to reduce the risk of long-term complications
(American Diabetes Association, 2001 ;UKPDS,
1998). There is widespread agreement that
specific tests are necessary to monitor for early
signs of diabetic complication (Gavin et al., 2004).
DM is expected to continue as a major health
problem owing to serious complications. Before
the commencement of any kind of management
measures it is important to assess the various
factors contributing to the occurrence of the
disease so that by limiting these factors the
progression of the disease in diabetic patients
can be controlled. As well as the chance of
occurrence of type 2 diabetes mellitus in
susceptible individuals can be prevented by
reducing the exposure to the specific pre
disposing factor that has been ruled out. The
baseline data regarding the prevalence and its
risk factors is essential before implementation of
National Program for control of Diabetes, Cardio-
vascular diseases and Stroke (Chythra Rao, 2010
and Majagi, 2012). The present study will be
helpful in increasing the awareness about
diabetes and its complications in the rural
population of these regions of north Karnataka.
So this study is intended to access the various
predisposing factors for type 2 diabetes mellitus
in rural population of North Karnataka (Bhalerao,
2013).
OBJECTIVES OF THE STUDY• The primary objective was to study the various
risk factors for type 2 diabetes mellitus in rural
population of north Karnataka.
• The secondary objective was to correlate the
prevalence of T2DM with various risk factors
for T2DM such as: Age groups, Gender wise
distribution of the diabetic subjects (male and
female), Literacy status, Occupation, Diet
(Vegetarian and Non-vegetarian), Smoking and
Alcohol consumption, Family history of
Diabetes, Central and Truncal obesity.
MATERIALS AND METHODSStudy Design
A community based cross-sectional study
Study Site and Duration
The study was carried out in three Primary Health
Center (PHC) areas at Handignur, Vantamoori
and Kinnaye, associated with J N Medical College,
Belgaum (North Karnataka), India during August
2009 to 2012. These areas were chosen due to
their proximity to Belgaum facilitating collection
of fasting blood samples in the early mornings.
The study was approved by the JNMC Institutional
Ethics Committee.
3
Int. J. Pharm. Med. & Bio. Sc. 2014 Sanjay D Bhalerao et al., 2014
Inclusion Criteria
Individuals with typical symptoms of T2DM,
physician diagnosed patients as T2DM (FBG>126
mg/dl), individuals who were 30 years and above
aged, overweight (BMI>25 kg/m2), and
Hypertension (>140/90 mm Hg)
Exclusion Criteria
Individuals who declined for informed consent,
not available at home after repeated visit, pregnant
women/who had delivered a baby weighing >4.5
kg, by women who had gestational diabetes,
individuals with psychological and endocrinal
disorders.
Sample Size and Sampling Method
The sample size was calculated based on data
from prevalence study conducted in rural areas
of Mysore District (lowest being 3.8%) which are
geographically and socio-culturally similar to the
study area. Considering error of 1% with 95%
confidence level, the sample size was estimated
to be 3000. The detailed sample size calculation
and sampling method is published elsewhere
(Bhalerao, 2013).
Blood Glucose Measurements
WHO recommends standard glucometer to
measure blood glucose for epidemiological
purpose (WHO, 1999). On a pre-informed date,
fasting blood glucose (FBS) was estimated (after
overnight fast) in morning by using a standard
digital Glucometer (Omnitest Plus B-Brown
Germany). Glucometer was standardized by (as
per ISO criteria) cross-checking laboratory
results (Biochemistry Laboratory of KLES
Hospital & Medical Research Centre, Belgaum).
Difference in the glucometer and the laboratory
readings was not above 1% and correlation
coefficient was found to be 0.8 (WHO, 2003 and
Sadikot, 2004)
Anthropometrical Measurements
Anthropometric measurements include height,
weight, waist circumference and hip
circumference (WHO, 2000). Weight was
recorded by using a standard Krups weighing
scale kept on firm horizontal surface. Weight was
recorded to the nearest 500 g. Height was
recorded by using a measuring tape to the
nearest 1 cm. Subjects were requested to stand
upright without shoes with their back against the
wall, heels together and looking forward Body
Mass Index (BMI) was calculated by formula:
weight in kilogram divided by height in meter
squared [weight (kg)/height (m2)] (WHO, 1995
and Suchalatha, 2003). Waist circumference was
measured to the nearest 0.1 cm at the mid-point
between the costal margin and iliac crest using a
non- stretchable measuring tape at the end of
normal expiration with the subject standing erect
in relaxed position feet 25-30 cm apart. Hip
circumference was measured at the level of
greater trochanters (widest position of hip to the
nearest 0.01 cm with a measuring tape, while
the subject was standing with the arms by side
and feet together. Waist-Hip ratio was calculated
as the ratio of waist circumference and Hip
circumference (WHO, 2000). Study subjects
were considered to be overweight when BMI>23
kg/m2 and obese if body mass index (BMI>25
kg.m2). Central/abdominal obesity was
considered to be present when waist
circumference >90 cm in males and >80 cm in
females. Waist-Hip ratio of >1.0 for males and
>0.85 for females was defined as truncal obesity
(Khan, 2006, Ashwinkamath, 2011).
Blood Pressure Measurement
Blood pressure was measured on the left arm in
sitting posture, with the subject in a relaxed state.
Standardized mercury sphygmomanometer
4
Int. J. Pharm. Med. & Bio. Sc. 2014 Sanjay D Bhalerao et al., 2014
(Diamond deluxe BP apparatus, Pune India) with
adult size cuff was used. The first appearance of
(phase I of Korotkoff sounds) sound was used to
define Systolic Blood Pressure (SBP). The
disappearance of sound (phase 5) was used to
define Diastolic Blood Pressure (DBP). Study
subjects were considered to be hypertensive if
he/she was an already diagnosed case of
hypertension and /or on treatment or with a current
SBP of >140 mmHg or DBP>90 mm Hg (JNC VII
criteria) (Chobanian et al., 2003).
Socioeconomic Status
The participants were interviewed with a pre-
tested questionnaire regarding identification,
demographic details, behavioral components,
social and biological variables. Education was
classified based on International Standard
Classification of Education (UNSCO, 1997). The
occupation of study subjects was classified as
workers and non-workers as per census of India
2001. Further workers were subdivided based on
their occupation such as Skilled-I to Skilled –IV(Govt. of India Report, 2004). Non-workers
included house-wives and elderly persons who
have stopped working( Chaturvedi, 1996).
Family History of Diabetes
Detailed family history of T2DM was taken. This
was verif ied either by blood glucose
measurement of the parents or in the person’s
absence, by other circumstantial evidences such
as physician report, diet modif ications,
consumption of drugs. Known cases of T2DM
were included in the study. Duration of diabetes
and medication details were noted. In the present
study, if the response was “diabetes status of
parents not known”, it was assumed to be “No
family history of DM” (Prabhakaran, 2005, Meigs,
2000 and Vishwanathan et al., 1996).
Smoking and Alcohol
Smoking and alcohol were considered as risk
factors. Smoking was measured in terms of
frequency those who were smoking daily for 6
months and quantum tobacco chewing/beedies/
cigarettes/cheroots per day (Toshimi et al., 2004
and Nakanishi et al., 2000). Based on tobacco
content of Indian beedis, cigarettes and cheroots,
Indian cigarette equivalents of beedi and cheroot
were calculated (The alcohol consumption pattern
(amount, type and frequency) of current drinkers
and past drinkers (who have stopped before 12
months) was noted (Saleai et al., 2006, Wei et
al., 2000 and Howard, 2004).
STATISTICAL ANALYSISDescriptive statistics was used to assess the
frequency distribution. Student unpaired ‘t’ test
was used to compare the mean values in diabetic
and non-diabetic participants. The trends in the
prevalence of diabetes among different correlates
Chi-square test was used. To study the impact
of selected socio-demographic factors,
anthropometric measurements (BMI) and other
risk factors on prevalence of T2DM, multiple
logistic regression analysis was done considering
diabetes as a dichotomous outcome and age,
sex, occupation, literacy, family history, substance
abuse, BMI, Waist-Hip ratio as independent
variables. Statistical analysis was performed
using statistical analysis package for Social
Science (SPSS) version 16.0. P-value >0.05 was
considered significant.
RESULTSThe study included 3000 subjects with response
rate of 89.28%. The baseline characteristics of the
study subjects are shown in Table 1. There was
inadequate representation of males in the study
5
Int. J. Pharm. Med. & Bio. Sc. 2014 Sanjay D Bhalerao et al., 2014
sample (36.8% males Vs 63.2% females) as most
of them were involved in agricultural work and were
not available during survey. A total 474 T2DM (299
known and 175 newly detected) were identified, the
total prevalence being 17.7% (Table 1).
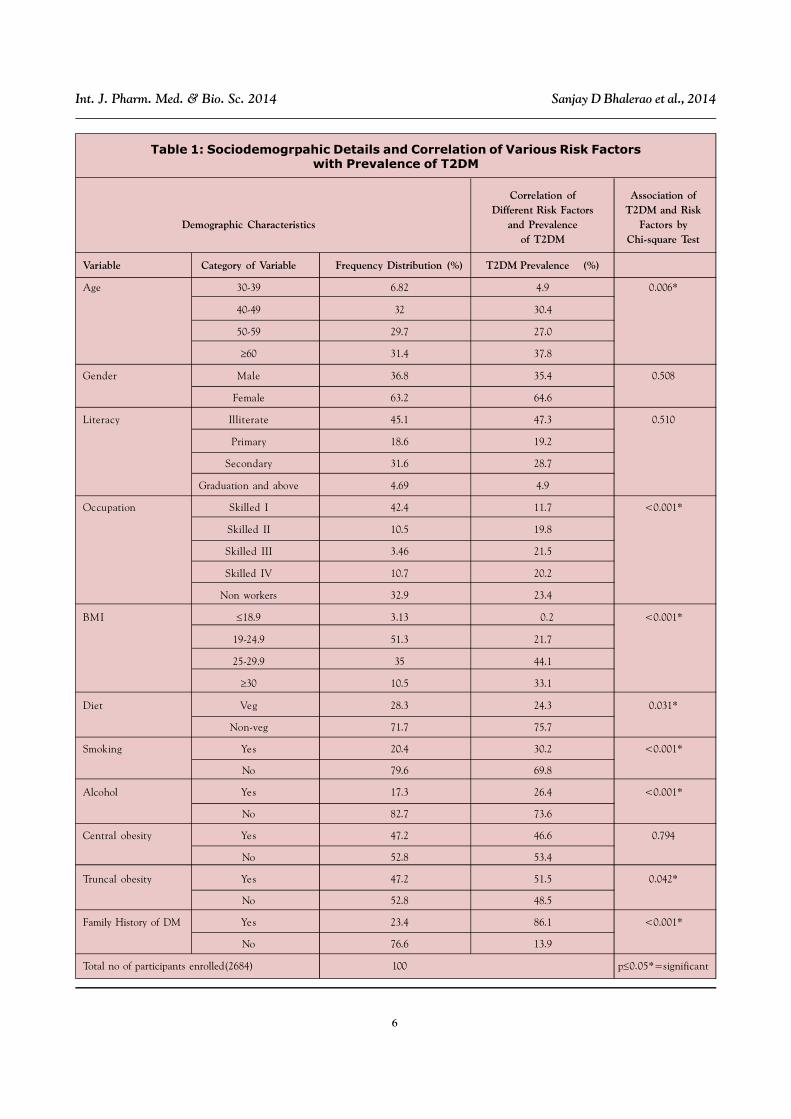
Table 1 revels the baseline descriptive
statistical features associated with the socio-
demographic profile of the study population. Table
1 showed that the prevalence of diabetes
increased significantly with age. The increased
prevalence was observed in the middle age group
40-49 years (30.4%) and in the old age group
above 60 years age group (37.8%)
The prevalence of T2DM among gender was
observed elevated in females (64.6%) compared
to males (35.4%). The prevalence of T2DM in
association with literacy observed in this study
was - Illiterate group (47.3%), Primary education
group (19.2%), Secondary school group (28.7%)
and graduation and above group (4.9%). The
prevalence stratified by occupation ranged
from 11.7% (skilled I) to 23.4% (Non workers)
(Table 1).
The increase in the prevalence of T2DM across
the BMI classes was significant. The prevalence
of T2DM was 21.7% and 44.1% among subjects
with BMI less than 24.9 kg/m2 and more than 25
kg/m2 respectively. The prevalence of T2DM in
mixed diet was 75.5% and in veg diet was 24.3%..
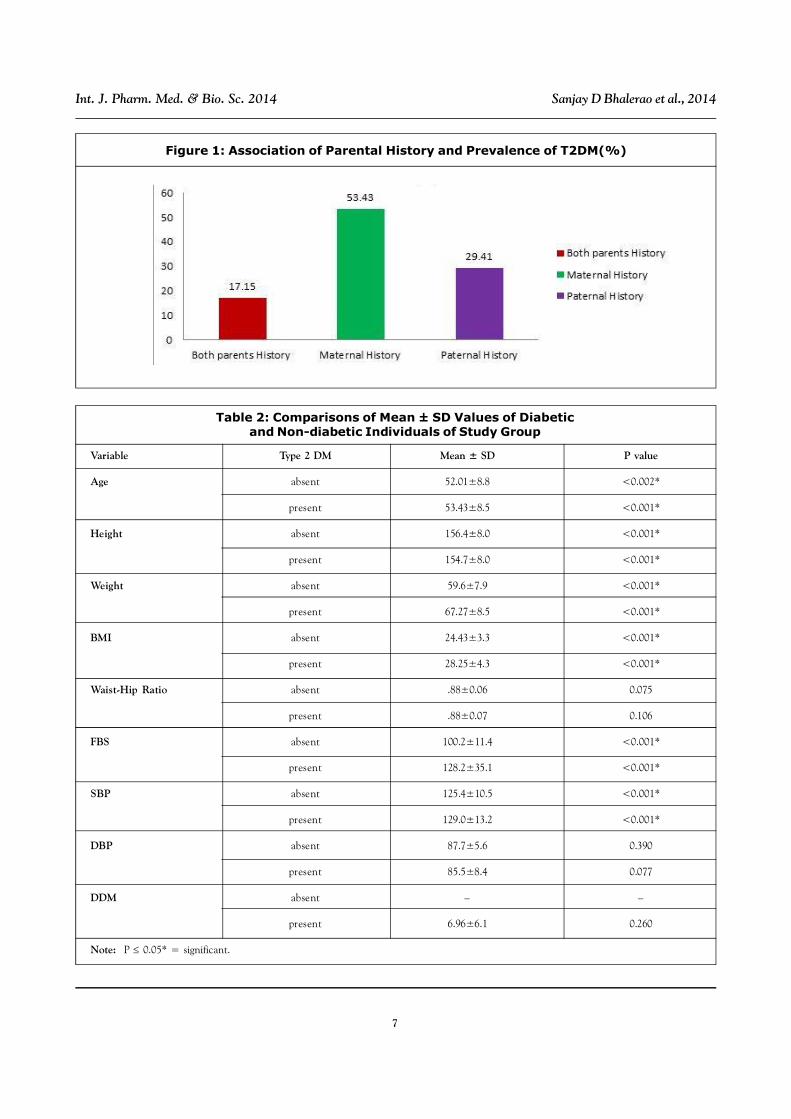
The prevalence of type 2 DM increased with the
family history of diabetes. The prevalence of
T2DM was 86.1% amongst subjects having family
history of diabetes. Prevalence of T2DM was
more in those who had maternal history of
diabetes (53.43%) than paternal history (17.15%)
(Table 1 and Figure 1).
The prevalence of T2DM in relation to
substance abuse like smoking was 30.2% and
alcohol consumption was 26.4%. The prevalence
of T2DM in association with truncate obesity was
51.5% and central obesity was 46.6 % (Table 1).
Table 2 reveals the difference of Mean±SD
values in diabetic and non-diabetic individuals by
using independent ‘t’ test analysis. Among the
study participants, in diabetic individuals Mean age
was 53.43±8.5 and in non-diabetic individual it was
52.01±8.89. Mean height was 154.7±8.0 for
diabetic individuals and 156.4±8.0 for non-diabetic
individuals. The Mean±SD of weight among
diabetic individuals and non-diabetic individuals
was 67.27±8.5 and 59.6±7.9, respectively. In the
BMI category, Mean±SD of BMI amongst diabetic
and non-diabetic individuals was 58.25±4.3 and
24.43±3.3, respectively. The Mean±SD value for
Waist-Hip ratio among diabetic and non-diabetic
individuals was found to be 0.88±0.07 and
0.88±0.06, respectively. The Mean±SD of fasting
blood sugar in diabetic and non-diabetic
individuals was 128.2±35.1 and 100.2±11.4,
respectively. The Mean±SD values of SBP in
diabetic and non-diabetic individuals were
129±13.2 and 125.4±10.5, respectively. The
Mean±SD values of DBP in diabetic and non-
diabetic individuals were 85.5±8.4 and 87.7±5.6,
respectively. The mean value of duration of
diabetes which was observed only in known
diabetic individuals was 6.96±6.1 years.
Table 1 shows the association of risk factors
with prevalence of T2DM by chi-square test
analysis. Risk factors such as age, occupation,
BMI, diet, smoking, alcohol drinking, truncal
obesity and family history of T2DM were
significantly associated with prevalence of T2DM,
whereas variables as gender, literacy, were not
significantly associated with prevalence of T2DM
The results of logistic regression analysis are
6
Int. J. Pharm. Med. & Bio. Sc. 2014 Sanjay D Bhalerao et al., 2014
Table 1: Sociodemogrpahic Details and Correlation of Various Risk Factorswith Prevalence of T2DM
Correlation of Association ofDifferent Risk Factors T2DM and Risk
Demographic Characteristics and Prevalence Factors byof T2DM Chi-square Test
Variable Category of Variable Frequency Distribution (%) T2DM Prevalence (%)
Age 30-39 6.82 4.9 0.006*
40-49 32 30.4
50-59 29.7 27.0
60 31.4 37.8
Gender Male 36.8 35.4 0.508
Female 63.2 64.6
Literacy Illiterate 45.1 47.3 0.510
Primary 18.6 19.2
Secondary 31.6 28.7
Graduation and above 4.69 4.9
Occupation Skilled I 42.4 11.7 <0.001*
Skilled II 10.5 19.8
Skilled III 3.46 21.5
Skilled IV 10.7 20.2
Non workers 32.9 23.4
BMI 18.9 3.13 0.2 <0.001*
19-24.9 51.3 21.7
25-29.9 35 44.1
30 10.5 33.1
Diet Veg 28.3 24.3 0.031*
Non-veg 71.7 75.7
Smoking Yes 20.4 30.2 <0.001*
No 79.6 69.8
Alcohol Yes 17.3 26.4 <0.001*
No 82.7 73.6
Central obesity Yes 47.2 46.6 0.794
No 52.8 53.4
Truncal obesity Yes 47.2 51.5 0.042*
No 52.8 48.5
Family History of DM Yes 23.4 86.1 <0.001*
No 76.6 13.9
Total no of participants enrolled(2684) 100 p0.05*=significant
7
Int. J. Pharm. Med. & Bio. Sc. 2014 Sanjay D Bhalerao et al., 2014
Table 2: Comparisons of Mean ± SD Values of Diabeticand Non-diabetic Individuals of Study Group
Variable Type 2 DM Mean ± SD P value
Age absent 52.01±8.8 <0.002*
present 53.43±8.5 <0.001*
Height absent 156.4±8.0 <0.001*
present 154.7±8.0 <0.001*
Weight absent 59.6±7.9 <0.001*
present 67.27±8.5 <0.001*
BMI absent 24.43±3.3 <0.001*
present 28.25±4.3 <0.001*
Waist-Hip Ratio absent .88±0.06 0.075
present .88±0.07 0.106
FBS absent 100.2±11.4 <0.001*
present 128.2±35.1 <0.001*
SBP absent 125.4±10.5 <0.001*
present 129.0±13.2 <0.001*
DBP absent 87.7±5.6 0.390
present 85.5±8.4 0.077
DDM absent – –
present 6.96±6.1 0.260
Note: P 0.05* = significant.
Figure 1: Association of Parental History and Prevalence of T2DM(%)
8
Int. J. Pharm. Med. & Bio. Sc. 2014 Sanjay D Bhalerao et al., 2014
Table 3: Univariate and Multivariate Logistic Regression Analysis of Risk Factor for T2DM
Risk Factors Category Univariate Analysis Multivariate analysis
Unadjusted OR 95%CI P value Adjusted OR 95%CI P value
Age 30-39 1 1
40-49 1.41 1.09-1.81 0.007* 0.86 0.60-1.25 0.439
50-59 1.34 1.05-1.70 0.020* 0.97 0.87-1.39 0.867
e”60 1.87 1.17-2.98 0.008* 6.62 3.42-12.82 <0.001*
Occupation Skilled -I 1 1
Skilled- II 0.89 0.53-1.51 0.678 1.44 0.68-3.03 0.338
Skilled-III 2.06 1.22-3.49 0.007* 3.58 1.69-7.57 <0.001*
Skilled-IV 1.08 0.61-1.91 0.788 2.44 1.07-5.58 0.034*
Non-Workers 1.11 0.62-1.97 0.721 1.72 0.75-3.93 0.200
Diet Veg 1 1
Nonveg 1.29 1.02-1.62 0.031* 1.29 0.92-1.79 0.134
Smoking No 1 1
Yes 1.94 1.55-2.42 <0.001* 1.39 0.76-2.31 0.331
Alcohol No 1 1
Yes 1.97 1.56-2.50 <0.001* 2.23 1.24-4.01 0.007*
BMI d”18.9 1 1
19-24.9 4.36 3.29-5.78 <0.001* 4.48 2.96-6.80 <0.001*
25-29.9 15.38 11.36-20.83 <0.001* 14.70 9.52-22.72 <0.001*
e”30 19.61 7.752-50 <0.001* 9.90 3.24-30.30 <0.001*
Truncal No 1 1
Obesity Yes 1.23 1.01-1.50 0.042* 1.41 1.05-1.89 0.022*
Family No 1
History Yes 35.96 27.60-46.85 <0.001* 35.67 26.42-48.42 <0.001*
Note: P 0.05* = significant.
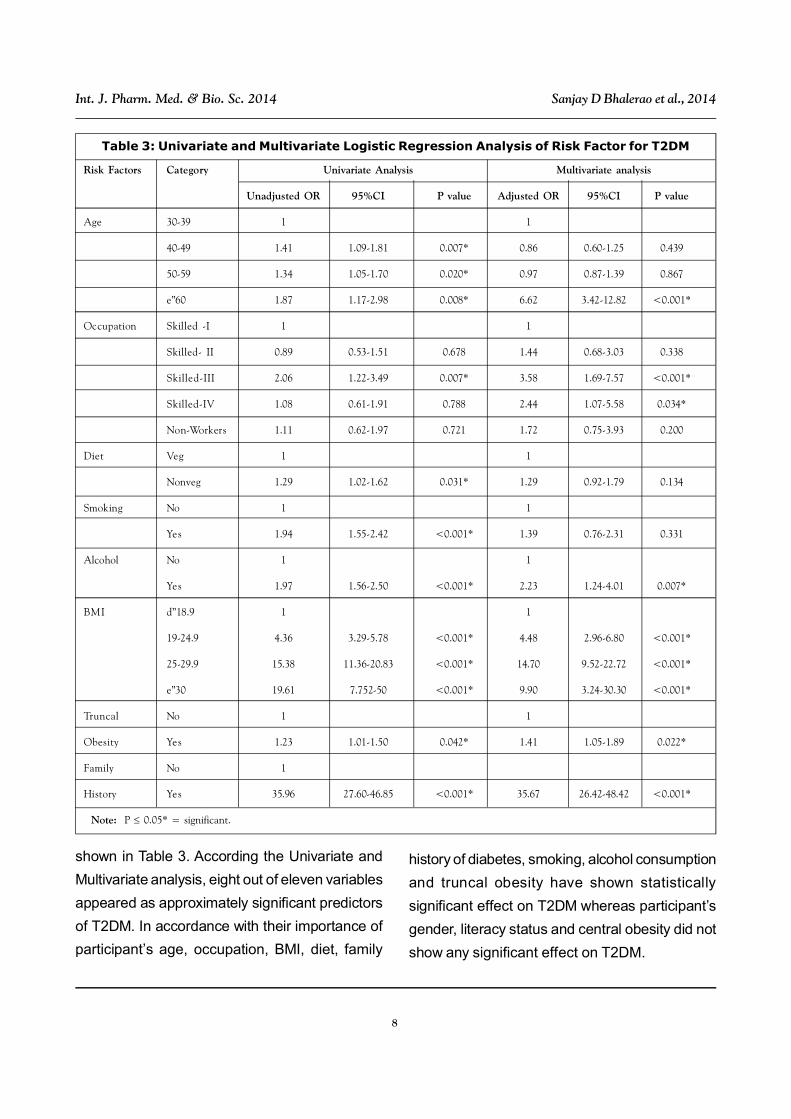
shown in Table 3. According the Univariate and
Multivariate analysis, eight out of eleven variables
appeared as approximately significant predictors
of T2DM. In accordance with their importance of
participant’s age, occupation, BMI, diet, family
history of diabetes, smoking, alcohol consumption
and truncal obesity have shown statistically
significant effect on T2DM whereas participant’s
gender, literacy status and central obesity did not
show any significant effect on T2DM.
9
Int. J. Pharm. Med. & Bio. Sc. 2014 Sanjay D Bhalerao et al., 2014
In univariate and multivariate analysis referral
category of age was considered as 30-39.
Participants belonging to 40-49, 50-59, >60 of age
group showed higher risk of T2DM respectively
compared to referral category of age in univariate
analysis. The corresponding Odds Ratio (OR)
for age category of 40-49, 50-59 and >60 are 1.41,
1.34 and 1.87 respectively. Multivariate analysis
showed participants with age >60 having higher
risk of T2DM and the corresponding odds ratio to
be 6.62. In univariate and multivariate analysis
referral category of occupation was considered
as skilled – I category. Participants belonging to
skilled –III category showed higher risk of T2DM
compared to referral skilled – I category. The
corresponding odds ratio was 2.06. Multivariate
analysis showed participants belonging skilled –
III category and skilled – IV category having higher
risk of T2DM. The corresponding odds ratios were
3.58 and 2.44, respectively. In diet category,
vegetarian diet was considered as referral
category for univariate and multivariate analysis.
Participants having non-veg diet showed higher
risk of T2DM and the corresponding odds ratio
was 1.29 in univariate analysis while in
multivariate analysis diet did not show any effect.
In substance abuse category for smoking, non-
smokers were considered as referral category
for both univariate and multivariate analysis.
Participants who were smoking have revealed
higher risk to the T2DM. The corresponding odds
ratio was 1.94 in univariate analysis. In multivariate
analysis there were no significant changes
associated with smoking. In substance abuse
category for alcohol, non-alcoholic was
considered as referral category in univariate and
multivariate analysis. Participants belonging to
alcoholic group have shown higher risk to T2DM.
The corresponding odds ratios were 1.97 and
2.23 in univariate and multivariate analysis
respectively. In BMI category, BMI>18.5 was
considered as referral category for univariate and
multivariate analysis. Participants belonging to
BMI of 19-24.9, 25-29.9 and >30 showed higher
risk to T2DM in both univariate and multivariate
analysis. The corresponding odds ratios for BMI
category of was 4.36, 15.38 and 19.61 in
univariate analysis and the corresponding odds
ratios were 4.48, 14.70 and 9.90 in multivariate
analysis. Participants having no truncal obesity
were considered as referral category for
univariate and multivariate analysis. Individual
having truncal obesity showed higher risk to
T2DM. The corresponding odds ratios were 1.23
and 1.41 for univariate and multivariate analysis.
The Participants having no family history of
diabetes were taken as referral category in
univariate and multivariate analysis. Participants
having family history of T2DM revealed higher risk
for T2DM. The corresponding odds ratios were
35.96 and 35.67 in univariate and multivariate
analysis.
DISCUSSIONEpidemiological data from different parts of India
showed a rise in prevalence of diabetes. In the
present study different finding was observed
compared to other studies, despite adopting
WHO standards which could be due to difference
in methodologies for measuring blood glucose,
definition of diabetes, age group and geographical
situations. The present study showed high
prevalence of T2DM (17.7%) in rural population
of north Karnataka, while similar study reported
lower prevalence (5.2%) in rural population in
costal Karnataka (Mohan et al., 2008, Bhalerao,
2013, Chow, 2006 and Kokiwar, 2007).
10
Int. J. Pharm. Med. & Bio. Sc. 2014 Sanjay D Bhalerao et al., 2014
In present study it is also observed that the
increasing in age was significantly associated
with higher risk of T2DM. Bhalerao (2013) and
Howard (2004) had reported the similar results.
This may be due to prolonged exposure to stress,
obesity, genetic factor, advancement of age. The
high prevalence among young adults 30-39 years
(4.9%), the most productive age group of the
community is unacceptable and hence focus on
prevention of diabetes among young is essential.
(Khatib, 2008 and Di Nardo, 2009).
The present study showed that BMI is a
significant predictor of development of diabetes.
Several studies reported BMI as an independent
risk factor for development of diabetes
(Snehalata, 2003 and Khan, 2006). The present
study also supported the evidence among Indian,
even at lower BMI, there was high odds of diabetes
(adjusted OR 2.1). Hence early identification of
high BMI would be helpful for primary prevention
and early diagnosis of diabetes. Khan et al.
reported that in obese individuals, adipose tissue
releases increased amounts of non-esterified fatty
acids, glycerol, hormones, pro-inflammatory
cytokines and other factors that are involved in
the development of insulin resistance (khan et
al., 2000).
The present study showed that there was a
significant association of occupation with
increasing prevalence of T2DM. Similar findings
were reported by some other studies in India
(Agardh, 2011). This association of diabetes with
occupation could be due to combined effect of
physical inactivity in employees, house wife and
work related stress among those who work in
agriculture field (Agardh, 2011).
There was no significant association with
literacy. Similar results were reported from a
cohort study amongst industrial workers.
(Chaturvedi, 1996). However some western
studies had reported a decrease in prevalence
with increase in educational status. Low
educations may influence the lesser awareness,
lesser opportunity for prevention and control.
Higher educational status may influence the
lifestyle factors (Chaturvedi, 1996 and Howard,
2004).
Dietary habits also demonstrated a significant
association with incidence of T2DM in this study.
Non vegetarian dietary habits were associated
with 1.29 times odds for incident T2DM compared
with those with good dietary habits (Chow, 2006).
The present study showed association
between truncal obesity and prevalence of T2DM.
Whereas there was no significant association of
central obesity with the increase in prevalence of
T2DM. Several studies reported truncal obesity
can be a risk factor for diabetes( WHO, 2000,
Khan, 2006, Khan, 2000 and Agardh, 2011).
There were no significant gender differences in
prevalence of diabetes. Similar findings were
reported by multicentric studies in India (WHO,
2000 and Khatib, 2008). However few studies have
showed a higher prevalence in females and some
other studies showed higher prevalence in males
(Prabhakaran, 2005). This is possibly due to
coexisting risk factors in specific gender.
Alternatively gender may not be a risk factor in
T2DM (Prabhakaran, 2005, Meigs, 2000 and Wei
et al., 2000).
The present study showed that the odds of
diabetes among those with family history of T2DM
(in terms of parental history) were 35.97 times
as compared to those without a family history of
T2DM. The present study also reported the
maternal history of T2DM to be stronger
11
Int. J. Pharm. Med. & Bio. Sc. 2014 Sanjay D Bhalerao et al., 2014
compared to paternal history of T2DM. Studies
reported relatively higher risk with maternal history
of diabetes compared to paternal( Meigs, 2000
and Vishwanathan et al., 1996). When both
parents were diabetic, the risk increases
synergistically. However in the present study no
such effect was observed, probably because
there were only a few subjects with both parents
diabetic. Family history of T2DM could act through
environmental factors (diet, stress, physical
activity, socioeconomic status) as well as a
genetic mechanism through gene expression.
Family history of diabetes could be an important
public health tool in predicting development of
diabetes (Khatib, 2008).
The present study showed that smoking is
associated with diabetes. Smoking habits were
associated with 1.94 times odds for incident
T2DM. This finding agrees with several other
cohort studies( Nakanishi et al., 2000 , Sakai et
al., 2006 and Chow, 2006). The present study
showed a significant association between alcohol
consumption and risk of diabetes. This is probably
due to the development of insulin resistance,
which is a key factor in the pathogenesis of T2DM
among heavy alcohol drinkers and this has been
shown by some studies to be mediated by
increased obesity, especially abdominal obesity.
Literature showed varied association of alcohol
consumption and increased risk of diabetes (Wei
et al., 2000 and Howard, 2004). The present study
was cross-sectional community based study in
rural population of North Karnataka and there were
no other studies which reported the prevalence
and associated risk factor for T2DM in this region.
CONCLUSIONA high prevalence of type 2 diabetes was noted
in the rural population of North Karnataka. In the
present study it was observed that advanced age,
occupational changes, BMI, substance abuse like
alcohol and smoking, truncal obesity and family
history of diabetes were highly associated risk
factors for T2DM whereas literacy, gender and
central obesity showed no association with risk
of T2DM. This study created awareness of
diabetes and its complication in rural population
of this region. The baseline data of the present
study regarding the prevalence of T2DM and its
associated risk factors could be useful for
implementation of the National Program for
control of Diabetes, cardiovascular diseases and
Stroke (NPDCS). Therefore, future research in
this direction is a need of the time.
ACKNOWLEDGMENTThe authors thank all participants, Medical
officers, ASHA workers of all three Primary Health
Centres (PHCs), Statistician Mr. M D Mallapur for
their participation and cooperation throughout the
study. The authors are grateful to the department
of community medicine and department of
biochemistry for their support and help during the
study. Author expresses cordial thanks to all the
teaching, postgraduates’ students and non-
teaching faculty of the department of physiology
for encouragement, support and guidance during
the study.
REFERENCES1. Agardh E, Allebeck P, Hallqvist J, Moradi T
and Sidorchuk A (2011), “Type 2 diabetes
incidence and socio-economic position: a
systematic review and meta-analysis”, Int J
Epidemiol., June, Vol. 40, No. 3, pp. 804-18.
doi: 10.1093/ije/dyr029. Epub 2011 Feb 19.
2. American Diabetes Association ADA (2001),
“Standard of medical care for patients with
12
Int. J. Pharm. Med. & Bio. Sc. 2014 Sanjay D Bhalerao et al., 2014
diabetes mellitus”, Diabetes Care, Vol. 24
(suppl 1), pp. S33-S43.
3. AshwinKamath, Shivprakash G and
PrabhaAdhikari (2011), “Body mass Index
and Waist circumference in type 2 diabetes
mellitus patient attending diabetic clinic”, Int
J Biol Med Res., Vol. 2, No. 3, pp. 636-638.
4. Bhalerao S D, Manjunath Somannavar and
Shivprasad S Goudar (2013), “Prevalence of
type 2 Diabetes in rural population of North
Karnataka-A community based cross
sectional study”, Biomedicine, Vol. 33, No. 2.
5. Chaturvedi N, Stephenson J and Fuller J
(1996), “The relationship between
socioeconomic status and diabetes control
and complications in the EURODIAB IDDM
Complications Study”, Diabetes Care, Vol.
19, pp. 423-430.
6. Chobanian A V, Bakris G L, Black H R,
Cusman W C, Green LA, IzzoJ LJr, et al.
(2003), “The seventh report of the Joint
national committee on prevention, detection,
evaluation and treatment of high blood
pressure: The JNC report”, JAMA, Vol. 289,
pp. 2560-72.
7. Chow C, Raju P and Raju R (2006), “The
pre Prevalence and management of
diabetes in rural India”, Diabetes Care, Vol.
29, pp. 1717-18.
8. Chythra R Rao, Veena G Kamath, Avinash
Shetty and AshaKamath (2010), “A study on
the prevalence of type 2 diabetes in costal
Karnataka”, Int J DiabDevCtries., Vol. 30,
No. 2.
9. Di Nardo F, Burattini R, Cogo C E, Faelli E
and Ruggeri P (2009), “Age-related analysis
of insulin resistance, body weight and
arterial pressure in the Zucker fatty rat”,
ExpPhysiol, Vol. 94, pp. 162-168.
10. Gavin J Putzar, Arnold M Ranirez, Kelvin
Sneed, H J Brownlee et al. (2004),
“Prevalence of patient with type 2 diabetes
mellitus reaching American diabetes
association target guidelines in a university
primary care setting”, Southern medical
journal, Vol. 97, No. 2.
11. Govt. of India (2004), “Directorate General
of Employment & Training. National
Classification of Occupations - 2004”,
Ministry of Labour, Government of India 2004,
dget.nic.in/nco/preface.pdf,Cited on 8
January 2013.
12. Howard A, Arnsten J and Gourevitch M
(2004), “Effect of alcohol consumption on
diabetes mellitus”, Annals of Internal
Medicine; Vol. 140, pp. 211-219.
13. Jazet I M, Piji H and Meinders A E (2003),
“Adipose tissue, an endocrine organ:
imparts on insulin resistance”, Neth J MED,
Vol. 61, pp. 194-212.
14. Kahn B B and Flier J S (2000), “Obesity and
insulin resistance”, J Clin Invest, Vol. 104,
pp. 473-481.
15. Khan S, Hull R and Utzschneider K(2006),
“Review Article Mechanisms linking obesity
to insulin resistance and type 2 diabetes”,
Nature; Vol. 444, pp. 840-846.
16. Khatib N M, Quazi Z S, Gaidhane A M,
Wagjare T S and Goyal R C (2008), “Risk
factors of type 2 diabetes mellitus in rural
wardha: A community based study”, Int J
Diabetes DevCtries, Vol. 28, pp. 79-82.
17. Kokiwar P, Gupta S and Durge P (2007),
13
Int. J. Pharm. Med. & Bio. Sc. 2014 Sanjay D Bhalerao et al., 2014
“Prevalence of diabetes in a rural area of
central India”, Int J Diabetes DevCtries, Vol.
27, No. 1, pp. 8-10.
18. Majagi S M, Soudarssanne B M, Roy G and
Das A K (2012), “Risk factors of diabetes
mellitus in rural Pondicherry”, Online J
Health Scs, Vol. 11, No. 1, p. 4.
19. Meigs J, Cupples L and Wilson P (2000),
“Parental transmission of type 2 diabetes:
the Framingham Offspring Study”,
DiabetesCare, Vol. 49, No. 12, pp. 2201-
2207.
20. Mohan V, Mathur P, Deepa R et al. (2008),
“Urban rural differences in prevalence of
self-reported diabetes in India the WHO-
ICMR Indian NCD risk factor surveillance”,
DiabetesResearch Clinical Practice, Vol. 80,
pp. 159-168.
21. Nakanishi N, Nakamura K, Matsuo Y et al.
(2000), “Cigarette Smoking and Risk for
Impaired Fasting Glucose and Type 2
Diabetes in Middle-Aged Japanese Men”,
Annals of Internal Medicine, Vol. 133, pp.
183-191.
22. Non-communicable Diseases and Mental
Health (2003), “STEPS Field Manual
Appendices. Geneva: World Health
Organization” 2003; 1-31, Http://www.idf.org/
w e bda t a / d oc s / G G T2 D% 2 001% 20
Screening%20and%20diagnosis.pdf, Cited
on January 8, 2013.
23. Prabhakaran D, Chaturvedi V and
Ramakrishnan L (2005), “Risk factors
related to the development of diabetes in
men working in a north Indian industry”,
National Medical Journal of India, Vol. 20,
No. 1, pp. 4-10.
24. Ramchandran A, Das A K, Joshi S R, Rajnik
C S, Shah S, Prassanna Kumar K M et al.
(2010), “Current status of diabetes in India
and Need for Novel Therapeutic Agents”,
JAPI, Vol. 58.
25. Ramchandran A, Snehalata C, Baskar A D,
Mary S, Kumar C K, Selvam S et al. (2004),
“Temporal changes in prevalence of
diabetes and impaired glucose tolerance
associated with life style transition occurring
in the rural population in india”, Diabetologia,
Vol. 47, pp. 860-5
26. Report of world health organization
consultation (1995), “Physical status: The
use and interpretation of anthropometry”,
Geneva, Switzerland: World health
organization; WHO Tech Rep Ser No.845,
H t t p : / / w h q l i b d o c . w h o . i n t / t r s /
WHO_TRS_854.pdf, cited on 22 July 2009.
27. Report of World Health Organization
Consultation (2000). Obesity: Preventing
and managing the global epidemic. Geneva,
Switzerland: World Health Organization;
WHO Tech RespSer No.894, Http://
whqlibdoc.who.int/trs/who_trs_916.pdf, cited
9 January 2013.
28. Sadikot S, Nigam A and Das S (2004), “The
burden of diabetes and impaired fasting
glucose in India using the ADA1997 criteria:
prevalence of diabetes in India study
(PODIS)”, Diabetes Research and Clinical
Practice, Vol. 66, pp. 293-300.
29. Sakai Y, Yamaji T, Tabata S et al. (2006),
“Relation of alcohol use and smoking to
glucose tolerance status in Japanese men”,
Diabetes Research Clinical Practice, Vol.
73, pp. 83-88.
14
Int. J. Pharm. Med. & Bio. Sc. 2014 Sanjay D Bhalerao et al., 2014
30. Snehalatha C, Viswanathan V and
Ramachandran A(2003), “Cutoff values for
normal anthropometric variables in Asian
Indian Adults”, Diabetes Care Vol.26:1380-
1384.
31. Toshimi S, Hiroyasu I, Akio N, Takako H,
Fujiko I, Yoko S, Atsushi M, Hisayuki F. et al.
(2004), “Cigarette smoking and risk of type
2 diabetes mellitus among middle-aged and
elderly Japanese men and women”, Am J
Epidemiol., Vol. 160, pp. 158-162.
32. Training for middle level manager. Expanded
program on immunization world health
organization.(1991), Http//whqlibdoc.who.int/
hq/1991/WHO_EPI_MLM_91.1.Pdf.Cited
on 8 January 2013.
33. UK prospective Diabetes study group
(1998), “Tight blood pressure control and
risk of microvascular and microvascular
complication in type 2 diabetes (UKPDS
33)”, Lancet, Vol. 352, pp. 837-853.
34. UNESCO (1997), International Standard
Classification of Education ISCED (1997),
Http://tuikapp.tuik.gov.tr/DIESS/FileUpload/
yayinlar/ISCDE_2011_draft.pdf, Cited on 9
January 2013.
35. Viswanathan M, McCarthy M, Snehalatha C
et al. (1996), “Familial aggregation of Type
2 (non-insulin-dependent) diabetes mellitus
in south India: absence of excess maternal
transmission”, Diabetic Medicine, Vol. 13,
pp. 232-237.
36. Wei M, Gibbons L, Mitchell T et al. (2000),
“Alcohol intake and incidence of type 2
Diabetes in men”, DiabetesCare Vol. 23 (1),
pp. 18-22.
37. Wild S, Roglic G, Green A, Sicree R and
King H (2004), “Global prevalence of
diabetes: estimates for the year 2000 and
projections for 2030”, Diabetes Care, Vol.
27, pp. 1047-53.
38. World Health Organization (1999),
Definition, Diagnosis and Classification of
Diabetes Mellitus and its Complications.
Geneva: Department of Non-communicable
Disease Surveillance, Http://whqlibdoc.who.
int/hq/1999/ who_ncd_ncs_ 99.2.pdf, Cited
on 9 January 2013.
39. World Health Organization (2000), “The Asia
Pacific Perspective. Redefining Obesity and
its treatment. International Association for
the study of obesity and international obesity.
Task Force”, International Diabetes Institute:
Melbourne: Health communication, Http://
b i o tec h . l aw. l s u .edu / obes i t y /w ho /
obesity_final.pdf, cited on 8 January 2013.
40. World Health Organization (2008), Http://
www.who.int/nmh/Actionplan-PC-NCD-
2008.pdf, cited 12 April 2011.


