

1RISKS LINKED TO THE MACRO-FINANCIAL ENVIRONMENT

BANCO DE ESPAÑA 24 FINANCIAL STABILITY REPORT. AUTUMN 2021 1. RISKS LINKED TO THE MACRO-FINANCIAL ENVIRONMENT
BANCO DE ESPAÑA 25 FINANCIAL STABILITY REPORT. AUTUMN 2021 1. RISKS LINKED TO THE MACRO-FINANCIAL ENVIRONMENT
The headway made in global vaccination is helping to reduce restrictions on
activity, despite some heterogeneity by geographical area. This has translated into
a relatively widespread economic recovery. It is also reflecting in lower uncertainty,
a favourable macroeconomic outlook in the medium and long term and an
improvement in the non-financial sectors’ financial position. However, certain
segments continue to show greater financial vulnerability than before the COVID-19
crisis. At the same time, risks linked to the adverse unfolding of the pandemic, to
the recent disruptions in the global production chains and to a sharper and more
persistent than expected increase in inflation, which could lead to a faster
withdrawal of monetary stimuli than anticipated by the financial markets, persist.
The materialisation of these risks might trigger abrupt asset price corrections in
the international markets, adversely impacting economic growth and financial
intermediaries’ credit risk. Greater buoyancy in demand and prices has also been
observed in the Spanish real estate market, but the risks to financial stability
appear to be contained for the time being.
1.1 Macroeconomic environment
1.1.1 Systemic and materially significant countries
Globaleconomicactivityhascontinuedtorecover in2021,albeitatamore
moderate pace in recent months. Against a backdrop of the spread of the
COVID-19 Delta variant, activity patterns in advanced and emerging market
economies have tended to diverge (see Chart 1.1.1), in good measure owing to the
uneven levels of vaccination and to the differences in economic policy support.1
Also, the appearance of bottlenecks in the global supply chains, prompted among
other factors by the rapid recovery in demand in advanced countries and by rising
commodity and transport prices, is affecting production, particularly in the
manufacturing sector (see Chart 1.1.2).2
The recovery of activity has been accompanied globally by considerable
inflation rate hikes (see Chart 1.1.3). These increases arise from various
idiosyncratic factors which are, in principle, temporary. They include the base effects
1 See QuarterlyreportontheSpanisheconomy2021Q3, Economic Bulletin.
2 See Box 3 “Euro area manufacturing bottlenecks”, Quarterly report on the Spanish economy 2021 Q3,Economic Bulletin.
1 RISKS LINKED TO THE MACRO-FINANCIAL ENVIRONMENT

BANCO DE ESPAÑA 26 FINANCIAL STABILITY REPORT. AUTUMN 2021 1. RISKS LINKED TO THE MACRO-FINANCIAL ENVIRONMENT
derived from sharp falls in some services prices recorded at the height of the
pandemic; the rise in energy and commodity prices from the abnormally low levels
recorded in the summer of 2020; and, in 2021 Q3, the aforementioned impact of the
global value chain disruptions on industrial prices and their potential pass-through
to consumer prices. In certain areas, the degree of fiscal policy expansion necessary
to speed up the recovery may also be playing a role.
The easing of restrictions to mobility has helped to consolidate the economic recovery over 2021, albeit with diverging outlooks between advanced and emerging market economies as a result of uneven vaccination rates and degrees of economic policy support. Global inflation rates have increased in recent months, in principle owing to temporary factors.
THE GLOBAL ECONOMY CONTINUES TO RECOVER IN 2021, BUT WITH DOWNSIDE RISKS DERIVING FROM UNCERTAINTYOVER THE UNFOLDING OF THE PANDEMIC, THE PERSISTENCE OF BOTTLENECKS AND A POSSIBLE TIGHTENING OFFINANCIAL CONDITIONS
Chart 1.1
SOURCES: IHS Markit, national statistics and Institute of International Finance Global Debt Monitor.
a The levels of debt in 2019 Q4 are shown in solid colours while the change between 2019 Q4 and 2021 Q2 is shown in translucid colours.
20
25
30
35
40
45
50
55
60
65
Feb-19 Aug-19 Feb-20 Aug-20 Feb-21 Aug-21
MANUFACTURING - ADVANCED MANUFACTURING - EMERGING
SERVICES - ADVANCED SERVICES - EMERGING
1 PMI IN ADVANCED AND EMERGING MARKET ECONOMIES
Index
15
20
25
30
35
40
45
50
55
Jun-19 Sep-19 Dec-19 Mar-20 Jun-20 Sep-20 Dec-20 Mar-21 Jun-21 Sep-21
EURO AREA UNITED STATES
UNITED KINGDOM JAPAN
Index
2 PMI MANUFACTURING: SPEED IN SUPPLIER DELIVERY TIMES
Longerdelivery times
JapanFranceSpain
Euro areaUnited Kingdom
United StatesChina
GermanyBrazilIndia
TurkeyMexico
-50 50 150 250 350 450
HOUSEHOLDS HOUSEHOLDS (INDUCED BY THE PANDEMIC)NFCsNFCs (INDUCED BY THE PANDEMIC)GENERAL GOVERNMENTGENERAL GOVERNMENT (INDUCED BY THE PANDEMIC)
4 DEBT BY INSTITUTIONAL SECTOR (a)
% of GDP
-1
0
1
2
3
4
5
6
Jan-19 Jan-20 Jan-21
EURO AREA - TOTAL EURO AREA - CORE
UNITED STATES - TOTAL UNITED STATES - CORE
UNITED KINGDOM - TOTAL UNITED KINGDOM - CORE
3 INFLATION IN ADVANCED ECONOMIES
%
BANCO DE ESPAÑA 27 FINANCIAL STABILITY REPORT. AUTUMN 2021 1. RISKS LINKED TO THE MACRO-FINANCIAL ENVIRONMENT
Thecurrentmedium-termprospectsofconsolidationoftheglobaleconomic
recoveryanda return tomoderate inflation ratesare subject to significant
uncertainties. The progressive resolution of the global health crisis, on which the
outlook of ongoing improvement in activity is based, is not guaranteed. The main
risks include the slow pace of vaccination outside the main advanced economies
and the possible spread of new, more resistant and infectious variants of the virus.
Despite the prevalence of negative output gaps, the sectoral mismatches that are
arising between a buoyant demand and a supply that is slower to respond to the
recovery, owing to the appearance of bottlenecks causing recent increases in certain
prices, may be more persistent than expected. This could lead to second-round
effects and to core inflationary pressures as a result of the de-anchoring of inflation
expectations, particularly in economies with a low level of monetary policy credibility.
Despite the favourable expectations for internal demand, especially in the
advanced economies, the recovery continues to depend on the adequate
calibrationofmonetaryandfiscalpolicystimuli. A premature withdrawal of such
support may have highly adverse consequences. Thus, a faster and more intense
normalisation of monetary policy than expected, particularly in the United States,
might lead to abrupt corrections in asset prices. These corrections would bring
about adverse effects on global financial conditions and activity in a setting of high
vulnerability owing to the significant increase in public and private debt in many
countries (see Chart 1.1.4). Likewise, an early withdrawal of fiscal stimuli in other
areas, owing to possible political or market pressures, could lead to a reassessment
of expectations regarding the repayment capacity of the most heavily indebted
private agents, particularly non-financial corporations. The recent liquidity difficulties
and the possible insolvency of China’s main real estate company, Evergrande, which
had resorted heavily to external financing over the last five years, illustrates the types
of risks generated by the above-mentioned increase in indebtedness. In the
hypothetical case that these problems were to extend to the rest of the real estate
sector or to the Chinese financial system, there would be severe consequences for
growth in China, with contagion effects for the rest of the world.
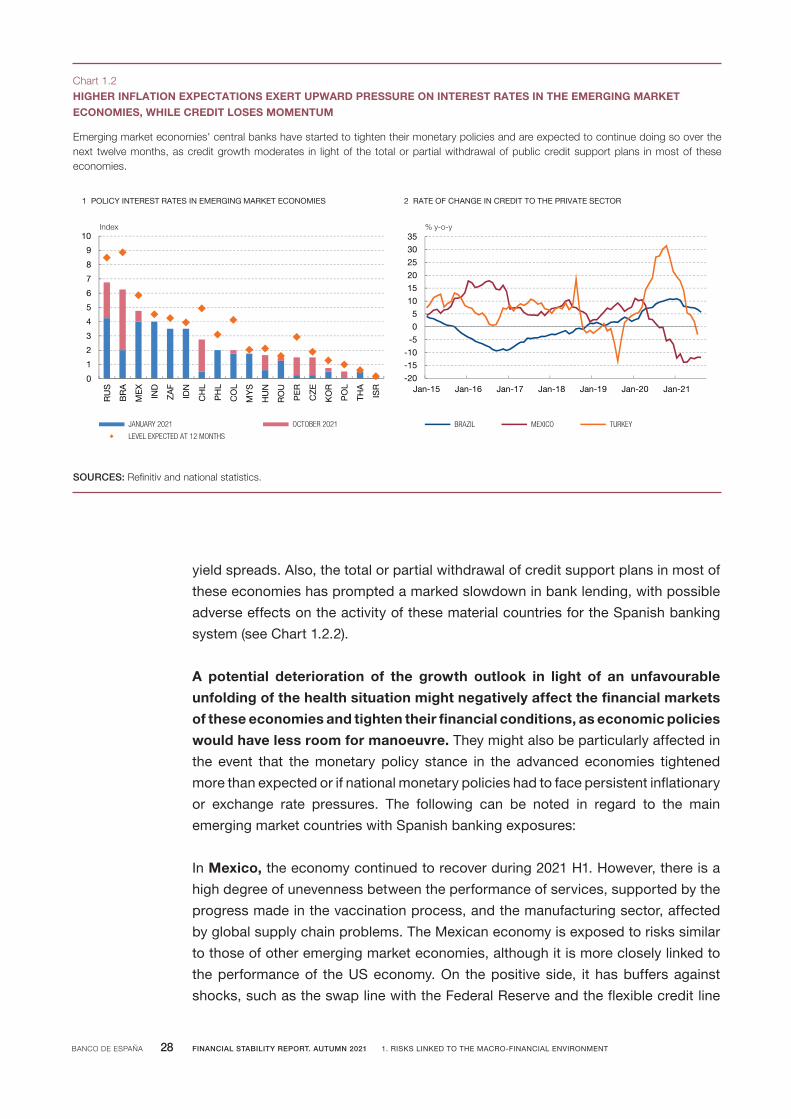
Financial conditions have tightened somewhat in the emerging market
economies,althoughtheycontinuetobegloballyfavourable.The increase in
inflation has led to the start of a cycle of policy interest rate hikes in many countries
in Latin America3 and Eastern Europe, to avoid possible second-round effects and a
de-anchoring of inflation expectations (see Chart 1.2.1). Also, economies with greater
fiscal vulnerabilities, or those recording episodes of social and political tension, have
observed an increase in local-currency long-term interest rates, a depreciation of
their currencies against the dollar and an increase in the external sovereign debt
3 See the ReportontheLatinAmericaneconomy.Secondhalfof2021.Outlook,vulnerabilitiesandpolicyspace, October 2021.
BANCO DE ESPAÑA 28 FINANCIAL STABILITY REPORT. AUTUMN 2021 1. RISKS LINKED TO THE MACRO-FINANCIAL ENVIRONMENT
yield spreads. Also, the total or partial withdrawal of credit support plans in most of
these economies has prompted a marked slowdown in bank lending, with possible
adverse effects on the activity of these material countries for the Spanish banking
system (see Chart 1.2.2).
A potential deterioration of the growth outlook in light of an unfavourable
unfoldingofthehealthsituationmightnegativelyaffectthefinancialmarkets
oftheseeconomiesandtightentheirfinancialconditions,aseconomicpolicies
wouldhavelessroomformanoeuvre.They might also be particularly affected in
the event that the monetary policy stance in the advanced economies tightened
more than expected or if national monetary policies had to face persistent inflationary
or exchange rate pressures. The following can be noted in regard to the main
emerging market countries with Spanish banking exposures:
In Mexico, the economy continued to recover during 2021 H1. However, there is a
high degree of unevenness between the performance of services, supported by the
progress made in the vaccination process, and the manufacturing sector, affected
by global supply chain problems. The Mexican economy is exposed to risks similar
to those of other emerging market economies, although it is more closely linked to
the performance of the US economy. On the positive side, it has buffers against
shocks, such as the swap line with the Federal Reserve and the flexible credit line
Emerging market economies' central banks have started to tighten their monetary policies and are expected to continue doing so over the next twelve months, as credit growth moderates in light of the total or partial withdrawal of public credit support plans in most of these economies.
HIGHER INFLATION EXPECTATIONS EXERT UPWARD PRESSURE ON INTEREST RATES IN THE EMERGING MARKET ECONOMIES, WHILE CREDIT LOSES MOMENTUM
Chart 1.2
SOURCES: Refinitiv and national statistics.
0
1
2
3
4
5
6
7
8
9
10
RU
S
BR
A
ME
X
IND
ZA
F
IDN
CH
L
PH
L
CO
L
MY
S
HU
N
RO
U
PE
R
CZ
E
KO
R
PO
L
THA
ISR
JANUARY 2021 OCTOBER 2021
LEVEL EXPECTED AT 12 MONTHS
Index
1 POLICY INTEREST RATES IN EMERGING MARKET ECONOMIES
-20
-15-10
-5
05
10
1520
25
3035
Jan-15 Jan-16 Jan-17 Jan-18 Jan-19 Jan-20 Jan-21
BRAZIL MEXICO TURKEY
2 RATE OF CHANGE IN CREDIT TO THE PRIVATE SECTOR
% y-o-y

BANCO DE ESPAÑA 29 FINANCIAL STABILITY REPORT. AUTUMN 2021 1. RISKS LINKED TO THE MACRO-FINANCIAL ENVIRONMENT
with the International Monetary Fund. However, political uncertainty in the domestic
and international fronts might negatively affect investment, which has been sluggish
in recent years.4
In Brazil GDP growth stagnated in Q2, after a surprising rise in Q1. The country
continues to accumulate imbalances in fiscal territory. Public debt is close to 90% of
GDP and largely financed at interest rates linked to inflation or to the policy interest
rate, which share a very pronounced upward trend. In addition, this debt is mostly
acquired by domestic banks or their investment funds, which raises the sovereign-
bank nexus risk. Against this backdrop, the fiscal adjustment envisaged is subject to
significant uncertainties. Political tensions have also increased significantly, and
they are not expected to weaken in the short term in view of next year’s presidential
elections. Indeed, Brazil’s financial markets have performed relatively worse, feeding
back into fiscal vulnerabilities.
In Turkey, in 2021 H1 the economy continued to show significant buoyancy and
notable imbalances which, however, have moderated with the gradual withdrawal
of some stimulus measures such as the credit support. Bank lending slowed
notably, with the exception of consumer loans, which maintained a strong growth
rate. Although still significant, the current account deficit has decreased.
Nonetheless, inflation has rebounded, standing at 19.6% year-on-year in
September. Against a backdrop of sizeable external financing needs and very low
international reserves, the Turkish economy’s biggest risk is the loss of confidence
from the financial markets. This could be the result of reductions in policy interest
rates, as occurred in September and October, that may prove to be early or greater
than that discounted by investors.
1.1.2 Spain
The baseline projections for the Spanish economy envisage, for the short
term,acontinuedrecovery,favouredbytheheadwaymadeinthevaccination
campaign,theconsequentliftingofthepandemiccontainmentmeasuresand
theeconomicpolicysupport. This would help to recover the pre-health crisis level
of activity over the horizon considered in the Banco de España’s most recent
projections, which cover up to 20235 (see Chart 1.3.1). Activity would grow more
during the first half of the projection period, boosted by the epidemiological
improvement and by the implementation of NGEU programme projects.
4 An example of external tensions in the case of Mexico is the application of the U.S.-Mexico-Canada tradeagreement(USMCA)rules,whichwerewordedambiguouslyandleaveroomfordifferentinterpretations.Inrecentmonths,divergenceshavearisenbetweentheUnitedStatesandtheothertreatymemberswhichmightparticularlyaffecttheMexicanautomotivesector.
5 SeeBox1“MacroeconomicprojectionsfortheSpanisheconomy(2021-2023)”,QuarterlyreportontheSpanisheconomy, September 2021.

BANCO DE ESPAÑA 30 FINANCIAL STABILITY REPORT. AUTUMN 2021 1. RISKS LINKED TO THE MACRO-FINANCIAL ENVIRONMENT
Uncertainty regarding theSpanisheconomy’sgrowthpathhasdeclined, in
line with the recent improvements in the health and economic situation. Recent
favourable epidemiological and economic developments in Spain have helped to
reduce uncertainty over economic growth in the short and medium terms, in line
with the behaviour observed in other advanced economies (see Chart 1.3.2).
YetdevelopmentsintheSpanisheconomyareinfluencedbyseveralfactors,
includingthepossibilityofgreaterpersistenceofdisruptionstoglobalvalue
chainsandincreasinginflation. First, if the supply problems recently observed in
the global production chains ultimately weigh down on economic activity worldwide
markedly and persistently, certain industrial sectors in Spain will be affected more
durably. Another downside risk to activity, which has recently grown stronger, is the
possibility of an increase in commodities and intermediate goods prices that is less
temporary than currently assumed, with the consequent compression of households’
and firms’ income in real terms. This greater persistence could lead to the transfer of
cost increases to final prices and wage demands, resulting in a more pronounced
and long-lasting rise in inflation than that anticipated at this point in time.
The projections for the Spanish economy envisage high buoyancy in activity in 2021 and 2022, underpinned by the normalisation of economic relations and the maintenance of economic policy support. The pre-COVID-19 level of activity would recover over the forecast horizon, which covers up to 2023. The most significant downside risks include the potential negative effect of bottlenecks in the global production chains and a more persistent inflation increase than currently expected. Some uncertainty persists, although less than in previous quarters, over the health situation, which affects certain sectors in particular (e.g. accommodation and food service activities).
THE BASELINE FORECASTS FOR THE SPANISH ECONOMY ENVISAGE HIGH DYNAMISM AT SHORT TERM, ALTHOUGHCERTAIN ECONOMIC AND HEALTH RISKS PERSIST
Chart 1.3
SOURCES: Instituto Nacional de Estadistico and Banco de España.
a The Banco de España’s September 2021 macroeconomic projections are shown. Their cut-off date was 14 September 2021 and they included the data available to that date, specifically the GDP flash estimate for 2021 Q2. Subsequently, the INE has published new data, which include the revision of Q2 and previous quarters and the flash estimate for 2021 Q3.
b See C. Ghirelli et al. (2021), "Measuring economic and economic policy uncertainty and their macroeconomic effects: the case of Spain", Empirical Economics. A decline in this indicator, constructed on the basis of the standard deviation of forecasters' projections of changes in GDP for 2021 and 2022, reflects greater certainty over the behaviour of this macroeconomic aggregate over this period.
0.0
0.1
0.2
0.3
0.4
0.5
0.6
0.7
0.8
0.9
1.0
Jan-19 May-19 Sep-19 Jan-20 May-20 Sep-20 Jan-21 May-21 Sep-21
2 INDICATOR OF DISAGREEMENT OVER GDP EXPERT FORECASTS FOR 2021 AND 2022 (b)
75
80
85
90
95
100
105
Q4 Q1 Q2 Q3 Q4 Q1 Q2 Q3 Q4 Q1 Q2 Q3 Q4 Q1 Q2 Q3 Q4
2019 2020 2021 2022 2023
SEPTEMBER FORECAST REVISED
1 REAL GDP IN SPAIN. LEVEL (a)(100 = 2019 Q4)

BANCO DE ESPAÑA 31 FINANCIAL STABILITY REPORT. AUTUMN 2021 1. RISKS LINKED TO THE MACRO-FINANCIAL ENVIRONMENT
Certaindownsiderisksrelatedtotheunfoldingofthepandemicanditsimpact
oneconomicactivityalsopersist.These downside risks are related to the spread
of new COVID-19 variants potentially more resistant to vaccines, which could lead to
reinstating restrictions to mobility. They may also be related to the more persistent
effects of the crisis on the business sector and employment. By contrast, if the
health situation improves faster than forecast, economic growth might also gain
momentum, mainly owing to a more pronounced freeing up by households of the
stock of savings generated during the pandemic or to an early reactivation of
spending by foreign tourists.
1.2 Financial markets and the real estate sector
1.2.1 Financial markets
The stock market indices in the main developed economies have tended to
appreciateoverthelastfewmonths.This was underpinned by the progress made
in the vaccination campaign, the maintenance of an accommodative monetary policy
stance and better corporate earnings than anticipated by the markets. However,
some episodes of stock market price corrections have also been observed, mainly
linked to fears regarding the impact of the spread of the COVID-19 Delta variant on
economic growth, to the fear of a contagion effect of the Chinese Evergrande real
estate crisis and to investor concerns about inflationary pressures possibly leading
to the withdrawal of monetary stimuli earlier than envisaged. The S&P 500 index
reached new all-time highs, accumulating a gain of 8.7% at the cut-off date for this
report with respect to the levels at end-April. In the same period the EURO STOXX 50
appreciated by 5.4%, while the IBEX 35 rose less (1.0%), affected by the negative
impact of the spread of the pandemic in Spain over the summer in the sectors most
exposed to it, such as leisure and tourism (see Chart 1.4.1).
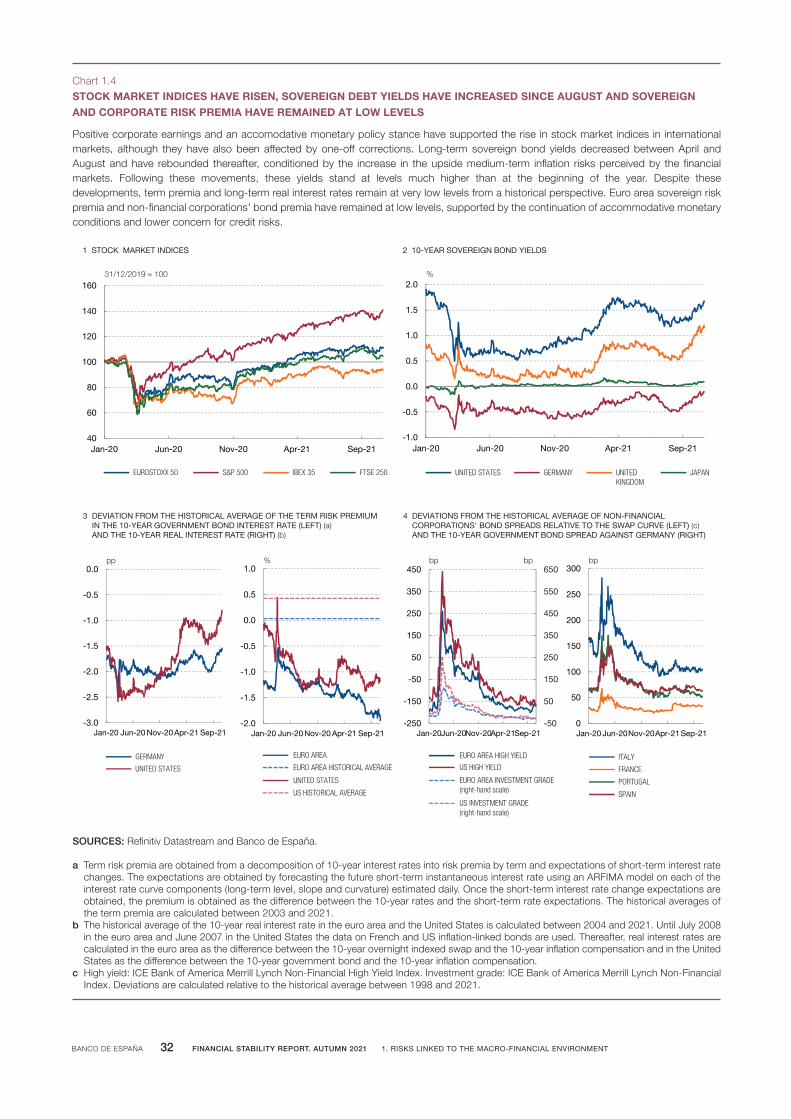
Thelong-termyieldsofhigher-ratedsovereignbondsfellbetweenApriland
end-August and have rebounded since then, while sovereign and corporate
risk premia have remained at low levels. The increase in long-term risk-free
interest rates in recent months is linked to the rise in the upside medium-term
inflation risks perceived by the financial markets. Following these movements, the
long-term yields of higher-rated sovereign bonds stand at levels close to or even
above (in the case of the UK and German benchmarks) those seen in Spring and
much higher than posted at the start of the year (see Chart 1.4.2). The estimates
available also point to an increase in term premia in recent months, although they
currently remain well below their historical averages (see Chart 1.4.3). Also, since
August long-term real interest rates have risen less than nominal interest rates
(United States) or have even continued to fall in certain areas (the euro area), reaching
highly negative levels (close to their all-time lows). This very low level of long-term
BANCO DE ESPAÑA 32 FINANCIAL STABILITY REPORT. AUTUMN 2021 1. RISKS LINKED TO THE MACRO-FINANCIAL ENVIRONMENT
Positive corporate earnings and an accomodative monetary policy stance have supported the rise in stock market indices in international markets, although they have also been affected by one-off corrections. Long-term sovereign bond yields decreased between April and August and have rebounded thereafter, conditioned by the increase in the upside medium-term inflation risks perceived by the financial markets. Following these movements, these yields stand at levels much higher than at the beginning of the year. Despite these developments, term premia and long-term real interest rates remain at very low levels from a historical perspective. Euro area sovereign risk premia and non-financial corporations' bond premia have remained at low levels, supported by the continuation of accommodative monetary conditions and lower concern for credit risks.
STOCK MARKET INDICES HAVE RISEN, SOVEREIGN DEBT YIELDS HAVE INCREASED SINCE AUGUST AND SOVEREIGNAND CORPORATE RISK PREMIA HAVE REMAINED AT LOW LEVELS
Chart 1.4
SOURCES: Refinitiv Datastream and Banco de España.
a Term risk premia are obtained from a decomposition of 10-year interest rates into risk premia by term and expectations of short-term interest rate changes. The expectations are obtained by forecasting the future short-term instantaneous interest rate using an ARFIMA model on each of the interest rate curve components (long-term level, slope and curvature) estimated daily. Once the short-term interest rate change expectations are obtained, the premium is obtained as the difference between the 10-year rates and the short-term rate expectations. The historical averages of the term premia are calculated between 2003 and 2021.
b The historical average of the 10-year real interest rate in the euro area and the United States is calculated between 2004 and 2021. Until July 2008 in the euro area and June 2007 in the United States the data on French and US inflation-linked bonds are used. Thereafter, real interest rates are calculated in the euro area as the difference between the 10-year overnight indexed swap and the 10-year inflation compensation and in the United States as the difference between the 10-year government bond and the 10-year inflation compensation.
c High yield: ICE Bank of America Merrill Lynch Non-Financial High Yield Index. Investment grade: ICE Bank of America Merrill Lynch Non-Financial Index. Deviations are calculated relative to the historical average between 1998 and 2021.
-3.0
-2.5
-2.0
-1.5
-1.0
-0.5
0.0
Jan-20 Jun-20 Nov-20 Apr-21 Sep-21
GERMANY
UNITED STATES
3 DEVIATION FROM THE HISTORICAL AVERAGE OF THE TERM RISK PREMIUM IN THE 10-YEAR GOVERNMENT BOND INTEREST RATE (LEFT) (a) AND THE 10-YEAR REAL INTEREST RATE (RIGHT) (b)
pp
40
60
80
100
120
140
160
Jan-20 Jun-20 Nov-20 Apr-21 Sep-21
EUROSTOXX 50 S&P 500 IBEX 35 FTSE 250
1 STOCK MARKET INDICES
31/12/2019 = 100
-2.0
-1.5
-1.0
-0.5
0.0
0.5
1.0
Jan-20 Jun-20 Nov-20 Apr-21 Sep-21
%
-1.0
-0.5
0.0
0.5
1.0
1.5
2.0
Jan-20 Jun-20 Nov-20 Apr-21 Sep-21
UNITED STATES GERMANY UNITED KINGDOM
JAPAN
2 10-YEAR SOVEREIGN BOND YIELDS
%
-50
50
150
250
350
450
550
650
-250
-150
-50
50
150
250
350
450
Jan-20Jun-20Nov-20Apr-21Sep-21
4 DEVIATIONS FROM THE HISTORICAL AVERAGE OF NON-FINANCIALCORPORATIONS' BOND SPREADS RELATIVE TO THE SWAP CURVE (LEFT) (c) AND THE 10-YEAR GOVERNMENT BOND SPREAD AGAINST GERMANY (RIGHT)
pbpb
0
50
100
150
200
250
300
Jan-20 Jun-20Nov-20Apr-21 Sep-21
ITALY
FRANCE
PORTUGAL
SPAIN
bp
EURO AREA
EURO AREA HISTORICAL AVERAGE
UNITED STATES
US HISTORICAL AVERAGE
EURO AREA HIGH YIELD
US HIGH YIELD
EURO AREA INVESTMENT GRADE(right-hand scale)
US INVESTMENT GRADE(right-hand scale)

BANCO DE ESPAÑA 33 FINANCIAL STABILITY REPORT. AUTUMN 2021 1. RISKS LINKED TO THE MACRO-FINANCIAL ENVIRONMENT
risk-free real interest rates appears to be linked to various structural factors
(demographic factors, low productivity growth, greater inequality, high demand for
safe assets, etc.) and to other more conjunctural factors, such as, in particular,
central banks’ asset purchase programmes. This factor has continued contributing
to euro area sovereign risk and non-financial corporations bond premia remaining at
low levels (see Chart 1.4.4). The latter, except in the high yield segment in the euro
area, have even declined in recent months, currently standing below their historical
average. This might be due to lower market concern for non-financial corporations’
credit risks, which would be in line with the more favourable performance of defaults
and the positive balance between upward and downward credit rating revisions in
recent months. However, around one third of the outstanding balance of debt
issuances in the euro area with BBB rating continues to have a negative outlook. Box
1.1 analyses in depth the factors determining sovereign debt long-term interest rates
in Europe and the United States.
Apotentialearlierthanexpectedwithdrawalbythemarketsofcentralbanks’
monetary stimuli might raise long-term risk-free interest rates further and
trigger corrections in asset prices. This scenario could materialise, for example,
if the rise in inflation observed in the advanced economies were more persistent
than anticipated. The possible increase in yields could be transferred more intensely
to corporate bonds, since their risk premia are abnormally low according to their
historical relationship with their usual determinants, such as enterprise value and
uncertainty over enterprise value, leveraging and risk aversion (see Chart 1.5.1). This
seems to be related to the persistence of very accommodative monetary conditions.6
In the stock markets, although risk premia do not appear to have been so influenced
by expansionary monetary policies and are currently above their historical average,
these developments could lead to a fall in share prices. In fact, their current high
level, compared with firms’ earnings, seems to be largely due to low long-term real
interest rates (see Chart 1.5.2). In any event, the impact of an increase in long-term
interest rates on the price of risk-bearing assets would probably be cushioned if this
movement were accompanied by an improvement in the macroeconomic outlook,
given the beneficial effect this would have on the economic and financial position of
the issuers of these assets.
Underthishypotheticalcorrectionscenario,therewouldalsobeatightening
offinancingconditionswithpossibleadverseimplicationsforcreditrisk.First,
this shock could reduce economic agents’ spending, negatively affecting economic
growth. Second, in this scenario, indebted agents’ financial burden would tend to
increase, although the speed and intensity of this effect would depend on the structure
of their liabilities and on how interest rates evolve over the different maturities.
6 Forfurtherdetails,seeBox1.1oftheFinancial Stability Report Spring 2021 andJ.M.GálvezandI.Roibás(2021),“Assetpricemisalignmentsinfinancialmarkets:anempiricalanalysis”,WorkingPaper,BancodeEspaña(forthcoming).

BANCO DE ESPAÑA 34 FINANCIAL STABILITY REPORT. AUTUMN 2021 1. RISKS LINKED TO THE MACRO-FINANCIAL ENVIRONMENT
Apotentialworseningof themacroeconomicoutlookoran increase in the
uncertaintysurrounding itmightalso triggerpricecorrections incorporate
bonds and shares in the international markets. This scenario might arise, for
instance, if the risks described in the previous section were to materialise. This
would translate into a reduction in the expected future path of firms’ earnings or
greater uncertainty about said path, which would adversely affect the value of shares
through its negative impact on shareholder remuneration. Corporate bond prices
would be affected to the extent that this situation causes risk premia to rise through
an increase in perceived credit risks or lower investor tolerance thereto.
1.2.2 Spanish real estate market
Housesalesrosesharplyinthefirsteightmonthsof2021,byalmost14%over
the same period of 2019, in contrast to housing supply which was more
Corporate credit risk premia are below the level warranted by their historical relationship with determinants such as enterprise value and uncertainty over enterprise value, leveraging or risk aversion. For their part, stock prices in the United States and the euro area are high compared with the cyclically-adjusted earnings of listed firms. This appears to be explained not by low stock market risk premia (which are above their historical average) but rather by low long-term real interest rates.
PRICES OF RISK-BEARING FINANCIAL ASSETS ARE STILL HIGH COMPARED WITH SOME OF THEIR DETERMINANTSChart 1.5
SOURCES: Refinitiv Datastream and Banco de España.
a The difference between the corporate credit risk premium observed and that predicted by a corporate bond valuation model based on four factors: expected enterprise value (EV), uncertainty over expected EV, corporate sector leverage, and investor risk aversion. For more details, see Galvez and Roibás, “Asset price misalignments: an empirical analysis”, Working Paper (forthcoming), Banco de España.
b The cyclically-adjusted PER is calculated as the ratio of the share price to the 10-year moving average of earnings. The historical averages are calculated for the period 1997-2021.
c The stock market risk premium is calculated using a 2-stage dividend discount model. For more details, see Fuller and Hsia (1984), “A simplified common stock valuation model”, Financial Analysts Journal. The historical averages are calculated for the period 2006-2021.
5
10
15
20
25
30
35
40
Jan-20 Jun-20Nov-20Apr-21 Sep-21
2 CYCLICALLY-ADJUSTED PER (LEFT-HAND PANEL) (b).STOCK MARKET RISK PREMIUM (RIGHT-HAND PANEL) (c)
4.5
5.5
6.5
7.5
8.5
9.5
10.5
11.5
Jan-20Jun-20Nov-20Apr-21Sep-21
pp
-300
-250
-200
-150
-100
-50
0
50
Mar-20 Jun-20 Sep-20 Dec-20 Mar-21 Jun-21 Sep-21
1 CORPORATE CREDIT RISK PREMIA, DEVIATIONS FROM HISTORICALDETERMINANTS (a)
bp
EURO AREA
EURO AREA HISTORICAL AVERAGE
UNITED STATES
US HISTORICAL AVERAGE
SPAIN
SPAIN HISTORICAL AVERAGE
EURO STOXX 50
EURO STOXX HISTORICAL AVERAGE
S&P 500
S&P 500 HISTORICAL AVERAGE
IBEX 35
IBEX 35 HISTORICAL AVERAGE
EURO AREA INVESTMENT GRADE EURO AREA HIGH YIELD
US INVESTMENT GRADE US HIGH YIELD

BANCO DE ESPAÑA 35 FINANCIAL STABILITY REPORT. AUTUMN 2021 1. RISKS LINKED TO THE MACRO-FINANCIAL ENVIRONMENT
contained. The recent housing demand dynamics appear to be backed, not only by
the improvement in the general economic situation and the accommodative financial
conditions, but also by the materialisation of investment decisions that had been
postponed following the onset of the pandemic and by changes in households’
housing preferences arising from that shock (see Chart 1.6.1). In particular, these
changes are being reflected in a comparatively more dynamic demand for single-
family homes and new housing. But housing supply is less dynamic and, were the
current patterns to continue, it could be insufficient to absorb higher demand in the
coming years. In any event, in the medium term, the Housing Renovation and Urban
Regeneration Plan, to be implemented within the framework of the Recovery,
Transformation and Resilience Plan (RTRP), which has funding of €6,820 million out
of the NGEU funds, could drive activity in the residential sector, including both
renovation and new housing.
This increase in house purchases prompted an acceleration in average house
pricesinQ2,reversingtheslowdownobservedsinceearly2019.House prices,
which rose by 3.3% year-on-year (see Chart 1.6.2), were stronger both in the new
housing segment (6%) and, to a lesser extent, in second-hand housing (2.9%). New
house prices have risen the most in recent years, which could be related to the fact
that new housing can be more easily adapted to buyers’ preferences and is in shorter
supply than second-hand housing. Going forward, the recent sharp increase in the
cost of building industry inputs, were it to persist, could put further pressure on new
house prices. It should also be borne in mind that the growth in activity stemming
from the implementation of the RTRP could further tighten the costs of building
industry inputs and labour. Despite these recent developments in house prices,
there are still no signs that these prices are, on average, significantly above their
long-term equilibrium level (see Chapter 3 of this report).
Inkeepingwith thegreaterdynamismofhousesales,newmortgage loans
also recorded strong growth in 2021 H1. Specifically, new lending for house
purchase was some 40% higher than in 2019 H1. Nevertheless, the outstanding
amount of mortgage lending has increased very moderately, as mortgage repayments
have also risen, possibly because households have used the savings they
accumulated in the early stages of the pandemic to early repay all or part of their
mortgage loans. Another possible factor is the end of the moratorium programmes,
which entails the restart of mortgage repayments that had been suspended.
Thismortgage loangrowthessentiallyappears to respond todemand-side
factors,astherearenosignsofeasingofcreditstandardsinrecentmonths,
although interest rate spreads in the fixed-rate mortgage segment have
narrowedrecently.For instance, average loan-to-price (LTP) ratios have held quite
steady in recent months, although for floating-rate mortgages they have dipped
slightly; this suggests that mortgage lending criteria may have become somewhat
more stringent. Moreover, the proportion of mortgage loans with LTP ratios over
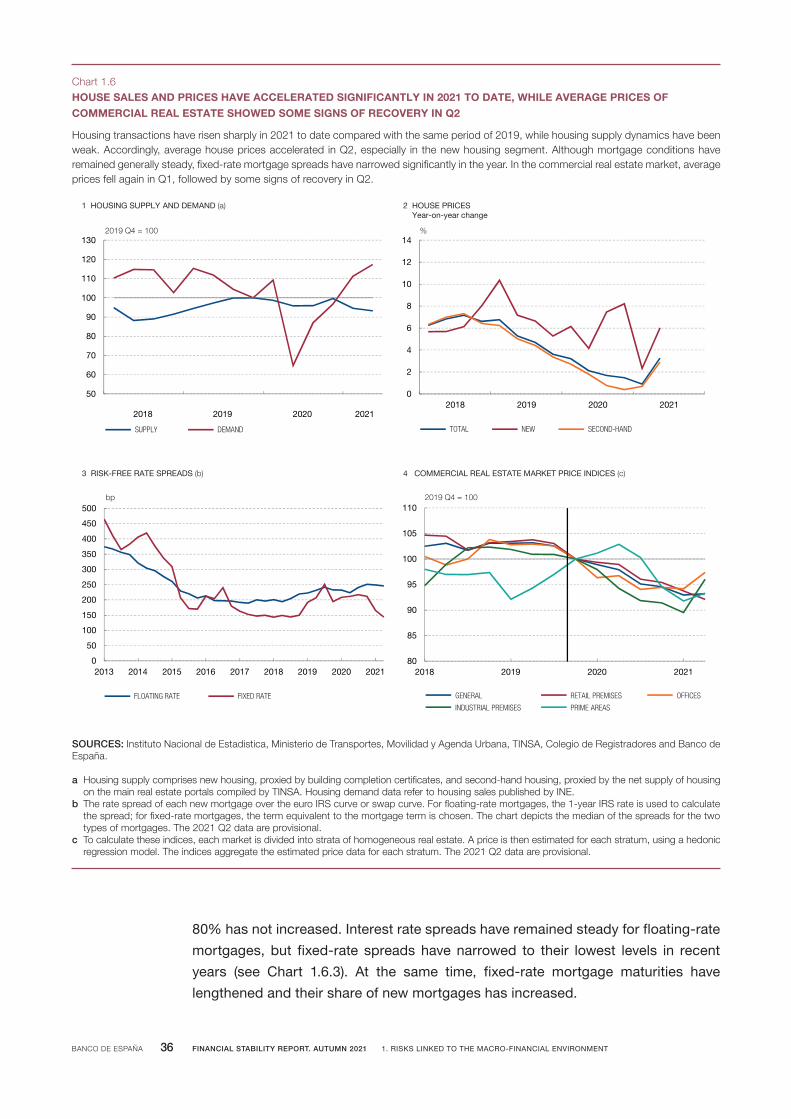
BANCO DE ESPAÑA 36 FINANCIAL STABILITY REPORT. AUTUMN 2021 1. RISKS LINKED TO THE MACRO-FINANCIAL ENVIRONMENT
80% has not increased. Interest rate spreads have remained steady for floating-rate
mortgages, but fixed-rate spreads have narrowed to their lowest levels in recent
years (see Chart 1.6.3). At the same time, fixed-rate mortgage maturities have
lengthened and their share of new mortgages has increased.
Housing transactions have risen sharply in 2021 to date compared with the same period of 2019, while housing supply dynamics have been weak. Accordingly, average house prices accelerated in Q2, especially in the new housing segment. Although mortgage conditions have remained generally steady, fixed-rate mortgage spreads have narrowed significantly in the year. In the commercial real estate market, average prices fell again in Q1, followed by some signs of recovery in Q2.
HOUSE SALES AND PRICES HAVE ACCELERATED SIGNIFICANTLY IN 2021 TO DATE, WHILE AVERAGE PRICES OFCOMMERCIAL REAL ESTATE SHOWED SOME SIGNS OF RECOVERY IN Q2
Chart 1.6
SOURCES: Instituto Nacional de Estadistica, Ministerio de Transportes, Movilidad y Agenda Urbana, TINSA, Colegio de Registradores and Banco de España.
a Housing supply comprises new housing, proxied by building completion certificates, and second-hand housing, proxied by the net supply of housing on the main real estate portals compiled by TINSA. Housing demand data refer to housing sales published by INE.
b The rate spread of each new mortgage over the euro IRS curve or swap curve. For floating-rate mortgages, the 1-year IRS rate is used to calculate the spread; for fixed-rate mortgages, the term equivalent to the mortgage term is chosen. The chart depicts the median of the spreads for the two types of mortgages. The 2021 Q2 data are provisional.
c To calculate these indices, each market is divided into strata of homogeneous real estate. A price is then estimated for each stratum, using a hedonic regression model. The indices aggregate the estimated price data for each stratum. The 2021 Q2 data are provisional.
0
2
4
6
8
10
12
14
2018 2019 2020 2021
TOTAL NEW SECOND-HAND
2 HOUSE PRICESYear-on-year change
%
80
85
90
95
100
105
110
2018 2019 2020 2021
GENERAL RETAIL PREMISES OFFICES
INDUSTRIAL PREMISES PRIME AREAS
4 COMMERCIAL REAL ESTATE MARKET PRICE INDICES (c)
2019 Q4 = 100
0
50
100
150
200
250
300
350
400
450
500
2013 2014 2015 2016 2017 2018 2019 2020 2021
FLOATING RATE FIXED RATE
3 RISK-FREE RATE SPREADS (b)
bp
50
60
70
80
90
100
110
120
130
SUPPLY DEMAND
1 HOUSING SUPPLY AND DEMAND (a)
2019 Q4 = 100
2018 2019 2020 2021

BANCO DE ESPAÑA 37 FINANCIAL STABILITY REPORT. AUTUMN 2021 1. RISKS LINKED TO THE MACRO-FINANCIAL ENVIRONMENT
Inthecommercialrealestatemarkets,pricesfellbackagainin2021 Q1,but
showedsomesignsofrecoveryinQ2.By market segment, prices of offices and
industrial premises rose moderately in Q2, but prices of retail premises, which make
up the majority of commercial real estate, continued to fall (see Chart 1.6.4). The
average price of real estate in prime locations (the prime segment) also rose in Q2,
after the decline observed since the start of the health crisis.
1.3 Non-financial sectors
1.3.1 Non-financial corporations and households
The economic situation of firms evolved favourably throughout 2021 H1,
althoughwith a notable degree of heterogeneity across sectors.Corporate
earnings posted a strong recovery, so that in most branches of activity turnover
returned to 2019 H1 levels (see Chart 1.7.1). However, in the economic sectors most
affected by the COVID-19 crisis,7 sales grew more moderately and are still well short
of pre-pandemic levels. These more favourable developments in terms of business
activity have driven up firms’ profitability. Thus, on Central Balance Sheet Data
Office Quarterly Survey (CBQ) data, the percentage of firms in 2021 H1 with negative
return on assets (ROA)8 is 8 pp lower than in the same period a year earlier, although
it is still 5 pp higher than in 20199 (see Chart 1.7.2). This is consistent with the
microsimulations made by the Banco de España, which project a gradual recovery
in corporate earnings this year and over the next two years, in keeping with the
greater economic dynamism expected. Nevertheless, this improvement will be
slower in the economic sectors most affected by the health crisis, and is subject to
the business risks indicated in section 1.1 above.10
Therecoveryineconomicactivity,thehaltinthetighteningofcreditstandards11
andlongeraveragedebtmaturitiesallappeartobehelpingeasefirms’liquidity
risks. Overall, in firms’ debt maturity structures, longer maturities account for a
higher share of the total than they did before the COVID-19 crisis, partly owing to the
Official Credit Institute (ICO) guarantee scheme. Recent developments in average
7 TheeconomicsectorsmostaffectedbytheCOVID-19pandemicarethosewhoseturnoverin2020wasdownmore than15%on2019, specifically: hospitality, oil refining, social andcultural services, transportation andstorage,thetextileindustryandthemanufactureoftransportequipment.
8 Returnonassets=(Ordinarynetprofit+Financialcosts)/Netassets(netofnon-interest-bearingborrowing).
9 See “Results of non-financial corporations to 2021 Q2”, Analytical Articles, Economic Bulletin 4/2021,Banco de España.
10 See“ImpactoftheCOVID-19crisisonSpanishfirms’financialvulnerability”,Occasional Paper No 2119,Bancode España.
11 See “TheJuly 2021BankLendingSurveyinSpain”,Analytical Articles, Economic Bulletin3/2021,BancodeEspaña.

BANCO DE ESPAÑA 38 FINANCIAL STABILITY REPORT. AUTUMN 2021 1. RISKS LINKED TO THE MACRO-FINANCIAL ENVIRONMENT
payment periods to suppliers, which on CBQ data returned, in 2021 Q2, to levels
similar to their pre-pandemic levels, also point to a drop in liquidity tensions.12
Therisksrelatedtothesolvencyofnon-financialcorporationsalsoappearto
be easing, as the recovery in economic activity has been accompanied by
lower debt growth. In consequence, average debt and debt burden ratios have
fallen, in the case of the latter driven also by the decline in the average cost of
outstanding debt. Developments in the volume and quality of bank debt and the use
of support measures such as the ICO guarantees have been uneven across economic
sectors and firms (see Chapter 2 of this report).
The economic situation of households has also recovered, as evidenced by
recent household income and labour market developments, but again with a
12 SeeBox 1,“Recentdevelopmentsintradefinancegrantedandreceivedbynon-financialcorporations”,in“Results ofnon-financialcorporationsto2021 Q2”, Analytical Articles, Economic Bulletin 4/2021,BancodeEspaña.
During the first half of the year, business turnover in most economic sectors returned to pre-pandemic levels. However, in the sectors severely affected by the health crisis, the recovery is proving to be slower and activity is still clearly below 2019 levels. Growth in corporate earnings has translated into an – albeit still incomplete – improvement in profitability.
FIRMS’ SALES AND PROFITABILITY HAVE IMPROVED, ALBEIT VERY UNEVENLY ACROSS ECONOMIC SECTORSChart 1.7
SOURCES: Agencia Estatal de Administración Tributaria and Banco de España.
a Economic sectors severely affected: those whose turnover fell by more than 15% in 2020.b Economic sectors moderately affected: those whose turnover fell by more than 8% but less than 15% in 2020.c Economic sectors least affected: those whose turnover fell by less than 8% in 2020.d CBQ data. Return on assets (R) = (Ordinary net profit + Financial costs) / Net assets (net of non-interest-bearing borrowing).
R <= 0% 0% < R <= 5% 5% < R <= 10%
10% < R <= 15% R > 15%
2 PERCENTAGE OF FIRMS BY RANGE OF ORDINARY RESULTS (ROA) (d)
%
-60
-50
-40
-30
-20
-10
0
10
20
Hos
pita
lity
Oil
refin
ing
Soc
ial s
ervs
. & c
ultu
re
Tran
spor
t. &
sto
rage
Text
ile in
dust
ry
Man
uf. t
rans
. equ
ip.
Man
uf. m
etal
pro
ds.
Oth
er p
rod.
ser
vs.
Woo
d &
furn
iture
Pap
er &
gra
phic
art
s
Man
uf. m
achi
nery
Who
lesa
le t
rad
e
Oth
er m
anuf
. ind
s.
Ext
ract
ive
indu
stry
Con
stru
ctio
n
Util
ities
Ret
ail t
rade
Info
rm. &
com
m.
Rea
l est
ate
activ
s.
Che
mic
al in
dust
ry
Food
Agr
icul
ture
Sectors severelyaffected (a)
Sectors moderatelyaffected (b)
Sectors leastaffected (c)
CHANGE IN ANNUAL TURNOVER: 2019-2020
CHANGE IN HALF-YEARLY TURNOVER: 2019 H1-2021 H1
%
1 BUSINESS TURNOVER BY SECTORRate of change compared with same period of 2019
0
20
40
60
80
100
2019 2020 2019Q1 to Q2
2020Q1 to Q2
2021Q1 to Q2

BANCO DE ESPAÑA 39 FINANCIAL STABILITY REPORT. AUTUMN 2021 1. RISKS LINKED TO THE MACRO-FINANCIAL ENVIRONMENT
certaindegreeofheterogeneity. Specifically, households’ gross disposable income
(GDI) rose by 1% in 2021 H1, but it is still 3.9% below the 2019 levels. Also, at September
2021, effective social security registrations13 were barely 1.2% lower than their pre-
pandemic levels (see Chart 1.8.1), placing the number of employed workers of the Labor
Force Survey (EPA), in this same period, above those observed before the pandemic.
Similarly, according to the European Commission’s consumer survey, at that date
households either expected their economic situation to improve over the next 12
months (households in the top two income quartiles) or to hold relatively steady
(households in the bottom two income quartiles)14 (see Chart 1.8.2). It must also be
borne in mind that since the start of the year there has been a significant cutback in
some of the household income support measures, such as the loan moratoria,15 and
this will have had most impact on the more vulnerable households.
Theaveragedebtratioroseslightlyin2021 H1,whiletheaveragedebtburden
ratiofellduetothedeclineintheaveragecostofoutstandingdebt.Thus, the
debt-to-GDI ratio stood at 94.9% in June, 4.2 pp above the pre-pandemic level,
while the debt burden-to-GDI ratio was 0.5 pp above its pre-pandemic level.
The more granular data point to different lending dynamics according to
certain household characteristics. Households that had loans before the outbreak
of the pandemic have generally reduced their level of debt, albeit at an increasingly
more moderate pace. The lowest reductions in the outstanding sum of bank loans
are recorded among higher income households (proxied according to income by
postcode) and among those resident in the municipalities hardest hit by the crisis
(proxied by those with the highest percentage of firms with furloughed workers) (see
Chart 1.8.3). The latter might be explained, at least in part, by the greater use made
of loan moratoria in the areas most affected by the crisis.16 An analysis of the new
debt taken on by households that had no loans at the onset of the pandemic also
shows stronger lending growth in higher income areas and in those hardest hit by
the crisis (see Chart 1.8.4). For all households, whether or not indebted at the start
of the crisis, income is the variable that best explains credit developments.17 This
suggests that higher income households, and especially those in the top income
quintile, were most likely to take on debt and/or to have had greater access to credit
since the beginning of the pandemic.
13 Effective social security registrations are total registrations excluding workers subject to furlough schemes(ERTEs by their Spanish name).
14 See the European Commission’s monthly consumer survey.
15 Forinstance,theapplicationperiodforbankloanmoratoria,withamaximumdurationofninemonths,endedon31 March 2021.SeeRoyalDecree-Law3/2021of2 February 2021adoptingmeasurestonarrowthegendergap and on other Social Security and economic matters.
16 See “Supportmeasuresinthebankingsector:loanmoratoria”,Financial Stability Review, Issue 40,spring2021,Banco de España.
17 Strongernewlendinginthemunicipalitieswiththemostfurloughedworkersisconsistentwithdebtstakenontomeettheircurrentexpenditure.However,thepositivecorrelationbetweenincomelevelandthepercentageoffirmswithfurloughedworkersatthemunicipallevelsuggeststhatthisincreaseinlendingcouldreflectanincomeeffect.

BANCO DE ESPAÑA 40 FINANCIAL STABILITY REPORT. AUTUMN 2021 1. RISKS LINKED TO THE MACRO-FINANCIAL ENVIRONMENT
At September, effective social security registrations were already very close to their pre-pandemic levels; indeed, Labour Force Survey (EPA) employment figures were above those levels. Workers who are still furloughed make up almost all employment still to be recovered. This positive picture of households’ situation was also reflected in their expectations for the next 12 months: in September, households expected their economic situation to improve over that horizon (the two highest income quartiles) or to hold relatively steady (the two lowest income quartiles). In general, households with outstanding loans before the health crisis have reduced their debt levels. Higher income households and those resident in municipalities with a higher percentage of firms with furloughed workers have done so to a lesser extent. These population segments also account for much of the new debt taken on by households that had no loans before the pandemic.
THE ECONOMIC SITUATION OF HOUSEHOLDS ALSO RECOVERED IN 2021 H1, WITH INCOME, EMPLOYMENT ANDEXPECTATIONS ALL IMPROVING, ALBEIT UNEVENLY BY EMPLOYMENT SECTOR AND INCOME LEVEL, WHICH ALSOCONDITION HOUSEHOLDS’ BORROWING DECISIONS
Chart 1.8
SOURCES: Ministerio de Inclusión, Seguridad Social y Migraciones, European Commission, INE and Banco de España.
a The average data for each month are taken and are seasonally adjusted.b Effective social security registrations are total registrations excluding furloughed workers.c Indicator = percentage of households expecting their economic situation to improve significantly × 1 + percentage expecting their economic situation
to improve somewhat × 1/2 – percentage of households expecting their economic situation to worsen somewhat × 1/2 – percentage expecting their economic situation to worsen significantly × 1.
d Classification by income quintiles at postcode level. Each postcode is assigned the percentage of firms using the furlough scheme in the corresponding municipality. Households are defined considering individual borrowers (natural persons and sole proprietors). Each individual borrower is assigned the amount of credit resulting from the sum of the proportional part of each of the loans in their name.
e Postcodes in very small municipalities for which no postcode-level income data are available have been excluded. In order for all quintiles to have equal importance, a double allocation criterion has been used in each. The postcodes (municipalities) are ranked by income, by the impact of the furlough scheme (measured as the percentage of firms using the furlough scheme over the number of firms in the municipality in March 2021) and by the stock of credit at the start of the crisis (December 2019). Thus, the first quintile includes the postcodes (municipalities) that account for 20% of loans at the start of the crisis and have the lowest income level or the lowest percentage of firms using the furlough scheme in the municipality, and so on for the other four quintiles.
f The contribution to the change in lending to households that had no bank debt in December 2019 is defined as the ratio of their bank debt in June 2021 (accumulated as a result of new lending since December 2019) to the stock of households’ bank loans at December 2019 within each quintile.
-25
-20
-15
-10
-5
0
5
10
15
2019 2020 2021
1st QUARTILE 2nd QUARTILE3rd QUARTILE 4th QUARTILE
2 EXPECTATIONS FOR THE ECONOMIC SITUATION OF HOUSEHOLDSFOR THE NEXT 12 MONTHS, BY INCOME QUARTILE (c)
%
Impr
ovem
ent
Wor
seen
ing
-25
-20
-15
-10
-5
0
5
Mar
-20
Apr
-20
May
-20
Jun-
20
Jul-
20
Aug
-20
Sep
-20
Oct
-20
Nov
-20
Dec
-20
Jan-
21
Feb-
21
Mar
-21
Apr
-21
May
-21
Jun-
21
Jul-
21
Aug
-21
Sep
-21
TOTAL REGISTRATIONS FURLOUGHED WORKERSEFFECTIVE REGISTRATIONS (b)
%
1 EFFECTIVE SOCIAL SECURITY REGISTRATIONS (a)Change compared with February 2020
0
1
2
3
4
5
6
7
8
Quintile 1
Quintile 2
Quintile 3
Quintile 4
Quintile 5
Quintile 1
Quintile 2
Quintile 3
Quintile 4
Quintile 5
INCOME PERCENTAGE OF FIRMS USING FURLOUGH SCHEME
4 HOUSEHOLDS WITH NO BANK DEBT AT DECEMBER 2019 (d) (e) (f)
%
93
94
95
96
97
98
99
100
Dec. 19 Dec. 20 Jun. 21 Dec. 19 Dec. 20 Jun. 21
Average income per person Percentage of firms usingfurlough scheme
QUINTILE 1 QUINTILE 2 QUINTILE 3
QUINTILE 4 QUINTILE 5
Dec. 2019 = 100
3 CHANGE IN LENDING TO HOUSEHOLDS THAT HAD BANK LOANS BEFORE DECEMBER 2019 (d) (e)

BANCO DE ESPAÑA 41 FINANCIAL STABILITY REPORT. AUTUMN 2021 1. RISKS LINKED TO THE MACRO-FINANCIAL ENVIRONMENT
The increase in households’ aggregate wealth —on account of the rising
pricesofboth financialandrealassetsandthesavingsaccumulated—has
also strengthened the financial positionof households.As consumption has
increased, the household saving rate has moderated, but it is still above its historical
average. In addition, the Household Budget Survey18 shows that all household
income quartiles made a positive contribution to the significant increase in aggregate
saving in 2020, although the contribution of lower income households was smaller.
1.3.2 General government in Spain
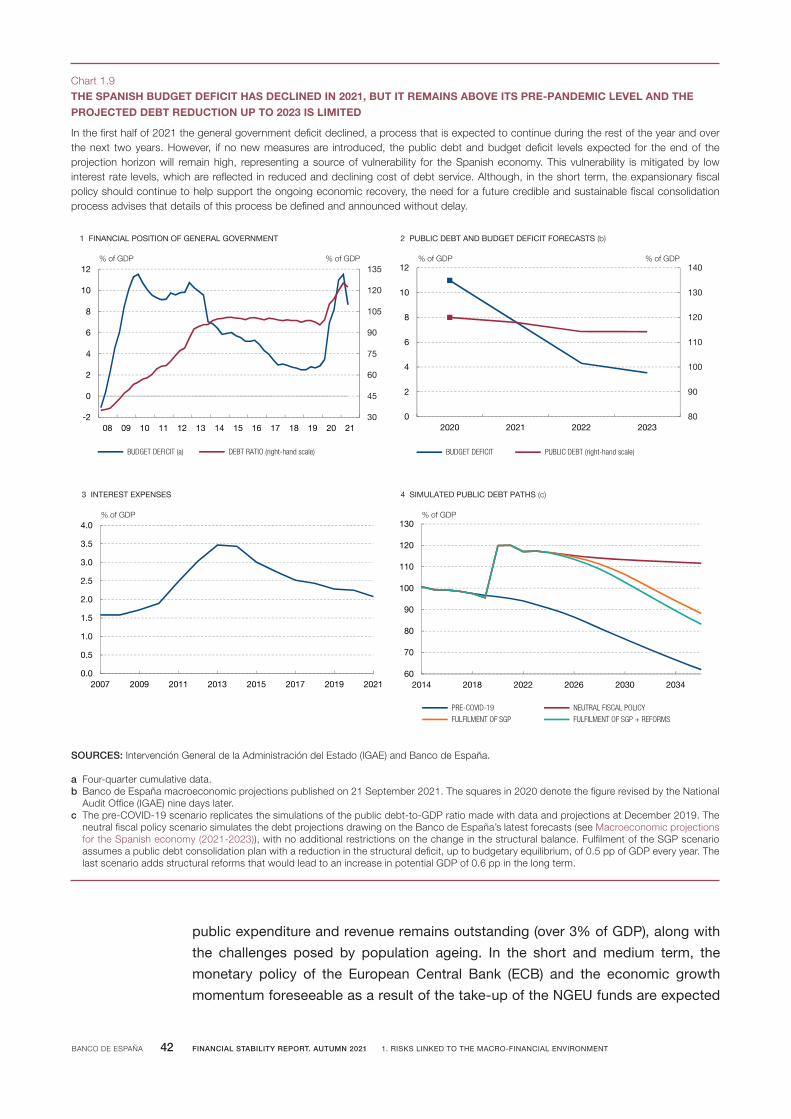
Thelatestdataavailable,correspondingto2021 H1,arebeginningtoreflecta
certaincorrectionintheimbalanceinpublicfinancesinSpaincomparedwith
thehighlevelsreachedin2020.The general government deficit stood at 8.7% of
GDP in June in cumulative 12-month terms, slightly more than 2 pp below the end-
2020 figure (see Chart 1.9.1), while public debt stood at a still very high 123% of GDP
in June. The deficit correction is explained by the pick-up in income (10.5% compared
with the same period of the previous year) arising from the economic recovery under
way, and by the moderation of expenditure growth, on the back of lower extraordinary
expenses related to the response to COVID-19 (total expenditure remained constant
compared with the same period of the previous year).
Bearinginmindthesedevelopments,theBancodeEspaña’slatestprojections,
published in September,19expectthegeneralgovernmentdeficit to improve
significantlyin2021andoverthenexttwoyears (see Chart 1.9.2). After reaching
11% of GDP in 2020, the budget deficit could close 2021 around 7.6%. This forecast
takes into account the measures adopted to temper the strong surge in electricity
prices, and also the costs of a further extension, to the end of the year, of the
COVID-19-related furlough schemes. The imbalance in public finances is expected
to continue to correct in 2022 and 2023, thanks to the improved cyclical momentum
expected and to the withdrawal of the extraordinary COVID-19-related measures.20
Nevertheless, the deficit will still be above 3% of GDP in 2023 and public debt will
decline by barely 5 pp over the projection horizon.
Thestructuraldeficitanddebtlevelsenvisagedfortheendoftheprojection
horizon (2021-2023) placeSpanish public finances in a vulnerable position,
which could also continue over longer horizons. In addition to the high level of
public debt expected for 2023 (over 110% of GDP), the structural adjustment of Spanish
18 See the INE’s Household Budget Survey. Year 2020.
19 See MacroeconomicprojectionsfortheSpanisheconomy(2021-2023).
20 Thedraft2022StateandSocialSecurityBudgetandthedraftBudgetaryPlanfor2022,whichwerepresentedafterthecut-offdatefortheBancodeEspaña’sSeptemberprojections,entailnosignificantchangetothefiscaloutlookfor2022.
BANCO DE ESPAÑA 42 FINANCIAL STABILITY REPORT. AUTUMN 2021 1. RISKS LINKED TO THE MACRO-FINANCIAL ENVIRONMENT
public expenditure and revenue remains outstanding (over 3% of GDP), along with
the challenges posed by population ageing. In the short and medium term, the
monetary policy of the European Central Bank (ECB) and the economic growth
momentum foreseeable as a result of the take-up of the NGEU funds are expected
In the first half of 2021 the general government deficit declined, a process that is expected to continue during the rest of the year and over the next two years. However, if no new measures are introduced, the public debt and budget deficit levels expected for the end of the projection horizon will remain high, representing a source of vulnerability for the Spanish economy. This vulnerability is mitigated by low interest rate levels, which are reflected in reduced and declining cost of debt service. Although, in the short term, the expansionary fiscal policy should continue to help support the ongoing economic recovery, the need for a future credible and sustainable fiscal consolidation process advises that details of this process be defined and announced without delay.
THE SPANISH BUDGET DEFICIT HAS DECLINED IN 2021, BUT IT REMAINS ABOVE ITS PRE-PANDEMIC LEVEL AND THE PROJECTED DEBT REDUCTION UP TO 2023 IS LIMITED
Chart 1.9
SOURCES: Intervención General de la Administración del Estado (IGAE) and Banco de España.
a Four-quarter cumulative data.b Banco de España macroeconomic projections published on 21 September 2021. The squares in 2020 denote the figure revised by the National
Audit Office (IGAE) nine days later.c The pre-COVID-19 scenario replicates the simulations of the public debt-to-GDP ratio made with data and projections at December 2019. The
neutral fiscal policy scenario simulates the debt projections drawing on the Banco de España’s latest forecasts (see Macroeconomic projections for the Spanish economy (2021-2023)), with no additional restrictions on the change in the structural balance. Fulfilment of the SGP scenario assumes a public debt consolidation plan with a reduction in the structural deficit, up to budgetary equilibrium, of 0.5 pp of GDP every year. The last scenario adds structural reforms that would lead to an increase in potential GDP of 0.6 pp in the long term.
30
45
60
75
90
105
120
135
-2
0
2
4
6
8
10
12
08 09 10 11 12 13 14 15 16 17 18 19 20 21
BUDGET DEFICIT (a) DEBT RATIO (right-hand scale)
1 FINANCIAL POSITION OF GENERAL GOVERNMENT
% of GDP % of GDP
80
90
100
110
120
130
140
0
2
4
6
8
10
12
2020 2021 2022 2023
BUDGET DEFICIT PUBLIC DEBT (right-hand scale)
2 PUBLIC DEBT AND BUDGET DEFICIT FORECASTS (b)
% of GDP % of GDP
0.0
0.5
1.0
1.5
2.0
2.5
3.0
3.5
4.0
2007 2009 2011 2013 2015 2017 2019 2021
3 INTEREST EXPENSES
% of GDP
60
70
80
90
100
110
120
130
2014 2018 2022 2026 2030 2034
PRE-COVID-19 NEUTRAL FISCAL POLICY
FULFILMENT OF SGP FULFILMENT OF SGP + REFORMS
4 SIMULATED PUBLIC DEBT PATHS (c)
% of GDP

BANCO DE ESPAÑA 43 FINANCIAL STABILITY REPORT. AUTUMN 2021 1. RISKS LINKED TO THE MACRO-FINANCIAL ENVIRONMENT
to help contain this vulnerability. So far, the impact of the rise in the debt ratio on
interest expenses (see Chart 1.9.3) has also been mitigated by the low interest rates.
However, a hypothetical future increase in interest rates would trigger a spike in
interest expenses, adding pressure to the fiscal position, although this effect would
not be immediate, given the maturities of the public debt. Moreover, an accommodative
fiscal policy remains necessary to consolidate the economic recovery currently
under way. In any event, this does not preclude the need for fiscal consolidation, to
ensure that, in the medium term, the Spanish economy is in a better position to
address the challenges outstanding, and in a less vulnerable position in the event of
future adverse economic developments or a crisis of confidence. According to the
simulation exercises performed, in the absence of budgetary consolidation measures
the debt ratio would remain around 115% of GDP over the next fifteen years, under
the assumption that the Spanish economy maintained growth rates similar to the
average of recent decades. By contrast, fulfilment of the Stability and Growth Pact
(SGP), especially if it is accompanied by structural reforms, would allow to reach
over that period a lower level of indebtedness than that observed before the outbreak
of the pandemic (see Chart 1.9.4).21
1.3.3 Financial flows vis-à-vis the rest of the world and the international investment position
In2021 H1, and in contrast to 2020, international investorsagainmadenet
purchasesofSpanishgeneralgovernmentdebt,an indication that financial
flows vis-à-vis the rest of the world were returning to normal. International
investors’ net purchases in 2021 H1 totalled €41.2 billion. In consequence, their
holdings, which amount to around 45% of Spanish sovereign debt, ceased to fall as
a proportion of the total (see Chart 1.10.1).
The Spanish economy’s negative net international investment position (IIP)
stoodat78.4%ofGDPinJune,representinganelementofvulnerabilityinthe
event of deterioration of financing conditions in the international markets.
Nevertheless, the ratio has fallen significantly since end-2020, specifically by 7.2 pp,
of which 2.8 pp are explained by GDP growth. The valuation effects resulting from
the increase in value of foreign assets held by Spanish residents and the decrease
in value of Spanish liabilities held by international investors (see Chart 1.10.2) explains
a further significant portion of this adjustment. In any event, this level of negative net
IIP to GDP is still 3.4 pp higher than that existing at end-2019.
21 TheSGPenvisagesapublicfinanceadjustmentthattranslatesintoanimprovementinthestructuralbalanceof0.5 ppofGDPperyearuntilthelevelofthisbalancereacheszero.Furthermore,thedebtrulerequiresthattheexcessof thedebt-to-GDP ratio above the60%benchmarkbe reducedbyone twentiethper year.As theSpanishpublicdebt ratio reached120%ofGDP in2020, thatexcess is60 pp.Therefore,according to theEuropeanrule,thedebtratioshouldbereduced,onaverage,by3 ppperyear.

BANCO DE ESPAÑA 44 FINANCIAL STABILITY REPORT. AUTUMN 2021 1. RISKS LINKED TO THE MACRO-FINANCIAL ENVIRONMENT
Spain’sgrossexternaldebtroseby€66.4 billionin2021 H1;althoughitfellto
197.9% of GDP thanks to output growth, it is still 28.4 pp above the pre-
pandemic level. This high debt level is an element of vulnerability in the event of a
possible tightening of financing conditions in the international markets. However,
this vulnerability is mitigated, to a certain extent, by the debt composition, as slightly
more than half is public sector debt (general government and Banco de España),
and by the fact that the average repayment periods are lengthy and it is mostly euro-
denominated debt.
Non-resident sectors again made net purchases of Spanish general government debt in 2021 H1, an indication that financial flows vis-à-vis the rest of the world were returning to normal. In the same period, the Spanish economy’s negative net international investment position (IIP) fell by 7.2 pp of GDP, thanks to positive valuation effects (due both to an increase in the value of foreign assets held by Spanish residents and a decrease in the value of Spanish liabilities held by foreign investors), net financial transactions vis-à-vis the rest of the world that were also positive (the counterpart of the current and capital account surpluses), and GDP growth.
IN 2021 H1, INTERNATIONAL INVESTORS RETURNED TO THE SPANISH GOVERNMENT DEBT MARKET AND SPAIN’S NEGATIVE NET INTERNATIONAL INVESTMENT POSITION DECLINED
Chart 1.10
SOURCE: Banco de España.
a The net IIP is the difference between the value of resident sectors’ foreign assets and that of the liabilities to the rest of the world.b Calculated on four-quarter cumulative GDP.
-15
-10
-5
0
5
10
15
20
15 16 17 18 19 20 2021H1 (b)
GDP EFFECT
VALUATION EFFECTS AND OTHER ADJUSTMENTS
FINANCIAL TRANSACTIONS BANCO DE ESPAÑA
FINANCIAL TRANSACTIONS (EXCLUDING BANCO DE ESPAÑA)
CHANGE IN NET IIP
2 DETERMINANTS OF CHANGE IN NEGATIVE NET IIP (a)
% of GDP
40
42
44
46
48
50
52
-30
-20
-10
0
10
20
30
2016 2017 2018 2019 2020 2021
QUARTERLY NET ACQUISITIONS
SHARE OF TOTAL HELD BY NON-RESIDENTS (right-hand scale)
1 INTERNATIONAL INVESTORS' NET ACQUISITIONS AND HOLDINGSOF SPANISH GENERAL GOVERNMENT DEBT
€bn %

BANCO DE ESPAÑA 48 INFORME DE ESTABILIDAD FINANCIERA. PRIMAVERA 2021 2. RIESGOS Y CAPACIDAD DE RESISTENCIA DEL SECTOR FINANCIERO


