

PAGE 0RWE Supply & Trading
Volatility, risk and risk premium in German and Continental power markets
Stefan Judisch / Andree StrackeRWE Supply & Trading GmbH
22nd January 2015

RWE Supply & Trading PAGE 1
Agenda
1. What are the market fundamentals telling us?
2. What can we observe in the traded market?
3. How will future developments impact merit order economics?
4. Summary and conclusions

RWE Supply & Trading PAGE 2
Reservoir
level
Reservoir
levelPower plant
new build
Power plant
new build
Marginal costs of
thermal plants
Marginal costs of
thermal plants
Power plant
closures
Power plant
closures
Available
capacity
Available
capacity
Wind capacity
growth
Wind capacity
growth Subsidies &
technical
progress
Subsidies &
technical
progress
Seasonal
temperature
forecast
Seasonal
temperature
forecast
Residential
demand
Residential
demand
Air conditioning /
Electric heating
Air conditioning /
Electric heating
Industrial demandIndustrial demand
Reservoirhydro plants
Reservoirhydro plants
Supply
Demand
Power price
Cross-border
exchange balance
Cross-border
exchange balance
PV capacity
growth
PV capacity
growth
CO2 pricesCO2 prices Gas pricesGas prices Crude pricesCrude prices Coal pricesCoal prices
Fuel forward curves
Weather impacts
Thermal power
generation
Thermal power
generation
Comfort of
living
Comfort of
living
Energy
efficiency
Energy
efficiency
Macro
cycle
Macro
cycle
Various fundamental factors influence power
prices on the long-term forward market
Renewable
power
generation
Renewable
power
generation
A
B
C
D
E

RWE Supply & Trading PAGE 3
A EB DC
Coal and gas prices collapsed whereas power
declined less Relative development of German Power, API#2 Coal and TTF Gas for the front year
(1st Jan 2014 = 100%)

RWE Supply & Trading PAGE 4
> Solar installation growth was relatively low with only about 1.9 GW installed until Dec 2014.
> Our 2015 capacity expansion forecast for PV is set at 1.8 GW.
> On the other hand German onshore wind installations until Dec 2014 surprised to the upside, partly as producers accelerated their projects in anticipation of the EEG reform. In total more than 3.3 GW were installed from January to Dec 2014.
> The onshore wind capacity growth forecast is set at 2.8 GW for 2015.
German Power Supply (I):
Renewables growth path: Less PV, but more wind
Installed Capacity (Dec 14):- PV 37.9 GW
- Wind 38.6 GW
(thereof 1.3 GW offshore)
BA EDC

RWE Supply & Trading PAGE 5
> Taken into account recent updates, closures planned for 2014-2017 exceed new builds by 3.4 GW.
> Grafenrheinfeld and Gundremmingen B will close in Apr 2015 and end 2017 according to the nuclear exit agreement.
> Further gas and coal closures expected, if a capacity market will not be implemented.
German Power Supply (II):
Fossil generation: capacity closures exceed new-buildsM
oth
balle
d
New
build
CA B ED

RWE Supply & Trading PAGE 6
Slowdown in German power demand less prominent
Source: Entso-E Power Consumption (preliminary hourly data)
> Energy-intensive industries are cutting production and consumers produce their own energy. Moreover, efficiency measures continue to weigh on power consumption, with the EU proposing an energy efficiency target of 30% until 2030.
> As the German economy is gradually picking up in 2014, the demand slowdown has decelerated in 2014.
-20%
-15%
-10%
-5%
0%
5%
10%
Dec 0
8
Ma
r 09
Ju
n 0
9
Se
p 0
9
Dec 0
9
Ma
r 10
Ju
n 1
0
Se
p 1
0
Dec 1
0
Ma
r 11
Ju
n 1
1
Se
p 1
1
Dec 1
1
Ma
r 12
Ju
n 1
2
Se
p 1
2
Dec 1
2
Ma
r 13
Ju
n 1
3
Se
p 1
3
Dec 1
3
Ma
r 14
Ju
n 1
4
Se
p 1
4
Dec 1
4
Average Load YoY Change
Bank holiday effects
DA EB C

RWE Supply & Trading PAGE 7
Cross-border flows: The introduction of flow-
based market coupling will lead to more convergence of European power prices> Flow-based market coupling (FB) will lead to higher utilization of cross-border capacities than ATC
market coupling.
> Parallel runs show that German price will increase by 0.40 to 2.26 €/MWh (depending on market tightness) and converge towards the higher price levels in Belgium and the Netherlands
EA B DC
Results of parallel runs ATC vs. Flow-based (FB) market coupling for 2013 and 2014
Source: CASC CWE

RWE Supply & Trading PAGE 8
Agenda
1. What are the market fundamentals telling us?
2. What can we observe in the traded market?
3. How will future developments impact merit order economics?
4. Summary and conclusions
RWE Supply & Trading PAGE 9
0
10
20
30
40
50
60
70
80
90
100
2001 2002 2003 2004 2005 2006 2007 2008 2009 2010 2011 2012 2013 2014 2015
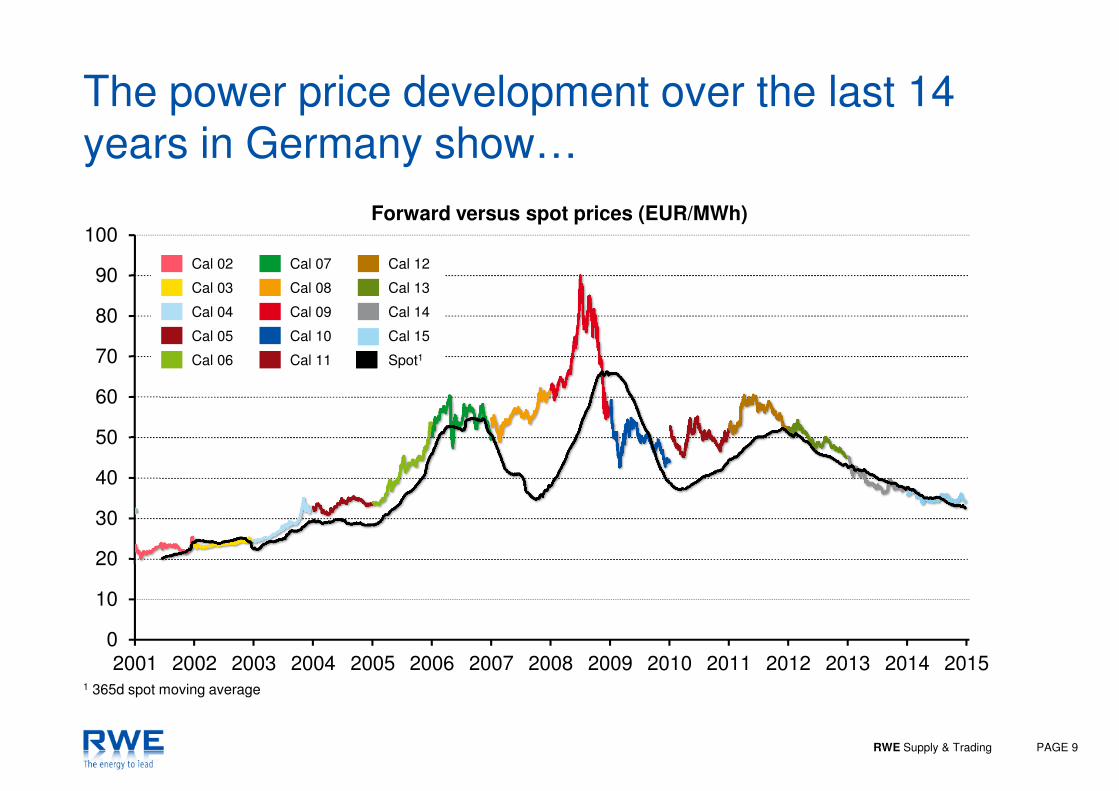
The power price development over the last 14
years in Germany show…
Forward versus spot prices (EUR/MWh)
1 365d spot moving average
Cal 02
Cal 03
Cal 04
Cal 05
Cal 06
Cal 07
Cal 08
Cal 09
Cal 10
Cal 11
Cal 12
Cal 13
Cal 14
Cal 15
Spot1

RWE Supply & Trading PAGE 10
With plenty of generation capacity available, the
market does no longer price in a risk premium
Contango vanished again in the front of the curve
Spread between implied versus front year (EUR/MWh)1
1 German power baseload2 Implied Cal as weighted average of spot settlements and balance-of-year forwards
Implied Year (FY0)2
Front Year (FY1)
Second Year (FY2)
Risk premium (right scale)

RWE Supply & Trading PAGE 11
Year 1
Year 2
Year 3
Risk premium (right scale)
The market expects renewable generation growth
to force utilities into more plant closures
Spread between year 3 versus year 1 (EUR/MWh)
Forward curve remains backwardated, but got significantly flatter.

RWE Supply & Trading PAGE 12
Cal 16 Baseload Prices:
European power prices decline as fuel prices collapse
UK: coal to gas switch, coal plant reliability very high this winter, all nukes back online
BE: 2 GW nuke (Tihange and Doel 4) closed due to safety concerns and repairs.
NL: gas dependent, hard coal
plants finally commissioned.
FR: ARENH decision postponed, expectations priced in.
DE: renewables feed-in, fossil new-builds.
NP: improved hydro balance
> French power prices were relatively less weak due to ARENH expectations.
> German power forward prices have mostly decreased due to “shut-in renewable feed-in”*.
> Belgian power prices decoupled when 3 GW of nuclear capacity was taken offline, but fell back now with 1 GW
nuke capacity returning and easing winter fears.
> Flow-based market coupling should lead to more price convergence again, but it was postponed to April 2015.
* In times of high renewables generation, cross-border constraints limit exports.

RWE Supply & Trading PAGE 13
Generation margin for hard coal plants is
recovering reflecting plant closures in 2016/17Expectations for clean dark spreads (EUR/MWh)
> German clean dark spreads
recovering while the
backwardation is flattening.
> Tightening supply/demand
balance is getting priced
into Cal’16 and even more
into Cal’17.

RWE Supply & Trading PAGE 14
The volatility in the German power market is
shifting to the front of the curve…
Annualised volatility compared to 2001: Forward versus spot

RWE Supply & Trading PAGE 15
…and intraday market becomes more relevant to
trade around actual solar and wind production
Trading volumes on EPEX compared to 2010: Day-ahead versus intraday
Market participants in 2014 Day-ahead trading: 199
Intraday trading: 195
Day-ahead
Intraday
Market participants in 2010 Day-ahead trading: 94
Intraday trading: 89

RWE Supply & Trading PAGE 16
A first blip of light at the end of the tunnel:
More intraday spikes in tight situationIntraday vs Day-ahead: calendar weeks 48-50/2014 (EUR/MWh)

RWE Supply & Trading PAGE 17
Agenda
1. What are the market fundamentals telling us?
2. What can we observe in the traded market?
3. How will future developments impact merit order economics?
4. Summary and conclusions

RWE Supply & Trading PAGE 18
German merit order in 2014: prices and volatilities
for different hours of the year
1 Excluding nuclear fuel tax1 Source: RWE
A sunny and windy hour
A sunny hourwith high intraday volatility
A average hourwith low intraday volatility
A cold winter hourwith low intraday volatility
A winter hourwith high intraday volatility
Announced for closureor closure candidates
Marg
inal co
st
(EU
R/M
Wh
)
Renewables
Nuclear1
Lignite
Coal
Gas
Oil
Others
Systemservices
Capacity (GW)

RWE Supply & Trading PAGE 19
What will happen over the next five years?
More renewables: merit order will shift further to the right
> More fuel switch coal to lignite
> Lower prices
> Higher spot volatility
Plant closures will accelerate
> Capacity ranges for coal and gas in merit order will shrink
> Gas will be running more often
> Higher prices
> More price spikes (spot/intraday)
> Higher spot and then higher forward volatility
> Re-appearance of risk-premium in forward prices
Rise in gas and/or CO2 prices
> Higher prices
> Higher forward volatility
Source: RWE

RWE Supply & Trading PAGE 20
Volatility and risk premium will spread from the
very front end further along the forward curve.
> Oversupply due to renewable penetration has moved volatility and risk in German and Continental power markets predominantly to the very front end of the curve.
> This development led to backwardation of long-term contracts.
> As a result generators react with initial mothballing of plants that are far out-of-the-money.
> Due to more plant closures to come (including nuclear closures), the tightening supply/demand balance already led to increasing clean dark spreads, especially for Cal 17 the dark spread backwardation compared to Cal 15 halved.
> The tighter supply/demand balance with more renewables will lead to even more volatility in the prompt which should introduce more risk premium along the forward curve.

RWE Supply & Trading PAGE 21
Agenda
1. What are the market fundamentals telling us?
2. What can we observe in the traded market?
3. How will future developments impact merit order economics?
4. Summary and conclusions

RWE Supply & Trading PAGE 22
Summary & conclusion
What are the market fundamentals telling us?
> Power prices are outperforming gas and coal prices
> Despite reduction in subsidies, solar and wind generation will continue to grow in Germany
> From 2015 onwards plant closures will reduce the current generous capacity margin
> Electricity demand will drift sideways at best (assuming no major break-through on electric cars)
> The markets indicated that renewable generation capacity grew faster than thermal plants are being closed, low dark spreads triggered plant closures
> Increasing fuel spreads on the back end of the forward curve are already increasing due to the
tightening fundamental picture
> More than 70 GW of renewable capacity in Germany push up intra-day volatility; sufficient flexibility in the system for the time being but more and more closures of conventional capacity will lead to
spikiness in spot and intraday markets
> Forward volatility is low right now as (1) coal plants are mostly price setting in average weather (assumption of forward market), (2) the volatility of coal is low
> Spot/intraday volatility has gone up and is expected to rise further
> Forward volatility likely to be pushed up if intraday price spikes become more frequent
> Outright prices to drift sideways for a while before markets tighten. Fuel spreads on the back end of the forward curve are already increasing due to the tightening fundamental picture.
> More short-term price spikes will induce rising forward volatilities and risk premium and a change
in hedging behaviour of large power consumers
What can we observe in the traded market?
How will future developments impact merit order economics?
Conclusions
1
2
3
4


