

Private and Confidential – November 2017 1
Saguaro Resources Ltd.Montney Liquids Rich Growth Story
Corporate Presentation
November 2017
Confidential

Private and Confidential – November 2017 2
• Q3 2017 production averaged 12,469 Boed from 40 producing Montney horizontal wells(2)
• Peak monthly production in August 2017 exceeded 14,000 Boed• Reserves were evaluated by an IQRE(3); 2P reserves increased to 400 MMBoe at October 31, 2017 from 295 MMBoe at mid year 2017(3)
• Well financed(4); $400 MM line of equity, $140 MM syndicated bank revolver, and $50 MM 8.5% second lien secured notes due 2022
1. See advisories on pages 22 to 24 hereof. 2. Includes producing wells to the end of Q3 2017.3. Independent Qualified Reserves Evaluator; based on reports prepared by Sproule Associates Limited effective October 31, 2017 and June 30, 2017, respectively.4. See page 18 for additional information.
Saguaro Highlights(1)
• 100% working interest on 164 sections in the NE BC Montney• Derisked/tested 146 sections (89%) through drilling to date and competitor activity
• 100% working interest plant capacities of 100 MMcfd compression/dehydration and 30 MMcfd amine sweetening with ability to expand to 1 Bcfd
• Executed a competitive, third party processing agreement to manage mid‐term production growth up to 130 MMcfd of firm capacity• Committed shipper on North Montney Mainline and T‐South
• Liquids‐rich Montney wells have attractive economics at current strip pricing• 52 Bbl/MMcf of liquids to date (71% condensate)• Over‐pressured Deep Basin trap; three stacked Montney zones; 1,200+ well inventory• Low capital cost due to shallow depth (1,400 to 1,900 m TVD)
Large contiguous land base
High caliber liquids rich resource
Expandable takeaway capacity
Well positioned for shareholder
growth

Private and Confidential – November 2017 3
Montney Captured to Date(1)(2)
• Internal estimate of resource size on 164 sections of a liquids rich Montney natural gas play with stacked potential:
1. See advisories on pages 22 to 24 hereof. Includes drills to the end of Q3 2017.2. Saguaro’s internal estimates of resource are supported by Sproule’s contingent resource evaluation dated July 31, 2015.
3,500 MMBoe in Place(21 Tcf Gas in Place)
1,100‐1,700 MMBoeRecoverable
Estimated 26% Liquids
Liquids RecoveriesInception to September 30, 2017
Bbl/MMcf (Sales)Propane 6Butane 9Condensate (includes Free) 37Total 52
19 miles
Saguaro
Montney Fairway
BC AB
Saguaro

Private and Confidential – November 2017 4
SaguaroOpen Crown (Montney rights)Montney PenetrationsSaguaro 12” Gathering LinesSaguaro Proposed Future Egress
• Geology:▫ Average 260 m of gross pay across three stacked porous zones
▫ Over‐pressured; 11‐15 kPa/m ▫ Shallower depth of ~1,400‐1,900 m
Current drilling costs for 2,500 m HZ development well is forecast at ~$2.2 MM
Excludes ~$1.0 MM deep well royalty credit
• Activity to date (100% WI):▫ Drilled 50 wells from inception to Q3 2017
Currently optimizing development with a two rig program
▫ Expanded gas facility to 100 MMcfd in April 2017 Next expansion planned for second half of 2018
▫ Installed three stages of 12” backbone gathering system
Derisking Across Saguaro’s Montney Land Base(1)
1. See advisories on pages 22 to 24 hereof. Includes drills to the end of Q3 2017.
81‐G12 HZ wells
34‐H16 HZ wells
14‐I3 HZ wells
76‐D8 HZ wells
b‐24‐HFacility 78‐C
10 HZ wells
54‐H1 HZ well
5 miles

Private and Confidential – November 2017 5
c‐81‐G b‐34‐H b‐54‐H c‐78‐C
> 175 m Net POR263 m Gross
> 200 m Net POR261 m Gross
> 175 m Net POR261 m Gross
Logs truncated; vertical well not drilled
> 245 m Net POR249 m Gross
a‐14‐I
LOWER MONTNEY
MIDDLEMONTNEY
UPPERMONTNEY
x8wells
Core
Core
x7wells
x1well
x1well
x3wells
x4wells
x8wells
x3wells
x8wells
x1well
x1 well
x1 well
x1 well
x2wells Upper
Target
Lower Target
Middle Target
c‐76‐D
Core
x1well
Logs truncated; vertical well not drilled
1. See advisories on pages 22 to 24 hereof.2. Porosity from Nutech Petrophysical analysis. 3% porosity cut off (excluding 54H).
Derisking Stacked Pay Zones(1)(2)
Core
Private and Confidential – November 2017 6
$3.8 $3.0 $2.6 $2.6 $2.5
$0
$50
$100
$150
$200
$250
$300
$0.0
$1.0
$2.0
$3.0
$4.0
$5.0
$6.0
Pre‐2015Pilot
Program
2015DevelopmentProgram
2016DevelopmentProgram
2017YTD
2018Forecast
Completion Cost ($000) per stageAv
erag
e Co
mpletion Co
st per W
ell
($MM)
Completions $000 per stage
$3.4 $3.0 $2.1 $2.4 $2.2
$0
$500
$1,000
$1,500
$2,000
$2,500
$3,000
$0.0
$1.0
$2.0
$3.0
$4.0
$5.0
$6.0
Pre‐2015Pilot
Program
2015DevelopmentProgram
2016DevelopmentProgram
2017YTD
2018Forecast
Drilling Cost ($) per H
Z m
Averag
e Drilling Co
st per W
ell
($MM)
Drilling $ per HZ m
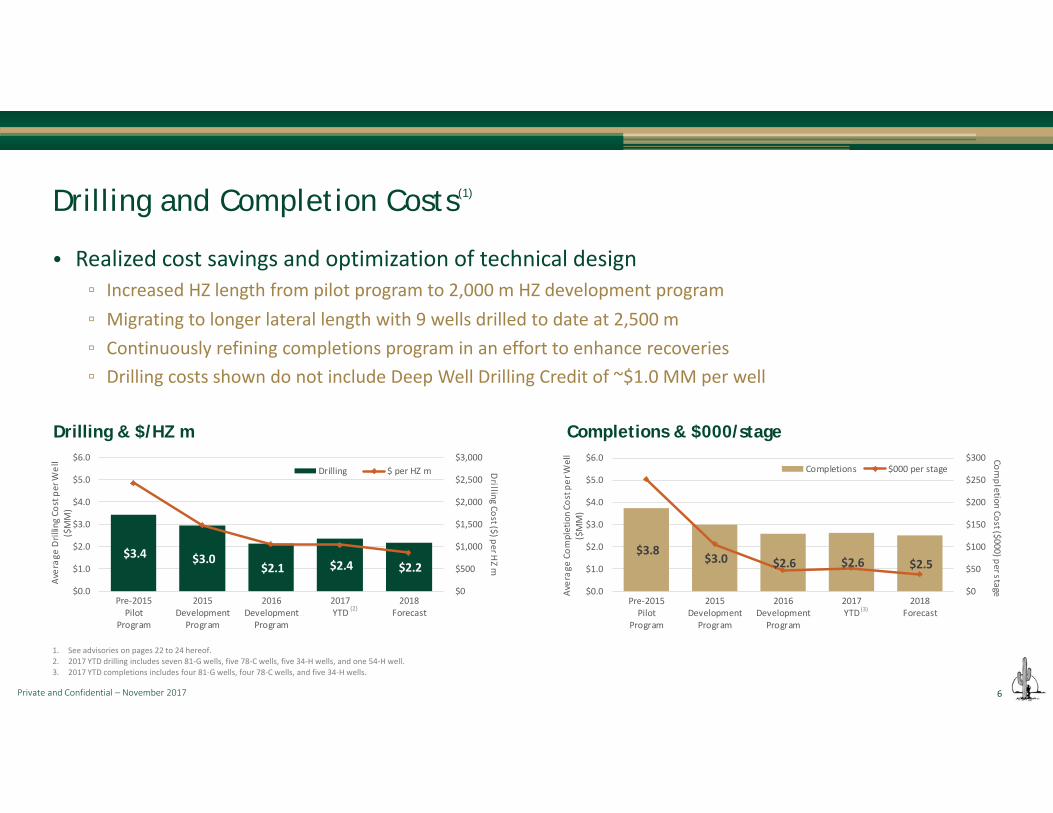
• Realized cost savings and optimization of technical design▫ Increased HZ length from pilot program to 2,000 m HZ development program▫ Migrating to longer lateral length with 9 wells drilled to date at 2,500 m▫ Continuously refining completions program in an effort to enhance recoveries ▫ Drilling costs shown do not include Deep Well Drilling Credit of ~$1.0 MM per well
Drilling and Completion Costs(1)
1. See advisories on pages 22 to 24 hereof.2. 2017 YTD drilling includes seven 81‐G wells, five 78‐C wells, five 34‐H wells, and one 54‐H well.3. 2017 YTD completions includes four 81‐G wells, four 78‐C wells, and five 34‐H wells.
Drilling & $/HZ m Completions & $000/stage
(2) (3)

Private and Confidential – November 2017 7
0
250
500
750
1,000
1,250
1,500
1,750
0 2 4 6 8 10 12 14 16 18 20 22 24 26 28 30
Prod
ucing D
ay Sa
les P
rodu
ction (Boe
d)
Calendar Months
8 Bcf Type Curve 7 Bcf Type Curve 6 Bcf Type Curve Development Program (24 wells @ 2,000 m HZ) Development Program (4 wells @ 2,500 m HZ)
Development Well Performance Update(1)(2)
1. See advisories on pages 22 to 24 hereof.2. See page 8 for the 2,000‐2,500 m Type Curve Economic Metrics.
• 2,000 m HZ development wells are tracking the 7 Bcf type curve• 2,500 m HZ development wells are tracking the 8 Bcf type curve
Private and Confidential – November 2017 8
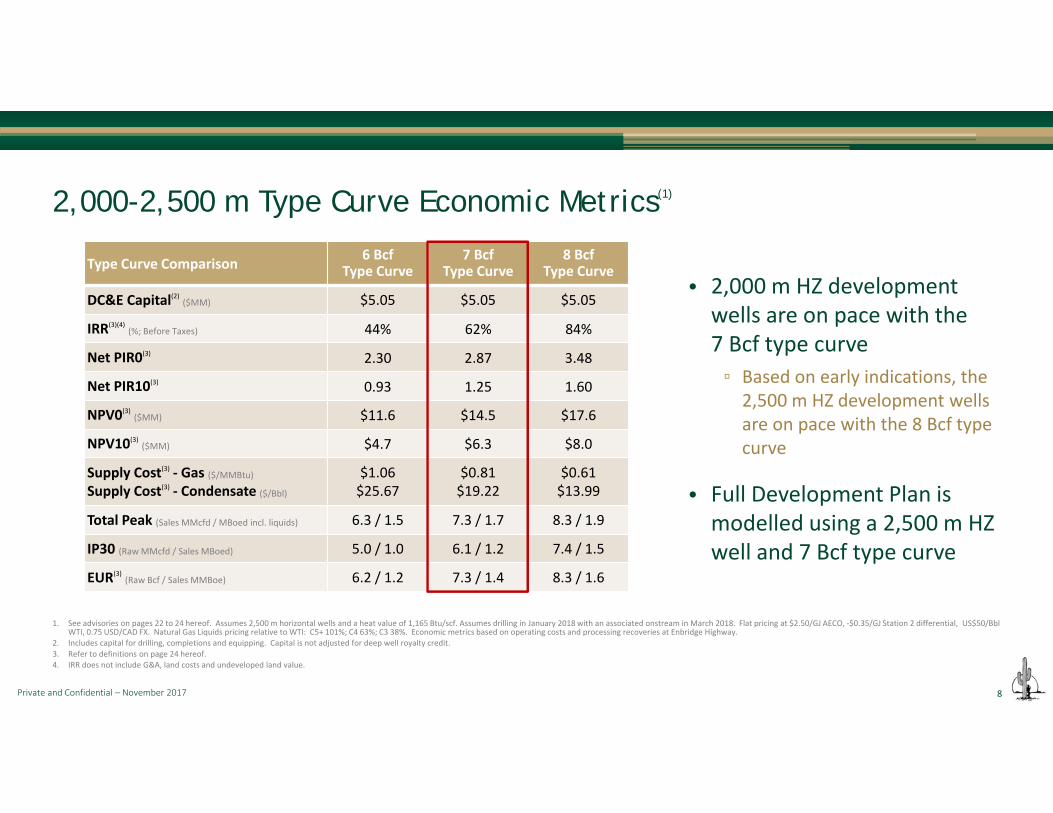
2,000-2,500 m Type Curve Economic Metrics(1)
Type Curve Comparison 6 Bcf Type Curve
7 BcfType Curve
8 BcfType Curve
DC&E Capital(2) ($MM) $5.05 $5.05 $5.05
IRR(3)(4)(%; Before Taxes) 44% 62% 84%
Net PIR0(3) 2.30 2.87 3.48
Net PIR10(3) 0.93 1.25 1.60
NPV0(3)($MM) $11.6 $14.5 $17.6
NPV10(3)($MM) $4.7 $6.3 $8.0
Supply Cost(3) ‐ Gas ($/MMBtu)
Supply Cost(3) ‐ Condensate ($/Bbl)$1.06$25.67
$0.81$19.22
$0.61$13.99
Total Peak (Sales MMcfd / MBoed incl. liquids) 6.3 / 1.5 7.3 / 1.7 8.3 / 1.9
IP30 (Raw MMcfd / Sales MBoed) 5.0 / 1.0 6.1 / 1.2 7.4 / 1.5
EUR(3)(Raw Bcf / Sales MMBoe) 6.2 / 1.2 7.3 / 1.4 8.3 / 1.6
• 2,000 m HZ development wells are on pace with the 7 Bcf type curve ▫ Based on early indications, the 2,500 m HZ development wells are on pace with the 8 Bcf type curve
• Full Development Plan is modelled using a 2,500 m HZ well and 7 Bcf type curve
1. See advisories on pages 22 to 24 hereof. Assumes 2,500 m horizontal wells and a heat value of 1,165 Btu/scf. Assumes drilling in January 2018 with an associated onstream in March 2018. Flat pricing at $2.50/GJ AECO, ‐$0.35/GJ Station 2 differential, US$50/Bbl WTI, 0.75 USD/CAD FX. Natural Gas Liquids pricing relative to WTI: C5+ 101%; C4 63%; C3 38%. Economic metrics based on operating costs and processing recoveries at Enbridge Highway.
2. Includes capital for drilling, completions and equipping. Capital is not adjusted for deep well royalty credit.3. Refer to definitions on page 24 hereof. 4. IRR does not include G&A, land costs and undeveloped land value.

Private and Confidential – November 2017 9
0%
20%
40%
60%
80%
100%
120%
140%
160%
AECO $2.00/GJWTI US$40.00/Bbl
AECO $2.50/GJWTI US$50.00/Bbl
AECO $3.00/GJWTI US$60.00/Bbl
Half Cycle IRR
(%)
2,000-2,500 m Single Well Sensitivities(1)(2)
1. See advisories on pages 22 to 24 hereof.2. Half‐cycle single well economic sensitivity is based on flat pricing with ‐$0.35/GJ Station 2 differential. FX USD/CAD of 0.72, 0.75 and 0.78 at WTI US$40/Bbl, US$50/Bbl and US$60/Bbl respectively. Natural Gas Liquids pricing relative to WTI: C5+ 101%; C4 63%; C3
38%. Operating costs based on recoveries at Highway.
• Economics at low gas prices are supported by strong condensate volumes▫ Material uplift on rates of return from underlying condensate production
• Type curves are based on the following criteria:▫ Drill, complete and equip capital of $5.05 MM
▫ Deep Well Drilling Credit of ~$1.0 MM per well
▫ Horizontal length of 2,000‐2,500 m
8 Bcf Type Curve
6 Bcf Type Curve
7 Bcf Type Curve

Private and Confidential – November 2017 10
De-risked Inventory with Strong Well Economics(1)
1. See advisories on pages 22 to 24 hereof.2. IRR is an estimate only and well results will vary. IRR is based on a 2,500 m horizontal well and flat pricing at $2.50/GJ AECO, ‐$0.35/GJ Station 2 differential, US$50/Bbl WTI, 0.75 USD/CAD FX. Natural Gas Liquids pricing relative to WTI: C5+ 101%; C4 63%; C3
38%. Operating costs based on recoveries at Highway.
• 89% of land base de‐risked with 1,200+ locations
Montney Delineation IRR by Montney Target(2)
5 miles
451
57
444
57
464
57
0
100
200
300
400
500
600
700
800
900
1,000
>50% IRR ~25% IRR To Be Tested
Drilling
Locatio
ns
Upper Target
Middle Target
Lower Target

Private and Confidential – November 2017 11
0
2,000
4,000
6,000
8,000
10,000
12,000
14,000
Q1‐2015
Q2‐2015
Q3‐2015
Q4‐2015
Q1‐2016
Q2‐2016
Q3‐2016
Q4‐2016
Q1‐2017
Q2‐2017
Q3‐2017
Prod
uctio
n (Boed)
Gas Oil Condensate Butane Propane
0
15
30
45
60
75
Q1‐2015
Q2‐2015
Q3‐2015
Q4‐2015
Q1‐2016
Q2‐2016
Q3‐2016
Q4‐2016
Q1‐2017
Q2‐2017
Q3‐2017
NGLs (b
bl/M
Mcf Sales)
Free Condensate Entrained Condensate Butane Propane1. See advisories on pages 22 to 24 hereof.2. Includes producing wells to the end of Q3 2017.
Production Update(1)
• Continued production growth▫ Highest quarterly production to date in Q3 2017
Production averaged 12,469 Boed from 40 producing Montney horizontal wells(2)
▫ An additional five Montney wells were brought onstream in October 2017
Production by Product Liquids Yield
• Liquids yield has stabilized at attractive levels▫ Recoveries vary somewhat depending on third party processing facilities used
▫ Condensate currently trading at a premium to Canadian Light Sweet oil

Private and Confidential – November 2017 12
0
50
100
150
200
250
300
350
400
450
Dec‐14 Jul‐15 Dec‐15 Jun‐16 Sep‐16 Dec‐16 Jun‐17 Oct‐17
Remaining
Recoverab
le Reserves
(MMBo
e)(6)
PDP
PDNP + PUD
Total Probable
• Reserves evaluated by an Independent Qualified Reserves Evaluator▫ Total Proved + Probable (2P) reserves increased by 36% since mid year 2017
400.4 MMBoe at October 31, 2017 compared to 295.1 MMBoe at mid year 2017(2)
▫ NPV 10% value of Proved reserves (1P) increased by 52% since mid year 2017 $1,129 MM at October 31, 2017 compared to $741 MM at mid year 2017(2)
Reserves Evaluation Summary(1)
1. See advisories on pages 22 to 24 hereof.2. Based on Sproule Reserves Evaluations dated effective October 31, 2017 and June 30, 2017, respectively and based on Sproule Pricing as of September 30, 2017 and May 31, 2017, respectively.3. Saguaro has 1P Total Gross Reserves of 140,728 MBoe and 2P Total Gross Reserves of 400,386 MBoe as of October 31, 2017. 4. PDP reserves are comprised of 78% Gas, 22% NGLs, 0.2% Oil. 1P and 2P reserves are comprised of 77% Gas, 23% NGLs.5. 1P includes 1,122 MBoe of net Proved Developed Non‐Producing (PDNP) reserves.6. Based on reserves evaluations prepared by Sproule Associates Limited pursuant to NI‐51‐101 and the COGE Handbook. Sproule Reserves Evaluations based on Sproule Pricing as of September 30, 2017 for Oct‐2017, May 31, 2017 for Jun‐2017, December 31, 2016
for Dec‐2016; July 31, 2016 for Sep‐2016; June 30, 2016 for Jun‐16; December 31, 2015 for Dec‐15; July 31, 2015 for Jul‐15; December 31, 2014 for Dec‐14.
Reserves EvaluationNet(3), NBR
Oct. 31 2017(2)
Total(4) NPV 10%Before Taxes
MontneyLocations
MBoe $000
Proved Developed Producing (PDP) 24,509 $276,141 43
Total Proved(5) (1P) 140,723 $1,128,815 169
Total Proved + Probable (2P) 400,378 $2,968,252 353

Private and Confidential – November 2017 13
Land Base Provides Large Future Reserves Potential(1)
• 2P Reserves represent ~23% of Saguaro’s estimated well inventory
1. See advisories on pages 22 to 24 hereof. Illustration based on Sproule’s reserves evaluation dated October 31, 2017.
UpperTarget
MiddleTarget
LowerTarget
ProvedProbable

Private and Confidential – November 2017 14
0
2
4
6
8
10
12
0
20
40
60
80
100
120
2013 2015 2017 2019 2021 2023 2025
Rigs (at Year End)
Horizontal Drills
per Ye
ar
Drills Rigs
0
150
300
450
600
750
900
1,050
0
25,000
50,000
75,000
100,000
125,000
150,000
175,000
2013 2015 2017 2019 2021 2023 2025
Annualized Production (MMcfed)An
nualized
Produ
ction (boed)
Gas NGLs
Full Development Plan – Activity & Production(1)(2)
1. See advisories on pages 22 to 24 hereof.2. 1,200 well development program which develops ~80% of Saguaro’s existing land base and assumes $7,425 MM of capital. This Full Development Plan (FDP) is based on 2017 YTD results and will continue to be updated throughout the delineation phase.
• The Full Development Plan (FDP) is based on approximately 1,200 horizontal wells (2,500 m) and the 7 Bcf type curve▫ FDP will continue to be updated throughout the delineation phase
Production is held flat at ~800 MMcfd (~170,000 Boed) for >10 years

Private and Confidential – November 2017 15
$‐
$200
$400
$600
$800
$1,000
$1,200
2013 2015 2017 2019 2021 2023 2025
$MM
Development Year
Development Capital
Corporate Cash Flow
Debt Drawn
Private Equity Drawn
Full Development Plan – Capital & Metrics(1)(2)
1. See advisories on pages 22 to 24 hereof.2. FDP is based on a 1,200 well development program which develops ~80% of Saguaro’s existing land base. Assumes 2,500 m 7 Bcf type curve. FDP is based on 2017 YTD results and will continue to be updated throughout the delineation phase. Any changes to the
assumptions used in the FDP will impact the metrics and results including amount of equity raised.3. Economics metrics for 7 Bcf well are based on half‐cycle single well economics with flat pricing at $2.50/GJ AECO, ‐$0.35/GJ Station 2 differential, US$50/Bbl WTI, 0.75 USD/CAD FX. Natural Gas Liquids pricing relative to WTI: C5+ 101%; C4 63%; C3 38%.
Economic metrics based on operating costs and processing recoveries at Enbridge Highway. 4. Economic metrics for FDP are unlevered project economics with flat pricing until 2022 at $2.50/GJ AECO, ‐$0.35/GJ Station 2 differential, US$50/Bbl WTI, 0.75 USD/CAD FX, then escalated at 1.5% thereafter. Natural Gas Liquids pricing relative to WTI: C5+ 101%;
C4 63%; C3 38%. Economic metrics are based on go forward assumptions. 5. FDP capital includes all development capital (inclusive from 2013; undiscounted) excluding land. 6. IRR is unlevered and does not include G&A, land costs and undeveloped land value. 7. Refer to definitions on page 24 hereof.
Economic Metrics 7 Bcf(3)2,500 m HZ
FDP(4)
with 7 BcfType Curve
Capital – PV0(5)($MM) $5.05 $7,425
IRR(6)(7)(%; Before Taxes) 62% 34%
Net PIR0(7) 2.87 3.39
Net PIR10(7) 1.25 0.99
NPV0(7)($MM) $14.5 $24,600
NPV10(7)($MM) $6.3 $3,150
Total Peak (Sales MMcfd)(Boed incl. Liquids)
7.31.7
~800~170,000

Private and Confidential – November 2017 16
• Currently connected to three third party processing facilities▫ Contracted firm service of 50 MMcfd▫ Significant interruptible service is also available
• Longer term opportunities:▫ Executed a competitive, third party processing agreement to manage mid‐term production growth up to 130 MMcfd of firm capacity
▫ Evaluating the construction of our own full processing facility Shovel‐ready egress to hub
▫ Firm shipper on TCPL North Montney Mainline Project (in service ~2019) and Enbridge T‐South (in service ~2020)
Infrastructure Options(1)
1. See advisories on pages 22 to 24 hereof.
Saguaro
Saguaro Proposed Sales Pipeline
Aitken Creek Takeaway Hub
Private and Confidential – November 2017 17
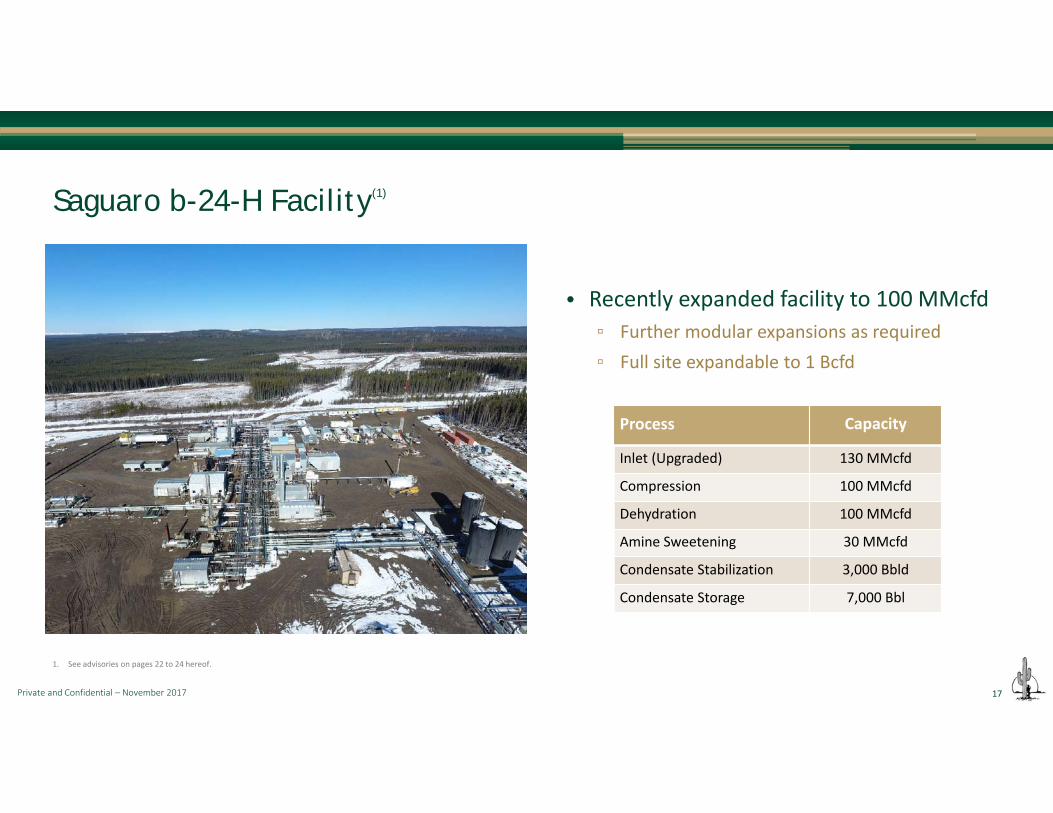
Process Capacity
Inlet (Upgraded) 130 MMcfd
Compression 100 MMcfd
Dehydration 100 MMcfd
Amine Sweetening 30 MMcfd
Condensate Stabilization 3,000 Bbld
Condensate Storage 7,000 Bbl
Saguaro b-24-H Facility(1)
• Recently expanded facility to 100 MMcfd▫ Further modular expansions as required▫ Full site expandable to 1 Bcfd
1. See advisories on pages 22 to 24 hereof.

Private and Confidential – November 2017 18
Strong Access to Capital(1)
1. See advisories on pages 22 to 24 hereof.2. Assumes full draw on Line of Equity and all future subscription warrants are exercised.
• $400 MM private equity line
• $140 MM syndicated bank revolver▫ Expected to increase to $160‐$170 MM on November 29, 2017
▫ Will continue to expand with reserve growth
• $50 MM 8.5% second lien secured notes due 2022▫ Placed with Canadian institutional
investors on March 15, 2017
Millions Capacity Outstanding Remaining
Line of Equity $400.0 $382.1 $17.9
Subscription Warrants(2) $24.1 $21.4 $2.7
Private Placement $20.8 $20.8 ‐
Total Equity Capacity $444.9 $424.3 $20.6
Total Shares 203.8 194.4 9.4
Second Lien Secured Notes $50.0 $50.0 ‐
Syndicated Credit Facility $140.0 Revolving
Total Debt Capacity $190.0
Private and Confidential – November 2017 19
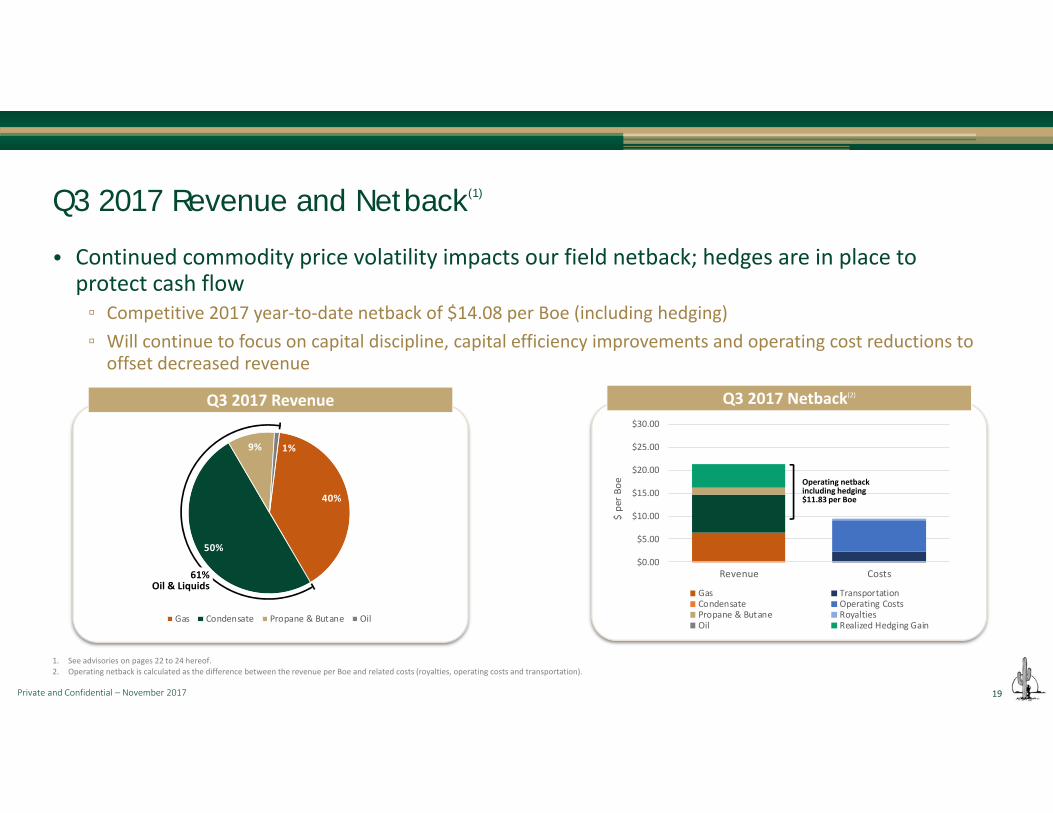
Q3 2017 Netback(2)
• Continued commodity price volatility impacts our field netback; hedges are in place to protect cash flow▫ Competitive 2017 year‐to‐date netback of $14.08 per Boe (including hedging)▫ Will continue to focus on capital discipline, capital efficiency improvements and operating cost reductions to offset decreased revenue
Q3 2017 Revenue and Netback(1)
1. See advisories on pages 22 to 24 hereof. 2. Operating netback is calculated as the difference between the revenue per Boe and related costs (royalties, operating costs and transportation).
Q3 2017 Revenue
61% Oil & Liquids
40%
50%
9% 1%
Gas Condensate Propane & Butane Oil
$0.00
$5.00
$10.00
$15.00
$20.00
$25.00
$30.00
Revenue Costs
$ per B
oe
Gas TransportationCondensate Operating CostsPropane & Butane RoyaltiesOil Realized Hedging Gain
Operating netbackincluding hedging$11.83 per Boe
Private and Confidential – November 2017 20
• Saguaro highlights include:▫ 40 producing Montney wells(2) on five different pads to the end of Q3 2017▫ 146 of 164 sections (89%) have been de‐risked/tested through Saguaro drilling and competitor activity
▫ Continually seeking to improve ultimate resource recovery through the application of advancing technologies
• Saguaro will continue to be focused on capital discipline, operating cost reductions and maintaining a strong balance sheet▫ Will remain prudent and flexible with capital expenditures▫ Activity focused on low risk development▫ Our liquids‐rich natural gas Montney wells have attractive economics at current strip pricing
Summary (1)
1. See advisories on pages 22 to 24 hereof.2. Includes producing wells to the end of Q3 2017; 50 wells drilled inception to date.
Liquids Rich• Unique reservoir with high
free condensate• Attractive economics at
current pricing
Low Cost• Lower cost due to shallow
drilling depth• Approximately 1,400 –
1,900 m TVD
Resource Size• 164 sections • 89% de‐risked• Represents ~1,200+
de‐risked locations

Private and Confidential – November 2017 21
Corporate InformationOfficersStacy Knull President & Chief Executive OfficerScott Carrothers Vice President Finance & Chief Financial Officer Tannis Gibson Vice President Geology & GeophysicsJason Hager Vice President Drilling & ConstructionJohn Christoffersen Vice President Operations & FacilitiesDarcy McLaughlin Vice President EngineeringEsther Troyan Vice President Land & Business Development
DirectorsMichael Graham ChairmanJames C. (Pep) Lough Independent BusinessmanM. Scott Bratt Independent BusinessmanRobert Chaisson Independent BusinessmanStacy Knull President & Chief Executive OfficerRichard Aube Pine Brook Road Partners LLCAndre Burba Pine Brook Road Partners LLCEdward Donkor Pine Brook Road Partners LLCTed Maa Pine Brook Road Partners LLCCameron McVeigh Camcor Partners Inc.
BankersCanadian Imperial Bank of Commerce595 Bay St., 5th Floor, Toronto, ON M5G 2C2
Alberta Treasury Branch239 ‐ 8th Ave SW, Calgary, AB T2P 1B9
National Bank of Canada600 De La Gauchetiere St. West, 3th Floor, Montreal, QC H3B 4L2
Royal Bank of CanadaRoyal Bank Plaza, 200 Bay Street, Toronto, ON M5J 2J5
Business Development Bank of Canada5, Place Ville Marie, Suite 400, Montreal, QC H3B 5E7
For more information, please contactStacy KnullPresident & Chief Executive OfficerPhone: (403) 453‐2680Email: [email protected]
Scott CarrothersVice President Finance & Chief Financial OfficerPhone: (403) 453‐2451Email: [email protected]
Head Office440, 222 – 3rd Ave SWCalgary, AB T2P 0B4Phone: (403) 453‐3040Fax: (403) 452‐5129Website: www.saguaroresources.com
AuditorsPricewaterhouseCoopers LLP3100, 111 – 5th Ave SWCalgary, AB T2P 5L3
Independent Qualified Reserves EvaluatorSproule Associates LimitedSuite 900, 140 – 4th Ave SWCalgary, AB T2P 3N3
Legal CounselBurnet, Duckworth & Palmer LLPSuite 2400, 525 – 8th Ave SWCalgary, AB T2P 1G1

Private and Confidential – November 2017 22
Forward Looking Statements. Certain statements included in this investor presentation (the "Presentation") constitute forward looking statements or forward looking information under applicable securitieslegislation. Such forward looking statements or information are provided for the purpose of providing information about management's current expectations and plans relating to the future. Readers are cautionedthat reliance on such information may not be appropriate for other purposes, such as making investment decisions. Forward looking statements or information typically contain statements with words such as"anticipate", "believe", "expect", "plan", "intend", "estimate", "propose", "project" or similar words suggesting future outcomes or statements regarding an outlook. Forward looking statements or information inthis Presentation include, but are not limited to, statements or information with respect to: Saguaro Resources Ltd.'s ("Saguaro" or the "Corporation") business strategy and objectives; statements with respect tothe performance characteristics of Saguaro’s oil and natural gas properties and wells; potential drilling locations; development plans including pilot, demonstration and development, optimization plans, maintaininga strong balance sheet and effect on costs and production; exploration plans; the Corporation’s focus for 2017, including capital discipline, capital expenditures, budgeted and forecasted drilling and completioncosts per well, low risk development, maintaining a strong balance sheet and cost reductions; anticipated production including production mix; estimated recoverable resources; proposed drilling locations;potential short and long term options for development and expansion of infrastructure; potential capital expenditures; anticipated well development program, including number of wells and anticipated timing ofcompletions; plans to investigate or participate in various pipeline projects; the Corporation’s plan to continue to evaluate construction of own processing facility and sales pipelines; expected timing of certainpipelines to be in service; forecasted pricing; expectations that the syndicated bank revolver will increase in Q4 2017; actual and estimated internal rates of return, which include assumptions respecting operatingand other costs, pricing, well depths, royalty rates and taxes; forecasted processing recoveries; our 2017 budgeted activities; and economic metrics of our full development plan, including capital, IRR, net presentvalues, EUR, netbacks, production rates, and anticipated debt and private equity drawn. In addition, the statements contained herein relating to "reserves" and "resources" are by their nature forward lookingstatements, as they involve the implied assessment, based on certain estimates and assumptions that the reserves or resources described can be can be profitably produced in the future.Type Well Production and Economics. This Presentation contains references to type well, or “type curve”, production and economics, which are derived, at least in part, from available information respecting thewell economics of other companies and, as such, there is no guarantee that Saguaro will achieve the stated or similar results, capital costs and return costs per well. Any references to peak rates, test rates, IP30 orinitial production rates or declines are useful for confirming the presence of hydrocarbons, however, such rates and declines are not determinative of the rates at which such wells will commence production anddecline thereafter and are not indicative of long term performance or ultimate recovery. In addition, such rates or declines may also include recovered fluids used in well completion stimulation. Readers arecautioned not to place reliance on such rates in calculating aggregate production for the Corporation.Assumptions. Forward looking statements or information are based on a number of factors and assumptions which have been used to develop such statements and information but which may prove to beincorrect. Although the Corporation believes that the expectations reflected in such forward looking statements or information are reasonable, undue reliance should not be placed on forward looking statementsbecause the Corporation can give no assurance that such expectations will prove to be correct. In addition to other factors and assumptions which may be identified in this Presentation, assumptions have beenmade regarding, among other things: commodity prices; the accuracy of geological and geophysical data and its interpretations of that data; estimated decline rates; the impact of increasing competition; thegeneral stability of the economic and political environment in which the Corporation operates; the timely receipt of any required regulatory approvals; the ability of the Corporation to obtain qualified staff,equipment and services in a timely and cost efficient manner; the ability of the Corporation to operate in a safe, efficient and effective manner; the ability of the Corporation to obtain financing on acceptableterms; that the Corporation will have sufficient cash flow, debt or equity or other financial resources to fund its capital and operating expenditures as needed; field production rates and decline rates; the ability toreplace and expand oil and natural gas reserves through acquisition, development or exploration; the timing and costs of pipeline, storage and facility construction and expansion and the ability of the Corporationto secure adequate product transportation; availability of pipelines; future oil and natural gas prices; currency, exchange and interest rates; the regulatory framework regarding royalties, taxes and environmentalmatters in the jurisdictions in which the Corporation operates; that the estimates of the Corporation’s reserve volumes and assumptions related thereto are accurate in all material respects; and the ability of theCorporation to successfully market its oil and natural gas products. Readers are cautioned that the foregoing list is not exhaustive of all factors and assumptions which have been used.Risks and Uncertainties. Forward looking statements or information are based on current expectations, estimates and projections that involve a number of risks and uncertainties which could cause actual resultsto differ materially from those anticipated by the Corporation and described in the forward looking statements or information. These risks and uncertainties which may cause actual results to differ materially fromthe forward looking statements or information include, among other things: the ability of management to execute its business plan; general economic and business conditions; the risk of instability affecting thejurisdictions in which the Corporation operates; the risks of the oil and natural gas industry, such as operational risks in exploring for, developing and producing crude oil and natural gas and market demand; thepossibility that government policies or laws may change or governmental approvals may be delayed or withheld; risks and uncertainties involving geology of oil and natural gas deposits; the uncertainty of reservesestimates and reserves life; the ability of the Corporation to add production and reserves through acquisition, development and exploration activities; the Corporation's ability to enter into or renew leases;potential delays or changes in plans with respect to exploration or development projects or capital expenditures; the uncertainty of estimates and projections relating to production (including decline rates), costsand expenses; fluctuations in oil and natural gas prices, foreign currency exchange rates and interest rates; risks inherent in the Corporation's marketing operations, including credit risk; uncertainty in amounts andtiming of royalty payments; health, safety and environmental risks; risks associated with potential future lawsuits and regulatory actions against the Corporation; uncertainties as to the availability and cost offinancing; changes in income tax rates; changes in incentive programs related to the oil and gas industry; failure of investors to fund capital calls; availability of pipelines; that legal actions may have an adverseeffect on Saguaro’s financial position or operations; and financial risks affecting the value of the Corporation’s investments. Readers are cautioned that the foregoing list is not exhaustive of all possible risks anduncertainties.No Obligation to Update. The forward looking statements or information contained in this Presentation are made as of the date hereof and the Corporation undertakes no obligation to update publicly or reviseany forward looking statements or information, whether as a result of new information, future events or otherwise unless required by applicable securities laws. The forward looking statements or informationcontained in this Presentation are expressly qualified by this cautionary statement.
Disclaimer
Private and Confidential – November 2017 23
Future Oriented Financial Information. This Presentation, in particular the information contained in the slides entitled, “Drilling and Completion Costs”, “2,000‐2,500 m Type Curve Economic Metrics” and “FullDevelopment Plan – Capital & Metrics” contains Future Oriented Financial Information ("FOFI") within the meaning of applicable securities laws. The FOFI has been prepared by Saguaro’s management to providean outlook of the Corporation's activities and results. The FOFI has been prepared based on a number of assumptions including the assumptions discussed under the heading "Forward Looking Statements" andassumptions with respect to the costs and expenditures to be incurred by the Corporation, capital equipment and operating costs, foreign exchange rates, taxation rates for the Corporation, general andadministrative expenses and the prices to be paid for the Corporation's production. Management does not have firm commitments for all of the costs, expenditures, prices or other financial assumptions used toprepare the FOFI or assurance that such operating results will be achieved and, accordingly, the complete financial effects of all of those costs, expenditures, prices and operating results are not objectivelydeterminable. The actual results of operations of the Corporation and the resulting financial results will likely vary from the amounts set forth in the analysis presented in this Presentation, and such variationmay be material. The Corporation and its management believe that the FOFI has been prepared on a reasonable basis, reflecting management’s best estimates and judgments. However, because this informationis highly subjective and subject to numerous risks including the risks discussed under the heading "Forward Looking Statements", it should not be relied on as necessarily indicative of future results. Except asrequired by applicable securities laws, Saguaro undertakes no obligation to update such FOFI and forward looking statements and information.Oil and Gas AdvisoriesFuture Drilling Locations. Unless otherwise expressly stated, the information in this Presentation pertaining to future drilling locations or drilling inventories is based solely on internal estimates made bymanagement and such locations have not been reflected in any independent reserve or resource evaluations prepared pursuant to National Instrument 51‐101 ("NI 51‐101"). Similarly, unless otherwise expresslystated, the information in this Presentation pertaining to targeted reserve volumes from future drilling is intended to indicate that in making its internal drilling decisions, the Corporation seeks to target drillinglocations that, based on previous drilling results and its own internal assessments, it believes will on average ultimately generate the indicated volumes. This document discloses drilling locations which areunbooked locations and are internal estimates based on Saguaro's prospective acreage and an assumption as to the number of wells that can be drilled per section based on industry practice and internal review.Unbooked locations do not have attributed reserves or resources and have been identified by management as an estimation of multi‐year drilling activities based on evaluation of applicable geologic, seismic,engineering, production and reserves information. There is no certainty that Saguaro will drill all unbooked drilling locations and if drilled there is no certainty that such locations will result in additional oil and gasreserves, resources or production. The drilling locations on which we actually drill wells will ultimately depend upon the availability of capital, regulatory approvals, oil and natural gas prices, costs, actual drillingresults, additional reservoir information that is obtained and other factors. While certain of the unbooked drilling locations have been derisked by drilling existing wells in relative close proximity to such unbookeddrilling locations, other unbooked drilling locations are farther away from existing wells where management has less information about the characteristics of the reservoir and therefore there is more uncertaintywhether wells will be drilled in such locations and if drilled there is more uncertainty that such wells will result in additional oil and gas reserves, resources or production.Finding and Development Costs. The aggregate of the exploration and development costs incurred in the most recent financial year and the change during that year in estimated future development costsgenerally will not reflect total finding and development costs related to reserves additions for that year.Reserves and Resources. Other than some of the reserves estimates disclosed on pages 2, 12, 13 and 27, the recovery, reserves and resources estimates provided herein are internal estimates only. Some of thereserve estimates disclosed on pages 2, 12, 13 and 27 were prepared by Sproule Associates Limited with an effective date of December 31, 2014, July 31, 2015, December 31, 2015, June 30, 2016, September 30,2016, December 31, 2016, June 30, 2017 and/or October 31, 2017 in accordance with NI 51‐101 and the Canadian Oil and Gas Evaluation Handbook and using Sproule’s forecast prices at December 31, 2014, July31, 2015, December 31, 2015, June 30, 2016, July 31, 2016, December 31, 2016, May 31, 2017 and/or September 30, 2017 respectively. There is no guarantee that the estimated reserves or resources will berecovered. As a consequence, actual results may differ materially from those anticipated in the forward looking statements. "Gas in Place", “MMBoe in Place", “MMBoe Recoverable“, “Tcf Gas in Place” and “EUR”are not indicative of reserves, nor are they categories of resources recognized by the Canadian Oil and Gas Handbook. These volumes are based upon Saguaro’s internal estimates only and are not derived from anindependent resources evaluation prepared pursuant to NI 51‐101. There may be more specific sub‐categories of resources applicable to these estimates that would provide a more accurate description of theresources and the work programs, technology and capital required to exploit such resources, but these have not been prepared by the Corporation. In addition, these volumes represent “best” case estimates,however “low” and “high” case estimates have not been prepared by the Corporation. There is no certainty that any portion of the noted volumes or resources will be discovered. If discovered, there is nocertainty that it will be commercially viable to produce any portion thereof. Estimates of the net present value of the future net revenue from Saguaro’s reserves do not represent the fair market value ofSaguaro’s reserves. Reserves and resource estimates contained herein have been made assuming that funding is likely to be available to Saguaro for the development of the applicable property.Pay Thickness. Estimates of pay thickness are considered to be anticipated results or information that indicate the potential value or quantities of resources under NI 51‐101. Such estimates have been prepared bymanagement of Saguaro and have not been prepared or reviewed by an independent qualified reserves evaluator or auditor. The risks associated with estimates of pay thickness include, but are not limited to, therisk that Saguaro's exploration and development drilling and related activities may provide different results; the risk that Saguaro may encounter unexpected drilling results; the occurrence of unexpected eventsinvolved in the exploration for, and the operation and development of, oil and gas; delays in anticipated timing of drilling and completion of wells; geological, technical, drilling and processing problems and otherdifficulties in producing petroleum reserves.Boe Presentation. All boe conversions in the report are derived by converting gas to oil at the ratio of six thousand cubic feet of natural gas to one barrel of oil equivalent. Boe may be misleading, particularly ifused in isolation. A Boe conversion rate of 1 Boe: 6 Mcf is based on an energy equivalency conversion method primarily applicable at the burner tip and does not represent a value equivalency at thewellhead. Given that the value ratio of oil compared to natural gas, based on current prevailing prices, is significantly different than the energy equivalency ratio of 1 Boe: 6 Mcf, utilizing a conversion ratio may bemisleading.
Disclaimer

Private and Confidential – November 2017 24
DEFINITIONSCertain oil and gas metrics. Finding, development and acquisition costs, finding and development costs, reserves replacement and netbacks do not have standardized meanings or standard methods of calculationand therefore such measures may not be comparable to similar measures used by other companies and should not be used to make comparisons. Such metrics have been included in documents provided bySaguaro to shareholders to give readers additional measures to evaluate the Saguaro's performance; however, such measures are not reliable indicators of the future performance of the Saguaro and futureperformance may not compare to the performance in previous periods and therefore such metrics should not be unduly relied upon.Net Present Value (NPV10): The anticipated net present value of the future net revenue (before tax) discounted at a rate of 10% associated with the type curves presented.IRR: Rate of return. IRR is the discount rate required to arrive at a NPV equal to zero. Rates of return set forth in this presentation are for illustrative purposes. There is no guarantee that such rates of return willbe achieved in the future.Profit to Investment Ratio (PIR): The ratio of payoff to investment for the project. For example, a net PIR (PIR0 for undiscounted future cash flow and PIR10 for future cash flow discounted by 10%) of $1.50represents for every $1.00 of investment, the project will return the invested $1.00 plus an additional $1.50 of profit for a total cash flow of $2.50. The net PIR of such a project would be $1.50 while the gross PIRwould be $2.50.Netback: Price less royalties, operating expenses and transportation costs.EUR: Estimated Ultimate Recovery. An approximation of the quantity of oil or gas that is potentially recoverable or has already been recovered from a reserve or well.Supply Cost: Price required to create an IRR (Before Tax) of 10% assuming the price is held flat over the life of the project (Natural Gas price at AECO, Condensate price at Edmonton).Finding and Development Costs (F&D): The anticipated full exploration and development costs associated with each barrel of oil equivalent expected to be recovered from a well based on the type curves andeconomics presented.Finding, Development and Acquisition Costs (FD&A): The anticipated full exploration, development and acquisition costs associated with each barrel of oil equivalent expected to be recovered from a well basedon the type curves and economics presented.Reserves Replacement: The estimated amount of proved reserves added to the reserves base during the year relative to the amount of oil and gas produced.IP30: The average production rate over a 30 day period.
Disclaimer

Private and Confidential – November 2017 25
Supplemental Information: Risk Management(1)
1. See advisories on pages 22 to 24 hereof. 2. Summary of hedges and physical contracts by type. Does not detail each transaction.3. Term can include full and partial years.
Hedge Type(2) Term(3) Weighted Average Price Total VolumeNYMEX Swap 2017 $4.177 CAD/GJ 5,275 GJd
NYMEX/AECO Basis Swap 2017 ‐$1.370 CAD/GJ 5,275 GJd
NYMEX/AECO Basis Swap 2018 ‐$1.355 CAD/GJ 90,000 GJd
NYMEX/AECO Basis Swap 2019 ‐$1.151 CAD/GJ 60,000 GJd
AECO Swap 2017 $2.958 CAD/GJ 40,000 GJd
AECO Swap Nov‐Dec2017 $3.088 CAD/GJ 10,000 GJd
AECO Swap Dec2017 $2.300 CAD/GJ 25,000 GJd
AECO/Station 2 Basis Swap 2017 ‐$0.447 CAD/GJ 40,000 GJd
AECO/Station 2 Basis Swap Nov‐Dec2017 ‐$0.371 CAD/GJ 25,275 GJd
AECO/Station 2 Basis Swap Dec2017 ‐$0.350 CAD/GJ 25,000 GJd
AECO/Station 2 Basis Swap 2018 ‐$0.429 CAD/GJ 90,000 GJd
AECO/Station 2 Basis Swap 2019 ‐$0.342 CAD/GJ 95,000 GJd
WTI Collar 2017 $55.68 CAD/Bbl put / $69.61 CAD/Bbl call 1,400 Bbld
WTI Swap 2018 $66.77 CAD/Bbl 3,650 Bbld
Physical Sales Contract(2) Term(3) Weighted Average Price Total VolumeSumas 2017 ‐$0.760 USD/MMBtu 14,478 MMBtud
Sumas 2018 ‐$0.728 USD/MMBtu 28,695 MMBtud
Sumas 2019 ‐$0.728 USD/MMBtu 28,695 MMBtud
Sumas 2020 ‐$0.724 USD/MMBtu 23,695 MMBtud
Chicago Nov17‐Oct18 ‐$1.50 USD/MMBtu 5,700 MMBtud

Private and Confidential – November 2017 26
0
250
500
750
1,000
1,250
1,500
1,750
0 2 4 6 8 10 12 14 16 18 20 22 24 26 28 30 32 34 36 38 40
Prod
ucing D
ay Sa
les P
rodu
ction (Boe
d)
Normalized Months
Upper Montney Wells Middle Montney Wells Lower Montney Wells7 Bcf Type Curve6 Bcf Type Curve
78‐C (2,500 m Hz) Wells8 Bcf Type Curve
1. See advisories on pages 22 to 24 hereof.2. See page 8 for the 2,000‐2,500 m Type Curve Economic Metrics.3. Includes test volumes which are not included in publicly reported production data.4. Pilot program included Lower, Middle and Upper targets.
Pilot Program(4): Horizontal length of 1,000 – 1,500 m
2,000 m HZ Development Program: Upper & Middle Montney wells (3)
Well Performance Update(1)(2)
78‐C (2,500 m HZ) wells(3)

Private and Confidential – November 2017 27
Supplemental Information: Reserves(1)
Reserves Evaluation(Net)
CompanyShare(2)(3)
NPV10 per BoeBefore Taxes
Full DevelopmentCapital (FDC)
Finding, & Development Costs
(F&D)(4)
Finding, Development & Acquisition Costs
(FD&A)(4)Locations
MBoe $ per boe $MM $ per boe $ per boe
YE2015
YE2016
MY2017
Oct. 312017
YE2015
YE2016
MY2017
Oct. 312017
YE2015
YE2016
MY2017
Oct. 312017
MY2017
Oct. 31 2017 ITD MY
2017Oct. 31 2017 ITD YE
2015YE
2016MY2017
Oct. 312017
Proved Developed Producing
9,181 15,822 18,933 24,509 $10.42 $12.05 $11.84 $11.27 $0 $0 $0 $0 $12.75 $10.81 $12.89 $12.85 $10.88 $16.36 19 32 34 43
Total Proved (1P)
31,781 83,541 92,690 140,723 $7.94 $7.23 $7.99 $8.02 $177 $511 $457 $699 $0.93 $5.29 $7.39 $0.97 $5.30 $8.21 52 134 134 169
Total Proved + Probable (2P)
107,995 270,294 295,124 400,378 $7.64 $6.83 $7.43 $7.41 $631 $1,543 $1,486 $1,893 $0.24 $3.61 $5.46 $0.26 $3.61 $5.76 118 330 330 353
1. Based on reports prepared by Sproule Associates Limited effective December 31, 2015, December 31, 2016, June 30, 2017 and October 31, 2017. See advisories on pages 22 to 24 hereof.2. YE 2015 PDP reserves are comprised of 70% Gas, 29% NGLs, 1% Oil. 1P and 2P reserves are comprised of 70% Gas, 30% NGLs.
YE 2016 PDP reserves are comprised of 75% Gas, 24% NGLs, 1% Oil. 1P and 2P reserves are comprised of 76% Gas, 24% NGLs. MY 2017 PDP reserves are comprised of 76% Gas, 24% NGLs, 0.3% Oil. 1P and 2P reserves are comprised of 76% Gas, 24% NGLs. Oct. 31 2017 PDP reserves are comprised of 78% Gas, 22% NGLs, 0.2% Oil. 1P and 2P reserves are comprised of 77% Gas, 23% NGLs.
3. YE 2015 Sproule Reserves Evaluation dated effective December 31, 2015 and based on Sproule Pricing as of December 31, 2015.YE 2016 Sproule Reserves Evaluation dated effective December 31, 2016 and based on Sproule Pricing as of December 31, 2016. MY 2017 Sproule Reserves Evaluation dated effective June 30, 2017 and based on Sproule Pricing as of May 31, 2017.Oct. 31 2017 Sproule Reserves Evaluation dated effective October 31, 2017 and based on Sproule Pricing as of September 30, 2017.
4. Oct. 31 2017 Development Capital of $132.2 MM (includes unaudited estimate for October 2017); MY 2017 Development Capital of $63.5 MM. Inception to Oct. 31 2017 (ITD) Development Capital of $479.3 MM or $611.2 MM including land and acquisition (includes unaudited estimate for October 2017). FD&A and F&D includes Full Development Capital (FDC).


