
8/3/2019 SAS Chapter4
http://slidepdf.com/reader/full/sas-chapter4 1/39
4. Saturation
V. S. LETOKHOV
With 38 Figures
In this chapter we consider the principles and methods of laser saturati on
spectroscopy for Doppler-broadened transitions, as well as the basicinformation obtained by this method.
4.1 Background Material
4.1.1 Historical Remarks
The discovery of saturation spectroscopy was connected with the first
experiments of studying physical effects when the laser radiation inter
acted with the amplifying medium of the first gas laser created by JAVAN
et al. [4.1]. Among them we should mention the works by BENNETT [4.2]
and by LA}IB [4.3]. The laser light burns a "hole" in the Doppler-broaden
ed amplification line, and the laser output power decreases resonantly,
when the laser frequency is tuned to the centre of the Dopple r-broadened
line. This effect was termed "the Lamb dip". Experimentally the
Lamb dip was revealed in works of two independent groups at MIT[4.4] and by Yale [4.5]. The saturation method was further elaborated by
three la boratories in the USSR and USA [4.6-8] that started a wide usc
of absorption saturation spectroscopy. They proposed to put a resonantly
absorbing low-pressure gas cell into the laser cavity. Saturation of
absorption in a standing wave laser field results in a narrow Lamb dip
at the centre of the Doppler-broadened absorption line. Thus the laser
output power has a narrow peak at the centre of the absorption line.
termed often as "the inverted Lamb dip". The early experimental worksin observing the narrow inverted Lamb dip were reported in Refs. [4.7-9].
In the subsequent works, other methods were suggested to improve
considerably the usefulness of saturation spectroscopy.
4.1.2 Saturation Approach
Saturation spectroscopy, free of Doppler broadening. is an example of
the great improvements in the methods of atomic and molecular spectros
copy which became practicable with the advent of lasers. This method of
8/3/2019 SAS Chapter4
http://slidepdf.com/reader/full/sas-chapter4 2/39
96 V. S. LETOKHOV
laser spectroscopy is one of the most efficient and promising in regards to
both fundamen tal and applied works. Th e basis for saturation spectros
copy is a change in the velocity distribution of particles at the levelsnand
m when a coherent light wave acts upon the Doppler-broadened transi
tion n - m. This approach gives the foundation for most experiments of
laser spectroscopy inside the Doppler contour conducted in the last ten
years. There are three main methods for obtaining narrow resonances:
1) saturated absorption resonances in a two-level transition: 2) absorption
and emission resonances in transitions connected to either level m or nof the transition under saturation; 3) resonances observed in the total
number of atoms (or molecules) in the levels n or 111 which interact with
the laser field.
This chapter presents principles of saturation spectroscopy. Anyone
who wants to familiarize himself in more detail with the methods and
the theory of saturation spectroscopy may use the original papers, which
are referred to below, as well as a monograph [4.10] and more compre
hensive reviews [4.11, 12]. Yet the ideas a nd methods of saturation
spectroscopy have been set forth in a more popular and accessible form
in Refs. [4.13-15].
4.2 Interaction of a Laser Wave with a DoppJer-Broadened
Transition
In the present section we shall list in brief and give final formulas for
basic resonance effects resulting from the interaction of the laser field
(a running wave, a standing wave, a combination of a strong running and
a weak counterrunning waves) with the Doppler-broadened transition.
Also we shall consider both the case of simple two-level transition and
resonance effects in two coupled transitions with a common level.
4.2.1 Hole in the Velocity Distribution Induced by a Traveling Wave
Assume that the Doppler-broadened transition between two levels
interacts with a traveling light wave which has the form:
E(t,r) 6'cos(wt+q> kr). (4.1 )
The field interacts most effectively with atoms (or molecules) which
have a velocity v (see Su bsect. 2.2.2):
(4.2)
Lower level
'.Ires v
Upper level
Molecular velocity distributions
(a l (b )
Saturation Spectroscopy
VaI
Atomiccenter
frequency
97
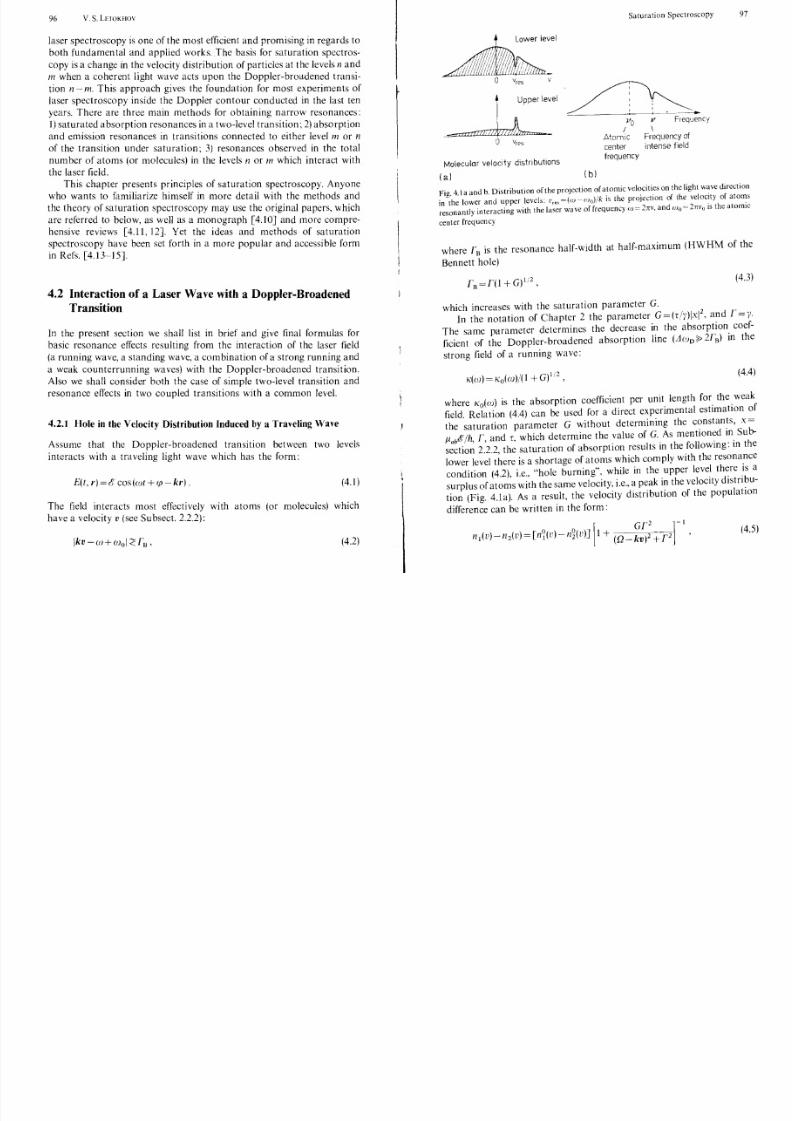
F 4 I ,d , Distributio n o f the projection of atomic velocities on the light wave direction
i n l ~ ' h ~ I ~ : ~ r and upper levels: t"e,=(w-wo)/k is the projection of the velocity of atoms
antI" interactin g with the laser wave of frequency W = 2nv, and wo= 2nvo IS the atomIC
reson J •
center frequency
where rB
is the resonance half-width at half-maximum (HWHM of the
Bennett hole)
(4.3)
which increases with the saturation parameter G.
In the notation of Chapter 2 the parameter G=(T/r)lxI2
, a ~ d r 'y,
The same parameter determines the decrease in the absorptIOn. coef
ficient of the Doppler-broadened absorption line ( L l O J D ~ 2rB) m the
strong field of a running wave:
/((w) /(o(w)/(1 +G)1!2 ,(4.4)
where /(o(w) is the absorption coefficient per unit. length for. the .weak
field. Relation (4.4) can be used for a direct expenmental estimatIOn of. . ' h n'tants xthe saturation parameter G Without determtnmg t e s . '
/latif/h, r , and T, which determine the value of G.As m e n t I O n , ~ d I ~ . Sub
section 2.2.2. the saturation of absorption results In the followmg. In the
lower level there is a shor tage of atoms which comply with the resona.nce
d 't ' (42) t' e "hole burning". while in the upper level there IS acon I Ion . , . .,. . d' 'bsurplus of atoms with the same velocity, i.e . a peak in the velocity Istn. u-
tion (Fig. 4.1a). As a result, the velocity distribution of the population
difference can be written in the form:
(4.5)
8/3/2019 SAS Chapter4
http://slidepdf.com/reader/full/sas-chapter4 3/39
9R V. S. LETOKHOV
wher.e Q.=w-wo, w=21tv, wo=21tvo, n?(L')=N?W(r) is the velocity
dIstrIbutIOn of population for the i-th level in the absence of field N°
is the total density of particles on the level in the absence of field, W ( l ~ ) is the Maxwell distribution of velocity projection on wave vector k
which is given .by ( 2 . ~ 7 ) . There is therefore a "hole" in the distribution ' \ ,
of the populatIOn dIfference (4.5) for the atoms complying with the
resonance condition (4.2). This corresponds to the "hole burning" in the
Doppler contour (Fig. 4.1 b) which was described by BENNETT [4.2].
4.2.2 Narrow Resonance of Saturated Absorption
During absorption only a small part of the atoms is excited at a resonance
velocity. The light wave seems to set up a beam of excited particlcs with
kl' = w - (1)0 in the gas. Just as the spectral line of a particle beam, if
observed perpendicular, has no Doppler broadening (see Chapt. 3),
so "an excited atomic beam" in gas induced by a strong running wave
can be observed through the use of a properly oriented probe wave;
information on the spectrum of such particles without Doppler broaden
ing can thus be obtained. Most widely used cases of observation of
narrow resonances by saturated absorption are discussed below.
1) Lamh Dip in the Standing Ware
Assume that the laser field is a standing plane wave which can be rep
resented as a superposition of two oppositely propagating waves of the
same freq uencies:
E=t1 cos(wt+cp-kr)+O' cos(wt+cp+kr)
= 0 ' ~ cos(wt+cp) coskr, (4.6)
where J, = 20' is the amplitude of the standing wave. This field interacts
with two groups of atoms with velocities which comply with one of the
resonance conditions:
w-wo±kv=O. (4.7)
In the velocity distribution, and on thc Doppler contour, these two
groups occupy symmetric positions about the centre. If the detuning
Q = w - Wo is somewhat larger than the resonance half-width J eachl,
running wave burns its "hole" independently from the other (Fig. 4.2a).
The parameters of each hole and the saturated absorption of each
running wave are described by the equations of Subsections 2.2.2 and
4.1.1, where the amplitude of the field in the saturation parameter G is
to be taken as the amplitude of one running wave.
Saturation Spectroscopy 99
(al{l j Frequency
(bl Frequency
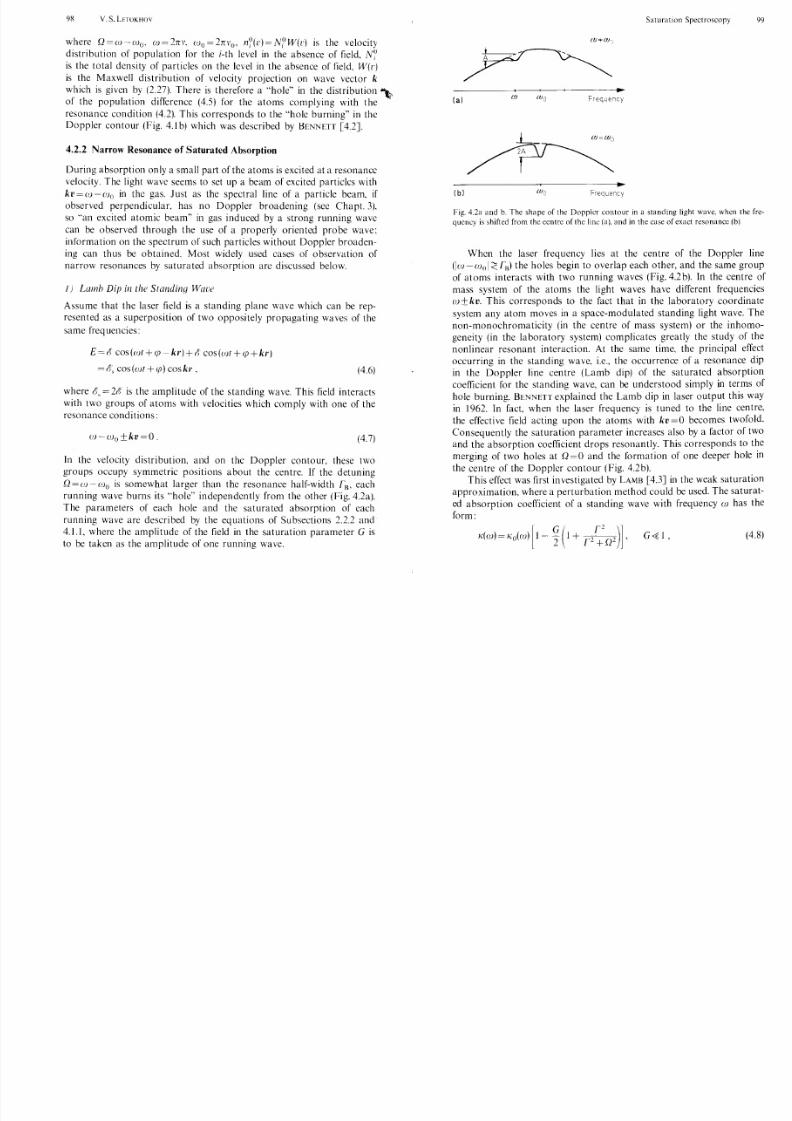
Fig. 4.2a and b. The shape of the Doppler contour in a standing light wave, when the fre
quency is shifted from the centre of the line (a), and in the case of exact resonance (b)
When the laser frequency lies at the centre of the Doppler line
(lw - wol <: JJl) the holes begin to overlap each other, and the same group
of atoms interacts with two running waves (Fig. 4.2 b). In the centre ofmass system of the atoms the light waves have different frequencies
w ±kv. This corresponds to the fact that in the laboratory coordinate
system any atom moves in a space-modulated standing light wave. The
non-monochromaticity (in the centre of mass system) or the inhomo
geneity (in the laboratory system) complicates greatly the study of the
nonlinear resonant interaction. At the same time, the principal effect
occurring in the standing wave, i.e., the occurrence of a resonance dip
in the Doppler line centre (Lamb dip) of the saturated absorption
coefficient for the standing wave, can be understood simply in terms of
hole burning. BENNETT explained the Lamb dip in laser output this way
in 1962. In fact, when the laser frequency is tuned to the line centre,
the effective field acting upon the atoms with kv =0 becomes twofold.
Consequently the saturation parameter increases also by a factor of two
and the absorption coefficient drops resonantly. This corresponds to the
merging of two holes at Q =0 and the formation of one deeper hole in
the centre of the Doppler contour (Fig. 4.2b).
This effect was first investigated by LAMB [4.3J in the weak saturation
approximation, where a perturbation method could be used. The saturat
ed absorption coefficient of a standing wave with frequency w has the
form:
(4.8)
8/3/2019 SAS Chapter4
http://slidepdf.com/reader/full/sas-chapter4 4/39
100 V.S.LETOKHOV
where G is the saturation parameter for one running wave. The degree
of absorption saturation is equal to G at the Doppler line centre and it is
equal to G 2 far from the resonance. The full width of the dip at the line
centre corresponds to 21.
In studying saturated absorption, the strong field case is of great
importance. Saturation in the strong field of a standing wave was
theoretically investigated by a number of authors: RAUTIAN and
SOBELMAN [4.16J, RAUTIAN [4.17J, GREENSTEIN [4.18], STENHOLM and
LAMB [4.19J, FELDMAN and FELD [4.20J, SHIMODA and UEHARA [4.21,22J,BAKLANovand CHEBOTAYEV [4.23]. In the case of an ar bitrary degree of
saturation, and of arbitrary detuning and relaxation constants, the
problem can be solved only with the help of computer. It possible to
get an analytic solution in the particular case of exact resonance (wo = (0)
and equal relaxation constants (,', = }'2 = T). However, approximate
methods enable us to get some idea of the intense standing wave interac
tion and to answer questions of practical importance. Th e complications
in solving problems of this type can be explained by changes in the
line shape of atomic emission and the level popUlations in the strong
field. These phenomena cannot be treated separately. When two fields
with frequencies 10 , and (1)2 interact simultaneously, the induced polariza
tion contains combination frequencies OJ, ±n (w, - (1)2) , where n= 1, 2 ....
Th e polarizations at these frequencies in turn result in a modulation of
the popUlation difference. Equations (2.12) are interconnected by time
dependent off-diagonal and diagonal elements of the density matrix,
which are related directly to the polarization and the population of the
levels, respectively.
In the rate-equation approximation one can ignore the well-known
changes of the absorption-or emission--line shape of a particle which
take place under the action of a strong field (oscillation of the probability
amplitudes between the two levels at the Rabi frequency, x = IlI5Ih).
When x 1, we may neglect oscillations. But, the condition x 1 does
not all mean that no saturation effects show up. If 1 1 T (or T2 T"where 0. = I I I is the transversal relaxation time, Tl =T is the longitudinal
relaxation time), then, nevertheless, the saturation parameter may be
rather large and saturation of the level population difference would
occur. Ignoring the spatial inhomogeneity the absorption of a standing
wave was studied by a number of authors [4.18, 21, 23]. They found
expressions which are identical and differ only in their form. The shape
of the Lamb dip when no coherence effects are taken into account can be
expressed by
/\1/\o=(u++a_)-1[1+(b 2+1)1/2/(I+b2
+2G)'/2J (4.9)
where
Saturation Spectroscopy 101
and the parameter b = Ql1 is the frequency detuning. This expression
(4.9) can be rewritten in the form given by UEHARA and SHIMODA [4.21J
where A=(Q2+12)1!2 and B=[Q2+12(1+2G)J 1/2.
At frequencies far from resonance, the absorption coefficient is
approximated by
(4.11)
which is in agreement with the absorption coefficient of the strong
traveling wave (4.4). This corresponds to independent propagation of the
traveling waves through the gas medium. In the case of exact resonance
the absorption coefficient is
(4.12)
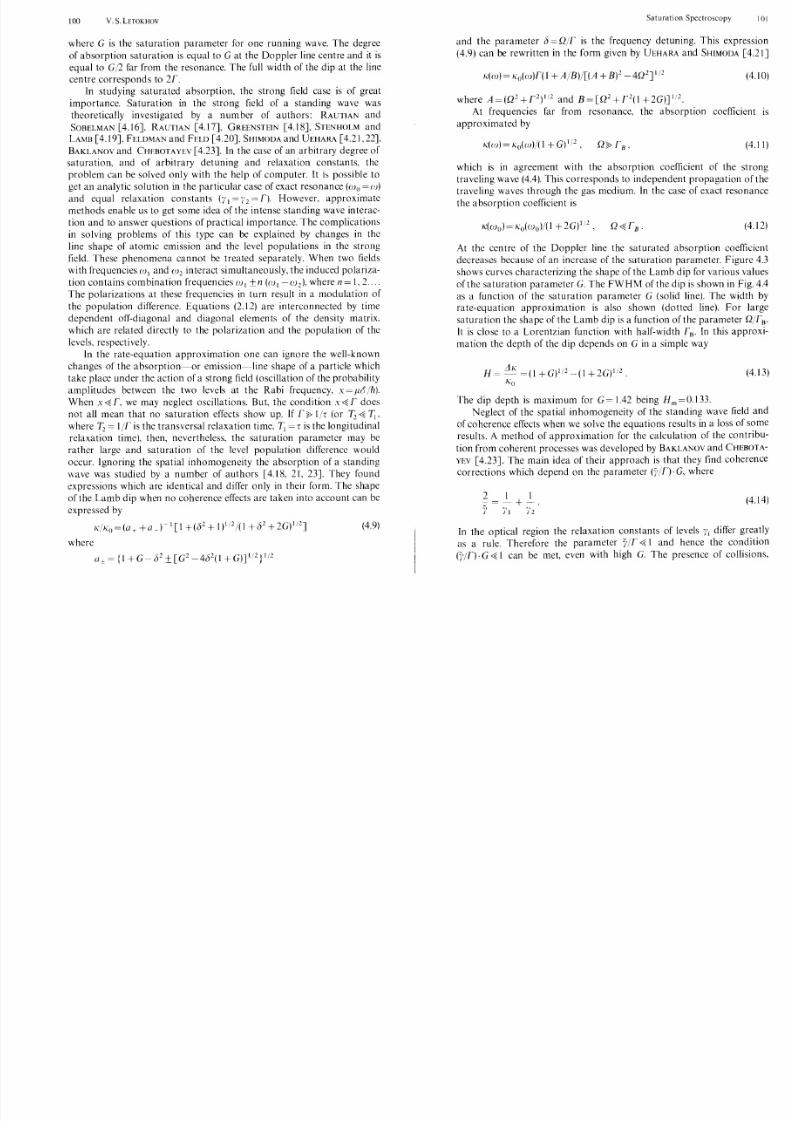
At the centre of the Doppler line the saturated absorption coefficient
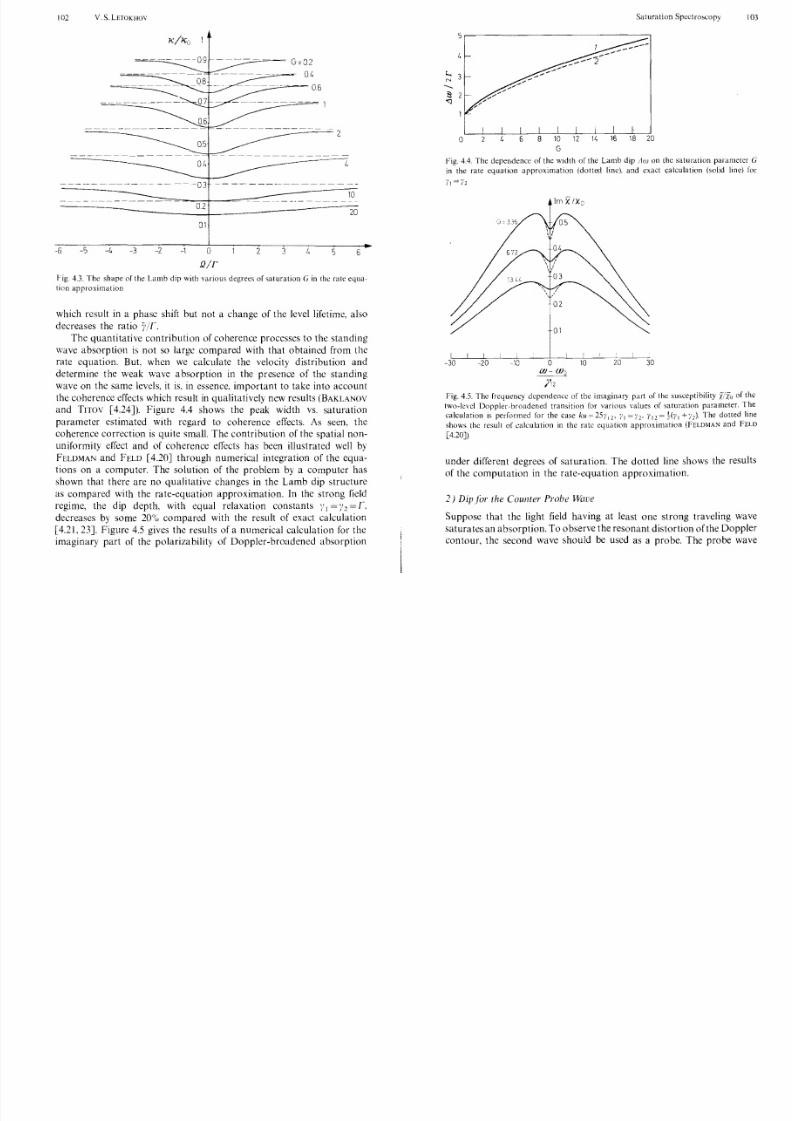
decreases because of an increase of the saturation parameter. Figure 4.3
shows curves characterizing the shape of the Lamb dip for various valuesof the saturation parameter G. The FWHM of the dip is shown in Fig. 4.4
as a function of the saturation parameter G (solid line). The width by
rate-equation approximation is also shown (dotted line). For large
saturation the shape of the Lamb dip is a function of the parameter Ql1Jj.
It is close to a Lorentzian function with half-width 113
, In this approxi
mation the depth of the dip depends on G in a simple way
H= L1/\ =(1+G)1/2_(1+2G)1!2.
/\ 0
The dip depth is maximum for G= 1.42 being Hm=O.133.
(4.13)
Neglect of the spatial inhomogeneity of the standing wave field andof coherence effects when we solve the equations results in a loss of some
results. A method of approximation for the calculation of the contribu
tion from coherent processes was developed by BAKLANOV and CHEBOTA
YEV [4.23]. The main idea of their approach is that they find coherence
corrections which depend on the parameter (1'1T)· G, where
2 1 1:- = - + -' . (4.14)
}' ,'I ,'2
In the optical region the relaxation constants of levels )Ii differ greatly
as a rule. Therefore the parameter ";11 1 and hence the condition
(}'/T). G 1 can be met, even with high G. Th e presence of collisions,
8/3/2019 SAS Chapter4
http://slidepdf.com/reader/full/sas-chapter4 5/39
102 V,S.LETOKHOV
0.5
0.4
0.3
0..2
0.1
-6 -5 -4 -3 -2 -1 0.
Qlr2
0.2
0.4
· · : : : : : . ~ ~ - 0 . . 6
- - - - -2
3 5
10
20.
6
Fig, 43, The sh ape of the Lamb dip with various degrees of saturation G in the rate equa
lion appfClximation
which result in a phase shift but not a change of the level lifetime. also
decreases the ratio y/f,The quantitative contribution of coherence processes to the standing
wave absorption is not so large compared with that obtained from the
rate equation. Bu t when we calculate the velocity distribution and
determine the weak wave absorption in the presence of the standing
wave on the same levels. it is, in essence, important to take into account
the coherence effects which result in qualitatively new results (BAKLANOV
and TITOV [4.24]). Figure 4.4 shows the peak width vs, saturation
parameter estimated with regard to coherence effects. As seen, the
coherence correction is quite small. The contribution of the spatial non
uniformity effect and of coherence effects has been illustrated well by
FELDMAN and FELD [4.20] through numerical integration of the equa
tions on a computer. The solution of the problem by a computer has
shown that there are no qualitative changes in the Lamb dip structure
as compared with the rate-equation approximation. In the strong field
regime, the dip depth, with equal relaxation constants )'1 )'2 r,decreases by some 20°" compared with the result of exact calculation
[4.21, 23]. Figure 4.5 gives the results of a numerical calculation for the
imaginary part of the polarizability of Doppler-broadened absorption
Saturation Specll'Oo,copy 10.3
5,----------------------------,
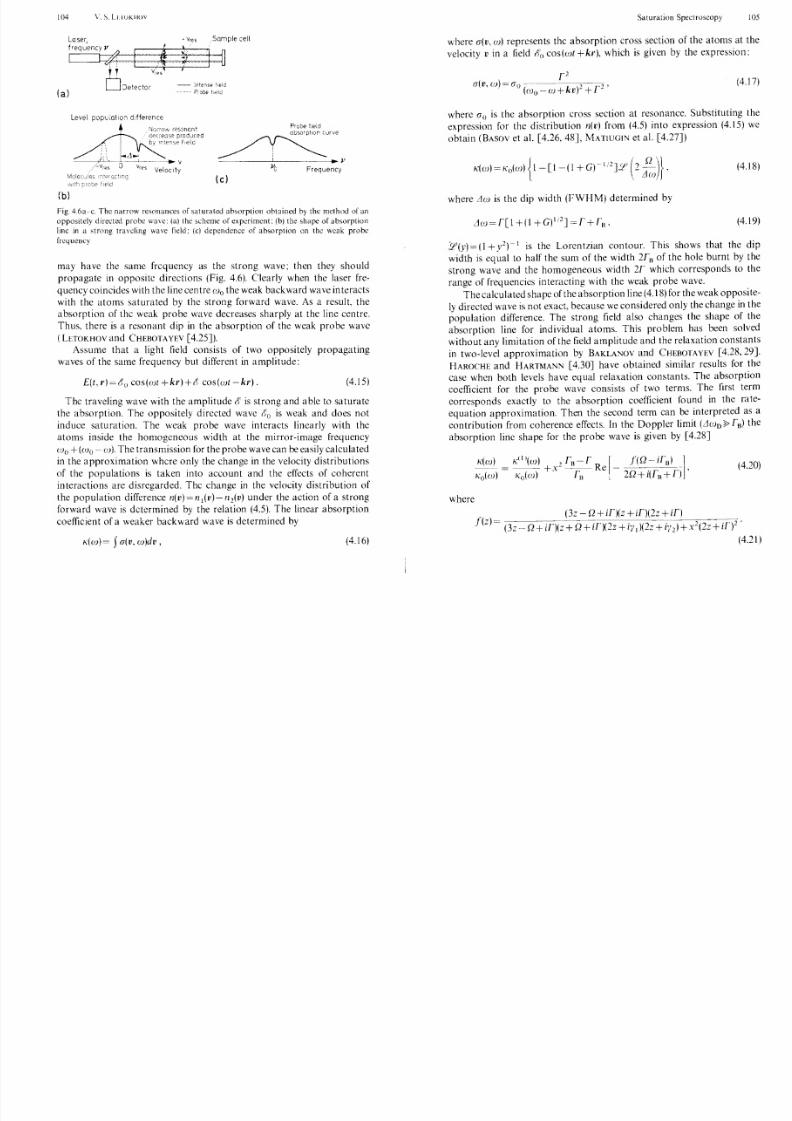
0. 20.
Fig, 4,4, The dependence of the Width of the Lamb dip Aw on the saturation parameter G
in the rate equation approximation (dOlled line), and exact calculation (solid line) for
1m X1XO
Fig, 4.5. The frequency dependence of the imaginary part of the susceptibility iii" of the
two-level Doppler-broadened transition for various values of saturation parameter. The
calculation IS perrormed for the case ku 25Y'2' I'l =;'2' 'I'll = Hi', -'-"2)' The dolted lineshows the result of <:aiculation in the rate equation approximation (FELDMA:-.l and FELD
[4,20J)
under different degrees of saturation. The dotted line shows the results
of the computation in the rate-equation approximation.
2) Dip for lhe Counter Probe JlJilVe
Suppose that the light field having at least one strong traveling wave
satura es an absorption. To observe the resonant distortion of the Doppler
contour, the second wave should be used as a probe, The probe wave
8/3/2019 SAS Chapter4
http://slidepdf.com/reader/full/sas-chapter4 6/39
104 v. S. LI.lOKHOV
(al
Level pop,-,;atlo:1 dIfference
(b)
Sample cell
inte'lsetlE'ld
Probe tleld
~ C ~ ' v 110 Frequency
(e)
Fig. 4.6a-c. The narrow resonances of saturated absorption obtained by the method of an
oppositely directed pr obe wave: (a) the scheme of cxperimcnt: (b) the shape of absorption
Iinc in a strong traveling wave field: (e) dependence of absorption on the weak probe
frequency
may have the same frequency as the strong wave; then they should
propagate in opposite directions (Fig. 4.6). Clearly when the laser frequency coincides with the line centre Wo the weak backward wave interacts
with the atoms saturated by the strong forward wave. As a result, the
absorption of the weak probe wave decreases sharply at the line centre.
Thus, there is a resonant dip in the absorption of the weak probe wave
(LETOKHovand CHEBOTAYEV [4.25J).
Assume that a light field consists of two oppositely propagating
waves of the same frequency but different in amplitude:
E(t,r) 0 0 Cos(wt+kr)+i1 cos(wt-kr). (4.15)
Th c traveling wave with the amplitude 0 is strong and able to saturate
the absorption. The oppositely directed wave 1:0 is weak and does notinduce saturation. The weak probe wave interacts linearly with the
atoms inside the homogeneous width at the mirror-image frequency
Wo + wo (1)). The transmission for the probe wave can be easily calculated
in the approximation whcre only the change in the velocity distributions
of the populations is taken into account and the effects of coherent
interactions are disregarded. The change in the velocity distribution of
the population difference n(v)=lI t(v) -n 2(v) under the action of a strong
forward wave is determined by the relation (4.5). Th e linear absorption
coefficient of a weaker backward wave is determined by
K(W)= SG(v, w)dv , (4.16)
Saturation Spectroscopy 105
where G(v, w) represents the absorption cross section of the atoms at the
velocity v in a field cos(wt +kr), which is given by the expression:
(4.17)
where Go is the absorption cross section at resonance. Substituting the
expression for the distribution II(V) from (4.5) into expression (4.15) we
obtain (BASOV et al. [4.26,48]. MA TlUGIN et al. [4.27J)
[1 (1 +G)-ti2J2' (I 2 ~ ' ) } , \ LIw.
(4.18)
where Aw is the dip width (FWHM) determined by
(4.19)
.!t(y) (1 +i ) I is the Lorentzian contour. This shows that the dip
width is equal to half the sum of the width 2f s of the hole burnt by the
strong wave and the homogeneous width 2f which corresponds to the
range of frequencies interacting with the weak probe wave.
The calculated shape of the absorption line (4.18) for the weak opposite
ly directed wave is not exact, because we considered only the change in the
population difference. The strong lield also changes the shape of the
absorption line for individual atoms. This problem has been solved
without any limitation of the lield amplitude and the relaxation constants
in two-level approximation by BAKLANovand CHEBOTAYEV [4.28,29].
HAROCHE an d HARTMANN [4.30J have obtained similar results for the
case when both levels have equal relaxation constants. The absorption
coefficient for the probe wave consists of two terms. The lirst term
eorresponds exactly to the absorption coefficient found in the rate
equation approximation. Then the second term can be interpreted as acontribution from coherence effects. In the Doppler limit (LlWD f B) the
absorption line shape for the probe wave is given by [4.28J
where
K(W) = K(I )(w) + X 2 ~ ~ Re rKo(O)) Ko(W) fs
I (Q if )
2Q+i(fs
, (3: Q+in(z+in(2z+
j (z) = (3z _ Q + n(: + Q+ f)(2z + y 1)(2z + 'l'2)+
(4.20)
(4.21 )
8/3/2019 SAS Chapter4
http://slidepdf.com/reader/full/sas-chapter4 7/39
106 V. S. LETOKHOY
-lor, --j/r---or / ku = 002
-0.8 -06 -01.
,,,,,\ ,,,,
"
\\ I\ I
\ I\ I\ I
, .........
-0 2 0
S2 / ku
02 06 08
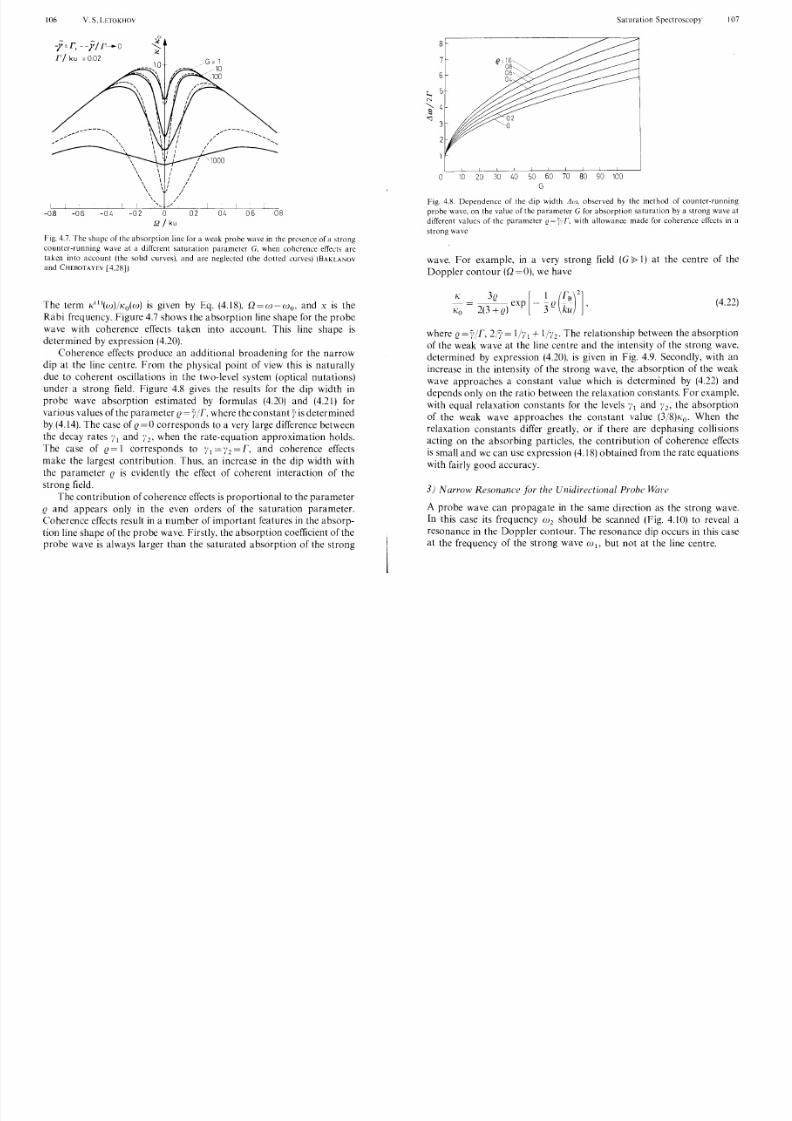
Fig. 4.7. The shape of the absorption line for a weak probe wave in the pre,ence of a strong
counter-running wave at a different saturation parameter G. when coherence elTects arc
taken into account (the solid curves), and are neglected (the dotted curves) (BAKLANOY
and CHEBOTAYEY [4.28J)
The term K1I)(W)/Ko(W) is given by Eq. (4.18), Q=w -wo . and x is the
Rabi frequency. Figure 4.7 shows the absorption line shape for the probe
wave with coherence effects taken into account. This line shape is
determined by expression (4.20).
Coherence effects produce an additional broadening for the narrow
dip at the line centre. From the physical point of view this is naturally
due to coherent oscillations in the two-level system (optical nutations)
unde r a strong field. Figure 4.8 gives the results for the dip width in
probe wave absorption estimated by formulas (4.20) and (4.21) for
various values o f the parameter Q = Y/T. where the constant}' is determinedby (4.14). The case of Q = 0 corresponds to a very large difference between
the decay rates ,'I and ,'2. when the rate-equation approximation holds.
The case of 12 = 1 corresponds to ,' I =,' 2 = T. and coherence effects
make the largest contribution. Thus, an increase in the dip width with
the parameter Q is evidently the effect of coherent interaction of the
strong field.
The contribution of coherence effects is proportional to the parameter
Q and appears only in the even orders of the saturation parameter.
Coherence effects result in a number of important features in the absorp
tion line shape of the probe wave. Firstly, the absorption coefficient of the
probe wave is always larger than the saturated absorption of the strong
Saturation Spectroscopy 107
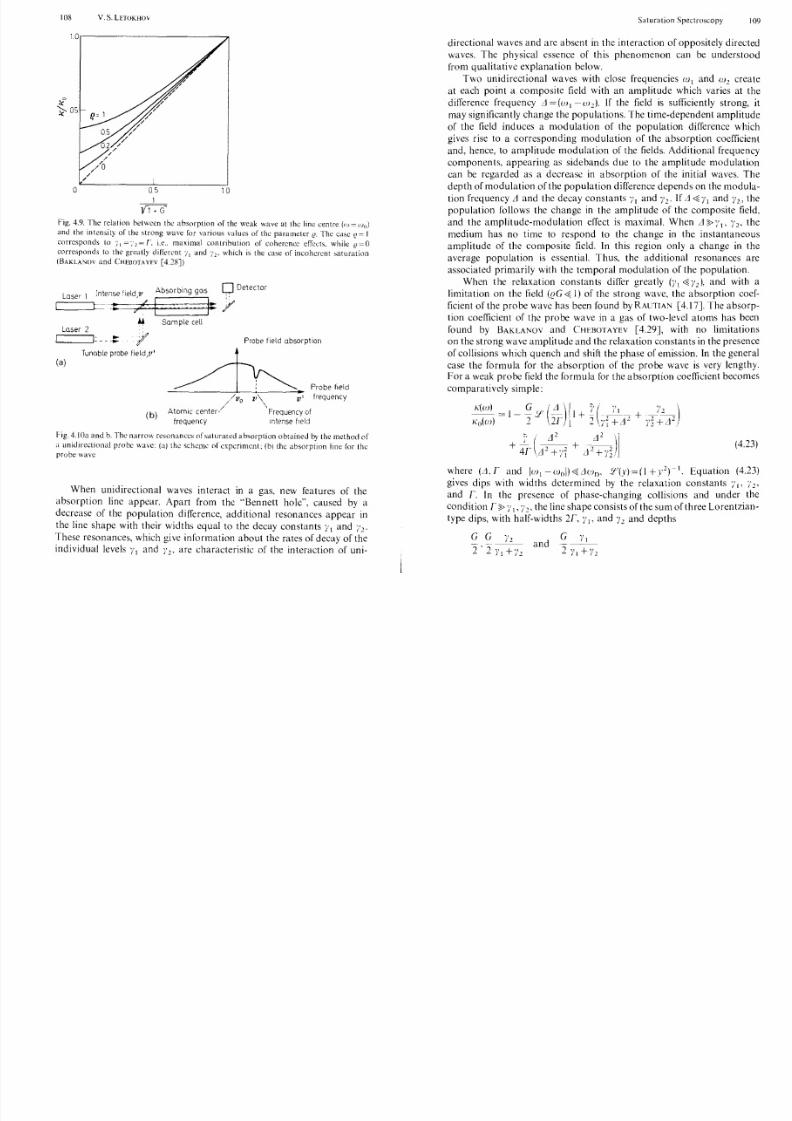
8
7
6
r... 5N
'S I.
"1 02
'0
o 10 20 30 1.0 50 60 70 80 90 100
G
Fig. 4.8. Dependence of the dip width dU), observed by the method of counter-running
probe wave, on the value of the parameter G for absorption saturation by a strong wave at
dilTerent values of the parameter Q= ).:r, with allowance made for coherence effects 111 a
strong wave
wave. For example, in a very strong field (G 1) at the centre of the
Doppler contour (Q =0), we have
(4.22)
where Q=y/T, 2/}' = 1hl + 1h2' The relationship between the absorption
of the weak wave at the line centre and the intensity of the strong wave,
determined by expression (4.20), is given in Fig. 4.9. Secondly, with an
increase in the intensity of the strong wave, the absorption of the weak
wave approaches a constant value which is determined by (4.22) and
depends only on the ratio between the relaxation constants. For example,
with equal relaxation constants for the levels I I and }'2' the absorption
of the weak wave approaches the constant value (3/8)Ko. When therelaxation constants differ greatly, or if there are dephasing collisions
acting on the absorbing particles, the contribution of coherence effects
is small and we can use expression (4.18) obtained from the rate equations
with fairly good accuracy.
3) Narrow Resonance for the Unidirectional Probe WcI1'c
A probe wave can propagate in the same direction as the strong wave.
In this case its frequency W2 should be scanned (Fig. 4.10) to reveal a
resonance in the Doppler contour. The resonance dip occurs in this case
at the frequency of the strong wave WI , but not at the line centre.
8/3/2019 SAS Chapter4
http://slidepdf.com/reader/full/sas-chapter4 8/39
108 V. S. LETOKHOV
1.0.------------------"
o 05 10
Fig. 4.9. The relation between the absorption or the weak wave at the line centre (" =0)0)
ami the intensity or the strong wave for various values of the parameter 11. The case fJ = I
corresponds to i', =';2 r, i.e . maximal contribution of coherence effects. while 0=0
corresponds to the greatly different '/, and ; '2 ' which is the case or incoherent satun;tion
(BAKLANOV and CHEDOTAYEV [4.28J)
Laser 1Absorbing gas [J Detector
Laser 2 : ~ L 1:--.:: <y
Tunable probe field,v'
(a)
(b)
/Sample cell
Probe field absorption
Pmb,',,1d/v o v \ Vi frequency
AtomiC center / \ Frequency of
frequency Intense field
Fig. 4.10a and b. The narrow resonances or saturated absorption obtained by the method or
a unidirectional probe wave: ('ll the scheme of experiment; Ib) the absorption linc ror the
probe wave
When unidirectional waves interact in a gas, new features of the
absorption line appear. Apart from the "'Bennett hole", caused by a
decrease of the population difference, additional resonances appear in
the line shape with their widths equal to the decay constants }'t and }'2'
'fhese resonances, which give information about the rates of decay of the
individual levels;'1 and "/2'
are characteristicof
the interactionof
uni-
Saturation Spectroscopy 109
directional waves and are absent in the interaction of oppositely directed
waves. The physical essence of this phenomenon can be understood
from qualitative explanation below.
Two unidirectional waves with close frequencies WI and W 2 create
at each point a composite field with an amplitude which varies at the
difference frequency /j (W I ( 2 ) ' If the field is sufficiently strong, it
may significantly change the popUlations. The time-dep endent amp litude
of the field induces a modulation of the popUlation difference which
gives rise to a corresponding modulation of the absorption coefficientand, hence, to amplitude modulation of the fields. Additional frequency
components, appearing as sidebands due to the amplitude modulation
can be regarded as a decrease in absorption of the initial waves. The
depth of modulation of the popUlation difference depends on the modula
tion frequency L1 and the decay constants ~ ' I and 1'2' If ~ . y ! and 'f l, the
population follows the change in the amplitude of the composite field,
and the amplitude-modulation effect is maximal. When j ~ ; ' t ' 'i'2, the
medium has no time to respond to the change in the instantaneous
amplitude of the composit e field. In this region on ly a change in the
average population is essential. Thus, the additional resonances are
associated primarily with the temporal modulation of the popUlation.
When the relaxation constants differ greatly (y 1 }'2)' and with a
limitation on the field (gG 1) of the strong wave, the absorption coef
ficient of the probe wave has been found by RAUTIAN [4.17]. The absorp
tion coefficient of the probe wave in a gas of two-level atoms has been
found by BAKLANOv and CHEBOTAYEV [4.29J, with no limitations
on the strong wave amplitude and the relaxation constants in the presence
of collisions which q uench and shift the phase of emission. In the general
case the formula for the absorption of the probe wave is very lengthy.
For a weak probe field t he formula for the absorption coefficient becomes
comparatively simple:
h'(w)
1 - ,5!) (i j) 1 + }' (' +:2' )T ; l 2 , ~ , ~ +/12
+ 4 ; ~ (' ) j2 7 + j2 · 1
1 ,j - +n j + .(4.23)
where (.1,1 and 1(;)1 - w ( ) I ) ~ j ( ! ) D ' _ . ~ l ' ( y ) (I +y2) I. Equation (4.23)
gives dips with widths determined by the relaxation constants ~ ' l ' ; '2 '
and T. In the presence of phase-changing collisions and under the
condition T ~ } ' l' '2' the line shape consists of the sum of three Lorentzian
type dips, with half-widths 2T, ('1' and )'2 and depths
8/3/2019 SAS Chapter4
http://slidepdf.com/reader/full/sas-chapter4 9/39
110 V. S. LnOKHOV
10
G c '03
r! KC =18-2
(al . t1 ! r(b) . t1 ! r
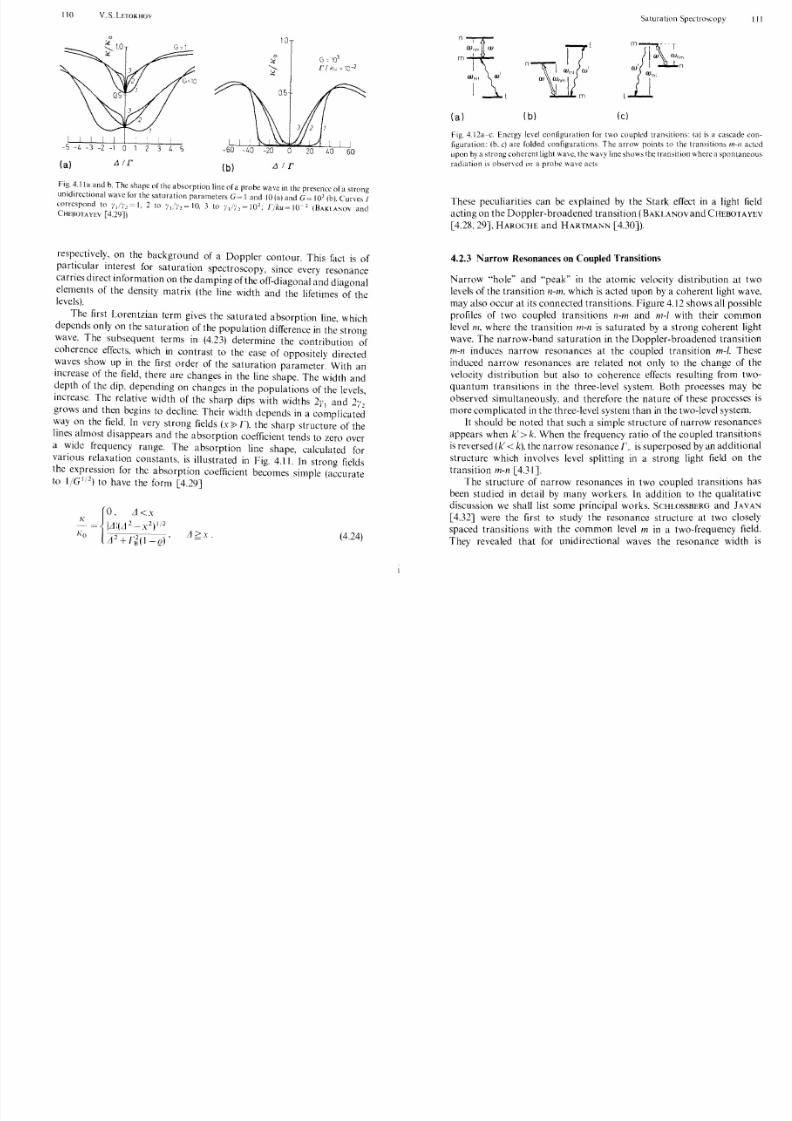
Fig. 4.11a and b. The shape of the absorption line or a probe wave in the presence or a strong
unidirectIOnal wa w for the saturatIOn parameters G= 1 and 10 (a) and G= 10 3 (b). Curves J
correspond to )',1)'2=1,2 to hiYl=IO, 3 to 10 2 ; I/ku=lO- iBAKl.A;-.;oyandCHEBOTA HY [4.29])
r e s p ~ c t i v e l y , on the background of a Doppler contour. This fact is of
p a r t ~ c u l a r I n ~ e r e s t f o ~ saturation spectroscopy, since every resonance
carnes direct m f o r m a ~ l O n on the damping of the off-diagonal and diagonalelements of the denSity matrix (the line width and the lifetimes of thelevels).
The first Lorentzian term gives the saturated absorption line, which
depends only on the saturation of the popUlation difference in the strong
wave. The subsequent terms in (4.23) determine the contribution clcoherence e f f e c t ~ , which in contrast to the case of oppositely directed
:vaves show up 111 the first order of the saturation parameter. With an
Increase of the field, there are changes in the line shape. The width and
?epth of the dip, depending on changes in the populations of the levels,
Increase. The relative width of the sharp dips with widths 2" a I 1 d ~ " ' . ' 11 ... ,2
grows andt ~ e n
begms to decline. Their width dep ends in a complicated~ a y on the f 1 ~ l d . In very strong fields (x 11 the sharp structure of the
hnes almost disappears and the absorption coefficient tends to zero over
a ~ i d e frequency range. The absorption line shape, calculated for
vano us r e l ~ x a t i o n constants. is illustrated in Fig. 4.11. In strong fields
the expressIOn for the absorption coefficient becomes simple (accurateto IIG to have the form [4.29]
(4.24)
Saturation Spectroscopy 111
n
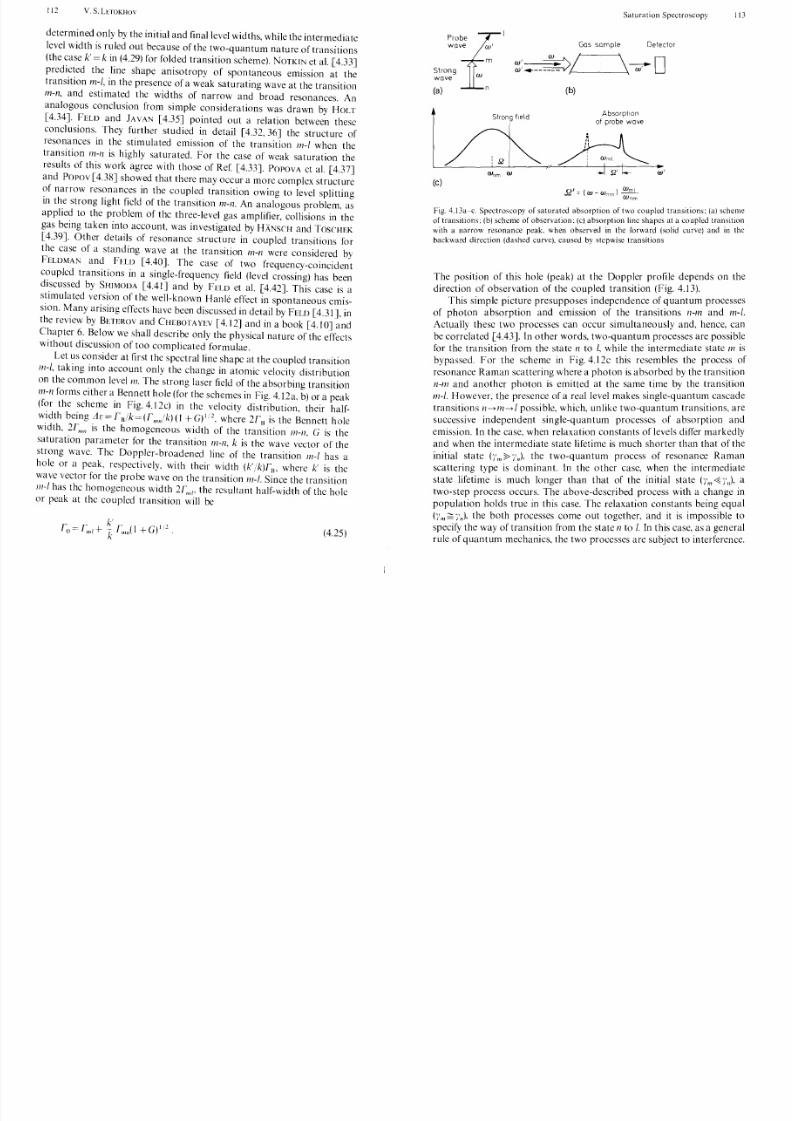
(al (b ) leI
Fig. 4.12a -c. Energy level for two coupkd transitions: (a) b a cascade con-
figuration: (b. c) arc folded The arrow points to the transitions m-Il acted
lIpon by a strong coherent light wave, the wavy lme shows the transition where a spontaneous
radiation is observed or a probe wave acts
These peculiarities can be explained by the Stark effect in a light field
acting on the Doppler-broadened transition (BAKLA!,;ov and CHEBOTAYEV
[4.28, 29]. HAROCHE and HARTMA!,;N [4.30]).
4.2.3 Narrow Resonances on Coupled Transitions
Narrow "hole" and "peak" in the atomic velocity distribution at twolevels of the transition n-m, which is acted upon by a coherent light wave,
may also occur at its connected transitions. Figure 4.12 shows all possible
profiles of two coupled transitions n-m and m-/ with their common
levelm, where the transition m-n is saturated by a strong coherent light
wave. The narrow-band saturation in the Doppler-broadened transition
nJ-n induces narrow resonances at the coupled transition m-l. These
induced narrow resonances are related not only to the change of the
velocity distribution but also to coherence effects resulting from two
quantum transitions in the three-level system. Both processes may be
observed simultaneously, and therefore the nature of these processes is
more complicated in the three-level system than in the two-level system.
It should be noted that such a simple structure of narrow resonances
appears when kt> k. When the frequency ratio of the coupled transitions
is reversed (kt < k), the narrow resonance r _ s superposed by an additional
structure which involves level splitting in a strong light field on the
transition m-n [4.31].
The structure of narrow resonances in two coupled transitions has
been studied in detail by many workers. In addition to the qualitative
discussion we shall list some principal works. SCHLOSSBERG and JAVA"!
[4.32] were the first to study the resonance structure at two closely
spaced transitions with the common level m in a two-frequency field.
They revealed that for unidirectional waves the resonance width is
8/3/2019 SAS Chapter4
http://slidepdf.com/reader/full/sas-chapter4 10/39
112 V. S. LETOKHOV
determined only by the initial and final level widths, whi le the intermediate
level width is ruled out because of the two-quantum nature of transitions
(the case k' = ki n (4.29) for folded transition scheme). NOTKIN et al. [4.33J
predicted the line shape anisotropy of spontaneous emission at the
transition In-I, in the presence of a weak saturating wa ve at the transition
In-n, and estimated the widths of narrow and broad resonances. An
analogous conclusion from simple considerations was drawn by HOLT
[4.34]. FELD and JA VAN [4.35J pointed out a relation between thesc
conclusions. They fur ther st udied in detail [4.32, 36J the structure of
resonances in the stimulated emission of the transition In-I when the
transition 1n-/1 is highly saturated. For the case of weak saturation the
results of this work agree with those of Ref. [4.33]. POPOVA et al. [4.37J
and PoPov [4.38J showed that there may occur a more complex structure
?f narrow resonances in the coupled transition owing to level splitting
il l th.e strong light field of the transition /11-/1. An analogous problem, as
applIed to the problem of thc three-level gas amplifier, collisions in the
gas being taken into account, was investigated by HANSCH and TOSCHEK
[4.39]. Other details of resonance structure in coupled transitions for
the case of a standing wave at the transition In-n were considered bv
FELDMAN and FELD [4.40]. Th e case of two frequency-coinciden-t
c?upled transitions in a single-frequency field (level crossing) has beendIscussed by SHIMODA [4.41 J and by FELO et al. [4.42]. This case is a
stimulated version of the well-known Hanle effect in spontaneous emis
SIOn. ~ a n y arising effects ha ve been discussed in detail by FELD [4.31 J, in
the review by BETERov and CHEBOTA YEV [4.12J and in a book [4.1 OJ and
Chapter 6. Below we shall describe only the physical nature of the effects
without discussion of too complicated formulae.
Let us consider at first the spectral line shape at the coupled transition
/11-1, taking into account only the change in atomic velocity distribution
on the com,?on level 111. The strong laser field of the absorbing transition
/11-/1 forms either a Bennet t hole (for the schemes in Fig. 4.12a. b) or a peak
(for the scheme in Fig.4.12c) in the velocity distribution, their half
WIdth being JV=/R/k=(/" jk)(l +G)I!2. where 21 13 is the Bennett holeWidth, 2 I ~ " , is the homogeneous width of the transition 111-11. G is the
saturation parameter for the transition 111-11, k is the wave vector of the
strong wave. The Doppler-broadened line of the transition m-I has a
hole or a peak. respectively. with their width (k' /k)/B• where k' is the
wave vector for the probe wave on the transition /11-/. Since the transition
111-/ has thc homogeneous width 2 I ~ I I I ' the resultant half-width of the holeor peak at the coupled transition will be
(4.25)
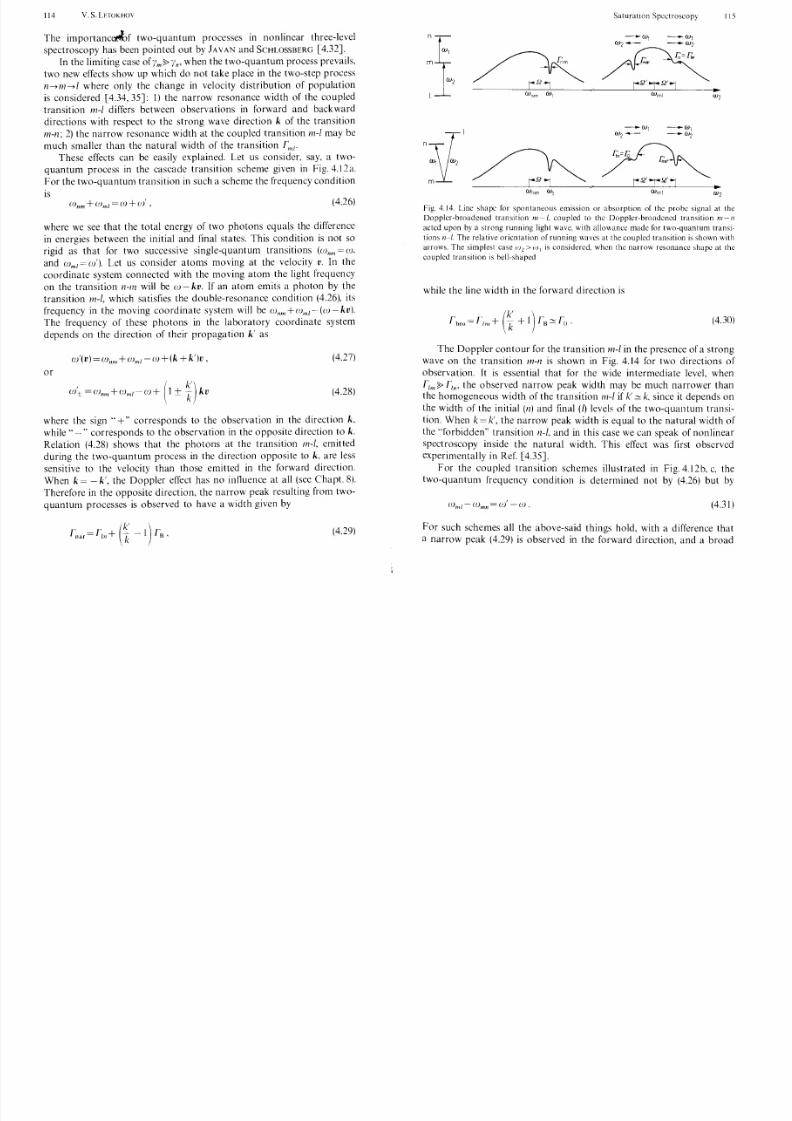
p r o b l
l
wave :'
Strongwave W
(a) n
Strong field
(e)
Saturation Spectroscopy
(b)
Gas sample
Absorptionof probe wave
Detector
"'i Wml
, I j Q ' L :'S2'= I w - w nm l Wml
Wnm
113
Fig. 4.13a-c. Spectroscopy of saturated abso rption of two coupled transitions: (a) scheme
of transitions: (b) scheme of observation: (c) absorption line shapes at a coupled transition
with a narrow resonance peak. when observed in the forward (solid curve) and in the
backward direction (dashed curve). caused by stepwise transitions
Th e position of this hole (peak) at the Doppler profile depends on thedirection of observation of the coupled transition (Fig. 4.13).
This simple picture presupposes independence of quantum proeesses
of photon absorption and emission of the transitions 11-In and In-I.
Actually these two processes can occur simultaneously and, hence, can
be correlated [4.43]. In other words, two-quantum processes are possible
for the transition from the state n to I, while the intermediate state In is
bypassed. For the scheme in Fig.4.12e this resembles the process of
resonance Raman scattering where a photon is absorbed by the transition
/1-/11 and another photon is emitted at the same time by the transition
m-I. However, the presence of a real level makes single-quantum cascade
transitions 11--'>/11--'>1 possible, which, unlike two-quantum transitions, are
successive independent single-quantum processes of absorption and
emission. In the case, when relaxat ion constants of levels differ markedly
and when the intermediate state lifetime is much shorter than that of the
initial state (,'", "n). the two-quantum process of resonance Raman
scattering type is dominant. In the other case, when the intermediate
state lifetime is much longer than that of the initial state (1'111 I',), a
two-step process occurs. The above-described process with a change in
population holds true in this case. The relaxation constants being equal
( " ) ' m ~ " ) ' , , ) , the both processes come out together, and it is impossible to
specify the way of transition from the state /1 to I. In this case, as a general
rule of quantum mechanics, the two processes are subject to interference.
8/3/2019 SAS Chapter4
http://slidepdf.com/reader/full/sas-chapter4 11/39
114 V. S. LETOKHov
The importancet!Lf two-quantum processes in nonlinear three-level
spectroscopy has been pointed out by JA VAN and SCHLOSSBERG [4.32].
In the limiting case o f r ' m ~ }'n' when the two-quantum process prevails,
two new effects show up which do not take place in the two-step process
n--->m--->I where only the change in velocity distribution of population
is considered [4.34,35]: 1) the narrow resonance width of the coupled
transition /11-1 differs between observations in forward and backward
directions with respect to the strong wave direction k of the transition
m-n; 2) the narrow resonance width at the coupled transition m-I may be
much smaller than the natural width of the transition r"'i'
These effects can be easily explained, Let us consider, say, a two
quantum process in the cascade transition scheme given in Fig. 4,lla.
For the two-quantum transition in such a scheme the frequency condition
IS
(4.26)
where we see that the total energy of two photons equals the difference
in energies between the initial and final states. This condition is not so
rigid as that for two successive single-quantum transitions (conm = w,
and Wmi = w'), Let us consider atoms moving at the velocity v, In the
coordinate system connected with the moving atom the light frequencyon the transition n-11l will be W - kv, If an atom emits a photon by the
transition m-I, which satisfies the double-resonance condition (4,26), its
frequency in the moving coordinate system will be wn",+w",I-(w-kv),
The frequency of these photons in the laboratory coordinate system
depends on the direction of their propagation k' as
w'(v)=W lIm +wm l -w+(k +k')v, (4.27)
or
(4,28)
where the sign ,- +" corresponds to the observation in the direction k,
while"' - " corresponds to the observation in the opposite direction to k.
Relation (4.28) shows that the photons at the transition /11-1, emitted
during the two-quantum process in the direction opposite to k, are less
sensitive to the velocity than those emitted in the forward direction.
When k = - k', the Doppler effect has no influence at all (see Chapt. 8).
Therefore in the opposite direction, the narrow peak resulting from two
quantum processes is observed to have a width given by
(4.29)
SaturatlOll Spectroscopy 115
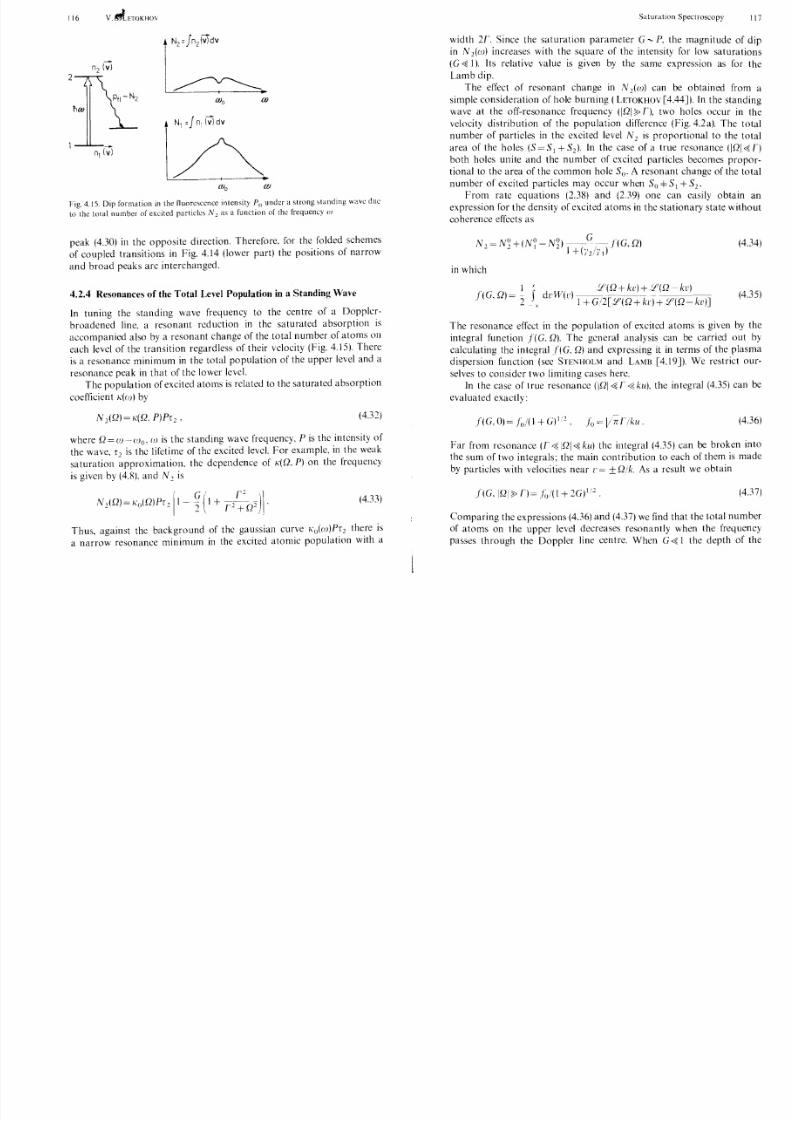
--.- w, --- . . W,W2"" ' - - - -"W2
SJ 1 Q':t'Q'1
Fig. 4.14. Line shape for spontaneous emission or absorption of the probe signal at the
Doppler-broadened transition I11-L coupled to the Doppler-broadened transition /11- /1
acted upon by a strong running light wave, with allowance made for two-quantum transi
tions 11-/. The relative orientation of running waves at the coupled transition is shown with
arrows. The simplest case "'2 >w! is considered, when the narrow resonance shape at the
coupled transition is bell-shaped
while the line width in the forward direction is
_ (k' )bro=ll",+ k +1 rB.:::::rO ' (4.30)
The Doppler contour for the transition 111-1 in the presence of a strong
wave on the transition m-n is shown in Fig, 4,14 for two directions of
observation. It is essential that for the wide intermediate level, when
rim rill' the observed narrow peak width may be much narrower than
the homogeneous width of the transition /11-1 if k' .::::: k, since it depends on
the width of the initial (n) and final (I) l e v e l ~ of the two-quantum transi
tion. When k= k', the narrow peak width is equal to the natural width of
the "'forbidden" transition n-I, and in this case we can speak of nonlinear
spectroscopy inside the natural width, This effect was first observed
experimentally in Ref. [4.35].
For the coupled transition schemes illustrated in Fig, 4.12b, c, the
two-quantum frequency condition is determined not by (4.26) but by
(4.31)
For such schemes all the above-said things hold, with a difference that
a narrow peak (4,29) is observed in the forward direction, and a broad
8/3/2019 SAS Chapter4
http://slidepdf.com/reader/full/sas-chapter4 12/39
116 V.If!tETOKHOV
2
(/)0 (t)
Fig. 4.15. Dip formation in the Ouoresccnce intensity Po under a strong ;,tanding way\: due
to the total number of excited particles tv 2 as a function of the frequency (i!
pcak (4.30) in the opposite direction. Therefore, for the folded schemes
of coupled transitions in Fig. 4.14 (lower part) the positions of narrow
and broad peaks arc interchanged.
4.2.4 Resonances of the Total Level Population in a Standing Wave
In tuning the standing wave frequency to thc centre of a Dopplcr
broadened line, a resonant reduction in the saturated absorption is
accompanied also by a resonant change of the total number of atoms on
each levcl of the transition regardless of their velocity (Fig. 4.15). There
is a resonance minimum in the total population of the upper level and a
resonance peak in that of the lower level.
The population of excited atoms is related to the saturated absorption
coefficient K(rJ)) by
(4.32)
where Q= W-Wo, (J) is the standing wave frequency, P is the intensity of
the wave, T, is the lifetime of thc excited level. Fo r example, in the weak
saturation ~ p p r o x i m a t i o n . the dependence of K(Q, P) on the frequency
is given by (4.8). an d N 1 is
tv (Q ) KoW)P'l [I (I + r ~ Q 2 ) 1 ' (4.33)
Thus, against the background of the gaussian curve /'O(W)P'2 there is
a narrow resonance minimum in the excited atomic population with a
Saturation Spectroscopy 117
width 2I'. Since the saturation parameter G - P, the magnitude of dip
in N 2(W) increases with the square of the intensity for low saturations
(G I). Its relative value is given by the same expression as for the
Lamb dip.
Th e effect of resonant change in N 2(W) can be obtained from a
simple consideration of hole burning ( LEToKHov [4.44J). In the standing
wave at the off-resonance frequency (IQI n, two holes occur in the
velocity distribution of the population differcnce (Fig.4.2a). Th e total
number of particles in the excited level N 2 is proportional to the total
area of the holes (S=SI +S2)' In the ease of a true resonance ( I Q I ~ n both holes unite an d the number of excited particles becomes propor
tional to the area of the common hole So. A resonant change of the total
number of excited particles may occur when SO+SI +S1'
From rate equations (2.38) an d (2.39) on e can easily obtain an
expression for the density of excited atoms in the stationary state without
coherence effects as
N , = N ~ + ( N ? - N ~ ) G f(G,Q)- 1+(;'2/Ytl·
(4.34)
in which
1 J Y(Q+hJ+Y(Q h)j '(G,Q)=2 J d L ' W ( d - I + ~ " C ~ = +krl+!f '(Q-h)J (4.35)
The resonance effect in the population of excited atoms is given by the
integral function f(G. Q). Th e gcneral analysis can be carried out by
calculating the integral f(G. Q) and expressing it in terms of the plasma
dispersion function (sec STENHOLM and LAMB [4.19J). We restrict our
selves to consider two limiting cases herc.
In the case of true resonance (IQI r ku). the integral (4.35) can be
evaluated exactly:
I(G. 0) = f ~ j ( l +G) l , = Vn: f!k ll . (4.36)
Fa r from resonance (I ' iQI kll) the integral (4.35) can be broken into
the sum of two integrals; the main contribution to cach of them is made
by particles with velocities ncar r = ±Qik. As a result we obtain
(4.37)
Comparing the expressions (4.36) an d (4.37) we find that the total number
of atoms on the upper level decreases resonantly when the frequency
passes through the Doppler line centre. When G I the depth of the
8/3/2019 SAS Chapter4
http://slidepdf.com/reader/full/sas-chapter4 13/39
118 V.S.LETOKHOV
n a r r ~ " Y dip is proportional to G2, and when Gp 1. the rise is proportional
to VG. The relative depth of the dip (dip contrast) approaches the
constant value H (1 1/V2) 0.29 for Gp 1. The optimum value of the
saturation parameter is at G l. In this case the dip contrast is H = 0.16,
that is, about one half the maximum value. and the factor of resonance
broadening by the strong wave is 0.The resonant change in the number of atoms of the lower level is
(4.38)
The resonant change in density of excited molecules in a strong
standing wave, which acts on one rotational-vibrational absorption
line, was estimated by LETOKHOV and PAVLIK [4.45]. They calculated
that, owing to rotational relaxation, it is possible to attain a more
intense resonance by accumulating excited moleculesof many rotational
levels.
4.3 Methods of Laser Saturation Spectroscopy
The resonance effects of saturation of a Doppler-broadened absorption
line, described in Section 4.2, may be used as the basis for many methodsof saturation spectroscopy. Such methods and their realization of dif
ferent schemes of nonlinear spectrometers are considered in this section.
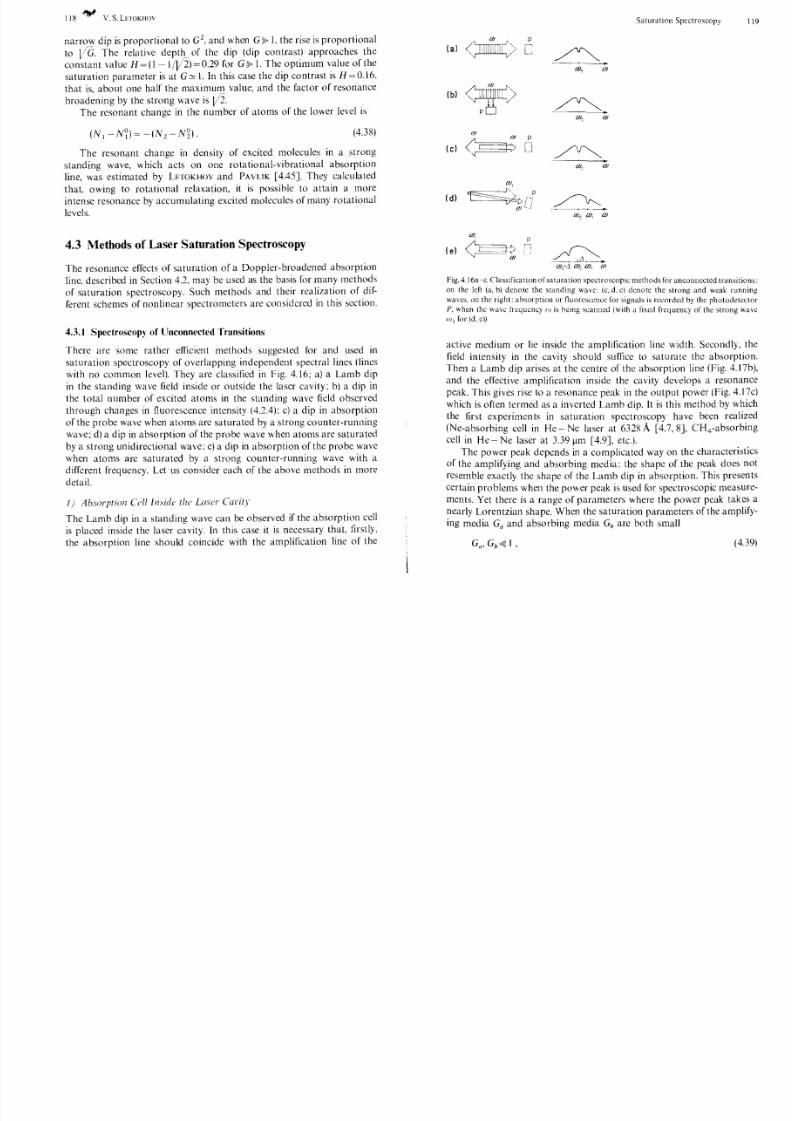
4.3.1 Spectroscopy of Unconnected Transitions
There are some rather efficient methods suggested for and used in
saturation spectroscopy of overlapping independent spectral lincs (lines
with no common level). They are classified in Fig. 4.16; a) a Lamb dip
in the standing wave field inside or outside the laser cavity; b) a dip in
the total number of excited atoms in the standing wave field observed
through changes in fluorescence intensity (4.2.4); c) a dip in absorption
of the probe wave when atoms are saturated by a strong counter-running
wave; d) a dip in absorption of the probe wave when atoms are satura ted
by a strong unidirectional wave:e) a dip in absorption of the probe wave
when atoms are saturated by a strong counter-running wave with a
different frequency. Let us consider each of the above m ~ t h o d s in more
detail.
I) Absorptioll eel/Inside the Laser Cal'itr
The Lamb dip in a standing wave can be observed if the absorption cell
is placed inside the laser cavity. In this case it is necessary that, firstly,
the absorption line should coincide with the amplification line of the
Saturation Spectroscopy 119
p
(a)
(I), (I)
Ib)
p
Ie) D
(d)
(J), (I), (I )
leI
00-.1 (I), aJ, (1)
Fig. 4.16a-c. Classification of saturation spectroscopIc methods for unconnected transitions:
on the lert (a. b) denote the standing wave: (c, d. el denote the strong and weak running
waves, on (he flghl: absorption or fluorescence for signals is recorded by the photodetector
P. when (he wave Ircqucncy OJ is being scanned (with a fixed frequency of the strong wave
w, for (d. ell
active medium or lie inside the amplification line width. Secondly, the
field intensity in the cavity should suffice to saturate the absorption.
Then a Lamb dip arises at the centre of the absorption line (Fig. 4.17b),
and the effective amplification inside the cavity develops a resonance
peak. This gives rise to a resonance peak in the output power (Fig. 4.17c)
which is often termed as a inverted Lamb dip. It is this method by which
the first experiments in saturation spectroscopy have been realized(Ne-absorbing cell in He- Ne laser at 6328 A [4.7,8], CH 4 -absorbing
cell in He-Ne laser at 3.39 11m [4.9J, etc.).
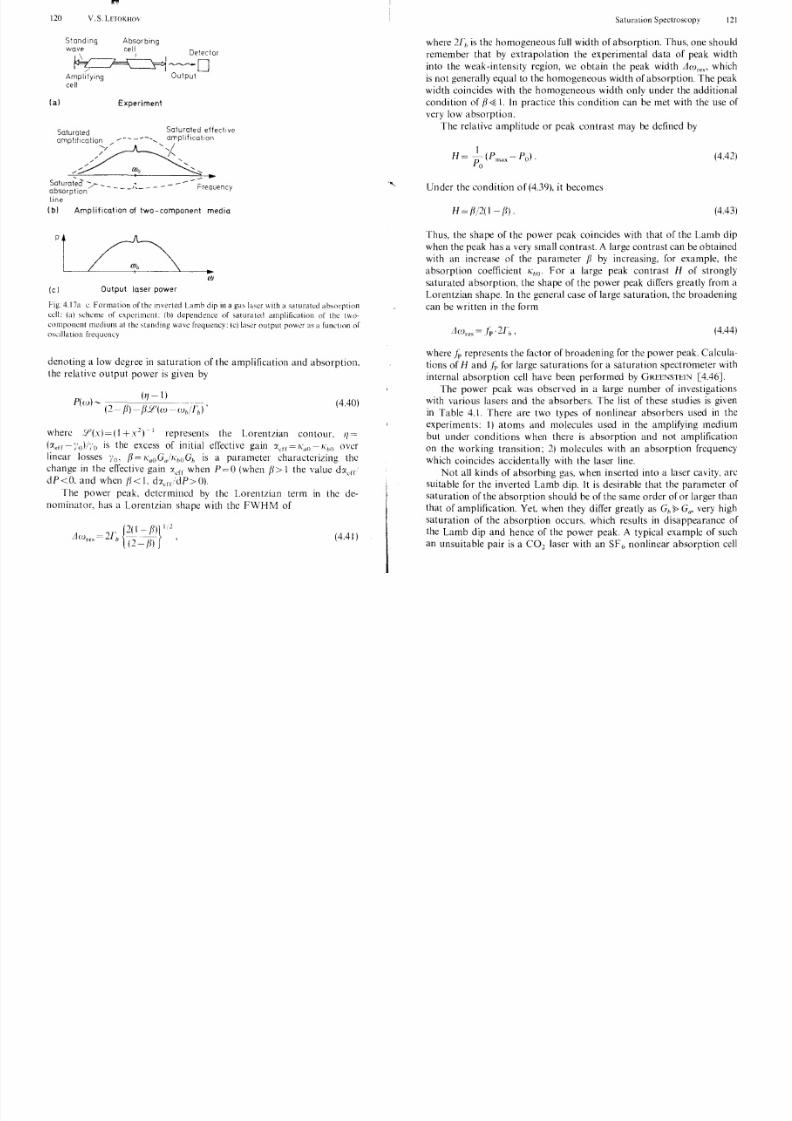
The power peak depends in a complicated way on the characteristics
of the amplifying and absorbing media; the shape of the peak does not
resemble exactly the shape of the Lamb dip in absorption. This presents
certain problems when the power peak is used for spectroscopic measure
ments. Yet there is a range of parameters where the power peak takes a
~ e a r l y Lorentzian shape. When the saturation parametersof the amplify
mg media Ga and absorbing media Gb are both small
(4.39)
8/3/2019 SAS Chapter4
http://slidepdf.com/reader/full/sas-chapter4 14/39
120 V. S. LETOKHOV
(a )
S'andingwave
Saturated
line
Absorbingcell
Experiment
/-
---.
,
Saturated effectiveamplification
Frequency
(b) Amplification of two-component media
(e) Output laser power
Fig.4.17a c. Formation or the inverted Lamb dip in a ga , laser with a s aturated ab,orption
cell: (a) sL'hcmc of experiment: (b) dependence or saturated amplilkation of the two
component medium at the standing wave frequency: (e) laser output power as a function of
oscillation fn:qucncy
denoting a low degree in saturation of the amplification and absorption,
the relative output power is given by
(11- 1)P(w).... .................
(2 - (J) - {JSf(w - ( l )h /Tn) ,(4.40)
where .::P(x)=(1 +,,1)-1 represents the Lorentzian contour. '/
(:Xeff-;'o)/:'o is the excess of initial effective gain :Xd r
"(10 "h O over
linear losses }'o, {J = KaOG'/'(hOGh is a parameter characterizing the
change in the effective gain :Xcii when P=O (when 1 the value d:Xcff
dP <0 , and when (J < 1, d:XcfridP> 0),
The power peak, determined by the Lorentzian term in the de
nominator, has a Lorentzian shape with the FWHM of
Llw =JT { ~ ( I - 1fe, - n (2 - fJ) , (4.41)
Saturation Spectroscopy 121
where 2Th is the homogeneous full width of absorption. Thus, one should
remember that by extrapolation the experimental data of peak width
into the weak-intensity region, we obtain the peak width Aw res , which
is not generally equal to the homogeneous width of absorption. The peak
width coincides with the homogeneous width only under the additional
condition of {J I. In practice this condition can be met with the use of
very low absorption,
The relative amplitude or peak contrast may be defined by
H (4.42)
Under the condition of (4,39), it becomes
H {J12(l in, (4.43)
Thus, the shape of the power peak coincides with that of the Lamb dip
when the peak has a very small contrast. A large contrast can be obtained
with an increase of the parameter (J by increasing, for example, the
absorption coefficient KhO ' For a large peak contrast H of strongly
saturated absorption, the shape of the power peak differs greatly from aLorentzian shape. In the general case of large saturation, the broadening
can be written in the form
(4.44)
where represents the factor of broadening for the power peak. Calcula
tions of H and . f ~ for large saturations for a saturation spectrometer with
internal absorption cell have been performed by GREENSTEIN
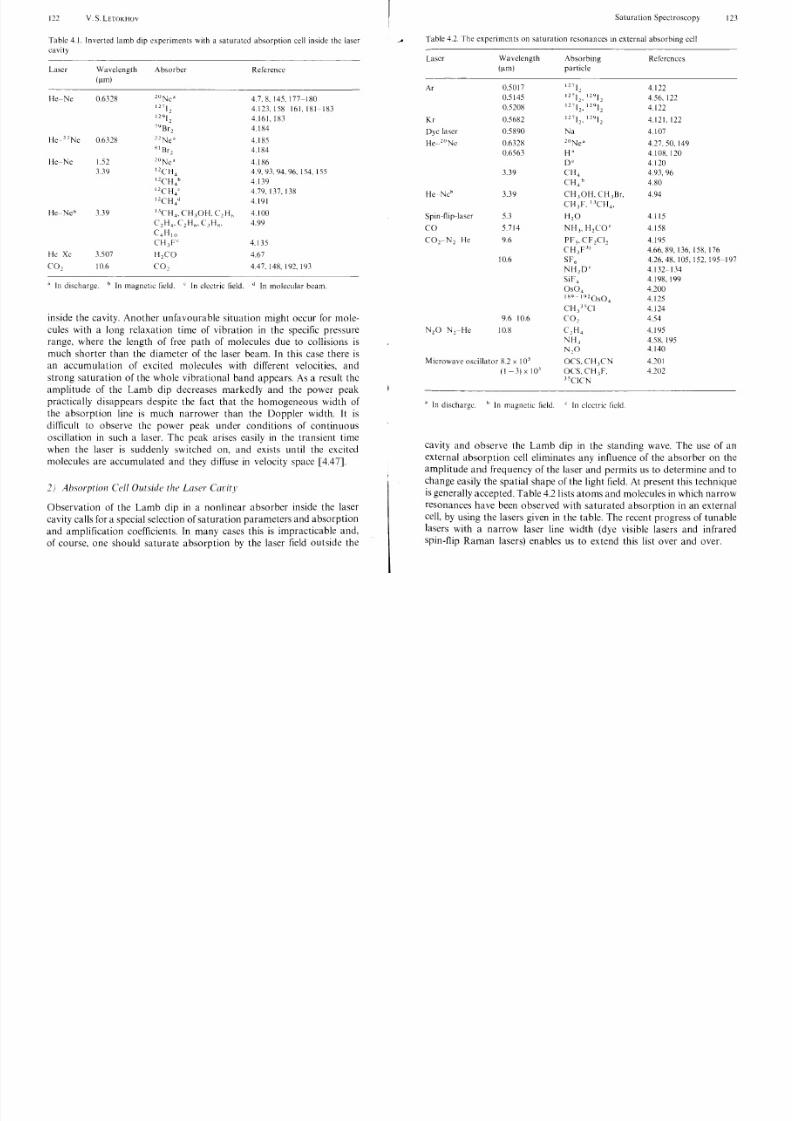
The power peak was observed in a large number of investigations
with various lasers and the absorbers. The list of these studies is given
in Table 4, I. There are two types of nonlinear absorbers used in the
experiments: 1) atoms and molecules used in the amplifying medium
but under conditions when there is absorption and not amplification
on the working transition; 2) molecules with an absorption frequency
which coincides accidentally with the laser line.
Not all kinds of absorbing gas, when inserted into a laser cavity, an:
suitable for the inverted Lamb dip. It is desirable that the parameter of
saturation of the absorption should be of the same order of or larger than
that of amplification. Yet, when they differ greatly as GnP Gu
, very high
saturation of the absorption occurs, which results in disappearance of
the Lamb dip and hence of the power peak. A typical example of such
an unsuitable pair is a CO 2 laser with an SF 6 nonlinear absorption cell
8/3/2019 SAS Chapter4
http://slidepdf.com/reader/full/sas-chapter4 15/39
122 V. S. LETOKHOV
Table 4.1. Inverted lamb dip experiments with a saturatcd absorption cell insidc thc laser
cavity
Laser
He-Ne
lie "N e
lIe- Ne
He-Neb
He Xc
CO ,
Wavelength
( ~ m )
0.6328
0.6328
1.52
3.39
3.39
3.507
10.6
Absorber
2°Nca
12712
129 1279Br2
22Ne<lHI Brl2°Nca
12CH4
12CH4"
12CH4'
12CH4"
I.'CH 4 , CH,OH, C,H"
C 2H4 • C 2Ho' C.,H K•C4 H10
CH,F'
H 2 CO
CO ,
Reference
4.7,8,145.177-180
4.123.158 161,181-183
4.161,IX3
4.IX4
4.1854.184
4.IX6
4.9,93.94.96, 154, 155
4.139
4.79,1J7,138
4.191
4.100
4.99
4.135
4.67
4.47,148,192,193
a In discharge. b In magnetic field. 'I n electric field. " In molecular beam.
inside the cavity. Another unfavourable situation might occur for mole
cules with a long relaxation time of vibration in the specific pressure
range, where the length of free path of molecules due to collisions is
much shorter than the diameter of the laser beam. In this case there is
an accumulation of excited molecules with different velocities, and
strong saturation of the whole vibrational band appears. As a result the
amplitude of the Lamb dip decreases markedly and the power peak
practically disappears despite the fact that the homogeneous width of
the absorption line is much narrower than the Doppler width. It is
difficult to observe the power peak under conditions of continuous
oscillation in such a laser. The peak arises easily in the transient time
when the laser is suddenly switched on, and exists until the excited
molecules are accumulated and they diffuse in velocity space [4.47].
2) Absorption Cell Outside the Laser C(/rity
Observation of the Lamb dip in a nonlinear absorber inside the laser
cavity calls for a special selection of saturation parameters and absorption
and amplification coefficients. In many cases this is impracticable and,
of course, one should saturate absorption by the laser field outside the
Saturation Spectroscopy 123
Table 4.2. The experimcnts on saturation resonances in external absorbing cell
Laser
Ar
Kr
Dyc laser
He-2 0Nc
HeNc"
Spin-flip-Iaser
CO
CO r N 2 He
Wavelength
( ~ m )
0.5017
0.5145
0.5208
0.5682
0.5890
O.632X0.6563
3.39
3.39
5.3
5.714
9.6
10.6
9.6 10.6
10.8
M icrowa vc oscilla or 8.2 x 10'
(1-3) X 10.1
Absorbing
particle
1171212712,12912
12"1 2, 129 12
12712 ,12912
Na
2°NeaH'
D'
CII 4
CH 4 h
CH,OH, CH.1Br,
CH,F,I.'CH4
,
H20
NH" H2CO '
PF " CF 2CI2CH,F.1)
SF"
N H ,D '
SiF 4OS04"9 - 19 2 0S 0
4
CH/ 'CI
CO ,
C, H 4
NH ,
N,O
OCS,CH,CN
OCS,CH,F,
"CICN
a In discharge. "In magnetic field. ' I n elcctric ficld.
Refercnccs
4.122
4.56, 122
4.122
4.121,122
4.107
4.27.50, 1494.108,120
4.120
4.93,96
4.80
4.94
4.115
4.158
4.195
4.66.89, 136, 158, 176
4.26. 48. 105, 152. 195-197
4.132-134
4.198, 1994.200
4.125
4.124
4.54
4.195
4.5X, 195
4.140
4.201
4.202
cavity and observe the Lamb dip in the standing wave. The use of an
external absorption cell eliminates any influence of the absorber on the
amplitude and frequency of the laser and permits us to determine and to
change easily the spatial shape of the light field. At present this technique
is generally accepted. Table 4.2 lists atoms and molecules in which narrow
resonances have been observed with saturated absorption in an external
cell, by using the lasers given in the table. The recent progress of tunable
lasers with a narrow laser line width (dye visible lasers and infrared
spin-flip Raman lasers) enables us to extend this list over and over.
8/3/2019 SAS Chapter4
http://slidepdf.com/reader/full/sas-chapter4 16/39
124 V. S. LETOKHOV
Photo
element
Scanning
Interferometer
/ '
1.2 M confocal Interferometer
/
/S/
B /~ - - - -Photo
element
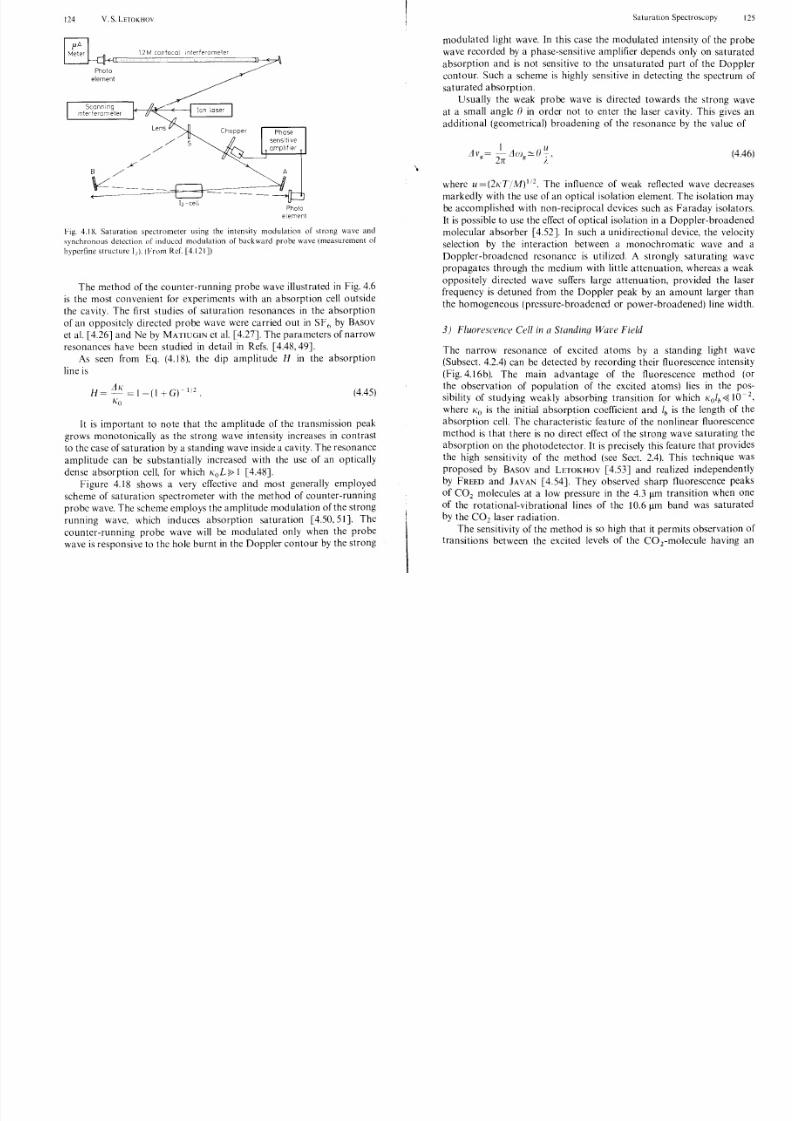
Fig. 4.18. Saturation spectrometer using the intensity modulation of strong wave and
synchronous detection of induced modulation of backward probe wave (measurement of
hyperfine structure I,). (From Ref. [4.121J)
The method of the counter-running probe wave illustrated in Fig. 4.6
is the most convenient for experiments with an absorption cell outside
the cavity. The first studies of saturation resonances in the absorption
of an oppositely directed probe wave were carried out in SF6
by BASOV
et al. [4.26J and Ne by MA TIUGIN et al. [4.27]. The parameters of narrow
resonances have been studied in detail in Refs. [4.48,49].
As seen from Eq. (4.18), the dip amplitude H in the absorption
line is
H= LlK = 1-(1 +G)-1!2.Ko
(4.45)
It is important to note that the amplitude of the transmission peak
grows monotonically as the strong wave intensity increases in contrast
to the case of saturation by a standing wave inside a cavity. The resonance
amplitude can be substantially increased with the use of an optically
dense absorption cell. for which K o L ~ 1 [4.48].
Figure 4.18 shows a very effective and most generally employed
scheme of saturation spectrometer with the method of counter-running
probe wave. The scheme employs the amplitude modulation of the strong
running wave, which induces absorption saturation [4.50,51]. The
counter-running probe wave will be modulated only when the probe
wave is responsive to the hole burnt in the Doppler contour by the strong
\
Saturation Spectroscopy 125
modulated light wave. In this case the modulated intensity of the probe
wave record ed by a phase-sensitive amplifier depends only on saturated
absorption and is not sensitive to the unsaturated part of the Doppler
contour. Such a scheme is highly sensitive in detecting the spectrum of
saturated absorption.
Usually the weak pro be wave is directed towards the strong wave
at a small angle 0 in order not to enter the laser cavity. This gives an
additional (geometrical) broadening of the resonance by the value of
1 uLlvg= - - ; 1 ( 1 ) , , ~ ( ) : ; - ,
. 2n " I.(4.46)
where U=(2KT/M)1/2. The influence of weak reflected wave decreases
markedly with the use of an optical isolation element. The isolation may
be accomplished with non-reciprocal devices such as Faraday isolators.
It is possible to use the effect of optical isolation in a Doppler-broadened
molecular absorber [4.52]. In such a unidirectional device, the velocity
selection by the interaction between a monochromatic wave and a
Doppler-broadened resonance is utilized. A strongly saturating wave
propagates through the medium with little attenuation, whereas a weak
oppositely directed wave suffers large attenuation, provided the laserfrequency is detuned from the Doppler peak by an amount larger than
the homogeneous (pressure-broadened or power-broadened) line width.
3) Fluorescence Cell in a Stand na Ware Field
The narrow resonance of excited atoms by a standing light wave
(Subsect. 4.2.4) can be detected by recording their fluorescence intensity
(Fig. 4.16b). The main ad vantage of the fl uorescence method (or
the observation of population of the excited atoms) lies in the pos
sibility of studying weakly absorbing transition for which Kolb 10 - 2,
where Ko is the initial absorption coefficient and lb is the length of the
absorption cell. The characteristic feature of the n onlinear fluorescencemethod is that there is no direct effect of the strong wave saturating the
absorption on the photodetector. It is precisely this feature that provides
the high sensitivity of the method (see Sect. 2.4). This technique was
proposed by BASOV and LETOKHOV [4.53J and realized independently
by FREED and JAVAN [4.54]. They observed sharp fluorescence peaks
of CO 2 molecules at a low pressure in the 4.3 11m transition when one
of the rotational-vibrational lines of the 10.6 11m band was saturated
by the CO 2 laser radiation.
The sensitivity of the method is so high that it permits observation of
transitions between the excited levels of the COrmolecule having an
126 V. S. LETOKHOV Saturation Spectroscopy 127
8/3/2019 SAS Chapter4
http://slidepdf.com/reader/full/sas-chapter4 17/39
'-'lode Qcclyser
Plezoelelectricm!rror drive
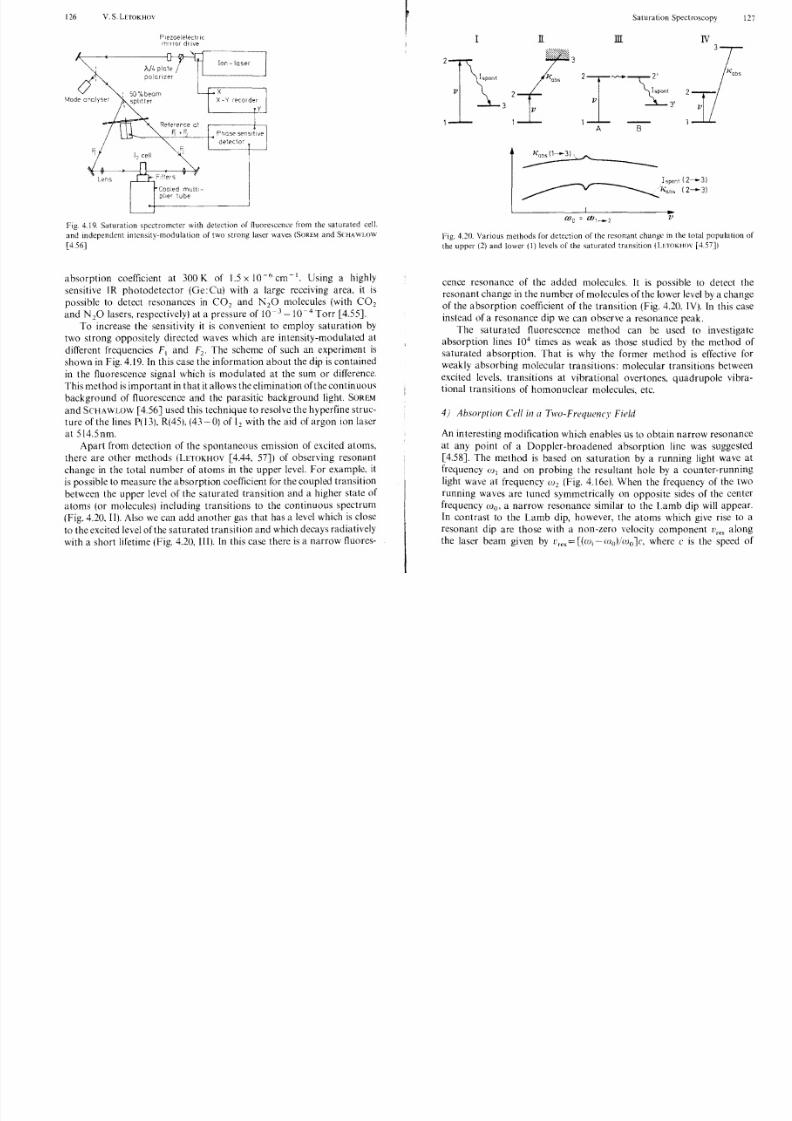
Fig. 4. J9. Saturation spectrometer with detection of fluorescence from the saturated cell.
an d independent intensi ty-modulation of two strong laser waves (SOREM and SCHAWLOW
[4.56]
absorption coefficient at 300K of 1.5 x lO-ocm-
1
• Using a highlysensitive I R photodete ctor (Ge:Cu) with a large receiving area, it is
possible to detect resonances in CO 2 and K2 0 molecules (with CO 2
and N 20 lasers, respectively) at a pressure of10 - 3 - 10 - 4 Torr [4.55].
'ro increase the sensitivity it is convenient to employ saturation by
two strong oppositely directed waves which are intensity-modulated at
different frequencies Fl and F2 • The scheme of such an experiment is
shown in Fig. 4.19. In this case the i nformat ion about the dip is contained
in the fluorescence signal w'hich is modulated at the sum or difference.
This method is important in that it allows the elimination of the continuous
background of fluorescence and the parasitic background light. SOREM
and SCHA WLOW [4.56] used this technique to resolve the hyperfine struc
ture of the lines PO 3), R(45), (43 -0) of 12 with the aid of argon ion laserat 5l4.5nm.
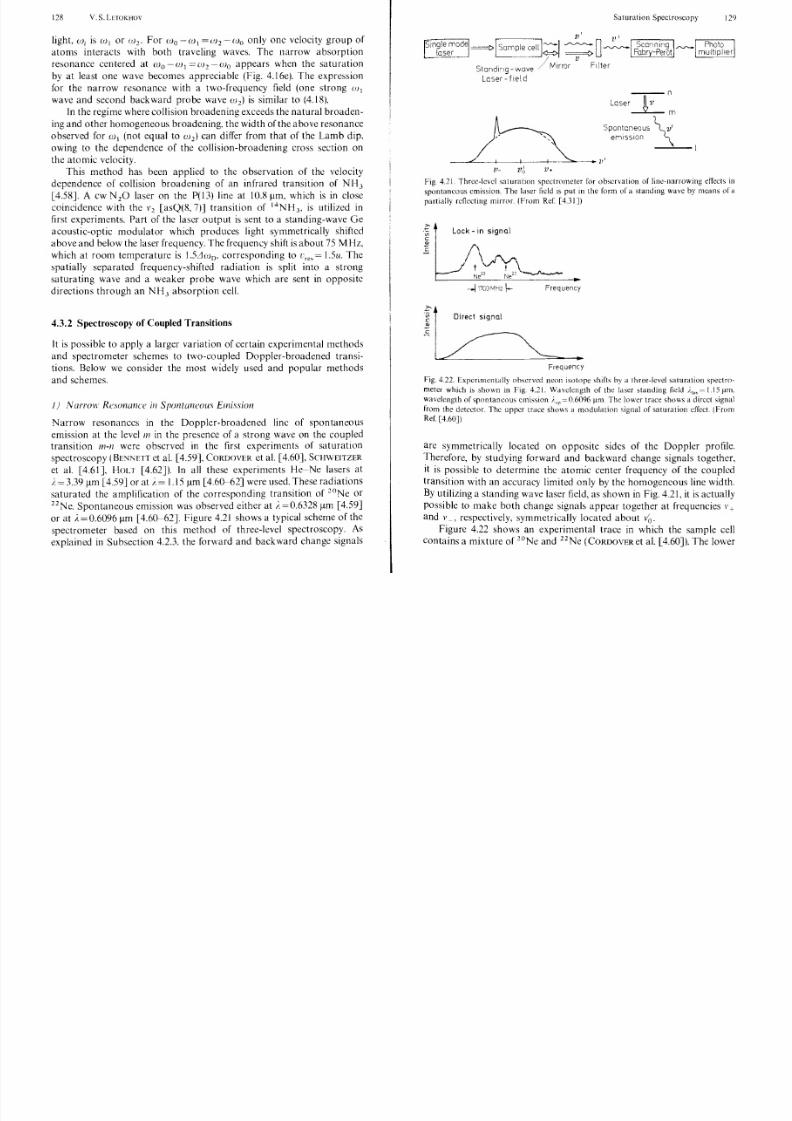
Apart from detection of the spon taneous emission of excited atoms,
there are other methods (LETOKHOV [4.44. 57]) of observing resonant
change in the total number of atoms in the upper level. For example. it
is possible to measure the absorption coefficient for the coupled transition
between the upper level of the saturated transitic)l1 and a higher state of
atoms (or molecules) including transitions to the continuous spectrum
(Fig. 4.20. II). Also we can add another gas that has a level which is close
to the excited level of the saturated transi tion an d which decays radiatively
with a short lifetime (Fig. 4.20, III). In this case there is a narrow fluores-
I n.
2 3
Ispont
v 2
3 v
II I IV
2 I - - - - ~ ~ s ~ o n t V .s:3'
1 --2
A B
Ispont (2-3)
/ " 0 ' 5 (2 -3 )
v
3
Fig. 4.20. Various methods for detection of the resonant change in the total population of
the upper (2) an d lower (1) levels of the saturated transition (LnoKHov [4.57])
cence resonance of the added molecules. It is possible to detect theresonant change in the number of molecules of the lower level by a change
of the absorption coefficient of the transition (Fig. 4.20, IV). In this case
instead of a resonance dip we can observe a resonance peak.
The saturated fluorescence method can be used to investigate
absorption lines 104 times as weak as those studied by the method of
saturated absorption. That is why the former method is effective for
weakly absorbing molecular transitions: molecular transitions between
excited levels, transitions at vibrational overtones, quadrupole vibra
tional transitions of homonuclear molecules, etc.
4) Absorption Cell ill a Two-Frequency Field
An interesting modification which enables us to obtain narrow resonance
at any point of a Doppler-broadened absorption line was suggested
[4.58]. The method is based on saturation by a running light wave at
frequency WI and on probing the resultant hole by a counter-running
light wave at frequency W2 (Fig. 4.16e). When the frequency of the two
running waves are tuned symmetrically on opposite sides of the center
frequency Wo, a narrow resonance similar to the Lamb dip will appear.
In contrast to the Lamb dip, however, the atoms which give rise to a
resonant dip are those with a non-zero velocity component lI,e, along
the laser beam given by v,es=[(Wi wo)/w01c, where c is the speed of
128 V. S. LETOKHOV Saturation Spectroscopy 129
8/3/2019 SAS Chapter4
http://slidepdf.com/reader/full/sas-chapter4 18/39
light, Wi is WI or W2 ' For Wo -WI (J)2 (1)0 only one velocity group of
atoms interacts with both traveling waves. The narrow absorption
resonance centered at Wo 0) 1 (1)2 W o appears when the saturation
by at least one wave becomes appreciable (Fig. 4.16e). The expression
for the narrow resonance with a two-frequency field (one strong WI
wave and second backward probe wave (1 2 ) is similar to (4.18).
In the regime where collision broadening exceeds the natural broaden
and other homogeneous broadening. the width of the above resonance
observed for WI (not equal to (12) can differ from that of the Lamb dip.
owing to the dependence of the collision-broadening cross section on
the atomic vclocity.
This method has been applied to the observation of the velocity
dependence of collision broadening of an infrared transition of NH J
[4.58]. A cw N 20 laser on the P(13) line at lO.8Ilm. which is in elose
coincidence with the \'2 [asQ(8,7)] transition of 14NHJ, is utilized in
first experiments. Part of the laser output is sent to a standing-wave Ge
acoustic-optic modulator which produces light symmetrically shifted
above and below the laser frequency. The frequency shiftis about 75 MHz,
which at room temperature is 1.5Jwo. corresponding to lOres = 1.5u. The
spatially separated frequency-shifted radiation is split into a strong
saturating wave and a weaker probe wave which are sent in oppositcdirections through an NH J absorption cell.
4.3.2 Spectroscopy of Coupled Transitions
It is possible to apply a larger variation of certain experimental methods
and spectrometer schemes to two-coupled Doppler-broadened transi
tions. Below we consider the most widely used and popular methods
and schemes.
1) IVarrow Resonance in Spontaneolls Emission
Narrow resonances in the Doppler-broadened line of spontaneousemission at the level II I in the presence of a strong wave on the coupledtransition /n-n were obscrved in the first experiments of saturation
spectroscopy (BENNETT et al. [4.59]. CORDOVER et al. [4.60], SCHWEITZER
et al. [4.61 J. HOLI [4.62J). In all these experiments He-Ne lasers at
;.= 3.39 11m [4.59J or at A 1.15 11m [ 4 . 6 ~ 6 2 ] were used. These radiations
saturated the amplification of the corresponding transition of 2°Ne or
22Ne. Spontaneous emission was observed either at i. 0.63281lfl1 [4.59J
or at A=0.6096 Jlm [ 4 . 6 0 ~ 6 2 ] . Figure 4.21 shows a typical scheme of the
spectrometer based on this method of three-level spectroscopy. As
explained in Subsection 4.2.3. the forward and backward change signals
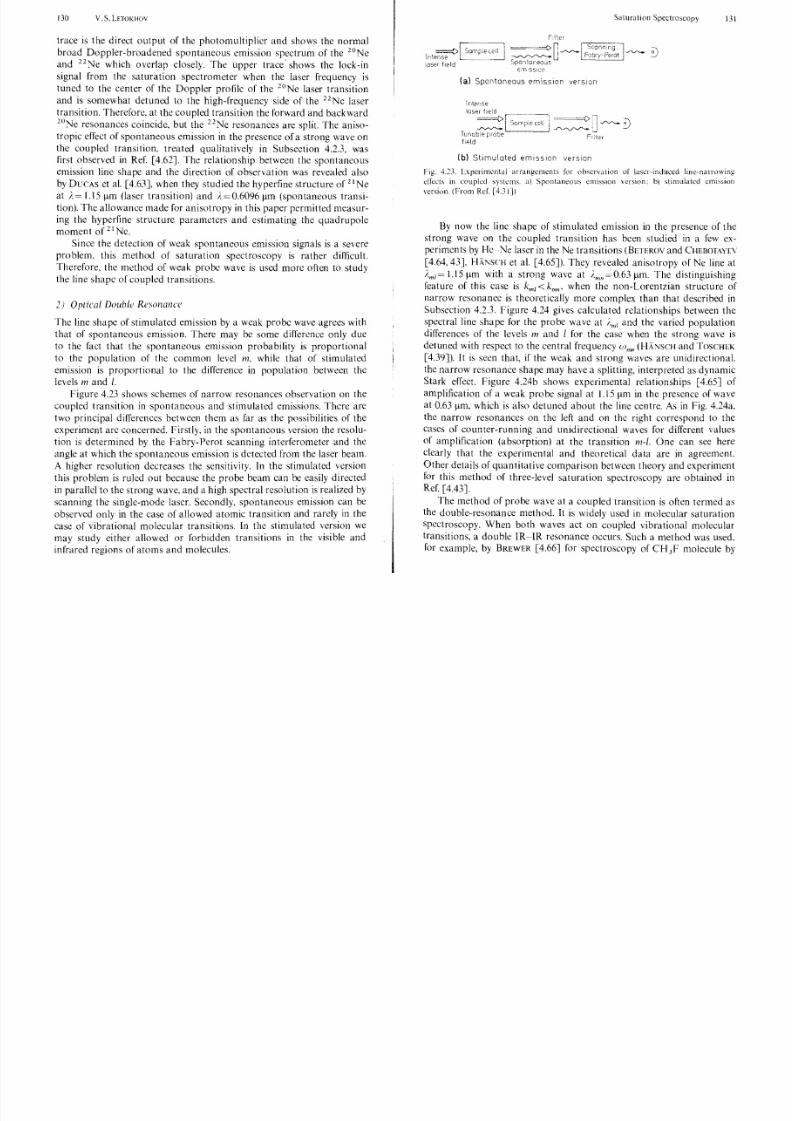
S t Q n d l ~ , g - w Q v e Laser field
Fig. 4.21. Three-level saturatIon spectrometer for observation of line-narrowing elTeet, in
spontaneous emission. The laser field IS put in the form of a standing wave by means of a
partially reflecting mirror. (From Ref. [4.31J)
Lock in signal
-..j 17:)0MHz !- F req uency
Direct signal
Frequency
Fig. 4.22. Experimentally observed neon isotope shifts by a three-level satul"dtion spectro
meter which is shown in Fig. 4.21. Wavelength of the laser standing field 1.15 )lm.
wavelength of spontaneous emission = 0.6096 )lm. The lower trace shows a direct signal
from the detector. The upper trace shows a modulation signal of saturation effect. (From
Ref. [4.60J)
are symmetrically located on opposite sides of the Doppler profile.
Therefore, by studying forward and backward ehange signals together,
it is possible to determine the atomic center frequency of the coupled
transition with an accuracy limited only by the homogeneous line width.
By utilizing a standing wave laser field, as shown in it is actually
possible to make both change signals appear together at frequencies \' +
and v ,respectively, symmetrically located about v ~ . Figure 4.22 shows an experimental trace in which the sample cell
contains a mixture of 2°Ne and 22 Ne (CORDOVER et aL [4.60]). The lower
130 v, S, LETOKHOV Saturation Spectroscopy 131
8/3/2019 SAS Chapter4
http://slidepdf.com/reader/full/sas-chapter4 19/39
trace is the direct output of the photomultiplier and shows the normal
broad Doppler-broadened spontaneous emission spectrum of the 20Ne
and which overlap closely. The upper trace' shows the lock-in
signal from the saturation spectrometer when the laser frequency is
tuned to the center of the Doppler profile of the 2°Ne laser transition
and is somewhat detuned to the high-frequency side of the 22Ne laser
transition. Therefore, at the coupled transition the forward and backward
2°Ne resonances coincide, but the 22Ne resonances are split. The aniso
tropic effect of spontaneous emission in the presence of a strong wave on
the coupled transition, treated qualitatively in Subseetion 4,2.3, was
first observed in Ref. [4,62]. The relationship between the spontaneous
emission line shape and the direction of observation was revealed also
by DucAs et aL [4.63J, when they studied the hyperfine structure of 21 Ne
at ;. = 1.15 I-lm (laser transition) and },=0.6096 J1ill (spontaneous transi
tion). The allowance made for anisotropy in this paper permitted measur
ing the hyperfine structure parameters and estimating the quadrupole
moment of 21 Nc.
Since the detection of weak spontaneous emission signals is a severe
problem. this method of saturation spectroscopy is rather diFficult.
Therefore, the method of weak probe wave is used more often to study
the line shapc of coupled transitions.
2) Optical Doublt' Resonance
The line shap e of stimulated emission by a weak probe wave agrees with
that of spontaneous emission. There may be some difference only due
to the fact that the spontaneous emission probability is proportional
to the popUlation of the common level m, while that of stimulated
emission is proportional to the difference in popUlation between the
levels m and l.
Figure 4.23 shows schemes of narrow resonances observation on the
coupled transition in spontaneous and stimulated emissions. Thcre are
two principal differences between them as far as the possibilities of theexperiment arc concerned. Firstly. in the spontaneous version the resolu
tion is determined by the Fabry-Perot scanning interferometer and the
angle at which the spontaneous emission is detected from the laser beam.
A higher resolution decreases the sensitivity. In the stimulated version
this problem is ruled out because the probe beam can be easily directed
in parallel to the strong wave, and a high spectral resolution is realized by
scanning the single-mode laser. Secondly, spontaneous emission can be
observed only in the case of allowed atomic transition and rarely in the
case of vibrational molecular transitions. In the stimulated version we
may study either allowed or forbidden transitions in the visible and
infrared regions of atoms and molecules.
ta) Spontaneous emission version
tb) Stimulated emiSSion version
Fig. 4.21 Lxperimclltal arrangements for observation of laser-induced line·narrowing
effecls in coupled systems, a) Spontaneous emission version: bl stimulated emission
version. (From Rcf. [4.31])
By now the line shape of stimulated emission in the presence of the
strong wave on the coupled transition has been studied in a few ex
periments by Hc.'J'e laser in the Ne transitions (BETEROV and CHEBOTAYE\
[4.64,43J, HX\;SCH et al. [4.65J). They revealed anisotropy of Ne line at
;'ml US I-lm with a strong wave at ;'",n=0.63 1-lID. The distinguishing
feature of this case is klnl < knm • when the non-Lorentzian structure of
narrow resonance is theoretically more complex than that described in
Subsection 4.2.3. Figure 4.24 gives calculated relationships between the
spectral line shape for the probe wave at ; 'nl i and the varied population
differences of the levels m and I for the case when the strong wave is
detuned with respect to the central frequency W m" (H.:(;';SCH and TOSCHEK
[4.39J). It is seen that, if the weak and strong waves a re unidirectional.
the narrow resonance shape may have a splitting, interpreted as dynamic
Stark effect. Figure 4.24b shows experimental relationships [4.65J of
amplification of a weak probe signal at 1.15 I-lm in the presence of wave
at 0.63 I-lm, which is also detuned about the line centre. As in Fig. 4.24a,
the narrow resonances on the left and on the right correspond to thecases of counter-running and unidirectional waves for different values
of amplification (absorption) at the transition m-I. One can see here
clearly that the experimental and theoretical data are in agreement.
Other details of quantitative comparison between theory and experiment
for this method of three-level saturation spectroscopy are obtained inRef. [4.43].
The method of probe wave at a coupled transition is often termed as
the double-resonance method. It is widely used in molecular saturation
spectroscopy. When both waves act on coupled vibrational molecular
transitions, a double I R ~ I R resonance occurs. Such a method was used,
for example, by BREWER [4.66J for spectroscopy of CH3F molecule by
132 V, S, LETOKHOV Saturation Spectroscopy 133
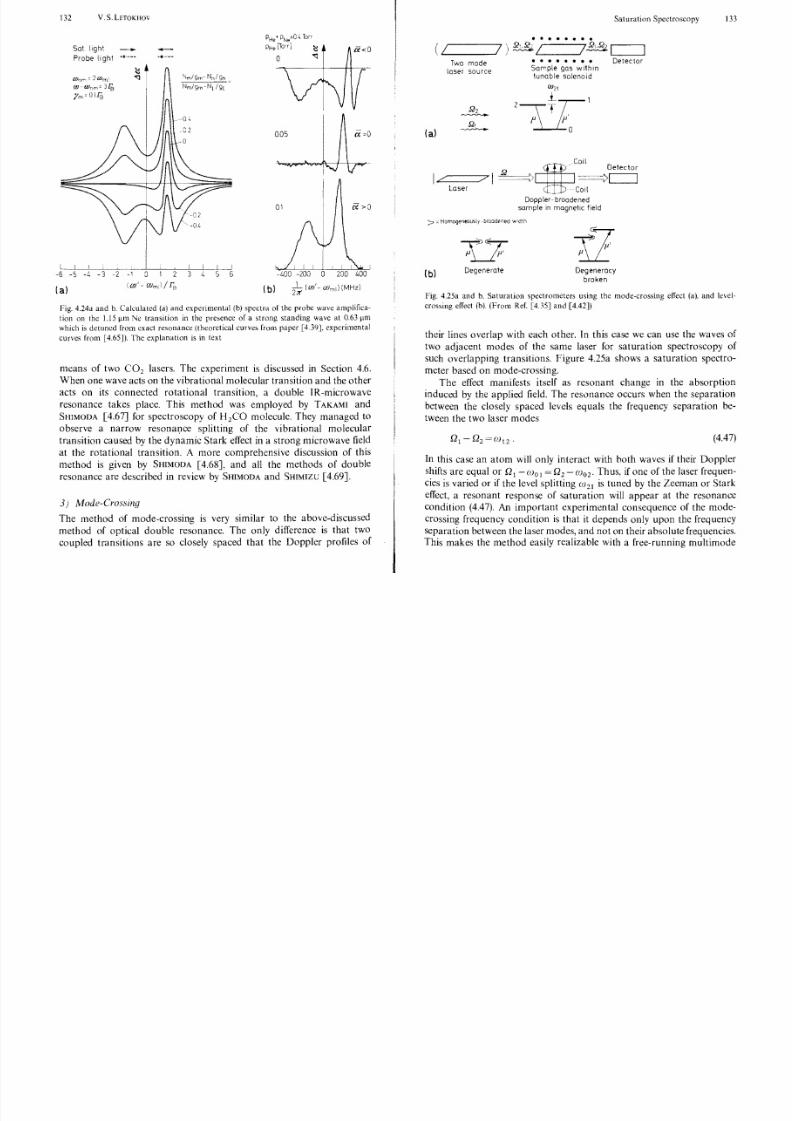
8/3/2019 SAS Chapter4
http://slidepdf.com/reader/full/sas-chapter4 20/39
I
Sat light
Probe l ight
Wf lm ')(i)m 1
(l)(l)n",,318
1m 01 18
I I-6 -5 -4 -3 -2 -1 CI 2
(a )lUi' - W mc i / r'l
4
I I I I3 f. 5 6
PH . PN.=O 4 Torr
PH. [Torr]
o
005
(b ) l(w'2)(
«<0
(l)",1i (MHz)
Fig, 4,24a and b, Calculated (a) and experimental (b) spectra of the probe wave amplifica
tion on the 1.15 11m Ne transition in the presence of a strong standing wave at 0,63 11m
which is detuncd from exact resonance (theoretical curves from paper [4,39]. experimental
curves from [4,65]), The explanation is in text
means of two CO 2 lasers, The experiment is discussed in Section 4.6.
When one wave acts on the vibrational molecular transition and the other
acts on its connected rotational transition, a double IR-microwave
resonance takes place. This method was employed by TAKAMI and
SHIMODA [4.67] for spectroscopy of H2CO molecule. They managed toobserve a narrow resonar:tce splitting of the vibrational molecular
transition caused by the dynamic Stark effect in a strong microwave field
at the rotational transition. A more comprehensive discussion of this
method is given by SHIMODA [4.68], and all the methods of double
resonance are described in review by SHIMODA and SHIMIZtJ [4.69].
3) Mode-Crossing
The method of mode-crossing is very similar to the above-discussed
method of optical double resonance. The only difference is that two
coupled transitions are so closely spaced that the Doppler profiles of
• • • • • •••
(I 1 ) ~ 1 1 ~ L - _ . . . . J
(a)
(b)
Two modelaser SOllrce
Laser
Degenerate
••••••••Sarr;ple gas within
lunable solenoid
W21
2 \+['' I'
o
Dopp er- broadenedsample in magnetic field
Detector
Degeneracy
broken
Fig, 4,25a and b. Saturation spectrometers using the mode-crossing effect (a). and 1evel
crossing effect (b), (From Ref. [4,35] and [4.42])
their lines overlap with each other. In this case we can use the waves of
two adjacent modes of the same laser for saturation spectroseopy of
such ovcrlapping transitions. Figure 4.2Sa shows a saturation speetro
meter based on mode-crossing.
The effect manifests itself as resonant change in the absorption
induced by the applied field. The resonance occurs when the separation
between the closely spaced levels equals the frequency separation be
tween the two laser modes
(4.47)
In this case an atom will only interact with both waves if their Doppler
shifts are equal or Q l -COOl Q2 -C002 ' Thus, if one of the laser frequen
cies is varied or if the level splitting C021 is tuned by thc Zeeman or Stark
effect, a resonant response of saturation will appear at the resonance
condition (4.47). An importan t experimental consequence of the mode
crossing frequency condition is that it depends only upon the frequency
separation between the laser modes, and not on their absolu te frequencies.This makes the method easily realizable with a free-running multimode
134 V. S. LETOKHOV Saturation Spectroscopy 135
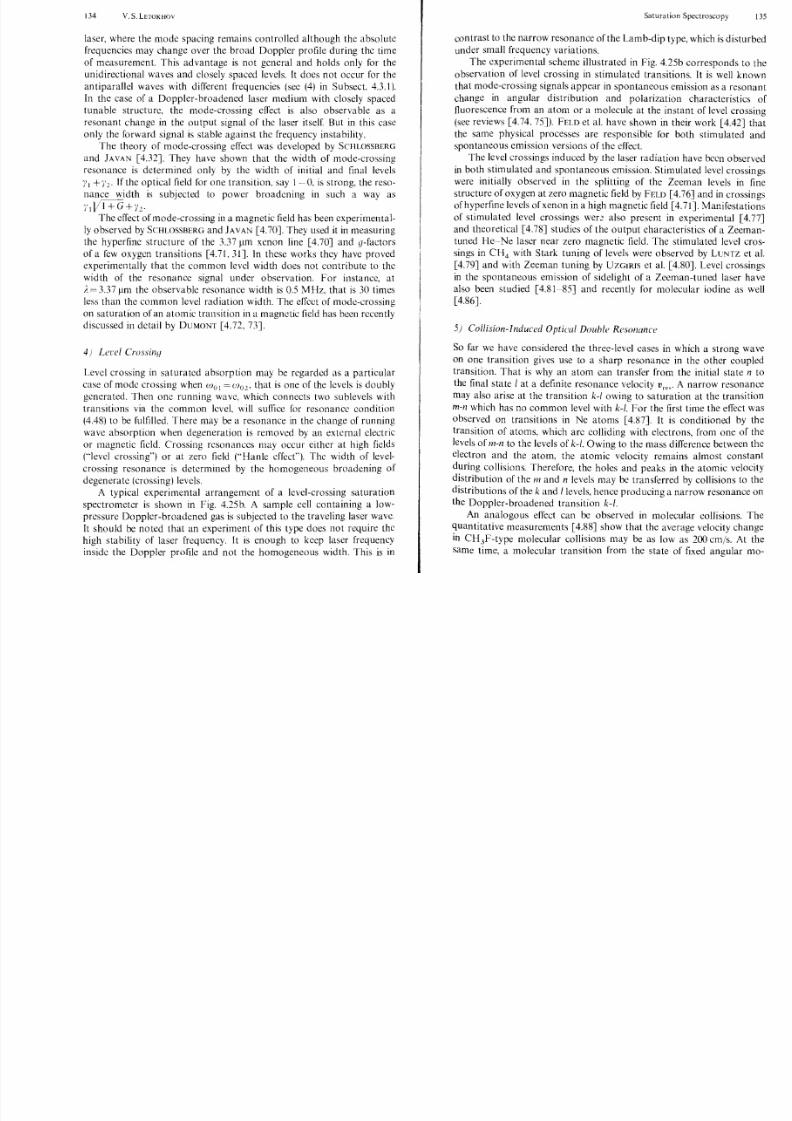
8/3/2019 SAS Chapter4
http://slidepdf.com/reader/full/sas-chapter4 21/39
laser, where the mode spacing remains controlled although the absolute
frequencies may change over the broad Doppler profile during the time
of measurement. This advantage is not general and holds only for the
unidirectional waves and closely spaced levels. It docs not occur for the
antiparallel waves with different frequencies (sec (4) in Su bsect. 4.3.1).
In the case of a Doppler-broadened laser medium with closely spaced
tunable structure, the mode-crossing effect is also observable as a
resonant in the output signal of the laser itself. But in this case
only the forward signal is stable against the frequency instability.
The theory of mode-crossing effect was developed by SCHLOSSBERG
and JAVAN [4.32]. They have shown that the width of mode-crossing
resonance is determined only by the width of initial and final levels
YI +1'2' If the optical field for one transition, say 1~ O , is strong, the reso
nance width is subjected to power broadening in such a way as
i 'IVI +G 2'
The effect of mode-crossing in a magnetic field has been experimental
ly 0 bserved by SCHLOSSBERG and J AVAN [4.70]. They used it in measuring
the hyperfine structure of the 3.37 Jlm xenon line [4.70J and g-factors
ofa few oxygen transitions [4.71.31]. In these works they have proved
experimentally that the common level width does not contribute to the
width of the resonance signal under observation. For instance. at;,= 3.37Jlm the observable resonance width is 0.5 MHz, that is 30 times
less than the common level radiation \vidth. The effect of mode-crossing
on saturation of an atomic transit ion in a magnetic field has been recently
discussed in detail by DUMONT [4.72, 73].
4) LeL'el CrussiIJfJ
Level crossing in saturated absorption may be regarded as a particular
case of mode crossing when Wo 1 = W02' that is one of the levels is doubly
generated. Then one running wave. which connects two sublevels with
transitions via the common level. will suffice for resonance condition
(4.48) to be fulfilled. There may be a resonance in the change of runningwave absorption when degeneration is removed by an external electric
or magnetic field. Crossing resonances may occur either at high fields
("level crossing") or at zero field ("Hank effect') The width of level
crossing resonance is determined by the homogeneous broadening of
degenerate (crossing I levels.
A typical experimental arrangement of a level-crossing saturation
spectrometer is shown in Fig. 4.25b. A sample cell containing a low
pressure Doppler-broadened gas is subjected to the traveling laser wave.
It should be noted that an experiment of this type does not require the
high stability of laser frequency. It is enough to keep laser frequency
inside the Doppler profile and not the homogeneous width. This is in
contrast to the narrow resonance of the Lamb-dip type, which is disturbed
under small frequency variations.
The experimental scheme illustrated in Fig. 4.25b corresponds to the
observation of level crossing in stimulated transitions. It is well known
that mode-crossing signals appear in spontaneous emission as a resonant
change in angular distribution and polarization characteristics of
fluorescence from an atom or a molecule at the instant of level crossing
(sec reviews [4.74, 75J). FELD et aL have shown in their work [4.42J that
the same physical processes are responsible for both stimulated and
spontaneous emission versions of the effect.The level crossings induced by the laser radiation have been observed
in both stimulated and spontaneous emission. Stimulated level crossings
were initially observed in the splitting of the Zeeman levels in fine
structure of oxygen at zero magne tic field by FEW [4.76J and in crossings
of hyperfine levels of xenon in a high magnetic field [4.71]. Mani festati ons
of stimulated level crossings wer.:: also present in experimental [4.77J
and theoretical [4.78J studies of the output characteristics of a Zeeman
tuned H e ~ N e laser near zero magnetic field. The stimulated level cros
sings in CH 4 with Stark tuning of levels were observed by LUNTZ et al.
[4.79J and with Zeeman tuning by UZGIRIS et al. [4.80]. Level crossings
inthe
spontaneousemission of sidelight
ofa Zeeman-tuned laser havealso been studied [4.8185J and recently for molecular iodine as well
[4.86J.
5J Collision-/ nduced Optical Double Resonance
So far we have considered the three-level cases in which a strong wave
on one transition gives use to a sharp resonance in the other coupled
transition. That is why an atom ean transfer from the initial state n to
the final state I at a definite resonance velocityVre
,. A narrow resonance
may also arise at the transition k-I owing to saturation at the transition
m-n which has no common level with k-I. For the first time the effect was
observed on transitions in Ne atoms [4.87]. It is conditioned by thetransition of atoms. which arc colliding with electrons, from one of the
levels of /n-n to the levels of k-I. Owing to the mass difference between the
electron and the atom, the atomic velocity remains almost constant
during collisions. Therefore, the holes and peaks in the atomic velocity
distribution of the m and n levels may be transferred by collisions to the
distributions of the k and I levels, hence producing a narrow resonance on
the Doppler-broadened transition k-I.
An analogous effect can be observed in molecular collisions. The
quantitative measurements [4.88J show that the average velOCity change
in CH)F-type molecular collisions may be as low as 200 cm/s. At the
same time, a molecular transition from the state of fixed angular mo-
136 V. S. LEToKHOv Saturation Spectroscopy 137
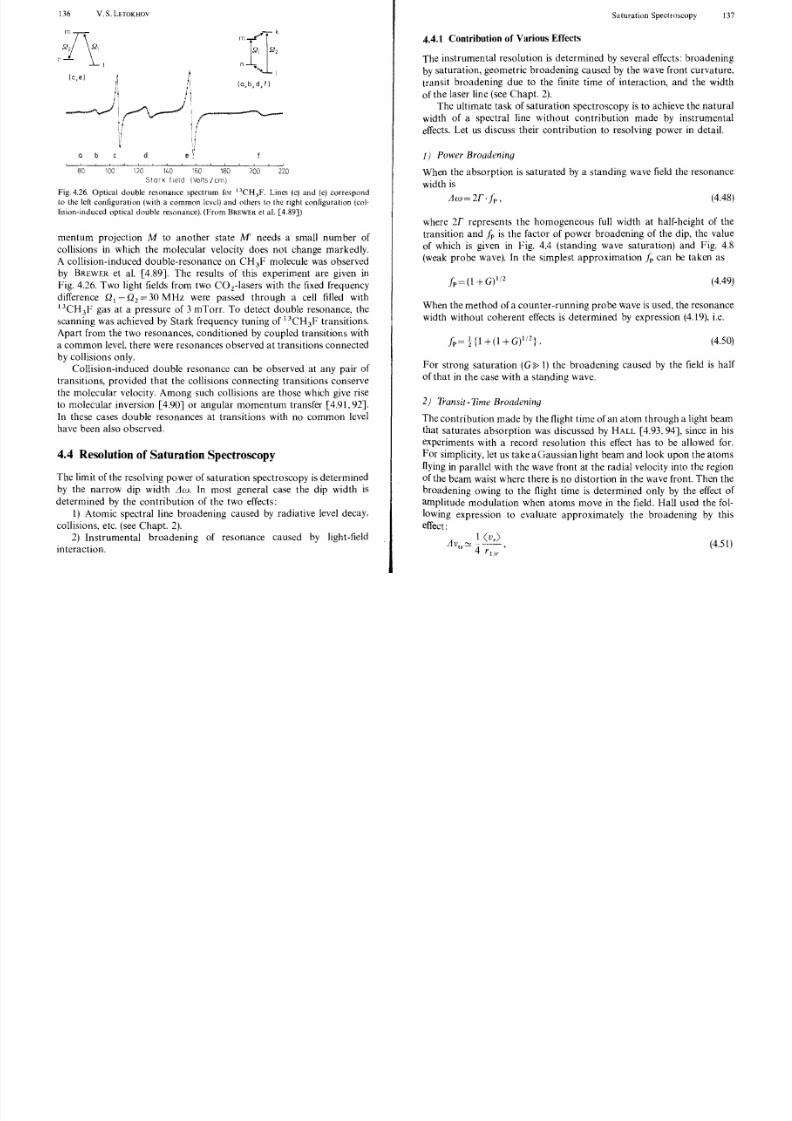
8/3/2019 SAS Chapter4
http://slidepdf.com/reader/full/sas-chapter4 22/39
Q b d
.;j'
e :
180
Stark field (Volts/em)
200 220
Fig. 4.26. Optical doub le resonan ce spectr um for 13CH, F. Lines (e) and (e) correspond
to the left configuration (with a common level) and others to the right configuration (col
lision-induced optical double resonance). (From BREWER et al. [4.89])
mentum projection M to another state M' needs a small number of
collisions in which the molecular velocity does not change markedly.
A collision-induced double-resonance on CH3F molecule was observed
by BREWER et al. [4.89J. The results of this experiment are given in
Fig. 4.26. Two light fields from two CO 2-lasers with the fixed frequency
difference Q 1 Q 2 = 30 MH z were passed through a cell filled with
13CH3F gas at a pressure of 3 mTorr. To detect double resonance, the
scanning was achieved by Stark frequency tuning of 13CH3F transitions.
Apart from the two resonances, conditioned by coupled transitions with
a common leveL there were resonances observed at transitions connected
by collisions only.
Collision-induced double resonance can be observed at any pair of
transitions, provided that the collisions connecting transitions conserve
the molecular velocity. Among such collisions are those which give rise
to molecular inversion [4.90J or angular momentum transfer [4.91,92].
In these cases double resonances at transitions with no common levelhave been also observed.
4.4 Resolution of Saturation Spectroscopy
The limit of the resolving power of saturation spectroscopy is determined
by the narrow dip width Aw. In most general case the dip width is
determined by the contribution of the two effects:
1) Atomic spectral line broadening caused by radiative level decay,
collisions, etc. (see Chapt. 2).
2) Instrumental broadening of resonance caused by light-field
interaction.
4.4.1 Contribution of Various Effects
The instrumental resolution is determined by several effects: broadening
by saturation, geometric broadening caused by the wave front curvature,
transit broadening due to the finite time of interaction, and the width
of the laser line (see Chapt. 2).
The ultimate task of saturation spectroscopy is to achieve the natural
width of a spectral line without contribution made by instrumental
effects. Let us discuss their contribution to resolving power in detail.
1) Power Broadening
When the absorption is saturated by a standing wave field the resonance
width is
Aw 2r'fp, (4.48)
where 2r represents the homogeneous full width at half-height of the
transition and fp is the factor of power broadening of the dip, the value
of which is given in Fig. 4.4 (standing wave saturation) and Fig. 4.8
(weak probe wave). In the simplest approximation fp can be taken as
(4.49)
When the method of a counter-running probe wave is used, the r esonance
width without coherent effects is determined by expression (4.19), i.e.
(4.50)
For strong saturation ( G ~ 1) the broadening caused by the field is half
of that in the case with a standing wave.
2) Transit -TIme Broadening
The contribution made by the flight time of an atom through a light beamthat saturates absorption was discussed by HALL [4.93, 94J, since in his
experiments with a record resolution this effect has to be allowed for.
For simplicity, let us take aGaussian light beam and look upon the atoms
flying in parallel with the wave front at the radial velocity into the region
of the beam waist where there is no distortion in the wave front. Then the
broadening owing to the flight time is determined only by the effect of
amplitude modulation when atoms move in the field. Hall used the fol
lowing expression to evaluate approximately the broadening by this
effect:
(4.51)
138 V. S. LETOKHOVSaturation Spectroscopy 139
8/3/2019 SAS Chapter4
http://slidepdf.com/reader/full/sas-chapter4 23/39
where c1v1r
is the FWHM, r i le is the Gaussian beam radius on the level
I!e of amplitude, <c r>s the average radial velocity which is given by the
expression
<V r>= (l,hr/2)u, u=(2kT/lvf)12. (4.52)
Recently BAKLANOV ct al. [4.95] havc carried out a rigorous estimation
for the narrow dip width in a low-pressure gas, with allowance made for
final cross section of a light beam with a Gaussian profile of intensity and
velocity distribution of atoms. Their exprcssion for the FWHM hasthe form
Ic1v = c1w
(f 2rr Ir
0.58 u(4.53)
rr 1'1
The value of (4.53) is just 16% less than the approximate value of (4.52).
The transit-time broadening is very small. For instance, it comes to
only 140 k Hz for 1'1 = 1 mm [4.94] for the 3.39 Iill1 transition of CH 4
at 300 K. In most experiments with I' li e of several mill imeters the contribu
tion by transit-time broadening may be neglected. To reach a high
possible resolution, however, as in the experiment by HALL and BORDE
[4.96J in measuring the magnetic hyperfine structure of CH 4 , the linewidth at 3.39 /lm must be less than 10 kHz, and the beam diameter has
to be increased up to 5 cm.
3; Geometrical Broudening
The directional alignment of two counter-running plane waves through
an angle () broadens the resonance by a value given by relation (4.46).
This relation can be written as
(4.54)
This broadening can be termed as thc residual Doppler effect caused by
light wave non-parallelism.
An analogous broadening due to a spherical wave front was estimated
by LETOKHOV [4.97J to be
(4.55)
where R denotes the radius of curvature. It should be noted that, even
though we have at first a plane light wave of diameter a, the wave front
becomes distorted owing to diffraction. The radius of curvature for a
Gaussian beam takes a minimum value of Rd i f at the distance of ka2
so that we may assume the approximate value as
(4.56)
From (4.55) and (4.56) the maximum broadening due to wave front
curvature will be
(4.57)
that coincides with the transit-time broadening. The coincidence of
these values is not accidental, since both types of broadening are charac-
terized by the beam diameter.
4j Laser Linewidth and Others
If the geometrical broadening is eliminated, the resolution of saturation
spectroscopy is limited by the Iinewidth of the laser used, that is by the
short-term frequency stability. The theoretical relative Iinewidth of a cw
gas laser determined by spontaneous emission and thermal noise is as
small as 10 - 1 3 _ 10 - 15 (JAVAN et al. [4.98]). But practically a very great
contribution to linewidth can be made by acoustic and other fast dis
turbances of the laser cavity which are hardly compensated by a servo
system stabilizing the oscillation frequency. In a very carefully constructed
arrangement it is possible to obtain a linewidth of about I kHz (He-Ne
laser at 3.39 /lm [4.94J).
Narrowing the laser radiation linewidth, in order to obtain a resolu
tion much better than 1011. requires consideration of other fundamental
~ f f e c t s that limit the resolution of the saturation method. There is, for
mstance, a thermal distribution of atomic transition frequencies in gas
due to the second-order Doppler effect. The value of such broadening is
. kTA " ;"
LJ 'S .DJ 'O - Ale 2 '(4.58)
This value, say, for CH 4 at 300 K amounts to 1.8 x 10 - 12.
4.4.2 Some Peculiarities of Saturation Spectroscopy
The saturation spectroscopy of overlapping complex (three or more
levels) transitions has some special features (additional crossing effects
and possibility of elimination of intermediate level width for coupled
140 V.S.LETOKHOV Sa tura tion Spectros copy 141
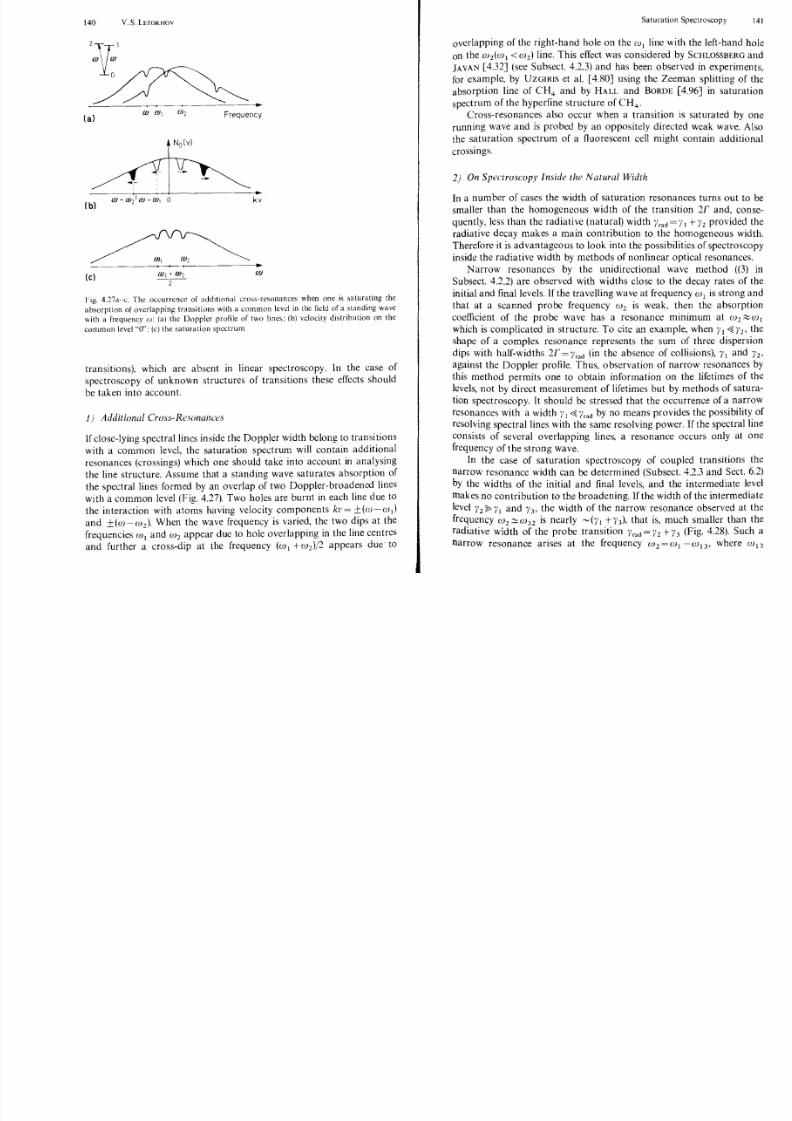
8/3/2019 SAS Chapter4
http://slidepdf.com/reader/full/sas-chapter4 24/39
2J{:1W W
o
...
la lFrequency
Ie)w
FIg. 4.27a-c. The occurrence of additional cross-resonances when one is saturating the
absorption of overlapping transitions with a common level in the field of a standing wave
with a frequency ( I) : (a) the Doppler profile of two lines; (b) velocity distribution on the
common level "0": (c) the saturation spectrum
transitions), which are absent in linear spectroscopy. In the case of
spectroscopy of unknown structures of transitions these effects should
be taken into account.
1) Additional Cross-Resonances
If close-lying spectral lines inside the Doppler width belong to transitions
with a common levcl, the saturation spectrum will contain additional
resonances (crossings) which one should take into account in analysing
the line structure. Assume that a standing wave saturates absorption of
the spectral lines formed by an overlap of two Doppler-broadened lines
with a common level (Fig. 4.27). Two holes are burnt in each line due to
the interaction with atoms having velocity components kv WI)
and ±(w 0h). When the wave frequency is varied, the two dips at the
frequencies WI and 0h appear due to hole overlapping in the line centres
and further a cross-dip at the frequency (W I + 2)/2 appears due to
overlapping of the right-hand hole on the WI line with the left-hand hole
on the W2(W I «2) line. This effect was considered by SCHLOSSBERG and
]AVAN [4.32] (see Subsect. 4.2.3) and has been observed in experiments,
for example, by UZGIRIS et aL [4.80] using the Zeeman splitting of the
absorption line of CH 4 and by HALL and BORDE [4.96] in saturation
spectrum of the hyperfine structure of CH4 •
Cross-resonances also occur when a transition is saturated by one
running wave and is probed by an oppositely directed weak wave. Also
the saturation spectrum of a fluorescent cell might contain additional
crossings.
2) On Spectr oscopy Inside the Natural Width
In a number of cases the width of saturation resonances turns ou t to be
smaller than the homogeneous width of the transition 21' and, conse
quently, less than the radiative (natural) width Yu d I ' +/2 provided the
radiative decay makes a main contribution to the homogeneous width.
Therefore it is advantageous to look into the possibilities of spectroscopy
inside the radiative width by methods of nonlinear optical resonances.
Narrow resonances by the unidirectional wave method ((3) in
Subsect. 4.2.2) are observed with widths close to the decay rates of theinitial an d final levels. If the travelling wave at frequency (1)1 is strong and
that at a scanned probe frequency (J)2 is weak, then the absorption
coefficient of the probe wave has a resonance minimum at W2 ;:::;;0)1
which is complicated in structure. To cite an example, when y, ~ / 2 ' the
shape of a complex resonance represents the sum of three dispersion
dips with half-widths 21' = Irad (in the absence of collisions), II and Y2'
against the Doppler profile. Thus, obse rvation of narrow resonances by
this method permits one to obtain information on the lifetimes of the
levels, not by direct measurement of lifetimes but by methods of satura
tion spectroscopy. It should be stressed that the occurrence of a narrow
resonances with a width Y trad by no means provides the possibility of
resolving spectral lines with the same resolving power. If he spectral lineconsists of several overlapping lines, a resonance occurs only at one
frequency of the strong wave.
In the case of saturation spectroscopy of coupled transitions the
narrow resonance width can be determined (Subsect. 4.2.3 and Sect. 6.2)
by the widths of the initial and final levels, and the intermediate level
makes no contribution to the broadening. I f he width of the intermediate
leVel }'2 ,' I and 13' the width of the narrow resonance observed at the
frequency W2 ::::::W32 is nearly """(Yl +/3), that is, much smaller than the
radiative width of the probe transition Irad = 12 +13 (Fig. 4.28). Such a
narrow resonance arises at the frequency 0)2 = WI - WI3 ' where W 13
142 V. S. LETOKHOVSaturation Spectroscopy t43
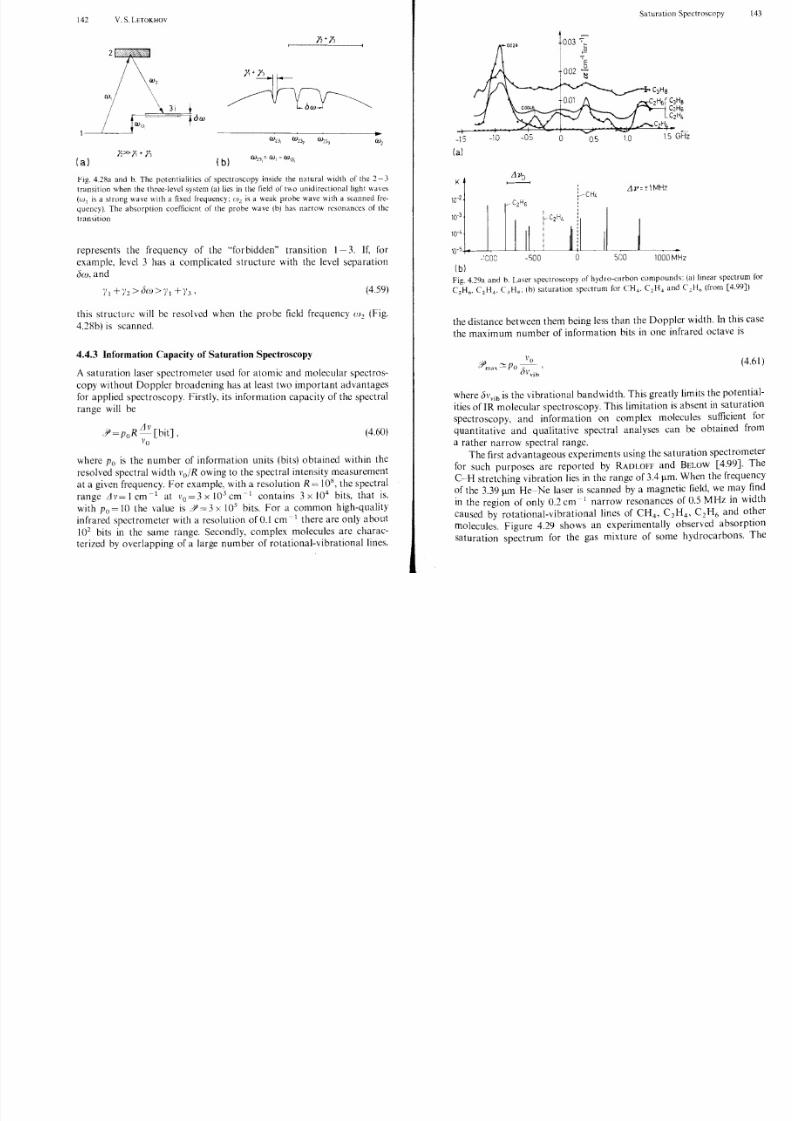
8/3/2019 SAS Chapter4
http://slidepdf.com/reader/full/sas-chapter4 25/39
bw
(a ) (b )
Fig. 4.28a and b. The potentialities of spectroscopy inside the natural width of the 2 -3
transition when the three-level system (a) lies in the field of two unidirectional light waves
(W I is a strong wave with a fixed frequency; (1)2 is a weak probe wave with a sc;nned fre
quency). The absorption coefficient of the probe wave (b) has narrow resonances of the
tn!Osition
represents the frequency of the "for bidden" transitio n 1 - 3. If, for
example, level 3 has a complicated structure with the level separation
(5w. and
(4.59)
this structure will be resolved when the probe field frequency W2 (Fig.
4.28b) is scanned.
4.4.3 Information Capacity of Saturation Spectroscopy
A saturation laser spectrometer used for atomic and molecular spectros
copy w i ~ h o u t Doppler broadening has at least two important advantages
for applIed spectroscopy. Firstly, its information capacity of the spectral
range will be
.JI>=PoR Llv [bit], (4.60)
"0
where Po is the number of information units (bits) obtained within the
resolved spectral width VoiR owing to the spectral intensity measurement
at a given frequency. For example, with a resolution R 10M, the spectral
range Lll'= 1 cm -[ at Vo = 3 X 10 3 cm I contains 3 x 104 bits, that is.
with Po = 10 the value is .Jj> = 3 X 105 bits. Fo r a common high-quality
infrared spectrometer with a resolution of OJ cm I there are only about
10 2 bits in the same range. Secondly, complex molecules are charac
terized by overlapping of a large number of rotational-vibrational lines,
-1.5
(a)
(b)
-1.0 ·o.s 0. 0..5 1.0
Fig. 4.293 and b. Laser spectroscopy of hydro-carbon compounds: (a) linear spectrum for
C1H
6- C
2H
4• C"H g : (h) saturation spectrum for CH 4 • C1 H4 and C1H6 (from [4.99])
the distance between them being less than the Doppler width. In this case
the maximum number of information bits in one infrared octave is
(4.61 )
where (5vVib
is the vibrational bandwidth. This greatly limits the potential
ities of IR molecular spectroscopy. This limitation is absent in saturation
spectroscopy, and information on complex molecules sufficient forquantitative and qualitative spectral analyses can be obtained from
a rather narrow spectral range.The first advantageous experiments using the saturation spectrometer
for such purposes are reported by RADLOFF and BELOW [4.99]. The
C- H stretching vibration lies in the range of 3.4 !1ll1. When the frequency
of the 3.39 !1m He-Ne laser is scanned by a magnetic field, we may find
in the region of only 0.2 cm 1 narrow resonances of 0.5 MHz in width
caused by rotational-vibrational lines of CH4 , C 2 H4 , C 2H6 and other
molecules. Figure 4.29 shows an experimentally observed absorption
saturation spectrum for the gas mixture of some hydrocarbons. The
144 V. S. LETOKHOV Saturation Spectroscopy 145
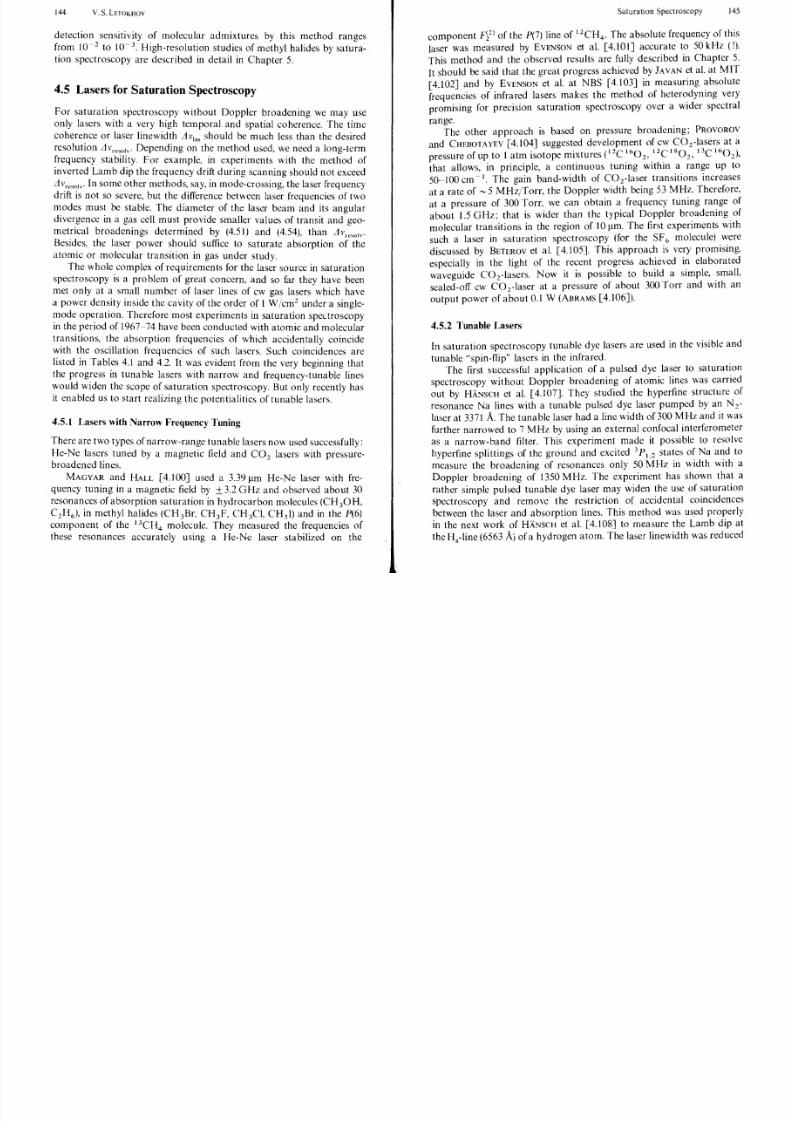
8/3/2019 SAS Chapter4
http://slidepdf.com/reader/full/sas-chapter4 26/39
detection sensitivity of molecular admixtures by this method ranges
from 10-2 to 10-3. High-resolution studies of methyl halides by satura
tion spectroscopy are described in detail in Chapter 5.
4.5 Lasers for Saturation Spectroscopy
Fo r saturation spectroscopy without Doppler broadening we may use
only lasers with a very high temporal and spatial coherence. The time
coherence or laser linewidth Av 1as should be much less than the desired
resolution Depending on the method used, we need a long-termfrequency stability. Fo r example, in experiments with the method of
inverted Lamb dip the frequency drift during scanning should no t exceed
AV.re";lv' In some other methods, say, in mode-crossing, the laser frequency
dnft IS no t so severe, bu t the difference between laser frequencies of two
n:odes m u s ~ be stable. The diameter of the laser beam and its angular
dIVer.gence m a g ~ s cell must provide smaller values of transit and geo
metrIcal broademngs determined by (4.51) and (4.54), than AVreso'v'
BeSIdes, the laser power should suffice to saturate absorption of the
atomIC or molecular transition in gas under study.
The whole complex of requirements for the laser source in saturation
spectroscopyis
aproblem of
great concern,and
so far they have beenmet only at a small num ber of laser lines of cw gas lasers'which have
a power d e n ~ i t y inside the cavity of the order of 1 W /cm 2 under a single
:node o p ~ r a t l O n . Therefore most experiments in saturation spectroscopy
il l the penod of 1 9 6 7 ~ 74 have been conducted with atomic and molecular
t r ~ n s i t i o n s , t?e absorption frequencies of which accidentally coincide
WIth the OSCIllatIon frequencies of such lasers. Such coincidences are
listed in T a b l ~ 4.1 and 4.2. It was evident from the very beginning that
the prog:-ess m tunable lasers with narrow and frequency-tunable lines
~ o u l d WIden the scope of saturation spectroscopy. But only recently has
It enabled us to start realizing the potentialities of tunable lasers.
4.5.1 Lasers with Narrow Frequency Tuning
There are two types of narrow-range tunable lasers now used successfully:
He-Ne lasers tuned by a magnetic field and CO lasers with pressure-broadened lines. 2
MAGYAR and HALL [4.100J used a 3.39 11m He-Ne laser with fre
quency tuning in a magnet ic field by 3.2 GH z and observed about 30
resonances of absorption saturation in hydrocarbon molecules (CH 0 H
C2 11 6 ), in methyl halides (CH)Br, CH3 F, CH 3Cl, CH)I) and in th: P(6)
component of the 13CH4 molecule. They measured the frequencies of
these resonances accurately using a He-Ne laser stabilized on the
component F}2l of the P(7) line of I The absolute frequeney of this
laser was measured by EVENSON et al. [4.101J accurate to 50kHz (!).
This method and the observed results are fully described in Chapter 5.
It should be said that the great progress achieved by JAVAN et al. at MI T
[4.1 02J and by EVENSON et al. at NBS [4.1 03J in measuring abs olute
frequencies of infrared lasers makes the method of heterodyning very
promising for precision saturation spectroscopy over a wider spectral
range.The other approach is based on pressure broadening; PROVOROV
and CHEBOTAYEV [4.104J suggested development of cw CO 2-lasers at apressure of up to 1 at m isotope mixtures e C 160 2 , 12C
180 2, 13C16
( 2 ),
that allows, in principle, a continuous tuning within a range up to
50--100 cm I. The gain band-width of CO 2-laser transitions increases
at a rate o f - 5 MHz/Torr, the Doppler width being 53 MHz. Therefore,
at a pressure of 300 Torr, we ean obtain a frequency tuning range of
about 1.5 GHz; that is wider than the typical Doppler broadening of
molecular transitions in the region of 10 11m. The first experiments with
such a laser in saturation speetroscopy (for the SF molecule) were
discussed by BETEROV et at [4.105]. This approach is very promising,
especially in the light of the recent progress achieved in elaborated
waveguide CO2-lasers. Now it is possible to build a simple, small,
sealed-ofT cw CO 2 -laser at a pressure of about 300 Torr and with an
output power of about 0.1 W (ABRAMS [4.106J).
4.5.2 Tunable Lasers
In saturation spectroscopy tunable dye lasers are used in the visible and
tunable "spin-flip" lasers in the infrared.
The first suceessful application of a pulsed dye laser to saturation
spectroscopy without Doppler broadening of atomic lines was carried
out by HANSCH et at [4.107]. They studied the hyperfine structure of
resonance Na lines with a tunable pulsed dye laser pumped by an N 2-
laser at 3371 A. The tunable laser had a line width of 300 MH z and it was
further narrowed to 7 MH z by using an external confocal interferometer
as a narrow-band filter. This experiment made it possible to resolve
hyperfine spliUings of the ground and excited 3P I12 states of Na and to
measure the broadening of resonances only 50 MHz in width with a
Doppler broadening of 1350 MHz. The experiment has shown that a
rather simple pulsed tunable dye laser may widen the use of saturation
spectroscopy and remove the restriction of accidental coincidences
between the laser and absorption lines. This method was used properly
in the next work of HANSCH et a!. [4.108J to measure the Lamb dip at
the H,-Iine (6563 A) of a hydrogen atom. The laser linewidth was reduced
146 V. S. LEToKHov Saturation Spectroscopy 147
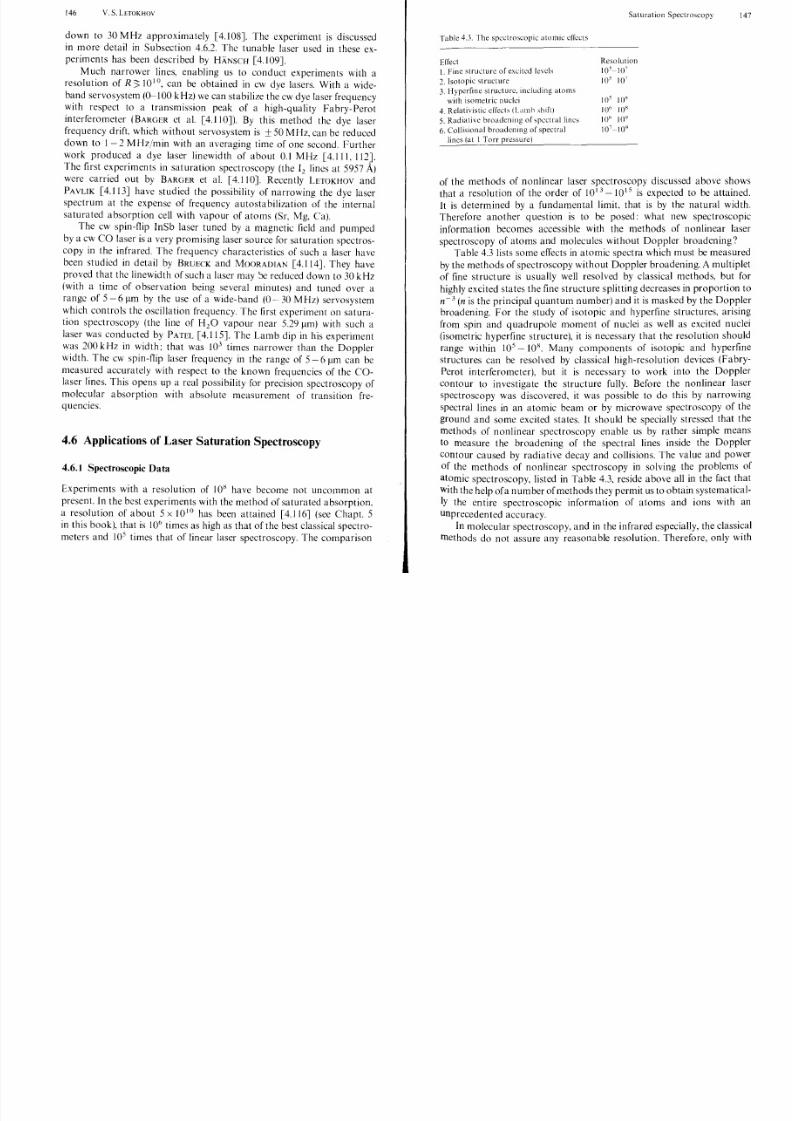
8/3/2019 SAS Chapter4
http://slidepdf.com/reader/full/sas-chapter4 27/39
down to 30 MHz approximately [4.108]. The experiment is discussed
in more detail in Subsection 4.6.2. The tunable laser used in these ex
periments has been described by HANSCH [4.109].
Much narrower lines, enabling us to conduct experiments with a
resolution of R>lOlo
, can be obtained in cw dye lasers. With a wide
band servosystem (0-100 kHz) we can stabilize the cw dye laser frequency
with respect to a transmission peak of a high-quality Fabry-Perot
interferometer (BARGER et al. [4.110J). By this method the dye laser
frequency drift, which without servo system is ± 50 MHz, can be reduced
down to 1 -2 MHz/min with an averaging time of one second. Furtherwork produced a dye laser linewidth of about 0.1 MHz [4.111,112].
The first experiments in saturation spectroscopy (the 12 lines at 5957 A)
were carried ou t by BARGER et al. [4.110]. Recen tly LETOKHOV and
PAVLIK [4.113J have studied the possibility of narrowing the dye laser
spectrum at the expense of frequency autostabilization of the internal
saturated absorption cell with vapour of atoms (Sr, Mg, Cal.
The cw spin-flip InSb laser tuned by a magnetic field and pumped
by a cw CO laser is a very promising laser source for saturation spectros
copy in the infrared. The frequency characteristics of such a laser have
been studied in detail by BRUECK and MOORADIAN [4.114]. They have
proved that the linewidth of such a laser may x reduced down to 30 kHz
(with a time of observation being several minutes) and tuned over a
range of 5 - 6 Ilm by the use of a wide-band (0 - 30 MHz) servosystem
which controls the oscillation frequency. The first experiment on satura
tion spectroscopy (the line of H 2 0 vapour near 5.29 Ilm) with such a
laser was conducted by PATEL [4.115]. The Lamb dip in his experiment
was 200 kHz in width; that was 10 3 times narrower than the Doppler
width. The cw spin-flip laser frequency in the range of 5 - 6 Ilm can be
measured accurately with respect to the known frequencies of the CO
laser lines. This opens up a real possibility for precision spectroscopy of
molecular absorption with absolute measurement of transition frequenCies.
4.6 Applications of Laser Saturation Spectroscopy
4.6 • Spectroscopic Data
Experiments with a resolution of 1 0 ~ have become not uncommon at
present. In the best experiments with the method of saturated absorption,
a resolution of about 5x 101o has been attained [4.116J (see Chapt. 5
in this book), that is 106 times as high as that of the best classical spectro
meters and 105
times that of linear laser spectroscopy. The comparison
Table 4.3. Th e spectroscopic atomic effects
Effect
1. Fine structure of excited levels
2. Isotopic structure
3. Hyperfine structure. including atoms
with isometric nuclei
4. Relativistic effects (Lamh shift)
5. Radiative broadening of spectral lines
6. Collisional broadening of spectral
lines (at 1 Torr pressure)
Resolution
10'-10'
105 10'
10 5 10<
10" 10"
10" 10"
10 7-10"
of the methods of nonlinear laser spectroscopy discussed above shows
that a resolution of the order of 10 13 _1 0 15 is expected to be attained.
It is determined by a fundamental limit, that is by the natural width.
Therefore another question is to be posed: what new spectroscopic
information becomes accessible with the methods of nonlinear laser
spectroscopy of atoms and molecules without Doppler broadening?
Table 4.3 lists some effects in atomic spectra which must be measured
by the methods of spectroscopy without Doppler broadening. A multiplet
of fine structure is usually well resolved by classical methods, but for
highly excited states the fine structure splitting decreases in proportion to
n-3 (n is the principal quantum number) and it is masked by the Doppler
broadening. For the study of isotopic and hyperfine structures, arising
from spin and quadrupole moment of nuclei as well as excited nuclei
(isometric hyperfine structure), it is necessary that the resolution should
range within 10 5 _lO H. Many components of isotopic and hyperfine
structures can be resolved by classical high-resolution devices (Fabry
Perot interferometer), but it is necessary to work into the Doppler
contour to investigate the structure fully. Before the nonlinear laser
spectroscopy was discovered, it was possible to do this by narrowing
spectral lines in an atomic beam or by microwave spectroscopy of the
ground and some excited states.It
should be specially stressed that themethods of nonlinear spectroscopy enable us by rather simple means
to measure the broadening of the spectral lines inside the Doppler
contour caused by radiative decay and collisions. The value and power
of the methods of nonlinear spectroscopy in solving the problems of
atomic spectroscopy, listed in Table 4.3, reside above all in the fact that
with the help ofa number of methods they permit us to obtain systematical
ly the entire spectroscopic information of atoms and ions with an
unprecedented accuracy.
In molecular spectroscopy, and in the infrared especially, the classical
methods do not assure any reasonable resolution. Therefore, only with
148 V.S.LETOKHOV Saturation Spectroscopy 149
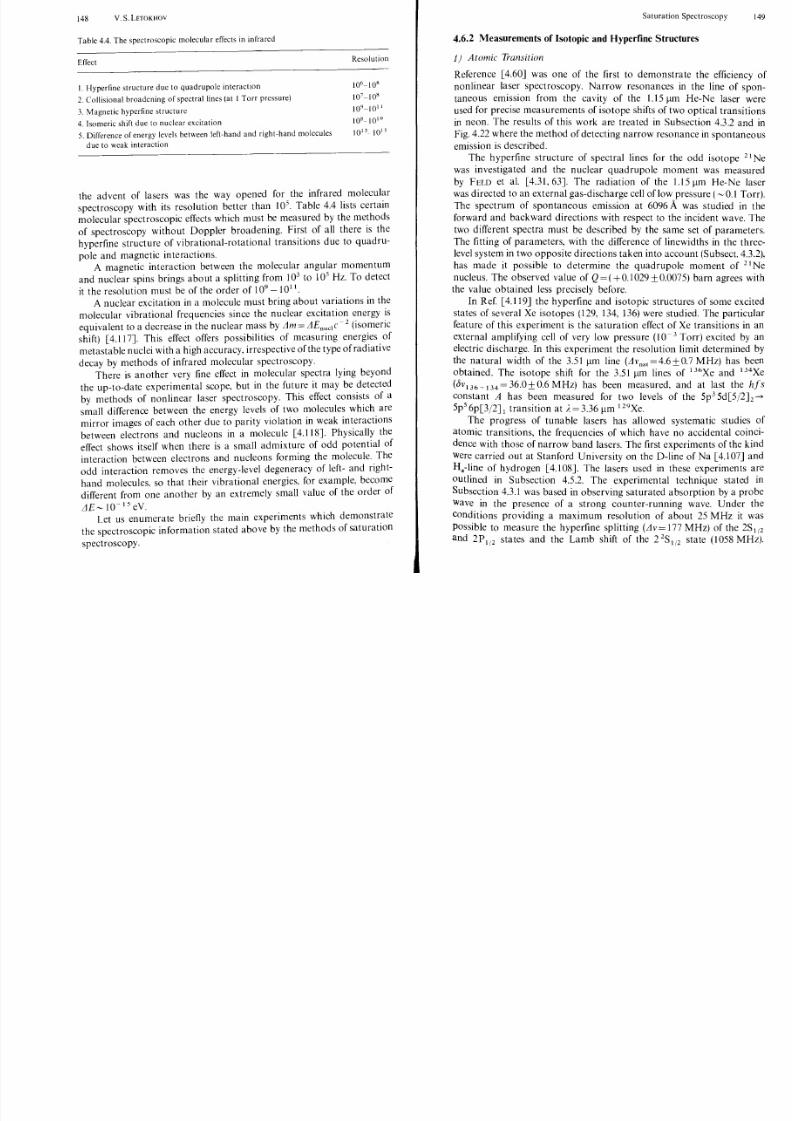
8/3/2019 SAS Chapter4
http://slidepdf.com/reader/full/sas-chapter4 28/39
Table 4.4. The spectroscopic molecular effects in infrared
Effect
1. Hyperfine structure due to quadrupole interaction
2. Collisional broadening of spectral lines (at I Torr pressure)
3. Magnetic hyperfine structure
4. Isomeric shift due to nuclear excitation
5. Difference of energy levels between left-hand and right-hand molecules
due to weak interaction
Resolution
106-IOB
107-loB
109_10 11
10B- 1010
1013 10 15
the advent of lasers was the way opened for the infrared molecular
spectroscopy with its resolution better than 105
. Table 4.4 lists certain
molecular spectroscopic effects which must be measured by the methods
of spectroscopy without Doppler broadening. First of all there is the
hyperfine structure of vibrational-rotational transitions due to quadru
pole and magnetic interactions.A magnetic interaction between the molecular angular momentum
and nuclear spins brings about a splitting from 103 to 10
5Hz. To detect
it the resolution must be of the order of 109- 1011.
A nuclear excitation in a molecule must bring about variations in the
molecular vibrational frequencies since the nuclear excitation energy is. - 2 . .
equivalent to a decrease il l the nuclear mass by LIm = LlEnucl C (lsomenc
shift) [4.117]. This effect offers possibilities of measuring energies of
metastable nuclei with a high accuracy, irrespectiveof the type of radiative
decay by methods of infrared molecular spectroscopy.
There is another very fine effect in molecular spectra lying beyond
the up-to-date experimental scope, but in the future it may be detected
by methods of nonlinear laser spectroscopy. This effect consists of a
small difference between the energy levels of two molecules which are
mirror images of each other due to parity violation in weak interactionsbetween electrons and nucleons in a molecule [4.118]. Physically the
effect shows itself when there is a small admixture of odd potential of
interaction between electrons and nucleons forming the molecule. The
odd interaction removes the energy-level degeneracy of left- and right
hand molecules, so that their vibrational energies, for example, become
different from one another by an extremely small value of the order of
L l E ~ to-I 5 eV.
Let us enumerate briefly the main experiments which demonstrate
the spectroscopic information stated above by the methods of saturation
spectroscopy.
4.6.2 Measurements of Isotopic and Hyperfine Structures
1) Atomic Transition
Reference [4.60] was one of the first to demonstrate the efficiency of
nonlinear laser spectroscopy. Narrow resonances in the line of spon
taneous emission from the cavity of the 1.15 He-Ne laser were
used for precise measurements of isotope shifts of two optical transitions
in neon. The results of this work are treated in Subsection 4.3.2 and in
Fig. 4.22 where the method of detecting narrow resonance in spontaneous
emission is described.The hyperfine structure of spectral lines for the odd isotope 21 Ne
was investigated and the nuclear quadrupole moment was measured
by FELD et al. [4.31,63]. The radiation of the 1.15 He-Ne laser
was directed to an external gas-discharge cellof low pressure ( ~ 0 . 1 Torr).
The spectrum of spontaneous emission at 6096 A was studied in the
forward and backward directions with respect to the incident wave. The
two different spectra must be described by the same set of parameters.
The fitting of parameters, with the difference of linewidths in the three
level system in two opposi te direct ions tak en into ac count (Subsect. 4.3.2),
has made it possible to determine the quadrupole moment of 21 Ne
nucleus. The observed value of Q= (+0.1 029 ± 0.0075) barn agrees with
the value obtained less precisely before.
In Ref. [4.119] the hyperfine and isotopic structures of some excited
states of several Xe isotopes (129, 134, 136) were studied. The particular
feature of this experiment is the saturation effect of Xe transitions in an
external amplifying cell of very low pressure (10- 3 Torr) excited by an
electric discharge. In this experiment the resolution limit determined by
the natural width of the 3.51 line (Llv nat =4.6±0.7 MHz) has been
obtained. The isotope shift for the 3.51 lines of 136Xe and 134Xe
(bV136_134=36.0±0.6MHz) has been measured, and at last the h fs
constant A has been measured for two levels of the 5p35d[5/2]2->
5p5 6p[3/2]1 transition at }"=3.36 129Xe.
The progress of tunable lasers has allowed systematic studies ofatomic transitions, the frequencies of which have no accidental coinci
dence with those of narrow band lasers. The first experiments of the kind
were carried out at Stanford University on the D-line of Na [4.1 07] and
H,-line of hydrogen [4.1 08]. The lasers used in these experiments are
outlined in Subsection 4.5.2. The experimental technique stated in
Subsection 4.3.1 was based in observing saturated absorption by a probe
wave in the presence of a strong counter-running wave. Under the
conditions providing a maximum resolution of about 25 MHz it was
possible to measure the hyperfine splitting (Llv= 177 MHz) of the 2S 1/2and 2P 1/2 states and the Lamb shift of the 2 2S1/2 state (1058 MHz).
150 V. S. LEToKHOv Saturation Spectroscopy 151
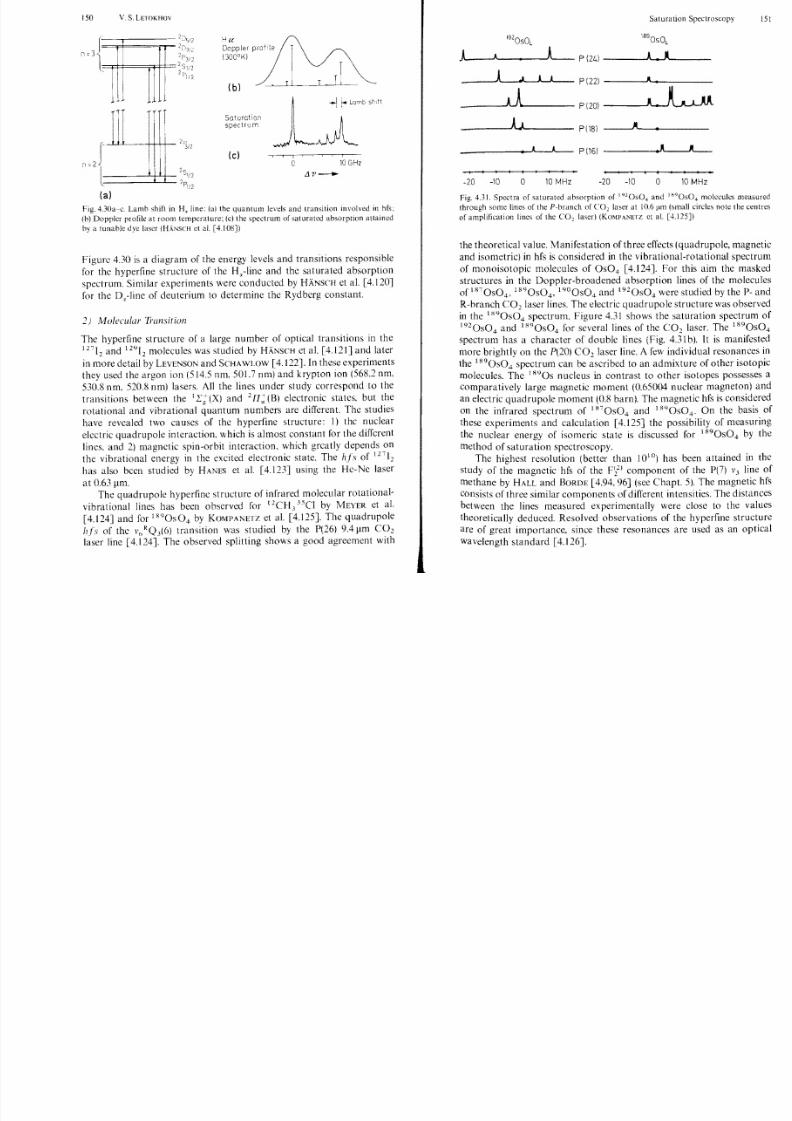
8/3/2019 SAS Chapter4
http://slidepdf.com/reader/full/sas-chapter4 29/39
II jT)
I!
!
(al
(b )
Saturationspectrum
(el
~ - - L T Li__ ~ T _ . . . c . . . L _
i
c 10 GHz
.11'-
Fig. 4 . 3 0 a ~ c . Lamb shift in H, line: (al the quantum levels and transition involved in hfs:
(b) Doppler profile at room temperature; (c) the spectrum of saturated absorptIon attained
by a tunable dye laser (HANSCH el al. [4.108])
Figure 4.30 is a diagram of the energy levels and transitions responsible
for the hyperfine structure of the H,-line and the saturated absorption
spectrum. Similar experiments were conducted by HANSCH et al. [4.120]for the D,-line of deuterium to determine the Rydberg constant.
2) Molecular Ti'allsition
The hyperfine structure of a large number of optical transitions in the
I and 1 molecules was studied by H,A,NSCH et al. [4.121] and later
in more detail by LEVENSON and SCHA WLOW [4.122J. In these experiments
they used the argon ion (514.5 nm, 501.7 nm) and krypton ion (568.2 nm,
530.8 nm, 520.8 nm) lasers. All the lines under study correspond to the
transitions between the 11:': (X) and 2n; (8 ) electronic states, but the
rotational and vibrational quantum numbers are different. The studies
have revealed two causes of the hyperfine structure: 1) thc nuclearelectric quadrupole interaction, which is almost constant for the different
lines. and 2) magnetic spin-orbit interaction. which greatly depends on
the vibrational energy in the excited electronic state. The hfs of 12
has also bcen studied by HANES et al. [4.123] using the He-Nc laser
at 0.63 J.1m.
The quadrupole hyperfine structure of infrared molecular rotational
vibrational lines has been observed for t 2C Hl J5Cl by MEYER et al.
[4.124J and for 1890S04 by KOMPANETZ et al. [4.1 The quadrupole
hIs of the VI> RQ3(6) transition was studied by the P(26) 9.4 J.1m CO 2
laser line [4.124]. The observed splitting shows a good agreement with
192050, :89050,
P{24)---LJ.---~ P ( 2 2 ) .......---___ .. P ( 2 0 ) ~ _ - - L - - - P(18) ~ ~ - . - - - -
. .
-20 -10 o 10 MHz -20 -10 o 10 MHz
Fig. 4Jl. Spectra of saturated absorption of i92 050 4 and l molecules measured
through some lines of the P-branch of CO 2 laser at 10.6 ,1m (smali circles note the centres
of amplification lines of the CO 2 laser) (KOMPANETZ ct al. [4.125])
the theoretical value. Manifestatio n of three effects (quadrupole, magnetic
and isometric) in hfs is considered in the vibrational-rotational spectrum
of monoisotopic molecules of Os O4 [4.124]. For this aim the masked
structures in theDoppler-broadened absorption
lines of the moleculesof 1870S04' 1890S04' 19°0504 and t920S04 were studied by the P- and
R-branch CO 2 laser lines. The electric quadrupole structure was observed
in the 11>9 0S 04 spectrum. Figure 4.31 shows the saturation spectrum of
1920S04 and 1890S04 for several lines of the CO 2 laser. The 1890S04
spectrum has a character of double lines (Fig. 4.31 b). It is manifested
more brightly on the P(20) CO 2 laser line. A few individual resonances in
the 1890S04 spectrum can be ascribed to an admixture of other isotopic
molecules. The 18 905 nucleus in contrast to other isotopes possesses a
comparatively large magnetic moment (0.65004 nuclear magneton) and
an electric quadrupole moment (0.8 barn). The magnetic hfs is considered
on the infrared spectrum of 1870S04 and 1890SO4' On the basis of
these experiments and calculation [4.125] the possibility of measuringthe nuclear energy of isomeric state is discussed for 1890S04 by the
method of saturation spectroscopy.
The highest resolution (better than 1010) has been attained in the
study of the magnetic hfs of the component of the P(7) V3 line of
methane by HALL and BORDE [4.94, 96] (see Chapt. 5). The magnetic hfs
consists of three similar components of different intensities. The distances
between the lines measured experimentally were close to the values
theoretically deduced. Resolved observations of the hyperfine structure
are of great importance, since these resonances are used as an optical
wa velength standard [4.126].
152 V. S. LETOKHOV Saturation Spectroscopy 153
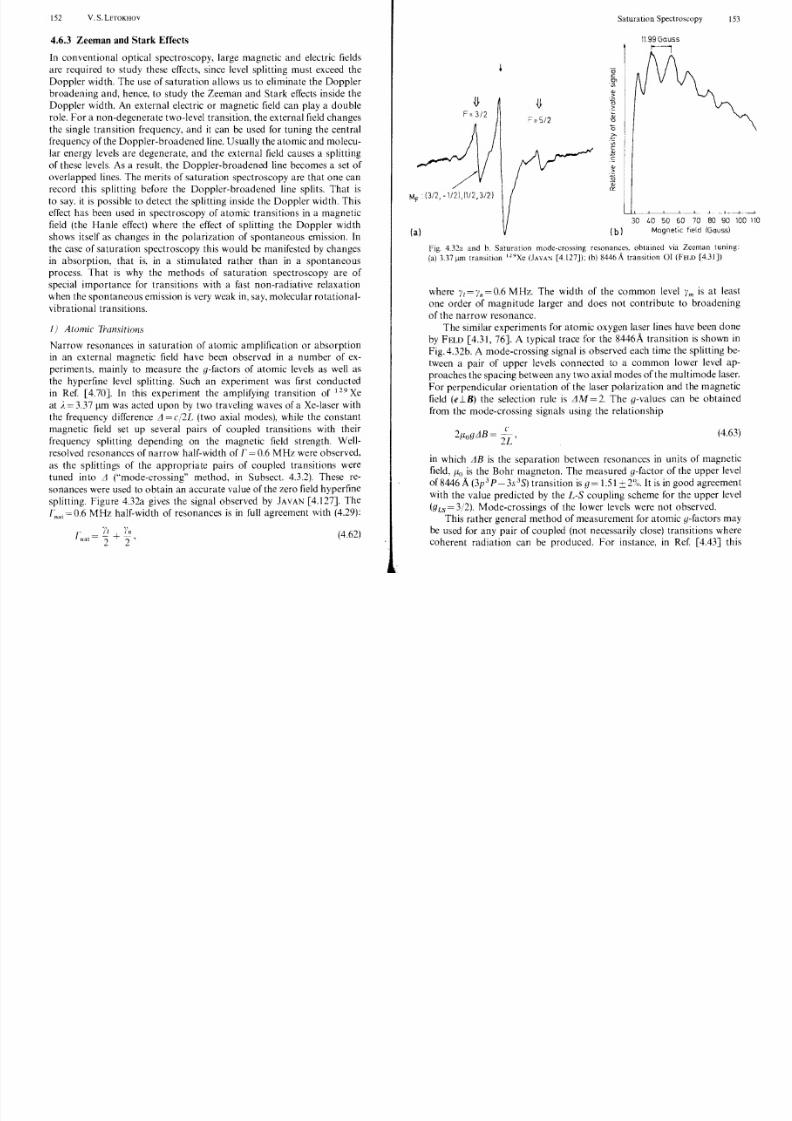
8/3/2019 SAS Chapter4
http://slidepdf.com/reader/full/sas-chapter4 30/39
4.6.3 Zeeman and Stark Effects
In conventional optical spectroscopy, large magnetic and electric fields
are required to study these effects, since level splitting must exceed the
Doppler width. The use of saturation allows us to eliminate the Doppler
broadening and, hence, to study the Zeeman and Stark effects inside the
Doppler width. An external electric or magnetic field can playa double
role. For a non-degenerate two-level transition, the external field changes
the single transition frequency, and it can be used for tuning the central
frequency of the Doppler-broadened line. Usually the atomic and molecu
lar energy levels are degenerate, and the external field causes a splitting
of these levels. As a result, the Doppler-broadened line becomes a set of
overlapped lines. The merits of saturation spectroscopy are that one can
record this splitting before the Doppler-broadened line splits. That is
to say. it is possible to detect the splitting inside the Doppler width. This
effect has been used in spectroscopy of atomic transitions in a magnetic
field ( t ~ e Hanle effect) where the effect of splitting the Doppler width
shows Itself as changes in the polarization of spontaneous emission. In
~ h e case of saturation spectroscopy this would be manifested by changes
111 absorption, that is, in a stimulated rather than in a spontaneous
process. That is why the methods of saturation spectroscopy are of
special importance for transitions with a fast non-radiative relaxationwhen the spontaneous emission is very weak in, say, molecular rotational
vibrational transitions.
f) Atomic TJ'ansitions
Narrow resonances in saturation of atomic amplification or absorption
111 an external magnetic field have been observed in a number of ex
periments, mainly to measure the g-factors of atomic levels as well as
the hyperfine level splitting. Such an experiment was first conducted
in Ref. [4.70]. In this experiment the amplifying transition of 12 9 Xe
at;. 3.37 Jlm was acted upon by two traveling waves ofaXe-laser with
the frequency difference A=c/2L (two axial modes), while the constant
magnetic field set up several pairs of coupled transitions with their
frequency splitting depending on the magnetic field strength. Well
resolved resonances of narrow half-width of T 0.6 MHz were observed,
as the splittings of the appropriate pairs of coupled transitions wcre
tuned into L1 ("mode-crossing" method, in Subsect. 4.3.2). These rc
sonances were used to obtain an accurate value of the zero field hyperfine
splitting. Figure 4.32a gives the signal observed by JAVAN [4. t27]. The
Tnat
= 0.6 MHz half-width of resonances is in full agreement with (4.29):
" • 'ir II Inna t="2 + 2 '
(4.62)
11.99 Gauss
,j}
F 3/2=5i2
MF (312, -1/2),(1i2, 312)
(a) (b )
30 40 50 60 70 80 90 100 110
Magnetic field (Gauss)
Fig. 4.32a and b. Saturation mode-crossing resonances. obtained via Zeeman tuning:
(a) 3.37 11m transition 129XC ( J A V A ~ [4.127J); (b) 8446 A transition 01 (FELD [4.3IJ)
where 11=1n =0.6 MHz. The width of the common level 1m is at leastone order of magnitude larger and does not contribute to broadening
of the narrow resonance.
The similar experiments for atomic oxygen laser lines have been doneby FEW [4.31, 76]. A typical trace for the 8446A transition is shown in
FigA.32b. A mode-crossing signal is observed each time the splitting be-
tween a pair of upper levels connected to a common lower level ap
proaches the spacing between any two axial modes of the multim ode laser.
For perpendicular orientation of the laser polarization and the magnetic
field (e 1B ) the selection rule is AM 2. The g-values can be obtained
from the mode-crossing signals using the relationship
(4.63)
in which AB is the separation between resonances in units of magnetic
field, Po is the Bohr magneton. The measured g-factor of the upper level
0 ~ 8 4 4 6 A (3p 3 P-3s 3S) transition is g 1.51 2%. It is in good agreement
WIth the value predicted by the L-S coupling scheme for the upper level
(gLS= 3/2). Mode-crossings of the lower levels were not observed.
This rather general method of measurement for atomic g-factors may
be used for any pair of coupled (not necessarily close) transitions wherecoherent radiation can be produced. For instance, in Ref. [4.43J this
154 V. S. LEToKHOvSaturation Spectroscopy 155
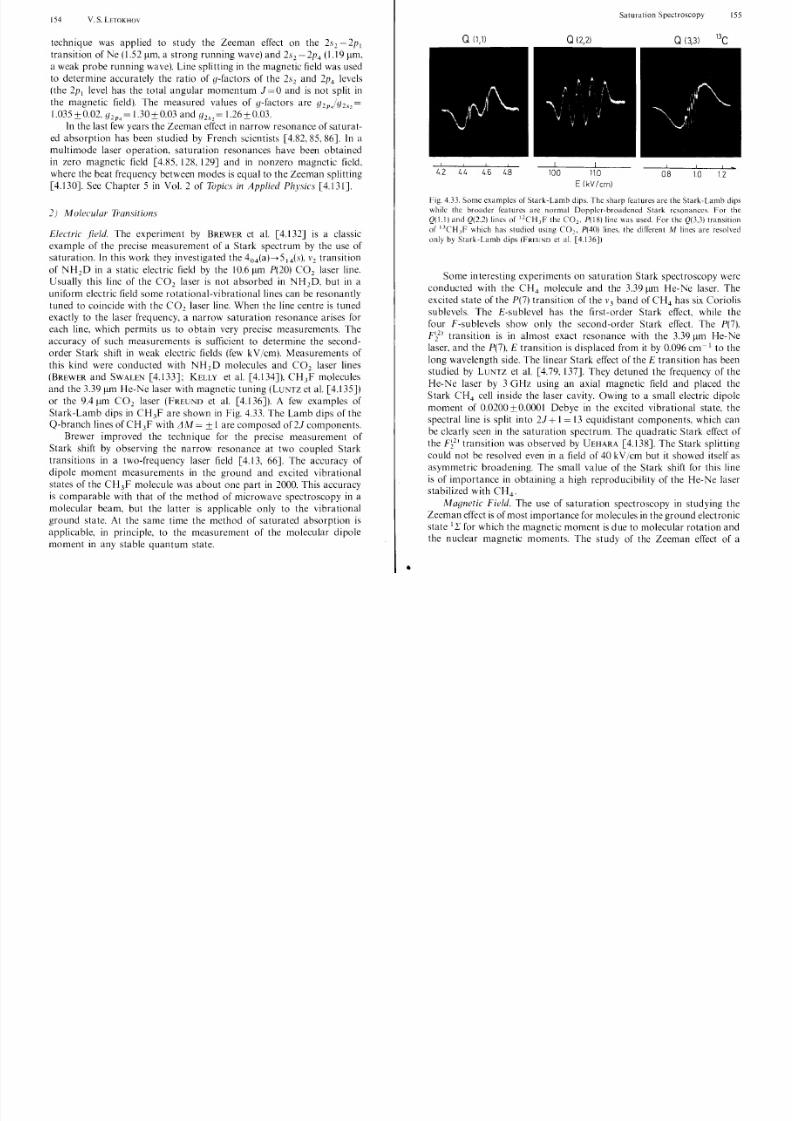
8/3/2019 SAS Chapter4
http://slidepdf.com/reader/full/sas-chapter4 31/39
technique was applied to study the Zeeman effect on the 2s2 -2pl
transition of Ne (1.52 /lm, a strong running wave) and 2s2 - 2p4 (1.19 /lm,
a weak probe running wave). Line splitting in the magnetic field was used
to determine accurately the ratio of g-factors of the 2s2 and 2P4 levels
(the 2PI level has the total angular momentum J = 0 and is not split in
the magnetic field). The measured values of g-factors are (1 /g . =2P4 2s-,
1.035 ± 0.02, g2P4 = 1.30± 0.03 and g2"2 = 1.26 ± 0.03.
In the last few years the Zeeman effect in narrow resonance of saturat
ed absorption has been studied by French scientists [4.82, 85, 86]. In a
multimode laser operation, saturation resonances have been obtained
in zero magnet ic field [4.85, 128, 129J and in nonzero magnetic field.
where the beat frequency between modes is equal to the Zeeman splitting
[4.130]. See Chapter 5 in Vol. 2 of Topics in Applied Physics [4.131].
2) Molecular Y,'ansitions
Electric field. The experiment by BREWER et al. [4.132J is a classic
example of the precise measurement of a Stark spectrum by the use of
saturation. In this work they investigated the 404 (a)--5 14 (S), \'2 transition
of NH2D in a static electric field by the 10.6/lm P(20) CO 2 laser line.
Usually this line of the CO 2 laser is not absorbed in NH 2D, bu t in auniform electric field some rotational-vibrational lines can be resonantly
tuned to coincide with the CO 2 laser line. When the line centre is tuned
exactly to the laser freq uency, a narrow saturation resonance arises for
each line, which permits us to obtain very precise measurements. The
accuracy of such measurements is sufficient to determine the second
order Stark shift in weak electric fields (few k V cm). Measurements of
this kind were conducted with NH2D molecules and CO 2 laser lines
(BREWER and SWALEN [4.133J; KELLY et al. [4.134J). CH3F molecules
and the 3.39 /lm He-Ne laser with magnetic tuning (LuNTz et al. [4.135J)
or the 9.4 /lm CO 2 laser (FREUND et al. [4.136J). A few examples of
Stark-Lamb dips in CH3F are shown in Fig. 4.33. The Lamb dips of the
Q-branch lines of CH3F with L1 M = ± 1 are composed of 2J components.Brewer improved the technique for the precise measurement of
Stark shift by observing the narrow resonance at two coupled Stark
tr.ansitions in a two-frequency laser field [4.13, 66]. The accuracy of
dipole moment measurements in the ground and excited vibrational
states of the CH3F molecule was about one part in 2000. This accuracy
is comparable with that of the method of microwave spectroscopy in a
molecular beam, but the latter is applicable only to the vibrational
ground state. At the same time the method of saturated absorption is
applicable, in principle, to the measurement of the molecular dipole
moment in any stable quantum state.
•
I I! ! !
4.2 44 46 4.8I >
10.0 110 0.8 1.0 1.2
E(kV/cm)
Fig. 4.33. Some examples of Stark-Lamb dips. The sharp features are the Stark· Lamb dips
while the broader features are normal Doppler-broadened Stark rcsonances. For the
Q(1.1) and Q(2.2) lines of 12CHJF the CO 2 , P(IS) line was used. For the Q(3J) transition
of I JCH,F which has studied using CO 2 • P(40) lines. the different M lines are resolved
only by Stark-Lamb dips (FREUND et a!. [4.136])
Some interesting experiments on saturation Stark spectroscopy were
conducted with the CH 4 molecule and the 3.39/lm He-Ne laser. The
excited state of the P(7) transition of the \'3 band of CH 4 has six Coriolis
sublevels. The E-sublevel has the first-order Stark effect, while the
four F-sublevels show only the second-order Stark effect. The P(7).
Fi2 ) transition is in almost exact resonance with the 3.39/lm He-Ne
laser, and the P(7), E transition is displaced from it by 0.096 cm - 1 to the
long wavelength side. The linear Stark effect of the E transition has been
studied by LUNTZ et al. [4.79. 137]. They detuned the frequency of the
He-Ne laser by 3 GH z using an axial magnetic field and placed the
Stark CH4
cell inside the laser cavity. Owing to a small electric dipole
moment of 0.0200 ±0.0001 Debye in the excited vib rational state, the
spectral line is split into 2J+
1= 13 equidistant components, which canbe clearly seen in the saturation spectrum. The quadratic Stark effect of
the Fi2 ) transition was observed by UEHARA [4.138]. The Stark splitting
could not be resolved even in a field of 40 kV /cm but it showed itself as
asymmetric broadening. The small value of the Stark shift for this line
is of importance in obtaining a high reproducibility of the He-Ne laser
stabilized with CH4
.
Magnetic Field. The use of saturation spectroscopy in studying the
Zeeman effect is of most importance for molecules in the ground electronic
state 1L for which the magnetic moment is due to molecular rotation and
the nuclear magnetic moments. The study of the Zeeman effect of a
156 v. S. LETOKHOV Saturation Spectroscopy 157
experiments. Not only the absolute value but also the sign of g] is measur
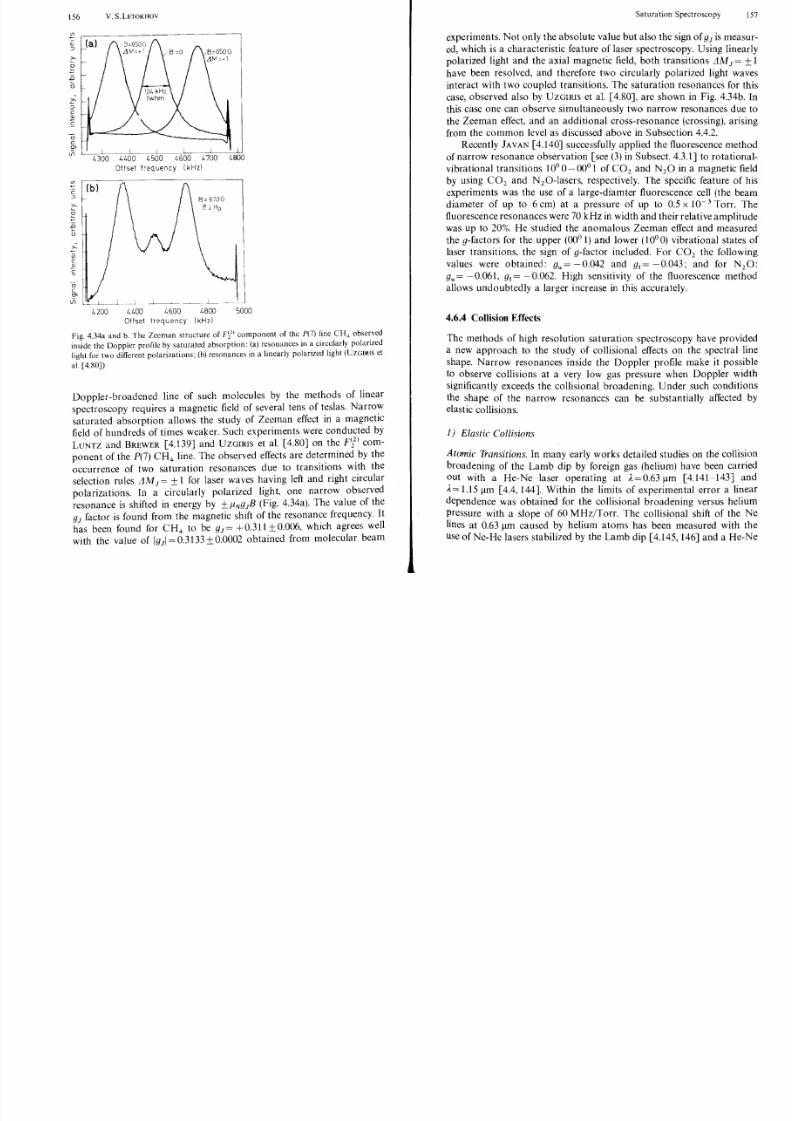
8/3/2019 SAS Chapter4
http://slidepdf.com/reader/full/sas-chapter4 32/39
Offset frequency (kHz)
1.200 41.00 4600 1.800 5000
Offset frequency 1kHz)
Fig. 4.34a and b. The Zeeman structure of F ~ 2 . component of the P(7) line CH " observed
inside the Doppler profile by saturated absorption: (a) resonances in a circularly polarized
light for two different polarizations; (b) resonances in a linearly polarized light (CZGlRIS et
aL [4.80J)
Doppler-broadened line of such molecules by the methods of linear
spectroscopy requires a magnetic field of several tens of teslas. Narrow
saturated absorption allows the study of Zeeman effect in a magneticfield of hundreds of times weaker. Such experiments were conducted by
LUNTz and BREWER [4.139] and UZGIRIS et al. [4.80] on the Fi2 ) com
ponent of the P(7) CH 4line. The observed effects are determined by the
occurrence of two saturation resonances due to transitions with the
selection rules 111VfJ= ± l for laser waves having left and right circular
polarizations. In a circularly polarized light. one narrow observed
resonance is shifted in energy by /lN9JB 4.34a). The value of the
gJ factor is found from the magnetic shift of the resonance frequency. It
has been found for CH4
to be 9J +0.31l ±0.006, which agrees well
with the value of IgJI 0.3133±0.0002 obtained from molecular beam
ed, which is a characteristic feature of laser spectroscopy. Using linearly
polarized light and the axial magnetic field, both transitions AM] ± 1
have been resolved, and therefore two circularly polarized light waves
interact with two coupled transitions. The sa turation resonances for this
case, observed also by UZGIRIS et al. [4.80], are shown in Fig. 4.34b. In
this case one can observe simultaneously two narrow resonances due to
the Zeeman effect, and an additional cross-resonance (crossing), arising
from the common level as discussed above in Subsection 4.4.2.
Recently JAVAN [4.140] successfully applied the fluorescence methodof narrow resonance observation [see (3) in Subsect. 4.3.1] to rotational
vibrati onal transitio ns 10° 0 00° 1 of CO 2 and N20 in a magne tic field
by using CO 2 and N 20-lasers, respectively. The specific feature of his
experiments was the use of a large-diamter fluorescence cell (the beam
diameter of up to 6 cm) at a pressure of up to 0.5 x 10- 3 Torr. The
fluorescence resonances were70 kHz in width and their relativeamplitude
was up to 20%. He studied the anomalous Zeeman effect and measured
the g-factors for the upper (00° 1) and lower (10°0) vibrational states of
laser transitions, the sign of g-factor included. For CO 2 the following
values were obtained: gu=-0.042 and 91=-0.043; and for NzO:
gu -0.061, gl 0.062. High sensitivity of the fluorescence method
allows undoubtedly a larger increase in this accurately.
4.6.4 Collision Effects
The methods of high resolution saturation spectroscopy have provided
a new approach to the study of collisional effects on the spectral line
shape. Narrow resonances inside the Doppler profile make it possible
to observe collisions at a very low gas pressure when Doppler width
significantly exceeds the collisional broadening. Under such conditions
the shape of the narrow resonances can be substantially affected by
elastic collisions.
1) Elas tic Collisions
Atomic Transitions. In many early works detailed studies on the collision
broadening of the Lamb dip by foreign gas (helium) have been carried
out with a He-Ne laser operating at A=0.63I1m [4.141-143] and
A= 1.15 11m [4.4,144]. Within the limits of experimental error a linear
dependence was obtained for the collisional broadening versus helium
pressure with a slope of 60 MHz/Torr. The collisional shift of the Ne
lines at 0.63 11m caused by helium atoms has been measured with the
use of Ne-He lasers stabilized by the Lamb dip [4.145,146] and a He-Ne
158 V. S. LETOKHOV
laser with an Ne-arsorbing cell [4.7,8]. The shift measured by the latter
Saturation Spectroscopy 159
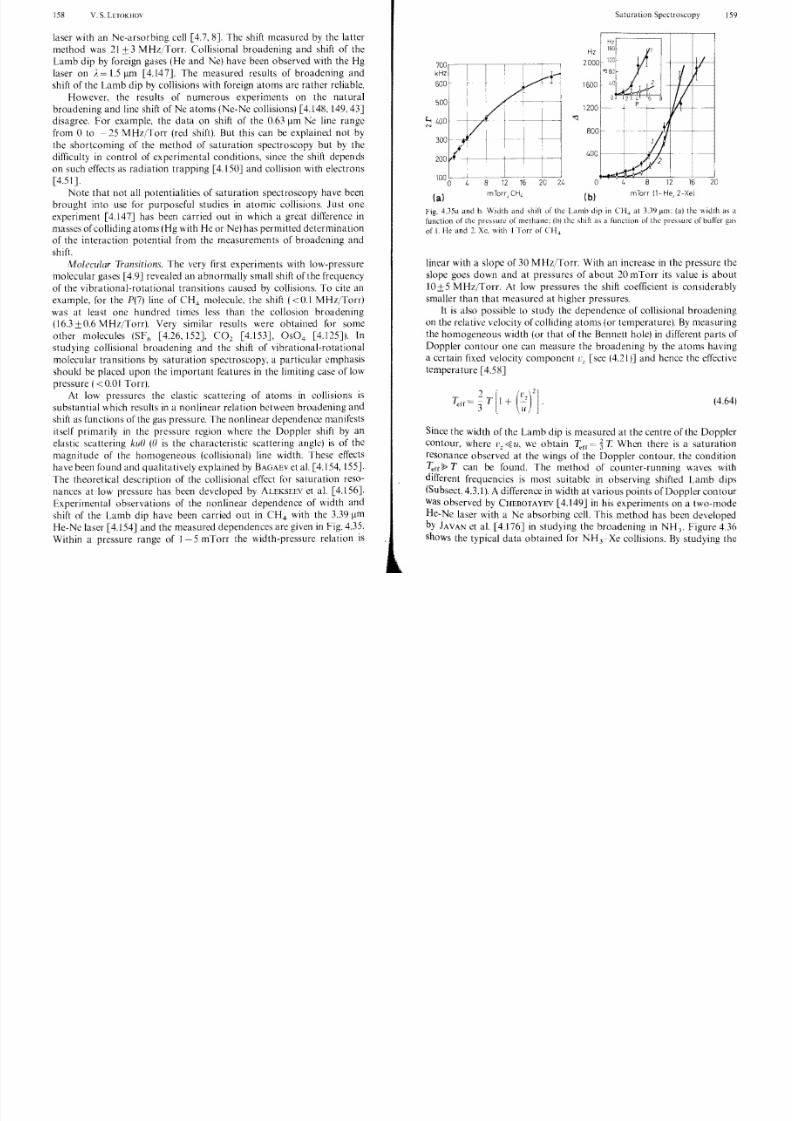
8/3/2019 SAS Chapter4
http://slidepdf.com/reader/full/sas-chapter4 33/39
method was 21 ±3 MHz/Torr. Collisional broadening and shift of the
Lamb dip by foreign gases (He and :Ke) have been observed with the Hg
laser on ;.= 1.5 JlIIl [4.147]. The measured results of broadening and
shift of the Lamb dip by collisions with foreign atoms are rather reliable.
However, the results of numerous experiments on the natural
broadening and line shift of Ne atoms (:Ke-Ne collisions) [4.148, l49. 43J
disagree. Fo r example, the data on shift of the 0.63 11m :Ke line range
from 0 to - 25 MHz/Torr (red shift). But this can be explained no t by
the shortcoming of the method of saturation spectroscopy but by thedifficulty in control of experimental conditions, since the shift depends
on such effects as radiation trapping [4.l50J and collision with electrons
[4.51].
Note that not all potentialities of saturation spectroscopy have been
brought into use for purposeful studies in atomic collisions. Just one
experiment [4.147J has been carried ou t in which a great difference in
masses of colliding atoms (Hg with He or Ne) has permitted determinat ion
of the interaction potential from the measurements of broadening and
shift.
Iv1o/eeular Ji'ansitions. The very first experiments with low-pressure
molecular gases [4.9J revealed an abnormally small shift of the frequency
of the vibrational-rotational transitions caused by collisions. To cite anexample, for the P(7) line of CH 4 molecule, the shift «0.1 MHz/Torr)
was at least one hundred times less than the collosion broadening
(16.3 ±0.6 MHz/Torr). Very similar results were obtained for some
other molecules (SFo [4.26,152], CO 2 [4.153J, OS04 [4.125J), In
studying collisional broadening and the shift of vibrational-rotational
molecular transitions by saturation spectroscopy, a particular emphasis
should be placed upon the important features in the limiting case of low
pressure «0.01 Torr).
At low pressures the elastic scattering of atoms in collisions is
substantial which results in a nonlinear relation between broadening and
shift as functions of the gas pressure. The nonlinear dependence manifests
itself p rimarily in the pressure region where the Doppler shift by an
elastic scattering kuO (0 is the characteristic scattering ang1c) is of the
magnitude of the homogeneous (collisional) line width. Thesc effects
have been found and qualitatively explained by BAGAEV et aL [4.154, l55J.
The theoretical description of the collisional effect for saturation reso
nances at low pressure has been developed by ALEKSEEV et aL [4.156}
Experimental observations of the nonlinear dependence of width and
shift of the Lamb dip have been carried out in CH 4 with the 3.39 11mHe-Ne laser [4.154J and the measured depen dences are given in Fig. 4.35.
Within a pressure range of 1 5 mTorr the width-pressure relation is
1200
800
400 f----,---
o
(bl
12 15 20
mTorr (l-He, 2-Xei
fig. 4J5a and b. Width and shift of the Lamb dip in CH 4 at 3J911m: (a) the width as a
function of the pressure of methane: (b) the shift as a function of the pressure of buffer gas
of I. He and 2. Xc, with I Torr of CH .
linear with a slope of 30 MHz/Torr. With an increase in the pressure the
slope goes down and at pressures of about 20 mTorr its value is about
5 MHz/Torr. At low pressures the shift coefficient is considerablysmaller than that measured at higher pressures.
It is also possible to study the dependence of collisional broadening
on the relative velocity of colliding atoms (or temperature). By measuring
the homogeneous width (or that of the Bennett hole) in different parts of
Doppler contour one can measure the broadening by the atoms having
a certain fixed velocity component L'z [see (4.21)J and hence the effective
temperature [4.58J
(4.64)
Since the width of the Lamb dip is measured at the centre of the Doppler
contour, where 1'; u, we obtain 'T.ff = t T. When there is a saturation
resonance observed at the wings of the Doppler contour, the condition
'T.rr'P T can be found. The method of counter-running waves with
different frequencies is most suitable in observing shifted Lamb dips
(Subsect. 4.3.l). A difference in width at various points of Doppler contour
was observed by CHEBOTAYEV [4.l49J in his experiments on a two-mode
He-Ne laser with a Ne absorbing cell. 'rhis method has been developed
by JAvAN et aL [4.176J in studying the broadening in NH 3 , Figure 4.36
shows the typical data obtained for NH3Xe collisions. By studying the
160 V. S. LETOKHOV
1.8
Saturation Spectroscopy 161
IJ - J'I = 2 or 4. The average change of the velocity component for
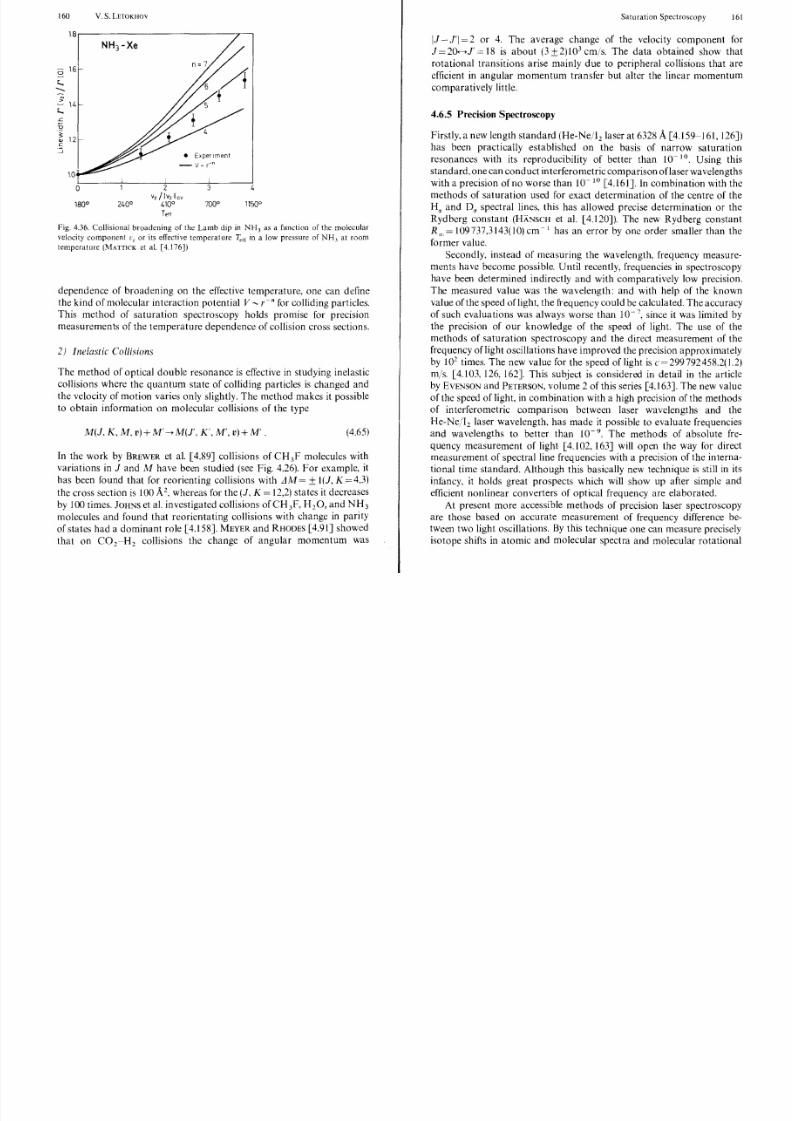
8/3/2019 SAS Chapter4
http://slidepdf.com/reader/full/sas-chapter4 34/39
NH3 -Xe
01.6
r.:...-.....
>1l.
r.:...L
u
12'"-' • ExperIment
_V r- n
10
0 2 3 4Vz !Ivz cv
1800 240 0 l.10 0 700 0 11500
loff
Fig. 4.36. Collisional broadening of the Lamb dip in NH3 as a function of the molecular
velocity compone nt or its effective temperatur e 7;,'r in a low pressure of NH , at room
temperature (MATTICK et aL [4.176])
dependence of broadening on the effective temperature, one can define
the kind of molecular interaction potential V -. r- n for colliding particles.
This method of saturation spectroscopy holds promise for precision
measurements of the temperature dependence of collision cross sections.
Inelastic Collisions
The method of optical double resonance is effective in studying inelastic
collisions where the quantum state of colliding particles is changed and
the velocity of motion varies only slightly. The method makes it possible
to obtain information on molecular collisions of the type
M(J. K, M, v)+ v1' --+iH(J', K' , M' , v)+ M' . (4.65)
In the work by BREWER et al. [4.89] collisions of CH3F molecules with
variations in J and M have been studied (see Fig. 4.26). For example, it
has been found that for reorienting collisions with AM = ± (J, K 4,3)
the cross section is 100 A , whereas for the (J, K = 12,2) states it decreases
by 100 times. JOHNS et al. investiga ted collisions of CH 3F, H 20, and NH3
molecules and found that reorientating collisions with change in parity
of states had a dominant role [4.158]. MEYER and RHODES [4.91] showed
that on CO 2-H z collisions the change of angular momentum was
J=20.-.J' 18 is about (3±2)103cm/s. The data obtained show that
rotational transitions arise mainly due to peripheral collisions that are
efficient in angular momentum transfer but alter the linear momentum
comparatively little.
4.6.5 Precision Spectroscopy
Firstly, a new length standard (He-Ne/lz laser at 6328 A 4.159-161,126])
has been practically established on the basis of narrow saturationresonances with its reproducibility of better than 10- 10
. Using this
standard, one can conduct interferometric comparison oflaser wa velengths
with a precision of no worse than 10- 10 [4.161]. In combination with the
methods of saturation used for exact determination of the centre of the
H", and D", spectral lines, this has allowed precise determination or the
Rydberg constant (HANSCH et al. [4.120]). The new Rydberg constant
Reo = 109737,3143(10) cm - 1 has an error by one order smaller than the
former value.
Secondly, instead of measuring the wavelength, frequency measure
ments have become possible. Until recently, frequencies in spectroscopy
have been determined indirectly and with comparatively low precision.
The measured value was the wavelength: and with help of the known
value of the speed of light, the frequency could be calcula ted. The accura cy
of such evaluations was always worse than 10- 7, since it was limited by
the precision of our knowledge of the speed of light. The use of the
methods of saturation spectroscopy and the direct measurement of the
frequency oflight oscillations have improved the precision approximately
by 102 times. The new value for the speed of light is c 299792458.2(1.2)
m/s. [4.103. 126, 162]. This subject is considered in detail in the article
by EVENSON and PETERSON, volume 2 of this series [4.163]. The new value
of the speed oflight, in combination with a high precision of the methods
of interferometric comparison between laser wavelengths and the
He-Ne/12 laser wavelength, has made it possible to evaluate frequenciesand wavelengths to better than 10- 9. The methods of absolute fre
quency measurement of light [4.102, 163] will open the way for direct
measurement of spectral line frequencies with a precision of the interna
tional time standard. Although this basically new technique is still in its
infancy. it holds great prospects which will show up after simple and
efficient nonlinear converters of optical frequency are elaborated.
At present more accessible methods of precision laser spectroscopy
are those based on accurate measurement of frequency difference be
tween two light oscillations. By this technique one can measure precisely
isotope shifts in atomic and molecular spectra and molecular rotational
162 V. S. LnOKHOV
constants. The frequencies of two lasers were stabilized by narrow Vibrational- nuclear
Saturation Spectroscopy
Doppler- broadened
163
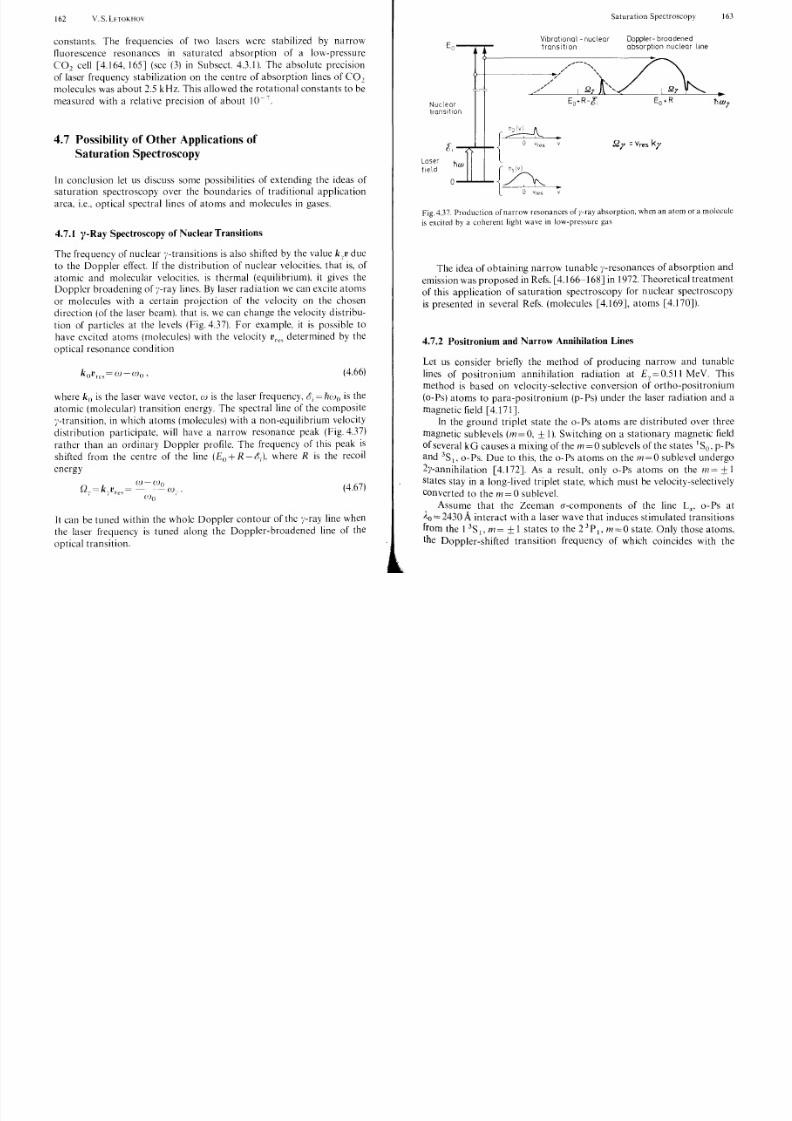
8/3/2019 SAS Chapter4
http://slidepdf.com/reader/full/sas-chapter4 35/39
fluorescence resonances in saturated absorption of a low-pressure
CO 2 cell [4.164, 165J (see (3) in Su bseet. 4.3.1). The absolute precision
of laser frequency stabilization on the centre of absorption lines of CO 2
molecules was about 2.5 kHz. This allowed the rotational constants to be
measured with a relative precision of about to- 7.
4.7 Possibility of Other Applications of
Saturation Spectroscopy
In conclusion let us discuss some possibilities of extending the ideas of
saturation spectroscopy over the boundaries of traditional application
area, i.e., optical spectral lines of atoms and molecules in gases.
4.7.1 y -Ray Spectroscopy of Nuclear Transitions
The frequency of nuclear ,'-transitions is also shifted by the value k,v due
to the Doppler effect. If the distribution of nuclear velocities, that is, of
atomic and molecular velocities, is thermal (equilibrium), it gives the
Doppler broadening of ,'-ray lines. By laser radiation we can excite atoms
or molecules with a certain projection of the velocity on the chosen
direction (of the laser beam). that is. we can change the velocity distr ibu
tion of particles at the levels (Fig. 4.37). For example, it is possible to
have excited atoms (molecules) with the velocity Vre, determined by the
optical resonance condition
(4.66)
where ko is the laser wave vector, w is the laser frequency, O'i = IU})o is the
atomic (molecular) transition energy. The spectral line of the composite
,'-transition, in which atoms (molecules) with a non-equilibrium velocity
distribution participate, will have a narrow resonance peak (Fig. 4.37)
rather than an ordinary Doppler profile. The frequency of this peak is
shifted from the centre of the line (Eo +R - t i ). where R is the recoil
energy
(4.67)
It can be tuned within the whole Doppler contour of the ,'-ray line when
the laser frequency is tuned along the Doppler-broadened line of the
optical transition.
Nucleartransition
Laser
field
transition
"""" -- ........,
A---1-------__/" '"
",//""""""
aV
absorption nuclear line
2 , =Vres k,
Fig. 4.37. Production of narrow resonances of y-ray absorption, when an atom or a molecule
is excited by a coherent light wave in low-pressure gas
The idea of obtaining narrow tunable I'-resonances of absorption and
emission was proposed in Refs, [4.166-168J in 1972. Theoretical treatment
of this application of saturation spectroscopy for nuclear spectroscopy
is presented in several Refs. (molecules [4.169J, atoms [4.170J).
4.7.2 Positronium and Narrow Annihilation Lines
Let us consider briefly the method of producing narrow and tunable
lines of positronium annihilation radiation at E,=0.511 MeV. This
method is based on velocity-selective conversion of ortho-positronium
(o-Ps) atoms to para-positronium (p-Ps) under the laser radiation and a
magnetic field [4.171].
Inthe ground triplet state the
0-
Ps atoms are distributed over threemagnetic sublevels (m = 0, ± 1). Switching on a stationary magnetic field
of several kG causes a mixing of he m=O sublevels of the states ISO' p-Ps
and 3S I, 0- Ps. Du e to this, the 0- Ps atoms on the m = 0 sublevel undergo
2y-annihilation [4.172]. As a result, only 0- Ps atoms on the m = ± 1
states stay in a long-lived triplet state, which must be velocity-selectively
converted to the m = 0 sublevel.
Assume that the Zeeman O'-components of the line La' o-Ps at
Ao =2430 A nteract with a laser wave that induces stimulated transitions
from the 1 3S 1 , m= ± 1 states to the 2 3P I, m=O state. Only those atoms,
the Doppler-shifted transition frequency of which coincides with the
164 V. S. LnOKHOv Saturation Spectroscopy 165
frequency of (4.69) against the background of the Doppler-broadened
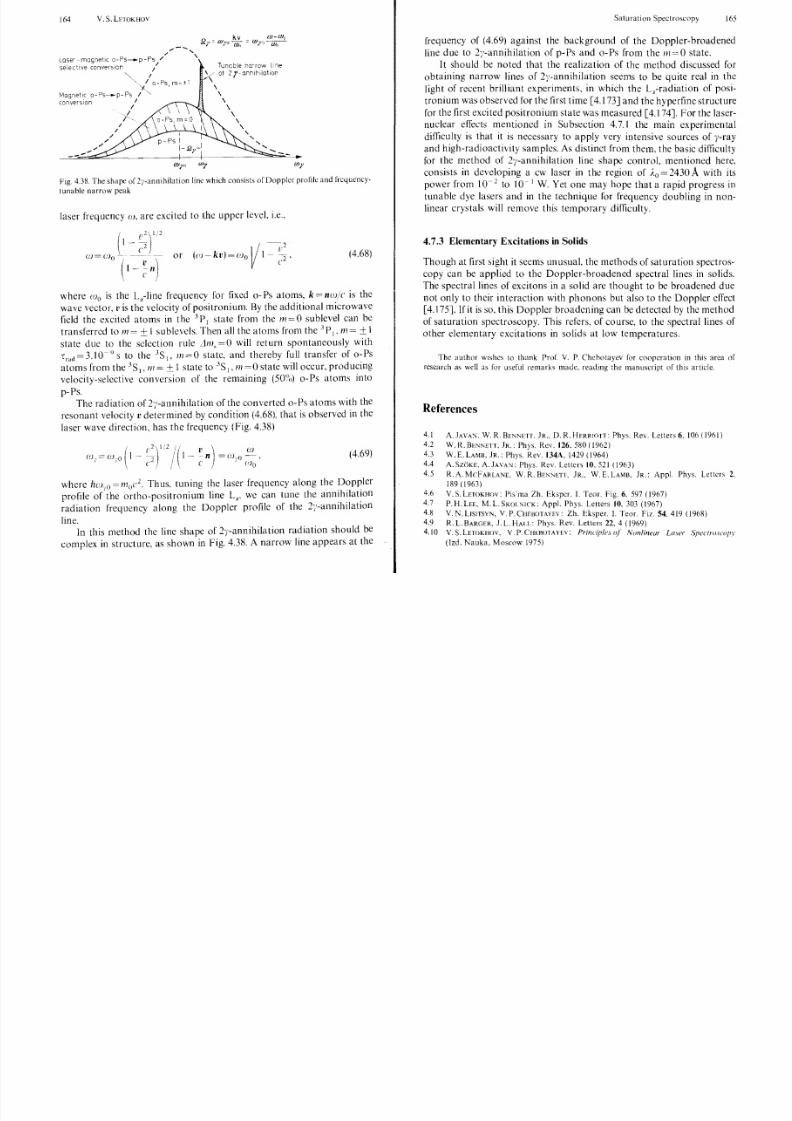
8/3/2019 SAS Chapter4
http://slidepdf.com/reader/full/sas-chapter4 36/39
",--" "aser magnetic o -P s -p -Ps /'
selective conversion ,/
" I"-',- I 0 - Ps m:;:; ±1't. '
Magnetic 0- Ps--- p- f's I "
conversion /
,,-
---.... '"
.;
//
/'
/
lunable rn'row i 1e
)( of 2)' arnihiatior
\\
\\
\\
\ ,"- ,
"- .....
--Fig. 4.38. The shape of 2i'-annihilation line which consists of Doppler profile and frequency·
tunable narrow peak
laser frequency (I), are excited to the upper level, i.e.,
(4.68)rJ) = (J)o
( I\
v n)c
where (()o is the Lx-line frequency for fixed 0 - Ps atoms, k = nOJ/c is the
wave vector, v is the velocity of positronium, By the additional microwave
field the excited atoms in the 3P l state from the 111=0 sublevel can be
transferred to m J sublevels. Then all the atoms from the 3 P1.111 1
state due to the selection rule Llm,=O will return spontaneously with
' rad 3.10 9 S to the .lSI' 111=0 state, and thereby full transfer of o-Ps
atoms from the 3 S ' m ± 1 state to 3S I ' 111 = 0 state will occur, producing
velocity-selective conversion of the remaining (50"0) o-Ps atoms into
p-Ps.The radiation of 2,'-annihilation of the converted o-Ps atoms with the
resonant velocity v determined by condition (4.68). that is observed in the
laser wave direction, has the frequency (Fig. 4.38)
OJ,.o ( 1\
(4.69)( v) (J)1 - - n = ftLo ,
/ . C . (1)0
where (1O»)'o = 1/10
('2. Thus, tuning the laser frequency along the ~ o p p l e r profile of the ortho-positronium line Lx. we can tune the anl1lh!lat!on
radiation frequency along the Doppler profile of the 2-;,-annlhilatlOn
line.In this method the line shape of 2;'-annihilation radiation should be
complex in structure, as shown in Fig. 4.38. A narrow line appears at the
line due to 2}'-annihilation of p·Ps and o-Ps from the 111=0 state.
It should be noted that the realization of the method discussed for
obtaining narrow lines of 2}'-annihilation seems to be quite real in the
light of recent brilliant experiments, in which the L,-radiation of posi
tronium was observed for the first time [4.173J and the hyperfine structure
for the first excited positronium state was measured [4.174]. For the laser
nuclear effects mentioned in Subsection 4.7.1 the main experimental
difficulty is that it is necessary to apply very intensive sources of y-ray
and high-radioactivity samples. As distinct from them, the basic difficultyfor the method of 2}·-annihilation line shape control, mentioned here,
consists in developing a cw laser in the region of;'o 2430 A with its
power from 10- 2 to 10 I W. Yet one may hope that a rapid progress in
tunable dye lasers and in the technique for frequency doubling in non
linear crystals will remove this temporary difficulty.
4.7.3 Elementary Excitations in Solids
Though at first sight it seems unusual. the methods of saturation spectros
copy can be applied to the Doppler-broadened spectral lines in solids.
The spectral lines of excitons in a solid are thought to be broadened duenot only to their interaction with phonons but also to the Doppler effect
[4. t75]. If t is so, this Doppler broadening can be detected by the method
of saturation spectroscopy. This refers. of course, to the spectral lines of
other elementary excitations in solids at low temperatures.
The author wishes to thank Prof, V. p, Chehotayev for cooperation in this area of
research as well as for useful remarks made. reading the manuscript of this article.
References
4.1 A. JAVA:--I. W. R. BEI'I'ETT. JR., D. R, HERRIOTT: Phys. Rev. Letters 6. 106 (1961)
4.2 W. R. BEI'I'ETT. JR.: Phys. Rev. 126. 580 (1962)
4.3 W.E.LAMB. JR.: Phys. Rev. 134A, 1429 (1964)
4.4 A.SzoKE, A.JAVA:--I: Phys. Rev. Letters 10,521 (1963)
4.5 R.A. McFARLAN£. W, R. BEI':--IETT. JR., W. E. LAMB, JR.: AppL Phys. Letters 2.
189 (1963)
4.6 V.S.LEToKHOv: Pis'ma Zh. Ekspcr. J. Teor. Fig. 6.597 (1967)
4.7 P.H.LEE, M.L.SKOL:\ICK: Appl. Phys. Letters 10. 303 (1967)
4.8 V.N.LISlTSYI'. V.P.CHEllOTAYEV: lh . Eksper. 1. Teor. Fiz. 54. 419 (1968)
4.9 R.L.BARGER. J.L.IIALL: Phys. Rev. Letters 22. 4 (1969)
4.10 V. S. LEToKHov, V, p, CHEBOTAYEV: Principles (1' Nonlinear Laser SpeClrOS(ojll'
Ozd. Nauka, Moscow 1975)
166 V.S. LEToKHov
4,11 V.P.CHEBOTAYEV. V.S.LETo KHOv: in Progr. QU(llit. Eledr. cd. hy J.H.SANDERS
SaturatIOn Spectroscopy
4.49 O.N.KoMPANETZ, V,S,LnoKHov: Zh. Eksper. L Teor. Fiz. 62,1302 (1972)
167
8/3/2019 SAS Chapter4
http://slidepdf.com/reader/full/sas-chapter4 37/39
and S. STENfiOLM (Pergamon Pre,s, London 1975) voL 4, p. 1
4.12 I. M.BETEROV, V.P.CIIEIlOTAYEV: in Proqr. Quant. Electr. cd. hy J.H.SANDERS
and S.STEI'HOLM, vol. 3 (Pergamon Press. London 1974) pp. 1-106
4.13 R. G. BREWER: Science 178. 247 (1972)
4.14 M.S.FELD. VSLETOKHOV: Sci. Am . 229. 69 (1973)
4.15 V. S. LETOKHOv: Science 190.344 (1975)
4.16 S.G.RAUTlAN, I. LSOBELMAN: Zn. Eksper. L Teor. Fiz. 44.834 (1963)
4.17 S. G. RAUTlAN: Proceedings of Lehedcv Physical Institute "Nonlinear Optics" 43
(1968)
4.18 H.GREENSTElN: Phys . Rev. 175,438 (1968)
4.19 S,STENHOLM, W.E.LAMB. JR.: Phys. Rev, 181. 618 (1969)4.20 B.J. FELDMAN. M. S. FELD: Phys. Rev, At . 1375 (1970)
4.21 K. UEHARA, K. SHIMODA: Japan. J. App!. Phys, 10,623 (1971)
4.22 K.SHI!>IODA, K. UEHARA: Japan. J. AppL Phys. 10.460 (1971)
4.23 E. V. BAKLANOV, V. p, CHEBOTAYEV. Zh. Eksper, !. Teor. Fiz. 62, 541 (1972)
4.24 E.V.BAKLANov, E.TITOv· Optika L Spcctroscopia. 38,169 (1975)
4.25 V.S. LETOKHOv, V. P. CHEBOTAYEV: Pis'ma Zh. Eksper. l. Teor. Fiz. 9. 364 (1969)
4.26 N.G.BAsov. LN . KOMPA:-.lETZ. O.N.KoMPANETZ. V.S.LETOKHov. V.V.KIKITIN:
Pis'ma Zh. Eksper. L Teor. Fiz. 9,568 (1969)
4.27 Yc.A.M ATlUGIN, RLT ROSHlN, V.P.CHEBOTAYEV: Optika I Spcctroscopla 31,
II I (1971): Digest of Physics Gas Laser Symposium. June 1969. Novosihirsk
4.28 E.V.BAKLANOV, V.P.CHEBOTAYEV: Zh. Eksper. I Tcor. Fiz. 60.552 (1971)
4.29 E. V. BAKLANOV, V. P. CHEBOTAYl:V: Zh. Ekspcr. I Teor. Fiz. 61, 922 (1971)
4.30 S. HAROCHE, F. H,\RTMANN: Phys. Rev. 6A. 1280 (1972)
4.31 M. S. FELD: in Fundamental and Applied Laser Pilysics, cd. by M. S. FELD. A. JA VAN.N. KURNIT (Wiley-Interscience PuhL 1973) pp. 369-420
4.32 H. R. SCHLOSSBERG. A.JAvAN: Phys. Rev. 150. 267 (1966)
4.33 G.E.NmKI:'>I , S.G.RAUTlAN, A.A.FEOKTISTOV: Zh. Eksper. L Teor. Fiz. 52.1673
( 1967)
4.34 H.K.HoLT: Phys. Rev. Letters. 19, 1275 (1967)
4.35 M. S. FEW, A. JAVA:-.I: Phys. Rev. Letters, 20, 12 (1968)
4.36 M . S . F E L D , A . J A V A ~ : Phys. Rev. 177. 540(1969)
4.37 T.YA.POI'OYA, A.K.PoPOY, S.G.RAUTIAN, R.LSOKOLOVSKIl: Zn. Ekspcr. L Teor.
Fiz. 57, 850 (1969)
4.38 A.K.Popov: Zh. Eksper. L Teor. Fiz. 58.1623 (1970)
4.39 T . H A ~ s c H , P.TOSCHEK: Z. Physik. 236. 213 (1970)
4.40 B.l.FELDMA:-.l, M.S.FEW. Phys. Rev. A5, 899 (1972)
4.41 K.SflIMODA: Japan. J AppL Phys.ll. 564(1972)
4.42 M.S.FEL!), A.SA:-.ICHEZ. A.lAVAN. RJ.FELDMA:-.l: Proccedings of Aussoisposium "Methodes de Speclroscopie Sans Largeur Doppler de Niceulix
Srs/ellles /14oleculaire.1 Simpl"s", May, 1973 (PubL N 217, CNRS, Paris
pp.87-104
4.43 I.M. BEfEROV, YC.A. MATILGI',". V.P.CHEBOTAYEV: Pis'ma Zh. Eksper. L Teor.
Fiz. 12, 174 (1970); Zh. Eksper. 1 TeoI'. hz . 64,1495 (1973)
4.44 V. S. LETOKHOV: Comments on Atomic and Molccular Physics 2. 181 (1971)
4.45 V.S.LnoKllov, B.D.PAVLlK: Zh. Eksper. L Teor. Fiz. 64.804 (1973)
4.46 H. GREENST[lJ':: 1. App!. Phys. 43, 1732 (1972)
4.47 Yc . V. BRZHAZOVSKY. V. P. CHEBOTAYEV, L. S. VASILENKO: IEEE J. QE-5, 146 (1969);
Zh. Ekspcr. L Teor. Fiz. 55, 2096 (1968)
4.48 :.l.G.BASOV. O.N.KoMPAl'ETZ, V.S.LEToKHov, V.V.NIKITlN: Zh. Eksper, L Fiz.
59,394 (1970)
4.50 C.V.SHANK, S.E.SCHWARZ: AppJ. Phys. Lett. 13,113 (1968)
4.51 T.W.Ri\NSCIl. P.ToscmK: IEEE 1. QE·4, 467 (1968)
4.52 F. KEIU.fANN. R. L. SHEFFIELD, M. S. FELD, A. JAVAI': AppJ. Phys. Lett. 23, 612 (1973)
4.53 N.G. BAsov. V. S. LEToKHov: Report on URSI Conference Laser Measurements,
Sept. 1968. Warsawa, Poland; Electron. Technology 2, 15 (1969)
4.54 C.FREED. A.lAVAl': AppL Phys. Lett. 17, 53 (1970)
4.55 Annual Report of Optical and Infrared Laser Laboratory, MIT. 1973, p. 18;
A.lAVAN, Private Communication
4.56 MSSOREM, A.LSCIlAWLOW: Opt. Commun. 5,148 (1972)
4.57 V.S.LnoKHov: In Fundamental and Applied Laser Physics, ed. by M.S.FELD.
A.JAVA:-.I, N.KuRNIT (Wiley-Interscicnce PubL 1973), pp. 335-3674.58 A.T.M.UTICK, A. SANCHEZ, N.A.KURNIT. A.1AvAN: AppL Phys. Letl. 23, 675
(1973)
4.59 W.R.BE:-.INETT. JR., V.P.CHEBOTAYEV, J.W.KNUTSON: 5th Intern. Cont'. on
Physics of Electron and Atomic Collisions, Ahstract of Papers. "Nauka", 1967
4.60 R.H.CORDOVER, P.A.Bo:-.lcZYK, A.1AVAN· Phys. Rev . Petters 18, 730 (1967)
4.61 W.G. SCHWEITZER, M. M. BIRKY, J.A. WHITE; 57, 1226 (1976)
4.62 H.K.HoLT: Phys. Rev. Letters 20, 410 (1968)
4.63 T.W.DucAs, M.S.FELD. L.W.RYAN, JR., N.SKRIBANOWITZ, A.JAVAN: Phys. Rev.
A5, 1036 (1972)
4.64 I.M.BETEROV. V.P.CHEBOTAYEV: Pis'ma Zh. Eksper. I Teor. Fiz. 9. 216 (1969)
4.65 T. H;\:-.lSCII. R. KUL. A. SCHABERT, CH. SCHMELZER, P. TOSCHEK: Z. Physik. 226. 293
(1969)4.66 R. G. BREWER: Phys. Rev. Letters 25, 1639 (1970)
4.67 M.TAKAMI, K.S.SHIMODA: Japan. J. AppL Phys. II . 1648 (1972)
4.68 K. SHIMODA: In Laser Speclw.,('(lpl, cd. by R. BREWER and A. MOORADIAN (Plenum
Press, New York 1974) pp. 2 9 ~ ~ 4 4 4.69 K.SHIMODA. T.SHIMIZU: in Progress in Quantum Electronics. cd. by J.H.SANDERS
and S. STENHOLM (Pergamon Press, Oxford 1972) vol. 2, pp. 43 139
4.70 RR.SCHLOSSBERG, A.JAVAl>;· Phys. Rev. Letters. 17,1242 (1966)
4.71 G.W.FLYNN. M.S.FELD. B.J.Ft:l.DMAN: Bull. Am. Phys. Soc. 12,669 (1967)
4.72 M. DUMONT: Phys. Rev. Letters 28, 1357 (1972)
4.73 M. DnloNT: In Proceedings of Colloques InternationaBx C.N.R.S. N217 AJet/lOdes
de Speuroscopie sans Largeur Doppler de Nireaux Excites de Systemes Mo/eculaires
Simples (Aussois. 23-26 May, 1973) p. 235
4.74 A.CCI.MITCHfLl. M.W.ZEMA"SKY: ResIlIuUIcc RadulliOlI ol1d Excited Atoms
(Cambridge University Press. London 1971)
4.75 V. G. POKAZAN'EV. G. V. SKROTSKll: Uspekhi Fiz. Nauk. 107. 623 (1972)
4.76 M.S.FELD: Ph. D. thesis (MIT, 1967)
4.77 JSLEVINE, P.A. BONCZYK, A.JAvAN: Bull. Am. Phys. Soc. 12,7 (1967); Phys. Rev.Letters 22,267 (1968)
4.78 M.LDIAKONOV. V.I.PEREL: Zh.Eksper. I. Teor. Fiz. 50, 4 4 ~ (1966)
4.79 A.C.Llll'TZ. R.G.BREWER. K.LFoSTFR. J.D.SWALEN: Phys. Rev. Lcttcrs 23.
951 (1969)
4.80 E.E.UZGIRIS, J.LHALL, R.L.BARGER: Phys. Rev. Letters 26. 289 (1971)
4.81 R. H.CORDOVER, l. PARKS. A. SZOKE. A.JAVAN: In Physics of" Quantum Electronics,
ed. hy P. L KELLEY, B. LAX and P.E.TANNE"IWALD (Mc-Graw Hill. New York 1966)
p. 591
4.82 RDECOMPS, M.DuMONT : l. de Phys. 29,443 (1968); IEEE J. QE-4, 916 (1961)
4.83 T . H A ~ s c H , P.TOSCHEK: Phys. Letters 20. 273 (1966): ibid. 22,150 (1966)
4.84 M. TSCKAKOSfI!. K.SflIMODA: J. Phys. Soc. Japan 26,758 (1969)
4.85 M. DeCLOY' Optics Comm. 3. 205 (1971)
168 V. S. LEToKHov
4.86 M.DucLOY, J. VIGUE, M. BROYER: in Proceedings of Colloqucs Internationaeux
du C.N.R.S. N 217 Methodes de Spectroscopic sans Laryeur Doppler de Niceaux
Saturation Spectroscopy 169
4.122 M. D. LEVENSON, A. L. SCHAWLOW: Phys. Rev. A6, 10 (1972)
4.123 G. R. HANES, J. LAPIERRE, P. R. BUNKER, K. C. SHOTTON: J. Molec. Spectros. 39,
8/3/2019 SAS Chapter4
http://slidepdf.com/reader/full/sas-chapter4 38/39
Excites de Systemes Maleculaires Simples (Aussois, 23-26, May, 1973) p. 241
4.87 S.N.ATUTOV, A.G.NIKITE!':KO, S.G.RAUTIAN, E.G.SAPRIKIN: Pis'ma Zh. Eksper.
I Teor. Fiz. l3, 232 (1971)
4.88 J.SCIIMIDT, P . R . B E R M A ~ , R.G.BREWER: Phys. Rev. Letters 31. 1103 (1973)
4.89 R.G.BREWER. R.L.SIlOEMAKER, S . S T E ~ H O L M : Phys. Rev. Letters 33, 63 (1974)
4.90 S.M.FREUND, J. W.C.JOH!':S, A.R.McKELLAR, T.OKA: J. Chern. Phys. 59, 3445
( 1973)
4.91 T. W. MEYER, C. K. RHODES: Phys. Rev. Letters 32,637 (1974)
4.92 T. OKA: in Adl'{{nces in A tamic and Molecular Pln'sics, ed. by D. R. BAu:s (Academic
Press, New York 1973) vol. 9, p. 1274.93 J. L. HALL: In Lectures in Thcor. Phys., XII, ed. by K. T. MANALTHEGA and W. E.
B O T I ~ (Gordon Brendi and Co., Ncw York 1970), p. 161
4.94 J. L. HALL: Proceedings of Conference Methodes de .'}'pcctroscopie sans larqcur
Doppler de niccaux excites de sy.ltCI/1S moleculaircs simples. May, 1973 (Pub!. N 217,
CNRS, Paris, 1974) pp. 105--125
4.95 E.V.BAKLANOV, B.Yu.DuBETSKII, V.M.SEMIBALAMUT, E.A.TITov: Soviet J.
Quant. Electron. 2, 2518 (1975)
4.96 J. L. HALl., C. BORDE: Phys. Rev. Letters 30, 1101 (1973)
4.97 V.S.LEToKHov: Zh. Ekspe r. I. Teor. Fiz. 56.1748 (1969)
4.98 T. S. JASEJA, A. JAVAI', C. H. T O W ~ E S : Phys. Rev. Letters 10, 165 (1963)
4.99 W.RADLOFF, E.BELOw: Optics Comm. 13, 160 (1975)
4.100 J.A.MAGYAR, J.L.HALL: IEEE J. QE-8, 567 (1971)
4.101 K.M.EvE!':SON, J.S.WELLS, F.R.PETERSEN, B.L.DANIELSON, G.W.DAY: App!.
Phys. Lett. 22. 192 (1973)4.102 A. JAVAN, A. S A ~ C H I o Z : In Laser Spectroscopy ed. by R. BREWER and A. MOORADIAN
(Plenum Press, N.Y. 1974) pp. 11 28
4.103 K. M. EVENSON, F. R. PETERSEN, J. S. WELLS: in Laser Spectroscopy, ed. by R. BREWER,
A.MoORADIAN (Plenum Press, N.Y. 1974) pp.143-156
4.104 A.S.PROVOROV, V.P.CHEBOTAYEV: Dok!. Akad. Nauk USSR 208, 318 (1973)
4.105 I. M.BETEROV, V.P.CHEBOTAYEV, A.S.PROVOROV: Opt. Commun. 7, 410 (1973)
4.106 R. L. ABRAMS: Digest of Technical Papers on VIII Intern. Quant. Electr. Conf.,
June 10-13. 1974, San Francisco, USA, p. 74
4.107 T. W. HANSCH, I. S. S H A H I ~ , A. L. SCHAWLOW: Phys. Rev. Letters 27, 707 (1971)
4.108 T.W.HANSCH, I.S.SHAHIN, A.L.SCHAWLOW: Nature 235, 63 (1972)
4.109 T.W.HANSCH: Appl. Opt. 11,895 (1972)
4.110 R.L.BARGER, M.S.SOREM. J.L.HAI.L: App!. Phys. Lctt. 28, 573 (1973)
4.111 R.E.GROVE. F. Y. WL, L.A. HACKEL, R. G. Y O U ~ I A N S , S. EZEKIEL: Appl. Phys.
Lett. 23, 442 (1973)4.112 W.HARTIG, H.WALTHER: Appl. Phys.1.171 (1973)
4.113 V.S.LEToKHov, B.D.PAVLlK: Kvan tova i Elek tron ika 3, N 1 (1976)
4.114 S. R. BRIJECK, A. MOORADIA!':: IEEE J. QE-IO, 634 (1974)
4.115 C.K.N.PATEL: Appl. Phys. Lett. 25,112 (1974)
4.116 J. L. HALL: Report on IV Vavilov Nonlinear Optics Conference, Junc 1975, Novo-
sibirsk, USSR
4.117 V. S. LEToKHov: Phys. Letters 41A. 333 (1972)
4.118 V.S.LEToKHov: Phys. Lett ers 53A, 275 (1975)
4.119 PH.CAHUZAC, R. VETTER: Phys. Rev. Letters 34,1070 (1975)
4.120 T.W.HANSCH, M.H.NAYFEH, S.A.La, S.M.CURRY, I. S.SHAHI!':: Phys. Rev.
Letters 32. 1336 (1974)
4.121 T. W. HANscH, M. D. L E v E N s o ~ , A. L. SCHAWLOW: Phys. Rev. Letters 26, 946 (1971)
506 (1971)
4.124 T. W. MEYER, J. F. BRILANDO. C. K. RHODES: Chern. Phys. Lett. 18. 382 (1973)
4.125 O.N.KoMPANETZ, A.R.KoOKOODJANOV, V.S.LEToKHov, V.G.MI!,:OGIN, E.L.
MIKHAILOV: Zh. Eksper. I. Teor. Fiz. 69, 32 (1975)
4.126 Comite Consultatif pour la Definition du Metre, 5th session, Rapport (Bureau
International des Poids et Mesures, Serves, France 1973)
4.127 A.JAVAN: in Fundamental and Applied Laser Physics, ed. by M.S.FELD, A.JAVAN,
N.KuRNIT (Wiley-Interscience Pub!. 1973) pp. 295-334
4.128 J.DATCHARY, M.DucLOY: Compt. Rend. Acad. Sc. 2748, 337 (1972)
4.129 M.P.GORzA, B.DEcoMPs, M.DuCLOY: Optics Comm. 8, 323 (1973)4.130 M .DuMoNT: J. Phys. 33, 971 (1972)
4.131 B.DEcoMPs, M.DuMoNT, M.DucLOY: Linea r and Non linea r Phenom ena in Laser
Optical Pumping; in Topics in Applied Physics, Vol. 2: Laser Spectroscopy of Atoms
and Molecules, ed. by H. WALTHER (Springer, Berlin', Heidelberg, New York 1976)
4.132 R.G.BREWER, M.J.KELLY, A.JAVAN: Phys. Rev. Letters 23,559 (1969)
4.133 R.G.BREWER, J.D.SWALEN: J. Chern. Phys. 52, 2774 (1970)
4.134 M. J. KELI.Y, R. E. F R A ~ C K E , M. S. FELD: J. Chern. Phys. 53, 2979 (1970)
4.135 A. C. LLNTZ, 1. D. SWALEN, R. G. BREWER: Chern. Phys. Lett. 14, 512 (1972)
4.136 S. M. FREUND, G. DUXBURY, M. Rt)MHELD, J. T. TIEDJE, T.OKA: J. Molec. Spectr. 52,
38 (1974)
4. 1:17 A. C. Lu:--nz. R. G. BREWER: J. Chern. Phys. 54. 3641 (1971)
4.138 K. UEHARA: J. Phys. Soc. Japan, 34, 777 (1973)
4. LW A. C. LUNTz, R. G. BREWER: J. Chern. Phys. 53, 3380 (1970)
4.140 A.JAVAN: Report on 2nd Intern. Laser Spectroscopy Conf., 23-27 June 1975,Megeve, France
4.141 P. W. SMITH: J. Appl. Phys. 37, 2089 (1966)
4.142 G.A. MIKHENKO, E. D. PROTZENKO: Optica and Spectr. 30. 668 (1969)
4.143 W. DIETEL: Phys. Lett. 29A, 268 (1969)
4.144 A. SZOKE, A.JAVAK: Phys. Rev. 145, 137 (1966)
4.145 S.N.BAGAEV. Yu.D.KoLOMNIKOV, V.N.LISITSYN, V.P.CHEBOTAYEV: IEEE J.
QE-4, 868 (1968)
4.146 T.R.SOSKOWSKI. W.B.JOHNSOK: IEEE 1. QE-4, 56 (1968)
4.147 K. A. BIKMUHAMETOV, B. M. KUMENT'EV, V. P. CHEBOTAYEV: Soviet Quant. Electr.
3,74 (1972)
4.148 L.S.VASILENKO, M.N.SKVORTZOV, V.P.CHEBOTAYEV, G.I.SHERSHNEVA, A.V.
SHISHAEV: Optika I Spektroskopia. 32, 1123 (1972)
4.149 YL.A.MATIUGIN, A. S.PROVOROV, V.P.CHEBOTAYEV: Zh. Eksper. I Teor. Fiz. 63,
2043 (1972)4.150 I.M.BETEROV, YL.A.MATUGIN, S.H.RALTIAN, V.P.CHEBOTAYEV: Zh. Eksper. i
Teor. Fiz. 58,1243 (1970)
4.151 1M THEK-DE. A.P.KAZA!\:TZEV, S.G.RAUTIAN, E.G.SAPRIKIN, A.M.SHALAGIN:
Smiet Quant. Elcctr. 1. 41() (1974)
4.152 O. N. KOMPANETZ, A. R. KOOKOODJANOV, V. S. LEToKHov, E. L. MIKIIAILOV: Kvan
tovai Elektronika, N 16,28 (1973)
4.153 L. S. VASILENKO: Thesis, Novosibirsk, Physics Semiconductor Institute, Siberian
Branch of Academy of Sciences USSR (1971)
4.154 S.N.BAGAEV, E.V.BAKLANOV, V.P.CHEBOTAYEV: Pis'ma Zh. Eksper. I. Teor. Fiz.
16, 15 (1972)
4.155 S. N. BAGAEV, E. V. BAKLANOV, V. P. CHEBOTAYEV: Pis'ma Zh. Eksper. I. Teor. Fiz.
16,344 (1972)
170 V. S. LETOKHOV
4.156 V.A.AuKSEEV, T.L.ANDREEVA, LLSOBEL'MAN: Zh. Ekspcr. i Teor. Fiz. 64, 813
(1973)
Saturation Spectroscopy 171
4.191 Yu.M.MALcsHEv, V.M.TATAREI'KOV, A.N.TlTov: Pis'ma Zh. Eksper. Teor.
8/3/2019 SAS Chapter4
http://slidepdf.com/reader/full/sas-chapter4 39/39
4.157 S. N. BAGAEV, A. K. DMITRIEV, V. P. CHEBOTAYEV: Pis'ma Zh. Eksper. i Tear. Fiz.
15, 91 (1972)
4.158 J. W.C.JOHNS, A. R. W. McKELLAR, T.OKA, M. ROMHELD: 1. Chern. Phys. 62. 1488
(1975)
4.159 G. R. HANES, K. M. BAIRD, J. DEREMIGIS: App!. Opt. 12, 1600 (1973)
4.160 A .. .WALLARD: J. Phys. E: Sci.lnstr. 5,926 (1972)
4.161 W.G.SCHWEITZER. JR., E.G. KESSLER, JR., R.D.DcsLATTES, B.P.LAYER. l.R.
WETSTONE: Appl. Opt. 12,2927 (1973)
4.162 K.M.EvENSON, J.s. WELLS, F.R.PETERSEN. B.L.DAl'IELSON, G.W.DAY, R.L.
BARGER, l. L. HALL: Phys. Rev. Lett. 29, 1346 (1972)4.163 K. M. EVENSON. F. R. PETERSEN: Laser Frequency Measurements, the Speed of
Light, and the Meter: in Topics in Applied Physics. Va!. 2: Laser Spectroscopy of
Atoms and Molecules. ed. by H. WALTHER (Springer, Berlin, Heidelberg, New York
1976)
4.164 F. R. PETERSEN, D.G. McDONALD, J. D.Cupp, B. L.DANIELSON: Phys. Rev. Lett. 31.
573 (1973)
4.165 F.R.PETERSEN, D.G.McDoNALD, .I.D.Cupp, B.L.DANIELSON: in Laser Spectros-
copy; ed. by R. BREWER and A. MOORADIAN (Plenum Press, New York 1973) pp.
555-569
4.166 V.S.LETOKHOV: Pis'ma Zh. Eksper. I Teor. Fiz. 16,428 (1972)
4.167 V. S. LETOKHOV: Phys. Rev. Letters 30.729 (1973)
4.168 V S. LETOKHOV: Phys. Letters 43A. 179 (1973)
4.169 V. S. LETOKHOV: Phys. Rev. A 12. 1954 (1975)
4.170 L.N.lvANOV. V.S.LETOKHOV: Zh. Eksper. i Teor. Fiz. 68,1748 (1975)
4.171 V. S. LETOKHOV: Phys. Letters 49A, 275 (1974)
4.172 V.l.GOL'DANSKII: Physical Chemistry oj Positron and Posilronium (Pub!. "Nauka".
Moscow 1968)
4.173 K.F.CANTER, A.P.MIL LS, S.BERKO: Phys. Rev. L ette rs 34. 277 (1975)
4.174 A.P.Mn.Ls, S.BERKO. K.F.CANTER: Phys. Rev Letters 34,1541 (1975)
4.175 E.F.GROSS, S.A.PER!.IAGOROV, B.S. RAZBIRIN: Z. Phys. Ch. Sol. 27,1647 (1966):
SOY. J. of Solid State Phys. 8, 1483 (1966)
4.176 A.T.MATTICK, N.A.KuRNlT. A.JAvA". Lecture Note I by JAVAI' in Les-Bouches
Summer School for Theoretical Physics, July 1975. Les-Bouches. France
4.177 V.P.C!1EllOTAYEV, T.M.BETEROv, V.N.LISlTSYN: IEEE J. QE-4, 788 (1968)
4.178 V.N.LISITSYN. V.P.CHEBOTAYEV: Zh. Eksper.1. Teor. Fiz. 54. 419 (1968)
4.179 V.M.TATARENKOV. A.N.TITOV, A.V.USPENSKY: Optika I Spectroscopia 28,572
(1970)
4.180 V. M. T ATARENKOV, A.:-1. TITOv: Optika I Spectroscopia 30. 803 (1971)
4.181 G.R. HANES. K.M.BAIRD. MctroJogia, 5, 32 (1969)
4.182 G. R. HANES, C. E. DAHLSTROM: App!. Phys. Letters 14. 362 (1969)
4.183 1. D. KNOX. YClH-HAN PAO: App!. Phys. Letters 16. 129 (1970)
4.184 .l.T.LAToURETTE, R.S.ENG: IEEEJ. QE-8. 561 (1972)
4.185 W.G.SCHWEITZER, JR.: App!. Phys. Letters 13, 367 (1968)
4.186 V.XLISlTSYK V.P.CHEBOTAYEV: Optika I Spectroscopia 26. 856 (1969)
4.187 N.G. BAsov. M. V. DAI'ILEIKO, V. V. NIKITlN: Zh. Prikl. Spectroscopii 11. 543 (1969)
4.188 S.N.BAGAEV, V.P.CHEBOTAYEV. Pis'ma Zh. Eksper. I Teor. Fiz. 15,91 (1972)
4.189 R. L. BARGER, .I. L. HAu.: App!. Phys. Letters 22, 196 (1973)
4.190 S.N.BAGAEV, E.V.BAKLAl'oV, E.TITOV. V.P.CHEBOTAYEV: Pis'rna Zh. Eksper. I.Teor. Fiz. 20. 292 (1974)
Fiz. 13,592 (1971)
4.192 L.S.VASILENKO, V.P.CHEBOTAYEV. G.I.SHERSHNEVA: Optika I Spectroscopia 19,
204 (1970)
4.193 T. KAN, G . .I. VOLGA: IEEE J. QE-7, 141 (1971)
4.194 P. W. SMITH, T. HANSCH: Phys. Rev. Letters 26. 740 (1971)
4.195 C. BORDE: C. R. Acad. Sci. Paris 271,371 (1970)
4.196 P.RABI:-.IOWlTZ, R.KELLER, J. T.LA TOURETTE: App!. Phys. Letters 14. 376 (1969)
4.197 F.SHIMIZL: App!. Phys. Lett. 14,378 (1969)
4.198 F.R.PETERSEN. B.L.DANIELSEN: Bull. Amer. Phys. Soc. 15. N ll (1970)
4.199 I. M. BETEROV, L. S. VASILENKO. B. GA:-.iGARDT. V. P. CHEBOTAYEV: K vantovai Elek
tronika 1. 970 (1974)4.200 YU.A.GOROKHOV, O.N.KoMPANETZ. V.S.LnoKHov, G.A.GERASIMOV, Yu.J.
POSUDlN: Opt. Comrnun. 7, 320 (1973)
4.201 C.COSTAIN: Canad. J. Physics 47, 2431 (1969)
4.202 R.S. WINTO". W.GORDY: Phys. Letters 32A. 219 (1970)


