
TM
SASB Standard for Oil & Gas - Exploration & ProductionExample of Integrated Disclosure in Form 10-KJuly 30, 2014
The information, text, and graphics in this publication (the “Content”) is owned by Sustainability Accounting Standards Board. All rights
reserved. You may use the Content only for non-commercial and scholarly use, provided that you keep intact all copyright and other
proprietary notices related to the Content, and that you make no modifications to the Content. The Content may not be otherwise
disseminated, distributed, republished, reproduced, or modified without the prior written permission of Sustainability Accounting Standards
Board. To request permission, please contact us at [email protected].
© 2014 SUSTAINABILITY ACCOUNTING STANDARDS BOARD
© 2014 SUSTAINABILITY ACCOUNTING STANDARDS BOARD
UNITED STATES
SECURITIES AND EXCHANGE COMMISSION
Washington, D.C. 20549
Form 10-K
(Mark One)
ANNUAL REPORT PURSUANT TO SECTION 13 OR 15(d) OF THE
SECURITIES EXCHANGE ACT OF 1934 For the fiscal year ended December 31, 2014
OR
TRANSITION REPORT PURSUANT TO SECTION 13 OR 15(d) OF
THE SECURITIES EXCHANGE ACT OF 1934 Commission file number 000-12345
Harris Robinson Energy, Inc. (Exact name of registrant as specified in its charter)
Delaware 99-999999 (State or other jurisdiction of
incorporation or organization)
(I.R.S. Employer
Identification No.)
47 Marks St.,
Houston, Texas
(Address of principal executive offices)
77002-1111
(Zip Code)
…
Item 7. MANAGEMENT’S DISCUSSION AND ANALYSIS OF FINANCIAL CONDITION AND
RESULTS OF OPERATIONS
Sustainability Performance
Overview
The Board of Directors has delegated to the Integrated Sustainability Review Committee matters
relating to corporate governance and responsibility for promoting sustainable management of the
Company’s activities. The Committee reviews internal compliance with sustainability codes and principles
across all business units, supervises compliance with environmental, health, and safety matters, conducts
scenario planning for impacts related to environmental and social trends and uncertainties, and assists the
Board of Directors in determining material sustainability issues for disclosure herein.
The Company conducted an assessment to determine sustainability-related risks and opportunities
it faces using the Sustainability Accounting Standards Board’s (SASB) Sustainability Accounting Standard
– Oil & Gas Exploration & Production (NR0101). We determined that all disclosure topics identified by

© 2014 SUSTAINABILITY ACCOUNTING STANDARDS BOARD
SASB represent trends and uncertainties that may have material impacts on the financial condition or
operational performance of the Company. The following is a discussion and disclosure of our performance
on 10 sustainability topics. For ease of interpretation, Table 1, below, summarizes all quantitative metrics
presented throughout this section. Table 2, below, includes “activity-level” metrics that are measures of the
scale of our business activity and may provide context for the interpretation of our performance on the
various environmental and social factors discussed throughout this section.
Greenhouse Gas Emissions
Many of the Company’s normal operations involve the combustion of fossil fuels to produce
energy, and thus we emit greenhouse gases (GHGs). The sources of these emissions vary based on the
activities in which we are engaged and the type of fuel we are using. The Company monitors its use of
energy inputs as well as its emissions of GHGs, both in accordance with applicable laws and regulations
and to improve its overall efficiency. The Company attempts to be as efficient as possible in its energy use
in order to avoid unnecessary emissions.
Gross global Scope 1 emissions
In 2013, we acquired two medium-sized oil exploration firms, which allowed us to expand our
operations in North Dakota, Montana, and Alberta, Canada. These acquisitions accounted for 1 million
metric tons CO2-e of the increase in the Company’s total Scope 1 emissions from 2012 to 2013. As we
continue to integrate these firms into the Company, we will review these emissions and, as necessary,
implement practices to ensure energy is used as efficiently as possible.
In some of the areas in which we operate, these emissions are regulated, primarily in California
under the Global Warming Solutions Act and in Norway under the European Union Emissions Trading
System. In the future, more of the areas in which we operate that are currently not subject to regulation may
become regulated, and existing regulations may become more stringent. To the extent that regulations
increase, operating costs may also increase.
Gross global Scope 1 emissions by operational source
Because the Company is involved in diverse exploration and production operations, its emissions
come from multiple sources. These emissions are a normal byproduct of necessary operational practices,
such as gas compression or well testing. We attempt to minimize fugitive emissions and leaks, largely
because they represent operational inefficiencies and could present safety risks to employees.
Year Ended December 31,
Metric 2012 2013 2014
Gross global Scope 1 emissions (in thousands of metric tons CO2-e) 6,525 7,765 7,762 Percentage from
Conventional oil operations 63% 47% 45%
Unconventional oil operations 2% 9% 11%
Conventional gas operations 35% 32% 31%
Unconventional gas operations 0% 12% 13%
Percentage covered under a regulatory program 3% 3% 3%
Year Ended December 31,
Metric 2012 2013 2014
Gross global Scope 1 emissions from (in thousands of metric tons CO2-e) Combustion 5,546 6,591 6,598
Flared hydrocarbons 326 388 388
Process emissions 457 543 543
Directly vented releases 326 388 388
Fugitive emissions and leaks 196 233 237

© 2014 SUSTAINABILITY ACCOUNTING STANDARDS BOARD
Strategy to manage Scope 1 emissions
In addition to our everyday efforts to most efficiently use resources, we are incorporating
improved emission-monitoring capabilities into our operations. To date, we have monitored emissions by
performing engineering calculations, which we believe to be reliable and informative. However, to gain a
more detailed understanding of our emissions, we added continuous emissions monitoring systems (CEMS)
to our equipment in the third quarter of 2014.
This addition is the first step in our new Energy Efficiency Initiative (EEI), which was
implemented Company-wide on January 1, 2014. As part of this initiative, the Company plans to reduce
gross global Scope 1 emissions by 2 percent from 2013 levels by 2018, as calculated on an absolute scale.
Given the diverse locations of our operations, we will rely on those in more developed areas, such as
Canada and the United States, for most of these reductions. We will focus our efforts on energy efficiency
to achieve these reductions, and upon achievement, we will review how to further reduce future emissions.
We will also launch a Company-wide employee education program to ensure all employees understand and
implement energy efficiency practices.
We expect to be able to incorporate EEI-related investments and activities into our operations
without material disruptions to our financial performance. However, achieving the reduction targets set by
the EEI will depend on a variety of factors. If our assumptions about potential efficiency gains—and the
costs necessary to achieve them— are incorrect, we may need to adjust our operations to a greater extent
than initially anticipated. This process could include incurring unanticipated costs. Alternatively, we may
need to adjust our targets in order to balance meeting energy efficiency and financial targets.
Air Quality
The Company’s commitment to being as efficient as possible in its use of resources extends to all
its operations, which, by their nature, emit oxides of nitrogen and sulfur, Volatile Organic Compounds
(VOCs), and Particulate Matter (PM). We recognize that controlling these emissions plays a role in
maintaining good relations with the communities in which we operate and that such relations are important
to our ongoing ability to operate effectively.
Air emissions from oxides of nitrogen and sulfur, VOCs, and PM
The Company tracks emissions of NO2, SO2, VOCs, and particulate matter through a combination
of direct, continuous monitoring and engineering calculations, which we believe to be reliable and
informative. The CEMS added to our equipment in the third quarter of this year will provide more detailed
and comprehensive direct measurements of our emissions of these substances. We will continuously review
the data from these systems, and once we have accumulated sufficient data, we plan to implement
improvements to reduce these emissions to the extent possible.
Water Management
The Company uses water in many of its exploration and production activities and attempts to
reduce wastewater and recycle water whenever possible. We also acknowledge that water is increasingly
being recognized as a precious resource and may cost more in the future than it does today. To mitigate this
risk, we invested $4 million in 2013 to research methods to both decrease our water usage and increase our
water recycling rates. To the extent that water costs rise and/or water regulations increase, we may find that
entering new geographical regions or extracting resources from certain existing fields becomes financially
Year Ended December 31,
Metric 2012 2013 2014
Air emissions from (in metric tons) NO2 8,040 9,525 10,300
SO2 7,400 8,700 8,950
Non-methane VOCs 11,050 13,720 14,200
PM 4,476 7,500 7,000

© 2014 SUSTAINABILITY ACCOUNTING STANDARDS BOARD
infeasible. This risk is heightened in areas with high baseline water stress and in areas where public
scrutiny of water usage is elevated. Operations in either type of area may be subject to increased regulation
and increased competition for water resources. However, as we implement improved efficiency methods,
from both our own research and that of others, we may find the cost of such exploration and extraction
falls. We continuously review potential methods to increase the efficiency of our water use.
Fresh water usage, recycling, and usage in water-stressed areas
Our 2013 acquisitions increased our overall water usage as well as the percentage of water
withdrawn in regions with high or extremely high baseline water stress. As we fully integrate these firms
into the Company, we will review ways to conserve water.
Volume of produced water and flowback generated
Water is a normal byproduct of the Company’s operations, and that water generally contains
hydrocarbons. With both onshore and offshore operations, the Company engages in multiple practices to
manage, treat, transport, and recycle produced water, in accordance with applicable local regulations. In
2013, the treatment systems at one of the Company’s offshore drilling stations malfunctioned, resulting in
discharge into the Gulf of Mexico of several thousand cubic meters of untreated produced water. In
response, the U.S. Environmental Protection Agency (EPA) fined the Company $75,000 and mandated a
review of all of the Company’s offshore produced-water management systems, at a cost of approximately
$2 million. The review, which was completed in the second quarter of last year, revealed that three other
offshore drilling stations had systems at risk of failure. The Company completed repairs of these systems in
the fourth quarter of last year. If similar incidents occur, the Company could be subject to financial
consequences, such as additional regulatory fines and remediation costs, and reputational risk. We are
committed to improving our operations in order to reduce risk and protect our ability to operate.
Percentage of hydraulically fractured wells with public disclosure of fluid chemicals used
In addition to giving the Company access to new operational geographies, the Company’s 2013
acquisitions substantially increased the number of hydraulically fractured wells under the Company’s
control. As noted, we are still fully integrating these acquired firms, which did not publicly disclose the
chemical composition of their fracturing fluids. The Company is in the process of reviewing these fluids
and evaluating public disclosure of them. In that evaluation, the Company will balance its need to protect
its intellectual property with its needs to maintain good relations with the communities in which it operates
and to comply with all applicable regulations.
Prior to its acquisitions, the Company operated a small number of hydraulically fractured wells,
for which it did publicly disclose the contents of the fracturing fluids used. In one region in which the
Company operates, public disclosure of these fluids is currently mandated, and in others it may become
mandated in the near future. It is likely that the percentage of wells for which we publicly disclose
information about chemicals contained in the fracturing fluid will increase in the future.
Year Ended December 31,
Metric 2012 2013 2014
Total fresh water withdrawn (in thousands of cubic meters) 1,753 1,994 2,050 Percentage recycled 12% 12% 14%
Percentage in regions with high/extremely high baseline water stress 3% 4% 6%
Year Ended December 31,
Metric 2012 2013 2014
Produced water and flowback fluid generated (in thousands of cubic meters) 2,100 2,500 2,550 Percentage discharged 48% 54% 52%
Percentage injected 43% 39% 40%
Percentage recycled 9% 7% 8%
Hydrocarbons present in produced water and flowback (in metric tons) 14,000 17,000 18,000
© 2014 SUSTAINABILITY ACCOUNTING STANDARDS BOARD
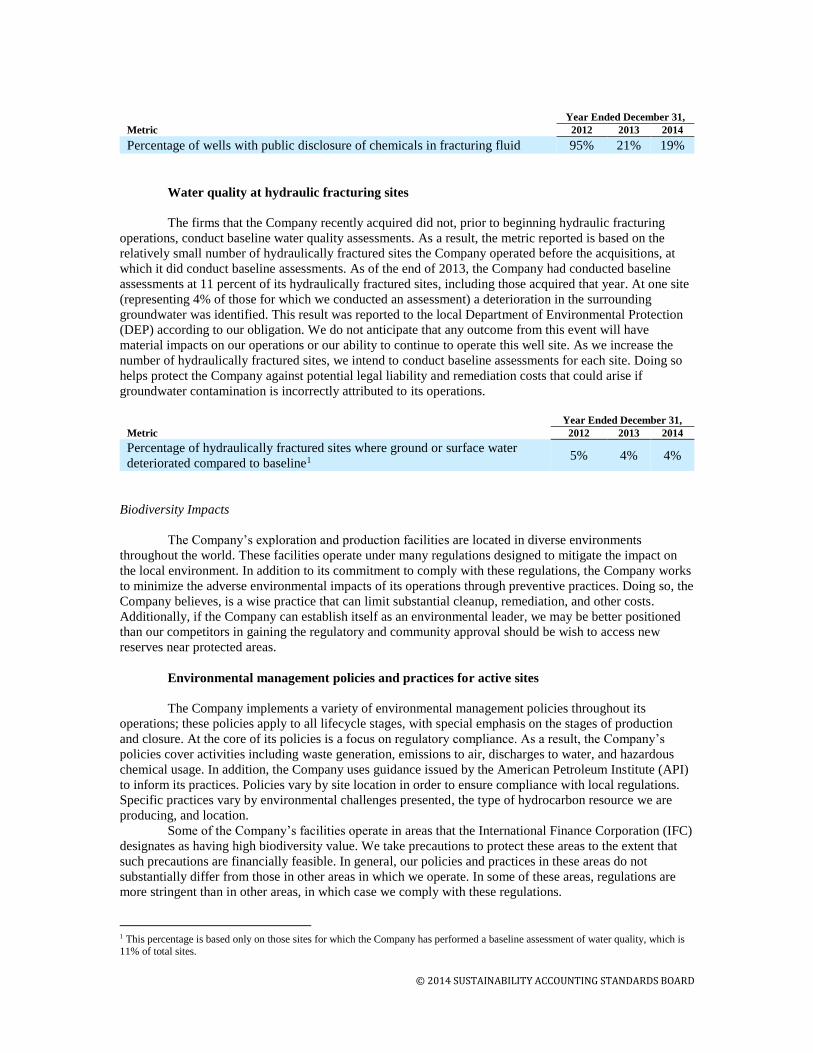
Water quality at hydraulic fracturing sites
The firms that the Company recently acquired did not, prior to beginning hydraulic fracturing
operations, conduct baseline water quality assessments. As a result, the metric reported is based on the
relatively small number of hydraulically fractured sites the Company operated before the acquisitions, at
which it did conduct baseline assessments. As of the end of 2013, the Company had conducted baseline
assessments at 11 percent of its hydraulically fractured sites, including those acquired that year. At one site
(representing 4% of those for which we conducted an assessment) a deterioration in the surrounding
groundwater was identified. This result was reported to the local Department of Environmental Protection
(DEP) according to our obligation. We do not anticipate that any outcome from this event will have
material impacts on our operations or our ability to continue to operate this well site. As we increase the
number of hydraulically fractured sites, we intend to conduct baseline assessments for each site. Doing so
helps protect the Company against potential legal liability and remediation costs that could arise if
groundwater contamination is incorrectly attributed to its operations.
Biodiversity Impacts
The Company’s exploration and production facilities are located in diverse environments
throughout the world. These facilities operate under many regulations designed to mitigate the impact on
the local environment. In addition to its commitment to comply with these regulations, the Company works
to minimize the adverse environmental impacts of its operations through preventive practices. Doing so, the
Company believes, is a wise practice that can limit substantial cleanup, remediation, and other costs.
Additionally, if the Company can establish itself as an environmental leader, we may be better positioned
than our competitors in gaining the regulatory and community approval should be wish to access new
reserves near protected areas.
Environmental management policies and practices for active sites
The Company implements a variety of environmental management policies throughout its
operations; these policies apply to all lifecycle stages, with special emphasis on the stages of production
and closure. At the core of its policies is a focus on regulatory compliance. As a result, the Company’s
policies cover activities including waste generation, emissions to air, discharges to water, and hazardous
chemical usage. In addition, the Company uses guidance issued by the American Petroleum Institute (API)
to inform its practices. Policies vary by site location in order to ensure compliance with local regulations.
Specific practices vary by environmental challenges presented, the type of hydrocarbon resource we are
producing, and location.
Some of the Company’s facilities operate in areas that the International Finance Corporation (IFC)
designates as having high biodiversity value. We take precautions to protect these areas to the extent that
such precautions are financially feasible. In general, our policies and practices in these areas do not
substantially differ from those in other areas in which we operate. In some of these areas, regulations are
more stringent than in other areas, in which case we comply with these regulations.
1 This percentage is based only on those sites for which the Company has performed a baseline assessment of water quality, which is 11% of total sites.
Year Ended December 31,
Metric 2012 2013 2014
Percentage of wells with public disclosure of chemicals in fracturing fluid 95% 21% 19%
Year Ended December 31,
Metric 2012 2013 2014
Percentage of hydraulically fractured sites where ground or surface water
deteriorated compared to baseline1 5% 4% 4%

© 2014 SUSTAINABILITY ACCOUNTING STANDARDS BOARD
The Company has reviewed the IFC’s Performance Standards on Environmental and Social
Sustainability, particularly standards 1, 3, 4, and 6. The Company’s focus is to assess risks and make
decisions based on both short- and long-term impacts to shareholder value. As a result, it does engage in
some of the activities required by the IFC standards, but not all. In addition, many of these activities are
incorporated into the Company’s normal management, analysis, and operational functions rather than
separated as individual activities or systems. Some of the activities prescribed by the IFC standards do not
provide, in the Company’s assessment, sufficient benefits to justify their costs.
Hydrocarbon spills
The Company makes substantial efforts to prevent hydrocarbon spills. However, spills occur,
sometimes as a result of hurricanes or other natural disasters beyond our control and sometimes as a result
of sabotage to our operations. Other spills result when measures to prevent them fail. For example, in 2014,
a section of pipeline that serves the Company’s operations along the northern coast of Alaska froze due to a
malfunctioning temperature sensor, causing a spill of approximately 9,400 bbl of crude oil into the Beaufort
Sea. In accordance with its policies, the Company helped fund the cleanup efforts, which did recover a
portion of the spilled oil. A similar incident occurred in 2012, also due to a malfunctioning temperature
sensor. The malfunctioning sensors have been replaced, and other sensors in the pipeline were inspected to
ensure they were functioning properly. Please note that the volume recovered does not include oil that
evaporated, which we estimate to be approximately 20 percent of the total spilled. The company incurs
costs associated with the cleanup of each hydrocarbon spill, particularly when they occur in Arctic areas
which requires more costly and time-intensive recovery. Significant spills could result in cleanup costs,
fines, and potentially settlements with individuals affected.
Reserves in or near protected sites
In general, the Company prefers to avoid securing reserves that exist in areas with protected
conservation status or endangered species habitat, largely because of the uncertainty surrounding the
Company’s ability to extract these resources in the future. Regulations governing this extraction may
become substantially more stringent, an event which is likely to increase operational costs; these increases
could make withdrawing resources from these reserves prohibitively expensive. However, some of the
Company’s reserves do exist in these areas. To the extent that regulations governing these areas change as
the Company expects them to, the potential value of these reserves may decline. The Company’s 2013
acquisitions slightly increased its oil reserves in these areas. Separately, improved measurements of
probable gas reserves reduced the 2013 and 2014 estimates as compared to 2012 estimates.
Year Ended December 31,
Metric 2012 2013 2014
Number of hydrocarbon spills 77 82 93 Volume of hydrocarbon spills (in bbls) 10,805 13,926 28,220
Volume of spills in the Arctic (in bbls) 4,200 2,920 12,040
Volume of spills near shorelines with ESI levels 8 to 10 (in bbls) 3,800 5,858 10,700
Volume recovered (in bbls) 702 1,115 2,060
Year Ended December 31,
Metric 2012 2013 2014
Proved oil reserves in or near sites with protected conservation status or
endangered species habitat (in MMbbls) 18 21 21
Probable oil reserves in or near sites with protected conservation status or
endangered species habitat (in MMbbls) 12 14 14
Proved gas reserves in or near sites with protected conservation status or
endangered species habitat (in MMscf) 515 502 490

© 2014 SUSTAINABILITY ACCOUNTING STANDARDS BOARD
Security, Human Rights, and Rights of Indigenous Peoples
In general, the Company attempts to avoid causing harm to people, including its own employees
and others affected by its operations. We consider the potential to cause harm a risk that requires careful
management. Many of the regions in which we operate have not only strict regulations but also
sophisticated legal systems that grant people who believe they are harmed by oil and gas activities various
methods of recourse. We prefer to avoid being the subject of legal action, to the extent practicable.
Reserves in or near areas of conflict
In accordance with its efforts to operate efficiently, the Company works to avoid operating in
certain regions, particularly areas of conflict. The security and other costs associated with these operations
can prove high, and the Company prefers to avoid incurring this type of risk. However, it is not possible to
predict what conflicts may arise in the future and where they may arise.
Reserves in or near indigenous land
Since 2002, the Company has been exploring and, to some extent, producing oil and gas in two
regions in Australia: Western Australia and the Northern Territory. Aboriginal Australians are the
predominant population in these areas. Our 2013 acquisitions increased our reserves in or near Native
American Indian reservations in North Dakota. It is possible that we may not be able to access some of
these reserves, if indigenous communities begin to oppose our operations. At this time, we believe that risk
is low, but that assessment may change if local conditions change. Since our operations began in Australia,
we have occasionally engaged with the local indigenous communities, to the extent required by law. As we
continue to integrate our recent acquisitions into our operations, we will review our engagement procedures
in North America.
Due diligence practices with respect to human rights, indigenous rights, and operation in
areas of conflict
The Company works with local authorities and non-governmental organizations to determine how
to communicate with indigenous peoples affected by its operations. None of the countries in which we
operate has ratified International Labour Organization (ILO) Convention 169. As such, the convention is
not used as the basis for determining operational practices, nor does the Company engage in specific
consultation processes with indigenous groups except as legally required. However, the Company complies
Probable gas reserves in or near sites with protected conservation status or
endangered species habitat (in MMscf) 230 200 190
Year Ended December 31,
Metric 2012 2013 2014
Proved oil reserves in or near areas of active conflict (in MMbbls) 0 0 0 Probable oil reserves in or near areas of active conflict (in MMbbls) 0 0 0
Proved gas reserves in/near conflict zones (in MMscf)
0 0 0
Probable gas reserves in/near conflict zones (in MMscf)
0 0 0
Year Ended December 31,
Metric 2012 2013 2014
Proved oil reserves in or near areas of indigenous land (in MMbbls) 36 45 45 Probable oil reserves in or near areas of indigenous land (in MMbbls) 22 39 41
Proved gas reserves in/near indigenous land (in MMscf)
350 450 420
Probable gas reserves in/near indigenous land (in MMscf)
475 400 380

© 2014 SUSTAINABILITY ACCOUNTING STANDARDS BOARD
with regulations promulgated by all locales in which it operates, including those governing interactions
with indigenous peoples and activities on or near land they occupy. To the extent that these regulations
become more stringent or otherwise change substantially, the Company’s operating costs may increase.
The Company abides by all the elements of ILO conventions 29, 87, 98, 100, 105, and 111. We
audit all our operations annually to ensure compliance, and we include in employee training a summary of
employees’ rights under these conventions. If employees believe the Company is not complying with these
fundamental conventions, they are expected to report the matter to the corporate human resources
department. The Chief Operating Officer is notified of any complaints and oversees the investigation and
resolution process.
The Company acknowledges that an increasing number of legislative and regulatory bodies are
issuing guidance with respect to human rights and oil and gas exploration and production. Because it does
not currently operate within the European Union (EU), the Company has conducted only an initial review
of the European Commission’s “Oil and Gas Sector Guide on Implementing the UN Guiding Principles on
Business and Human Rights,” and is not, at this time, prepared to offer a thorough description of its
implementation of these principles. If and when the Company expands its operations into EU nations, it
will review the guidance again and describe its adherence to the principles
With respect to the Voluntary Principles on Security and Human Rights, we closely adhere to the
first principle, which governs risk assessment, largely because the principle’s elements represent sound
business practices. Furthermore, we adhere to several—but not all—elements of the other two principles,
which govern interactions between companies and public security and interactions between companies and
private security.
Currently, we do not operate in areas of conflict and generally prefer to avoid doing so. However,
as noted earlier, it is impossible to predict when and where conflicts may arise. Therefore, the Company
has reviewed the IPIECA’s “Guide to operating in areas of conflict for the oil and gas industry.” If and
when we either enter into an area in which conflict exists, or conflict arises in one of the countries in which
we operate, we will disclose any applicable practices and procedures.
Community Relations
As previously noted, the Company recognizes the importance of maintaining good relations with
the communities in which it operates. Strained relations introduce or exacerbate potential risks, such as
nationalization of resources, denied permits, or other disruptions to operations. These risks can, in turn,
affect the value of reserves, increase exploration and production costs, and potentially result in fines.
Processes to manage risks and opportunities associated with community rights and interests
We carefully assess community risks as part of our everyday activities. We strive to work in
concert with and respect local communities, to the extent reasonable and practicable. In accordance with
our policy, we rely on local authorities and regulatory bodies to introduce and enforce requirements that
meet their communities’ economic, environmental, and social and cultural needs. In addition, we fund
schools, technical skills training centers, and healthcare clinics in the communities near our West African
operations. These programs help improve the lives of everyone in these communities.
Given the Company’s preference to avoid developing assets in high-risk or high-uncertainty areas,
where regulations or other cost influences could increase substantially in the near future, it carefully
evaluates sites before bidding on them. Throughout the lifecycle of its activities, the Company relies on
sound business practices to ensure safe and effective operations. Once sites in West Africa are
decommissioned, which the Company does not expect to occur for many years, it plans to conduct post-
closure monitoring of environmental and socio-economic conditions.
Non-technical delays do occasionally occur as a result of disagreement with local communities,
and the Company recently had such a delay (please see “Number and duration of non-technical delays” for
more information). Another risk is the potential for nationalization of resources. The Company monitors
factors influencing these and other risks and, on a quarterly basis, the Board of Directors reviews them as
well as potential mitigation procedures. The assessment of social risks is integrated into our overall risk
assessment practices rather than separated into an individual function. We use what we believe are effective
analytical tools and frameworks in our assessments. Should an assessment indicate the need for high levels
of community engagement, we focus our efforts on working with community leaders and respected

© 2014 SUSTAINABILITY ACCOUNTING STANDARDS BOARD
community organizations. These efforts often take the form of meetings and discussions, but may also
include Company representatives touring local areas and meeting with local residents to understand their
concerns.
The Company has reviewed IFC Performance Standards on Environmental and Social
Sustainability—specifically standards 4, 5, and 8—and has incorporated elements of them into our
operations. Our operations substantially comply with standards 5 and 8. With respect to standard 4, we
generally rely on local authorities to ensure regulations meet their communities’ needs and follow these
regulations. We also seek to design, construct, operate, and decommission equipment in a way that reduces
risk to local communities. To the extent that affected communities have concerns or grievances about
Company operations, we attempt to work with them to understand and resolve the issues.
When working with business partners, the Company permits these partners to have their own
policies, procedures, and operational practices. The Company does expect, and contractually obligate, these
partners to follow all applicable laws and regulations.
The Company’s efforts to comply with regulations and maintain good community relations help
mitigate some of the risks that are specific to the places it operates. However, some locales present risks
over which the Company has only limited control.
In Ghana, we maintain good relations with the state-owned companies with which we work.
Ghana is a relatively stable country, and we believe it does not currently present undue political, economic,
or social risk.
Compared to Ghana, Guinea is less developed; it has also experienced recent political shifts,
which create uncertainty. The education and health of the local workforce also present risks. Many people
do not complete primary education in Guinea, and the country’s literacy rate is low. In addition, infectious
diseases, such as HIV, malaria, and Ebola, are prevalent. The Company needs both educated and healthy
workers to operate efficiently, and funds the aforementioned schools, training centers, and healthcare
clinics in part to help mitigate this risk. The Company has also implemented additional training measures in
Guinea, including literacy programs, to assist new workers and reduce risk. Still, the Company carries
insurance to cover losses stemming from an inability to operate. Our work in Guinea remains in the
exploration stage, and the premiums on this insurance are estimated to reduce the net present value of our
projects there by $430,000.
In the Russian Federation, the Company faces some political risk and corruption-related risk. The
Company does not knowingly participate in corruption, but to the extent that it competes with companies
that do participate, the Company may lose contracts or permits or experience delays.
Community and social concerns in the United States and Canada are generally translated into new
or additional regulations; this is the main social risk our North American operations are subject to. In
addition community members may express their concerns through protests, which are discussed below.
Non-technical delays
The Company experienced one significant non-technical delay in 2013, which affected operations
in Alaska. Environmental protestors climbed onto one of the Company’s offshore rigs and remained in
place for several days. Once the protestors were removed from the rig, operations resumed. The Company
estimates the delay cost $800,000 in lost and delayed revenues.
Health, Safety, and Emergency Management
We are committed to safety, both to protect our employees and our shareholders: safety is a wise
investment that pays off for everyone. Many of our 3,000 employees work in unique environments that
require special caution. Maintaining our ability to recruit skilled workers depends, in part, on our safety
record. It is these skilled workers who drive productivity, revenues, and shareholder value.
Year Ended December 31,
Metric 2012 2013 2014
Number of non-technical delays 0 1 0 Duration of non-technical delays (in days) 0 5 0

© 2014 SUSTAINABILITY ACCOUNTING STANDARDS BOARD
Total injury, fatality, and near-miss frequency rates
In classifying, identifying, and reporting near-miss accidents, we require all on-site supervisors to
report all incidents to the district manager, who works with the regional safety manager to understand the
nature of each incident. The regional safety manager uses internal guidelines to determine which incidents
are considered “near miss.” To ensure we implement high safety standards, incidents that are close to
meeting the criteria for a near miss are classified as such. Only those incidents that are clearly not near
misses are excluded from the data.
Process Safety Event rates for Tier 1 Loss of Primary Containment (LOPC)
The Company experienced 39 Tier 1 Loss of Primary Containment (LOPC) incidents in 2014,
down from 42 such events in 2012 and 49 in 2013.
Discussion of safety management systems and emergency preparedness plans
The Company prioritizes safety throughout its operations, especially in its training and in its
implementation of technology. We employ an enterprise-wide set of safety standards that, in many cases,
exceed regulatory mandates. The Chief Operating Officer (COO) regularly reviews compliance with these
standards and leads quarterly internal reviews of adherence to safety practices. In addition, we conduct
surprise safety inspections of many of our operations and promote close collaboration among regional
safety managers to ensure best practices are used throughout the organization. Contractors and sub-
contractors are expected and contractually obligated to follow all prescribed safety procedures and
emergency preparedness practices, including those that exceed local regulations.
We consistently review available monitoring technologies and install those we believe will be
most beneficial to our operations. In 2012, we upgraded many of the monitoring systems on our offshore
rigs to improve safety.
Employees are trained to report concerns about safety to their supervisors. We expect supervisors
to take all such reports seriously, investigate them, and act on them or escalate them as necessary.
In preparing for emergencies, regional safety managers draw up communication plans that all
employees, including contractors and sub-contractors, are expected to follow. During emergencies, the
Year Ended December 31,
Metric 2012 2013 2014
Total Recordable Injury Rate (TRIR)
Full-time employees .34 .37 .36
Contract employees .39 .36 .37
Short-service employees .4 .38 .37
Fatality Rate
Full-time employees .1 .034 .06
Contract employees .07 0 .03
Short-service employees .13 .17 0
Near Miss Frequency Rate
Full-time employees .34 .34 .3
Contract employees .4 .32 .39
Short-service employees .45 .37 .4
Year Ended December 31,
Metric 2012 2013 2014
PSE rate for Tier 1 LOPC 1.4 1.63 1.3

© 2014 SUSTAINABILITY ACCOUNTING STANDARDS BOARD
district manager(s) and regional safety manager work together with employees to implement all necessary
response procedures. These managers also serve as points of contact for questions or concerns from
contractors, sub-contractors, or local authorities.
Business Ethics & Payments Transparency
We strive to operate in a transparent, ethical manner, and we require all employees to follow both
Company policies and local laws. We recognize the importance of complying with anti-corruption, anti-
bribery, and other related laws and regulations, not only to maintain our license to operate but also to avoid
fines and penalties.
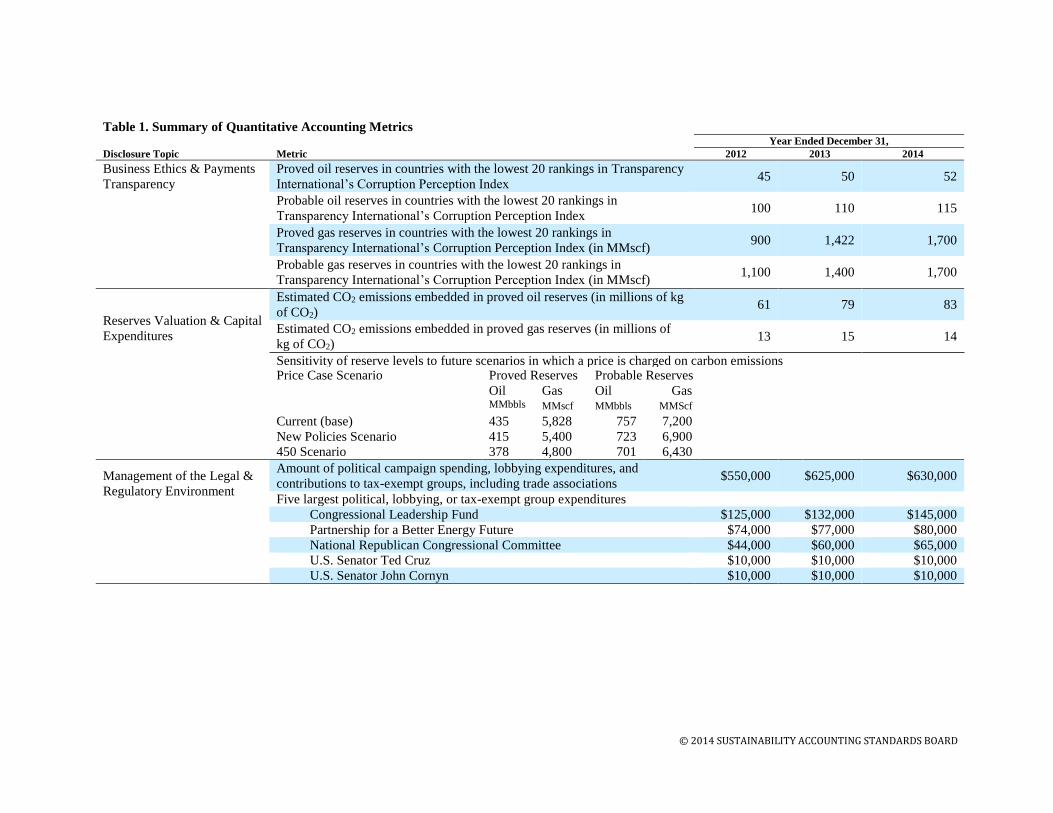
Reserves in countries with low corruption perception index rankings
Although we operate in countries perceived to be at risk for corruption, we make substantial
efforts to adhere to highly ethical practices throughout our operations. Despite our efforts, however, our
operations in these countries may be more costly and time-consuming than those in other countries. For
instance, the time required to obtain an operating permit may be longer due to forces beyond our control.
To the extent that permits, licenses, and other necessary business clearances are unobtainable through
ethical means, it may not be possible to extract all our reserves, which could adversely affect revenues and
shareholder value.
The Company operates in two countries that Transparency International (TI) has assigned low
rankings in its Corruption Perception Index (CPI): Guinea, ranked 150, and Russia, ranked 127.
Management systems to prevent corruption and bribery
The Company does not tolerate corruption or bribery from any of its employees, contractors, sub-
contractors, or joint venture partners. The Chief Executive Officer reinforces this message through
Company-wide messaging and personal interactions with employees, including executives and senior
managers. We also employ an anti-corruption officer who oversees our implementation of the International
Chamber of Commerce (ICC) Rules of Conduct against Extortion and Bribery (2005 edition).
During initial training, employees are instructed that engaging in corruption, bribery, or other
unethical business practices is grounds for termination. Employees are also required to review annually the
Company’s ethics policy. Employees who suspect unethical behavior is occurring are required to report
their suspicions to their supervisors, who are required to work with the anti-corruption officer to investigate
the matter.
Both Ghana and Guinea are members of the Extractive Industry Transparency Initiative (EITI),
and the Company participates in full disclosure of EITI measures in those countries. The United States is a
candidate country, and Russia has not yet declared its candidacy. Should these countries become EITI-
compliant, the Company will participate in disclosure there.
The Company also screens its business partners, including local consultants engaged outside the
U.S. to assist in business dealings. These screenings take place both before a partner is hired and
throughout the course of the relationship. The anti-corruption officer and her team review the partner’s
track record and reputation and require clear, detailed accountings for all expenses. In some cases, the anti-
Year Ended December 31,
Metric 2012 2013 2014
Proved oil reserves in countries with the lowest 20 rankings in TI’s CPI (in
MMbbls)
45 50 52
Probable oil reserves in countries with the lowest 20 rankings in TI’s CPI (in
MMbbls)
100 110 115
Proved gas reserves in in countries with the lowest 20 rankings in TI’s CPI (in
MMscf)
900 1,422 1,700
Probable gas reserves in in countries with the lowest 20 rankings in TI’s CPI
(in MMscf)
1,100 1,400 1,700

© 2014 SUSTAINABILITY ACCOUNTING STANDARDS BOARD
corruption officer works with external agents in order to ascertain a picture of a potential partner’s practices
that is as complete as possible.
Reserves Valuation & Capital Expenditures
The Company’s ability to profitably extract all its reserves depends, to a degree, on extraction
costs and the price of crude oil and other hydrocarbons. The Company makes continual efforts to improve
the efficiency of our exploration and production costs in order to reduce the impact prices have on our
operations. Still, a substantial fall in the price of oil and/or gas could make some extraction financially
infeasible.
Separately, the company currently estimates and discloses its reserves as required by Item 1202(a)
of Regulation S-K. This method makes use of historical prices of oil and gas. Here, the Company has
conducted a sensitivity analysis of its proved and probable reserves based on price scenarios outlined by the
International Energy Agency in its World Energy Outlook publication.
Under prices outlined in the “New Policies Scenario,” the Company may see a small reduction in
the size of its proved and probable reserves. It would see a more significant reduction in its reserves under
the “450 Scenario.” However, neither scenario would significantly reduce global demand for hydrocarbons.
Therefore, given the mix and type of our hydrocarbon reserves, the Company remains well positioned for
continued demand for our products should either scenario come to fruition. The Company, however, based
on various, conservative political and economic assumptions, considers the “450 Scenario” to be highly
unlikely to occur.
Sensitivity of reserve levels to future scenarios in which a price is charged on carbon
emissions
Price Case Proved Reserves Probable Reserves
Scenario Oil Gas Oil Gas
MMbbls MMscf MMbbls MMscf
Current (base) 435 5,828 757 7,200
New Policies Scenario 415 5,400 723 6,900
450 Scenario 378 4,800 701 6,430
Based on reasonable estimates of the type of the Company’s hydrocarbon reserves, we have
determined the likely carbon dioxide emissions that would be associated with their combustion. The
company maintains no reserves of coal and minimal reserves of unconventional hydrocarbons like tar sands
that typically have a higher carbon content than traditional deposits. Therefore, on a CO2-per-barrel basis,
the estimated emissions in our reserves ranks below the industry average (0.11 t CO2 / BOE as compared to
an industry average of 0.18 t CO2 / BOE). Should the Company acquire and develop more carbon-intensive
reserves in the future, there is a risk that it may not be economically feasible to extract them. This risk is
due to uncertainty around future climate change regulation and the potential effects on hydrocarbon prices.
Estimated CO2 emissions embedded in proved hydrocarbon reserves
Impact of price and demand for hydrocarbons and carbon regulations on capital
expenditure strategy for exploration, acquisition, and development
Year Ended December 31,
Metric 2012 2013 2014
Estimated CO2 emissions embedded in proved oil reserves (millions of kg of
CO2) 61 79 83
Estimated CO2 emissions embedded in proved gas reserves (millions of kg of
CO2) 13 15 14

© 2014 SUSTAINABILITY ACCOUNTING STANDARDS BOARD
Our operations require large capital investments, and the decision to make such investments
depends heavily on our ability to recoup them. If the price of or demand for hydrocarbons fall substantially,
we may find it financially infeasible to pursue extraction in some areas.
Many factors affect prices for oil and gas, including macroeconomic conditions, currency values,
and the ability of some industry entities to influence prices. As a result, prices are extremely difficult to
predict accurately. However, the Company does make projections to facilitate decision-making. The
Company’s current projections account for a wide variety of price scenarios; some of these scenarios factor
in prices affecting hydrocarbons, which could be in the form of carbon taxes or cap-and-trade systems.
Although the Company prepares for many scenarios, it believes that extreme reductions in demand
for or prices of hydrocarbons are unlikely in the short term. Some of the countries in which we operate
have yet to adopt carbon pricing regulations or systems. Our operations in Canada are currently too small to
be subject to Alberta’s Specified Gas Emitters Regulation. Indeed, some of the countries in which we
operate appear somewhat unlikely to institute certain types of carbon-related regulation in the near future.
Moreover, the Company believes that it will be able to recoup a material share of its capital expenditures
related to extraction before such pricing systems are fully implemented. In the medium- and long-term,
however, carbon regulations may be more likely. Ultimately, the Company consistently monitors the
potential for carbon regulation implementation and engages in scenario planning on a regular basis to better
inform its operating—and capital expenditure—decisions.
Some operations, especially hydraulic fracturing, can be expensive and require substantial capital
investments. Our recent acquisitions, which increased the amount of these operations under our control,
will require a limited amount of capital expenditures in the near term. When bidding on the companies, we
did account for these costs.
Management of the Legal & Regulatory Environment
The Company believes active engagement with lawmakers and policymakers is beneficial to itself
and its shareholders. Engagement allows the Company to stay informed of potential legislation that could
affect its current or future operations as well as to provide policymakers with insight into how legislation
may affect the Company.
Amount of political campaign spending, lobbying expenditures, and contributions to tax-
exempt groups
Where permitted, we make political contributions in the U.S. and report those contributions as the
law requires. The Company is a member of trade associations, including the API, the Natural Gas Supply
Association, and the Canadian Association of Petroleum Producers. We also make limited political
contributions in Canada and follow all applicable regulations and guidelines when doing so.
Five largest political, lobbying, or tax-exempt group expenditures
The Company’s political contributions go primarily to industry organizations that we believe
represent our interests. When appropriate, we also contribute to individual candidates and to efforts
surrounding a particular issue.
Year Ended December 31,
Metric 2012 2013 2014
Political campaign spending, lobbying expenditures, and
contributions to tax-exempt groups (in thousands of dollars) $550 $625 $630
Year Ended December
31,
Metric 2012 2013 2014
Largest political, lobbying, or tax-exempt group expenditures (in thousands of
dollars)
Congressional Leadership Fund $125 $132 $145
Partnership for a Better Energy Future $74 $77 $80

© 2014 SUSTAINABILITY ACCOUNTING STANDARDS BOARD
National Republican Congressional Committee $44 $60 $65
U.S. Senator Ted Cruz $10 $10 $10
U.S. Senator John Cornyn $10 $10 $10

© 2014 SUSTAINABILITY ACCOUNTING STANDARDS BOARD
Table 1. Summary of Quantitative Accounting Metrics
Year Ended December 31,
Disclosure Topic Metric 2012 2013 2014
Greenhouse Gas Emissions Gross global Scope 1 emissions (in thousands of metric tons CO2-e) 6,525 7,765 7,762 Percentage from:
Conventional oil operations 63% 47% 45%
Unconventional oil operations 2% 9% 11%
Conventional gas operations 35% 32% 31%
Unconventional gas operations 0% 12% 13%
Percentage covered under a regulatory program 3% 3% 3%
Gross global Scope 1 emissions from (in thousands of metric tons CO2-e)
Combustion 5,546 6,591 6,598
Flared hydrocarbons 326 388 388
Process emissions 457 543 543
Directly vented releases 326 388 388
Fugitive emissions/leaks 196 233 237
Air Quality Air emissions from (in metric tons) NO2 8,040 9,525 10,300
SO2 7,400 8,700 8,950
Non-methane VOCs 11,050 13,720 14,200
PM 4,476 7,500 7,000
Water Management Total fresh water withdrawn (in thousands of cubic meters) 1,753 1,994 2,050 Percentage recycled 12% 12% 14%
Percentage in regions with high/extremely high baseline water stress 3% 4% 6%
Produced water and flowback fluid generated (in thousands of cubic meters) 2,100 2,500 2,550
Percentage discharged 48% 54% 52%
Percentage injected 43% 39% 40%
Percentage recycled 9% 7% 8%
Hydrocarbons present in produced water and flowback (in metric tons) 14,000 17,000 18,000
Percentage of hydraulically fractured wells with public disclosure of the
chemical content of fracturing fluid
95% 21% 19%
Percentage of hydraulically fractured sites where ground/surface water
deteriorated compared to baseline2
5% 4% 4%
Biodiversity Impacts Number of hydrocarbon spills 77 82 93 Volume of hydrocarbon spills (bbls) 10,805 13,926 28,220
2 This percentage is based only on those sites for which the Company has performed a baseline assessment of water quality, which is 11% of total sites.

© 2014 SUSTAINABILITY ACCOUNTING STANDARDS BOARD
Table 1. Summary of Quantitative Accounting Metrics
Year Ended December 31,
Disclosure Topic Metric 2012 2013 2014
Volume in the Arctic (bbls) 4,200 2,920 12,040
Volume near shorelines with ESI levels 8-10 (bbls)
3,800 5,848 10,700
Volume recovered (bbls) 702 1,115 2,060
Proved oil reserves in or near sites with protected conservation status or
endangered species habitat (in MMbbls) 18 21 21
Probable oil reserves in or near sites with protected conservation status or
endangered species habitat (in MMbbls) 12 14 14
Proved gas reserves in or near sites with protected conservation status or
endangered species habitat (in MMscf) 515 502 490
Probable gas reserves in or near sites with protected conservation status or
endangered species habitat (in MMscf) 230 200 190
Security, Human Rights, and
Rights of Indigenous Peoples
Proved oil reserves in or near areas of active conflict (in MMbbls) 0 0 0 Probable oil reserves in or near areas of active conflict (in MMbbls) 0 0 0
Proved gas reserves in or near areas of active conflict (in MMscf) 0 0 0
Probable gas reserves in or near areas of active conflict (in MMscf) 0 0 0
Proved oil reserves in or near areas of indigenous land (in MMbbls) 36 45 45
Probable oil reserves in or near areas of indigenous land (in MMbbls) 22 39 41
Proved gas reserves in or near areas of indigenous land (in MMscf) 350 450 420
Probable gas reserves in or near areas of indigenous land (in MMscf) 475 400 380
Community Relations Number of non-technical delays 0 1 0 Duration of non-technical delays 0 5 0
Health, Safety, and
Emergency Management
Total Recordable Injury Rate (TRIR) Full-time employees .34 .37 .36
Contract employees .39 .36 .37
Short-service employees .4 .38 .37
Fatality Rate
Full-time employees .1 .034 .06
Contract employees .07 0 .03
Short-service employees .13 .17 0
Near Miss Frequency Rate
Full-time employees .34 .34 .3
Contract employees .4 .32 .39
Short-service employees .45 .37 .4
PSE rate for Tier 1 LOPC 1.4 1.63 1.3
© 2014 SUSTAINABILITY ACCOUNTING STANDARDS BOARD
Table 1. Summary of Quantitative Accounting Metrics
Year Ended December 31,
Disclosure Topic Metric 2012 2013 2014
Business Ethics & Payments
Transparency
Proved oil reserves in countries with the lowest 20 rankings in Transparency
International’s Corruption Perception Index 45 50 52
Probable oil reserves in countries with the lowest 20 rankings in
Transparency International’s Corruption Perception Index 100 110 115
Proved gas reserves in countries with the lowest 20 rankings in
Transparency International’s Corruption Perception Index (in MMscf) 900 1,422 1,700
Probable gas reserves in countries with the lowest 20 rankings in
Transparency International’s Corruption Perception Index (in MMscf) 1,100 1,400 1,700
Reserves Valuation & Capital
Expenditures
Estimated CO2 emissions embedded in proved oil reserves (in millions of kg
of CO2) 61 79 83
Estimated CO2 emissions embedded in proved gas reserves (in millions of
kg of CO2) 13 15 14
Sensitivity of reserve levels to future scenarios in which a price is charged on carbon emissions
Price Case Scenario Proved Reserves Probable Reserves
Oil Gas Oil Gas
MMbbls
s MMscf MMbbls MMScf
Current (base) 435 5,828 757 7,200
New Policies Scenario 415 5,400 723 6,900
450 Scenario 378 4,800 701 6,430
Management of the Legal &
Regulatory Environment
Amount of political campaign spending, lobbying expenditures, and
contributions to tax-exempt groups, including trade associations $550,000 $625,000 $630,000
Five largest political, lobbying, or tax-exempt group expenditures
Congressional Leadership Fund $125,000 $132,000 $145,000
Partnership for a Better Energy Future $74,000 $77,000 $80,000
National Republican Congressional Committee $44,000 $60,000 $65,000
U.S. Senator Ted Cruz $10,000 $10,000 $10,000
U.S. Senator John Cornyn $10,000 $10,000 $10,000

© 2014 SUSTAINABILITY ACCOUNTING STANDARDS BOARD
Table 2. Activity Level Metrics
Year Ended December 31,
Metric 2012 2013 2014
Wellhead production Conventional oil (thousand bbls/day) 1,548 1,348 1,548
Unconventional oil (thousand bbls/day) 327 348 571
Conventional gas (MMscf/day) 7,854 7,985 9,010
Unconventional gas (MMscf/day) 798 918 6,765
Number of sites Offshore 28 22 19
Terrestrial 65 67 71


