

SAAB MARFIN MBA
Study of factors affecting sales of SBI mutual fund and promotion and competition analysis of its popular
schemes
MBA MARKETING PROJECT REPORT Page | 1

SAAB MARFIN MBA
ContentsExecutive Summary...............................................................................................................................7
Introduction...........................................................................................................................................9
ORGANISATION OF A MUTUAL FUND..............................................................................................11
Sponsor:.......................................................................................................................................12
Trustees:......................................................................................................................................12
Asset Management Company(AMC):...........................................................................................12
Types of AMCs in Indian Context:................................................................................................13
Custodian:....................................................................................................................................13
Registrars & Transfer Agent(R & T Agent):..................................................................................14
SEBI – Securities and Exchange Board of India:...........................................................................14
ADVANTAGES OF MUTUAL FUND........................................................................................................16
Disadvantage of Investing Through Mutual Funds..............................................................................17
TYPES OF MUTUAL FUND SCHEMES:...................................................................................................17
VARIOUS CRITERIA TO EVALUATE THE MUTUAL FUNDS.....................................................................23
P/E Ratio..........................................................................................................................................23
Turnover Ratio.................................................................................................................................24
Expense Ratio..................................................................................................................................24
SHARPE RATIO.................................................................................................................................24
TREYNOR RATIO..............................................................................................................................25
Standard Deviation..........................................................................................................................26
BETA................................................................................................................................................26
NAV..................................................................................................................................................27
Company profile:.................................................................................................................................28
SBI- MUTUAL FUND PRODUCTS:..........................................................................................................30
EQUITY SCHEMES:...........................................................................................................................30
DEBT SCHEMES:...............................................................................................................................31
BALANCED SCHEMES:......................................................................................................................32
CHANNELS OF SELLING MUTUAL FUNDS.............................................................................................34
Mutual Fund Office:.........................................................................................................................34
Intermediaries:................................................................................................................................35
National Distributors.......................................................................................................................35
Banks...............................................................................................................................................36
Individual Financial Advisors............................................................................................................37
MBA MARKETING PROJECT REPORT Page | 2

SAAB MARFIN MBA
The Internet.....................................................................................................................................37
Learning’s from the internship –.........................................................................................................39
Competition Analysis of Various schemes...........................................................................................44
SBI Magnum MIP v/s Reliance MIP......................................................................................................46
Questionnaire......................................................................................................................................51
Factor Analysis through SPSS...............................................................................................................52
Analysis............................................................................................................................................57
Recommendations...............................................................................................................................59
LIMITATIONS........................................................................................................................................60
CONCLUSION.......................................................................................................................................61
BIBLIOGRAPHY.....................................................................................................................................62
MBA MARKETING PROJECT REPORT Page | 3

SAAB MARFIN MBA
Executive SummaryObjective –
1. To study and work in all the distribution channels of SBI mutual fund.
2. To identify various factors that influences the decision of investors while investing in
mutual fund.
3. To compare the popular schemes of SBI mutual Fund with the most popular schemes
in the same segment.
Scope of the project
The project can prove to be very useful to the company as it can help to identify the most
important factors that influence the decision of investor while investing in mutual fund and
working on these factors to improve sales and also communicating these factors to the sales
force so that they can focus on them while convincing the customers. This project will also
help the company to get information about the performance of schemes of its competitors in
the same segment.
Methodology
1. Study all about mutual fund and various schemes.
2. Sell mutual fund through various channels.
3. Identify various factors that influence the investors’ decision while investing in
mutual fund.
4. Listing down of all the factors identified.
5. Develop a questionnaire using these factors on Likert Scale.
6. Take a survey through various distribution channels and also among internal
customers of the company.
MBA MARKETING PROJECT REPORT Page | 4

SAAB MARFIN MBA
7. Analyze primary data collected through SPSS (factor analysis)
8. Study the distribution channel thoroughly and take feedback from various
intermediaries about various schemes of SBI MF and that of its competitors.
9. Based on feedback and ranking given by various organizations identify best schemes
of SBI and its competitors and do a comparative analysis.
10. Make recommendations based on findings.
Sampling
Sample size – 60
Since the questionnaire is long and not easy for anybody to understand so the respondents
were mostly who knoe about mutual i.e. investors and internal customers etc.
IntroductionMutual funds:
MBA MARKETING PROJECT REPORT Page | 5

SAAB MARFIN MBA
Mutual funds, as the name indicates is the fund where in numerous investors come together to
invest in various schemes of mutual fund. Mutual funds are dynamic institution, which plays
a crucial role in an economy by mobilizing savings and investing them in the capital market,
thus establishing a link between savings and the capital market.
A mutual fund is an institution that invests the pooled funds of public to create a diversified
portfolio of securities. Pooling is the key to mutual fund investing. Each mutual fund has a
specific investment objective and tries to meet that objective through active portfolio
management.
Mutual fund as an investment company combines or collects money of its shareholders and
invests those funds in variety of stocks, bonds, and money market instruments. The latter
include securities, commercial papers, certificates of deposits, etc. Mutual funds provide the
investor with professional management of funds and diversification of investment.
Investors who invest in mutual funds are provided with units to participate in stock markets.
These units are investment vehicle that provide a means of participation in the stock market
for people who have neither the time, nor the money, nor perhaps the expertise to undertake
the direct investment in equities. On the other hand they also provide a route into specialist
markets where direct investment often demands both more time and more knowledge than an
investor may possess.
The price of units in any mutual fund is governed by the value of underlying securities. The
value of an investor’s holding in a unit can therefore, like an investment in share, can go
down as well as up. Hence it is said that mutual funds are subjected to market risk. Mutual
fund cannot guarantee a fixed rate of return. It depends on the market condition. If a
particular scheme is performing well then more return can be expected.
It also depends on the fund manager expertise knowledge. It is also seen that people invest in
particular funds depending on who the fund manager is.
MBA MARKETING PROJECT REPORT Page | 6

SAAB MARFIN MBA
The following diagram shows the working of mutual fund
This diagram signifies the importance of Mutual Fund.
A Mutual Fund is a trust that pools the savings of a number of investors who share a common
financial goal. The money thus collected is invested by the fund manager in different types of
securities depending upon the objective of the scheme. These could range from shares to
debentures to money market instruments. The income earned through these investments and
the capital appreciations realized by the schemes are shared by its unit holders in proportion
to the number of units owned by them.
Thus a mutual fund is the most suitable investment for the common person as it offers an
opportunity to invest in a diversified, professionally managed basket of securities at a
relatively low cost.
Since small investors generally do not have adequate time, knowledge, experience &
resources for directly accessing the capital market, they have to rely on an intermediary,
which undertakes informed investment decisions & provides consequential benefits of
professional expertise.
The advantage of Mutual Funds to the investors is professionally managed, low transaction
cost, liquidity, transparency, well regulated, diversified portfolios & tax benefits. By pooling
their assets through mutual funds, investors achieve economies of scale.
MBA MARKETING PROJECT REPORT Page | 7

SAAB MARFIN MBA
A collected corpus can be used to procure a diversified portfolio indicating greater returns has
also create economies of scale through cost reduction. This principle has been effective
worldwide as more & more investors are going the mutual fund way. This portfolio
diversification ensures risk minimization. The criticality of such a measure comes in when
you factor in the fluctuations that characterize stock markets. The interest of the investors is
protected by the SEBI, which acts as a watchdog. Mutual funds are governed by SEBI
(Mutual Funds) regulations, 1996.
ORGANISATION OF A MUTUAL FUND
There are many entities involved and the diagram below illustrates the organizational set up
of a mutual fund:
Mutual funds have a unique structure not shared with other entities such as companies or
firms. It is important for employees & agents to be aware of the special nature of this
structure, because it determines the rights & responsibilities of the fund’s constituents viz.,
sponsors, trustees, custodians, transfer agents & of course, the fund & the Asset Management
Company(AMC) the legal structure also drives the inter-relationships between these
constituents.
The structure of the mutual fund India is governed by the SEBI (Mutual Funds) regulations,
1996. These regulations make it mandatory for mutual funds to have a structure of sponsor,
trustee, AMC, custodian. The sponsor is the promoter of the mutual fund,& appoints the
trustees. The trustees are responsible to the investors in the mutual fund, & appoint the AMC
for managing the investment portfolio. The AMC is the business face of the mutual fund, as it
manages all affairs of the mutual fund. The mutual fund & the AMC have to be registered
MBA MARKETING PROJECT REPORT Page | 8

SAAB MARFIN MBA
with SEBI. Custodian, who is also registered with SEBI, holds the securities of various
schemes of the fund in its custody.
Sponsor:
The sponsor is the promoter of the mutual fund. The sponsor establishes the Mutual fund &
registers the same with SEBI. He appoints the trustees, Custodians & the AMC with prior
approval of SEBI, & in accordance with SEBI regulations. He must have at least five year
track record of business interest in the financial markets. Sponsor must have been profit
making in at least three of the above five years. He must contribute at least 40% of the capital
of the AMC.
Trustees:
The Mutual Fund may be managed by a Board of trustees of individuals, or a trust company –
a corporate body. Most of the funds in India are managed by board of trustees. While the
board of trustees is governed by the provisions of the Indian trust act, where the trustee is the
corporate body, it would also be required to comply with the provisions of the companies act,
1956. the board of trustee company, as an independent body, act as protector of the unit-
holders interest. The trustees don’t directly manage the portfolio of securities. For this
specialist function, they appoint an AMC. They ensure that the fund is managed by AMC as
per the defined objectives & in accordance with the trust deed & SEBI regulations.
The trust is created through a document called the trust deed i.e., executed by the fund
sponsor in favor of the trustees. The trust deed is required to be stamped as registered under
the provision of the Indian registration act & registered with SEBI. The trustees begin the
primary guardians of the unit-holders funds & assets, a trustee has to be a person of high
repute & integrity.
Asset Management Company(AMC):
The role of an Asset management companies is to act as the investment manager of the trust.
They are the ones who manage money of investors. An AMC takes decisions, compensates
investors through dividends, maintains proper accounting & information for pricing of units,
calculates the NAV, & provides information on listed schemes. It also exercises due diligence
on investments & submits quarterly reports to the trustees. AMCs have been set up in various
countries internationally as an answer to the global problem of bad loans.
MBA MARKETING PROJECT REPORT Page | 9

SAAB MARFIN MBA
Bad loans are essentially of two types: bad loans generated out of the usual banking
operations or bad lending, and bad loans which emanate out of a systematic banking crisis.
It is in the latter case that banking regulators or governments try to bail out the banking
system of a systematic accumulation of bad loans which acts as a drag on their liquidity,
balance sheets and generally the health of banking. So, the idea of AMCs or ARCs is not to
bail out banks, but to bail out the banking system itself.
Types of AMCs in Indian Context:
The following are the various types of AMCs we have in India:
AMCs owned by banks.
AMCs owned by financial institutions.
AMCs owned by Indian private sector companies.
AMCs owned by foreign institutional investors.
AMCs owned by Indian & foreign sponsors.
Custodian:
Often an independent organization, it takes custody all securities & other assets of mutual
fund. Its responsibilities include receipt & delivery of securities collecting income-
distributing dividends, safekeeping of the unit & segregating assets & settlements between
schemes.
Mutual fund is managed either trust company board of trustees. Board of trustees & trust are
governed by provisions of Indian trust act. If trustee is a company, it is also subject Indian
Company Act. Trustees appoint AMC in consultation with the sponsors & according to SEBI
regulation. All mutual fund schemes floated by AMC have to be approved by trustees.
Trustees review & ensure that net worth of the company is according to stipulated norms,
every quarter.
Though the trust is the mutual fund, the AMC is its operational face. The AMC is the first
functionary to be appointed, & is involved in appointment of all other functionaries. The
AMC structures the mutual fund products, markets them & mobilizes fund, manages the
funds & services to the investors.
MBA MARKETING PROJECT REPORT Page | 10

SAAB MARFIN MBA
A draft offer document is to be prepared at the time of launching the fund. Typically, it pre-
specifies investment objectives of the fund, the risk associated, the cost involved in the
process & the broad rules to enter & to exit from the fund & other areas of operation. In India
as in most countries, these sponsors need approval from a regulator, SEBI in our case. SEBI
looks at track records of the sponsor & its financial strength granting approval to the fund for
commencing operations.
A sponsor then hires an asset management company to invest the funds according to the
investment objective. It also hires another entity to be the custodian of the assets of the fund
& perhaps the third one to handle registry work for the unit holder of the fund.
Registrars & Transfer Agent(R & T Agent):
The Registrars & Transfer Agents(R & T Agents) are responsible for the investor servicing
function, as they maintain the records of investors in mutual funds. They process investor
applications; record details provide by the investors on application forms; send out to
investors details regarding their investment in the mutual fund; send out periodical
information on the performance of the mutual fund; process dividend payout to investor;
incorporate changes in information as communicated by investors; & keep the investor record
up-to-date, by recording new investors & removing investors who have withdrawn their
funds.
SEBI – Securities and Exchange Board of India:
Securities and Exchange Board of India (SEBI) is a board (autonomous body) created by
the Government of India in 1988 and given statutory form in 1992 with the SEBI Act 1992
with its head office at Mumbai.
The Securities and Exchange Board of India is perhaps the most important regulatory body.
Similar to the Securities Exchange Commission in the US, it is the authority that has to
always be on its toes. More so, when the markets are doing well and there are a spate of IPOs
(initial public offerings) or FPO’s (follow-on public offerings) like now.
Its main mandate is to protect the interest of investors in the securities markets and to
promote the development of and to regulate the securities markets so as to establish a
dynamic and efficient securities market.
MBA MARKETING PROJECT REPORT Page | 11

SAAB MARFIN MBA
When investors have complaints against listed companies or registered intermediaries, and if
they are not solved directly between the parties concerned, or if the investor is not happy with
the response then SEBI acts as the nodal agency for addressing these complaints.
SEBI has listed certain categories of grievances for which investors can file complaints with
it. These include:
Non-receipt of refund order or allotment advice in case of investment in IPO's, FPO's
and rights issues
Non-receipt of dividend from listed companies
Non-receipt of share certificates after transfer from listed companies
Non-receipt of debentures after transfer or non-receipt of interest or principal on
redemption and non-receipt of interest on delayed repayment
Non-receipt of rights offer letter
MBA MARKETING PROJECT REPORT Page | 12

SAAB MARFIN MBA
ADVANTAGES OF MUTUAL FUND
S.
No.Advantage Particulars
1.
Portfolio
Diversificati
on
Mutual Funds invest in a well-diversified portfolio of securities which
enables investor to hold a diversified investment portfolio (whether the
amount of investment is big or small).
2.
Professional
Managemen
t
Fund manager undergoes through various research works and has
better investment management skills which ensure higher returns to
the investor than what he can manage on his own.
3. Less Risk
Investors acquire a diversified portfolio of securities even with a small
investment in a Mutual Fund. The risk in a diversified portfolio is lesser
than investing in merely 2 or 3 securities.
4.
Low
Transaction
Costs
Due to the economies of scale (benefits of larger volumes), mutual
funds pay lesser transaction costs. These benefits are passed on to the
investors.
5. Liquidity
An investor may not be able to sell some of the shares held by him
very easily and quickly, whereas units of a mutual fund are far more
liquid.
6.Choice of
Schemes
Mutual funds provide investors with various schemes with different
investment objectives. Investors have the option of investing in a
scheme having a correlation between its investment objectives and
their own financial goals. These schemes further have different
plans/options
7.Transparenc
y
Funds provide investors with updated information pertaining to the
markets and the schemes. All material facts are disclosed to investors
as required by the regulator.
8. Flexibility
Investors also benefit from the convenience and flexibility offered by
Mutual Funds. Investors can switch their holdings from a debt scheme
to an equity scheme and vice-versa. Option of systematic (at regular
intervals) investment and withdrawal is also offered to the investors in
most open-end schemes.
9. Safety
Mutual Fund industry is part of a well-regulated investment
environment where the interests of the investors are protected by the
regulator. All funds are registered with SEBI and complete
transparency is forced.
MBA MARKETING PROJECT REPORT Page | 13

SAAB MARFIN MBA
Disadvantage of Investing Through Mutual Funds
S.
No.
Disadvantag
eParticulars
1.
Costs
Control Not
in the
Hands of an
Investor
Investor has to pay investment management fees and fund
distribution costs as a percentage of the value of his investments (as
long as he holds the units), irrespective of the performance of the
fund.
2.
No
Customized
Portfolios
The portfolio of securities in which a fund invests is a decision taken
by the fund manager. Investors have no right to interfere in the
decision making process of a fund manager, which some investors
find as a constraint in achieving their financial objectives.
3.
Difficulty in
Selecting a
Suitable
Fund
Scheme
Many investors find it difficult to select one option from the plethora
of funds/schemes/plans available. For this, they may have to take
advice from financial planners in order to invest in the right fund to
achieve their objectives.
TYPES OF MUTUAL FUND SCHEMES:
By Structure
o Open-ended schemes
o Close-ended schemes
o Interval schemes
By Investment Objective
o Growth schemes
o Income schemes
o Balance schemes
o Money Market schemes
MBA MARKETING PROJECT REPORT Page | 14

SAAB MARFIN MBA
Other types of schemes
o Tax Saving schemes
o Special schemes
o Index schemes
o Sector specific schemes
Schemes according to maturity period:
A mutual fund scheme can be classified into open-ended scheme or close-ended scheme
depending on its maturity period.
Open-ended Fund / Scheme
An open-ended fund or scheme is one that is available for subscription and repurchase on a
continuous basis. These schemes do not have a fixed maturity period. Investors can
conveniently buy and sell units at Net Asset Value (NAV) related prices which are declared
on a daily basis. The key feature of open-end schemes is liquidity.
Close-ended Fund / Scheme
A close-ended fund or scheme has a stipulated maturity period e.g. 5-7 years. The fund is
open for subscription only during a specified period at the time of launch of the scheme.
Investors can invest in the scheme at the time of the initial public issue and thereafter they
can buy or sell the units of the scheme on the stock exchanges where the units are listed. In
order to provide an exit route to the investors, some close-ended funds give an option of
selling back the units to the mutual fund through periodic repurchase at NAV related prices.
SEBI Regulations stipulate that at least one of the two exit routes is provided to the investor
i.e. either repurchase facility or through listing on stock exchanges. These mutual funds
schemes disclose NAV generally on weekly basis.
Interval scheme
Interval funds combine the features of open-ended & closed ended schemes. They are open
for sale or redemption during pre-determined intervals at NAV related prices.
MBA MARKETING PROJECT REPORT Page | 15

SAAB MARFIN MBA
Schemes according to Investment Objective:
A scheme can also be classified as growth scheme, income scheme, or balanced scheme
considering its investment objective. Such schemes may be open-ended or close-ended
schemes as described earlier. Such schemes may be classified mainly as follows:
Growth / Equity Oriented Schemes
The aim of growth funds is to provide capital appreciation over the medium to long- term.
Such schemes normally invest a major part of their corpus in equities. Such funds have
comparatively high risks.
These schemes provide different options to the investors like dividend option, capital
appreciation, etc. and the investors may choose an option depending on their preferences. The
investors must indicate the option in the application form. The mutual funds also allow the
investors to change the options at a later date. Growth schemes are good for investors having
a long-term outlook seeking appreciation over a period of time.
Income / Debt Oriented Scheme
The aim of income funds is to provide regular and steady income to investors. Such schemes
generally invest in fixed income securities such as bonds, corporate debentures, Government
securities and money market instruments. Such funds are less risky compared to equity
schemes. These funds are not affected because of fluctuations in equity markets. However,
opportunities of capital appreciation are also limited in such funds. The NAVs of such funds
are affected because of change in interest rates in the country. If the interest rates fall, NAVs
of such funds are likely to increase in the short run and vice versa. However, long term
investors may not bother about these fluctuations.
Balanced Fund
The aim of balanced funds is to provide both growth and regular income as such schemes
invest both in equities and fixed income securities in the proportion indicated in their offer
documents. These are appropriate for investors looking for moderate growth. They generally
invest 40-60% in equity and debt instruments. These funds are also affected because of
fluctuations in share prices in the stock markets. However, NAVs of such funds are likely to
be less volatile compared to pure equity funds.
MBA MARKETING PROJECT REPORT Page | 16

SAAB MARFIN MBA
Money Market or Liquid Fund
These funds are also income funds and their aim is to provide easy liquidity, preservation of
capital and moderate income.
These schemes invest exclusively in safer short-term instruments such as treasury bills,
certificates of deposit, commercial paper and inter-bank call money, government securities,
etc. Returns on these schemes fluctuate much less compared to other funds. These funds are
appropriate for corporate and individual investors as a means to park their surplus funds for
short periods.
Other Schemes
Tax Saving Schemes
These schemes offer tax rebates to the investors under specific provisions of the Income Tax
Act, 1961 as the Government offers tax incentives for investment in specified avenues. e.g.
Equity Linked Savings Schemes (ELSS). Pension schemes launched by the mutual funds also
offer tax benefits. These schemes are growth oriented and invest pre-dominantly in equities.
Their growth opportunities and risks associated are like any equity-oriented scheme.
Gilt Fund
These funds invest exclusively in government securities. Government securities have no
default risk. NAVs of these schemes also fluctuate due to change in interest rates and other
economic factors as is the case with income or debt oriented schemes.
Index Funds
Index Funds replicate the portfolio of a particular index such as the BSE Sensitive index,
S&P NSE 50 index (Nifty), etc these schemes invest in the securities in the same weight age
comprising of an index. NAVs of such schemes would rise or fall in accordance with the rise
or fall in the index, though not exactly by the same percentage due to some factors known as
"tracking error" in technical terms. Necessary disclosures in this regard are made in the offer
document of the mutual fund scheme.
MBA MARKETING PROJECT REPORT Page | 17

SAAB MARFIN MBA
There are also exchange traded index funds launched by the mutual funds which are traded
on the stock exchanges.
Sector specific funds / schemes
These are the funds/schemes which invest in the securities of only those sectors or industries
as specified in the offer documents. e.g. Pharmaceuticals, Software, Fast Moving Consumer
Goods (FMCG), Petroleum stocks, etc. The returns in these funds are dependent on the
performance of the respective sectors/industries. While these funds may give higher returns,
they are more risky compared to diversified funds. Investors need to keep a watch on the
performance of those sectors/industries and must exit at an appropriate time. They may also
seek advice of an expert.
MBA MARKETING PROJECT REPORT Page | 18

SAAB MARFIN MBA
MBA MARKETING PROJECT REPORT Page | 19

SAAB MARFIN MBA
VARIOUS CRITERIA TO EVALUATE THE MUTUAL FUNDS
The most important and widely used measures of performance are:-
Basic criterions to evaluate the mutual fund schemes
P/E ratio
Turnover ratio
Expense ratio
Standard deviation
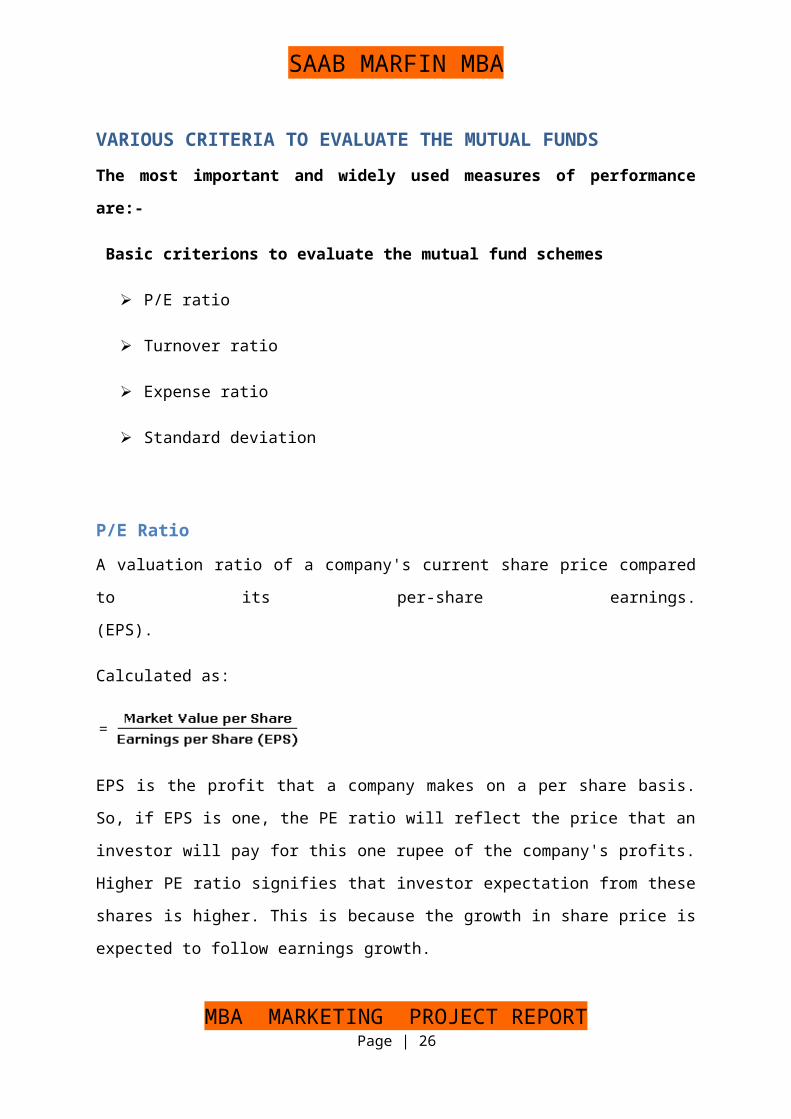
P/E Ratio
A valuation ratio of a company's current share price compared to its per-share earnings.
(EPS).
Calculated as:
EPS is the profit that a company makes on a per share basis. So, if EPS is one, the PE ratio
will reflect the price that an investor will pay for this one rupee of the company's profits.
Higher PE ratio signifies that investor expectation from these shares is higher. This is because
the growth in share price is expected to follow earnings growth.
In general, a high P/E suggests that investors are expecting higher earnings growth in the
future compared to companies with a lower P/E. However, the P/E ratio doesn't tell us the
whole story by itself. It's usually more useful to compare the P/E ratios of one company to
other companies in the same industry, to the market in general or against the company's own
historical P/E.
MBA MARKETING PROJECT REPORT Page | 20

SAAB MARFIN MBA
Turnover Ratio
The turnover ratio is the lower of the total sales or total purchases over the period divided by
the average of the net assets. Higher the turnover ratio, greater is the volume of trading
carried out by the fund.
The turnover ratio is more important for equity and balanced funds where the trading cost of
equities is substantial. So, each time a fund manager buys and sells, he has to keep in mind
that the cost of buying and selling will eat into the fund's returns. Dynamic equity funds,
which can move rapidly between sectors, will obviously have a higher turnover ratio. Here
risk will not be just of the fund manager making a wrong call on a sector but also that of
turnover risk. In comparison a passively managed fund, such as an index fund, will have a
lower turnover rate compared to an active fund as it has to just mirror the index. The only
trading here will be due to investments, redemptions and changes in the index. Also, it is not
meaningful to use turnover ratio for new schemes, which are not fully invested. As the
scheme is deploying its assets there will be more transactions, at least buy orders, as
compared to a fund` which is fully invested. Turnover ratio is less relevant for income funds
as brokerage costs are much lower, and hence they will have a lower potential to eat into
returns. So, even though gilt funds may have equally high turnover as compared to equity
funds, the impact of this turnover is much less.
In Short, Turnover ratio is a measure of how a fund's portfolio changes in a year. This ratio
indicates how much a fund is trading. Understanding turnover ratio helps in gaining insights
into a fund's performance.
Expense Ratio
Expense ratio is the percentage of total assets that are spent to run a mutual fund. As returns
from bond funds tend to be similar, expenses become an important factor while comparing
bond funds.
SHARPE RATIOSt= Rp --Rf
S.D
WHERE
MBA MARKETING PROJECT REPORT Page | 21
SAAB MARFIN MBA
Rp – Avereage return to portfolio
Rf—Risk free rate of interest
S.D- Standard Deviation
Sharpe’s performce index gives a single value to be used for the performance ranking of
various funds or portfolios. Sharpe index measures the risk premium of the portfolio relative
to the total amount of risk in the portfolio. The risk premium is the difference between the
portfolio’s average rate of return and the risk less rate of return. The standard deviation of the
portfolio indicates the risk.
Higher the value of sharpe ratio better the fund has performed. Sharpe ratio can be used to
rank the desirability of funds or portfolios. The fund that has performed well comapred to
other will be ranked first then the others.
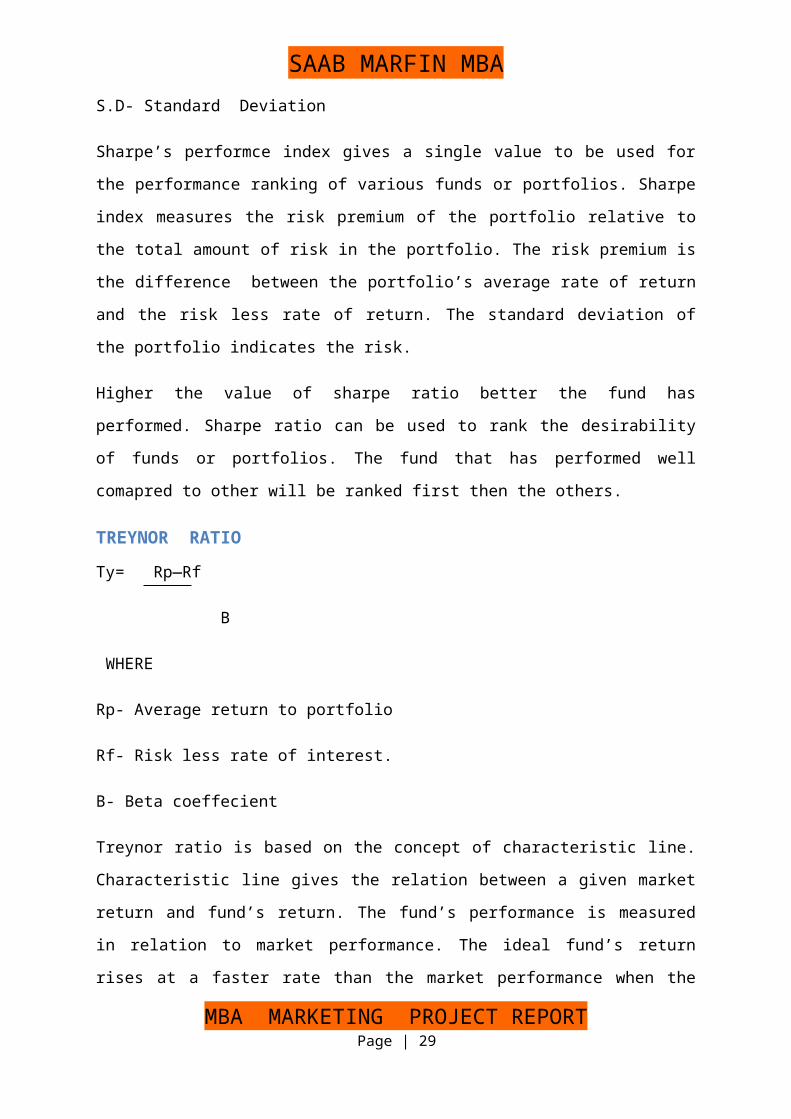
TREYNOR RATIO
Ty= Rp—Rf
B
WHERE
Rp- Average return to portfolio
Rf- Risk less rate of interest.
B- Beta coeffecient
Treynor ratio is based on the concept of characteristic line. Characteristic line gives the
relation between a given market return and fund’s return. The fund’s performance is
measured in relation to market performance. The ideal fund’s return rises at a faster rate than
the market performance when the market is moving upwards and its rate of return declines
slowly than the market return, in the decline.
Treynor’s risk premium of the portfolio is the difference between the aveage return and the
risk less rate of return. The risk premium depends on the systematic risk assumed in a
portfoilo.
MBA MARKETING PROJECT REPORT Page | 22

SAAB MARFIN MBA
Standard Deviation
Standard Deviation is the most common statistical measure of judging a fund's volatility and
risk. It gives you a 'quality rating' of an average.
A measure of the total volatility of a fund is based on the trailing three-year monthly returns.
For debt and gilt funds it is based on average weekly return over the past one and a half years.
The Standard Deviation of an average is the amount by which the numbers that go into an
average deviate from that average. It tells us how closely an average represents the
underlying numbers. A high Standard Deviation may be a measure of volatility, but it does
not necessarily mean that such a fund is worse than one with a low Standard Deviation. If the
first fund is a much higher performer than the second one, the deviation will not matter much.
BETA
Beta describes the relationship between the stock’s return and index returns. There can be
direct or indirect relation between stock’s return and index return. Indirect relations are very
rare.
1) Beta =+1.0
It indicates that one percent change in market index return causes exactly one percent change
in the stock return. It indicates that stock moves along with the market.
2) Beta= + 0.5
One percent changes in the market index return causes 0.5 percent change in the stock return.
It indicates that it is less volatile compared to market.
3) Beta=2.0
One percent change in the market index return causes 2 percent change in the stock return.
The stock return is more volatile. The stocks with more than 1 beta value are considered to be
very risky.
4) Negative beta value indicates that the stocks return move in opposite direction to the
market return.
Beta= N*∑XY- (∑X) (∑Y/ N(X*X) * (∑x)
Where
MBA MARKETING PROJECT REPORT Page | 23

SAAB MARFIN MBA
N- No of observation
X- Total of market index value
Y- Total of return to Nav
NAV
Net Asset Value or NAV of a mutual fund is the value of one unit of investment in the fund,
in net asset terms.
NAV = Net Assets of the scheme / Number of Units Outstanding
Where Net Assets are calculated as:-
(Market value of investments + current assets and other assets + Accrued income – current
liabilities and other liabilities – less accrued expenses) / No. of Units Outstanding as at the
NAV date
MBA MARKETING PROJECT REPORT Page | 24

SAAB MARFIN MBA
Company profile:
STATE BANK OF INDIA - MUTUAL FUND - A partner for life
SBI Mutual Fund (SBI MF) is one of the largest mutual funds in the country with an investor
base of over 4.6 million. With over 20 years of rich experience in fund management, SBI MF
brings forward its expertise in consistently delivering value to its investors
Proven Skills in wealth generation:
SBI Mutual Fund is India’s largest bank sponsored mutual fund and has an enviable track
record in judicious investments and consistent wealth creation.
The fund traces its lineage to SBI - India’s largest banking enterprise. The institution has
grown immensely since its inception and today it is India's largest bank, patronized by over
80% of the top corporate houses of the country.
SBI Mutual Fund is a joint venture between the State Bank of India and Société General
Asset Management, one of the world’s leading fund management companies that manages
over US$ 500 Billion worldwide.
Exploiting expertise, compounding growth:
In twenty years of operation, the fund has launched 38 schemes and successfully redeemed
fifteen of them. In the process it has rewarded it’s investors handsomely with consistently
high returns.
A total of over 60 lakh investors have reposed their faith in the wealth generation expertise
of the Mutual Fund.
Schemes of the Mutual fund have consistently outperformed benchmark indices and have
emerged as the preferred investment for millions of investors and HNI’s.
Today, the fund manages over Rs. 51,461 crores of assets and has a diverse profile of
investors actively parking their investments across 37 active schemes.
The fund serves this vast family of investors by reaching out to them through network of over
130 points of acceptance, 29 investor service centers, 55 investor service desks and 45 district
organizers.
MBA MARKETING PROJECT REPORT Page | 25
SAAB MARFIN MBA
SBI Mutual is the first bank-sponsored fund to launch an offshore fund – Resurgent India
Opportunities Fund.
Growth through innovation and stable investment policies is the SBI MF credo.
Fund house expertise:
The investment environment is becoming increasingly complex. Innumerable parameters
need to be factored in to generate a clear understanding of market movement and
performance in the near and long term future.
At SBIMF, we devote considerable resources to gain, maintain and sustain our profitable
insights into market movements. We consistently push the envelope to ensure our investors
get the maximum benefits year after year.
Research - the backbone of our Performance
Our expert team of experienced and market savvy researchers prepare comprehensive
analytical and informative reports on diverse sectors and identify stocks that promise high
performance in the future.
This team works in tandem with a compliance and risk-monitoring department, which
ensures minimization of operational risks while protecting the interests of the investors.
Quite naturally many of our equity funds have delivered consistent returns to investors and
have repeatedly out performed benchmark indices by wide margins.
Risk Management Team:
The Risk Management unit is a separate division within the organization headed by the Chief
Risk Officer (CRO). A Risk Management Committee, comprising the MD, Deputy CEO,
CRO, COO, CIO and the CMO meets on a regular basis to manage risk within the
organization.
The CRO is responsible for risk management over all the functions within the organization
including Investments, Marketing, Operations, etc. Currently, the CRO is an experienced
investment professional and is assisted by a two-member team, one being an investment
Professional with an MBA in Finance and the other being an investment professional deputed
from SGAM.
MBA MARKETING PROJECT REPORT Page | 26

SAAB MARFIN MBA
SBI- MUTUAL FUND PRODUCTS:
EQUITY SCHEMES:
The investments of these schemes will predominantly be in the stock markets and endeavor
will be to provide investors the opportunity to benefit from the higher returns which stock
markets can provide. However they are also exposed to the volatility and attendant risks of
stock markets and hence should be chosen only by such investors who have high risk taking
capacities and are willing to think long term. Equity Funds include diversified Equity Funds,
Sectoral Funds and Index Funds. Diversified Equity Funds invest in various stocks across
different sectors while Sectoral funds which are specialized Equity Funds restrict their
investments only to shares of a particular sector and hence, are riskier than Diversified Equity
Funds. Index Funds invest passively only in the stocks of a particular index and the
performance of such funds move with the movements of the index.
Magnum COMMA Fund
Magnum Equity Fund
Magnum Global Fund
Magnum Index Fund
Magnum MidCap Fund
Magnum Multicap Fund
Magnum Multiplier Plus 1993
Magnum Sector Funds Umbrella
MSFU - FMCG Fund
MSFU - Emerging Businesses Fund
MSFU - IT Fund
MSFU - Pharma Fund
MSFU - Contra Fund
MBA MARKETING PROJECT REPORT Page | 27

SAAB MARFIN MBA
SBI Arbitrage Opportunities Fund
SBI Blue chip Fund
SBI Infrastructure Fund - Series I
SBI Magnum Taxgain Scheme 1993
SBI ONE India Fund
SBI TAX ADVANTAGE FUND - SERIES I
DEBT SCHEMES:
Debt Funds invest only in debt instruments such as Corporate Bonds, Government Securities
and Money Market instruments either completely avoiding any investments in the stock
markets as in Income Funds or Gilt Funds or having a small exposure to equities as in
Monthly Income Plans or Children's Plan. Hence they are safer than equity funds. At the
same time the expected returns from debt funds would be lower. Such investments are
advisable for the risk-averse investor and as a part of the investment portfolio for other
investors.
Magnum Children’s Benefit Plan
Magnum Gilt Fund
Magnum Gilt Fund (Long Term)
Magnum Gilt Fund (Short Term)
Magnum Income Fund
Magnum Income Plus Fund
Magnum Income plus Fund (Saving Plan)
Magnum Income plus Fund (Investment Plan)
Magnum Insta Cash Fund
Magnum InstaCash Fund -Liquid Floater Plan
Magnum Institutional Income Fund
MBA MARKETING PROJECT REPORT Page | 28
SAAB MARFIN MBA
Magnum Monthly Income Plan
Magnum Monthly Income Plan Floater
Magnum NRI Investment Fund
SBI Capital Protection Oriented Fund - Series I
SBI Debt Fund Series
SDFS 15 Months Fund
SDFS 90 Days Fund
SDFS 13 Months Fund
SDFS 18 Months Fund
SDFS 24 Months Fund
SDFS 30 DAYS
SDFS 30 DAYS
SDFS 60 Days Fund
SDFS 180 Days Fund
SDFS 30 DAYS
SBI Premier Liquid Fund
SBI Short Horizon Fund
SBI Short Horizon Fund - Liquid Plus Fund
SBI Short Horizon Fund - Short Term Fund
BALANCED SCHEMES:
Magnum Balanced Fund invests in a mix of equity and debt investments. Hence they are less
risky than equity funds, but at the same time provide commensurately lower returns. They
provide a good investment opportunity to investors who do not wish to be completely
MBA MARKETING PROJECT REPORT Page | 29

SAAB MARFIN MBA
exposed to equity markets, but is looking for higher returns than those provided by debt
funds.
Magnum Balanced Fund
Magnum NRI Investment Fund - Flexi Asset Plan
MBA MARKETING PROJECT REPORT Page | 30

SAAB MARFIN MBA
CHANNELS OF SELLING MUTUAL FUNDS
Mutual funds are emerging as an important financial intermediary for the investing public in
India. Conceptually and operationally they are different. The investors need to understand the
working of a mutual fund and the increasingly diverse and complex investment options
brought to them by a large number of mutual funds. The key channel in bringing the mutual
funds to a large number of investors all over the country is the network of
INTERMEDIARIES/DISTRIBUTORS. In this industry we have five different channels
through which mutual fund are sold:
• Mutual Fund Company
• National Distributors (NDs) & Intermediaries
• Banks
• Individual Financial Advisors (IFAs)
• Internet
Each one has its own customer base. Their way of dealing with them is totally different from
other. Every one attracts in their own way. How they attract we will study. There are many
industries here. The urgency to keep increasing in size has led mutual funds to use marketing
hooks to draw investors. As we rely only on channel partners, our relation with them really is
going to play a vital role. How different companies lure the partners, we’ll study that. As to
start with we will first study about the intermediaries in brief by describing who they are and
how they help a direct investor.
Mutual Fund Office:
Anyone can walk into a mutual fund’s office, and buy/sell units of its schemes. It’s a simple
process, and there are employees of the fund house on hand to guide you through. If you are
buying units, you will have to fill up an application form and hand over a cheque equivalent
to your investment. The fund house will give you an acknowledgement of your investment in
its scheme(s) and subject to your cheque being cleared, send you an account statement within
three to seven days. Since a fund house market only its schemes and not those of its
competitors, buying directly means knowing which fund house we want to invest in. If we are
selling units, the relevant document is the redemption form, which sometimes forms part of
MBA MARKETING PROJECT REPORT Page | 31

SAAB MARFIN MBA
your account statement and can be torn off it, or can be had from the fund house’s office. The
fund house mails the cheque within three days. The problem with transacting through fund
house is that they have a very thin presence. Most fund houses have just an office or two in
the big cities; moreover, since such offices are located in the central business district, for
most investors, this means travelling a fair distance. It’s worse in smaller centres-only a few
fund houses have a scattered presence. But as the industry grows and gains greater investor
acceptance. Mutual funds are bound to expand beyond cities.
Intermediaries:
Distributors such as agents, banks and stockbrokers are present in much greater numbers,
which makes them the preferred option among investors. While dealing with the
intermediaries, make sure they have the AMFI (Association of Mutual Fund in India)
certification-a SEBI precondition; since September 2003, for selling mutual funds, intended t
ensure that only qualified distributors dispense mutual fund advice. AMFI issues photo
identity cards to registered intermediaries, which is proof of their having acquired the
certification.
National Distributors
The big agents are one-stop sellers of financial products. Agents score over mutual funds on
convenience, choice and quality of service. They operate from multiple locations-for
example, national distributors like Bajaj Capital has more outlets than most mutual funds-and
are supported by an army of registered agents, some of whom are willing to come to our
doorstop and sell schemes to you. Further, while a mutual fund offer its schemes, a big agent
has the biggest stock among all mutual fund sellers, selling virtually all schemes of virtually
every fund house, as well as other investment products. For us, this means more choice. If we
know the scheme we want to invest in, go to an agent, fill up the scheme’s form and give in a
cheque. Even if we don’t know which scheme we want to invest in, a good agent will
understand our need and help you pick a scheme. The agent should understand our reasons
for investing in a mutual fund and based on that offer us appropriate options, and let us make
a choice. An agent is supposed to be impartial and not show a preference towards a particular
fund house. The very nature of the relationship between an intermediary and fund houses
opens up the possibility of bias. Fund houses pay intermediaries a commission linked to the
business they bring in. If fund house X pays a higher commission than fund house Y, an
intermediary might push scheme X, as it stands to earn more. How do we know that we are
MBA MARKETING PROJECT REPORT Page | 32
SAAB MARFIN MBA
being misguided or not? The entry load charged by a scheme can offer us some clues. The
entry load represents the upfront costs an investor pays to invest in a scheme, and the agent’s
commission tends to flow out of it. The higher the entry load, chances are, the higher the
agent’s commission. If the agent is pushing the higher load scheme, perhaps he is more
interested in maximizing his commission than our returns. Hence always know the entry load
being charged by a scheme. Till mid 2002, intermediaries passed on a part of their
commission to investors, as an incentive to invest. The amount of cash paid depended largely
on much they got from a fund house. Obviously the more they got form the fund house, the
more they passed on to investors. This often created an unhealthy situation, where cash
incentives, and not investment-worthiness, determined which scheme, an agent
recommended. In June 2002, to stop such abuse, SEBI made it illegal for intermediaries to
give money and gifts to investors. Although intermediaries can’t lure you with money now
(legally speaking that is), their commission-based earnings structure means a distributor
could still be a partial to a fund house. Which is why, listen to what an intermediary to say
but also do the homework, and use your judgement to make an informed decision.
Banks
A number of banks, especially the private and foreign ones, are into marketing the mutual
fund schemes. Many of them market not only their own schemes, but also those of their rivals
as a point of purchase; banks are a good option because of their fantastic reach-banks can be
founded in every neighborhood. This wide reach has enabled banks to emerge as a major
distributor. In 1999, barely 10 percent of fresh mutual fund sales were made through banks;
during 2003, various estimates put the share of banks in mutual fund sales at between 30
percent and 50 percent. In terms of scope of service, banks are a notch below agents.
Whatever your profile or investment amount might be, an agent will offer you personalized
service-he will listen to your investment needs, offer you information on various schemes as
asked by you, and suggest investment options. However, typically a bank will not give you
this option or attention, unless you are a big money client and subscribe to its wealth
management services. What banks will do, unconditionally, is help you through the
investment formalities like filling up a form and offering basic information. But things are
changing and banks are also giving personalized service to its retail investors also.
MBA MARKETING PROJECT REPORT Page | 33

SAAB MARFIN MBA
Individual Financial Advisors
Big brokers combine the attributes of agents (one-stop shop, personalized service) and banks
(a team of analyst who crack the mutual fund industry). This service, though usually comes at
a cost, and is reserved for their clients. Small brokers, on the other hand, welcome retail
investors, but most of them market schemes of select fund houses only. These are
independent professionals trained to advice you on all personal finance matters. They all sell
financial products, as agents currently do. Unlike agents, though, CFPs might charge you for
their services.
The Internet
At present, around 3 percent of mutual fund transactions are done online. This figure is bound
to increase, with better Net connectivity are also expected to tie up with more banks, which
will bring more investors into the loop.The other move that will provide a fillip to online
transactions to be supplemented by physical documentation. At present, some fund houses
enable buying-and in some instances, selling on three platforms:
1. Own websites-- Most of the mutual fund houses let you buy and sell the units of their
schemes through their websites. All you need is a Net banking account with any of the banks
the fund houses have tied up with. You log on to the fund’s site, choose your scheme and
investment amount. A link on the website takes you to the website of the designated bank,
where you make your payment.
Money is transferred from your Net banking account to the mutual fund and units are allotted
to you instantaneously. The transaction is also documented in the physical form-the fund
houses send you the application form to sign, and send back. Once you have done an online
transaction with a fund house, you can open an online account with it. This will enable you to
sell your holdings, switch between the schemes and purchase additional units-at the click of a
mouse.
2. Financial Portals-- You can also buy units of several mutual funds through financial
portals as myiris.com, timesofmoney.com and indiainfoline.com among others. The process
and requirements are similar to that of for buying through the fund’s site. However, most
portals enable only purchase.
3. Online trading portals-- Share trading portals like ICICI Direct (icicidirect.com) and
Sharekhan (sharekhan.com) too offer a fair number of mutual fund schemes on their
MBA MARKETING PROJECT REPORT Page | 34

SAAB MARFIN MBA
platforms. Registered user can buy or sell their units on offer, just like a stock-at no extra
cost.
SBI Mutual Fund Gurgaon has 30 IFAs and NDs and they also sell mutual fund through all
its SBI branches in Gurgaon and some of the private banks like Axis bank. Some brokerage is
charged by NDs and IFAs, no brokerage is given for sales through SBI branches and direct
selling through head Office of SBI mutual Fund.
MBA MARKETING PROJECT REPORT Page | 35

SAAB MARFIN MBA
Learning’s from the internship –
I was put into the distribution channel of SBI mutual Fund. Most of the time was spent selling
and promoting SBI mutual fund in MR branch of SBI. Since only small investors visit that
bank so I was asked to focus mainly on two schemes of equity diversified segment of SBI
mutual fund – SBI MSFU Contra Fund, SBI MSFU Emerging Business Fund and SBI
Magnum Taxgain fund (for tax saving). Emerging Business Fund has also been rated five
stars by moneycontrol.com. Contra Fund and Taxgain fund are most famous funds of SBI
mutual fund. Most of the investors I came across had already heard about Contra and Taxgain
fund. I gained a good knowledge of Mutual fund and also a nice experience of selling mutual
funds through this internship. After spending some weeks in SBI banks I visited other
channels of Distribution. I was sent to various IFAs, National Distributors and Private Banks.
Promotion of new brokerage plan for SIP and MIP was also done while visiting IFA’s and
national Distributors. Through interaction with them I found out that SBI had a tough
competition with Reliance, Birla SL, HDFC, DSP BR, UTI, IDFC, Fidelity and ICICI
prudential. Investors especially big investors who have already invested in mutual funds
preferred these companies over SBI. Services offered by private companies were better than
that of SBI. I have shortlisted some schemes in the same segment i.e. equity diversified
scheme to compare with MSFU contra fund and MSFU emerging business fund. Based on
rankings on www.moneycontrol.com and feedback from various investors and NDs and also
survey in banks like ICICI, Indusind etc. I identified ICICI prudential discovery fund, HDFC
top 200 and Reliance RSF – equity to compare with MSFU contra and emerging business
Fund.
TTTOP 15 OPEN ENDED -DIVERSIFIED FUNDS - PERIOD (LAST 5 YEARS)
MBA MARKETING PROJECT REPORT Page | 36

SAAB MARFIN MBA
Rank Scheme Name Date NAV (Rs.) Last 5
Years %
1 HDFC Equity Fund - Growth May 14 , 2010
240.076 28.5332
2 HDFC Top 200 - Growth May 14 , 2010
183.755 28.4923
3 ICICI Prudential Dynamic Plan - Growth
May 14 , 2010
95.6179 28.0848
4 Reliance Growth - Growth May 14 , 2010
444.0182 27.6988
5 DSP BlackRock Top 100 Equity Fund - Growth
May 14 , 2010
89.795 27.6583
6 Sundaram BNP Paribas Select Midcap - Growth
May 14 , 2010
136.1424 27.3918
7 SBI Magnum Multiplier Plus 93 - Growth
May 14 , 2010
76.07 27.2716
8 Birla Sun Life Frontline Equity Fund - Plan A - Growth
May 14 , 2010
79.89 26.9049
9 SBI Magnum Sector Umbrella - Contra Fund - Growth
May 14 , 2010
54.36 26.6358
10 Reliance Equity Opportunities Fund - Growth
May 14 , 2010
31.66 25.991
11 Reliance NRI Equity Fund - Growth May 14 , 2010
35.8151 25.8727
12 SBI Magnum Equity Fund - Growth May 14 , 2010
39.38 25.756
13 Birla Sun Life Mid Cap Fund - Plan A - Growth
May 14 , 2010
105.88 25.5568
14 DSP BlackRock India Tiger Fund - Growth
May 14 , 2010
44.928 25.5228
15 Sundaram BNP Paribas Select Focus - Growth
May 14 , 2010
83.6513 25.3097
*Note:- Returns calculated for less than 1 year are Absolute returns and returns calculated for more than 1 year are compounded annualized.
Source – www.mutualfundsindia.com
From the above table it is clear that magnum contra fund and HDFC Top 200 have been
ranked in top 10 for the period of last 5 years with an average return of 26.6%.
MBA MARKETING PROJECT REPORT Page | 37

SAAB MARFIN MBA
TOP 15 OPEN ENDED -DIVERSIFIED FUNDS - PERIOD (LAST 3 YEARS)
Rank Scheme Name Date NAV (Rs.) Last 3
Years %
1 IDFC Premier Equity Fund - Plan A - Growth May 14 , 2010
28.5311 23.4317
2 Reliance Regular Savings Fund - Equity - Growth
May 14 , 2010
28.2826 21.5581
3 ING Dividend Yield Fund - Growth May 14 , 2010
21.23 21.3639
4 Sundaram BNP Paribas SMILE Fund - Growth
May 14 , 2010
31.7935 20.4443
5 ICICI Prudential Discovery Fund - IP- Growth May 14 , 2010
19.59 19.8633
6 Birla Sun Life Dividend Yield Plus - Growth May 14 , 2010
75.73 19.7577
7 UTI Dividend Yield Fund - Growth May 14 , 2010
28.64 18.9938
8 UTI Opportunities Fund - Growth May 14 , 2010
23.86 18.9221
9 ICICI Prudential Discovery Fund - Growth May 14 , 2010
44.26 18.3609
10 HDFC Top 200 - Growth May 14 , 2010
183.755 17.4927
11 Canara Robeco Equity Diversified - Growth May 14 , 2010
50.52 17.1731
12 Tata Dividend Yield Fund - Growth May 14 , 2010
29.3495 17.1138
13 Reliance Growth - Growth May 14 , 2010
444.0182 16.4405
14 Tata Equity P/E Fund - Growth May 14 , 2010
44.2171 16.4259
15 HDFC Equity Fund - Growth May 14 , 2010
240.076 16.4196
*Note:- Returns calculated for less than 1 year are Absolute returns and returns calculated for more than 1 year are compounded annualized.
From the above table it is seen that none of the SBI schemes have been in top 15 if take last 3
years data, though HDFC top 200 is still there on 10 th rank. Other schemes from different
company have come up like – ICICI prudential discovery fund – Growth and Reliance
regular savings fund growth.
MBA MARKETING PROJECT REPORT Page | 38

SAAB MARFIN MBA
TOP 15 OPEN ENDED -DIVERSIFIED FUNDS - PERIOD (LAST 6 MONTHS)
Rank Scheme Name Date NAV (Rs.) Last 6
Months %
1 ICICI Prudential Discovery Fund - IP- Growth May 14 , 2010
19.59 21.7526
2 ING Dividend Yield Fund - Growth May 14 , 2010
21.23 21.4531
3 ICICI Prudential Discovery Fund - Growth May 14 , 2010
44.26 21.0613
4 ICICI Prudential Emerging STAR Fund - IP - Growth
May 14 , 2010
13.37 20.4505
5 Canara Robeco Emerging Equities - Growth May 14 , 2010
20.02 20.3848
6 DSP BlackRock Small and Midcap Fund - Growth
May 14 , 2010
16.087 19.8198
7 ICICI Prudential Emerging STAR Fund - Growth
May 14 , 2010
32.96 19.637
8 Reliance Equity Opportunities Fund - Growth May 14 , 2010
31.66 18.9689
9 SBI Magnum Sector Umbrella - Emerging Businesses Fund - Growth
May 14 , 2010
35.53 18.5519
10 Taurus Ethical Fund - Growth May 14 , 2010
21.34 18.031
11 IDFC Small & Midcap Equity Fund - Growth May 14 , 2010
16.8373 17.2538
12 Fortis Future Leaders Fund - Growth May 14 , 2010
8.785 17.2115
13 UTI Master Value Fund - Growth May 14 , 2010
46.72 17.1808
14 Escorts Growth Plan - Growth May 14 , 2010
74.9237 17.1356
15 Religare Mid Cap Fund - Growth May 14 , 2010
12.87 16.7877
*Note:- Returns calculated for less than 1 year are Absolute returns and returns calculated for more than 1 year are compounded annualized.
From the above table it is seen that neither HDFC top 200 nor Magnum contra fund and nor
Reliance RSF growth are in top 15 but ICICI prudential Discovery fund growth is on 3 rd rank
and SBI MSFU emerging business fund has come up on 9th rank which was nowhere earlier.
MBA MARKETING PROJECT REPORT Page | 39

SAAB MARFIN MBA
Fund Ratings
As on : May 2010
Equity Diversified
Birla SL Dividend Yield (G)
Birla SL Long Term Adv.-Sr1(G)
Birla SL Pure Value Fund (G)
DSP-BR Micro Cap Fund - RP (G)
DSP-BR Small & Mid Cap -RP (G)
ICICI Pru Discovery Fund (G)
ICICI Pru Emerging S.T.A.R.(G)
IDFC Premier Equity - A (G)
IDFC Small&Midcap Eqty -G
Principal LT Equity 3yr Sr2(G)
Reliance Equity Oppor - RP (G)
Reliance RSF - Equity (G)
SBI Magnum Emerging Busi (G)
Sundaram S.M.I.L.E Fund (G)
Sundaram Select Small Cap (G)
UTI Dividend Yield Fund (G)
UTI Master Value Fund (G)
UTI Mid Cap (G)
Above is the 5 star rating given to various funds by www.moneycontrol.com. ICICI
prudential discovery fund growth, Reliance RSF equity growth and SBI Magnum emerging
Business fund Growth have been rated 5 star.
Though HDFC top 200 has been rated 4 star and SBI magnum Contra fund has been rated 1
star. But at the same time valueresearch has rated Magnum contra fund with 4 stars.
MBA MARKETING PROJECT REPORT Page | 40

SAAB MARFIN MBA
Competition Analysis of Various schemes
From the above analysis it is observed that ICICI prudential discovery is giving highest
returns since inception followed by emerging business fund and HDFC top 200, and contra is
MBA MARKETING PROJECT REPORT Page | 41
ICICI Prudential Discovery fund (G)
SBI MSFU
Contra
fund (G)
Reliance
RSF
equity (G)
SBI MSFUemerging business fund (G)
HDFC top
200 (G)FACTS Inception Date 14/8/2004 5/7/1999 9/6/2005 17/9/2004 11/9/1996
Face Value 10 10 10 10 10Fund Size(in Cr.) 971.34 3632.34 2669.98 222.8 7219.5Increase in fund sizesince 31st mar 2010(in Cr.)
95.58 77.65 169.29 17.58 360.66
Expense ratio 2.08 1.91 1.9 2.38 1.8portfolio turnoverratio
223 111 40 198 50.95
NAV latest 44.26 54.36 28.28 35.53 183.7652-week high 45.16 57.28 29.46 37.86 187.8952-week low 23.3 41.23 18.87 21.02 131.99
returns 1 month -0.09 -4.09 -3.58 -3.19 -1.123 months 9.88 3.94 4.72 8.62 7.876 months 21.06 3.54 7.71 18.55 3.931 year 110.16 52.44 74.48 92.68 62.573 years 18.36 11.21 21.56 6.5 17.495 years 25.27 26.64 NA 16.94 28.49Since inception 29.52 19.04 23.41 25.12 23.96
Risk Sharpe -0.11 -0.11 -0.13 -0.2 -0.07Beta 0.82 0.87 0.88 0.99 0.88treynor -0.71 -0.63 -0.75 -1.25 -0.39
Portfolio Market cap (in Cr.) 35,452.31 81,798.56 52,144.25 18,543.08 79,610.86
Large 31.06 63.72 49.92 8.16 80.42Mid 48.61 28.9 31.99 49.86 14.57Small 10.44 1.11 2.08 33.62 2.41No. of stocks 56 80 45 35 66P/e ratio 21.91 26.24 20.2 35.74 24.44
Asset allocation
equity 90.96 93.73 93.37 94.77 97.41
Debt 0 0.97 0 0 0Cash and equivalent 9.04 5.3 6.63 5.23 2.59

SAAB MARFIN MBA
giving lowest returns amongst the following. If we look at Sharpe and Treynor ratio they are
highest for HDFC top 200 followed by contra fund giving the proof of better management
and better performance.
Comparing Beta values indicate that emerging business funds moves exactly with the market
compared to other funds amongst the following. Even in portfolio turnover ratio emerging
business fund is second highest. As it is seen that though SBI schemes are performing very
well but still investors go for schemes offered by other companies because of
1) Less brokerage given to IFAs and NDs,
2) Other companies provide better services comparatively.
3) Bad performance of schemes in the past. Eg. – One India Fund.
4) Even the returns from Magnum Taxgain scheme which has the highest AUM and is one of
the best schemes by SBI was less compared to tax saver schemes of HDFC and Reliance.
5) Complaints like dividend not received or statement not received were frequent.
MBA MARKETING PROJECT REPORT Page | 42

SAAB MARFIN MBA
SBI Magnum MIP v/s Reliance MIP
TOP 10 -MIP FUNDS - PERIOD (LAST 3 MONTHS)
Rank Scheme Name NAV (Rs.) Last 3 Months %
1 HDFC Multiple Yield Fund - Plan 2005 - Growth
15.4639 3.8633
2 Tata MIP Plus - Growth 15.4206 3.1437
3 DWS Twin Advantage Fund - Growth 15.8466 3.1277
4 HDFC Monthly Income Plan - Long Term Plan - Growth
21.51 2.9753
5 Canara Robeco Monthly Income Plan - Growth
28 2.7523
6 HDFC Multiple Yield Fund - Growth 16.8201 2.5841
7 Reliance Monthly Income Plan - Growth
20.5229 2.3351
8 LIC MF Floater - Monthly Income Plan - Growth
17.3964 2.244
9 SBI Magnum Monthly Income Plan - Growth
19.3489 2.1821
10 ICICI Prudential Income Multiplier Fund - Cumulative
18.4546 2.1397
*Note:- Returns calculated for less than 1 year are Absolute returns and returns calculated for more than 1 year are compounded annualized.
Source – www.mutualfundsindia.com
From the above ranking it is concluded that SBI magnum MIP has gained good popularity
and performed really well in the last three months.
TOP 15 MIP FUNDS – Period last 6 months
Rank Scheme Name NAV (Rs.) Last 6 Months %
1 HDFC Multiple Yield Fund - Plan 2005 - Growth
15.4639 6.0544
2 HDFC Multiple Yield Fund - Growth 16.8201 5.3007
MBA MARKETING PROJECT REPORT Page | 43

SAAB MARFIN MBA
3 Canara Robeco Monthly Income Plan - Growth
28 4.5947
4 HDFC Monthly Income Plan - Long Term Plan - Growth
21.51 4.1929
5 Tata MIP Plus - Growth 15.4206 4.1229
6 DWS Twin Advantage Fund - Growth 15.8466 3.755
7 LIC MF Floater - Monthly Income Plan - Growth
17.3964 3.4699
8 UTI Monthly Income Scheme - Growth 18.8858 3.4578
9 Reliance Monthly Income Plan - Growth
20.5229 3.4024
10 Baroda Pioneer Monthly Income Fund - Growth
12.5978 3.3208
11 HDFC Monthly Income Plan - Short Term Plan - Growth
16.4407 3.1263
12 ICICI Prudential Income Multiplier Fund - Cumulative
18.4546 3.0839
13 Birla Sun Life Monthly Income - Growth 34.5834 3.0498
14 SBI Magnum Monthly Income Plan - Floater - Growth
12.3998 2.9584
15 SBI Magnum Monthly Income Plan - Growth
19.3489 2.8059
*Note:- Returns calculated for less than 1 year are Absolute returns and returns calculated for more than 1 year are compounded annualized.
Even in last six months SBI Magnum MIP is in top 15
Source – www.mutualfundsindia.com
TOP 10 MIP FUNDS LAST – 12 months
Rank Scheme Name NAV (Rs.) Last 12 Months %
1 HDFC Multiple Yield Fund - Plan 2005 - Growth
15.4639 17.382
MBA MARKETING PROJECT REPORT Page | 44

SAAB MARFIN MBA
2 HDFC Monthly Income Plan - Long Term Plan - Growth
21.51 14.75
3 HDFC Multiple Yield Fund - Growth 16.8201 14.1468
4 Reliance Monthly Income Plan - Growth
20.5229 13.8807
5 HSBC MIP - Savings Plan - Growth 18.4544 10.8725
6 UTI Monthly Income Scheme - Growth 18.8858 10.2988
7 HDFC Monthly Income Plan - Short Term Plan - Growth
16.4407 9.7701
8 Birla Sun Life MIP - Wealth 25 - Growth 16.9589 9.6535
9 Birla Sun Life Monthly Income - Growth 34.5834 9.2534
10 DSP BlackRock Savings Manager Fund - Aggressive - Growth
18.4164 9.0205
*Note:- Returns calculated for less than 1 year are Absolute returns and returns calculated for more than 1 year are compounded annualized.
Top 5 MIP funds in Last 3 years
Rank Scheme Name NAV (Rs.) Last 3 Years %
1 Reliance Monthly Income Plan - Growth
20.5229 14.7699
2 L&T Monthly Income Plan - Growth 18.8877 12.2357
3 HDFC Monthly Income Plan - Long Term Plan - Growth
21.51 12.1536
4 Canara Robeco Monthly Income Plan - Growth
28 12.0961
5 Birla Sun Life MIP - Savings 5 - Growth
16.681 12.0375
*Note:- Returns calculated for less than 1 year are Absolute returns and returns calculated for more than 1 year are compounded annualized.
MBA MARKETING PROJECT REPORT Page | 45

SAAB MARFIN MBA
Source – www.mutualfundsindia.com
From the above data it is clear that Reliance MIP (G) has been performing consistently well
from last three years.
SBI Magnum MIP has been rated 3 star and Reliance MIP has been rated 5 star by
moneycontrol.com.
Comparison of the above two schemes
SBI Magnum MIP (G)
Reliance MIP (G)
FACTS Inception Date 9/4/2001 13/1/2004 Face Value 10 10 Fund Size(in Cr.) 235.06 4771.44
Increase in fund size since 30th april 2010 (in Cr.) 21.19 333.32
Expense ratio 1.73 1.57
portfolio turnover ratio NA 357NAV Latest 19.35 20.52 52-week high 19.39 20.55 52-week low 17.73 17.69returns 1 month -0.01 0.23 3 months 2.18 2.34 6 months 2.81 3.4 1 year 8.39 13.88 3 years 4.72 14.77 5 years 5.9 13.36 Since inception 7.43 11.83Risk Sharpe -0.13 0.21 Beta 0.78 1.15 Treynor -0.19 0.28Portfolio Market cap (in Cr.) 14,800.17 54,140.31 Large 2.56 13.69 Mid 6.36 4.33 Small 4.65 0.16 No. of stocks 25 70 P/e ratio 33.14 22.98Asset allocation Equity 13.56 18.82 Debt 10.88 46.45
Cash and equivalent 75.56 34.74
MBA MARKETING PROJECT REPORT Page | 46

SAAB MARFIN MBA
Sharpe and Treynor ratio of Reliance MIP is greater than that of SBI MIP giving a proof of
better management and better performance. Though last three months returns have been
almost similar but if we look at long run returns from Reliance MIP are far greater than SBI
MIP. Since sales of SBI MIP is low so the fund size is very small comparatively and it is also
increasing at a very low rate. No. of stocks invested in is also very low.
After continuous interaction with investors, IFA’s and ND’s I identified following factors
which might affect customer’s decision while investing in mutual funds. I used these factors
in form of a questionnaire on likert scale to identify the major factors.
MBA MARKETING PROJECT REPORT Page | 47

SAAB MARFIN MBA
MBA MARKETING PROJECT REPORT Page | 48

SAAB MARFIN MBA
QuestionnaireFactors Affecting Customers’ Decision while investing in mutual Fund
Factor Analysis through SPSS
Total Variance Explained
MBA MARKETING PROJECT REPORT Page | 49
S. No.
Question Strongly disagree
Disagree Neutral Agree Strongly Agree
1 Risk 2 Return3 Income of the investor4 Age of the investor5 Brand Name6 Popularity of the scheme7 Plans available for the scheme (eg. SIP, STP, MIP)8 Date of inception of the scheme9 No. of times Dividend declared for a particular scheme
10 Options available in the scheme (eg.- growth, Dividend, Lock in period)
11 Type of organization (PSU, Private etc.)12 Investor investing in mutual fund for the first time13 Promotion of the brand14 Convincing ability of the sales person15 Knowledge of share market and stocks16 Investor has made some investments in share market17 Investor has other modes of savings (eg. - FDs, Life insurance)18 No. of dependents in the family19 Availability of the mutual fund20 Investor having account in a particular bank21 Tax saving22 For how long does he/she want to invest23 Current market situation24 NAV of the scheme25 Investor's awareness of the financial products26 Type of job of the investor (public/govt., private, business)27 Investor is living in hometown or away28 Recommendation of family member or friend29 For the time period he/she has been working30 Fund manager of the scheme31 Time period for which the organization has been in business32 Savings of the investor
33 Past performance of the scheme

SAAB MARFIN MBA
Comp
onent
Initial Eigenvalues Extraction Sums of Squared Loadings Rotation Sums of Squared Loadings
Total
% of
Variance Cumulative % Total
% of
Variance Cumulative % Total
% of
Variance Cumulative %
1 12.830 38.879 38.879 12.830 38.879 38.879 4.751 14.396 14.396
2 3.331 10.094 48.973 3.331 10.094 48.973 4.283 12.977 27.373
3 2.428 7.356 56.329 2.428 7.356 56.329 4.251 12.882 40.255
4 2.136 6.471 62.800 2.136 6.471 62.800 3.383 10.251 50.506
5 1.853 5.615 68.416 1.853 5.615 68.416 3.275 9.923 60.429
6 1.671 5.064 73.479 1.671 5.064 73.479 3.266 9.897 70.327
7 1.304 3.951 77.430 1.304 3.951 77.430 1.882 5.702 76.028
8 1.263 3.827 81.257 1.263 3.827 81.257 1.725 5.229 81.257
9 .950 2.878 84.135
10 .913 2.767 86.902
11 .727 2.202 89.104
12 .648 1.965 91.069
13 .577 1.748 92.816
14 .446 1.353 94.169
15 .425 1.286 95.456
16 .304 .920 96.376
17 .266 .805 97.181
18 .220 .667 97.848
19 .180 .544 98.392
20 .165 .500 98.892
21 .108 .328 99.220
22 .063 .192 99.411
23 .052 .157 99.568
24 .049 .149 99.717
25 .043 .130 99.847
26 .026 .080 99.927
27 .012 .038 99.965
28 .008 .024 99.989
29 .004 .011 100.000
30 4.173E-16 1.265E-15 100.000
31 2.638E-16 7.994E-16 100.000
32 4.339E-17 1.315E-16 100.000
33 -9.012E-17 -2.731E-16 100.000
MBA MARKETING PROJECT REPORT Page | 50

SAAB MARFIN MBA
Extraction Method: Principal Component Analysis.
In the above table as only first eight components are having their Eigen values more than one
so only these components will be taken into consideration. Out of these eight components
first three have highest variance and they form 56% of the total variance, therefore I will
consider only these three components for my analysis.
Rotated Component Matrixa
Component
MBA MARKETING PROJECT REPORT Page | 51

SAAB MARFIN MBA
1 2 3 4 5 6 7 8
Risk .573 .585 .296 -.042 .123 .343 .108 -.120
Return .557 .067 .143 .187 .458 .454 .113 .031
Income of the investor .304 .759 .158 .148 .009 .152 .173 .091
Age of the investor -.288 .230 .747 .179 .098 .158 .370 -.015
Brand Name .108 .291 .775 .103 -.113 .372 -.042 .123
Popularity of the scheme .210 .177 .817 .070 .077 .017 -.213 .230
Plans available for the
scheme (eg. SIP, STP,
MIP)
.032 .139 .439 -.039 -.013 .192 -.166 .752
Date of inception of the
scheme
.255 .160 .670 -.018 .357 .166 -.161 -.135
No. of times Dividend
declared for a particular
scheme
.022 .161 -.119 .122 .814 .138 .308 -.041
Options available in the
scheme (eg.- growth,
Dividend, Lock in period)
.116 .402 .240 .202 .760 .172 -.211 .085
Type of organization
(PSU, Private etc.)
.793 .163 .250 .113 .085 .017 .058 .294
Investor investing in
mutual fund for the first
time
.506 .154 -.038 .160 .438 .077 .379 -.043
Promotion of the brand .237 .061 .663 .154 .350 -.056 -.192 .450
Convincing ability of the
sales person
.395 .078 .610 .116 -.125 -.200 .057 -.098
Knowledge of share
market and stocks
.309 -.224 .118 .585 .364 .505 -.065 -.045
Investor has made some
investments in share
market
-.124 .075 .022 .804 .056 .012 .451 -.148
Investor has other modes
of savings (eg. - FDs, Life
insurance)
.193 .520 .244 .157 .117 .614 .087 -.208
No. of dependents in the
family
.274 .644 .295 .149 .133 .152 .038 .218
Availability of the mutual
fund
.227 .018 -.108 .079 .072 .028 .851 -.034
MBA MARKETING PROJECT REPORT Page | 52

SAAB MARFIN MBA
Investor having account in
a particular bank
.704 .380 .209 -.128 -.101 .300 .181 .019
Tax saving -.021 .823 .157 .166 .315 .147 .018 -.185
For how long does he/she
want to invest
.300 .468 .078 .562 .243 .360 -.006 -.092
Current market situation -.128 .389 .292 .320 .217 .594 -.144 -.230
NAV of the scheme .176 .137 -.013 -.102 .132 .888 .057 .128
Investor's awareness of
the financial products
.134 .332 .178 .221 .180 .363 -.152 -.550
Type of job of the investor
(public/govt., private,
business)
.527 .268 -.008 .241 .031 .508 .231 .312
Investor is living in
hometown or away
.206 .205 .115 .863 .104 .019 -.060 .072
Recommendation of
family member or friend
.605 .327 .145 .559 .040 -.021 -.072 -.016
For the time period he/she
has been working
.179 .318 .271 .568 .459 .018 .022 -.018
Fund manager of the
scheme
.458 .047 .351 .171 .526 .347 -.072 -.077
Time period for which the
organization has been in
business
.337 .649 .140 .190 .285 -.036 -.325 .105
Savings of the investor .661 .094 .028 .269 .281 .201 .058 -.214
Past performance of the
scheme
.546 .285 .297 .082 .468 .010 -.252 -.209
Extraction Method: Principal Component Analysis.
Rotation Method: Varimax with Kaiser Normalization.
a. Rotation converged in 17 iterations.
Now looking at Rotation component matrix we can see that factors which are most influential
i.e. factors which come under first component are – Factors with their values more than .5 in first component
1. Risk
2. Return
3. Type of organization (PSU, Private etc.)
4. Investor investing in mutual fund for the first time
5. Investor having Account in particular Bank
MBA MARKETING PROJECT REPORT Page | 53

SAAB MARFIN MBA
6. Type of job of the investor
7. Past performance of the scheme
8. Recommendation of family member or friend
9. Savings of the investor
Second most important factors (second component) are –
1. Risk
2. Income of the Investor
3. Investor has other modes of savings
4. No. of dependents in the family
5. Tax Savings
6. Time period for which the organization has been in business
Third most important factors (third component) are –
1. Age of the investor
2. Brand name
3. Popularity of the scheme
4. Date of inception of the scheme
5. Promotion of the Brand
6. Convincing ability of the salesperson
MBA MARKETING PROJECT REPORT Page | 54

SAAB MARFIN MBA
KMO and Bartlett's Test
Kaiser-Meyer-Olkin Measure of Sampling Adequacy. .683
Bartlett's Test of Sphericity
Approx. Chi-Square 431.796
Df 201
Sig. .000
Since KMO and Bartlett’s ratio is more than .5 so the questionnaire was and well understood
by the respondants.
Analysis
1. Risk – it matters most to the investor as he/she is investing his/her hard earned money
2. Returns – returns from the scheme matters most to the investor so SBI MF should try
to increase returns as much as possible.
3. Brand Name – brand name also matters a lot to the investor, since SBI itself has a
good brand name so it was a plus point for the company.
4. No. of times dividend declared. – for investors who want to invest in dividend option,
no. of times dividend declared in the past is very important, so SBI MF should try to
maximize its dividend declaration.
5. Tax saving is also very important for investors, many of them keep this on their first
priority.
6. Awareness of the financial product (Mutual Fund) is very important. Investors having
account in a particular bank is one of the major factors so SBI MF should try to tap
the existing customers of SBI.
7. Type of organization is also very important as investors have a perception that if they
are investing in PSU then their money won’t go anywhere.
8. Type of job of the investor is also important as businessmen are more risk taking and
govt. employees are risk averse.
MBA MARKETING PROJECT REPORT Page | 55
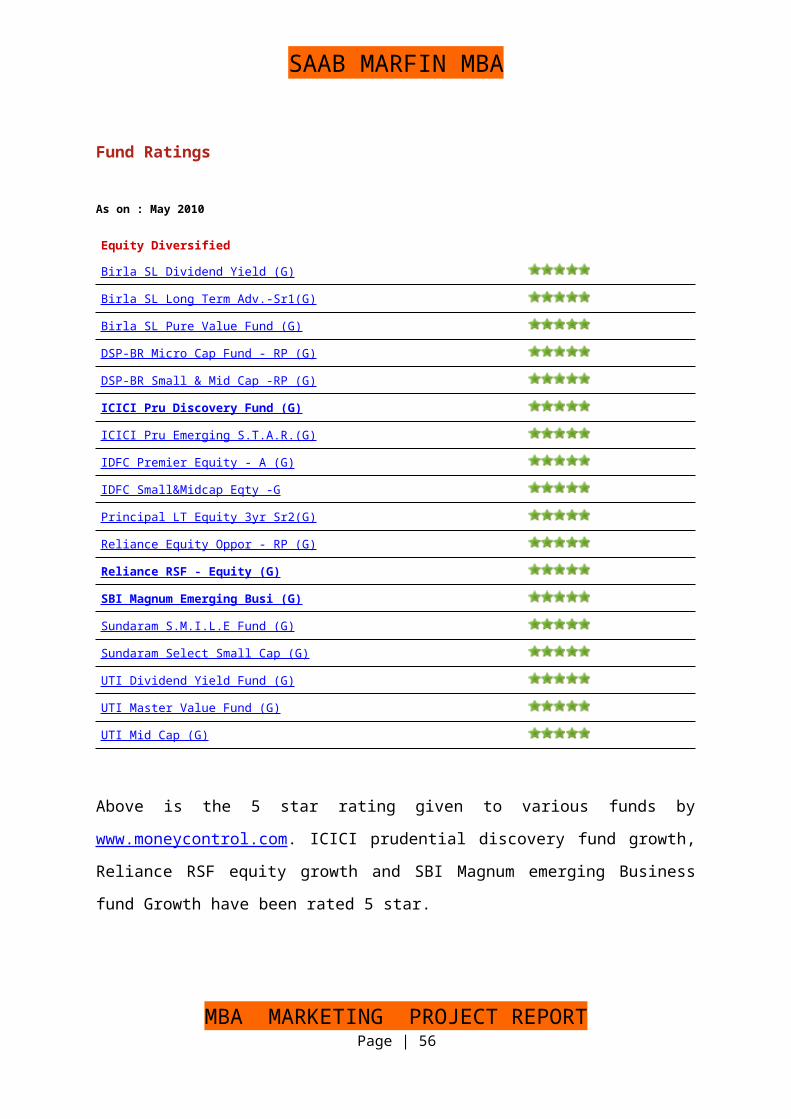
SAAB MARFIN MBA
9. Age of the investor is important as young investors are risk takers so they invest more
in mutual funds and old age investors are risk averse and they usually invest in FDs
10. Risk is a very important factor as investors always look for schemes with least risk eg.
– Schemes which have been giving consistent returns.
11. Investor investing for the first time won’t invest a high amount as they are not sure
about it.
12. Savings is a very important factor – higher the savings higher will be the investment
as no one wants to keep his/her savings without any growth.
13. Past performance of the scheme is also very important as it gives a sense of security
and confidence while investing if the scheme has performed well.
14. Tax saving is also a major factor as most of the investors invests to save tax.
15. Date of inception is important as older the scheme more reliable it will be for the
investor.
16. Promotion of the brand and popularity of the scheme is important as it also gives a
sense of security to the investor.
Recommendations
MBA MARKETING PROJECT REPORT Page | 56

SAAB MARFIN MBA
1. Convincing ability of the salesperson. – since IFAs have a great convincing ability so
SBI mutual fund should keep s good relationship with them by increasing brokerage
and by having regular meetings with them.
2. Spreading awareness about Mutual fund is required, there is a large customer base of
SBI who have no idea about mutual funds, and they need to be tapped. This can be
done through advertisements, road shows etc.
3. Returns from scheme offered by SBI are very low compared to its competitors, so
fund managers should try to increase the returns by changing portfolio.
4. Most of the customers of SBI MF are not satisfied with its service, so organization
should focus on its operations and provide better service to its customers by sending
regular statements and should train its employees to give first preference to customer
satisfaction.
5. HNI segment usually ask for latest NAVs while investing so CREs or sales executive
should be regularly updated with latest NAVs of all the schemes.
6. People who come to SBI bank for investment in FDs, TDS etc should be convinced to
invest in mutual funds as they give more returns comparatively.
7. Young customers having account with SBI should be convinced to invest in MF as
they are risk taking.
8. Schemes like child benefit plan can be promoted to newly married couples or
customers with small children.
9. HNI investors usually invest in dividend option so SBI MF should try to increase no.
of times dividend declared and be at par with the competitors.
10. Schemes which have performed well in past should be advertised and promoted as it
gives a confidence to investors.
MBA MARKETING PROJECT REPORT Page | 57

SAAB MARFIN MBA
LIMITATIONS
1. Research is limited to only Gurgaon Region.
2. Since questionnaire can only be understood by investors who invest in mutual find so
sample mostly consisted of existing customers, internal customers and IFAs.
3. Sample size is only sixty.
4. This project focuses only on Mutual Funds and not on other financial products.
5. This project has mostly catered to the customers of SBI MF and not of other Mutual
Fund companies.
6. Project has covered only well educated people with good knowledge of financial
products.
MBA MARKETING PROJECT REPORT Page | 58

SAAB MARFIN MBA
CONCLUSION
Mutual fund is very good for people who have less knowledge of stock market or who don’t
have enough time to keep a regular check on the market. Mutual Funds are managed by
professionals, so investor doesn’t need to take any tension about his/her money. Selling MF is
a tough task as the product is intangible and the investor doesn’t get anything tangible for the
money he pays except an acknowledgement. Though Mutual Funds are popular but still there
is a large number market who have no idea of mutual funds because awareness of mutual
fund is less compared to life insurance and FDs.
Mutual Fund is a service industry so it is very important for the company to provide good
service and make sure it is at par with its competitors. Eg. – easy process of investment and
redemption, keeping investors updated with NAVs through email or statements etc.
SBI MF has a good name in the mutual Fund industry because of the name SBI attached to it,
since SBI is one of the oldest and biggest banks of India so it has a big hand in spreading
awareness of SBI MF. SBI MF also has a strong distribution network with effective
employees. In fact SBI MF Gurgaon has been awarded best investor desk for increasing the
market share of SBI MF up to 33% in NCR. Mutual Fund is a good industry to work with
because of its transparency and it also with growing literacy rate in India it has a good future.
MBA MARKETING PROJECT REPORT Page | 59

SAAB MARFIN MBA
BIBLIOGRAPHY
1. www.wikipedia.com
2. www.sbimf.com
3. www.mutualfundsindia.com
4. www.amfiindia.com
5. www.moneycontrol.com
6. www.investopedia.com
7. www.economictimes.com
8. www.valueresearchonline.com
9. www.allenandunwin.com/spss.htm
MBA MARKETING PROJECT REPORT Page | 60


