

1
Department of Criminology and Criminal Justice
SCHOOL RESOURCE OFFICERS (SROs) AND THE ARMING
OF SCHOOL TEACHERS OR ADMINISTRATORS AS
RESPONSES TO SCHOOL SHOOTINGS:
RESULTS FROM A STATE CENSUS OF LAW ENFORCEMENT
EXECUTIVES AND PUBLIC SCHOOL PRINCIPALS
South Carolina Law Enforcement Census 2013
Margaret M. Chrusciel
J. Andrew Hansen, M.A.
Jeff Rojek, Ph.D.
Scott Wolfe, Ph.D.
Robert J. Kaminski, Ph.D.
April 2014

2
Table of Contents
EXECUTIVE SUMMARY 3
INTRODUCTION 6
SAMPLE CHARACTERISTICS 7
SRO PREVALENCE 11
SURVEY FINDINGS 16
Support for SROs 17
Impact of SROs 21
Support for arming teachers 22
Support for arming teachers 24
Responsibility for school safety 26
DISCUSSION 27
CONCLUSION 29
APPENDIX A: LAW ENFORCEMENT EXECUTIVES’ RESPONSES 30
APPEBNDIX B: PRINCIPALS’ RESPONSES 37

3
Abstract:
The recent events of the Sandy Hook (CT) school shooting, along with other similar events, have
prompted calls for various strategies to prevent these incidents in the future. One such strategy is
the placement of school resource officers in every elementary, middle, and high school in the
United States. Given that many schools do not have resource officers assigned on a permanent
basis, particularly at the elementary level, this strategy would require considerable investment
from state and local governments. In addition, it requires support from law enforcement and the
K though 12 educational community. The present study examines issues related to school safety
in South Carolina through a statewide survey of law enforcement leaders and school principals at
the K through 12 levels. Both groups were asked about the issues of school safety, support for
resource officers in every school, and their perception of potential effectiveness in prevention. In
addition, both groups were asked about this strategy in relation to the more controversial call for
arming school teachers and/or administrators.
EXECUTIVE SUMMARY
The purpose of the current study is to capture the perspective of South Carolina law
enforcement executives and public school principals regarding the use of SROs, and arming
teachers and/or administrators as a means to improve school safety. In the summer and early fall
of 2013, members of the Department of Criminology and Criminal Justice at the University of
South Carolina conducted two surveys regarding the use of SROs and other school safety
measures as a part of the department’s annual census. One survey was sent to executives of all
228 county and municipal law enforcement agencies in South Carolina and the other was sent to
principals of 1086 public schools across the state of South Carolina. While the surveys were
similar, each was tailored to be specific to the respondents such that law enforcement executives’
questions focused on their jurisdiction and the principals’ survey focused on their school as well
as their district. There were a total of 141 law enforcement executives (62.7%) and 487 public
school officials (44.8%) who responded to the survey.

4
Over half of law enforcement executives report employing SROs and nearly 60% of
principals report having an SRO stationed in their school and an overwhelming majority agree an
SRO should be placed in every school in their jurisdiction/district. Primarily, law enforcement
executives and principals expect SROs to serve as law enforcement in schools, while notably less
expect them to act as mentors/counselors or as teachers. A majority of both groups of
respondents agree that an SRO would improve overall safety in a school and reduce the number
of victims if a school shooting were to occur. However, only about half of the respondents agree
that an SRO would prevent a school shooting from occurring.
Law enforcement and principal respondents were also asked about alternative measures
to school safety, specifically arming teachers and/or administrators. A small portion of law
enforcement executives and public school principals report that they would agree with a policy
that arms teachers in their jurisdiction/district. Following this trend, a minority of respondents
agree that an armed teacher would improve overall school safety. Slightly more of the law
enforcement executives and principals agreed that an armed teacher would reduce the number of
victims if a school shooting were to occur. However, only a minute fraction of respondents
agreed that an armed teacher would prevent a school shooting from occurring.
Law enforcement executives and public school principals are slightly more supportive of
a policy that arms school administrators than a policy that arms teachers. Nonetheless, only a
minority of law enforcement executives and principals agree that an armed administrator would
improve overall school safety and reduce the number of victims if a school shooting were to
occur. Furthermore, even fewer respondents agree that an armed administrator would reduce the
number of victims if a school shooting were to occur. Thus, the responses of law enforcement
5
executives and principals suggest they are more supportive of the use of SROs to maintain
school safety than arming teachers and/or administrators.
Respondents were also asked how strongly they agree that school safety is law
enforcement’s responsibility. A majority of law enforcement executives agree that school safety
is law enforcement’s responsibility while only a minority of principals agrees with this
statement. In sum, the proportion of law enforcement executives that agree school safety is law
enforcement’s responsibility is roughly equal to the proportion of principals that disagree with
the same statement. This suggests that both parties feel responsible themselves for maintaining
school safety. Perhaps law enforcement executives agree with this statement because they
believe it is their duty to maintain safety, regardless of the specific location, while principals
disagree because they feel as though the duty of school safety falls upon their own shoulders.
Thus, although their answers conflict, it is possible that the responses of both the law
enforcement executives and school principals were driven by similar sentiments.

6
INTRODUCTION
In response to recent school shootings, there has been a policy discussion regarding
measures to increase school safety. The primary focus has been on increasing the presence of
school resource officers (SROs) as seen in President Obama’s executive actions announced in
January 2013 which proposed a plan to put up to 1,000 more SROs and counselors in schools as
well as a strategy for providing incentives to schools for hiring SROs (www.whitehouse.gov).
However, there are a number of legislators, and policymakers involved in the nationwide debate
about the best strategy for maintaining safe school environments. Among the proposed safety
measures has been the idea of arming school teachers and/or administrators. Given the nature of
the issue, this conversation has turned into a heated debate with proponents arguing armed
teachers and/or administrators could better protect from active shooters while critics point to the
dangers of bringing a weapon into the school environment. While both sides of the political
debate argue their position, there appears to have been little effort to empirically consider the
perspectives of those most directly impacted by school violence and the subsequent policy
responses. Thus, the purpose of the current study is to capture the perspective of South Carolina
law enforcement executives and public school principals regarding the use of SROs, and arming
teachers and/or administrators as a means to improve school safety.
In the summer and early fall of 2013, members of the Department of Criminology and
Criminal Justice at the University of South Carolina conducted two surveys regarding the use of
SROs and other school safety measures as a part of the department’s annual census. One survey
was sent to executives of all South Carolina law enforcement agencies and the other was sent to
principals of public schools across the state of South Carolina. While the surveys were similar,
each was tailored to be specific to the respondents such that law enforcement executives’
questions focused on their jurisdiction and the principals’ survey focused on their school and

7
their district. Also, because law enforcement employs SROs, they were also asked about the
training provided to the SROs and other related issues. Principals, on the other hand, were asked
about their experience with the SRO in their school and the impact of SROs from the perspective
of those within the school.
The survey is broken into three primary sections. First, both surveys ask for general
information about the agency or school (i.e., size, type, etc.) at which the respondent is
employed. Next, the survey poses questions pertaining to perceptions of SROs including their
role, impact, and effectiveness in maintaining school safety. Schools principals that report
having at least one SRO stationed in their school are then asked about their perceptions of the
SRO(s) in their school and the types of relationships that their SRO(s) have with teachers and
students. Finally, both surveys inquire about perceptions of armed teachers and armed
administrators as school safety measures. This last section also includes a few more general
questions about school security issues such as the best method to maintain school safety and the
most effective response to potential school shooting. Each survey concludes with an open-ended
section which calls for any additional concerns on which the respondent may wish to comment.
SAMPLE CHARACTERISTICS
The population used for this study included a total of 228 law enforcement agencies and
1086 public schools in South Carolina from which our sample was drawn. In order to encourage
response, a modified Dillman method was used which relies on multiple contacts to increase the
likelihood of survey participation1. First, both law enforcement agencies and public schools
received an initial survey packet which included a cover letter that outlined the purpose and
1 Dillman, D. A. (2007). Mail and internet surveys: The tailored design method (2
nd Ed.). Hoboken, NJ: John Wiley
& Sons.

8
relevance of the survey and also provided directions to access to a secure, online version of the
survey. Because law enforcement agencies in South Carolina have participated in the annual
census in the past, their questionnaire included questions that provided identifying information;
however, the cover letter they received explained that any information provided by the
respondents is not only voluntary, but would be kept anonymous. On the other hand, South
Carolina schools have no past experience with the annual census and thus, their questionnaire
involved only demographic information that cannot be used to identify them in any way. Given
an appreciation of the controversial nature of the topic, the cover letter that was sent to the public
schools explained this anonymity and the voluntary nature of the survey. Also included in the
first survey packet that was mailed to the public schools was a letter from the Department of
Education at the University of South Carolina that encouraged the principals’ participation and
also offered support for the merit of our study.
Approximately two weeks later, a follow-up letter was sent to each law enforcement
agency and public school expressing appreciation to those who responded and requesting the
participation of those who had not. Around three weeks after the follow-up letter was sent,
another survey packet was sent to law enforcement agencies and public schools including a cover
letter and questionnaire. Because there was no method by which those who already responded
could be identified, all schools in the sample received a follow-up letter and a second survey,
even if they had already responded to the first survey.
In the end, respondents include 141 law enforcement agencies comprising 61.8% of the
original sample. Table 1 presents characteristics of the responding agencies in comparison to the
total number of agencies sampled for this study. A majority of responding agencies are police
departments (N=98, 69.5%) while there are considerably less respondents from sheriff’s offices

9
(N=34, 24.1%), departments of public safety (N=8, 5.7%), and highway patrol (N=1, 0.7%).
This is consistent with the proportions of agencies comprising the sample. Sheriff’s offices
(73.9%) and departments of public safety (66.7%), however, had higher response rates than
police departments (58.0%) as a result of our sampling strategy.
Table 1. Respondent and population characteristics of law enforcement executives.
Respondent
Characteristics (N=141)
Population
Characteristics (N=228)
Response
Rate
Number of
Agencies
% Number of
Agencies
%
Agency Type
Police Department 98 69.5 169 74.1 58.0%
Sheriff’s Office 34 24.1 46 20.2 73.9%
Public Safety 8 5.7 12 5.3 66.7%
Highway Patrol 1 0.7 1 0.4 100.0%
Number of Sworn
Officers
1 – 9 52 36.9 -- -- --
10 – 24 17 12.1 -- -- --
25 – 49 30 21.3 -- -- --
50 – 99 19 13.5 -- -- --
100 – 249 16 11.3 -- -- --
250+ 7 5.0 -- -- --
Total 141 100.0 228 100.0 61.8%
South Carolina public school principals were surveyed with the same strategy used with
the law enforcement executives. Table 2 presents characteristics of the respondents in
comparison to the population of public schools from which they were drawn. Public school
respondents represent 44.8% (N=487) of the population. Elementary schools include students in
kindergarten through the fifth grade, middle schools include grades six through eight, and high
schools include grades nine through twelve. Intermediate schools include students in the fourth
grade through the sixth grade, and thus the students in attendance at intermediate schools are
generally slightly younger than those at a middle school. A majority of the respondents are at the

10
elementary level (N=229), followed by high schools (N=113) and middle schools (N=110).
Approximately 2% of the responding principals (N=10) identified their school as an
elementary/middle school, which means that their school includes students in the first grade
through the eighth grade. Likewise, approximately 3% of the responding principals (N=14)
identified their school as a middle/high school which includes students from the grade six
through twelve, thus encompassing students in both middle and high schools. Of the three
primary school levels (elementary, middle, and high) the response rate is the lowest for
elementary schools (39.8%) and highest for high schools (56.7%).
Table 2. Respondent and population characteristics of public school principals.
Respondent
Characteristics (N=487)
Population
Characteristics (N=1086)
Response
Rate
Number of
Schools
% Number of
Schools
%
School Type
Elementary 229 47.0 576 53.0 39.8%
Middle 110 22.6 238 21.9 46.2%
High 113 23.2 199 18.3 56.7%
Elementary/middle 10 2.1 21 1.9 47.6%
Middle/high 14 2.9 14 1.3 100.0%
Intermediate 3 0.6 17 1.6 11.7%
Other 5 0.8 21 1.9 23.8 %
Missing 3 0.6 -- -- --
School Size
Less than 100 2 0.4 -- -- --
100-299 37 7.6 -- -- --
300-499 135 27.5 -- -- --
500-699 127 26.0 -- -- --
700-999 112 23.0 -- -- --
1000-1199 20 4.3 -- -- --
1200-1399 13 2.7 -- -- --
1400-1599 14 2.9 -- -- --
1600-1799 13 2.9 -- -- --
1800-1999 5 1.0 -- -- --
2000-2999 5 1.0 -- -- --
Missing 4 0.8 -- -- --
Total 487 100.0 1086 100.0 44.8%

11
SRO PREVALENCE
With respect to SRO prevalence, approximately 56.7% (N=80) of South Carolina law
enforcement executive survey participants report currently employing SROs and 60.8% (N=295)
of South Carolina schools report currently having an SRO stationed in their school. In other
words, over half of both law enforcement agencies and public schools in our sample currently
have experience with at least one SRO.
Figure 1. Percent of South Carolina law enforcement agencies that employ SROs.
44.2%
56.7%
Does your agency currently employ SROs?
No
Yes

12
Figure 2. Percent of South Carolina public schools in which SROs are stationed.
Table 3 presents the minimum, maximum, and average number of SROs employed by the
agencies by agency size. Agency size is defined by the number of full-time sworn officers
employed by the agency as reported by the law enforcement executive. There are a total of 80
agencies that report currently employing at least one SRO. The average number of SROs
employed by these agencies is nine; however, larger agencies generally employ greater numbers
of SROs than the smaller agencies. In fact, every agency that has nine or less full-time officers
and currently employs SROs reports having only one full-time SRO position, while none of the
agencies that employ over 100 full-time sworn officers employ only one SRO. Furthermore,
none of the agencies that employ over 250 full-time sworn officers have less than four SRO
positions and one of these large agencies employs as many as 73 SROs.
39.2%
60.8%
Are there any SROs currently stationed in your school?
No
Yes

13
Table 3. Descriptive statistics for number of SROs by agency size.
Size of agency
# of agencies in size
category employing at
least one SRO
Minimuma
Maximumb
Meanc
1-9 officers 4 1 1 1.0
10-24 officers 9 1 5 2.0
25-49 officers 26 1 5 3.1
50-99 officers 19 1 8 3.6
100-249 officers 16 2 16 6.8
250 or more officers 6 4 73 32.0
Total 80 1 73 9.4 a Minimum = the minimum number of SROs employed by at least one agency in each size category
b Maximum = the maximum number of SROs employed by at least one agency in each size category
c Mean = the average number of SROs employed by agencies in each size category
Table 4 presents the number of SROs presents the number of SROs currently stationed in
the 225 surveyed public schools that reported having at least one SRO stationed in their school
partitioned across each of the education levels. There are a total of 295 principals that report at
least one SRO currently stationed in their school, including 225 full-time SRO positions and 73
part-time SRO positions. In general, the number of full-time SROs increases as education level
increases such that full-time SROs are most common in high schools (N=102) and part-time
SROs are most common in elementary schools (N=54). Both high school (N=6) and middle
school (N=10) principals report very few part-time SROs stationed in their school. However,
despite the predominance of part-time SROs in elementary schools, there are also 29 full-time
SROs reportedly stationed in elementary schools.

14
Table 4. School type by SRO presence
School Type # of schools that report
having at least one SRO
Have at least one
full-time SRO
Have at least one
part-time SRO
Elementary 82 29 54
Middle 95 85 10
High 106 102 6
Elementary/Middle 2 1 1
Middle/High 8 8 0
Intermediate 0 0 0
Other 2 0 2
Total 295 225 73
Figure 3 depicts the number of years that the responding law enforcement agencies have
employed SROs. A majority of law enforcement executives report employing SROs for 11 to 15
years (N=27, 33.8%), but a large number of agencies have also employed SROs for 16 to 20
years (N=22, 27.5%). In contrast, very few have employed SROs for less than five years (N=4,
5%) or more than 21 years (N=6, 7.5%). Thus, it follows that most law enforcement agencies in
South Carolina have employed SROs for more than 10 years but less than 20 years.

15
Figure 3. Number of years that law enforcement agencies have employed SROs.
Figure 4 presents the number of years that public school principals report having at least
one SRO stationed in his/her school. Unlike the law enforcement agencies, a majority of public
school principals report having an SRO stationed in their school for six to ten years (N=101,
34.2%) and a nearly equal portion have had an SRO stationed in their school for five years or
less (N=99, 33.6%). However, only about 5% of principals report having an SRO stationed in
their school for more than 16 to 20 years (N=15) and less than 1% of school principals (N=2)
report having an SRO for more than 20 years. Thus, although most law enforcement agencies
report employing SROs for approximately 10 to 20 years, most public schools have had an SRO
stationed in their school for less than ten years (N=200, 67.8%).
0
5
10
15
20
25
30
5 years or less 6-10 years 11-15 years 16-20 years 21 years or more
Nu
mb
er o
f A
gen
cies
Length of SRO Employment
How many years has your agency employed SROs?

16
Figure 4. Number of years that SROs have been stationed in public schools.
SURVEY FINDINGS
Law enforcement and principal respondents were presented a series of statements
regarding SROs, arming teachers and/or administrators, and other school safety measures. They
were asked to respond how strongly they agree or disagree with each of the statements on a four
point scale (1 = strongly disagree, 2 = disagree, 3 = agree, and 4 = strongly agree). For
purposes of the following discussion, these categories were collapsed into “agree,” which
includes those who strongly agree and agree, and “disagree,” which includes those who disagree
and strongly disagree. These two categories are used for every question discussed in the
following sections. If interested in the full breakdown of these categories for each question,
please see Appendix A for the law enforcement responses and Appendix B for principals’
responses.
0
20
40
60
80
100
120
5 years or less 6-10 years 11-15 years 16-20 years 21 or more years
Nu
mb
er o
f Sc
ho
ols
Length of SRO presence
How many years have you had an SRO stationed in your school?

17
Support for SROs
Both the law enforcement executives and school principals were asked about their
feelings regarding the use of SROs to maintain school safety. Figure 5 indicates that more than
95% of both the law enforcement executives and school principals agree with the statement that
“SROs should be placed in public schools in your jurisdiction/district.” In fact, nearly 75% of
law enforcement executives strongly agree that SROs should be placed in public schools in their
jurisdiction while none strongly disagree. Although less dramatic, a similar trend is noted in the
principals’ responses, with almost 65% of principals who strongly agree SROs should be placed
in public schools in his/her district while only eight principals strongly disagree (1.7%).
Figure 5. Do you agree or disagree that SROs should be placed in every school?
97.8% 96.5%
2.2% 3.5%
0.0%
20.0%
40.0%
60.0%
80.0%
100.0%
Law Enforcement Executives School Principals
SROs should be placed in every school
Agree Disagree

18
Support for a policy that requires at least one SRO in every public school seems to
depend on the manner in which SROs are funded. In general, support for such a policy is greater
if these SROs would be externally funded and this support waned if these SROs were to be
entirely agency or district funded. As presented in Figure 6, nearly 75% of law enforcement
executive respondents (N=99) indicated they would support a policy that required at least one
SRO in every school if it were entirely externally funded, but this number decreases dramatically
to only about 10% (N=13) if this practice were to be entirely agency funded. Although less
distinctive, Figure 7 indicates that this trend is also reflected in the responses of the school
principals with nearly 59% (N=287) supporting such a policy if it were to be entirely externally
funded and 30.0% (N=146) supporting the policy if it were entirely district funded. However,
this also suggests that school principals are generally more supportive of a policy that requires at
least one SRO in every school. In fact, only 3.7% of principals would not support the policy
regardless of how it would be funded.

19
Figure 6. Law enforcement support for SROs in every school by funding
Figure 7. School principal support for SROs in every school by funding
9.8%
40.6%
74.4%
0.0%
20.0%
40.0%
60.0%
80.0%
100.0%
Entirely internally funded Partially internally funded Entirely externally funded
Pe
rce
nt
of
Law
En
forc
eme
nt
Exec
uti
ves
Law enforcement support for policy which mandates an SRO in every school
30.0%
57.7% 58.9%
3.7%
0.0%
20.0%
40.0%
60.0%
80.0%
100.0%
Entirely internallyfunded
Partially internallyfunded
Entirely externallyfunded
Would not support atall
Pe
rcen
t o
f P
rin
cip
als
Support for policy which mandates an SRO in every school

20
In order to better understand this trend, it is helpful to examine the roles that law
enforcement and principals expect the SRO to fill in the school. This information is presented in
Table 5. It is important to note that respondents were asked to select at least one role that they
expected the SRO to fill and thus they could check all four boxes if they expected SROs to serve
as law enforcement, a counselor/mentor, a teacher, and some other role. Over 94% of both law
enforcement executives (N=132) and school principals (N=461) reported that they expect SROs
to serve a “law enforcement” function in schools. Approximately 80% of law enforcement
executives (N=120) and school principals (N=394) also selected “counselor/mentor” as a role
they expected the SRO to fulfill. Notably fewer respondents identified the role of “teacher” as
one that the SRO was expected to fill, with only 37% of law enforcement executives (N=50) and
24% (N=119) of principals including this role in their response.
Table 5. The expected role(s) of an SRO according to law enforcement executives and principals.
Counselor/mentor
N (%)
Teacher
N (%)
Law Enforcement
N (%)
Other
N (%)
Law Enforcement
Executives
109 (80.7%) 50 (37.0%) 132 (97.8%) 5 (3.7%)
School Principals 394 (80.9%) 119 (24.4%) 461 (94.7%) 65 (13.3%)
In addition to law enforcement, counselor/mentor, and teacher, about 4% of the law
enforcement executives and approximately 14% of public school principals also named a number
of “other” roles they expected SROs to fill in schools. “Other” roles identified by law
enforcement executive include “security” (N=2) and “liaison” (N=2), and the most common
“other” role identified by public school principals that they expected of SROs includes “role
model” (N= 8), “community liaison” (N=6), “security-related positions” (N=5) and “safety-
related positions” (N=5) (e.g., safety inspections and safety training). Additional expected roles
that the public school principals identified include “traffic duties” and “maintaining a visual
presence.”

21
Along with the expected roles of SROs, law enforcement executives and school
principals were asked to identify what they perceived to be the primary role of the SRO and
these results are presented in Table 6. Nearly 96% of law enforcement executives (N=130) and
over 82% of school principals (N=401) identify “law enforcement” as the primary role of an
SRO while less than 25% of law enforcement executives (N=30) and principals (N=115) believe
“counselor/mentor” to be the primary role of the SRO and approximately 5% of law enforcement
(N=7) and principal (N=15) respondents identify “teacher” as the primary role of the SRO.
Table 6. The primary role of the SRO according to law enforcement executives and school principals.
Counselor/mentor
N (%)
Teacher
N (%)
Law Enforcement
N (%)
Other
N (%)
Law Enforcement
Executives
30 (22.1%) 7 (5.1%) 130 (95.6%) 2 (1.5%)
School Principals 115 (23.6%) 15 (3.1%) 401 (82.3%) 33 (6.8%) * Note: Respondents were instructed to select one primary role of the SRO, but because a majority of respondents
selected more than one role, this question was treated as though respondents could check all that apply.
Impact of SROs
Table 7 presents the perceptions of law enforcement executives and school principals
regarding the impact SROs may have on school safety. Consistent with the sense of support for
the placement of SROs in schools, over 99% of law enforcement executives (N=135) and over
95% of school principals (N=464) agree that SROs improve overall schools safety. The same
pattern continued with respect to respondents’ perspectives of SROs in active shooter situations.
Approximately 92% of both law enforcement executives (N=124) and school principals (N=440)
agreed that SROs would reduce the number of victims if a school shooting were to occur. On the
other hand, about 55% of law enforcement executives (N=76) and 51% of school principals
(N=238) agreed that an SRO would prevent a school shooting from occurring. Thus, both law
enforcement executives and school principals in South Carolina support the use of SROs in

22
public schools and their responses suggest that, in general, they believe SROs can be an effective
measure in maintaining school safety.
Table 7. The impact of SROs on schools as reported by law enforcement executives and public
school principals.
Law Enforcement Agencies Public School Principals
Agree
N (%)
Disagree
N (%)
Agree
N (%)
Disagree
N (%)
Improve school safety 135 (99.3%) 1 (0.7%) 464 (96.3%) 18 (3.7%)
Prevent school shootings 76 (56.3%) 59 (43.7%) 238 (51.0%) 229 (49.0%)
Reduce number of victims if school
shooting were to occur
124 (91.9%) 11 (8.2%) 440 (92.2%) 37 (7.8%)
Support for arming teachers
Figure 7 presents law enforcement executives’ and public school principals’ level of
support for policies in their jurisdiction/district that would arm school teachers. Unlike the
overwhelming support for the placement of SROs in every school (approximately 95% of both
law enforcement and principals), only about 25% of law enforcement executives (N= 35) agree
with a policy that would arm teachers in their jurisdiction and less than 10% of school principals
(N=44) agree with such a policy. Overall, this finding suggests that law enforcement executive
and principal respondents are not supportive of arming teachers in an effort to improve school
safety. This is evident when considering how strongly law enforcement and principals agree or
disagree with such a policy. Approximately 47% of law enforcement (N=64) strongly disagree
with a policy that would arm teachers in their district’s schools, and more notably, about 65% of
principals also strongly disagree with a policy that would arm teachers. Conversely, only about
3% of respondent law enforcement executives (N=4) and principals (N=13) strongly agree with
such a policy.

23
Figure 7. Law enforcement executives’ and public school principals’ level of agreement with a
policy that arms teachers in their jurisdiction/district.
Table 8 presents the law enforcement executives’ and public school principals’
perceptions regarding how arming teachers in public schools may impact school safety.
Consistent with respondents’ attitudes toward such a policy, only 27% of law enforcement
executives (N=38) and less than 10% of school principals (N=46) believe arming teachers would
improve overall school safety. Although there is greater support for the role of armed teachers in
reducing the number of victims if a school shooting were to occur, a majority of both law
enforcement executives and school principals disagree. Less than half of law enforcement
executives (N=65, 47.4%) and even fewer school principals (N=119, 25.3%) agree that armed
teachers may help reduce the overall number of victims during an active shooter situation.
Furthermore, only 11% of law enforcement executives (N=16) and 4% of school principals agree
that armed teachers would prevent school shootings from occurring. Table 8 also suggests that
law enforcement executives feel more favorably towards arming teachers than do the principals.
25.6%
9.3%
74.4%
90.7%
0.0%
20.0%
40.0%
60.0%
80.0%
100.0%
Law Enforcement Executives School Principals
Level of agreement with a policy that arms teachers
Agree Disagree
24
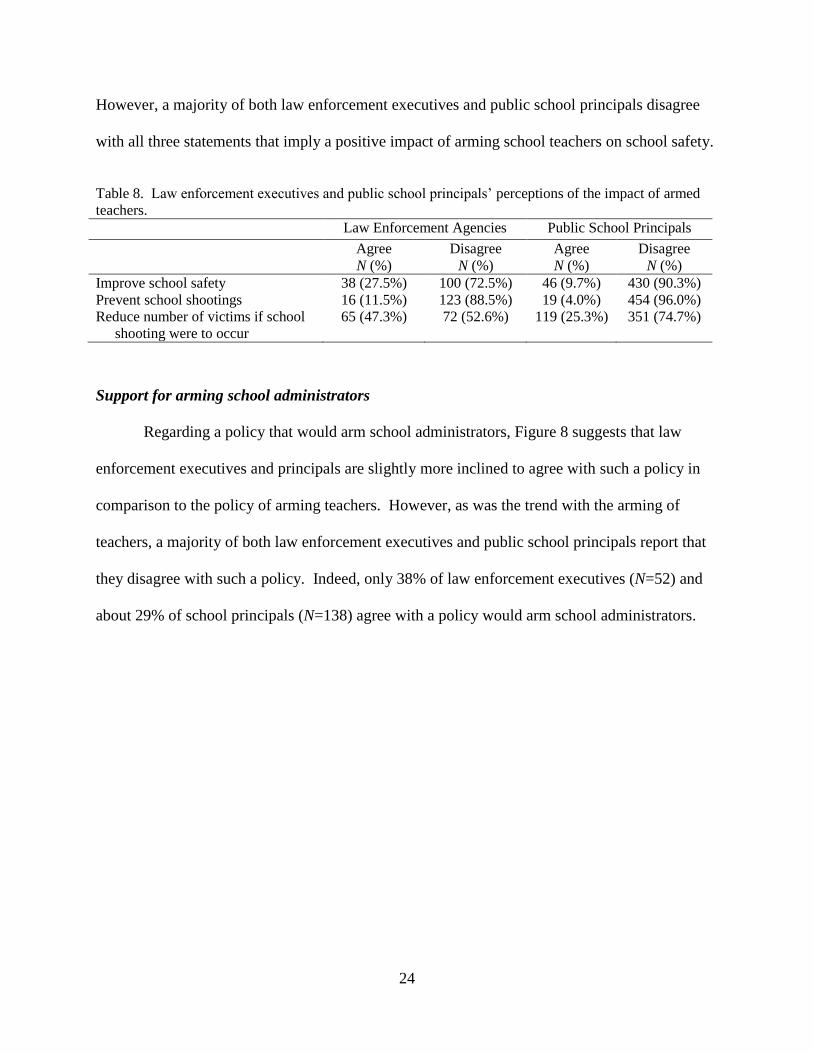
However, a majority of both law enforcement executives and public school principals disagree
with all three statements that imply a positive impact of arming school teachers on school safety.
Table 8. Law enforcement executives and public school principals’ perceptions of the impact of armed
teachers.
Law Enforcement Agencies Public School Principals
Agree
N (%)
Disagree
N (%)
Agree
N (%)
Disagree
N (%)
Improve school safety 38 (27.5%) 100 (72.5%) 46 (9.7%) 430 (90.3%)
Prevent school shootings 16 (11.5%) 123 (88.5%) 19 (4.0%) 454 (96.0%)
Reduce number of victims if school
shooting were to occur
65 (47.3%) 72 (52.6%) 119 (25.3%) 351 (74.7%)
Support for arming school administrators
Regarding a policy that would arm school administrators, Figure 8 suggests that law
enforcement executives and principals are slightly more inclined to agree with such a policy in
comparison to the policy of arming teachers. However, as was the trend with the arming of
teachers, a majority of both law enforcement executives and public school principals report that
they disagree with such a policy. Indeed, only 38% of law enforcement executives (N=52) and
about 29% of school principals (N=138) agree with a policy would arm school administrators.

25
Figure 8. Law enforcement executives’ and public school principals’ perceptions of a policy that
arms school administrators.
Table 9 presents the perceptions of law enforcement executives and school principals
regarding the potential impact of arming administrators on school safety. Less than 40% of law
enforcement executives (N=53) and less than 30% of school principals (N=134) agree that
arming administrators at schools in their jurisdiction/district would improve overall school
safety. Although there is more support for the idea that armed administrators would reduce the
number of victims if a school shooting were to occur, less than half of law enforcement
executives (46.8%, N=64) and about 40% of school principals (N=188) agree with this statement.
Consistent with the trend observed in Table 9 regarding arming school teachers, a small minority
of law enforcement executives (17.3%, N=24) and school principals (11.4%, N=54) agree that
arming school administrators would prevent school shootings from occurring.
37.7%
29.2%
62.3%
70.8%
0.0%
20.0%
40.0%
60.0%
80.0%
100.0%
Law Enforcement Executives School Principals
Level of agreement with a policy that arms school administrators
Agree Disagree

26
Table 9. Law enforcement executives and public school principals’ perspectives of the impact of
armed administrators.
Law Enforcement Executives Public School Principals
Agree
N (%)
Disagree
N (%)
Agree
N (%)
Disagree
N (%)
Improve school safety 53 (38.4%) 85 (61.6%) 134 (28.4%) 338 (71.6%)
Prevent school shootings 24 (17.3%) 115 (82.8%) 54 (11.4%) 418 (88.6%)
Reduce number of victims if school
shooting were to occur
64 (46.8%) 73 (53.2%) 188 (40.2%) 280 (59.8%)
Responsibility for school safety
Law enforcement executives and public school principals were also asked how strongly
they agree or disagree that school safety is law enforcement’s responsibility. Figure 9 presents
their responses and illustrates a point of differentiation between the two types of respondents. A
majority of law enforcement executives (92.0%, N=127) agree that school safety is law
enforcement’s responsibility. In contrast, less than 20% of school principals (N=92) agree with
this statement; that is, over 75% of principals disagree that school safety is law enforcement’s
responsibility. In sum, the proportion of law enforcement executives that agree school safety is
law enforcement’s responsibility is roughly equal to the proportion of principals that disagree
with the same statement.

27
Figure 9. How strongly do you agree or disagree that school safety is law enforcement’s
responsibility?
DISCUSSION
Based on the above findings, the following discussion will highlight a few key trends that
emerged from the analyses. First, there is a large amount of support for SROs in general. An
overwhelming majority of both law enforcement executives and school principals agree that
SROs should be placed in every school with a slightly larger percent of law enforcement
executives supporting this statement. However, when asked about supporting a policy that
would place an SRO in every school, principals were more accepting of the policy if it were to
be entirely district funded, while very few law enforcement executives would support the policy
if it were entirely agency funded. This may be because law enforcement executives are more
familiar with the costs of employing SROs and would prefer to share that burden. On the other
hand, it may also reflect that those school principals who support the placement of SROs in their
schools feel more strongly about the policy, despite what costs it may entail.
92.0%
19.5%
8.0%
80.5%
0.0%
20.0%
40.0%
60.0%
80.0%
100.0%
Law Enforcement Executives School Principals
School safety is law enforcement's responsibility
Agree Disagree

28
In addition, it appears that both law enforcement executives and public school principals
are generally more supportive of SROs than the arming of either school teachers or
administrators. Law enforcement executives demonstrate more support across the board for all
dimensions of safety regarding SROs, armed teachers, and armed administrators. Law
enforcement executives exhibited over twice as much support for a policy that arms teachers than
principals, but they were only slightly more supportive of arming administrators than were
principal respondents. Considering that principals are school administrators, this raises the point
that principals are less supportive than law enforcement executives of a policy that would give
administrators like themselves a firearm.
Another key trend that develops throughout this analysis deals with the sentiments of law
enforcement executives and school principals about preventing school shootings. In contrast to
the law enforcement executives’ high level of agreement that SROs improve school safety and
would reduce the number of victims if a school shooting were to occur, just over half agree that
SROs would prevent a school shooting from occurring. The principals demonstrate a similar
trend, although the level of support for these three statements is slightly less than that exhibited
by the law enforcement executives. This suggests that although both law enforcement executives
and school principals agree that SROs can be a useful tool in maintaining school safety, SROs
are not perceived to be an effective measure to for preventing school shootings.
Furthermore, an overwhelming majority of law enforcement and principal respondents
would support a policy that would place SROs in public schools in their jurisdiction/district and
agree SROs are effective in maintaining school safety in general. In contrast, only about half of
the respondents agree that SROs could prevent a school shooting from occurring. Considering
the alternatives, the respondent law enforcement executives and public school principals are not,

29
in general, very supportive of armed teachers and/or administrators as school safety measures.
However, only a small percentage of law enforcement and principal respondents agree that
armed teachers and/or administrators would prevent school shootings from occurring. Thus, the
above results indicate that law enforcement executives and school principals do not perceive
arming teachers or administrators as an adequate alternative in attempting to prevent school
shootings. Compared to their sentiments regarding the use of SROs, these findings suggest that
law enforcement executives and principals prefer SROs as opposed to arming teachers and/or
administrators as measures to maintain safety within schools, but that none of these approaches
to schools safety are effective in preventing school shootings from occurring.
Finally, one major point of disagreement between the law enforcement executives and the
public school principals was in regards to whether or not school safety is law enforcement’s
responsibility. While a majority of law enforcement executives agreed that school safety was
their own responsibility, an equally large majority of principals disagreed with this same
sentiment. This suggests that both parties feel responsible themselves for maintaining school
safety. Perhaps law enforcement executives agree with this statement because they believe it is
their duty to maintain safety, regardless of the specific location, while principals disagree
because they feel as though the duty of school safety falls upon their own shoulders. Thus,
although their answers conflict, it is possible that the responses of both the law enforcement
executives and school principals were driven by similar sentiments.
CONCLUSION
Considering the current debate regarding the best strategy to maintain school safety, the
perspectives of law enforcement and public school principals captured by this study can inform
policy decisions. According to their responses, both law enforcement executives and principals

30
support the use of SROs as tools to ensure a safe school environment. Conversely, this study
also indicate that although arming teachers and/or administrators has found its way into policy
discussions, South Carolina law enforcement and principals, in general, would not be supportive
of such a practice. This suggests that rather than exhausting finances and resources to pass
legislation that would arm teachers and/or administrators, the focus should be on continued
funding of existing SROs and developing strategies to add SROs to those schools where one is
not currently stationed. However, law enforcement executives expressed concern regarding the
manner in which new SRO positions would be funded. Thus, considering their perspective, the
responsibility of funding SROs should not fall solely on the shoulders of law enforcement, who
already feel overburdened by financial constraints. In fact, the large number of principals who
would support a policy that places an SRO in every school in their district even if it was entirely
district funded suggests that perhaps SRO funding could be shared by law enforcement and
school districts. Furthermore, given that this issue is of great concern for policymakers, it
behooves state and federal governments to consider providing funding or other financial
incentives to those agencies who employ SROs and those schools where SROs are stationed.
Despite the support demonstrated by law enforcement executives and principals for the
use of SROs, they did not agree that SROs would prevent a school shooting from occurring and
they were even less supportive of the idea that armed teachers and/or administrators would
prevent a school shooting. The perspectives of the respondents indicate that SROs are an
effective response to threats to school safety, but that SROs and armed teachers and/or
administrator are not effective measures to prevent these problems in the first place. Thus,
policymakers should be first concerned with creating and maintaining SRO positions in agencies
and schools and secondly on identifying effective measures to preventing school shootings.

31
APPENDIX A
LAW ENFORCEMENT EXECUTIVES’ RESPONSES TO ALL QUESTIONS
5. Which category below best describes your agency? (N=140)
N %
Municipal or County Police Department 102 72.9
Sheriff’s Office – full service 36 25.7
Department of Public Safety 1 0.7
State Highway Patrol 1 0.7
6. How many full-time sworn officers does your agency currently employ? (N=141)
Minimum: 0
Maximum: 762
Mean: 66
Mode: 9
7. Does your agency currently employ school resource officers (SROs)? (N=141)
N %
Yes 80 56.7
No 61 43.3
a. If yes, what year did your agency start placing school resource officers in schools?
(N=67)
Minimum: 1982
Maximum: 2013
Mean: 1999
Mode: 1998, 1999
i. How many full-time SRO positions do you currently have in your agency?
(N=79)
Minimum: 1
Maximum: 73
Mean: 6
Mode: 2
ii. Does your agency receive external funding to support your SRO position(s)?
(N=79)
N %
Yes 69 87.3
No 10 12.7

32
iii. In which of the following does your agency currently have SROs? (N=79)
N %
Elementary 20 25.3
Middle 65 82.3
High 70 88.6
iv. Does your agency provide additional, SRO-specific training before placing
them in a school? (N=80)
N %
Yes 66 82.5
No 14 17.5
a. If yes, approximately how many additional hours of SRO training? (N=59)
Minimum: 20
Maximum: 80
Mean: 47
Mode: 40
8. In which type(s) of schools in your jurisdiction would you support the placement of
SROs? (N=136)
N %
Elementary 98 72.1
Middle 106 77.9
High 101 74.3
None 5 3.7
9. Would you support a policy that required at least one SRO in every public school in your
jurisdiction if it was? (N=133)
N %
Entirely agency funded 13 9.8
Partially agency funded 54 40.6
Entirely externally funded 99 74.4
10. What roles do you expect SROs to fulfill in schools? (N=135)
N %
Counselor/mentor 109 80.7
Teacher 50 37.0
Law enforcement 132 97.8
Other 5 3.7
Other: coach, information/security/resource, liaison for law enforcement

33
11. What is the primary role of SROs? (N=137)
N %
Counselor/mentor 30 22.1
Teacher 7 5.1
Law enforcement 130 95.6
Other 2 1.5
Security
12. SROs should be placed in public schools in your jurisdiction. (N=137)
N %
Strongly agree 100 73.0
Agree 34 24.8
Disagree 3 2.2
Strongly disagree 0 0.0
13. AN SRO would improve overall safety within a school. (N=136)
N %
Strongly agree 102 75.0
Agree 33 24.3
Disagree 1 0.7
Strongly disagree 0 0.0
14. AN SRO would prevent a school shooting from occurring. (N=135)
N %
Strongly agree 29 21.5
Agree 47 34.8
Disagree 51 37.8
Strongly disagree 8 5.9
15. AN SRO would reduce the number of victims if a school shooting were to occur.
(N=135)
N %
Strongly agree 74 54.8
Agree 50 37.0
Disagree 10 7.5
Strongly disagree 1 0.7
16. How strongly do you agree or disagree with a policy that arms teachers in your
jurisdiction’s schools? (N=137)
N %
Strongly agree 4 3.0
Agree 31 22.6
Disagree 38 27.7
Strongly disagree 64 46.7

34
17. An armed teacher would improve overall school safety. (N=138)
N %
Strongly agree 5 3.6
Agree 33 23.9
Disagree 49 35.5
Strongly disagree 51 37.0
18. An armed teacher would prevent a school shooting from occurring. (N=139).
N %
Strongly agree 1 0.7
Agree 15 10.8
Disagree 66 47.5
Strongly disagree 57 41.0
19. An armed teacher would reduce the number of victims if a school shooting were to occur.
(N=137)
N %
Strongly agree 10 7.3
Agree 55 40.1
Disagree 36 26.3
Strongly disagree 36 26.3
20. How strongly do you agree or disagree with a policy that arms administrators in your
jurisdiction’s schools? (N=138)
N %
Strongly agree 12 8.7
Agree 40 29.0
Disagree 44 31.9
Strongly disagree 42 30.4
21. An armed administrator would improve overall school safety. (N=138)
N %
Strongly agree 10 7.2
Agree 43 31.2
Disagree 51 37.0
Strongly disagree 34 24.6
22. An armed administrator would prevent a school shooting from occurring. (N=139)
N %
Strongly agree 4 2.9
Agree 20 14.4
Disagree 75 54.0
Strongly disagree 40 28.8

35
23. An armed administrator would reduce the number of victims if a school shooting were to
occur. (N=137 )
N %
Strongly agree 12 8.8
Agree 52 38.0
Disagree 48 35.0
Strongly disagree 25 18.2
24. What is the most effective method for maintaining overall school safety? (N=134)
N %
SROs 121 91.0
Armed teachers 1 0.7
Armed administrators 0 0.0
Other 11 8.3
Other: Better physical security of campus; collaborative effort with all involved – law
enforcement, community and school; combination of all three; development and
enforcement of security plan both physical and operational; faculty design/security
devices; planning, training, and security of school; proper physical security measures –
alert teachers/administrators, law enforcement involvement in the school to include
planning; SROs plus educating all school staff; trained tactical plans
25. Which of these school resources is the best response to school shootings? (N=136)
N %
SROs 130 95.6
Armed teachers 0 0.0
Armed administrators 0 0.0
Other 6 4.4
Other: A planned response in concert with teachers/admin; armed security; better
physical security of campus; law enforcement; overall training; SROs and responding law
enforcement resources; trained tactical teams
26. How strongly do you agree or disagree that school safety in your jurisdiction is law
enforcement’s responsibility? (N=138)
N %
Strongly agree 66 47.8
Agree 61 44.2
Disagree 10 7.3
Strongly disagree 1 0.7

36
27. What has been the level of concern your agency has received from parents or other
community members regarding school shootings in the past years? It has: (N=139)
N %
Increased 82 59.0
Stayed about the same 54 38.8
Decreased 3 2.2
28. In the next year, do you believe the risk of school shootings in your jurisdiction will:
(N=138)
N %
Increase 24 17.4
Stay about the same 109 79.0
Decrease 5 3.6

37
APPENDIX B
PRINCIPALS’ RESPONSES TO ALL QUESTIONS
1. What is your position in the school? (N=474)
N %
Principal/Executive Director 426 89.9
Assistant Principal 26 5.5
Interim Principal 4 0.7
Administrator/Asst. Admin 11 2.4
Other 7 1.5
2. How many years have you been in your current position? (N=484)
N %
Less than 2 years 94 19.4
2 – 4 years 122 25.2
5 – 9 years 156 32.2
10 – 14 years 63 13.0
15 – 19 years 35 7.2
20 or more years 14 2.9
3. How many years have you been in education-related employment? (N=464)
N %
2 – 4 years 3 0.6
5 – 9 years 5 1.1
10 – 14 years 57 12.3
15 – 19 years 113 24.4
20 or more years 285 61.6
4. Respondent Age (N=478)
N %
30 years or younger 4 0.8
31 – 35 years 25 5.1
36 – 40 years 78 16.0
41 – 45 years 109 22.4
46 – 50 years 78 16.0
51 – 55 years 75 15.4
56 – 60 years 66 13.6
61 years or older 43 8.8

38
5. What is your highest level of education? (N=478)
N %
Some college 3 0.6
Bachelor’s degree 4 0.8
Master’s degree 389 81.4
Doctoral degree 82 16.8
Please complete the following questions regarding the 2012-2013 school year:
6. Which category below best describes your school? (N=484)
N %
Elementary school 229 47.3
Middle school 110 22.7
High school 113 23.3
Online/virtual school 1 0.2
Other 4 0.8
Intermediate (4th
& 5th
) 2 0.4
4th
-6th
1 0.2
Elementary/middle school 10 2.1
Middle/high school 14 2.9
7. Approximately how many students are enrolled in your school? (N=483)
N %
Less than 100 2 0.4
100-299 37 7.7
300-499 135 28.0
500-699 127 26.3
700-999 112 23.2
1000-1199 20 4.1
1200-1399 13 2.7
1400-1599 14 2.9
1600-1799 13 2.7
1800-1999 5 1.0
2000-2999 5 1.0
8. What was your school’s approximate attendance rate? (N=436)
Minimum: 5.0%
Maximum: 100.0%
Average approximate attendance rate: 95.2%

39
9. Approximately what percentage of your students were eligible for the National School
Lunch Program? (N=461)
Minimum: 4.0%
Maximum: 100.0%
Average approximate percent of students: 63.9%
10. Approximately what percentage of your students had a disability other than speech?
(N=441)
Minimum: 0.0%
Maximum: 100.0%
Average approximate percent of students: 13.5%
11. Are any SROs currently assigned to your school? (N=485)
N %
Yes 295 60.8
No 190 39.2
a. If yes to #11, how many part time SROs are currently assigned to your
school? (N=295)
N %
0 222 75.3
1 65 22.0
2 1 0.3
3 2 0.7
4 0 0.0
5 or more 5 1.7
N/A = 189
If yes to #11, how many full time SROs are currently assigned to your school?
(N=294)
N %
0 69 23.5
1 209 71.1
2 16 5.4
N/A = 189
b. If yes to #11, about how long has your school had an SRO? (N=273)
N %
1 year or less 43 15.8
2-4 years 39 14.3
5-9 years 64 23.4
10-14 years 88 32.2
15-19 years 33 12.1
20 or more years 6 2.2
N/A = 189

40
c. If yes to #11, does your school have a Memorandum of Understanding with
the SRO’s agency? (N=267)
N %
Yes 237 88.8
No 30 11.2
N/A = 189
d. If yes to #11, how is the SRO funded? (N=275)
N %
Entirely district funded 67 24.4
Partially district funded 166 60.4
Entirely externally funded 42 15.3
N/A=189
Please answer the following questions regardless of whether you have an SRO in your schoolor
not.
12. Would you support a policy that required at least one SRO in every public school in your
district if it was (check all that apply): N=472)
N %
Entirely district funded 146 30.9
Partially district funded 281 59.5
Entirely externally funded 287 60.8
Would not support at all 18 3.8
13. What role(s) do you expect SROs to fulfill in schools? (check all that apply) (N=482)
N %
Counselor/mentor 394 81.7
Teacher 119 24.7
Law enforcement 461 95.6
Other 65 13.5
Other: a resource; administrative support; advise; advocacy for police, role model;
advocate; age appropriate safety education – personal safety, stranger danger, water
safety, bike safety; awareness class; behavior support; behaviorist; coach; community
liaison; DARE; deterrent; drugs and law education; home visits/truancy; law
enforcement/mentoring; mentor; mostly at front of building – safety; one who can
explain certain laws to children; order; parent/community advocate; part of the
administrative team; positive reinforcement; prevention; professional development;
resource; resource to school reporting to principals; resource training awareness; role
model (N=8); safety (N=3); safety inspections (door checks etc.), safety training;
scaffold school/home/community resources; security (N=5); security specialist;
student monitoring; student need; supervision; support; traffic; visible presence; work
with administrative team

41
14. What is the primary role of an SRO? (N=477)
N %
Counselor/mentor 115 24.1
Teacher 15 3.1
Law enforcement 401 84.1
Other 33 6.9
Other: arrival, dismissal, attendance; behavior support; community
liaison/member/support, deterrent; DARE; help maintain a safe environment; mentor
(not counselor); order; parental support; prevention; prevention through education;
resource; resource training awareness; role model; safety (N=7); safety/security;
security; security specialist; supervisional; traffic; uphold district code of student
conduct
Please indicate how strongly you agree or disagree with the following statements regarding
SROS.
15. SROs should be placed in public school in your district? (N=481)
N %
Strongly agree 310 64.4
Agree 154 32.0
Disagree 9 1.9
Strongly disagree 8 1.7
16. AN SRO would improve overall safety within a school? (N=482)
N %
Strongly agree 307 63.7
Agree 157 32.6
Disagree 11 2.3
Strongly disagree 7 1.5
17. AN SRO would prevent a school shooting from occurring? (N=467)
N %
Strongly agree 66 14.1
Agree 172 36.8
Disagree 191 40.9
Strongly disagree 38 8.1
18. AN SRO would prevent a school shooting from occurring? (N=477)
N %
Strongly agree 222 46.5
Agree 218 45.7
Disagree 28 5.9
Strongly disagree 9 1.9

42
19. AN SRO’s authority should override a school principal’s authority (N=472)
N %
Strongly agree 23 4.9
Agree 50 10.6
Disagree 212 44.9
Strongly disagree 186 39.4
20. School safety in your district is law enforcement’s responsibility (N=471)
N %
Strongly agree 22 4.5
Agree 70 14.9
Disagree 267 56.7
Strongly disagree 112 23.8
Please indicate how strongly you agree or disagree with each of the following general statemetns
regarding relationships and interactions between SROs and STUDENTS. Each question is
important so please read them carefully and please provide your best response even if your
school does not currently have an SRO. (We are interested in your general perception of
SRO’s, whether based on your experience working with them or general opinion if you do not
have this experience):
21. When dealing with students, SROs make decisions based on facts, not their personal
biases or opinions (N=477)
N %
Strongly agree 205 43.0
Agree 259 54.3
Disagree 11 2.3
Strongly disagree 2 0.4
22. SROs treat students with respect (N=479)
N %
Strongly agree 273 57.0
Agree 203 42.4
Disagree 1 0.2
Strongly disagree 2 0.4
23. SROs take time to listen to students (N=479)
N %
Strongly agree 261 54.5
Agree 216 45.1
Disagree 0 0.0
Strongly disagree 2 0.4

43
24. SROs treat students fairly (N=478)
N %
Strongly agree 266 55.6
Agree 210 43.9
Disagree 1 0.2
Strongly disagree 1 0.2
25. SROs clearly explain the reason for their actions with students they deal with (N=478)
N %
Strongly agree 245 51.3
Agree 222 46.4
Disagree 10 2.1
Strongly disagree 1 0.2
26. SROs use rules and procedures that are fair to students (N=477)
N %
Strongly agree 267 56.0
Agree 207 43.4
Disagree 2 0.4
Strongly disagree 1 0.2
27. SROs are neutral and fair when dealing with students (N=478)
N %
Strongly agree 248 51.9
Agree 221 46.2
Disagree 7 1.5
Strongly disagree 2 0.4
28. SROs consider students’ views (N=477)
N %
Strongly agree 191 40.0
Agree 270 56.6
Disagree 15 3.1
Strongly disagree 1 0.2
29. SROs try to take students’ needs into account (N=479)
N %
Strongly agree 210 43.8
Agree 253 52.8
Disagree 14 2.9
Strongly disagree 2 0.4

44
30. Students usually receive fair outcomes from SROs (N=473)
N %
Strongly agree 226 47.8
Agree 241 51.0
Disagree 5 1.1
Strongly disagree 1 0.2
31. Students usually receive the outcomes they deserve under the law from SROs (N=467)
N %
Strongly agree 208 44.5
Agree 247 52.9
Disagree 11 2.4
Strongly disagree 1 0.2
32. Students should obey SRO’s decisions because it is the proper thing to do (N=474)
N %
Strongly agree 232 48.9
Agree 235 49.6
Disagree 6 1.3
Strongly disagree 1 0.2
33. Students have no choice but to obey the directives of SROs if they consider their actions
lawful (N=471)
N %
Strongly agree 141 29.9
Agree 223 47.3
Disagree 104 22.1
Strongly disagree 3 0.6
34. Students should obey the directives of SROs if they consider their actions lawful
(N=470)
N %
Strongly agree 215 45.7
Agree 227 48.3
Disagree 24 5.1
Strongly disagree 4 0.9

45
Please indicate how strongly you agree or disagree with each of the following general statemetns
regarding relationships and interactions between SROs and STUDENTS. Each question is
important so please read them carefully and please provide your best response even if your
school does not currently have an SRO. (We are interested in your general perception of
SRO’s, whether based on your experience working with them or general opinion if you do not
have this experience):
35. When dealing with teachers, SROs make decisions based on facts, not their personal
biases or opinions (N=473)
N %
Strongly agree 234 49.5
Agree 230 48.6
Disagree 8 1.7
Strongly disagree 1 0.2
36. SROs treat teachers with respect (N=473)
N %
Strongly agree 275 58.0
Agree 197 41.6
Disagree 1 0.2
Strongly disagree 1 0.2
37. ROs take time to listen to teachers (N=475)
N %
Strongly agree 262 55.2
Agree 210 44.2
Disagree 2 0.4
Strongly disagree 1 0.2
38. SROs treat teachers fairly (N=473)
N %
Strongly agree 265 56.0
Agree 206 43.6
Disagree 1 0.2
Strongly disagree 1 0.2
39. SROs clearly explain the reasons for their actions with teachers they deal with (N=475)
N %
Strongly agree 250 52.6
Agree 214 45.1
Disagree 10 2.1
Strongly disagree 1 0.2

46
40. SROs use rules and procedures that are fair to teachers (N=475)
N %
Strongly agree 259 54.4
Agree 215 45.3
Disagree 0 0.0
Strongly disagree 1 0.2
41. SROs are neutral and fair when dealing with teachers (N=475)
N %
Strongly agree 249 52.4
Agree 219 46.1
Disagree 6 1.3
Strongly disagree 1 0.2
42. SROs considers teachers’ views (N=475)
N %
Strongly agree 218 45.9
Agree 247 52.0
Disagree 9 1.9
Strongly disagree 1 0.2
43. SROs try to take teachers’ needs into account (N=474)
N %
Strongly agree 212 44.7
Agree 251 53.0
Disagree 10 2.1
Strongly disagree 1 0.2
44. Teachers often receive fair outcomes from SROs (N=470)
N %
Strongly agree 230 48.9
Agree 237 50.4
Disagree 2 0.4
Strongly disagree 1 0.2
45. Teachers usually receive the outcomes they deserve under the law from SROs (N=467)
N %
Strongly agree 222 47.5
Agree 238 51.0
Disagree 6 1.3
Strongly disagree 1 0.2

47
46. Teachers should obey SRO’s decisions because it is the proper thing to do (N=465)
N %
Strongly agree 208 44.7
Agree 238 51.2
Disagree 17 3.7
Strongly disagree 2 0.4
47. Teachers have no choice but to obey the directives of SROs (N=465)
N %
Strongly agree 126 27.1
Agree 188 40.4
Disagree 138 29.7
Strongly disagree 13 2.8
48. Teachers should obey the directives of SROs if they consider their actions lawful
(N=464)
N %
Strongly agree 205 44.2
Agree 230 49.6
Disagree 24 5.2
Strongly disagree 5 1.1
If your school currently has at least one SRO (either full or part time), please indicate how
strongly you agree or disagree with the following statements. If you school does not currently
have an SRO, please check “Not Applicable.” (N/A = 185)
49. SRO(s) have a good relationship with students in my school (N=291)
N %
Strongly agree 190 65.3
Agree 91 31.3
Disagree 5 1.7
Strongly disagree 5 1.7
50. SRO(s) have a good relationship with teachers in my school (N=291)
N %
Strongly agree 192 66.0
Agree 91 31.3
Disagree 3 1.0
Strongly disagree 5 1.7

48
51. SRO(s) are doing a good job in my school (N=290)
N %
Strongly agree 180 62.1
Agree 98 33.8
Disagree 7 1.0
Strongly disagree 5 1.4
52. Students demonstrate respect for the SRO(s) in my school (N=293)
N %
Strongly agree 182 62.1
Agree 105 35.8
Disagree 2 0.7
Strongly disagree 4 1.4
53. Teachers demonstrate respect for the SRO(s) in my school (N=290)
N %
Strongly agree 192 66.2
Agree 93 32.1
Disagree 0 0.0
Strongly disagree 5 1.7
54. Students trust the SRO(s) in my school (N=289)
N %
Strongly agree 167 57.8
Agree 114 39.4
Disagree 4 1.4
Strongly disagree 4 1.4
55. Teachers trust the SRO(s) in my school (N=290)
N %
Strongly agree 181 62.4
Agree 100 34.5
Disagree 5 1.7
Strongly disagree 4 1.4
56. There is good communication between SRO(s) and my staff (N=290)
N %
Strongly agree 175 60.3
Agree 96 33.1
Disagree 12 4.1
Strongly disagree 7 2.4

49
As concerns for school safety have continued to grow, alternative measures have been proposed
to protect students from active shooters. Please answer the following questions regarding the
arming of teachers and school administrators with firearms.
57. How strongly would you agree or disagree with a policy that arms teachers in your
district’s schools? (N=475)
N %
Strongly agree 13 2.7
Agree 31 6.5
Disagree 119 25.1
Strongly disagree 312 65.7
Please indicate how strongly you agree or disagree with the following statements regarding
armed teachers.
58. An armed teacher would improve overall school safety (N=467)
N %
Strongly agree 4 0.8
Agree 42 8.8
Disagree 150 31.5
Strongly disagree 280 58.8
59. An armed teacher would prevent a school shooting from occurring (N=473)
N %
Strongly agree 1 0.2
Agree 18 3.8
Disagree 163 34.5
Strongly disagree 291 61.5
60. An armed teacher would reduce the number of victims if a school shooting were to occur
(N=470)
N %
Strongly agree 11 2.3
Agree 108 23.0
Disagree 137 29.1
Strongly disagree 214 45.5

50
61. How strongly would you agree or disagree with a policy that arms school administrators
in your district’s schools? (N=473)
N %
Strongly agree 42 8.9
Agree 96 20.3
Disagree 141 29.0
Strongly disagree 194 39.8
Please indicate how strongly you agree or disagree with the following statements regarding
armed teachers:
62. An armed school administrator would improve overall school shooting (N=472)
N %
Strongly agree 29 6.1
Agree 105 22.2
Disagree 157 33.3
Strongly disagree 181 38.3
63. An armed school administrator would prevent a school shooting from occurring (N=472)
N %
Strongly agree 11 2.3
Agree 43 9.1
Disagree 203 43.0
Strongly disagree 215 45.6
64. An armed school administrator would reduce the number of victims if a school shooting
were to occur (N=468)
N %
Strongly agree 35 7.5
Agree 153 32.6
Disagree 128 27.4
Strongly disagree 152 32.5
65. What is the most effective method for maintaining overall school safety (N=467)
N %
SROs 360 75.6
Armed teachers 1 0.2
Armed administrators 13 2.7
Other 143 30.0

51
66. What is the best response to school shootings? (N=470)
N %
SROs 393 83.6
Armed teachers 1 0.2
Armed administrators 14 3.0
Other 102 21.7
67. In general, how much parental involvement in school-related activities would you say
there is at your school? (N=477)
N %
Almost none 13 2.7
A small amount 123 25.8
A good amount 231 48.4
A lot 110 23.1
68. What has been the level of concern your school has received from parents or other
community members regarding school shootings in the past year? It has: (N=475)
N %
Increased 214 45.1
Stayed about the same 241 50.7
Decreased 20 4.2
69. If South Carolina allowed schools to enact policies that permit armed teachers on school
grounds, the risk of school shootings will: (N=459)
N %
Increase 119 25.9
Stayed about the same 292 63.6
Decrease 48 10.5
70. If South Carolina allowed schools to enact policies that permit armed administrators on
school grounds, the risk of school shootings will: (N=464)
N %
Increase 78 16.8
Stayed about the same 306 65.9
Decrease 80 17.2
71. How much of a problem is cyber-bullying (e.g., online or other electronic means)?
(N=475)
N %
Not a problem 148 31.2
A slight problem 277 58.3
Serious problem 50 10.5
52
72. How much of a problem is in-person bullying? (N=477)
N %
Not a problem 60 12.6
A slight problem 382 80.1
Serious problem 35 7.3
73. How much of a problem is alcohol use? (N=476)
N %
Not a problem 366 76.9
A slight problem 91 19.1
Serious problem 19 4.0
74. How much of a problem is truancy? (N=477)
N %
Not a problem 142 29.8
A slight problem 256 53.8
Serious problem 70 14.8
75. How much of a problem is vandalism (e.g., graffiti, destruction of property, etc.)?
(N=475)
N %
Not a problem 343 72.2
A slight problem 131 27.6
Serious problem 1 0.2
76. How much of a problem is drug use? (N=477)
N %
Not a problem 326 68.3
A slight problem 130 27.3
Serious problem 21 4.4
77. How much of a problem is drug sales? (N=477)
N %
Not a problem 363 76.1
A slight problem 105 22.0
Serious problem 9 1.9
78. How much of a problem is violence (e.g., fights between students and/or teachers) etc.)?
(N=477)
N %
Not a problem 318 66.7
A slight problem 154 32.3
Serious problem 5 1.0

53
79. How much of a problem is theft (e.g., items stolen from students and/or teachers)?
(N=476)
N %
Not a problem 241 50.6
A slight problem 220 46.2
Serious problem 15 3.2
80. How much of a problem are weapons? (N=476)
N %
Not a problem 424 89.0
A slight problem 52 11.0
Serious problem 0 0.0
81. How much of a problem are gangs? (N=478)
N %
Not a problem 386 80.8
A slight problem 87 18.2
Serious problem 5 1.0


