

SCHRIFTENREIHE DER FAKULTÄT FÜR WIRTSCHAFT DER DUALEN HOCHSCHULE BADEN-WÜRTTEMBERGRAVENSBURG
2014/01
Emotional Appeal, Disappointment, and a Concept of Virtual Indifference Curves Joachim Güntzel


SCHRIFTENREIHE DER FAKULTÄT FÜR WIRTSCHAFT DER DUALEN HOCHSCHULE BADEN-‐WÜRTTEMBERG RAVENSBURG 2014/01
Emotional Appeal, Disappointment, and a Concept of Virtual Indifference Curves Joachim Güntzel


IMPRESSUM Schriftenreihe der Fakultät für Wirtschaft der Dualen Hochschule Baden-‐Württemberg Ravensburg Herausgeber Prof. Dr. Petra Radke Dekanin der Fakultät für Wirtschaft Duale Hochschule Baden-‐Württemberg Ravensburg Baden-‐Wuerttemberg Cooperative State University Marienplatz 2 88212 Ravensburg Deutschland http://www.dhbw-‐ravensburg.de 2014/01, Februar 2014 ISBN 978-‐3-‐945218-‐00-‐6 ISSN 2198-‐5626 DOI 10.12903/DHBW_RV_01_2014_GUENTZEL © Joachim Güntzel, 2014 Alle Rechte vorbehalten. Der Inhalt der Publikation wurde mit größter Sorgfalt erstellt. Für die Richtigkeit, Vollständigkeit und Aktualität des Inhalts übernimmt der Herausgeber keine Haftung. Druck und Verarbeitung Gestaltung Nicole Stuepp DHBW Ravensburg Marienplatz 2, 88212 Ravensburg Druck Frick Kreativbüro & Onlinedruckerei e.K. Brühlstraße 6 86381 Krumbach

Emotional Appeal, Disappointment, and a Concept of Virtual Indifference Curves Joachim Güntzel1
ABSTRACT
Emotional appeal is nowadays a well-‐known approach to Marketing and product branding. Contrasting to its importance in these disciplines, it has gained very little – if any – attention in economic theory. In order to close this gap, this paper proposes the introduction of a new analytical concept into microeconomic theory, namely the virtualisation of product properties through emotional branding and, as a result of this phenomenon, the existence of so-‐called virtual indifference curves. As a starting point, the empirical evidence of McClure et al. 2004 is considered. They observed that households tend to be influenced in their consumption decisions very strongly by the knowledge of product brands. This influence can be so strong that there even occurs a gap between preferences stated before the consumption decision and behavioural preference demonstrated through his consumption decision. The visual recognition of a product brand is in some cases also accompanied by significant activities of certain regions in the brain. We try to explain such phenomena within a microeconomic model. We then demonstrate that household equilibriums based on virtual indifference curves lead to biased consumption decisions which are revised when the household gets aware of his disappointment. The virtual indifference curve is then substituted by a non-‐virtual (in other words: a real) indifference curve, and the utility level of his household equilibrium will be revised downwards. It is argued that this is not the same as a simple re-‐evaluation of the utility level by a sovereign consumer. Since the equilibrium which was based on a virtual indifference curve is now affiliated with disappointment and deception, the household will be affected by this revised consumption decision in an explicitly negative way.
1 Dr. Joachim Güntzel is Professor of Economics at Baden-‐Wuerttemberg Cooperative State University
Ravensburg. Corresponding address: Marktstrasse 28, 88212 Ravensburg, Germany. Phone: +49.751.18999.2784. Fax: +49.751.18999.2703. E-‐Mail: guentzel@dhbw-‐ravensburg.de. Note: This paper has first been presented at the 2013 NeuroPsychoEconomics Conference at the University of Bonn. An abstract of this presentation has been published in B. Weber, M. Reuter, A. Falk, M. Reimann, O. Schilke (Eds., 2013), 2013 NeuroPsychoEconomics Conference Proceedings, Starnberg/Washington DC (Association for NeuroPsychoEconomics and American Psychological Association), ISSN 1861-‐8243, p. 38.
1

1 INTRODUCTION
The insight that emotional factors are often underlying economic behaviour is not a completely new one for economic theory. Moreover, there appears to be a growing dissatisfaction with the standard microeconomic model of economic decision making. Particularly some research results from the field of Neuroscience and Neuromarketing challenge the paradigm of rational households maximizing a well defined utility function under a given budget constraint. For an overview of this critique and different pathways of economic theory towards an integration of neuroscience into economics see, for example, Zak 2004, Rustichini 2005, Kenning and Plessmann 2005, Camerer et al. 2005, Neumärker 2007. For an early critique on the behavioural foundations of economic theory see Sen 1977. A specific topic in the context of Neuromarketing is the study of behavioural preferences towards branded products. McClure et al. 2004 have shown that consumers – in contrast to conventional microeconomic models – tend to be influenced very strongly by the brand of a product. This paper develops a new concept which intends to adjust economic theory to behavioural preferences of the kind described above. Therefore the existence of a new type of indifference curves – in the following called “virtual indifference curves” – is presented and offered to a discussion. First, the empirical results of McClure et al. 2004 are discussed. Then it is argued that some crucial effects generated by Marketing activities such as positioning and emotional branding can be described as a virtualisation of product properties. In the next step, we demonstrate that such a virtualisation of product properties leads to the emergence of virtual indifference curves. Finally, it is shown that virtual indifference curves, in respect, can lead to a loss of utility within the standard model of household decision.
2


2 EMPIRICAL EVIDENCE FROM NEUROSCIENCE
McClure et al. 2004 state that “behavioural evidence suggests that cultural messages can insinuate themselves into the decision-‐making processes that yield preferences for one consumable or another” (McClure et al. 2004: 380). By means of combined taste tests and functional magnetic response imaging (fMRI), they investigate the behavioural preference for Coke® and Pepsi®, and the neural responses which correlate with these preferences. Furthermore, they probe the influence that the brand of the tasted product gains over behavioural choices and brain responses. To achieve this, they separated a sample of n = 67 persons into four groups (n1 = 16, n2 = 17, n3 = 16, n4 = 18; for the details of the experimental design see McClure et al. 2004). These four groups stated their preference for either Coke or Pepsi in advance of the taste tests (stated preferences) Then they were confronted with an arrangement of tests consisting of anonymous taste tests (for groups 1 and 2, no brand label seen) and semi-‐anonymous taste tests for both drinks (for group 3: one cup labelled with Coke, one unlabelled, but both contained Coke; for group 4: one cup labelled with Pepsi, one unlabelled, but both contained Pepsi). Preferences the persons showed during these tests are referred to as behavioural preferences. In addition, all participants had to take part in fMRI experiments in the scanner during which they received a drink delivery. The most interesting results in our context are summarized as follows: 1. Groups 1 and 2: In the absence of brand information, behavioural preference for Coke
and Pepsi is split equally between individuals.
2. Group 4: Brand knowledge of Pepsi in the semianonymous test had no significant influence on behavioural preference when contrasted with the anonymous test.
3. Group 3: In the case of Coke, the semianonymous test showed that brand knowledge had a strong influence on behavioural preferences, both when compared with the anonymous test (Mann-‐Whitney U-‐Test: n1 = 16, n2 = 16, U = 191,5, p < 0,05) and compared with the semianonymous test for Pepsi (Mann-‐Whitney U-‐Test: n1 = 18, n2 = 18, U = 225,5, p < 0,005). There even occurs a gap between behavioural preferences in the test and stated preferences before the test, both preferences did not correlate (p = 0,92). A later completed anonymous taste test for this group showed that people´s preference distribution differed significantly from the semianonymous Coke test (Mann-‐Whitney U-‐Test: n1 = 16, n2 = 16, U = 142,5, p < 0,01).
3

4. The imaging experiments in the scanner corroborated the behavioural taste test results. E.g., one result showed that an image of a coke can which preceded a coke delivery lead to a significant greater brain activity. No such effect was observed in the case of equivalent knowledge about Pepsi delivery.
The authors draw the conclusion that “there are visual images and Marketing messagesthat have insinuated themselves into the nervous systems of humans that consume the drinks” (McClure et al. 2004: 381). We shall take these results as a strong argument for what will be analysed in this paper as being a process of “virtualisation”. The aim is to develop an analytical framework for the integration and explanation of such phenomena into a microeconomic standard model of the household. In the following, we define a good by its properties, referring to Lancaster (1971).
3 A CONCEPT OF VIRTUALISATION
Definition 1:
By a “virtual property” (z*) of a good, we mean a property which can only be observed through a neural response within the brain of a consumer.
We denominate a property as “virtual” when it can only be observed by a neural response, in the sense of a brain activity, but by no other means of measurement. This implies that a virtual property of a good cannot be explained or measured by any kind of physical attributes of the product. To point it out clearly: Making the label of Coke visible (Mc Clure et.al. 2004) does not mean that any kind of new physical attributes is added to the drink. The only (but nevertheless decisive) effect of the visualisation is the emergence of a neural response in the brains of the pobands by adding a virtual property (that means the label) to the drink.
4

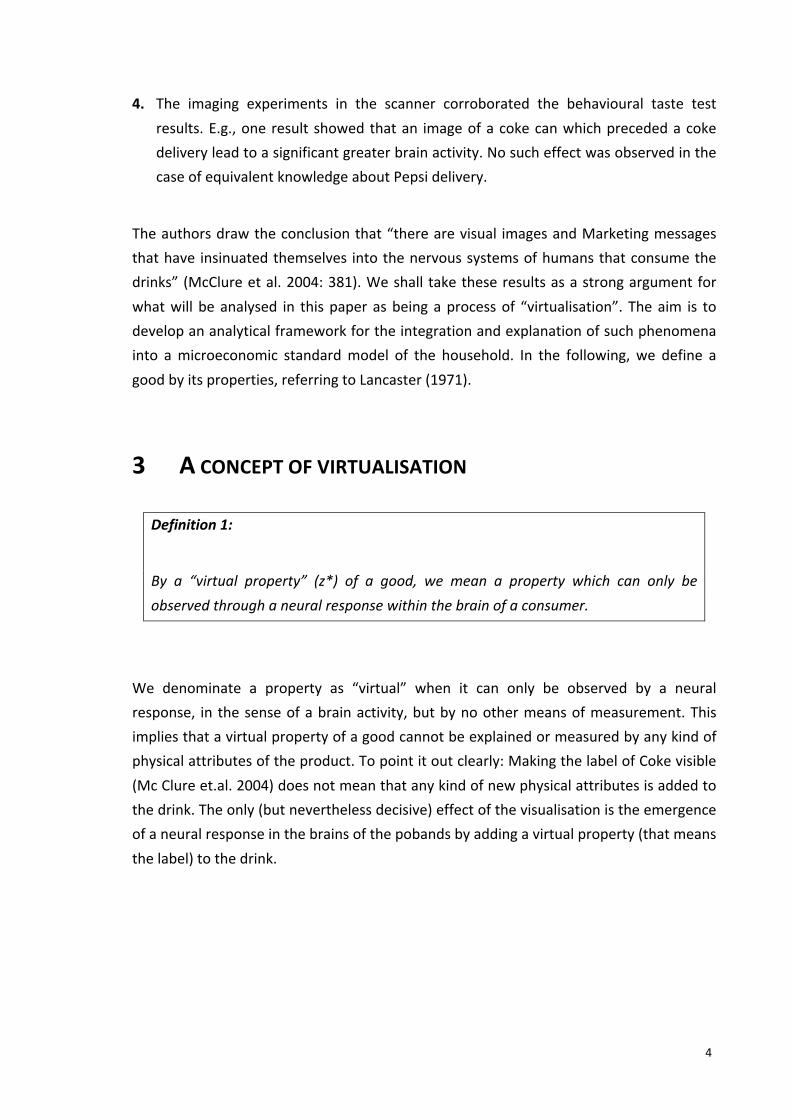
Definition 2:
By “virtualisation” we mean the addition of a virtual property (z*) to the physical (or non-‐virtual) properties (z1, z2) of a good X:
X [z1; z2] X* [z1; z2; z*]
We shall call the phenomenon which leads to a behavioural preference of the kind mentioned in the study above (McClure et.al. 2004) a process of “virtualisation”. The term is used in the sense that a virtually created image of a product and its properties serves as a cognitive substitute (X* [z1; z2; z*]) for the same product (X [z1; z2]) as it would be assessed without a virtually added property. Let us take a simple example to illustrate this point. An apple is an apple, not doubt about that. It is characterized through clearly defined physical properties like smell, taste, colour, weight, and so on. Of course, preferences differ, and some people prefer a green or a red apple, or they don´t like apples at all. But this does not change anything concerning the physical properties of the certain apple. But what will happen when, as a result of positioning and emotional appeal, the apple gets more and more substituted by the virtually created image of an apple? Commercials on TV as well as advertisings in print media will tell us that it is extraordinary juicy, that it tastes overwhelmingly good, and that it will contribute essentially to our wellbeing. Apples may be targeted by intense Marketing activities like TV commercials, presentations in supermarkets, and others. As a probable effect of these activities of positioning and emotional appeal, the apple will more and more be substituted through a virtually created image of an apple (and the brand or label which represents this image) in the consumer’s mind:
Apple Image of an apple
X [z1; z2] X* [z1; z2; z*]
Diagram 1: The virtualisation process
5

When this point is reached, the pure recognition of the virtual property (z*), e.g. the view of the brand or label of the product, will be sufficient to activate the virtually created image and to direct a consumer´s preferences and choices. Since X* [z1; z2; z*] contains all physically measurable properties which X [z1; z2] contains, and furthermore a virtual property which we can regarded as some kind of emotional attraction, the household will prefer an additional quantity of X* to the identical additional quantity of X. In other words: the marginal utility of X* will be assessed higher: δU / δX* > δU /δ X To point it out clearly: Making the label of Coke© visible (in the Coke©/Pepsi© test, Mc Clure et.al. 2004) does not mean that any kind of new physical attributes is added to the drink. The only (but nevertheless decisive) effect of the visualization is the emergence of a neural response in the brains of the probands by adding a virtual property to the drink. Especially activities which are labelled with the term “emotional branding” and “positioning” can be suspected to initiate some kind of virtualisation process in the minds of consumers. As the founders of the modern positioning strategy express it: „Positioning starts with a product. A piece of merchandise, a service, a company, an institution, or even a person. Perhaps yourself. But positioning is not what you do to a product. Positioning is what you do with the mind of the prospect. That is, you position the product in the mind of the prospect” (Ries and Trout. 2001: 2). For further details on the role of positioning and branding within a modern Marketing strategy, see, e.g. Aaker 2002, Köhler 2001, Esch 2005, Trommelsdorf and Paulsen 2005. For a focus on the integration of Neurosciences into Marketing, see Häusel 2007, Kenning 2007, Pusler and Reichart 2005, Rosenzweig 2005.
4 A CONCEPT OF VIRTUAL INDIFFERENCE CURVES
The challenge for microeconomic standard theory, which is posed by the empirical findings of McClure et al. 2004, lies in the question: If the preference structure of an individual is described by an ordinal utility function and the corresponding system of indifference curves, then how can the revealing of a brand affect this preference structure and even lead to a revision of consumption decisions, respectively to a discrepancy between stated and behavioural preferences? We propose that the answer lies in the hereby postulated existence of virtual indifference curves:
6

Definition 3:
By a “virtual indifference curve” we mean an indifference curve with one of both goods possessing a virtual property (z*), additional to the non-‐virtual properties (z1; z2):
U = f(X1[z1; z2]; X2*[z1; z2; z*]) = I*(X1; X2*)
Let X1 and X2 be two goods for which an indifference curve I(X1, X2) with U = f(X1; X2) exists. The addition of a virtual property z* to good X2 leads to X2*, constituting a new indifference curve I*(X1: X2*). Since we said that δU / δX2* > δU / δX2 (see above), we can follow that the consumer will prefer a combination of both goods (X1; X2*) to a combination of (X1, X2*), containing the same amounts of X1 and X2, respectively X2*. In other words: Given a first combination of both goods (X1, X2) in point A in diagram 2, the virtualization process leads to a virtual indifference curve I*(X1; X2*) which has a higher marginal rate of substitution:
│dX1 / dX2*│ > │dX1 / dX2│
or (δU / δX2*) / (δU / δX1) > (δU / δX2) / (δU / δX1)
All characteristics of a non-‐virtual indifference curve also apply to a corresponding virtual indifference curve, in particular: Asymmetry: There exists no pair (X11, X2*1) and (X12, X2*2) for which (X11, X2*1) > (X12, X2*2) and (X11, X2*1) < (X12, X2*2); Negative transitivity: If (X11, X2*1) > (X12, X2*2), then for another pair (X13, X2*3) there is either (X11, X2*1) > (X13, X2*3) or (X13, X2*3) > (X12, X2*2) or both.
7

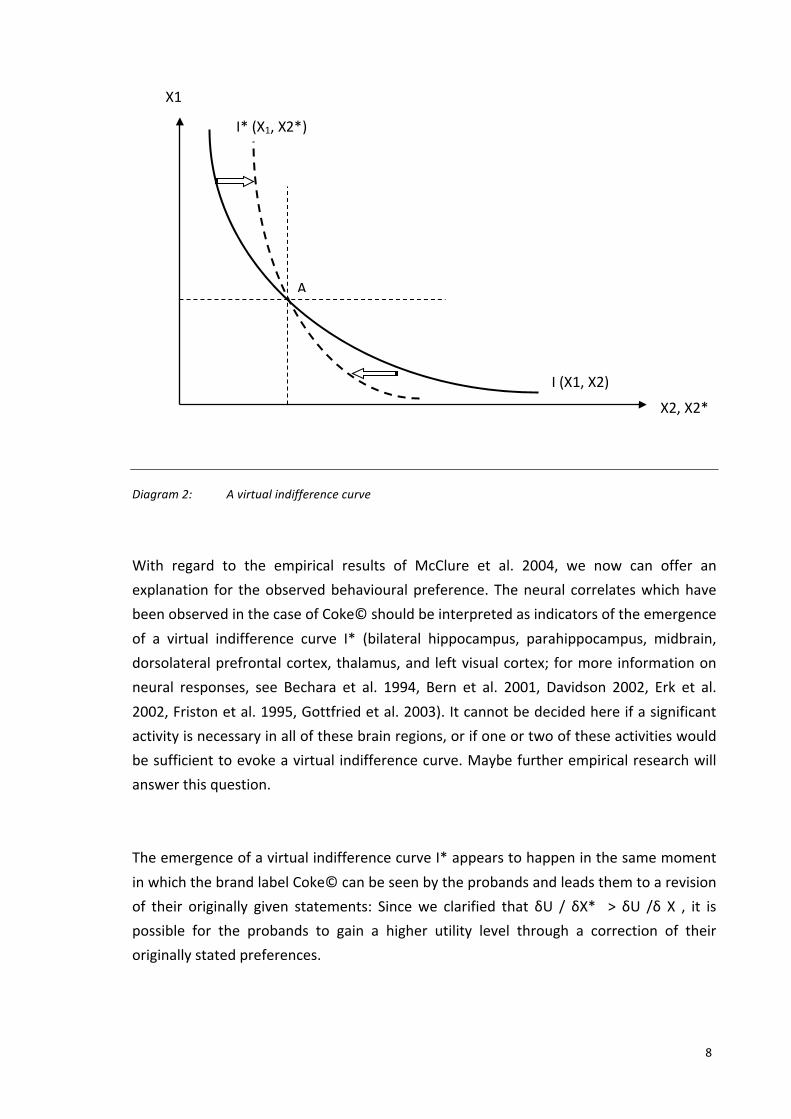
Diagram 2: A virtual indifference curve
With regard to the empirical results of McClure et al. 2004, we now can offer an explanation for the observed behavioural preference. The neural correlates which have been observed in the case of Coke© should be interpreted as indicators of the emergence of a virtual indifference curve I* (bilateral hippocampus, parahippocampus, midbrain, dorsolateral prefrontal cortex, thalamus, and left visual cortex; for more information on neural responses, see Bechara et al. 1994, Bern et al. 2001, Davidson 2002, Erk et al. 2002, Friston et al. 1995, Gottfried et al. 2003). It cannot be decided here if a significant activity is necessary in all of these brain regions, or if one or two of these activities would be sufficient to evoke a virtual indifference curve. Maybe further empirical research will answer this question. The emergence of a virtual indifference curve I* appears to happen in the same moment in which the brand label Coke© can be seen by the probands and leads them to a revision of their originally given statements: Since we clarified that δU / δX* > δU /δ X , it is possible for the probands to gain a higher utility level through a correction of their originally stated preferences.
I* (X1, X2*)
A
X2, X2*
I (X1, X2)
X1
8

5 DISAPPOINTMENT AND LOSS OF UTILITY
It is crucial to point out that the emergence of a virtual indifference curve is not equivalent to a simple change in preferences. Since the existence of a virtual indifference curve I*(X1; X2*) depends only on the addition of virtual property (z*) to the physical properties (z1; z2), the non-‐virtual indifference curve I(X1; X2) will still continue to exist. In McClure et.al. (2004), the empirical findings for group 3 (semi anonymous test with one cup unlabelled, one cup labelled with Coke©, but both contained Coke©) indicate strongly that virtualisation (and thus the emergence of a virtual indifference curve) does not mean that the preference relation for goods without a virtual property vanishes. On the contrary, one will have to draw the conclusion from this results that both indifference curves, virtual and non-‐virtual, exist simultaneously, with the existence of the virtual curve depending only on the virtual property (z*). In the following, we pose the question: What will happen if the virtual property (z*) vanishes? We will call this process “disappointment”:
Definition 4:
By “disappointment” in the context of virtual indifference curves we mean the vanishing of a virtual property (z*). Thus, disappointment corresponds to the reversion of virtualisation:
X*[z1; z2; z*] X[z1; z2]
To illustrate this, we first have to look on the household equilibrium after the process of virtualisation. A household equilibrium based on a virtual indifference curve can be analysed as follows (see diagram 3).
9

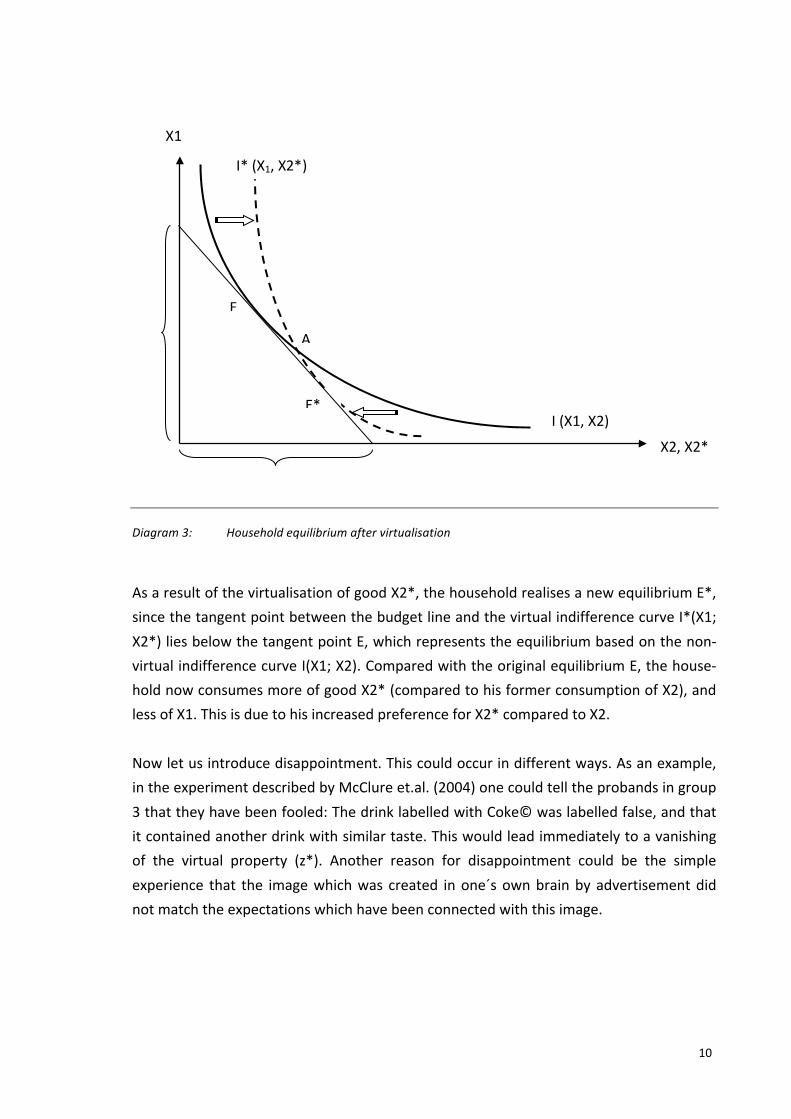
Diagram 3: Household equilibrium after virtualisation
As a result of the virtualisation of good X2*, the household realises a new equilibrium E*, since the tangent point between the budget line and the virtual indifference curve I*(X1; X2*) lies below the tangent point E, which represents the equilibrium based on the non-‐virtual indifference curve I(X1; X2). Compared with the original equilibrium E, the house-‐hold now consumes more of good X2* (compared to his former consumption of X2), and less of X1. This is due to his increased preference for X2* compared to X2. Now let us introduce disappointment. This could occur in different ways. As an example, in the experiment described by McClure et.al. (2004) one could tell the probands in group 3 that they have been fooled: The drink labelled with Coke© was labelled false, and that it contained another drink with similar taste. This would lead immediately to a vanishing of the virtual property (z*). Another reason for disappointment could be the simple experience that the image which was created in one´s own brain by advertisement did not match the expectations which have been connected with this image.
E
I* (X1, X2*)
A
X2, X2*
I (X1, X2) E*
X1
10


Definition 5:
By “loss of utility” in the context of virtual indifference curves, we mean that a household equilibrium based on a virtual indifference curve turns into a disequilibrium at a lower utility level.
In such a situation of disappointment, the virtual indifference curve will vanish, but the household will still find itself in the point E*, which is now connected with a lower utility level than before:
Diagram 4: Disappointment and loss of utility
Since I1(X1; X2) > I2(X1; X2) it is clear that in the same moment that the virtual indifference curve I*(X1; X2*) vanishes, the household will find that his realised combination E* now lies on a non-‐virtualised indifference curve which represents a lower utility level that it represented before, where it lied on the virtual indifference curve I*(X1; X2*). Thus, the household will feel this disappointment as a loss of utility. The loss of utility is the higher, the stronger the utility level differs between I1(X1; X2) and I2(X1; X2).
E
I2 (X1, X2)
A
X2, X2*
I1(X1, X2)
E*
X1
11


6 CONCLUSION
Starting with the empirical evidence given by McClure et al. 2004 that individuals can be influenced in their consumption decisions by the brand of a product – even so strongly that there occurs a gap between stated preferences and behavioural preferences – we pursued the question how such phenomena can be described within a microeconomic model. We first introduced the concept of virtualisation of product properties which is formalised by the addition of a virtual property (z*). Virtual properties are implemented in the consumer´s mind through positioning and branding activities, and can only be observed or measured by certain brain activities. Further we argued that such a process of virtualisation leads to the emergence of what we call virtual a indifference curve. Virtual indifference curves express the effect on the preferences toward a good which is subject to a virtualisation process. The empirical evidence of the fMRI experiments presented by McClure et al. 2004 can be interpreted as neural correlates of the emergence of virtual indifference curves. Finally, we investigated the consequences of the existence of virtual indifference curves for the household´s optimal consumption plan. We argued that a household who is influenced by a virtualisation process will leave his original equilibrium (based on a non-‐virtual indifference curve) and search a new equilibrium, which will lead to higher consumption of the virtualised good and lower consumption of the non-‐virtualised good. Disappointment occurs when a virtual property vanishes (by what reason ever). As a consequence, the household then will find itself on a lower utility level and thus will feel this disappointment as a loss of utility.
We could finally draw the conclusion that certain activities, like emotional branding and positioning, can lead to a loss of utility in the case when virtual properties do not prove to be durable.
12


REFERENCES
Aaker, D. (2002), Building Strong Brands. New Edition. New York, The Free Press.
Bechara, A./Damasio, A.R./Damasio, H./Anderson, S.W. (1994), Insensitivity to Future Consequences Following Damage to Human Prefrontal Cortex, Cognition 50: 7-‐15.
Berns, G.S./McClure, S.M./Pagnoni, G./Montague, P.R. (2001), Predictability Modulates Human Brain Response to Rewards, Journal of Neuroscience 21: 2793-‐2798.
Camerer, C.F./Loewenstein, G./Prelec, D. (2005), Neuroeconomics: How Neuroscience can Inform Economics, Journal of Economic Literature 42: 9-‐64.
Davidson, R.J. (2002), Anxiety and Affective Style: Role of Prefrontal Cortex and Amygdala, Biological Psychiatry, 51: 68-‐80.
Erk, S./Spitzer, M./Wunderlich, A.P./Galley, L./Walter, H. (2002), Cultural Objects Modulate Reward Circuitry, Neuroreport 13: 2499-‐2503.
Esch, F.R. (2005), Markenpositionierung als Grundlage der Markenführung, in: Esch, F.R. (Hrsg.), Moderne Markenführung, 4. Auflage, Gießen, Gabler: 131-‐164.
Friston, K.J./Holmes, A.P./Worsley, K./Poline, J.P./Frith, C.D./Frackowiak, R.S.J. (1995), Statistical Parametric Maps in Functional Brain Imaging: A General Linear Approach, Human Brain Mapping 2: 189-‐210.
Gottfried, J.A./O´Doherty, J./Dloan, R.J. (2003), Encoding Predictive Reward Value in Human Amygdale and Orbitofrontal Cortex, Science 301: 1104-‐1107.
Häusel, H.G. (2007), Neuromarketing. München, Haufe.
Jehle, G.A./Reny, P.J. (1997), Advanced Microenconomic Theory, Reading MA, Addison-‐Wesley.
Kenning, P. (2012), Neuroökonomie und Neuromarketing: Begriff und Hintergrund, in: Häusel, H.G. (Hrsg.), Neuromarketing, 2. Aufl., München, Haufe: 22-‐25.
Kenning, P./Plassmann, H. (2005), NeuroEconomics: An Overview from an Economic Perspective, Brain Resarch Bulletin 67: 343-‐ 354.
Köhler, R. (2001), Erfolgsfaktor Marke: Neue Strategien des Markenmanagements, München, Vahlen.
13


Lancaster, K. (1971), Consumer Demand. A new Approach, New York, London, Columbia University Press.
Mas-‐Colell, A./Whinston, M.D./Green, J.R. (1995), Microeconomic Theory, New York, NY, Oxford University Press.
McClure, S.M./Li, J./Tomlin, D./Cypert, K.S./Montague, L.M./Montague, P.R., (2004), Neural Correlates of Behavioral Preference for Culturally Familiar Drinks, Neuron 44: 379-‐387.
Montague, P.R./Berns, G.S. (2002), Neural Economics and the Biological Substrates of Valuation, Neuron 36: 265-‐284.
Neumärker, K.J. (2007), Neuroeconomics and the Economic Logic of Behavior, http://portal.unifreiburg.de/wiwi/Unterlagen/Neumaerker/Neuro (last access 20 Mar 2008).
Pusler, M./Reichart, M. (2005), Neuromarketing, Marketingjournal, Sonderheft: 17.
Ries, A./Trout, J. (2001), Positioning: The Battle for your Mind, New York, McGraw Hill Professional.
Rosenzweig, B. (2005), Neuromarketing, Marketingjournal, Sonderheft: 21.
Rustichini, A. (2005), Neuroeconomics: Present and Future, Games and Economic Behavior 52: 201-‐212.
Sen, A. (1977), Rational Fools: A Critique of the Behavioral Foundations of Economic Theory, Philosophy and Public Affairs 6: 317-‐344.
Trommelsdorff, V./Paulssen, M. (2005), Messung und Gestaltung der Marken-‐positionierung, in: Esch, F.H. (Hrsg.), Moderne Markenführung, 4. Auflage, Gießen, Gabler: 1363-‐1380.
Varian, H.R. (2005), Intermediate Microeconomics: A Modern Approach, 7th ed. New York, NY, W.W. Norton.
Zak, P. (2004), Neuroeconomics, in: Philosophical Transactions of the Royal Society of London, Biological Sciences 359: 1737-‐1748.
14


Herausgeber
Prof. Dr. Petra RadkeDekanin der Fakultät für Wirtschaft
Duale Hochschule Baden-Württemberg RavensburgBaden-Wuerttemberg Cooperative State UniversityMarienplatz 288212 Ravensburg
ISBN 978-3-945218-00-6
ISSN 2198-5626
DOI 10.12903/DHBW_RV_01_2014_GUENTZEL


