


Science Spectrum(An Official Journal of Andhra Pradesh Akademi of Sciences)
. Volume 2
ISSN
Science Spectrum(An Official Journal of Andhra Pradesh Akademi of Sciences)
Issue 1 January
[email protected] www.apas.org.in
ISSN - 2455-5053
Science Spectrum
(An Official Journal of Andhra Pradesh Akademi of Sciences)
anuary 2017
www.apas.org.in .
Science Spectrum
_____________________________________________________________________________________________ Volume 2 (1) CONTENTS January 2017
Research Papers
Utilization and Nutritional Evaluation of Babul Bark (Acacia Arabica) for the Development 1-11
of Value Added Product to Implement on the Diabetic Patient
Jaya Sinha and Zeba Naz
Morphological and Biochemical Responses to Heat Stress in Arachis hypogaea. L 12-22
K. Rekha Rani, A. Sujitha, Y.Mrunalini, D. Sujitha and R. Usha
Extraction of Iron (III) with Tri-caprylamine oxide from hydrochloric& sulphuric acid 23-26
solutions
A.V.L.N.S.H. Hariharan
An Environmentally benign synthesis of N-alkyl-2-((benzimidazol-2-yl) thio) acetonitrile 27-30
Sadhu Srinivas Rao
A New Validated RP-HPLC Method for the Quantification of Cabazitaxel - An Anticancer 31-38
Plant product
Mathrusri Annapurna Mukthinuthalapati and Venkatesh Bukkapatnam
Cloud Data Security using hybrid RSA and Cuckoo Search Algorithm 39-42
A Arjuna Rao, K Sujatha, P Praveen Kumar and V Sravani IKC
Structural and Dielectric Properties of Sm3+ Doped SrTiO3 Ceramic Powders 43-48
J. Guravamma, C. Sai Vandana and B.H.Rudramadevi
Construction of Subsets of B and B0 49-53
S.Nagendra and Dr.E.Keshava Reddy
Influence of silver nitrate and different carbon sources on in vitro shoot development in 54-61
Solanum nigrum (Linn)-an important antiulcer medicinal plant
G. Geetha, K. Harathi, D. Giribabu and C.V. Naidu
Synthesis and Spectral characterization and DNA Binding properties of Copper (II) 62-71
complexes with Nicotinoyl and Isonicotinoylhydrazones
S. Chandrasekhar & K. Hussain Reddy
Total Coloring and Chromatic Number of Strong Intuitionistic Fuzzy Graph 72-76
S. Narayanamoorthy and P. Karthick
1
Science Spectrum Vol.2 (1) 1- 11 January 2017, ISSN 2455-5053
Utilization and Nutritional Evaluation of Babul Bark (Acacia Arabica) For the
Development of Value Added Product to Implement On the Diabetic Patient
Jaya Sinha and Zeba Naz University Department of Clinical Nutrition and Dietetics, Vinoba Bhave University, Hazaribag, Jharkhand
*For Correspondence: [email protected]
Abstract
Babul bark is worldwide distributed. In India it is
widely observed from Rajasthan, Gujarat, Uttar
Pradesh, Bihar, Jharkhand, Bengal and Orissa.
Babul tree is of significant importance in
Ayurveda, Unani medicine and African folk
medicine. Babul tree contains Arabinose,
Galactose, Rhamnose and Glucuronic acid. Barks
are rich source of micronutrients such as Vitamin-
C, Iron, Calcium, Carbohydrate (found in babul in
less amount in polysaccharide form). It is a richest
source of Tannins which are responsible for
reducing Blood sugar level. The study was
undertaken with the objectives (i) to process Babul
bark in power form and find out the component
changes after dehydration (ii) To introduce the
babul plant as medicinal uses for reducing the
complication of diabetes by preparing biscuits
enriched with babul bark powder (iii) to assess the
organoleptic quality of biscuits enriched with
babul bark powder (iv) To evaluate the
effectiveness of babul bark biscuits on diabetic
patient after intervention. The present study was
an attempt to utilize the medicinal bark to develop
value added product namely namkin biscuits and
its effect on diabetic patients for reducing the
Blood sugar level (BSL). Babul bark were
dehydrated by tray drying and nutrient estimation
of dehydrated babul bark powder was done for
protein, fat, ash, moisture, crude fibre, iron,
calcium and vitamin-C. Organoleptic test of the
product was done by nine point hedonic scale. For
intervention 100 respondents aged between 27-80
years were randomly selected from different
hospitals of Ramgarh district of Jharkhand and
was dived into two groups of 50 each. One was
control and the other was experimental. The
nutritional status of the patients was recorded
through dietary survey. BSL was estimated with
alkaline citrate method for both the groups before
and after intervention to see the effect of biscuits.
The data collected were analysed statistically by
using mean, standard deviation, standard error,
ANOVA and paired‘t’ test. The nutrient
estimation per 100 gm of dehydrated babul bark
shows that it is a good source of iron (140mg),
fibre (18 g), Vit- C (25.3 mg), and calcium (2939
mg). It is low in fat (2 g) and it contains 58 g
carbohydrate in polysaccharide form. A significant
difference was found between the color, flavor,
texture, taste and over all acceptability of the
biscuits enriched with babul bark powder on
applying ANOVA test. The mean age of the
respondent was 46 years. 87% were non-
vegetarian.
The energy and fibre intake of respondents in both
the groups was less then the RDA. On applying
analysis of variance test it was found that there
was no significant difference in intake of different
nutrients in both the groups. On applying paired‘t’
test a significant difference was found in fasting
and PP glucose level of experimental group which
was intervened with namkin biscuits enriched with
babul bark powder for one month in comparison to
the control group. It was concluded that namkin
biscuits enriched with babul bark powder was
effective in reducing BSL in diabetic patient.

2
Vol.2 (1) 1- 11 January 2017, ISSN 2455-5053 Science Spectrum
Introduction
Babool (Acacia arabica) is commonly known as
kikar and bava in Hindi, Indian gum arabic in
English, Babula in Sanskrit, Acacia arabica Willd
Pennel in Latin. It belongs to the family:
Leguminosae, sub-family: Fabacaea. First of all
described by Linnaeus in 1773. The genus acacia
was first described by philipmiller in 1754 and
until 1842. It is estimated that there are roughly
1380 species of Acacia worldwide, about two-
third of them native to Australia and rest of spread
around tropical and subtropical regions of the
world. Gamble, (1918) have reported more than 40
species of this genus in India in his ‘Flora of
Madras Presidency.’
Perennial shrub or tree, 2.5-10 (-20) mt tall,
variable in many aspects. Branches are spreading,
forming a dense flat or rounded crown with dark
to black colored stems. Bark thin, rough, fissured,
deep red-brown. Spines (thorns) thin, straight,
light-grey in axilliary pairs, usually in 3-12 pairs,
5-7.5 cm long in young trees, mature trees
commonly without thorns. Babul plant is
worldwide distributed native to Africa, Algeria,
Ethiopia and Ghana. In Asia it is also observed
from Iran, Iraq and Israel along with Nepal,
Pakistan and India. In India it is widely observed
from Rajasthan, Gujarat, Uttar Pradesh, Bihar,
Jharkhand, Bengal and Orissa.
Babul tree is of significant importance in
Ayurveda, Unanl medicine and African folk
medicine. Babul tree contains Arabinose,
Galaclose, Rhamnose and Glucuronic acid. Gum
of the tree contains calcium, magnesium and
potassium, malic acid, sugar. Bark and pods
contain a large quantity of tannins and Gallic acid.
(The Satvik Blog and www.dabur.com)
Phytochemical investigations of Acacia arabica
found that phenolic compounds are presents in
Acacia arabica extracts. Acacia arabica contains
flavonoids, sterols, triterpenoids, alkaloids and
phenolics which possess various health benefits.
The isolation and characterization of quercetin,
gallic acid, catechin, epicatechin, dicatechin, and
leucocyanidin gallate from the acetone extract is
reported. The seeds of Acacia arabica contain
5.2% oil. Physico-chemical constants and fatty
acid composition of the refined seed oil were
estimated. The oil was rich in linoleic acid, oleic
acid and trace quantities of epoxy and hydroxy
fatty acids. Acacia arabica bark is reported to
contain catechin, epicatechin, dicatechin,
quercetin, grallic acid leucocyanidin gallate,
sucrose and catechin. (drugandcure.blogspot.in)
The parts of babul such as Leaves, bark and fruit
are used beneficial therapeutically. The doses of
Babul is Bark decoction 30-80 ml; Bark powder 3-
6gm; leaves powder 3-6gm; and fruit powder 3-
6gm. (www.avurveda.com).
It has a slight tan-tike odour, astringent taste and
mucilaginous (botanica.com)
Babul is used as anti-diabetic. Acacia arabica
seeds contains a substance(s) which depressed the
blood glucose level in normoglycemic but not in
alloxan-diabetic rabbits, suggesting that the
mechanism of action involved release of insulin
from pancreatic beta-cells. The bark in the form of
decoction (20 mg/kg) as well as the standard drug
talbutamide produced a significant reduction in
blood glucose levels in mild alloxonised diabetic
rabbits fasted for 18 - 38 hr.
Methanolic extract of the bark decreased the UV-
induced mutagenicity using the Escherichia coli
WP-2 in a dose of 5 mg/plate. This decrease might
be due to some enzymatic action which reverted
the formation of pyrimidine dimmers.
Acacia seeds extracts displayed more pronounced
action on human trypsin and chymotrypsin, it was
more effective in inhibiting the total proteolytic
activity of the bovine system.
3
Science Spectrum Vol.2 (1) 1- 11 January 2017, ISSN 2455-5053
Studies have shown that babul bark extracts
resulted in lipid per- oxidation or cholesterol
control. On the other hand, the antioxidant
properties also showed hepato-protective
properties or liver protection from carbon
tetrachloride by free radical scavenging.
The seeds of babul can control ordinary diarrhoea,
Fresh leaves of the plant can be administered with
same quantity of cumin seeds. This mixture of 12g
each can be taken thrice every day. The decoction
of the gum can be made for the same.
The stem bark extracts of babul or Acacia arabica
showed significant antibacterial properties against
S. viridans, S. aures, E coli, B subtilis, Sonnei and
against fungi such as C albicans, A niger.
The seeds and pod extracts of babul have been
shown to significant control the arterial blood
pressure. Antispasmodic effects were also
observed in the extracts. The antispasmodic effects
were very similar to the control of arterial blood
pressure. Babul demonstrated acetyl cholinesterase
inhibitory effects. Acetyl cholinesterase inhibition
has been named critical in proper functioning of
the nervous system and in the treatment of
Alzheimer’s disease.
Research on babul showed chemopreventive and
antimutagenic properties through the presence of
polyphenals and gallic acid. The extracts of
flowers and gum were observed to be very
effective.
For hundreds of years, babul bark and gum have
been used for Dental problems. Studies on the
babul gum have yielded positive results in
removing plaque, gingivitis and periodontitis. The
gum was found to be effective in inhibiting the
growth of periodontitis bacteria such as
Actinobacillus actinomycetemcomitans,
Capnocytophaga spp., Porrphyrcmonas gingivalis,
Prevotella intermedia and Treponema denticola.
The bark of babul tree is useful in the treatment of
eczema. About 25 grams each of this bark and the
mango bark should be boiled in about 1 litre of
water and the vapours allowed fomenting the
affected part. After the fomentation, the affected
part should be anointed with ghee.
A decoction of the bark, mixed with rock salt,
should be used as a gargle in treating tonsillitis.
(www.dabur.com & www.allayurveda.com)
The Present study was conducted with following
objectives:
(i) To process Babul bark in powder form and
find out the component changes after
dehydration.
(ii) To introduce the babul plant as medicinal
uses for reducing the complication of
diabetes by preparing biscuits enriched with
babul bark powder.
(iii) To assess the organoleptic quality of namkin
biscuit enriched with babul bark powder.
(iv) To see the effectiveness of babul bark
namkin biscuit on diabetic patient by
intervention.
Material & Methods
The present investigation “Utilization and
Nutritional Evaluation of Babul (Acacia Arabica)
For the Development of Value Added Product to
implement on the Diabetic Patient” was carried
out by using the material and methods described in
this chapter.
The details of materials, experimental procedure
and techniques adopted during the course of the
present investigation have been elaborated:
1. Selection of Products: The product namely
babul bark were selected for present study.
2. Procurement of raw materials: Babul (Acacia
arabica) barks were collected from local areas
of Hazaribag in the month of November to
January.

4
Vol.2 (1) 1- 11 January 2017, ISSN 2455
3. Experimental site: The present investigation
was carried out in the laboratory of university
Clinical Nutrition and Dietetics, Vinoba
Bhave University, Hazaribag and Department
of Home Science, Birsa Agriculture
University, Ranchi.
4. Dehydration of Babul (Acacia arabica) barks:
Selected herbal plants namely Babul (Acacia
arabica) barks were subjected to dehydration.
The Babul (Acacia arabica) barks were tray
dried at controlled temperature of 180
for 4-5 hrs.
The Process is described in the following steps:
5. Development of value added food Products:
Dehydrated Babul barks powder were used for
the development of value added locally
familiar food product namely Namkin biscuits
at the ratio of 10:90 in 100 gm.
Final moisture content
Storage
Seiving
Grinding
Tray drying
Sorrting, cutting,
Washing (to remove micro-organisms, dirts
etc.)
Collection of Babul barks (Initial stage moisture
content)
11 January 2017, ISSN 2455-5053
Experimental site: The present investigation
was carried out in the laboratory of university
Clinical Nutrition and Dietetics, Vinoba
Bhave University, Hazaribag and Department
a Agriculture
Dehydration of Babul (Acacia arabica) barks:
Selected herbal plants namely Babul (Acacia
arabica) barks were subjected to dehydration.
The Babul (Acacia arabica) barks were tray
dried at controlled temperature of 180-2000C
The Process is described in the following steps:
Development of value added food Products:
Dehydrated Babul barks powder were used for
the development of value added locally
familiar food product namely Namkin biscuits
Replication of value added food products enriched
with dehydrated Babul barks were done as
follows:
5.1. Chemical Analysis: Chemical analysis of
dehydrated Babul barks powder was done by
standard procedures. For this 3 replications
were done.
Babul barks Dehydrated Babul bark powder
5.2. Organoleptic Test: Organoleptic test was
done by using 9 point hedonic scale namkin
biscuits and it was replicated 5 times.
Product Replication
Namkin Biscuits
6. Organoleptic analysis of the
To analyse the products Namkin Biscuits were
freshly prepared and evaluated
organoleptically by a panel of five judges
selected from the Department of Clinical
Nutrition and Dietetics, Vinoba Bhave
University, Hazaribag. The judges were
requested to score the products with the help
of score card based on the nine point hedonic
scale; mean scores for biscuits were
calculated.
7. Nutrient estimation: After estimation
dehydrated babul bark was analyzed for their
moisture content, total ash,
fibre, crude fat, calcium, iron, carotene. Iron
content was estimated by Atomic Absorption
Spectrophotometer method. Protein, fat, ash,
fibre was estimated by AOAC 1990 method.
Calcium was estimated by Atomic Absorption
Spectrophotometer. Carbohydrate was
estimated by Difference method. Vitamin C
was estimated by Dimethod.
Science Spectrum
Replication of value added food products enriched
with dehydrated Babul barks were done as
Chemical Analysis: Chemical analysis of
dehydrated Babul barks powder was done by
standard procedures. For this 3 replications
Replication Dehydrated Babul bark 3
Organoleptic Test: Organoleptic test was
done by using 9 point hedonic scale namkin
biscuits and it was replicated 5 times.
Replication
5
Organoleptic analysis of the cooked products:
To analyse the products Namkin Biscuits were
freshly prepared and evaluated
organoleptically by a panel of five judges
selected from the Department of Clinical
Nutrition and Dietetics, Vinoba Bhave
University, Hazaribag. The judges were
quested to score the products with the help
of score card based on the nine point hedonic
scale; mean scores for biscuits were
After estimation - The
dehydrated babul bark was analyzed for their
moisture content, total ash, protein, crude
fibre, crude fat, calcium, iron, carotene. Iron
content was estimated by Atomic Absorption
Spectrophotometer method. Protein, fat, ash,
fibre was estimated by AOAC 1990 method.
Calcium was estimated by Atomic Absorption
arbohydrate was
estimated by Difference method. Vitamin C
was estimated by Dimethod.
5
Science Spectrum Vol.2 (1) 1- 11 January 2017, ISSN 2455-5053
8. Calculation of Nutritive value: The protein,
crude fibre, iron, calcium, carotene,
carbohydrate and vitamin-c of the products
were calculated by using the proximate
analysis values determined of dehydrate babul
bark as well as the Food Composition Table
by Gopalan et. al. (2004).
For Intervention Selection of Sample:
Three stages of sampling were adopted for the
present study.
(i) Selection of District: Ramgarh district was
selected purposively for the present study as
it was convenient, as the researcher had
good access to it, so regular visit could be
made authentic for the collection of data.
(ii) Selection of Area: CCL Hospital of Saunda,
Sayal, Bhurkunda and Ramgarh were
selected purposively for the study as these
are in the centre of the town and were easier
for the researcher to make regular visit and
carry out the survey.
(iii) Selection of Respondent: The total no of
respondents selected were 100, out of whom
50 were in control group & reviewing 50 in
experimental group. Selection was done by
simple random sampling method. All the
respondents of experimental group were
from age group of 27-80 years. Intervened
with the biscuits enriched with babul bark
powder. Each respondents of experimental
group were given 5 biscuits/day (50g) for
one month.
Preparation of Instrument and Tools for the
Data Collection:
For the date collection and structured was
developed. The schedule consisted of the
following information which is elaborated below.
(i) General Profile: The data regarding the
general profile of respondents were
collected using first part of the schedule
which include name, age, sex, religion and
family type no. of family members, total
income of the respondents.
(ii) Dietary Survey: In the present study 24
hours dietary recall method (Swaminathan,
2006) was adopted and nutrient intake per
day was calculated. Calculation of nutrient
intake was done with the help of “Nutritive
value of Indian foods”. Gopalan et al., 2007,
and compared with Recommended Dietary
Allowances given by ICMR. The food
consumption frequency was recorded in
terms of cereals, green leafy vegetables and
other vegetable, roots and tubers, milk &
milk products, meat and fish, egg, fruits, oil
& seeds other food (fast and junk food)
consumption. Information related to dietary
pattern, food habits, food intake and nutrient
intake with references to protein, fat,
carbohydrate, energy, iron, calcium and
fibre were recorded. The respondents were
asked to provide information regarding the
menu as well as ingredients and amounts
used for meal preparation.
(iii) Blood Testing: Blood testing carried out
two times in a month of the respondents in
both the groups i.e. as control group and
experimental group. This data was collected
for the comparison study.
Method: Estimation of BSL of both group i.e.,
experimental and control group were estimated
with alkaline citrate method.
Statistical Analysis: Data was tabulated and
subjected to analysis at the end of the study. The
statistical techniques used were as described by
Prasad. S (2012) and included the following four
tests: Standard deviation, Standard Error, Paired t-
test &Analysis of variance.
Period of Inquiry: The data for the study were
calculated during the period from January - April
2014.

6
Vol.2 (1) 1- 11 January 2017, ISSN 2455-5053 Science Spectrum
Results & Discussion
According to the data obtained from table 1 the
proximate composition in response to protein,
carbohydrate, fat, vitamin C, Fibre, Iron, Calcium,
ash and moisture is in sufficient amount. After
dehydration the moisture content in dehydrated
powder was 8 gm, carbohydrate estimation of
dehydrate bark was 58 gm which was in
polysaccharide form being helpful for diabetic
patients. It contain (140 mg) of Iron which can
treat the iron deficiency diseases. It is high in fibre
content which covers the 18 gm. It is low in fat (2
gm) and high in vitamin-C (25.3 mg). Calcium
content in dehydrated babul bark is (2939.2 mg)
which can reduce the calcium deficiency.
Table 1. Proximate composition of dehydrated
Acacia arabica bark powder per 100 gm.
Nutrient Dehydrated Acacia
Arabic (babul)
Mean
R1 R2 R3
Moisture
(gm)
8.360 8.477 8.470 8.435
0.03
Protein (g) 5.33 5.51 5.25 5.36
0.07
Carbohydr
ate (g)
55.41 56.093 56.30 55.93
0.27
Crude
fibre (g)
18.11 18.01 18.14 18.08
0.03
Ash (g) 10.61 10.00 9.91 10.91
0.57
Calcium
(mg)
2905.8
1
2905.8 3006 2939.2
34.0
Iron (mg) 140.5 141.1 141.5 140.86
0.31
Vitamin-C
(mg)
20.7 27.6 27.6 25.3
2.34
Fat (g) 2.18 1.91 1.93 2.00
0.08
Table 2. Effect of addition of dehydrated Acica
arabica (Babul) bark powder on the colour,
texture, flavor and taste of the Namkin Biscuit.
Results
The table 2 shows average score based on 9 point
hedonic scale for colour, texture, flavor, taste, and
overall acceptability of biscuit enriched with babul
bark powder. Overall acceptability and taste
scored maximum followed by flavor, texture and
colour respectively.
From the ANOVA table it was evident that the
calculated value of biscuit was greater than the
tabulated value at 5% probability level. Therefore
it was found that there was significant difference
between the colour, texture, flavor, taste and
overall acceptability of the biscuit (P 0.05). So,
it was concluded that overall acceptability was
overall like to very much.
For Intervention: All the information about the
hundred respondents collected is presented and
discussed here. Among the subjects studied
majority of the respondents (92%) belonged to
Hindu religion whereas (8%) belonged to Muslim
religion, (65%) lived in nuclear family whereas
(35%) lived in joint family (86%) respondents and
his family were literate, earned between Rs.
20,000/- – 25,000/-, had per capita income
between Rs. 4,000/- - 5,500/- (47%) were working
as employee and has sedentary life style.
Replicat
ion
Sensory scores Mean
S.E R1 R2 R3 R4 R5
Colour 7.3 8.1 7.9 8.4 9 8.1 0.27
Texture 7.1 7.9 8.4 8.4 9 8.1 0.31
Flavor 7.4 8.1 8.3 8.4 9 8.2 0.25
Taste 7.7 8.3 8.7 8.6 9 8.4 0.21
Overall
acceptab
ility
7.9 8.3 8.5 8.6 9 8.4 0.17
7
Science Spectrum Vol.2 (1) 1- 11 January 2017, ISSN 2455-5053
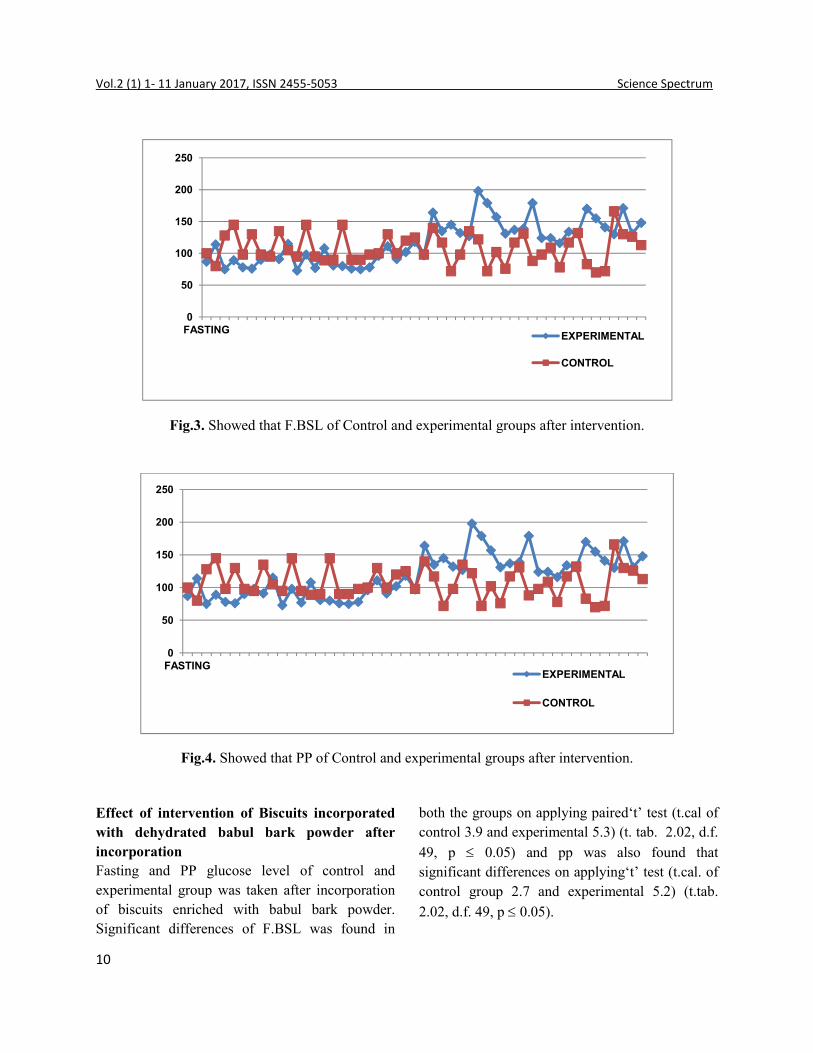
Table 3. Nutritive value of Namkin biscuit enriched with dehydrated babul bark powder per 100 gm.
S.
No.
Ingredie
nts
Energy
(K cal)
CHO
(gm)
Protein
(gm)
Fat
(gm)
Iron
(mg)
Vit. C
(mg)
Fibre
(gm)
Calcium
(mg)
Moisture
(gm)
1 Flour
(70gm)
238 48.58 8.47 1.19 3.43 - 1.33 33.6 8.54
2 Bark
Powder
(10gm)
22 5.593 0.536 0.2 14.15 2.53 1.808 293.92 0.8435
3 Oil
(10gm)
90 - - 10 - - - - -
4 Milk
Powder
(6gm)
29.76 2.28 1.548 1.60
2
0.036 0.24 - 57 0.21
Table 4. Food consumption frequency of respondents
Food
EXPERIMENT GROUP CONTROL GROUP
Daily 2-4
times a
week
4-6
times a
week
Seldom Never Daily 2-4
times a
week
4-6
times a
week
Seldom Never
N
=
50
%
N
=
50
%
N
=
50
%
N
=
50
%
N
=
50
%
N
=
50
%
N
=
50
%
N
=
50
%
N
=
50
%
N
=
50
%
Cereals
and Cereal
products
50 10
0 50
10
0
Pulses &
Legumes 47 94 3 6 44 88 4 8 2 4
Green leafy
vegetables 43 86 4 8 3 6 38 76 4 8 8 16
Other
vegetables 16 32 13 26 9 18 8 16 4 23 46 11 22 14 28 2 4
Fruits 36 72 5 10 6 12 3 6 42 84 4 8 2 4
Milk & its
products 48 96 2 4 49 98 1 2
Meat &
Fish 16 28 14 28 11 22 9 18 21 46 17 34 8 16 4 8
Eggs 39 78 7 14 4 8 37 74 11 22 2 4
Other
snacks
(chips,
pakoda)
23 58 6 12 8 16 13 26 14 28 10 20 17 34 9 18
Alcohol 23 46 4 8 12 24 10
22
2 20 40 12 24 9 18 9 18

8
Vol.2 (1) 1- 11 January 2017, ISSN 2455-5053 Science Spectrum
Table 4 showed that, most of the respondents
(87%) were Non-vegetarian. Both groups of the
respondents were consuming cereals and its
products daily. The percentage of consumption of
pulses & legumes was higher (94%) in
experimental group while higher percentage of
respondents in both group consume milk and its
product daily. Fruit consumption is very low in
both groups (66%) as the comparison of other food
consumption frequency. According to Table-5
intake of most of the nutrients in the experimental
and control groups were comparatively more than
the recommended dietary allowance (RDA).
Intake of energy and fibre of both groups i.e.,
experimental and control were very less than the
RDA. On applying analysis of variance test
(ANOVA) test, it was found that there were no
significant differences with respect of all nutrients
in different age groups at 5% probability level
Table 5. Average daily Nutrient intake of the respondents in both groups
Group
Energ
y
(Kcal)
CHOs
(gm)
Protei
n
(gm)
Fat
(gm
)
Fibr
e
(gm)
Iron
(mg)
Calciu
m
(mg)
Thia
mine
(mg)
Ribofla
vin
(mg)
Niacin
e (mg)
Experi
mental
Group
Intake 1566
22
196
2.5
67
1.44
55
1.41
6.4
0.14
17
0.27
856
33
1.6
0.07
3.38
0.24
16.2
0.56
RDA 2320 195 60 25 25 17 600 1.2 1.4 16
Differ
ence -754 1 7 30 -18.6 17 256 0.47 1.98 0.2
Contro
l
Group
Intake 1564
17.1
194
2.73
68
1.21
57
0.98
5.8
0.16
17
0.26
8.26
10.22
1.53
0.07
3.41
0.24
19.1
0.58
RDA 2320 195 60 25 -25 17 600 1.2 1.4 16
Differ
ence -756 1 8 37 19.2 0 220 0.33 2.01 3.1
F. Cal. : 18.51 5.12
F. Tab. : 19.00 3.63
P 0.05
Result NS NS

9
Science Spectrum Vol.2 (1) 1- 11 January 2017, ISSN 2455-5053
Fig.1. Showed that F.BSL of Control and experimental groups before intervention.
Fig.2. Showed that PP of Control and experimental groups before intervention.
Effect of intervention of Biscuits incorporated
with dehydrated babul barks powder before
incorporation
Fasting and PP glucose level of control and
experimental group was taken before
incorporation of biscuits enriched with babul bark
powder. Significant differences (Appendix ‘E’) of
F.BSL was found in both the groups on applying
paired‘t’ test (t.cal of control 2.9 and experimental
4.02) (t. tab. 2.02, d.f. 49, p 0.05) and pp was
also found that significant differences on
applying‘t’ test (t.cal. of control group 3.8 and
experimental 2.3) (t.tab. 2.02, d.f. 49, p 0.05).
0
50
100
150
200
250
300
350
FASTI…
EXPERIMENTAL
CONTROL
0
50
100
150
200
250
300
350
PPEXPERIMENTAL CONTROL
10
Vol.2 (1) 1- 11 January 2017, ISSN 2455-5053 Science Spectrum
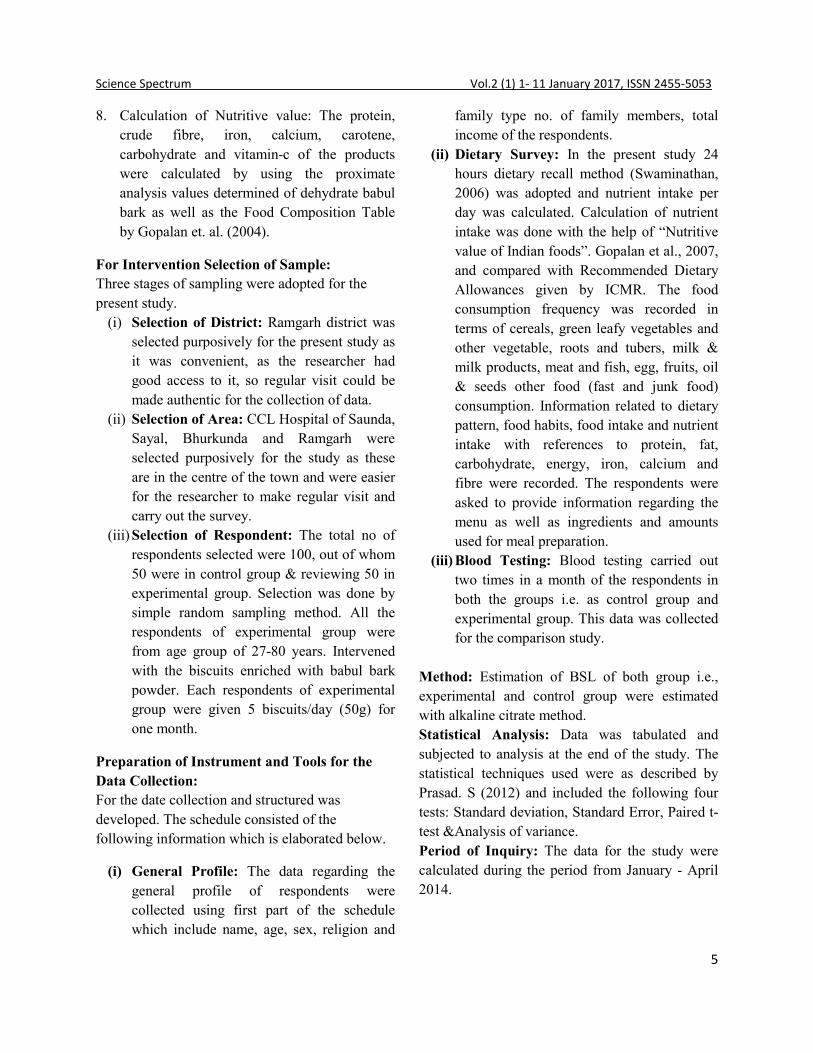
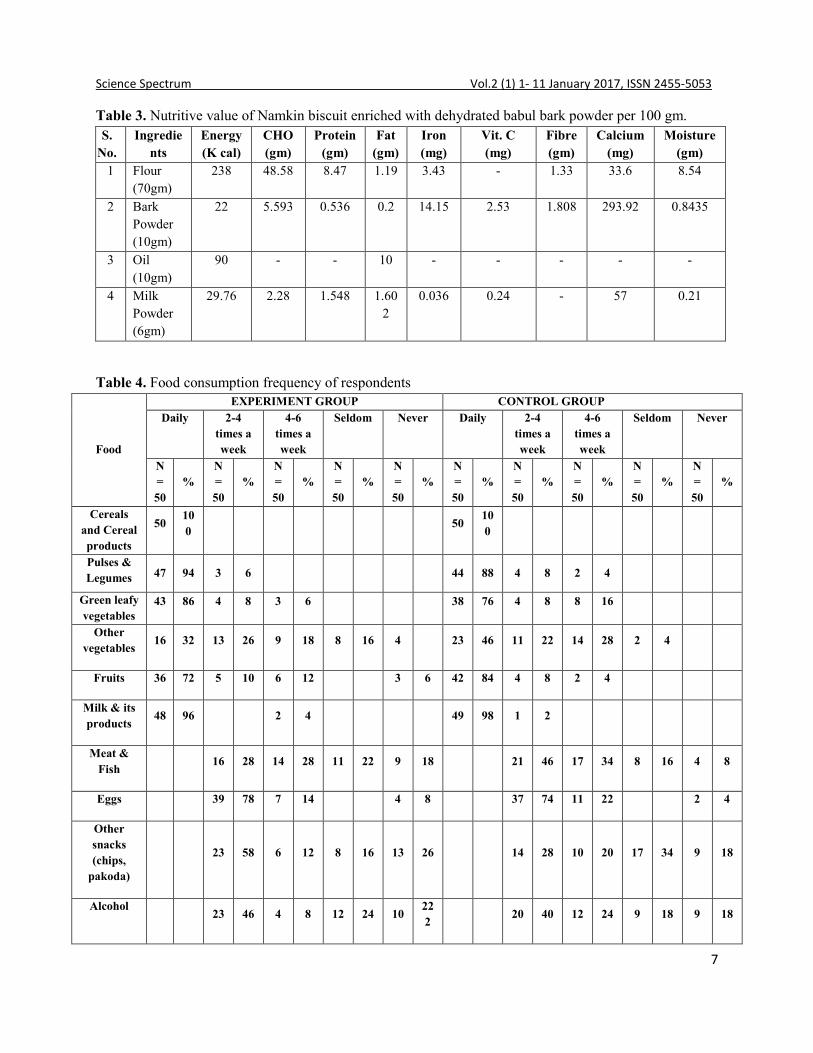
Fig.3. Showed that F.BSL of Control and experimental groups after intervention.
Fig.4. Showed that PP of Control and experimental groups after intervention.
Effect of intervention of Biscuits incorporated
with dehydrated babul bark powder after
incorporation
Fasting and PP glucose level of control and
experimental group was taken after incorporation
of biscuits enriched with babul bark powder.
Significant differences of F.BSL was found in
both the groups on applying paired‘t’ test (t.cal of
control 3.9 and experimental 5.3) (t. tab. 2.02, d.f.
49, p 0.05) and pp was also found that
significant differences on applying‘t’ test (t.cal. of
control group 2.7 and experimental 5.2) (t.tab.
2.02, d.f. 49, p 0.05).
0
50
100
150
200
250
FASTINGEXPERIMENTAL
CONTROL
0
50
100
150
200
250
FASTINGEXPERIMENTAL
CONTROL

11
Science Spectrum Vol.2 (1) 1- 11 January 2017, ISSN 2455-5053
Conclusions
It is concluded that babul bark, powder mainly 5
g/day given in the form of namkin biscuit reduces
the blood glucose level in diabetic subjects and it
may be beneficial for diabetes. This is the primary
study, for a short period of time. It may be more
effective when more human studies require finding
out the effective doses and effect of doses.
However nutrition education should also be given
for the management and control of disease.
References
1. A. Banso, Photochemical and antibacterial
investigation of bark extract of Acacia
nilotica, Journal of medicinal plant research,
2009, 3(2), 082-085.
2. A.R. Pradeep, E.P. Agrwal, S.B. Bajaj, N.
Naik, Shanbhag, and S.R. Uma, Clinical and
microbiolgic effects of commercially available
gel and powder containing Acacia arabica on
gingivitis, Australian Dental Journal, 2012, 57,
312-318.
3. A.S. Andreson, An overview of diet survey
methodology, British Food Journal, 1995, 97,
ISS 7, 22-26.
4. C.D. Jensen, G.A. Spiller, and J.E. Gates, The
effect of acacia gum and a water soluble
dietary fiber mixture on blood lipids in human,
J. Am. Coll. Nutr. 1993, 2, 147-154.
5. FAO 1992: Gum arabic (Published in FAO
food and nutrition paper 49, 1990), In
compendium of food additive specification.
FAO food & Nutrition paper 52 (Joint
FAO/WHO) Expert committee on food
Additive, Food & Agriculture organization,
735-737.
6. H.C. Durry, Ayurvedic useful plants of India,
with their medicinal properties and use in
medicine, Article published by Colonel Herber
Durry, 2006.
7. M. Chellapandian, and M. Murugan, Chemical
composition and nutritive value of Acacia
nilotic pods for sheep, Indian J. small rumin,
2003, 9(2), 130-132.
8. M.A. Khan, T. Khan, and Z. Ahmed, Barks
used as source of medicine in Madhya
Pradesh, India, Fitoterpia, 1994, 65, 444-446.
9. Masuellie & A. Martin, Hydrodynamic
properties of whole Arabic gum, American
Journal of Food Science and Technology,
2013, 1.3, 6.
10. P. Priyanka, and C. Maya, Management of
type 2 DM by Indian gum Arabic pods
powder, International Journals of Food &
Nutritional Search, e-ISSN: 2320-7876 Col.-2
ISS – 2, April – June, 2013.
11. S. Goels, and T. Kaur, Impact of
Hypoglycemic herbal mixture based biscuits
intervention on blood glucose level and lipid
profile of Type 2 DM, 2012, IJFANS: E ISSN
2320-7876.
12. S. Rajvaidhya, B.P. Nagori, G.K. Singh, B.K.
Dubey, P. Desai, and S. Jain, A review on
Acacia Arabica – An Indian Medicinal Plant,
International Journals of Pharma and Science
Research, 2012, 3(7), 1995-2005.
13. U.B. Cheema, J.I. Sultan, A. Javaid, P. Akhtar,
and Mr. Shahid, Chemical composition,
mineral profile and in situ digestion kinetics of
fodder leaves of four native etrees, Pakistan J.
Bot., 2011, 42(1), 397-704.

12
Vol.2 (1) 12 – 22 January 2017, ISSN 2455-5053 Science Spectrum
Morphological and Biochemical Responses to Heat Stress in
Arachis hypogaea L.
K. Rekha Rani, A. Sujitha, Y. Mrunalini, D. Sujitha and R. Usha* Department of Biotechnology, Sri Padmavati Mahila Visvavidyalayam, Tirupathi-517502, Andhra Pradesh, India
*For Correspondence: [email protected]
Abstract
Globally peanut (Arachis hypogaea L.) is
economically one of the important oil and food
crop and it ranks third and fourth as a source of
protein and edible-oil respectively. The world
population is increasing rapidly and may reach 6
to 9.3 billion by the year 2050, whereas the crop
production is decreasing rapidly because of the
negative impact of various environmental stresses;
therefore, it is now very important to develop
stress tolerant varieties to cope up with this
upcoming problem of food security. Abiotic
stresses are major constraints for many crop plants
in specific areas over the globe which limits the
crop production. Heat stress due to high ambient
temperatures is a serious threat to crop production
worldwide. Screening of ground nut genotypes for
high temperature stresses in natural conditions
which are highly variable is very difficult. The
adverse effects of heat stress can be mitigated by
developing crop plants with improved thermo-
tolerance using various genetic approaches.
Temperature Induction Response (TIR) technique
is the best alternative to evaluate ground nut
genotypes for thermo-tolerance. The physiological
and biochemical responses to heat stress are active
research areas, and the molecular approaches are
being adopted for developing heat stress tolerance
in plants. Most recently, biotechnology has
contributed significantly to a better understanding
of the genetic basis of heat tolerance. Molecular
knowledge of response and tolerance mechanisms
will pave the way for engineering plants that can
tolerate heat stress and could be the basis for
production of crops which can produce economic
yield under heat-stress conditions.
Keywords: Arachis hypogaea L., Heat stress,
Temperature induction response, Osmoprotectants,
Membrane thermostability.
Introduction
Globally peanut (Arachis hypogaea L.) is
economically one of the important oil and food
crop and it ranks third and fourth as a source of
protein and edible-oil respectively, with over two-
thirds of global production coming from
seasonally rainfed areas of tropical, sub-tropical
and warm regions of the world. Therefore it
constitutes an important portion of food nutrition
for people in these regions. Cultivated groundnut
or peanut (A. hypogaea L.) is a self pollinated,
allotetraploid (2n=4x=40) with a genome size of
2891 Mbp (Fig. 1) Though a native of South
America, peanut is presently cultivated mainly in
Asian (11.82 m ha), African (7.6 m ha) and
American (1.1 m ha) countries in semi- arid
regions and also in India, China, Nigeria, USA etc.
(USDA, 2013).

13
Science Spectrum Vol.2 (1) 12-22 January 2017, ISSN 2455-5053
Fig 1. Groundnut (Arachis hypogaea L.)
Impact of Heat Stress
Among the ever-changing components of the
environment, the constantly rising ambient
temperature is considered one of the most
detrimental stresses. Heat stress due to high
ambient temperatures is a serious threat to crop
production worldwide (Hall, 2001). According to a
report of the Intergovernmental Panel on Climatic
Change (IPCC, 2007), global mean temperature
will rise 0.30C per decade (Jones et al., 1999)
reaching to approximately 1 to 30C above the
present value by years 2025 and 2100,
respectively, and leading to global warming.
Rising temperatures may lead to altered
geographical distribution and growing season of
agricultural crops by allowing the threshold
temperature for the start of the season and crop
maturity to reach earlier (Porter, 2005).
Heat stress causes alterations in plant growth,
development, physiological processes, and yield
(Fig.1). One of the major consequences of heat
stress is the excess generation of reactive oxygen
species (ROS), which leads to oxidative stress
(Hasanuzzaman et al., 2013). A plant is able, to
some extent, to tolerate heat stress by physical
changes within the plant body and frequently by
creating signals for changing metabolism. Plants
alter their metabolism in various ways in response
to high temperature, particularly by producing
compatible solutes that are able to organize
proteins and cellular structures, maintain cell
turgor by osmotic adjustment, and modify the
antioxidant system to re-establish the cellular
redox balance and homeostasis (Janska et al.,
2010). At the molecular level, heat stress causes
alterations in expression of genes involved in
direct protection from high temperature
(Chinnusamy et al., 2007; Shinozaki and
Yamaguchi-Shinozaki, 2007). These include genes
responsible for the expression of osmoprotectants,
detoxifying enzymes, transporters, and regulatory
proteins (Krasensky and Jonak, 2012; Semenov
and Halford, 2009). Due to high temeparatures,
modification of physiological and biochemical
processes by gene expression changes gradually
leads to the development of heat tolerance in the
form of acclimation, or in the ideal case, to
adaptation (Moreno and Orellana, 2011;
Hasanuzzaman et al., 2010).
Direct injuries due to high temperatures include
protein denaturation and aggregation, and
increased fluidity of membrane lipids. Indirect or
slower heat injuries include inactivation of
enzymes in chloroplast and mitochondria,
inhibition of protein synthesis, protein degradation
and loss of membrane integrity (Howarth, 2005).
Fig. 2. Major effects of high temperature in Plants.
14
Vol.2 (1) 12 – 22 January 2017, ISSN 2455-5053 Science Spectrum
Heat stress also affects the organization of
microtubules by splitting and/or elongation of
spindles, formation of microtubule asters in
mitotic cells, and elongation of phragmoplast
microtubules. These injuries eventually lead to
starvation, inhibition of growth, reduced ion flux,
production of toxic compounds and reactive
oxygen species (ROS) (Schoffl et al., 1999). Plants
overcome high-temperature stress by several
physiological and biochemical mechanisms
(Rampino et al., 2009).
Morpho-Physiological Responses
When plants are exposed to high temperatures
they exhibit various mechanisms for surviving
which include long-term evolutionary,
phenological and morphological adaptations or
short-term avoidance or acclimation mechanisms
involving leaf orientation, transpiration cooling
(Wahid, 2007). Physiological role of leaf rolling
was the maintenance of adaptation potential by
increasing the efficiency of water metabolism in
the flag leaves of wheat under high temperature
(Sarieva et al., 2010). High temperature also
greatly affects starch and sucrose synthesis, by
reduced activity of sucrose phosphate synthase,
ADP-glucose pyrophosphorylase, and invertase
(Rodríguez et al., 2005). Heat imposes negative
impacts on leaf of plant like reduced leaf water
potential, reduced leaf area and pre-mature leaf
senescence which have negative impacts on total
photosynthesis performance of plant (Greer and
Weedon 2012; Young et al., 2004). Brief exposure
of plants to high temperatures during seed filling
can accelerate senescence, diminish seed set and
seed weight, and reduce yield (Siddique et al.,
1999). In temperate and tropical lowlands, heat
susceptibility is a cause of yield loss in groundnut,
Arachis hypogaea L. (Vara Prasad et al., 1999).
Under prolonged heat stress depletion of
carbohydrate reserves and plant starvation are also
observed (Djanaguiraman et al., 2009). High
temperatures can cause considerable pre- and post-
harvest damages, including scorching of leaves
and twigs, sunburns on leaves, branches and
stems, leaf senescence and abscission, shoot and
root growth inhibition, fruit discoloration and
damage, and reduced yield (Guilioni et al., 1997;
Ismail and Hall, 1999; Vollenweider and
Gunthardt- Goerg, 2005).
Similarly, in temperate regions, heat stress has
been reported as one of the most important causes
of reduction in yield and dry matter production in
many crops, including maize (Giaveno and
Ferrero, 2003). Heat stress affects the process of
photosynthesis through various means, i.e., ROS-
mediated membrane damage and reduced
chlorophyll production (Chu et al., 1974; Dhindsa
et al., 1981; Nishizawa et al., 2008).
Growth chamber and greenhouse studies suggest
that high temperature is most deleterious when
flowers are first visible and sensitivity continues
for 10–15 days. Reproductive stages of peanut are
sensitive to temperatures over 35°C and yield
losses were reported when temperatures exceeded
this threshold value (Ketring, 1984; Vara Prasad et
al., 2000). Heat stress may alter membrane lipid
bilayer structure and cause membrane protein
displacement, which together with solute leakage
is believed to contribute to the loss of membrane
selectivity (Du et al., 2011). A membrane injury
test such as electrolyte conductivity test has been
widely used to differentiate stress tolerant and
susceptible cultivars in peanut (Celikkol Akcay et
al., 2010; Ketring, 1985; Lauriano et al., 2000).
The relationship between membrane injury and
other physiological traits such as specific leaf area
and chlorophyll content was also demonstrated in
peanut (Nautiyal et al., 2008). Thus, membrane
injury tests offer a promising tool for assessing the
stress tolerance ability in peanut. In peanut,
genotypic differences in heat tolerance/
susceptibility have been reported for partitioning
of dry matter to pods and kernels (Craufurd et al.,

15
Science Spectrum Vol.2 (1) 12-22 January 2017, ISSN 2455-5053
2002), fruit set, membrane thermostability
(Srinivasan et al., 1996) and chlorophyll
fluorescence (Chauhan and Senboku, 1997). In a
controlled growth chamber study (Vara prasad et
al., 2003; Talwar et al., 1999) reported that
stomatal conductance and transpiration rates
significantly increased with the increase in
temperature and higher net photosynthetic rate.
Biochemical Responses
Various analytical techniques are being used for
identification of metabolites involved in plant
adaptation to environmental changes (Fiehn, 2002;
Kaplan et al., 2004; Guy et al., 2008). Analysis of
stress-induced metabolic profiles can provide new
insights into the mechanisms of stress tolerance in
crops and the resulting information can further
assist in developing stress-tolerant cultivars
through conventional breeding and metabolic
engineering techniques (Fernie and Schauer, 2009;
Valliyodan and Nguyen, 2006).
In response to abiotic stresses, plants produce
metabolites that are involved in primary and
secondary metabolism (Rizhsky et al., 2004;
Shulaev et al., 2008). In plants, these metabolites
act as osmoprotectants, compatible solutes,
reactive oxygen species scavengers, and signal
transduction molecules (Farooq et al., 2009).
During stress, lipid peroxidation can cause severe
membrane injury and as such, can be measured to
assess the degree of heat stress in crops including
peanuts (Bajji et al., 2002; Blum and Ebercon,
1981). A General increases of unsaturated fatty
acid levels during heat stress have been reported
previously (Upchurch, 2008; Zhang et al., 2005).
Several studies reported increased amino acid
levels in response to various stresses in sensitive
cultivars (Vasquez-Robinet et al., 2008; Zuther et
al., 2007).
Their increase is sometimes attributed to stress-
induced protein degradation due to tissue damage
and senescence (Diaz et al., 2005; Widodo et al.,
2009). Leaf chlorophyll fluorescence, measured as
the ratio of variable (Fv) to maximum (Fm)
fluorescence (Fv/Fm), is extensively used in heat
stress studies by physiologists and
ecophysiologists (Burke, 2007; Maxwell, 2000).
The relationship between chlorophyll fluorescence
parameters (including Fv/Fm) and pod yield in
field-grown peanuts was also reported (Clavel et
al., 2006).
A very important adaptive mechanism under high
temperatures is the accumulation of compatible
osmoprotectants like proline, glycine betaine,
sugars, alcohols, polyamines (Hare et al., 1998).
Activities of different antioxidant enzymes such
as super oxide dismutase (SOD), catalase (CAT),
peroxidase (POX), glutathione reductase (GR) and
ascorbate peroxidase (APX) are increased with
increase in temperature. One of the primary
responses of plants exposed to high temperature is
enchanced synthesis of reactive oxygen species
(ROS) (Larkindale et al., 2005; Sung et al., 2003).
Some of the major biochemical responses include
changes in protein content, ion transporters,
signalling molecules, free radical scavengers etc.
To generate response in specific cellular
compartments or tissues against a certain stimuli,
interaction of cofactors and signaling molecules
are required. Signaling molecules are involved in
activation of stress responsive genes. Once the
stress responsive genes activate, they help to
detoxify the ROS (by activating detoxifying
enzymes, free radical scavengers); reactivate the
essential enzymes and structural proteins
(Ciarmiello et al., 2011) and all the above stated
processes help to maintain the cellular homeostasis
(Figure 3).

16
Vol.2 (1) 12- 22 January 2017, ISSN 2455-5053 Science Spectrum
Fig.3. Schematic illustration of heat induced signal
transduction mechanism and development of heat
tolerance in plants.
Screening for Thermotolerance
Screening of ground nut genotypes for high
temperature stresses in natural conditions which
are highly variable is very difficult. The adverse
effects of heat stress can be mitigated by
developing crop plants with improved
thermotolerance using various genetic approaches.
Temperature Induction Response (TIR) technique
is the best alternative to evaluate ground nut
genotypes for thermo tolerance (Gangappa et al.,
2006). The relevance of a physiological or
biochemical trait for thermotolerance can best be
studied by pre-exposure of seedlings/plants to a
sub-lethal acclimation temperature before they are
challenged with severe temperature and
subsequently recovery growth is measured. The
seedling survival and recovery growth is
considered as criteria to arrive at optimum
acclimation stress levels. Thermoprotection on exposure to acclimation
treatment was also observed not only in seedlings
but also at mature plant level (Attaluri, 1998;
Srikanthbabu, 1999). Thermotolerant lines
developed in sunflower, pea, groundnut, pigeon
pea and few vegetable crops adopting TIR
approach substantiate the efficiency and
usefulness of this protocol (Senthil-Kumar et al.,
2003). The advantage of the TIR-based screening
method is that large number of seedlings can be
screened in a short time. It also provides an option
to screen for different temperature regimes. But
the limitation of this method is that screening is
amenable only at seedling stage. Viewed in this
context, it is important to ensure that the
genotypes selected as thermotolerant based on TIR
at seedling level also exhibit tolerance at plant
level. Only then the application of this screening
method is justified.
The best characterized aspect of acquired
thermotolerance is production of heat shock
proteins (HSPs) (Vierling, 1991; Burke, 2001; Iba,
2002). Several other studies in different species
demonstrated that upon acclimation in seedlings as
well as plants, significant increase in HSPs (HSP
70, HSP 104, HSP 90 and HSP 18.1) occurred
(Uma et al., 1995; Kumar et al., 1999;
Srikanthbabu et al., 2002). Along with different
physiological and biochemical mechanisms,
molecular approaches are boosting to understand
the concept of heat stress tolerance very clearly.
Plants tolerate such stresses by modulating
multiple genes and by coordinating the expression
of genes in different pathways (Vinocur and
Altman, 2005; Bohnert et al., 2006).
Conclusion and Future Prospects
The world population is increasing rapidly and
may reach 6 to 9.3 billion by the year 2050,
whereas the crop production is decreasing rapidly
because of the negative impact of various
environmental stresses; therefore, it is now very
important to develop stress tolerant varieties to
cope up with this upcoming problem of food
security. Abiotic stresses are major constraints for
many crop plants in specific areas over the globe
which limits the crop production. Heat stress due
to high ambient temperatures is a serious threat to
crop production worldwide. The global air
temperature is predicted to rise by 0.2°C per
decade, which will lead to temperatures 1.8–4.0°C
higher than the current level by 2100.

17
Science Spectrum Vol.2 (1) 12-22 January 2017, ISSN 2455-5053
This prediction is creating apprehension among
scientists, as heat stress has known effects on the
life processes of organisms, acting directly or
through the modification of surrounding
environmental components. Screening of ground
nut genotypes for high temperature stresses in
natural conditions which are highly variable is
very difficult. The adverse effects of heat stress
can be mitigated by developing crop plants with
improved thermotolerance using various genetic
approaches. Temperature Induction Response
(TIR) technique is the best alternative to evaluate
ground nut genotypes for thermo tolerance.
TIR is a potential screening method not only to
identify contrasting genotypes differing in
thermotolerance but also to identify highly tolerant
lines from segregating progenies or from a
population. This screening protocol is robust and a
large number of seedlings can be screened in a
short period.
The physiological and biochemical responses of
peanut to heat stress are active research areas, and
most recently, biotechnology has contributed
significantly to a better understanding of the
genetic basis of heat tolerance.
Molecular knowledge of response and tolerance
mechanisms will pave the way for engineering
plants that can tolerate heat stress and could be the
basis for production of crops which can produce
economic yield under heat-stress conditions.
Functional characterization of stress inducible
genes is important not only for understanding the
molecular mechanisms of stress tolerance, but also
for practical application in improving stress
tolerance of crops by gene manipulation.
References
1. A.A. Moreno, A. Orellana, The physiological
role of the unfolded protein response in plants,
Biol. Res., 2011, 44, 75–80.
2. A. Blum, A. Ebercon, Cell membrane stability
as a measure of drought and heat tolerance in
wheat, 1981, Crop Sci., 21, 43-47.
3. A.E. Hall, Crop Responses to
Environment.CRC Press LLC, Boca Raton,
Florida, 2001.
4. A. Janska, P. Marsik, S. Zelenkova, J. Ovesna,
Cold stress and acclimation: What is important
for metabolic adjustment? Plant Biol., 2010,
12, 395–405.
5. A.M. Ismail, A.E. Hall, Reproductive-stage
heat tolerance, leaf membrane thermostability
and plant morphology in cowpea, Crop Sci.,
1999, 39, 1762–1768.
6. A.R. Fernie, N.Schauer, Metabolomics-
assisted breeding: a viable option for crop
improvement Trends Genet., 2009, 25, 39-48.
7. B. Valliyodan, H.T. Nguyen, Understanding
regulatory networks and engineering for
enhanced drought tolerance in plants. Curr.
Opin. Plant Biol., 2006, 9, 189–195.
8. B. Vinocur, A. Altman, Recent advances in
engineering plant tolerance to abiotic stress:
Achievements and limitations, Curr. Opin.
Biotechnol., 2005, 16, 123-132.
9. C. Diaz, S. Purdy, A. Christ, J.-F. Morot-
Gaudry, A. Wingler, and C. Masclaux-
Daubresse, Characterization of markers to
determine the extent and variability of leaf
senescence in Arabidopsis. A metabolic
profiling approach, Plant Physiol., 2005, 138,
898-908.
10. C. Giaveno, J. Ferrero, Introduction of tropical
maize genotypes to increase silage production
in the central area of Santa Fe, Argentina.
Crop Breed, Appl. Biotechnol., 2003, 3, 89–
94.

18
Vol.2 (1) 12 – 22 January 2017, ISSN 2455-5053 Science Spectrum
11. C. Vasquez-Robinet, S.P. Mane, A.V. Ulanov,
J.I. Watkinson, V.K. Stromberg, D. De
Koeyer, R. Schafleitner, D.B. Willmot, M.
Bonierbale, H.J. Bohnert, R. Grene,
Physiological and molecular adaptations to
drought in Andean potato genotypes, J. Exp.
Bot., 2008, 59, 2109-2123.
12. C.Guy, F. Kaplan, J. Kopka, J. Selbig, D.K.
Hincha, Metabolomics of temperature Stress,
Physiologia Plantarum, 2008, 132, 220-235.
13. C.J. Howarth, Genetic improvements of
tolerance to high temperature. In: Ashraf, M.,
Harris, P.J.C. (Eds.), Abiotic Stresses: Plant
Resistance Through Breeding and Molecular
Approaches, Howarth Press Inc., New York,
2005.
14. D. Clavel, O. Diouf, J.L. Khalfaoui, S.
Braconnier, Genotypes variations in
fluorescence parameters among closely related
groundnut (Arachis hypogaea L.) lines and
their potential for drought screening programs,
Field Crops Res., 2006, 96, 296-306.
15. D. L. Ketring, Temperature effects on
vegetative and reproductive development of
peanut, Crop Sci., 1984, 24, 877-882.
16. D.H. Greer, M.M. Weedon, Modelling
photosynthetic responses to temperature of
grapevine (Vitis vinifera cv. Semillon) leaves
on vines grown in a hot climate, Plant Cell
Environ., 2012, 35, 1050–1064.
17. D.L. Ketring, Evaluation of peanut genotypes
for membrane thermostability, Peanut Sci.,
1985, 12, 28-32.
18. D.-Y. Sung, F. Kaplan, K.-J. Lee, C.L. Guy,
Acquired tolerance to temperature extremes,
Trends Plant Sci., 2003, 8, 179–187.
19. E. Gangappa, K. Ravi, GN. Veera Kumar,
Evaluation of groundnut genotypes for
temperature tolerance based on temperature
induction response (TIR) technique, Indian J.
Genet., 2006, 66, 127–130.
20. E. Vierling, The roles of heat shock proteins in
plants, Annu. Rev. Plant Physiol. Plant Mol.
Biol., 1991, 42, 579–620.
21. E. Zuther, K. Koehl, J. Kopka, Comparative
metabolome analysis of the salt response in
breeding cultivars of rice, In M. Jenks, P.
Hasegawa, and S. M. Jain (Eds.), Advances in
Molecular Breeding Toward Drought and Salt
Tolerant Crops, Springer Netherlands, 2007,
285-315.
22. F. Kaplan, J. Kopka, D.W. Haskell, W. Zhao,
K.C. Schiller, N. Gatzke, D.Y. Sung,
C.L.Guy, Exploring the temperature-stress
metabolome of Arabidopsis, Plant Physiol.,
2004, 136, 4159-4168.
23. F. Schöffl, R. Prandl, A. Reindl, Molecular
responses to heat stress, In Molecular
Responses to Cold, Drought, Heat and Salt
Stress in Higher Plants; K. Shinozaki, K.
Yamaguchi-Shinozaki, Eds.; R.G. Landes Co.:
Austin, TX, USA, 1999, 81–98.
24. G. Kumar, BT. Krishnaprasad, M. Savitha, R.
Gopalakrishna, K. Mukhopadhyay, G.
Ramamohan, Enhanced expression of heat
shock proteins in thermotolerant lines of
sunflower and their progenies selected on the
basis of temperature induction response (TIR),
Theor Appl Gen., 1999, 99, 359–367.
25. G.E. Sarieva, S.S. Kenzhebaeva, H.K.
Lichtenthaler, Adaptation potential of
photosynthesis in wheat cultivars with a
capability of leaf rolling under high
temperature conditions, Russ. J. Plant
Physiol., 2010, 57, 28–36.
26. H.Du, Z. Wang, W.Yu, Y.Liu, B. Huang,
Differential metabolic responses of perennial

19
Science Spectrum Vol.2 (1) 12-22 January 2017, ISSN 2455-5053
grass Cynodon transvaalensis×Cynodon
dactylon (C4) and Poa pratensis (C3) to heat
stress, Physiol. Plantarum , 2011, 141, 251-
264.
27. H.J. Bohnert, Q. Gong, P. Li, S. Ma,
Unraveling abiotic stress tolerance
mechanisms getting genomics going, Curr.
Opin. Plant Biol., 2006, 9, 180–188.
28. H.S. Talwar, H. Takeda, S. Yashima, T.
Senboku, Growth and photosynthetic
responses of groundnut genotypes to high
temperature, Crop Sci., 1999, 39 (2), 460-466.
29. IPCC (Intergovernmental Panel on Climate
Change) Climate Change, The Physical
Science Basis, Contribution of Working
Group I to the Fourth Assessment Report of
the Intergovernmental Panel on Climate
Change, Cambridge Univ, Press, Cambridge,
UK, 2007, pp 996.
30. J. Krasensky, C. Jonak, Drought, salt, and
temperature stress-induced metabolic
rearrangements and regulatory networks. J.
Exp. Bot., 2012, doi:10.1093/jxb/err460.
31. J. Larkindale, M. Mishkind, E. Vierling, Plant
responses to high temperature. In: MA. Jenks,
PM. Hasegawa, editors. Plant abiotic stress.
Oxford: Blackwell Scientific Publications;
2005b in press.
32. J.A. Lauriano, F.C. Lidon, C.A. Carvalho, P.S.
Campos, M. do Céu Matos, Drought effects on
membrane lipids and photosynthetic activity in
different peanut cultivars, Photosynthetica,
2000, 38, 7-12.
33. J.J. Burke, Evaluation of source leaf responses
to water-deficit stresses in cotton using a novel
stress bioassay, Plant Physiol. 2007, 143,108-
121.
34. J.J. Burke, Identification of genetic diversity
and mutations in higher plant acquired
thermotolerance, Physiol. Plant, 2001, 112,
167–170.
35. J.R. Porter, Rising temperatures are likely to
reduce crop yields, Nature, 2005, 436, 174.
36. J.Widodo, H. Patterson, E. Newbigin, M.
Tester, A. Bacic, and U. Roessner, Metabolic
responses to salt stress of barley (Hordeum
vulgare L.) cultivars, Sahara and Clipper,
which differ in salinity tolerance, J. Exp. Bot.,
2009, 60, 4089-4103.
37. K. Iba, Acclimative response to temperature
stress in higher plants: approaches of gene
engineering for temperature tolerance, Annu.
Rev. Plant Biol. 2002, 53, 225–245.
38. K. Maxwell, Chlorophyll fluorescence--a
practical guide, J. Exp. Bot. 2000, 51, 659-
668.
39. K. Shinozaki, K. Yamaguchi-Shinozaki, Gene
networks involved in drought stress response
and tolerance. J. Exp. Bot., 2007, 58, 221–227.
40. L. Guilioni, J. Wery, F. Tardieu, Heat stress-
induced abortion of buds and flowers in pea: is
sensitivity linked to organ age or to relations
between reproductive organs? Ann. Bot.,
1997, 80, 159–168.
41. L. Rizhsky, H. Liang, J. Shuman, V. Shulaev,
S. Davletova, R. Mittler, When defense
pathways collide. The response of Arabidopsis
to a combination of drought and heat stress,
Plant Physiol., 2004,134, 1683-1696.
42. L.F. Ciarmiello, P. Woodrow, A. Fujji, G.
Pontecorvo, P. Carillo, Plant genes for abiotic
stress. In abiotic stress in plants- mechanisms
and adaptations; A.K. Shanker, B.
Venkateswarulu, (Eds), InTech; Rijeka,
Croata, 2001, pp 283-308.
43. L.W. Young, R.W. Wilen, P.C. Bonham-
Smith, High temperature stress of Brassica
napus during flowering reduces micro- and
20
Vol.2 (1) 12 – 22 January 2017, ISSN 2455-5053 Science Spectrum
megagametophyte fertility, induces fruit
abortion, and disrupts seed production, J. Exp.
Bot., 2004, 55, 485–495.
44. M. Bajji, J.-M. Kinet, S. Lutts, The use of the
electrolyte leakage method for assessing cell
membrane stability as a water stress tolerance
test in durum wheat, Plant Growth Regul.,
2002, 36, 61-70.
45. M. Djanaguiraman, J.A. Sheeba, D.D. Devi,
U. Bangarusamy, Cotton leaf senescence can
be delayed by nitrophenolate spray through
enhanced antioxidant defense system, J.
Agron.Crop Sci., 2009, 195, 213–224.
46. M. Farooq, A. Wahid, N. Kobayashi, D.
Fujita, S. M.A. Basra. Plant drought stress:
effects, mechanisms and management, In E.
Lichtfouse, M. Navarrete, P. Debaeke, S.
Véronique, C. Alberola (eds.), Sustainable
Agriculture, Springer, Netherlands, 2009, 153-
188.
47. M. Hasanuzzaman, K. Nahar, M. Fujita,
Extreme Temperatures, Oxidative Stress and
Antioxidant Defense in Plants. In Abiotic
Stress—Plant Responses and Applications in
Agriculture; K. Vahdati, C. Leslie, Eds.;
InTech: Rijeka, Croatia, 2013, 169–205.
48. M. Hasanuzzaman, M.A. Hossain, M. Fujita,
Physiological and biochemical mechanisms of
nitric oxide induced abiotic stress tolerance in
plants, Am. J. Plant Physiol. 2010, 5, 295–
324.
49. M. Rodríguez, E. Canales, O. Borrás-Hidalgo,
Molecular aspects of abiotic stress in plants,
Biotechnol. Appl., 2005, 22, 1–10.
50. M. Senthil-Kumar, V. Srikanthbabu, B.
Mohanraju, G. Kumar, N. Shivaprakash, M.
Udayakumar, Screening of inbred lines to
develop a thermotolerant sunflower hybrid
using the temperature induction response
(TIR) technique: a novel approach by
exploiting residual variability, J. Exp. Bot.,
2003, 54, 2569–78.
51. M. Zhang, R. Barg, M. Yin, Y. Gueta-Dahan,
A. Leikin-Frenkel, Y. Salts, S. Shabtai, G.
Ben-Hayyim, Modulated fatty acid
desaturation via overexpression of two distinct
ω-3 desaturases differentially alters tolerance
to various abiotic stresses in transgenic
tobacco cells and plants, Plant J., 2005, 44,
361-371.
52. M.A. Semenov, N.G.Halford, Identifying
target traits and molecular mechanisms for
wheat breeding under a changing climate, J.
Exp. Bot., 2009, 60, 2791–2804.
53. M.R.B. Siddique, A. Hamid, M.S. Islam,
Drought stress effects on photosynthetic rates
and leaf gas exchange of wheat, Bot. Bull.
Acad. Sin., 1999, 40, 141–145.
54. Nishizawa, Y. Yabuta, S. Shigeoka, Galactinol
and raffinose constitute a novel function to
protect plants from oxidative damage, Plant
Physiol., 2008, 147:1251-1263.
55. O. Fiehn, Metabolomics – the link between
genotypes and phenotypes, Plant Mol. Biol.
2002, 48, 155-171.
56. P. Q. Craufurd, P.V.V. Prasad, R. J.
Summerfield, Dry matter production and rate
of change of harvest index at high temperature
in peanut, Crop Sci., 2002, 42, 146-151.
57. P. Rampino, M. Giovannoni, P.Stefano, DP.
Mariarosaria, DF.Natale, P.Carla, Acquisition
of thermotolerance and HSP gene expression
in durum wheat (Triticum durum Desf.)
cultivars, Environ and Exp Botany, 2009, 66,
257–264.
58. P. Vollenweider, M.S. Gunthardt-Goerg,
Diagnosis of abiotic and biotic stress factors
using the visible symptoms in foliage,
Environ. Pollut., 2005,137, 455–465.

21
Science Spectrum Vol.2 (1) 12-22 January 2017, ISSN 2455-5053
59. P.C.Nautiyal, K. Rajgopal, P.V. Zala, D.
Pujari, M. Basu, B. Dhadhal, B. Nandre,
Evaluation of wild Arachis species for abiotic
stress tolerance: I. Thermal stress and leaf
water relations, Euphytica, 2008, 159, 43-57.
60. P.D. Hare, W.A. Cress, J.V. Staden,
Dissecting the roles of osmolyte accumulation
during stress, Plant Cell Environ., 1998, 21,
535–553.
61. P.D. Jones, M. New, D.E. Parker, S. Mortin,
I.G. Rigor, Surface area temperature and its
change over the past 150 years. Rev.
Geophys., 1999, 37, 173–199.
62. P.V.V. Prasad, K.J. Boote, L.H. Jr. Allen,
J.M.G. Thomas, Super-optimal temperatures
are detrimental to reproductive processes and
yield of peanut under both ambient and
elevated carbon dioxide, Glob. Change Biol.,
2003, 9, 1775–1787.
63. P.V.V. Prasad, P.Q. Craufurd, R.J.
Summerfield, Effect of high air and soil
temperature on dry matter production, pod
yield and yield components of groundnut,
Plant Soil, 2000, 222, 231–239.
64. P.V.V. Prasad, P.Q. Craufurd, R.J.
Summerfield, Sensitivity of peanut to timing
of heat stress during reproductive
development, Crop Sci., 1999, 39, 1352–1357.
65. R. Upchurch, Fatty acid unsaturation,
mobilization, and regulation in the response of
plants to stress, Biotech. Lett., 2008, 30,967-
977.
66. R.S.Dhindsa, P. Plumb-Dhindsa, T.A. Thorpe,
Leaf Senescence: Correlated with Increased
Levels of Membrane Permeability and Lipid
Peroxidation, and Decreased Levels of
Superoxide Dismutase and Catalase, J. Exp.
Bot., 1981, 32,93-101.
67. S. Attaluri, Thermotolerant groundnut
(Arachis hypogaea L.) genotypes identified
based on temperature induction response
(TIR) technique also exhibited enhanced
expression of a few stress responsive proteins,
M.Sc. thesis, University of Agricultural
Sciences, Bangalore, India, 1998.
68. S.Uma, TG. Prasad, M. Udayakumar, Genetic
variability in recovery growth and synthesis of
stress proteins in response to polyethylene
glycol and salt stress in Finger millet, Ann
Bot., 1995, 76, 43–49.
69. Srinivasan, H. Takeda, T. Senboku, Heat
tolerance in food legumes as evaluated by cell
membrane thermostability and chlorophyll
fluorescence techniques, Euphyt., 1996, 88,
35–45.
70. T.Chu, D. Aspinall, L. Paleg, Stress
metabolism. VI. Temperature stress and the
accumulation of proline in barley and radish,
Funct. Plant Biol., 1974, 1, 87-97.
71. U. Celikkol Akcay, O. Ercan, M. Kavas, L.
Yildiz, C. Yilmaz, H. Oktem, M. Yucel,
Drought-induced oxidative damage and
antioxidant responses in peanut (Arachis
hypogaea L.) seedlings, Plant Growth Regul.,
2010, 61, 21-28.
72. USDA, Oil crops yearbook 2013. USDA
Economics, Statistics and Market Information
System, Albert R. Mann Library, Cornell
University, 2013.
73. V. Chinnusamy, J. Zhu, T. Zhou, J.K. Zhu,
Small RNAs: Big Role in Abiotic Stress
Tolerance of Plants. In Advances in Molecular
Breeding toward Drought and Salt Tolerant
Crops; M.A. Jenks, P.M. Hasegawa, S.M.
Jain, (Eds.); Springer: Dordrecht, The
Netherland, 2007, 223–260.
74. V. Shulaev, D. Cortes, G. Miller, R. Mittler,
Metabolomics for plant stress response,
Physiologia Plantarum, 2008, 132, 199-208.

22
Vol.2 (1) 12 – 22 January 2017, ISSN 2455-5053 Science Spectrum
75. V. Srikanthbabu, G. Kumar, BT.
Krishnaprasad, R. Gopalakrishna, M. Savitha,
M. Udayakumar, Identification of pea
genotypes with enhanced thermotolerance
using temperature induction response (TIR)
technique, J. Plant. Physiol., 2002,159, 535–
45.
76. V. Srikanthbabu, Identification of high
temperature stress tolerant genotypes in
garden pea (Pisum sativum L.) using
temperature induction response (TIR)
technique, M.Sc. thesis, University of
Agricultural Sciences, Bangalore, India, 1999.
77. Wahid, S. Gelani, M. Ashraf, M.R. Foolad,
Heat tolerance in plants: An overview,
Environ. Exp. Bot,. 2007, 61, 199–223.
78. YS. Chauhan, T. Senboku, Evaluation of
groundnut genotypes for heat tolerance, Ann
Appl Biol., 1997, 131, 481–489.

23
Science Spectrum Vol.2 (1) 23-26 January 2017, ISSN 2455-5053
A Novel and Simple Method Developed For Analysis of Iron (III) In Food
Samples
A.V.L.N.S.H. Hariharan* Department of Chemistry, GIT, GITAM University, Visakhapatnam – 530 045, India
*For Correspondence: [email protected]
Abstract
Extraction of iron (III) was carried out with
5.0X10⁻² M of Tri capryl amine oxide [TCAO] in
benzene from aqueous hydrochloric and sulphuric
acid solutions have been done. Stripping of iron
(III) from the organic phase was attempted with
1.0M NaOH. The extractions were nearly
quantitative with the acid solutions employed in
the study. Based on the results obtained in this
study, estimation of iron in food samples as well
alloys was attempted successfully.
Key words: Extraction -iron (III) - Tri capryl
amine oxide – Food samples – Iron alloys
Introduction
Iron is one of the most essential elements in the
human body. Iron deficiency [anemia] is one of
the world’s most common nutritional deficiency
diseases (Ghadamali et al., 2009). Because of the
different biological roles of iron in humans,
animals, plants, and oceans, the need for
analysis of iron in environmental and biomedical
materials have been receiving attention. The
extraction of iron in its trivalent state from
aqueous hydrochloric (Sahu, 2000; Lee and Lee,
2005; Staszak et al., 2011; Gupta et al., 2003) and
sulphuric acid (Cattrall and west, 1966; Alguacil,
and Amer, 1986) solutions by various extractants
has been studied. As there were no reports
available on the extraction of iron (III) with Tri
capryl amine oxide [TCAO], an attempt was made
on its extraction in hydrochloric as well as
sulphuric acid solutions. The results obtained are
discussed in the present communication. The
applicability of the method was extended for
separation of Iron (III) in food samples and iron
alloys.
Experimental
Apparatus and Reagents: A stock solution of
0.3M Iron (III) was prepared by dissolving
appropriate amount of ammonium iron (III) sulfate
(E. Merck) in 500 ml of double distilled water.
The solution was standardized volumetrically with
potassium dichromate using diphenyl amine as the
indicator. Iron (III) solutions of required
concentration were prepared from the stock
solution. TCAO was synthesized (Kennedy, 1964)
by N- oxidation of Tricapryl amine using
hydrogen peroxide as oxidant. A sock solution of
5.0X10⁻² M TCAO in benzene was used
throughout the course of investigations.
Determination of iron content has been done with
ELICO SL 191 UV-Visible Double beam
Spectrophotometer.
Procedure for Iron (III) Extraction: An aliquot
(10ml) of solution containing iron (III) was added
with appropriate concentration of the acid in a
separating funnel and 10 ml of 5X 10⁻² M of
TCAO was added to it. The solution was
vigorously shaken for ten minutes and the two
phases were allowed to s separate. Iron (III) from
the organic phase was stripped with 10 ml of 1M
NaOH and was determined spectrophotometrically
(Vogel, 1962) at 480 nm as its colored complex
with thiocyanate. The concentration of Iron (III)
was computed from the calibration curve.

24
Vol.2 (1) 23-26 January 2017, ISSN 2455-5053 Science Spectrum
Results and Discussion
Variation of Acidity: Iron (III) was extracted from
different concentrations of the acids with 5.0X10⁻²
M TCAO in benzene and the results are presented
in Table 1. It was observed that the distribution
ratio (Kd) increased with increasing concentration
of the acid up to 8.0 M (98.18%) and remained
constant up to 9.0 M acidity and 10.0-11.0M
(96.89%) from sulphuric acid media respectively.
The extractions are nearly quantitative from both
the acid solutions.
Table 1. % Extraction as a function of varying
Acidity
[Fe(III) ]= 1.2 x 10⁻³ M [TIOA] = 5.0 x 10⁻² M
Molarity
(M)
%Extraction
(HCl)
%Extraction
(H2SO4)
1.0 59.99 47.79
2.0 82.58 52.92
3.0 91.20 60.50
4.0 94.08 64.26
5.0 95.17 66.42
6.0 96.62 69.16
7.0 97.25 73.28
8.0 98.18 78.02
9.0 98.18 86.27
10.0 96.45 96.89
11.0 92.46 96.89
12.0 83.37 90.25
Composition of the Extracted species: The
extraction isotherm method (Coleman et al., 1958)
and distribution ratio method (Hesford and Mckay,
1958) were employed to determine the
composition of the extracted species. In the
extraction isotherm method the limiting ratio of
the metal to TCAO was found unity under the
experimental conditions. Representative data from
hydrochloric acid solutions has been provided in
Table 1.
Effect of TCAO concentration: With all other
factors being kept constant, iron (III) was
extracted with 10 ml of TCAO with concentration,
varying from 1.0 X 10⁻² M to 4.85 X 10⁻² M. The
log-log plots of Kd Vs TCAO from both the acid
solutions gave straight lines of with unit slope in
hydrochloric acid (Fig.1) and two from sulphuric
acid media respectively.
Effect of diluent: Several solvents with varying
dielectric constants were tested as the diluents
(Table 2). Quantitative extractions were achieved
with benzene as diluent. More than 80% efficiency
was obtained with carbon tetrachloride, hexane,
toluene, cyclohexane and xylene. Nitrobenzene
and n-heptane were found to be poor in extraction.
Hence benzene was preferred as diluent
throughout the study.
Effect of various stripping agents: After
extraction, iron (III) was stripped with 20ml
reagents of various concentrations (0.1 – 1 .0 M)
of HCl, H2SO4, HNO3, ACOH, and NaOH
solutions. It was observed that 1.0 M NaOH alone
is a good stripping agent. However in no case the
acid strips out all the iron (III) in a single
extraction. 99.7% iron (III) could be recovered
from organic phase by making contact four times
with equal volumes of 1.0 M NaOH.
0.4 0.6 0.8 1.0 1.2 1.4 1.6 1.8 2.0
1.2
1.4
1.6
1.8
2.0
2.2
2.4
2.6
2.8
3.0
Fig.1. Extractant variation
Slope-1.0
[Fe(III)] = 1.2x10⁻³M
[HCl] = 8.5M
LogK
d
1+Log[TCAO]g/lt
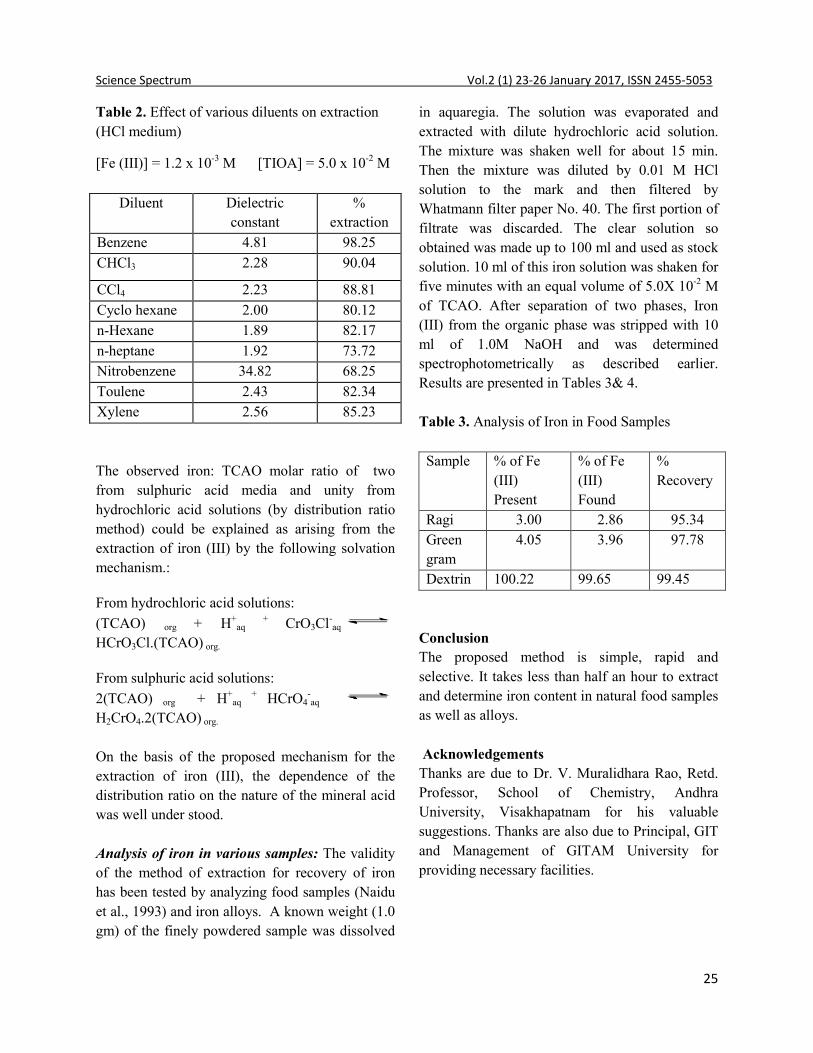
25
Science Spectrum Vol.2 (1) 23-26 January 2017, ISSN 2455-5053
Table 2. Effect of various diluents on extraction
(HCl medium)
[Fe (III)] = 1.2 x 10⁻³ M [TIOA] = 5.0 x 10⁻² M
Diluent Dielectric
constant
%
extraction
Benzene 4.81 98.25
CHCl3 2.28 90.04
CCl4 2.23 88.81
Cyclo hexane 2.00 80.12
n-Hexane 1.89 82.17
n-heptane 1.92 73.72
Nitrobenzene 34.82 68.25
Toulene 2.43 82.34
Xylene 2.56 85.23
The observed iron: TCAO molar ratio of two
from sulphuric acid media and unity from
hydrochloric acid solutions (by distribution ratio
method) could be explained as arising from the
extraction of iron (III) by the following solvation
mechanism.:
From hydrochloric acid solutions:
(TCAO) org + H+aq
+ CrO3Cl-aq
HCrO3Cl.(TCAO) org.
From sulphuric acid solutions:
2(TCAO) org + H+aq
+ HCrO4-aq
H2CrO4.2(TCAO) org.
On the basis of the proposed mechanism for the
extraction of iron (III), the dependence of the
distribution ratio on the nature of the mineral acid
was well under stood.
Analysis of iron in various samples: The validity
of the method of extraction for recovery of iron
has been tested by analyzing food samples (Naidu
et al., 1993) and iron alloys. A known weight (1.0
gm) of the finely powdered sample was dissolved
in aquaregia. The solution was evaporated and
extracted with dilute hydrochloric acid solution.
The mixture was shaken well for about 15 min.
Then the mixture was diluted by 0.01 M HCl
solution to the mark and then filtered by
Whatmann filter paper No. 40. The first portion of
filtrate was discarded. The clear solution so
obtained was made up to 100 ml and used as stock
solution. 10 ml of this iron solution was shaken for
five minutes with an equal volume of 5.0X 10⁻² M
of TCAO. After separation of two phases, Iron
(III) from the organic phase was stripped with 10
ml of 1.0M NaOH and was determined
spectrophotometrically as described earlier.
Results are presented in Tables 3& 4.
Table 3. Analysis of Iron in Food Samples
Sample % of Fe
(III)
Present
% of Fe
(III)
Found
%
Recovery
Ragi 3.00 2.86 95.34
Green
gram
4.05 3.96 97.78
Dextrin 100.22 99.65 99.45
Conclusion
The proposed method is simple, rapid and
selective. It takes less than half an hour to extract
and determine iron content in natural food samples
as well as alloys.
Acknowledgements
Thanks are due to Dr. V. Muralidhara Rao, Retd.
Professor, School of Chemistry, Andhra
University, Visakhapatnam for his valuable
suggestions. Thanks are also due to Principal, GIT
and Management of GITAM University for
providing necessary facilities.

26
Vol.2 (1) 23-26 January 2017, ISSN 2455-5053 Science Spectrum
Table 4. Determination of Iron in Alloys
Material Carbon Manganese Sulfur Phosphorus Silicon Iron Amount
of
Iron(III)
taken
(ppm)
Amount
of
Iron(III)
found
(ppm)
%
Recovery
Cast
Iron
3.430 0.880 0.041 ---- 2.120 91 -
91.2
91.1 90.7 99.56
Carbon
steel
0.007-
1.3
0.3-1.0 0.02-
0.06
0.002-0.1 0.005-
0.5
98.1-
99.5
99.2 98.8 99.30
Wrought
iron
0.05-
0.25
0.01-0.1 0.02-
0.1
0.05-0.2 0.02-
0.2
99-
99.8
99.5 99.6 99.59
References
1. A.I.Vogel, A.I (3rd Edn), A Text book of
quantitative Inorganic Analysis, Longman,
London, 1962.
2. B.Ghadamali , A.C.Mansour, B.Zeinab,
Eurasian J. Anal. Chem., 2009, 4(3), 285-293.
3. B.Gupta, A.Deep, V.Singh, S.N. Tandon ,
Hydrometallurgy, 2003 70, 121.
4. C.F. Coleman, K.B. Brown, J.G.Moore.,
K.A.Allen, Proc.2nd Intl. Conf., Peaceful Uses
of Atomic Energy, Geneva, 1958, C.10, 510.
5. E.Hesford, H.A.C Mckay, Trans Faraday Soc.,
1958, 54, 573.
6. F.J. Alguacil, S. Amer, Polyhedron, 1986,
6(11), 1755.
7. J.Kennedy , R.Perkins, J. Inorg .Nucl .Chem.,
1964 26, 1601.
8. K.K.Sahu, R.P. Das , Metlrgy. Met. Trans.B,
9. K.Staszak , R.Clerpiszewski, K. Prochaska,
Polish J. Chem. Tech.,2011, 1(1), 1-5.
10. K.V.S Murthy, T. Balaji, P Ramadevi and
G.R.K. Naidu, J. Ind. council chemists, chem.
abstr. 1994, 121, 220454h, 1993, 9,13.
11. M.S.Lee, K.J. Lee, Hydrometallurgy, 2005,
80, 163.
12. R.W.Cattrall, B.O. West, J. Inorg. Nucl.
Chem., 1966, 28, 3035.

27
Science Spectrum Vol.2 (1) 27-30 January 2017, ISSN 2455-5053
An Environmentally benign synthesis of N-alkyl-2-((benzimidazol-2-yl) thio)
acetonitrile
Sadhu Srinivas Rao* Department of Chemistry, Vidya Jyothi Institute of Technology (Autonomous), Himayatnagar (Vill.), C.B.Post,
Hyderabad, India – 500 075
*For Correspondence: [email protected]
Abstract
An environmentally benign synthesis of
N-substituted-2- ((benzimidazol-2-yl) thio)
acetonitrile (2) under different conditions has been
developed under green conditions. In this method,
2 - (( 1H-benzimidazol-2-yl) thio) acetonitrile (1)
was treated with an alkylating agent such as
DMS/DES/PhCH2Cl under green conditions i.e.,
by physical grinding in the presence of K2CO3 at
RT or by heating in PEG-600 as a green solvent at
100 0C or by irradiation with micro-waves at RT to
obtain N-alkyl-2- ((benzimidazol-2-yl) thio)
acetonitrile (2).
Key Words: 2-mercaptobenzimidazole, thiourea,
green synthesis, physical grinding.
Introduction
Benzimidazoles are very important class of
compounds due to their wide spectrum of
biological activity (Gravatt et al., 1994; Kim et al.,
1996). Benzimidazole derivatives play an
important role with diverse types of
pharmacological actions (Roth et al., 1997;
Hasegawa et al., 1975; Rovnyak et al., 1974; Bell
et al., 1976; Graber et al., 1987; Korotkikh et al.,
1995; Korotkikh et al., 1997). In continuation of
our earlier studies (Rao et al., 2013; Rao & Dubey
et al., 2016) on alkylation of 2-mercapto
benzimidazole, we now wish to report our studies
on alkylation of 2-((benzimidazol-2-yl) thio)
acetonitrile using Green methods.
Results and Discussion
Treatment of 2-mercaptobenzimidazole with
chloroacetonitrile in dimethylformamide
containing K2CO3 as base and tetra-n-butyl
ammonium bromide (TBAB) as phase transfer
catalyst for 3 h gave previously reported (S.S.Rao
et al., 2015) 1H-benzimidazol-2-ylsulfanyl)
acetonitrile (1). Reaction of 1, independently, with
each of dimethyl sulphate (DMS), diethyl sulphate
(DES) and benzyl chloride (PhCH2Cl) in the
presence of K2CO3 as a mild base, by a simple
physical grinding of the reaction mixture in a
mortar with a pestle under solvent-free conditions
for 10-15 min at RT, followed by processing, gave
respectively 1-methyl-2-chlorobenzimidazole (2a,
i.e., R=CH3) , 1-ethyl-2-chlorobenzimidazole (2b,
i.e., R=C2H5), 1-benzyl-2-chlorobenzimidazole
(2c, i.e., R=PhCH2), as the products identical with
the ones reported in the earlier methods10 in all
respects (m.p. m.m.p. and co-tlc analysis).
The reaction was also carried out in PEG-600 as a
solvent. Thus, heating a mixture of 1,
independently, with each of dimethylsulphate
(DMS), diethylsulphate (DES) and benzyl chloride
(PhCH2Cl) in PEG-600 at 100oC for 3hrs without
the use of any added base, followed by simple
processing, gave respectively 2a (i.e., 2, R=CH3),
2b (i.e., 2, R=CH2CH3) and 2c (i.e., 2, R=PhCH2)
identical with the same products obtained above. 2
could also be prepared by an alternative method.

28
Vol.2 (1) 27-30 January 2017, ISSN 2455-5053 Science Spectrum
Thus, 1 on treating, independently, with each of
dimethyl sulphate (DMS), diethyl sulphate (DES)
and benzyl chloride (PhCH2Cl) under microwave
irradiation conditions for 5 min and subsequent
processing, gave respectively 2a ( i.e., 2, R=CH3)
2b (i.e., 2, R=CH2CH3) , 2c ( i.e., 2, R=PhCH2)
identical with the products obtained earlier above.
Thus, the above four methods have different yields
with one suffering from relatively poor yields.
Among these, in solvent system ethanol giving
high yields where as PEG-600 giving lower yields.
Due to high molecular weight and viscous nature
of PEG-600 (135 cp at 250C) may lower reaction
rates, reduce product yields and cause the reaction
to be mass-transfer limited. Because of this, three
of the four methodologies result in the preparation
of the compounds giving high yields whereas
PEG-600 gives lower yields. Among these four
methodologies, the microwave irradiation is
superior than that of three methods because of
microwave dielectric heating is more energy
efficient than classical conductive heat transfer
methods.
Experimental Section
Preparation of 4 from 3:
Physical grinding method: A mixture of 1
(10mM), K2CO3 (20mM) and alkylating
agent(10mM) was ground together for about 10-15
min in a mortar with a pestle at RT to obtain a
homogeneous mixture.
The completion of the reaction was monitored by
TLC on prepared silica gel-G Plates using
authentic samples of the starting material and the
target compounds as references. The mixture was
then treated with ice-cold water (≈30-40ml). The
separated solid was filtered, washed with water
(2x10ml) and dried to obtain crude 2a-c. For
yields please see Table-1. Recrystallization of the
crude product from a suitable solvent gave pure
2a-c. IR, 1H-NMR and LC-MS spectra for the
compounds 2a-c were found to be in agreement
with the structures assigned to them.
In PEG-600: A mixture of 1 (10 mM), alkylating
agent (10mM) and PEG-600 (20 ml) was heated
on a steam-bath at 100oC for 3hrs. At the end of
this period, the mixture was cooled to RT and
poured into ice-cold water (≈50ml).The separated
solid was filtered, washed with water (2x10ml)
and dried. The crude products were recrystallized
from a suitable solvent to obtain pure 2a-c,
identical with the same products obtained above.
For yields please see Table-1.
Under microwave condition: A mixture of 1 (10
mM) and alkylating agent (10mM) was taken in a
10 mL CEM-reaction tube sealed by rubber
stopper and subjected to microwave irradiation for
2 min in the commercial micro-wave reactor.
After that, the tube was cooled and the completion
of reaction was checked by TLC. Then, the
reaction mixture was poured into ice-cold water
(50 mL). The separated solid was filtered, washed
with water (2x10ml) and dried. The crude products
were recrystallized from a suitable solvent to
obtain pure 3a-c, identical with the same products
obtained above. For yields, please see Table-1.
Conclusion
In conclusion, we have developed a green
methodology for the synthesis of N-substituted-2-
thiobenzimidazole under different conditions.
Acknowledgement
The author is highly indebted to UGC New Delhi
for sanctioned Minor Research Project and also
thankful to Principal, Vidya Jyothi Institute of
Technology, Hyderabad.

29
Science Spectrum Vol.2 (1) 27-30 January 2017, ISSN 2455-5053
SCHEME: 1
(2a, R = CH3; 2b, R = C2H5; 2c, R = CH2Ph)
Table.1. Preparation of 2a-c from 1 under different green conditions
M.P. of 2a: 108-111 0C (Lit. (10) m.p. 110-112 0C)
M.P. of 2b: 99-101 0C (Lit. (10) m.p. 98-100 0C)
M.P. of 2c: 85-88 0C (Lit. (10) m.p. 86-88 0C )
*Yield refers to isolated crude product only.
References:
1. D. R. Graber, R. A. Morge and Raenko,
Reaction of 2-(alkylsulfinyl)-, 2-
(arylsulfinyl)-, and (aralkylsulfinyl)
benzimidazoles with thiols: a convenient
synthesis of unsymmetrical disulfides,
Journal of Org. Chem, 1987, 52, 4620.
S.
No.
S
M
Reagent
Prod
uct
Physical grinding
Green solvent Microwave
irradiation
PEG-600
Time
(Min)
Tem
p
(0C)
Yield*
(%)
Time
(Min)
Tem
p
(0C)
Yield
*
(%)
Time
(Min)
Temp
(0C)
Yield
*
(%)
1.
1
DMS 2a 10-15 RT 89 180 100 69 2 RT /
450 W
87
DES 2b 10-15 RT 87 180 100 72 2 RT /
450 W
89
PhCH2Cl 2c 10-15 RT 85 180 100 63 2 RT /
450 W
83
30
Vol.2 (1) 27-30 January 2017, ISSN 2455-5053 Science Spectrum
2. G. Rovnyak, V. L. Narayana, R. D.
Haugwitz and C. M. Cimarusti, US Pat,
014, 1973, Chem. Abstr, 1974, 105596.
3. G.L. Gravatt, B.C. Baugley , W. R. Wilson
and W. A. Denny, DNA-Directed Alkylating
Agents, Synthesis and Antitumor Activity of
DNA Minor Groove-Targeted Aniline
Mustard Analogs of Pibenzimol (Hoechst
33258), J. Med. Chem., 1994, 37,4338.
4. H. Hasegawa, N. Tsuda and M. Hasoya,
Japanese Pat, 1974, 198; Chem Abstr, 1975,
156308.
5. J. S. Kim, B. Gatto and L. F. Liu,
Substituted 2,5‘-Bi-1H-benzimidazoles:
Topoisomerase I Inhibition and
Cytotoxicity, Eur J Med Chem, 1996, 39,
992.
6. N. I. Korotkikh, G. F. Raenko and O. P.
Shavaika, Reaction of some azoles
and azolinthiones with 2-chlorobenzoxazole,
Chem. Heterocycl. compd, 1995, 31, 359.
7. N. I. Korotkikh, A. F. Aslanov and G. F.
Raenko, Heterocyclizations of 2-
allylthiobenzimidazoles under the action
of bromine, Russ. J. Org. Chem, 1995, 31,
721; Chem. Abstr, 1997, 18833.
8. S. C. Bell and P. H. Wei, Syntheses of
heterocyclic fused thiazole acetic acids, J.
Med. Chem., 1976, 19, 524.
9. S. S. Rao, P. K. Dubey & Y. B. Kumari, A
green and simple synthesis of 2-mercapto
benzimidazoles , Indian J. Chem, 2013, 52B,
1210.
10. S. S. Rao, Ch. V. R. Reddy & P. K. Dubey,
Highly efficient tandem syntheses of
unsymmetrically substituted isomeric S, N–
disubstituted-2-mercaptobenzimidazoles,
Indian J. Chem, 2015, 54, 829-832.
11. S. S. Rao, Ch. V. R.Reddy & P. K. Dubey,
Synthesis of α-Benzylthiobenzimidazole
acetonitriles and Their Chemoselective
Reduction of the Double Bond with NaBH4,
J. Heterocyclic. Chem, 2016, 53 (74). DOI
10.1002/jhet.2282.
12. T. Roth, M. L. Morningstar, P. L. Boyer, S.
H. Hughes, R. W. Buckheit and C. J.
Michejda, Synthesis and Biological Activity
of Novel Nonnucleoside Inhibitors of HIV-1
Reverse Transcriptase. 2-Aryl-Substituted
Benzimidazoles, J. Med. Chem., 1997, 40,
4199.

31
Science Spectrum Vol.2 (1) 31-38 January 2017, ISSN 2455-5053
A New Validated RP-HPLC Method for the Quantification of Cabazitaxel -
An Anticancer Plant product
Mathrusri Annapurna Mukthinuthalapati* and Venkatesh Bukkapatnam Department of Pharmaceutical Analysis & Quality Assurance, GITAM Institute of Pharmacy, GITAM University,
Visakhapatnam, India
*For Correspondence: [email protected]
Abstract
Cabazitaxel, a semi-synthetic derivative of a
natural taxoid extracted from the yew tree needles.
Cabazitaxel is recommended for the treatment of
metastatic castration-resistant prostate cancer. A
new stability-indicating high performance liquid
chromatographic technique was developed for
Cabazitaxel in the presence of the degradation.
Chromatographic elution was performed on
Shimadzu Model CBM-20A/20 Alite, equipped
with Zorbax SB-C18 column (150 mm × 4.6 mm
i.d., 3.5 µm particle size) using mobile phase
consisting of sodium acetate buffer and methanol
(flow rate of 1.0 ml/min). Forced/Stress
degradation studies were performed with various
conditions (acidic, alkaline, oxidation, thermal and
photolytic degradations) and the method was
validated (ICH guidelines). The method follows
the Beer-Lambert’s law over a linearity range 0.1–
200 µg/ml with linear regression equation, y =
21316x - 3152 (r2 = 0.9999). It was observed that
Cabazitaxel is more sensitive towards basic
environment in comparison to other stress
conditions. The projected method is accurate,
precise and economical and it is practically useful
in quality control department for the analysis of
Cabazitaxel marketed formulations as well as
biological fluids.
Keywords: Cabazitaxel, Taxoid, Anti-cancer, RP-
HPLC, Stability-indicating, Validation.
Introduction
Cabazitaxel is a new generation taxane used for
the management of hormone-refractory prostate
cancer (Neil, 2006). It is a dimethyloxy derivative
of docetaxel. The methyl group moieties provide
Cabazitaxel an uncommon capability among
chemotherapy agents i.e. the capability to cross the
blood–brain barrier. It is effective against
docetaxel-refractory prostate cancer. Cabazitaxel
is used for the treatment of prostate cancer. The
anti-tumour activity was proven by blocking
tumour cell division (Jordan, 2004) and also
stabilizes the microtubules. In the US Cabazitaxel
has been accepted by the Food and Drug
Administration (Oudard, 2011) in June 2010 and
in Europe by the European Medicines Agency in
January 2011 for the patients with castration
resistant metastatic prostate cancer whose disease
progresses after docetaxel treatment (Assessment
Report, 2011) along with prednisone.
Current research is going on metastatic breast
cancer (Pivot, 2008) (Villanueva, 2011).
Cabazitaxel (Figure 1) is chemically known as
(2aR, 4S, 4aS, 6R, 9S, 11S, 12S, 12aR, 12bS)-
12b- acetoxy- 9-(((2R, 3S)- 3-((tert-
butoxycarbonyl) amino)- 2- hydroxy- 3- phenyl
propanoyl) oxy)- 11-hydroxy- 4, 6- dimethoxy- 4a,
8, 13, 13- tetramethyl- 5- oxo- 2a, 3, 4, 4a, 5, 6, 9,
10, 11, 12, 12a, 12b- dodecahydro- 1H- 7, 11-
methanocyclodeca benzo [1, 2-b] oxet-12-yl
benzoate (C45H57NO14) with molecular weight
835.93 g/mol. (Sanofi-Aventis, 2006), (Cheetham,
2013).

32
Vol.2 (1) 31-38 January 2017, ISSN 2455-5053 Science Spectrum
Fig.1. Structure of Cabazitaxel
The analytical methods so far developed are based
on LC-MS/MS (Kort, 2013), (Jagannath, 2012),
(Peter, 2012), spectrophotometry (Kishore, 2012)
and RP-HPLC (Mathrusri, 2013) (Mathrusri,
2014a) (Mathrusri, 2014b) techniques. A present
the authors have proposed a robust, and selective
(stability indicating RP-HPLC method for the
estimation of Cabazitaxel in presence of its
degradants.
Materials and Methods
Chemicals and reagents: Cabazitaxel was
obtained from Dr. Reddy’s Laboratories Ltd.,
(India) and all other chemicals used were of AR
grade. Methanol (HPLC grade), Glacial acetic acid
(HPLC grade), Hydrogen peroxide, Hydrochloric
acid, and Sodium hydroxide were purchased from
Merck (India) and used as received. Cabazitaxel is
available as infusion with brand name Jevtana®
(Sanofi-Aventis, Malaysia) with label claim of 60
mg of drug.
Instrumentation and Chromatographic
conditions: Shimadzu Model CBM-20A/20 Alite
HPLC system with PDA detector and Zorbax SB-
C18 column (150 mm × 4.6 mm i.d., 3.5 µm) was
used for chromatographic separation. Isocratic
mode of elution was selected with sodium acetate
buffer and methanol (20:80, v/v) mixture as
mobile phase at a flow rate of 1.0 ml/min. The
overall run time was 10 min (UV detection at 234
nm).
Preparation of stock solution: The stock solution
(1000 µg/ml) was prepared by transferring about
25 mg of Cabazitaxel in to a 25 ml volumetric
flask and dissolved in methanol. Working standard
solutions were prepared from stock on dilution as
per the requirement and filtered through 0.45 µm
membrane filter.
Preparation of sodium acetate buffer solution
(pH 4.0): The buffer solution (pH 4.0) was
prepared by thorough mixing of 28.6ml of glacial
acetic acid with 10 ml of 50% w/v NaOH in a
1000 ml volumetric flask with the help of HPLC
grade water.
Method Validation
The proposed method was validated according to
ICH prescribed validation parameters such as
linearity, precision, accuracy, limit of quantitation
(LOQ), limit of detection (LOD), selectivity and
robustness (ICH, 2005). Linearity was conducted
by using a series of solutions (0.1–200 µg/ml)
prepared from the stock solution by dilution and
introduced in to the HPLC system (n=3). The
average peak area of the chromatograms was
plotted against concentration to construct the
calibration curve. The limit of quantification and
limit of detection were also determined from the
calibration curve.
The intra-day and inter-day precision studies were
conducted (20, 50 and 100 µg/ml) and the %
relative standard deviation was calculated. The
accuracy study was performed by standard
addition and recovery experiments (80, 100 and
120%) and the percentage recoveries were
calculated. Robustness studies were performed by
incorporating small changes in the parameters
such as wavelength (232 and 236 nm),
composition of mobile phase (78 and 82%) and
flow rate (0.9 and 1.1 ml/min). Forced degradation
studies (ICH, 2003) were evaluated by refluxing
the drug solution (1 mg/ml) to different treatments
for 30 min at 80 ºC in a thermostat.
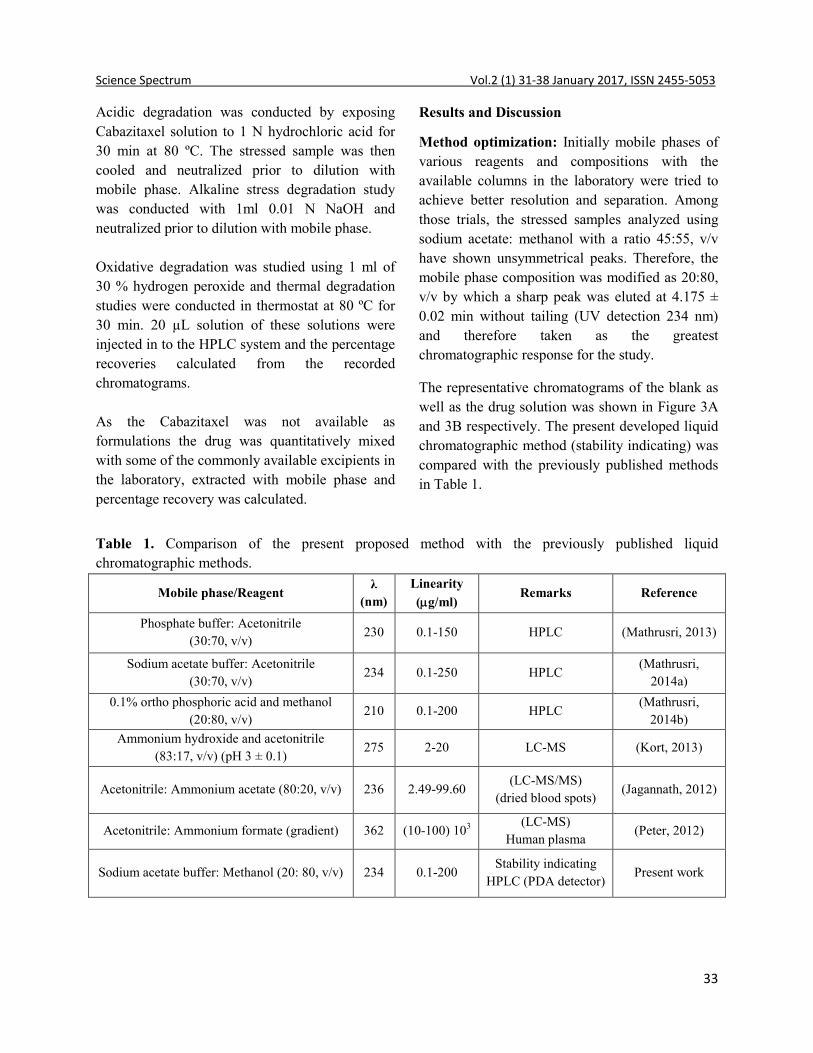
33
Science Spectrum Vol.2 (1) 31-38 January 2017, ISSN 2455-5053
Acidic degradation was conducted by exposing
Cabazitaxel solution to 1 N hydrochloric acid for
30 min at 80 ºC. The stressed sample was then
cooled and neutralized prior to dilution with
mobile phase. Alkaline stress degradation study
was conducted with 1ml 0.01 N NaOH and
neutralized prior to dilution with mobile phase.
Oxidative degradation was studied using 1 ml of
30 % hydrogen peroxide and thermal degradation
studies were conducted in thermostat at 80 ºC for
30 min. 20 µL solution of these solutions were
injected in to the HPLC system and the percentage
recoveries calculated from the recorded
chromatograms.
As the Cabazitaxel was not available as
formulations the drug was quantitatively mixed
with some of the commonly available excipients in
the laboratory, extracted with mobile phase and
percentage recovery was calculated.
Results and Discussion
Method optimization: Initially mobile phases of
various reagents and compositions with the
available columns in the laboratory were tried to
achieve better resolution and separation. Among
those trials, the stressed samples analyzed using
sodium acetate: methanol with a ratio 45:55, v/v
have shown unsymmetrical peaks. Therefore, the
mobile phase composition was modified as 20:80,
v/v by which a sharp peak was eluted at 4.175 ±
0.02 min without tailing (UV detection 234 nm)
and therefore taken as the greatest
chromatographic response for the study.
The representative chromatograms of the blank as
well as the drug solution was shown in Figure 3A
and 3B respectively. The present developed liquid
chromatographic method (stability indicating) was
compared with the previously published methods
in Table 1.
Table 1. Comparison of the present proposed method with the previously published liquid
chromatographic methods.
Mobile phase/Reagent λ
(nm)
Linearity
(g/ml) Remarks Reference
Phosphate buffer: Acetonitrile
(30:70, v/v) 230 0.1-150 HPLC (Mathrusri, 2013)
Sodium acetate buffer: Acetonitrile
(30:70, v/v) 234 0.1-250 HPLC
(Mathrusri,
2014a)
0.1% ortho phosphoric acid and methanol
(20:80, v/v) 210 0.1-200 HPLC
(Mathrusri,
2014b)
Ammonium hydroxide and acetonitrile
(83:17, v/v) (pH 3 ± 0.1) 275 2-20 LC-MS (Kort, 2013)
Acetonitrile: Ammonium acetate (80:20, v/v) 236 2.49-99.60 (LC-MS/MS)
(dried blood spots) (Jagannath, 2012)
Acetonitrile: Ammonium formate (gradient) 362 (10-100) 103 (LC-MS)
Human plasma (Peter, 2012)
Sodium acetate buffer: Methanol (20: 80, v/v) 234 0.1-200 Stability indicating
HPLC (PDA detector) Present work

34
Vol.2 (1) 31-38 January 2017, ISSN 2455-5053 Science Spectrum
Method Validation: Cabazitaxel has shown
linearity over a concentration range of 0.1–200
μg/ml (Table 2) (% RSD 0.11-0.54) with linear
regression equation y = 21316x - 3152
(r2 = 0.9999) (Figure 2). The LOQ was found to
be 0.0967 μg/ml and the LOD was found to be
0.0319 μg/ml.
Table 2. Linearity of Cabazitaxel
Conc. (g/ml) *Mean peak area ± SD * RSD (%)
0.1 1942 ± 8.74 0.35
0.5 9968 ± 44.86 0.45
1 20354 ± 50.89 0.25
5 104251 ± 229.35 0.22
10 214033 ± 813.33 0.38
20 415242 ± 415.24 0.10
50 1064255 ± 4789.15 0.55
100 2100511 ± 6091.48 0.29
150 3212545 ± 20881.54 0.65
200 4260567 ± 15764.10 0.37
*Mean of three replicates
Fig. 2. Calibration curve of Cabazitaxel
For the precision studies the % RSD range was
found to be 0.19-0.25 (Intra-day) and 0.15-0.20
(Inter-day) which was within the limit (<2%)
whereas in accuracy studies the % RSD was 0.26-
0.49 with a recovery of 99.35-99.51%. Table 3
indicates the results representing that the method
is precise and accurate. The results obtained in the
robustness study were shown in Table 4 in which
the % RSD was found to be less than 2.0% (0.22-
1.34) indicating that the method is robust.
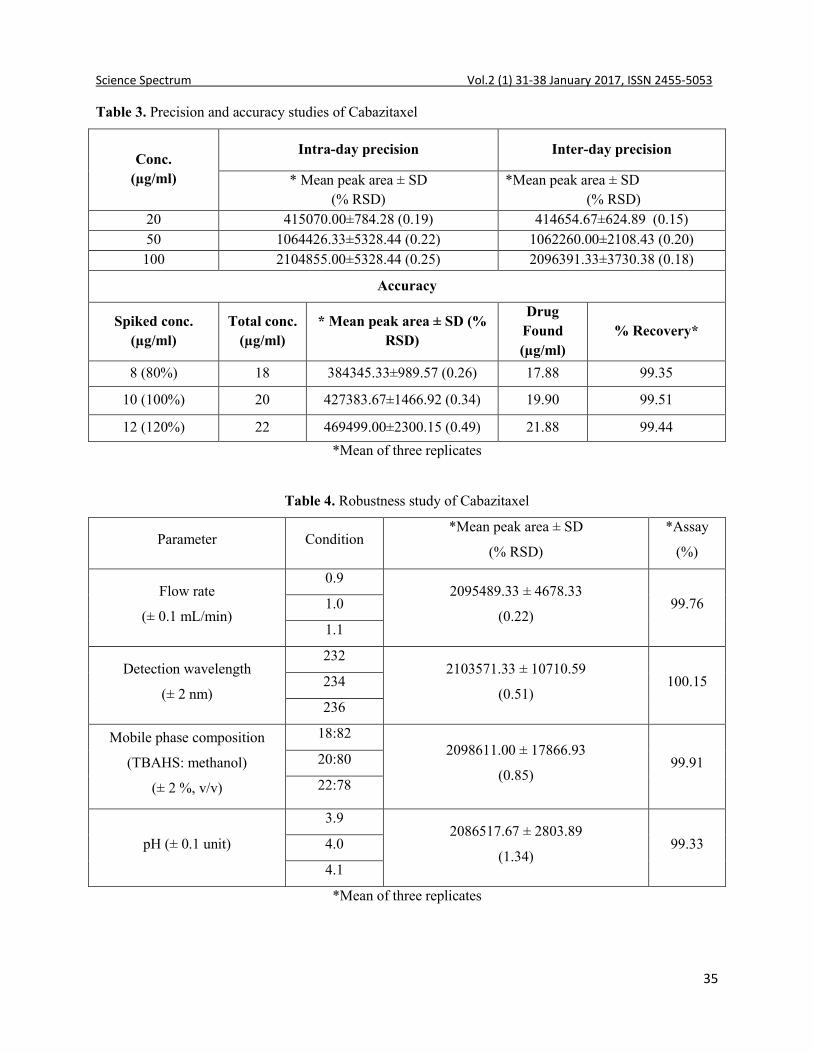
35
Science Spectrum Vol.2 (1) 31-38 January 2017, ISSN 2455-5053
Table 3. Precision and accuracy studies of Cabazitaxel
Conc.
(µg/ml)
Intra-day precision Inter-day precision
* Mean peak area ± SD
(% RSD)
*Mean peak area ± SD
(% RSD)
20 415070.00±784.28 (0.19) 414654.67±624.89 (0.15)
50 1064426.33±5328.44 (0.22) 1062260.00±2108.43 (0.20)
100 2104855.00±5328.44 (0.25) 2096391.33±3730.38 (0.18)
Accuracy
Spiked conc.
(µg/ml)
Total conc.
(µg/ml)
* Mean peak area ± SD (%
RSD)
Drug
Found
(µg/ml)
% Recovery*
8 (80%) 18 384345.33±989.57 (0.26) 17.88 99.35
10 (100%) 20 427383.67±1466.92 (0.34) 19.90 99.51
12 (120%) 22 469499.00±2300.15 (0.49) 21.88 99.44
*Mean of three replicates
Table 4. Robustness study of Cabazitaxel
Parameter Condition *Mean peak area ± SD
(% RSD)
*Assay
(%)
Flow rate
(± 0.1 mL/min)
0.9 2095489.33 ± 4678.33
(0.22) 99.76 1.0
1.1
Detection wavelength
(± 2 nm)
232 2103571.33 ± 10710.59
(0.51) 100.15 234
236
Mobile phase composition
(TBAHS: methanol)
(± 2 %, v/v)
18:82 2098611.00 ± 17866.93
(0.85) 99.91 20:80
22:78
pH (± 0.1 unit)
3.9 2086517.67 ± 2803.89
(1.34) 99.33 4.0
4.1
*Mean of three replicates

36
Vol.2 (1) 31-38 January 2017, ISSN 2455
Forced degradation studies:
indicating capability of the method was
established from the separation of Cabazitaxel
peak from the degraded samples to judge the
specificity of the developed method. The typical
chromatograms obtained for the for
degradation studies were shown in Figure 3C
Cabazitaxel during basic stress indicating has
undergone 9.60 % degradation with degradant at
2.306 min and 2.569 min showing that the drug is
sensitive towards basic environment. In the drug
structure the amino group may be responsible for
this degradation. Cabazitaxel solution was seen
decomposing on exposure to acidic (0.99 %),
alkaline (9.60 %), oxidative (0.41 %) thermal
(0.77 %) and photolytic (0.31 %) conditions
Table 5. Forced degradation studies of Cabazitaxel
Stress Condition *Drug recovered
(%)
Standard (Untreated)
100
Acidic degradation
99.01
Alkaline degradation
90.40
Oxidative degradation 99.59
Thermal degradation 99.23
Photolytic degradation 99.69
*Mean of three replicates
Fig. 3. Typical chromatograms of blank [A], Cabazitaxel (100 μg/ml) oxidative [E],
January 2017, ISSN 2455-5053
Forced degradation studies: The stability
indicating capability of the method was
established from the separation of Cabazitaxel
peak from the degraded samples to judge the
specificity of the developed method. The typical
chromatograms obtained for the forced
degradation studies were shown in Figure 3C-3G.
Cabazitaxel during basic stress indicating has
undergone 9.60 % degradation with degradant at
2.306 min and 2.569 min showing that the drug is
sensitive towards basic environment. In the drug
e amino group may be responsible for
this degradation. Cabazitaxel solution was seen
decomposing on exposure to acidic (0.99 %),
alkaline (9.60 %), oxidative (0.41 %) thermal
(0.77 %) and photolytic (0.31 %) conditions
(Table 5). From these studiesl it is
drug is much sensitive towards alkaline
conditions. The system suitability parameters for
the Cabazitaxel peak shows that the theoretical
plates were more than 2000 and the tailing factor
was less than 2 (or <1.5-2.0) (Table 5).The 3D
chromatograms obtained during the forced
degradation studies were shown in Figure 4.
The present proposed stability-
quantification of Cabazitaxel is specific because
the drug peak was well separated even in presence
of degradation products. The proposed method
was applied to the laboratory prepared formulation
and the percentage recovery was calculated as
99.52.
degradation studies of Cabazitaxel
*Drug recovered *Drug decomposed
(%)
Theoretical
Plates
100 - 2854.152
99.01 0.99 2732.556
90.40 9.60 2810.816
99.59 0.41 2719.496
99.23 0.77 2818.388
99.69 0.31 2861.906
Typical chromatograms of blank [A], Cabazitaxel (100 μg/ml) [B], acidic [C], alkaline [D],
oxidative [E], thermal [F] and photolytic [G] degradations
Science Spectrum
it is concluded that
is much sensitive towards alkaline
The system suitability parameters for
the Cabazitaxel peak shows that the theoretical
plates were more than 2000 and the tailing factor
2.0) (Table 5).The 3D
tograms obtained during the forced
degradation studies were shown in Figure 4.
-indicating for the
is specific because
the drug peak was well separated even in presence
The proposed method
was applied to the laboratory prepared formulation
and the percentage recovery was calculated as
Tailing factor
1.056
1.039
1.046
1.046
1.046
1.050
acidic [C], alkaline [D],
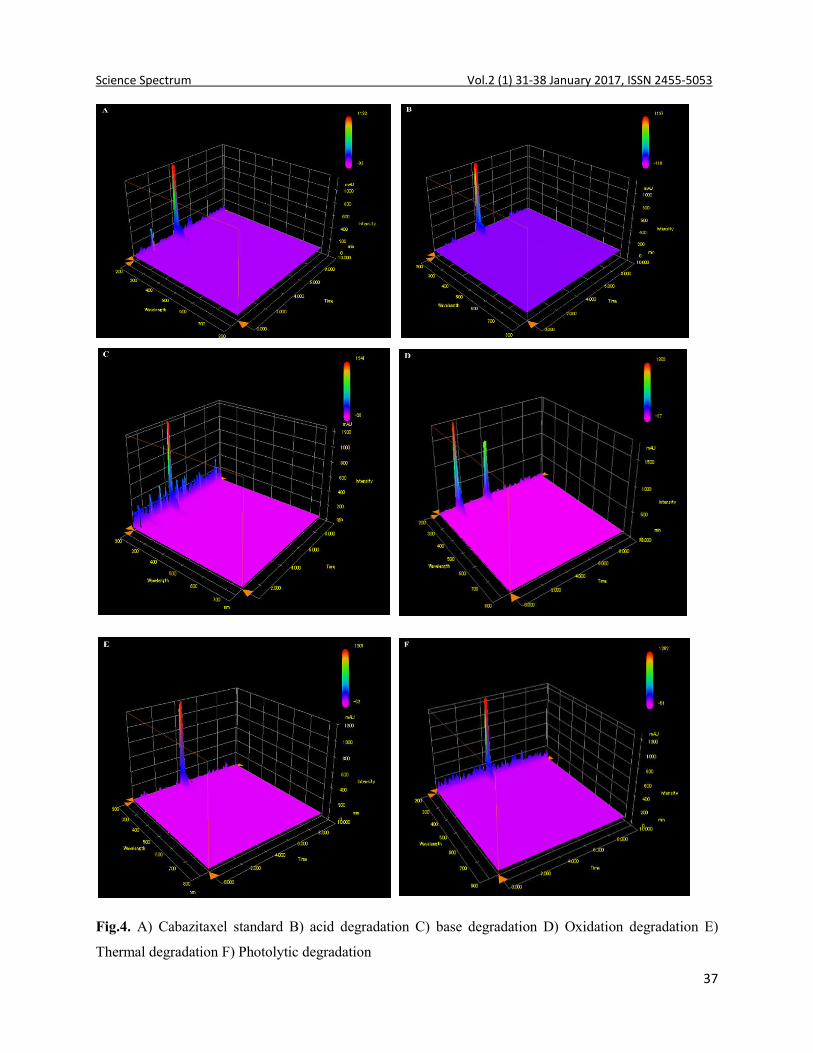
37
Science Spectrum Vol.2 (1) 31-38 January 2017, ISSN 2455-5053
Fig.4. A) Cabazitaxel standard B) acid degradation C) base degradation D) Oxidation degradation E)
Thermal degradation F) Photolytic degradation
38
Vol.2 (1) 31-38 January 2017, ISSN 2455-5053 Science Spectrum
Conclusion The developed stability-indicating liquid chromatographic method was validated as per ICH guidelines and can be applied for the pharmaceutical dosage forms and also for the accelerated stability studies as well as for the determination of drug in biological fluids. Acknowledgements The authors are grateful to University Grants Commission, New Delhi, India for their financial support and M/s GITAM University, Visakhapatnam for providing the research facilities. The authors have no conflict of interest. References 1. "Jevtana (Cabazitaxel) Injection approved by
U.S. FDA after priority review" (Press release), Sanofi-Aventis, 2010-06-17. Retrieved June 17, 2010.
2. A. Kort., M.J.X. Hillebrand, G. A. Cirkel, E. E. Voest, A. H. Schinkel, H. Rosing, J. H. M. Schellens, J.H. Beijnen, J.Chromatogr. B. 2013, 925, 117-123.
3. Assessment Report for Jevtana (Cabazitaxel), Procedure No.: EMEA/H/C/002018, European Medicines Agency, London, 2011.
4. C. Villanueva, A. Awada, M. Campone, J. P. Machiels, T. Besse, E. Magherini, F. Dubin, D. Semiond, X. Pivot, European Journal of Cancer 2011, 47, 1037-1045.
5. G. Kishore, Int. J. Res. Rev. Pharm. Appl. Sci. 2012, 2, 950-958.
6. ICH stability testing of new drug substances and products Q1A (R2), International Conference on Harmonization, 2003.
7. ICH validation of analytical procedures: text
and methodology Q2 (R1), International Conference on Harmonization, 2005.
8. M. A. Jordan, L. Wilson, Nat Rev Cancer 2004, 4, 253–265.
9. M. J. O’Neil, (Ed.) The Merck Index, Merck Research Laboratories, Whitehouse Station, NJ, 2006.
10. M. Mathrusri Annapurna, B. Venkatesh, G. Naga Supriya, J. Bioeq. Bioavai 2014, 6, 134-138.
11. M.Mathrusri Annapurna, B. Venkatesh, K. Pramadvara, S. Hemchand, Chem. Sci. Trans. 2014, 3, 854-860.
12. M. Mathrusri Annapurna, K. Pramadvara, B. Venkatesh, G. Sowjanya, Indo American J. Pharm. Res. 2013, 3, 9262-9269.
13. P. Cheetham, and D.P. Petrylak, Cancer Journal 2013, 19, 59-65.
14. Peter de Bruijn, Anne-Joy M de Graan, Annemieke Nieuweboer, Ron HJ Mathijssen, Mei-Ho Lam, Ronald de Wit, Erik, AC Wiemer, Walter J Loos, J. Pharm. Biomed. Analy. 2012, 59, 117–122.
15. S. Oudard, Future Oncology 2011, 7, 497-506.
16. V Jagannath Patro, R. Nageshwara Rao, N. K. Tripathy, Open Access Scientific Reports 2012, 1, 1-4.
17. X. Pivot, P. Koralewski, J. L. Hidalgo, A. Chan, A. Goncalves, G. Schwartsmann, S. Assadourian, J. P. Lotz, Annals of Oncology, 2008, 19, 1547-1552.
39
Science Spectrum Vol.2 (1) 39-42 January 2017, ISSN 2455-5053
Cloud Data Security using hybrid RSA and Cuckoo Search Algorithm
A. Arjuna Rao, K. Sujatha*, P. Praveen Kumar and V. Sravani I K C
Department of CSE, Miracle Educational Society Group of Institutions, Bhogapuram, Vizianagram, India
*For Correspondence: [email protected]
Abstract
Cloud provides the means to instantly use new
services and expand the infrastructure. However
lack of physical control, bring a whole host of
Cloud Security Issues and arises problems like
data deletion, leakage etc. Encryption of data
stored in cloud allows solving these issues. RSA
Algorithm is public key encryption algorithm
proposed by Rivest-Shamir-Adleman. This has
been used for years due to its simplicity and
security. Hybrid RSA and Cuckoo Search
Algorithm is proposed here to enhance the security
of RSA algorithm. Cuckoo Search Algorithm is
the optimization algorithm that is used to select the
random values used in RSA algorithm. This is
based on biological facts where Cuckoo Birds
selects the nests of other birds to lay the eggs.
Cloud Data Security is provided by using this
hybrid algorithm. This algorithm provides
enhanced security and effectively uses the
algorithm. Test Results are simulated which
proves that the proposed algorithm provides
reliable confidentiality.
Keywords: Cloud Security Issues, Authentication,
data deletion, leakage, Encryption, RSA
Algorithm, Rivest-Shamir-Adleman, Hybrid RSA
and Cuckoo Search Algorithm, Cloud Data
Security.
Introduction
Cloud computing security refers to the set of
procedures, processes and standards designed to
provide information security assurance in a cloud
computing environment. Cloud computing
security addresses both physical and logical
security issues across all the different service
models of software, platform and infrastructure.
This also addresses how these services are
delivered. Cloud security encompasses a broad
range of security constraints from an end-user and
cloud provider's perspective, where the end-user
will primarily will be concerned with the
provider's security policy, how and where their
data is stored and who has access to that data. For
a cloud provider, on the other hand, cloud
computer security issues can range from the
physical security of the infrastructure and the
access control mechanism of cloud assets, to the
execution and maintenance of security policy.
Cloud security is important because it is probably
the biggest reason why organizations fear the
cloud. Cloud Encryption can be used within the
AppProtex Cloud Security Gateway which acts to
protect data – both at rest and in the cloud – from
unauthorized access. One can learn more
about cloud data encryption(Samiksha et.al.,
2011).
Cloud knowledge Security may be achieved
through watching and reportage on cloud use via
management console that permits users to outline
and maintain knowledge discovery, analysis and
protection policies. The Cloud Security Alliance
(CSA), a noncommercial organization of trade
specialists, has developed a pool of pointers and
frameworks for implementing and imposing
security among a cloud in operation surroundings.

40
Vol.2 (1) 39-42 January 2017, ISSN 2455-5053 Science Spectrum
RSA serves as solution to these problems (Yang
et.al., 2009).
Problems identified in Cloud Storage
Data can be stolen
Information is misused
Unauthorised access
Modification of content
Secured data is attacked
Cloud Data Storage using Hybrid RSA and CS
Algorithm
Security can be provided to the data stored in
Cloud by using Hybrid RSA and CS Algorithm.
This maintains the confidentiality and integrity in
data that is stored in cloud. Unauthorized users
cannot access the contents that are placed in cloud.
The data stored cannot be altered or modified as
this is not understood by them.
Cuckoo Search Algorithm: Cuckoo search (CS)
is associate degree optimisation algorithmic rule
developed by Xin-she principle and Suash woman
in 2009. It had been galvanized by the obligate
brood mutuality of some cuckoo species by
parturition their eggs within the nests of different
host birds (of different species). Some host birds
will have interaction direct conflict with the
intrusive cuckoos. As an example, if a bird
discovers the eggs don't seem to be here own, it'll
either throw these alien eggs away or just abandon
its nest and build a brand new nest elsewhere.
Some cuckoo species like the New World brood-
parasitic Tapera have evolved in such some way
that feminine parasitic cuckoos square measure
typically terribly specialised within the mimicry in
colours and pattern of the eggs of many chosen
host species (Samiksha et.al., 2011).
Cuckoo search perfect such breeding behavior,
and therefore is applied for varied optimisation
issues. It looks that it will surmount different
metaheuristic algorithms in applications. Cuckoo
search (CS) uses the subsequent representations.
Each egg during a nest represents an answer, and a
cuckoo egg represents a brand new resolution. The
aim is to use the new and doubtless higher
resolutions (cuckoos) to exchange a not-so-good
solution within the nests. Within the simplest type,
every nest has one egg. The algorithmic rule is
extended to additional difficult cases during which
every nest has multiple eggs representing a group
of solutions (Yang et.al., 2009).CS is predicated on
3 idealized rules:
1. Every cuckoo lays one egg at a time, and
dumps its egg in an exceedingly arbitrarily
chosen nest;
2. The simplest nests with prime quality of
eggs can carry over to ensuing generation;
3. The quantity of accessible hosts nests is
fastened, and also the egg set by a cuckoo is
discovered by the host bird with a likelihood
electronic device in (0,1). Discovering treat
some set of worst nests, and discovered
solutions drop from farther calculations.
Modified RSA: RSA technique is one of the most
popular public-key techniques and is predicted on
the problem of factoring large numbers. RSA is a
cryptosystem that supports public-key encryption.
This is widely used for securing sensitive data
particularly when being sent over an insecure
network such as the Internet (Zhang et al., 2011).
The public and therefore the private key-generation
algorithmic design is that the most advanced a part
of RSA cryptography and requires choosing
optimal parameter. Two massive prime numbers, p
and q, area unit generated exploitation the Rabin-
Miller property take a look at algorithmic program.
A modulus n is calculated by multiplying p and
alphabetic character (Chhabra et.al, 2011). This
range is employed by each the general public and
personal keys and provides the link between them.
Its length, typically expressed in bits, is named the
key length. the general public key consists of the
modulus n, and a public exponent, e, that is
ordinarily set at 65537, as it is a prime that's not
large. The e figure ought not to be a on the Q.T.

41
Science Spectrum Vol.2 (1) 39-42 January 2017, ISSN 2455-5053
designated prime because the public secret's shared
with everybody. The personal key consists of the
modulus n and therefore the personal exponent d,
that is calculated exploitation the Extended
geometer algorithmic program to search out the
opposite with relevance the totient of n(Taher,
1985).
The changed RSA algorithmic program with
cuckoo search is as follows.
1. First, a few of enormous primes p and letter
of the alphabet square measure elite by
victimization cuckoo search algorithmic
program.
2. victimization p and letter of the alphabet, n
and Ø square measure calculated.
n= p * q
Ø = (p-1)*(q-1)
3. Exponent e is chosen basing on n and
personal exponent d from e, p and q. Here,
(n, e) is treated because the public key and
(n, d) because the non-public key.
4. The RSA encoding shown in equation (7) is
that the mathematical operation to the eth
power modulo n
C = Me mod n - (7)
5. The decoding shown in equation (8) is
performed as mathematical operation to the
dth power modulo n
M = Cd mod n - (8)
Encryption of knowledge that's hold on in cloud is
handled by MRSA that is encrypted by
victimization the general public key and may be
decrypted solely by the user UN agency possesses
the non-public key. therefore any user UN agency
has the shared public key of given user will
encode the info however solely the desired user
will decode.
Result
RSA implements construct of public-key
cryptography. This could produce smaller, quicker
and a lot of economical scientific discipline keys.
RSA authors specify that the cryptography time
per block will increase no quicker than the cube of
the quantity of digits in n. The secured algorithmic
rule is developed and tested victimization
numerous sample sets of information and is found
secure. Then this is often tested on cloud
application to supply unified security to cloud. The
RSA and Modified RSA(MRSA) are compared
and shown in table 1.
Table 1. Accuracy Percentage comparing RSA
and MRSA
Sample Set RSA(%) MRSA(%)
Set 1 82 98
Set 2 88 97
Set 3 85 100
Set 4 88 98
Set 5 90 97
Set 6 84 99
From table 1 it can be analysed that MRSA is
more accurate compared to RSA as this generates
results accurately. The encryption and decryption
values are considered from each sample set to find
the accuracy count. Hence MRSA is preferable
technique for performing encryption.
Conclusion
The issue of security was handled by enforcing
encryption to cloud data security. All the issues in
manual system are solved by using this automated
encryption system. This can be used in any
system that requires identifying the user securely
and with reliability. Security is never limited to an
application and hence this algorithm can be used
in many related problems which are having such
issues. Cloud is becoming popular along with
Internet of things and people worldwide started
using cloud to store their images, photographs and
data. Hence Security is always a issue in cloud.
This is resolved by using Modified RSA that
provides both authentication and privacy. This is
basically popular public key cryptographic
algorithm with optimally choosing parameters by
using Cuckoo Search. The future scope includes
42
Vol.2 (1) 39-42 January 2017, ISSN 2455-5053 Science Spectrum
applying other optimization algorithms to choose
the parameters of RSA and compare them to
identify the best technique.
References
1. A.Chhabra, S.Mathur, Modified RSA
Algorithm: A Secure Approach,
Computational Intelligence and
Communication Networks (CICN), IEEE,
2011 International Conference, 7-9 Oct.
2011, 545 – 548.
2. Sameera Abdulrahman Almulla and Chan
Yeob Yeun, Cloud computing security
management, Engineering Systems
Management and Its Applications
(ICESMA), 2010 Second International
Conference, 2010, 1-7.
3. Samiksha Goel, Arpita Sharma, Punam
Bedi, Cuckoo Search Clustering Algorithm:
A novel strategy of biomimicry, Information
and Communication Technologies (WICT),
2011 World Congress, 2011, 916 – 921.
4. Taher El Gamal, A public key cryptosystem
and a signature scheme based on discrete
logarithms, in Proceedings of CRYPTO 84
on Advances in cryptology, Springer-Verlag
New York, Inc., 1985, 10–18.
5. Xin Zhou and Xiaofei Tang, Research and
implementation of RSA algorithm for
encryption and decryption, Strategic
Technology (IFOST), 2011, 6th
International Forum, Aug. 2011, Vol 2, 1118
– 1121, IEEE.
6. Xin-She Yang, Suash Deb, Cuckoo Search
via Lévy flights, Nature & Biologically
Inspired Computing, 2009, NaBIC 2009,
World Congress, 2009, 210 – 214.
7. Zhang Qing, Hu Zhihua, The Large Prime
Numbers Generation of RSA Algorithm
Based on Genetic Algorithm, Intelligence
Science and Information Engineering (ISIE),
2011 International Conference on 20-21,
Aug. 2011, 434 – 437.
43
Science Spectrum Vol.2 (1) 43-48 January 2017, ISSN 2455-5053
Structural and Dielectric Properties of Sm3+ Doped SrTiO3 Ceramic Powders
J.Guravamma, C.Sai Vandana and B.H.Rudramadevi*
Department of Physics, Sri Venkateswara University, Tirupati-517 502 *For Correspondence: [email protected]
Abstract
The structural and dielectric properties of SrTiO3
and Sm3+:SrTiO3 ceramic powders were prepared
by using conventional solid-state reaction method.
The samples were characterized by using the
XRD, FTIR, and SEM with EDS for structural,
functional groups, morphological and elemental
analysis respectively. For Sm3+:SrTiO3 ceramic
powders, the dielectric properties such as
dielectric constant (εr), dielectric loss (tan δ) as
well as ac conductivity in the frequency range
(100Hz – 1MHz) were studied for their use of
technological applications such as capacitors,
transducers, actuators, and nonvolatile random
access memory devices etc.
Keywords: SrTiO3, XRD, FTIR, SEM &
Dielectric measurements
Introduction
Ceramic compounds exhibiting the high dielectric
constant are of enormous importance to the
electronic industry due to their wide range of
applications such as capacitors, sensors, actuators,
power transmission devices, memory devices and
high energy storage devices (Saifi and Cross,
1970; Sakudo and Unoki, 1971; Ueno et al., 2008;
Roth, 1957; Song et al., 1996). Most of the high
dielectric constant materials contain the lead
which causes environmentally pollution and are
harmful to human beings due to the toxicity of
lead oxide. Therefore compulsory to search
alternative lead free compounds for such
applications which should take the comparable and
superior dielectric properties of SrTiO 3 is one of
the ferroelectric materials having ABO3 type
perovskite structure (Dietz et al., 1995;
Schumacher et al., 1995). TiO2 posses the good
mechanical resistance and stability and therefore it
is widely used for development of the stable host
matrices like as SrTiO3, BaTiO3 CaTiO3. Solid
solutions of SrTiO3 recently studied for
microwave devices and gas sensors. Among all the
lanthanide ions, the samarium (Sm3+) ion has been
known as the most efficient and could be
converting in to ultraviolet light to visible light
emissions (Longo et al., 2008; Tagantsev et al.,
2003; Kanemitsu and Yamada, 2011), because the
doping of rare earth ion. Samarium (Sm3+) ion has
been known as the most efficient down–converting
material and it could convert the ultraviolet light to
visible emissions which can be reabsorbed by dyes
in Dye-Sensitized Solar Cells (Kan et al., 2005;
Takashima et al., 2009).In this paper we
demonstrated a systematic study of structural and
dielectric properties of samarium doped strontium
titanate ceramic powders. Samarium ions doped
normally occupy the Sr+2 sites in a perovskite
structure. The Sm3+ doped SrTiO3 ceramics for the
applications of capacitors are used in high voltage
conditions. For these high voltage applications we
need a high storage dielectric ceramics. For this
purpose samarium doped strontium titanate can be
used in energy storage applications.
Experimental Procedure
Materials: Sm2O3 (99.9% purity), SrCO3 and TiO2
(Annular grade) were used as the raw chemicals to
prepare the SrTiO3 and (0.2 mol %) Sm3+:SrTiO3
ceramic powders by a solid state reaction method.
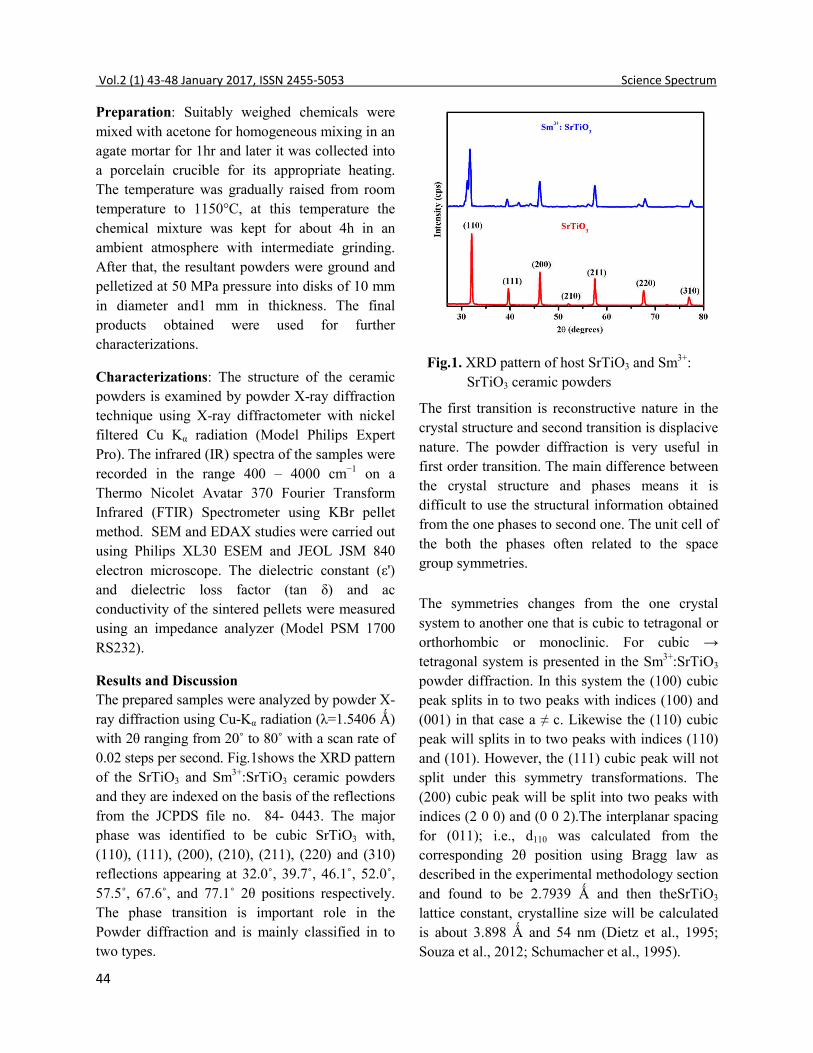
44
Vol.2 (1) 43-48 January 2017, ISSN 2455-5053 Science Spectrum
Preparation: Suitably weighed chemicals were
mixed with acetone for homogeneous mixing in an
agate mortar for 1hr and later it was collected into
a porcelain crucible for its appropriate heating.
The temperature was gradually raised from room
temperature to 1150°C, at this temperature the
chemical mixture was kept for about 4h in an
ambient atmosphere with intermediate grinding.
After that, the resultant powders were ground and
pelletized at 50 MPa pressure into disks of 10 mm
in diameter and1 mm in thickness. The final
products obtained were used for further
characterizations.
Characterizations: The structure of the ceramic
powders is examined by powder X-ray diffraction
technique using X-ray diffractometer with nickel
filtered Cu Kα radiation (Model Philips Expert
Pro). The infrared (IR) spectra of the samples were
recorded in the range 400 – 4000 cm−1 on a
Thermo Nicolet Avatar 370 Fourier Transform
Infrared (FTIR) Spectrometer using KBr pellet
method. SEM and EDAX studies were carried out
using Philips XL30 ESEM and JEOL JSM 840
electron microscope. The dielectric constant (ε')
and dielectric loss factor (tan δ) and ac
conductivity of the sintered pellets were measured
using an impedance analyzer (Model PSM 1700
RS232).
Results and Discussion
The prepared samples were analyzed by powder X-
ray diffraction using Cu-Kα radiation (λ=1.5406 Ǻ)
with 2θ ranging from 20˚ to 80˚ with a scan rate of
0.02 steps per second. Fig.1shows the XRD pattern
of the SrTiO3 and Sm3+:SrTiO3 ceramic powders
and they are indexed on the basis of the reflections
from the JCPDS file no. 84- 0443. The major
phase was identified to be cubic SrTiO3 with,
(110), (111), (200), (210), (211), (220) and (310)
reflections appearing at 32.0˚, 39.7˚, 46.1˚, 52.0˚,
57.5˚, 67.6˚, and 77.1˚ 2θ positions respectively.
The phase transition is important role in the
Powder diffraction and is mainly classified in to
two types.
Fig.1. XRD pattern of host SrTiO3 and Sm3+:
SrTiO3 ceramic powders
The first transition is reconstructive nature in the
crystal structure and second transition is displacive
nature. The powder diffraction is very useful in
first order transition. The main difference between
the crystal structure and phases means it is
difficult to use the structural information obtained
from the one phases to second one. The unit cell of
the both the phases often related to the space
group symmetries.
The symmetries changes from the one crystal
system to another one that is cubic to tetragonal or
orthorhombic or monoclinic. For cubic →
tetragonal system is presented in the Sm3+:SrTiO3
powder diffraction. In this system the (100) cubic
peak splits in to two peaks with indices (100) and
(001) in that case a ≠ c. Likewise the (110) cubic
peak will splits in to two peaks with indices (110)
and (101). However, the (111) cubic peak will not
split under this symmetry transformations. The
(200) cubic peak will be split into two peaks with
indices (2 0 0) and (0 0 2).The interplanar spacing
for (011); i.e., d110 was calculated from the
corresponding 2θ position using Bragg law as
described in the experimental methodology section
and found to be 2.7939 Ǻ and then theSrTiO3
lattice constant, crystalline size will be calculated
is about 3.898 Ǻ and 54 nm (Dietz et al., 1995;
Souza et al., 2012; Schumacher et al., 1995).

45
Science Spectrum Vol.2 (1) 43-48 January 2017, ISSN 2455-5053
Fig.2. FTIR spectrum of prepared SrTiO3 ceramic
powder
The Fig. 2 shows the FTIR spectrum of the SrTiO3
ceramic powder pellet. The bands at 1466 cm−1 are
due to the stretching and bending vibrations of
water molecule. The band at 852 cm−1 is assigned
to stretching vibrations of Sr-O (Komatsu et al.,
1998).
The band at 558 cm−1 corresponds to stretching
vibrations of TiO2 and the band at 1466 cm-1 is
related to asymmetric stretch of COO- (Sulaeman
et al., 2011).
Fig. 3 shows the SEM & EDS images of the pure
SrTiO3 and Sm3+: SrTiO3 Ceramic powders. The
SEM images of the samples had obvious pores or
displayed homogeneous microstructure. The grain
size of SrTiO3 and Sm3+:SrTiO3 samples are about
184.3 and 241.4 nm respectively. The grain size of
the samarium doped strontium titanate is increased
compared to the pure strontium titanate. We
believe that these fine particles belong to the
second phase and that their sizes are on the
nanometer scale. These nanosize particles increase
the scattering centers as well as decrease the
thermal conductivity and electrical conductivity.
The energy dispersive x-ray spectroscopy (EDS)
spectrum shows the elements that are present in
SrTiO3 and Sm3+:SrTiO3 ceramic powders.
Fig.3. The SEM&EDS images of the host SrTiO3 and Sm3+:SrTiO3 ceramic powders
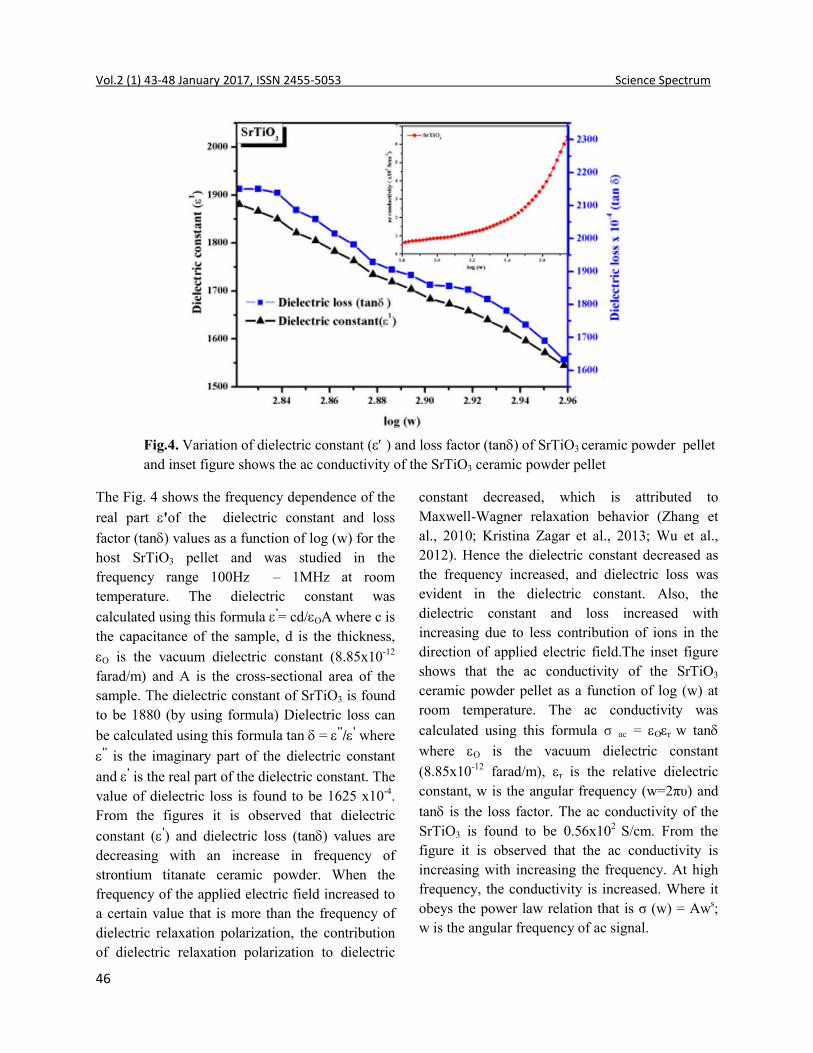
46
Vol.2 (1) 43-48 January 2017, ISSN 2455-5053 Science Spectrum
Fig.4. Variation of dielectric constant ( ) and loss factor (tan) of SrTiO3 ceramic powder pellet
and inset figure shows the ac conductivity of the SrTiO3 ceramic powder pellet
The Fig. 4 shows the frequency dependence of the
real part 'of the dielectric constant and loss
factor (tan) values as a function of log (w) for the
host SrTiO3 pellet and was studied in the
frequency range 100Hz – 1MHz at room
temperature. The dielectric constant was
calculated using this formula '= cd/OA where c is
the capacitance of the sample, d is the thickness,
O is the vacuum dielectric constant (8.85x10⁻¹²
farad/m) and A is the cross-sectional area of the
sample. The dielectric constant of SrTiO3 is found
to be 1880 (by using formula) Dielectric loss can
be calculated using this formula tan = ''/' where
'' is the imaginary part of the dielectric constant
and ' is the real part of the dielectric constant. The
value of dielectric loss is found to be 1625 x10-4.
From the figures it is observed that dielectric
constant (') and dielectric loss (tan) values are
decreasing with an increase in frequency of
strontium titanate ceramic powder. When the
frequency of the applied electric field increased to
a certain value that is more than the frequency of
dielectric relaxation polarization, the contribution
of dielectric relaxation polarization to dielectric
constant decreased, which is attributed to
Maxwell-Wagner relaxation behavior (Zhang et
al., 2010; Kristina Zagar et al., 2013; Wu et al.,
2012). Hence the dielectric constant decreased as
the frequency increased, and dielectric loss was
evident in the dielectric constant. Also, the
dielectric constant and loss increased with
increasing due to less contribution of ions in the
direction of applied electric field.The inset figure
shows that the ac conductivity of the SrTiO3
ceramic powder pellet as a function of log (w) at
room temperature. The ac conductivity was
calculated using this formula σ ac = Or w tan
where O is the vacuum dielectric constant
(8.85x10⁻¹² farad/m), r is the relative dielectric
constant, w is the angular frequency (w=2πυ) and
tan is the loss factor. The ac conductivity of the
SrTiO3 is found to be 0.56x10² S/cm. From the
figure it is observed that the ac conductivity is
increasing with increasing the frequency. At high
frequency, the conductivity is increased. Where it
obeys the power law relation that is σ (w) = Aws;
w is the angular frequency of ac signal.

47
Science Spectrum Vol.2 (1) 43-48 January 2017, ISSN 2455-5053
Fig.5. Variation of dielectric constant ( ) and loss factor (tan) of Sm3+:SrTiO3ceramic powder pellet
and inset figure shows the ac conductivity of the Sm3+:SrTiO3ceramic powder pellet
The Fig. 5 shows that the dielectric constant and
loss factor tan values as a function of log (w) for
the Sm3+:SrTiO3 pellet and was studied in the
frequency range 100Hz – 1MHz at room
temperature. From the figures it is observed that
dielectric constant () and dielectric loss (tan)
values are decreasing with an increase in
frequency of samarium doped strontium titanate
ceramic powder. The high dielectric constant is
also related to the substitution of Sm3+ to Sr2+ It is
reported that the rare earth doped SrTiO3 ceramics
with dielectric constant is increased compared to
that of pure SrTiO3 value is 1.24x10¹¹, dielectric
loss lower than 0.87 and the ac conductivity is
1.32x10⁵ S/cm were obtained. Sr vacancies and Ti
vacancies charge compensation mechanism is
reasonable for high dielectric constant trivalent
rare-earth doped SrTiO3 ceramics. In this work,
the trivalent ions Sm3+ is replaced the divalent ions
Sr2+ at the A-sites of the perovskite lattice would
result in Sr-site vacancies to maintain the charge
equilibrium. It is believed that a small quantity of
Sr-site vacancies will be helpful to improve the
dielectric constant. It is clear that all doped
ceramic powders show higher values than the un
doped ceramic powder due to the introduction of
localized states (Jung, and Lee, 2013).
Conclusions
SrTiO3 and Sm3+:SrTiO3 ceramics powders were
successfully synthesized by solid-state reaction
method. The strontium titanate powder X-ray
diffraction analysis confirms the phase transition
occurred.The strontium titanate can be changed in
to cubic to tetragonal nature. The crystalline size
of the powder has been calculated by using the
Scherrer’s equation. The SEM&EDS image shows
the morphological and elemental analysis. By
using the SEM we calculated the grain size of
SrTiO3 and Sm3+:SrTiO3 powders. The samarium
doped strontium titanate grain size was increased
compared to the host strontium titanate ceramic
powder. The functional groups and structural
phase transition have been evaluated from the
FTIR analysis. The dielectric properties of SrTiO3
and Sm3+:SrTiO3 ions also studied. Sm3+doped
SrTiO3 can be considered as a promising dielectric
material due to the increased dielectric constant,
48
Vol.2 (1) 43-48 January 2017, ISSN 2455-5053 Science Spectrum
dielectric loss and increasing ac conductivity
values compared to the undoped SrTiO3. Therefore
Sm3+:SrTiO3 is good dielectric material and it can
be used high voltage capacitors in energy storage
applications.
References
1. A.E. Souza, G.T.A. Santos, B.C. Barra, W.D. Macedo Jr., S.R. Teixeira, C.M. Santos, A.M.O.R. Senos, L. Amaral, and E. Longo, Cryst. Growth Des., 2012, 12, 5671–5679.
2. A.K.Tagantsev, V.O. Sherman, K.F. Astafiev, J. Venkatesh, N. Setter, J.Electroceram., 2003, 11, 5–66.
3. D. Kan, T. Terashima, R. Kanda, A. Masuno, K. Tanaka, S. Chu, H. Kan, A. Ishizumi, Y. Kanemitsu, Y. Shimakawa, and M. Takano, Nat. Mater., 2005, 4, 816–819.
4. G.W. Dietz, W. Antpohler, M. Klee, and R. Waser, J. Appl. Phys., 1995, 78, 6113-6121.
5. H. Takashima, K. Shimada, N. Miura, T. Katsumata, Y. Inaguma, and K. Ueda, Adv. Mater., 2009, 21, 3699–3702.
6. H.S. Jung, and J.K. Lee, J. Phys. Chem. Lett. 2013, 4, 1682-1693.
7. J. Zhang, C. Tang, and J.H. Bang, Electrochem. Commun., 2010, 12, 1124-1128.
8. K. Ueno, S. Nakamura, H. Shimotani, A. Ohtomo, N. Kimura, T. Nojima, H. Aoki, Y. Iwasa, and M. Kawasaki, Nature Mater, 2008, 7, 855-858.
9. Kristina Zagar, Cristian Fàbrega, Francisco Hernandez-Ramirez, Joan Daniel Prades, Joan Ramon Morante, Aleksander Recnik, and Miran Ceh, Mater.Chem.Phys., 2013,141, 9-13.
10. M. A. Saifi and L. E. Cross, Phys. Rev. B2, 1970, 677-684.
11. M. Schumacher, G.W. Dietz, R. Waser, Integrated Ferroelectrics, 1995, 10, 231-245.
12. M.X. Wu, X. Lin, Y.D. Wang, L. Wang, W. Guo, D.D. Qi, X.J. Peng, A. Hagfeldt, M. Gratzel, and T. Ma, J. Am. Chem. Soc., 2012, 134, 3419-3421.
13. R.S. Roth, J. Research NBS, RP.1957, 58, 75-88.
14. S. Komatsu, K. Abe, and N. Fukushima, Japanese, J. Appl. Phys., 1998, 37, 5651-5654.
15. T. Sakudo and H. Unoki, Phys. Rev. Lett., 1971, 26, 851-854.
16. T.K. Song, J. Kim, S.I. Kwun, Solid State Commun., 1996, 97, 143-147.
17. U. Sulaeman, S. Yin and T. Sato, Applied catalysis B: Environmental, 2011, 102, 286-290.
18. V.M. Longo, A.T. de Figueiredo, S. de Lázaro, M.F. Gurgel, M.G.S. Costa, C.O. Paiva Santos, J.A. Varela, E. Longo, V.R. Mastelaro, F.S. de Vicente, A.C. Hernandes, R.W.A. Franco, J. Appl. Phys., 2008,104, 023515 (1-11).
19. Y. Kanemitsu, Y. Yamada, Phys. Status Solidi B2, 2011, 48 (2), 416–421.

49
Science Spectrum Vol.2 (1) 49-53 January 2017, ISSN 2455-5053
Construction of Subsets of B and B0
S.Nagendra1 and Dr. E. Keshava Reddy2 1Department of Mathematics, Govt. Degree College, Porumamilla, Kadapa- 516193
2Department of Mathematics, JNTUA, Anantapur * For Correspondence: [email protected]
Abstract
In continuation to the study of subsets of the Bloch space B and the Little Bloch space B0 (Nagendra and
Keshava Reddy, 2015), we construct new subsets of B and B0 based on the results obtained in Bloch
Multipliers by Nagendra and Keshava Reddy (2015).
Keywords: Bloch space, Little Bloch space, Hp spaces, Minkowski’s inequality
Introduction
Let be the unit disc in the Complex plane� . An analytic function :f � is said to be a Bloch
function if f 2'sup 1z
f z z
. The function space of Bloch functions is called Bloch Space and
denoted by B. It is known that B is a Banach Space with respect to the norm defined as
2'0 sup 1B
z
f f f z z
.
The subspace of B denoted by B0 known as the little Bloch Space consists of members of B for which
lim|�|→����′(�)�(1 − |�|�)= 0.
Simple examples of Bloch functions are polynomials which are also in B0. For detailed discussion and
interesting theorems related to B and B0, an interested reader can refer to Dinakar ().
In the Study of subsets of the Bloch space and the Little Bloch space (Nagendra and Keshava Reddy,
2015), we made a detailed study of function spaces such as��, BMOA, VMOA, A, D in view of subsets
of B or B0. In the next sections, we construct new subsets of B and B0.
Subset of Bloch Multipliers
In this section, we prepare new subsets of B based upon the results obtained in Bloch Multipliers (2015).
In this, the concept of Bloch Multiplier was defined and the collection of Bloch multipliers was denoted
by ‘M’ which was proved to be a normed linear space. Theorem-1 and 2 give necessary and sufficient
conditions for Bloch multipliers. While doing this, we came across a new function space denoted by ‘L’
which was also a normed linear space. We brief about these concepts below.
� = {∅: ∆→ ℂ:∅� ∈ ��ℎ������� ∈ �}
� = {∅: ∆→ ℂ ∶ ∅��������������(∅)< ∞}
Where �(∅)= (1 − |�|�)|∅�(�)|�∈∆���
�1 + log�
��|�|�
For details of these concepts, we refer reader to (Nagendra and Keshava Reddy, 2015).

50
Vol.2 (1) 49-53 January 2017, ISSN 2455-5053 Science Spectrum
Theorems-1 and 2 of Bloch Multipliers by Nagendra and Keshava Reddy (2015) imply that
a) � ∩ �� = �
b) From a) M L and M H
c) From definition of M, once ∅ ∈ � ⇒ ∅ ∈ � which implies that M B
d) L B
For ∅ ∈ �, |∅�(�)|(1 − |�|�)< �(∅)
2'sup 1
z
z z L
B
L B
M L B
In the next section, we prepare new subsets which are similar to �� spaces.
A. �� space:
With the inspiration obtained from �� spaces (Nagendra and Keshava Reddy, 2015), we started
constructing �� type space which we are calling �� space.
Definition
Let �: ∆→ ℂ be an analytic function and � ∈ [0,1[, � > 0 then � ∈ �� if f
��(�, �)< +∞��������
where
��(�, �)= � �
��∫ ����������
���
��
� ����
Clearly polynomials are members of ��.
Now let us do some propositions about ��.
Proposition-1
lim�→���(�, �)= �� where �� = max|�|��|��(�)|
Proof: For � > 0,�� − � is not maximum of |��(�)| on |�| = �. So there exists � > 0 such that
��������|� − ��| <�2� ⇒ ���������� > �� − �
For given� ∈ [0,1[, �� = �����������, then
��
2��
���
(�� − �)< ��
2��
���
���������� ≤ ��
2��
���
����������� = ��
��� �����������
���
����
��
����
��
�
���
≤ ��(�, �)≤ ��
taking � → ∞ in the above inequality, we get
�
2�(�� − �)≤ ��(�, �)≤ ��, ∀� ∈ [0,1]
∴ ��(�, �)= �� = |��(�)|.�∈∆���

51
Science Spectrum Vol.2 (1) 49-53 January 2017, ISSN 2455-5053
Using above proposition, we define
�� = ��: ∆→ ℂ ∶ �������������� |��(�)| < +∞�∈∆���
�
It is to note that �(�)= log(1 − �), � ∈ ∆ is not a member of �� as
|��(�)| = �1
� − 1�
For� = � ∈ [0,1[, |��(�)| = ��
���� → ∞��� → 1�
Proposition-2
For 0 < � < �, �� ⊆ �� and hence �� ⊆ ��,∀� > 0
Proof: For this, we use
0 < � < � ⇒ �� < �� + 1, ∀� ≥ 0
Now for � ∈ ��,
���(�, �)=
�
��� ����������
����
�
��� �����������
������
��
�
��
�
< ���(�, �)+ 1
<+∞
∴ � ∈ ��
Therefore, �� ⊆ �����0 < � < �
It is to note that �� ⊆ ��,∀� > 0.
In the next section, we discuss the normed linear structure of �� and it’s containment in B0.
B. Linear structure of ��:
For �, � ∈ ��,
��(� + �, �)= ��
��� �(���)��������
���
��
�
�
���
≤ � �
��∫ �����������������������
���
��
�����
Using Minkowski’s inequality, we have
��(� + �, �)≤ ��(�, �)+ ��(�, �)
< +∞
⇒ � + � ∈ ��
For � ∈ ℂ���� ∈ ��,��(�, �)= � �
��∫ �(��)��������
���
��
�����
52
Vol.2 (1) 49-53 January 2017, ISSN 2455-5053 Science Spectrum
= |�|��(�, �)< +∞
⇒ �� ∈ ��.
∴ (��,+, . )/ℂ�� a linear space.
�� can also be made a normed linear space equipped with norm
‖�‖�� = |�(0)| + ��(�, �)��������
Where ��(�, �) is defined as in this section 6.2.1
Clearly ‖�‖�� ≥ 0 and if ‖�‖�� = 0
�(0)= 0����������� = 0, ∀�&∀�
�(0)= 0���������������
⇒ � ≡ 0
For �, � ∈ K�,
‖� + �‖�� = |(� + �)(0)| + ��(� + �, �)��������
Using Minkowski’s inequality
≤ ‖�‖�� + ‖�‖��
For � ∈ ℂ, � ∈ K�, ‖αf‖�� = |(αf)(0)| + K�(αf, r)��������
= |�|‖�‖��
Therefore (��,+, . , ‖ ‖��)��������������������.
Next we prove a theorem about containment of �� in B.
Theorem: �� ⊆ ��
Proof: If� ∈ ��, then by definition
��(�, �)< +∞��������
⇒ ��(�, �)≤ ‖�‖��, ∀0 ≤ � < 1
⇒ ���(�, �)≤ ‖�‖���, ∀0 ≤ � < 1
⇒�
��� ����������
���
�
�� ≤ ‖�‖���, ∀0 ≤ � < 1…… . . (∗)
The above inequality implies that
����������� is bounded ∀0 ≤ � < 1���0 ≤ � < 2�………(∗∗)
53
Science Spectrum Vol.2 (1) 49-53 January 2017, ISSN 2455-5053
Otherwise, let �����������
� is unbounded for 0 ≤ � < 2� and for some �� ∈ [0,2�].From the theory of
Riemann integration
�
��∫ �������
�������
��� would be unbounded which contradicts equ.(*).
Therefore assertion (**) is true and thus ���������� is bounded ∀0 ≤ � < 1���0 ≤ � < 2�
Hence |��(�)| ≤ �, ∀� ∈ ∆ and for some � > 0
⇒ lim|�|→��(1 − |�|�)|��(�)| = 0
⇒ � ∈ ��
Hence � ∈ �.
Hence the theorem.
Conclusions
In this paper, we constructed two subsets ‘M’ and ‘L’ of B. Also defined and discussed about �� spaces
and proved these spaces as subsets of��.
References
1. S. Nagendra and E. Keshava Reddy, Study of subsets of the Bloch space and the Little Bloch space
published in IJSIMR, 2015, 3(1), pp. 345-348, ISSN 2347-307X.
2. S. Nagendra and E. Keshava Reddy, Bloch Multipliers by published in IJPAMS, 2015, 8(1), pp.55-60,
ISSN 0972-9828.
3. N. Danikar, Some Banach spaces of Analytic functions, Aristotle Univ. of Thessaloniki.

54
Vol.2 (1) 54-61 January 2017, ISSN 2455-5053 Science Spectrum
Influence of silver nitrate and different carbon sources on in vitro shoot
development in Solanum nigrum (Linn)-an important antiulcer medicinal
plant
G. Geetha, K. Harathi, D. Giribabu and C.V. Naidu*
Department of Biotechnology, Dravidian University, Kuppam-517426, A.P, India
*For Correspondence: [email protected]
Abstract
In the present study the influence of different
carbon sources such as sucrose, fructose, glucose
and maltose (1-6%) and ethylene inhibitor silver
nitrate (0.4 mg/l) along with 1.0 mg/l Kn and 0.1
mg/l NAA was investigated for the development
of multiple shoots from axillary bud or nodal
explants of Solanum nigrum. The regeneration
frequency, growth and multiplication rate were
highly influenced by the type and concentration of
carbohydrates and AgNO3 used. The highest
number of shoots (34.5) was obtained on MS
medium augmented with 4% fructose and 0.4mg/l
AgNO3 when compared to media devoid of
AgNO3. In the absence of carbohydrates there is
no regeneration was found. Observations of the
shoot cultures developed on media containing one
of these carbohydrates indicated that 4% fructose
was the preferential carbohydrate for the
proliferation of multiple shoots followed by
sucrose, maltose and glucose from nodal explants
of S. nigrum.
Key words Solanum nigrum, Axillary bud
explants, Micropropagation, Silver nitrate, Carbon
sources.
Abbreviations
BAP 6 – benzyl amino purine
AgNO3 Silver nitrate
NAA α – naphthalene acetic acid
IAA Indole – 3 – acetic acid
IBA Indole – 3 – butyric acid
MS Murashige and Skoog
Introduction
Solanum nigrum is an important herbaceous
medicinal plant belongs to solanaceae family.
Solanacae family comprises a number of plants
widely known for the presence of natural products
of medical significance mainly steroidal lactones,
glycosides, alkaloids and flavonoids. The herb is
antiseptic, antidysentric and diuretic used in the
treatment of cardiac, skin disease, psoriasis,
herpivirus and inflammation of kidney. The fruits
and leaves have been traditionally used against
various nerve disorders (Perez et al., 1998). It has
very important gastric ulcerogenic activities
(Aktar and Munir, 1989), and is recommended in
ayurveda for the management of gastric ulcers.
Most prominent medical properties are the
presence of alkaloids solamargin and solosonin
which yield solasodine as glycone. Solasodine has
embryogenic, teratonic and antimicrobial activities
(Kim et al., 1996). The growth and multiplication
of shoots in vitro are affected by many factors
(Anwar et al., 2005), one of which was the
concentration and type of exogenous carbon
sources added to medium to serve as energy and
also to maintain the osmotic potential (Lipavska
and Konradova, 2004). In general sucrose is the
carbohydrate of choice as a carbon source for in
vitro plant culture probably, because it is the most
common carbohydrate in the phloem sap of many
plants (Murashige and Skoog, 1962; Lemos and
Baker, 1998; Fuents et al., 2000). Although
sucrose has been the carbohydrate of choice in
vast majority of work on in vitro shoot induction
55
Science Spectrum Vol.2 (1) 54-61 January 2017, ISSN 2455-5053
and shoot development, it is not always the most
effective carbon source for these purpose
(Thomson and Thrope, 1987).
The involvement of ethylene in plant tissue growth
and differentiation has been widely investigated.
Application of ethylene precursors and/or
inhibitors has shown that ethylene may often have
diverse effects in similar tissue culture systems.
Although it has been reported that ethylene may
promote callus growth (Songstad et al., 1991), it
generally appears to inhibit shoot regeneration
(Biddington, 1992). Silver nitrate (AgNO3), a
potent inhibitor of ethylene action (Beyer, 1976),
was shown to promote regeneration in Brassica
campestris (Palmer, 1992) and Helianthus annuus
(Chraibi et al., 1991).
Therefore, the aim of the present study was to
determine the effect of silver nitrate and different
carbon sources such as sucrose, glucose, fructose
and maltose on in vitro shoot regeneration from
nodal explants of Solanum nigrum.
Materials and methods
Source of plant material: Healthy axillary bud
and leaf explants of Solanum nigrum (L.) were
collected from two-month-old seed germinated
field grown plants growing in the Herbal garden of
Dravidian University, Kuppam, Andhra Pradesh,
India.
Surface sterilization: Explants were washed
thoroughly under running tap water to remove
traces of dust etc. followed by treatment with 10%
teeepol or tween -20 for 5 minutes and 0.4%
bavistine (fungicide) for 10-15 minutes. Then the
explants were sterilized in 70% alcohol for a
minute, and finally with 0.01% mercuric chloride
for1-2 minutes and washed 3-4 times with sterile
double distilled water.
Culture Medium: The explants were inoculated
on MS medium (Murashige and Skoog, 1962)
containing different carbohydrates and gelled with
0.8% agar, supplemented with BAP (2.0mg/l) in
combination with NAA (0.5mg/l) and AgNO3
(0.4mg/l). The pH of the medium was adjusted to
5.8 before gelling with agar and autoclaved for 20
minutes at 121°C and 15 lbs pressure.
Sub culturing: The cultures were maintained by
regular subculture at 4 week intervals on fresh MS
medium.
Culture conditions: All cultures of Solanum
nigrum were maintained in a culture room at
temperature of 24 ± 2°C and 55-65% RH with 16
h/8 h photoperiod at a photon flux density of 3000
lux or 50-70 Em-2 s-1 provided by cool white
fluorescent tubes.
Data collection and statistical analysis: Visual
observations were recorded on the frequency in
terms of number of cultures responding for
axillary shoot proliferation, shoot development,
number of shoots per explant, average length of
the regenerated shoots, and number of roots per
shoot and average root length.
Despite scarcity and limitations encountered with
the plant material, for most of the treatment a
minimum of 10 replicates were used. All the
experiments were repeated at least twice/thrice and
the cultures were observed at regular intervals.
The qualitative data were subjected to statistical
analysis by using standard error (SE±) for shoot
length, rate of shoot multiplication and then
number of roots per shoot.
Results and Discussion
Influence of silver nitrate and various carbon
sources on shoot regeneration from axillary
bud explants: Experiments were conducted with
axillary bud explants at 0.4 mg/l AgNO3 to find
more effective energy source for in vitro
propagation of Solanum nigrum. After pursuing
the observations depicted in the table-1 the type
and amount of carbohydrates on multiple shoot
proliferation are significantly influenced by silver
nitrate in comparison with normal control. The
regeneration frequency which indicates the
56
Vol.2 (1) 54-61 January 2017, ISSN 2455-5053 Science Spectrum
survival rate of explants has varied depending on
the presence of silver nitrate and energy sources
supplemented to the media. Silver nitrate supplied
media had shown maximum survival rate
compared to control. The media free from energy
source had not shown any regeneration where as
media supplemented with 0.4 mg/l AgNO3 along
with 3% sucrose and 4% fructose had shown
maximum regeneration frequency as high as 95%
and 92% respectively. Among all the
carbohydrates, fructose supplemented media
grown explants had shown better regeneration
frequency ranging from 65% to 92%. The fructose
at 4% in the presence of silver nitrate gave
significantly higher mean number of shoots (34.5
± 0.36) followed by 4% sucrose (27.6 ± 0.25). The
results obtained obviously indicate (Fig-1)
supplementation of silver nitrate along with
various concentrations and types of carbohydrates
in the media had increased the shoots proliferation
over three folds compared to control.
Similar to the multiple shoot regeneration, mean
shoot length was also influenced by silver nitrate
on various types and concentrations of
carbohydrates. The maximum mean shoot length
was given by AgNO3 supplemented media along
with 4% sucrose (11.4 ± 0.30 cm) followed by 4%
fructose (10.4 ± 0.25 cm).
In plant tissue culture continuous supply of
carbohydrate is essential, since the photosynthetic
activity of in vitro plant tissue is reduced due to
low light intensity, high humidity and limited
gaseous exchange (Kozai, 1991a). The type and
levels of exogenous carbohydrate supplements
play a dynamic role in plant growth and
multiplication (Hossain et al., 2005). Surpassing of
glucose over sucrose in the investigation could be
explained, as the presence of sucrose might cause
hypoxia and ethanol accumulation in cells due to
quick metabolisation. But when it comes to
longevity parameter under investigation, 4%
sucrose besides showing 95% regeneration
percentage proved to be promising in repeated sub
culturing. Whereas 4% glucose, though
appreciably extended with 80% withering,
yellowish lean shoots development in next sub
culturing on the same media. Hence there is a
prospect of using 3% sucrose which had promoted
more healthy shoots and high survival frequency
(95%), instead of 4% glucose for further
investigations. However, it is also reported by
many other researchers that the different carbon
sources like glucose, fructose and maltose are also
proved to better carbohydrate sources for in vitro
propagation. Fructose have been reported to be
effective in preventing hyperhydricity and helps in
production of adventitious shoots in Almonds
(Rugini et al., 1987), also achieved maximum
number of shoots in mulberry (Vijay chitra and
Padmaja, 2002), in Mentha piperita (Sujana and
Naidu, 2011). Another major carbon source in
culture media proved to be glucose used in Prunus
mume (Hisashi and Yasuhiro, 1996).
Presence of silver nitrate in in vitro propagation
showed distinct significance in almost all
parameters under present investigation. When
media was devoid of energy source there was no
growth at all and media without silver nitrate
showed lesser response. This clearly explains that
the presence of optimal AgNO3 concentration at
particular carbohydrate concentration had
increased almost three folds in shoot proliferation.
This may be due to presence of silver nitrate,
which might have suppressed the activity of
AgNO3 might have promoted production of poly
amines (Roustan et al., 1990), which implicate
easy translocation and assimilation of these energy
sources available in the media by the explants
resulting in cell division and leading to vigorous
growth. In addition, sugar sensitive plant gene
which plays an important role in cellular
adjustment to critical nutrient availability might
show carbohydrate modulated gene expression at
various levels (Koch, 1996).

57
Science Spectrum Vol.2 (1) 54-61 January 2017, ISSN 2455-5053
Table 1. Effect of AgNO3 on different carbohydrates on multiple shoot regeneration from axillary bud
explants of Solanum nigrum supplemented with BAP 2.0 mg/l and NAA 0.5 mg/l. Observation: After 8
weeks, values are mean ± S.E. of 10 independent determinants.
Carbohydrat
e Source
Concentrati
on (%)
Regeneration
frequency (%)
Mean number of
shoots/explants
Mean shoot length
(cm)
Without
AgNO3
0.4mg/l
AgNO3
Without
AgNO3
0.4mg/l
AgNO3
Without
AgNO3
0.4mg/l
AgNO3
Control No
carbohydr-
ate
- - - - - -
Glucose 1.0 55 65 4.5 ± 0.35 10.8 ± 0.25 2.8 ± 0.35 4.4 ± 0.26
2.0 60 72 6.4 ± 0.19 14.6 ± 0.30 4.5 ± 0.39 5.8 ± 0.50
3.0 68 75 7.9 ± 0.47 18.5 ± 0.36 6.8 ± 0.47 9.5 ± 0.28
4.0 75 80 11.5 ± 0.2 21.9 ± 0.20 4.53 ± 0.32 7.56 ± 0.32
5.0 70 75 5.4 ± 0.41 16.9 ± 0.15 3.96 ± 0.40 6.4 ± 0.43
6.0 60 70 3.6 ± 0.25 12.7 ± 0.2 2.9 ±0.17 4.5 ± 0.2
Sucrose 1.0 58 80 3.5 ± 0.18 16.9 ± 0.3 3.1± 0.32 4.53 ± 0.15
2.0 70 85 5.4 ± 0.29 20.5 ± 0.36 3.39 ±0.28 6.3 ± 0.20
3.0 85 95 9.4 ± 0.40 24.3 ± 0.37 5.5 ± 0.15 8.9 ± 0.3
4.0 80 92 12.5 ± 0.28 27.6 ± 0.25 8.0 ± 0.41 11.4 ± 0.30
5.0 70 85 6.9 ± 0.3 17.4 ± 0.41 5.35 ± 0.16 7.5 ± 0.18
6.0 65 70 4.0 ± 0.29 9.9 ± 0.36 3.4 ± 0.28 4.2 ± 0.15
Fructose 1.0 62 70 7.3 ± 0.32 13.5 ± 0.18 2.5 ±0.35 3.9 ± 0.32
2.0 65 75 9.4 ± 0.40 17.8 ± 0.47 3.6 ± 0.30 5.7 ± 0.17
3.0 75 85 11.7 ± 0.15 23.4 ± 0.3 4.41 ± 0.42 7.56 ± 0.41
4.0 85 92 14.3 ± 0.30 34.5 ± 0.36 7.63 ± 0.37 10.4 ± 0.25
5.0 70 75 8.5 ± 0.17 19.0 ± 0.34 5.3 ± 0.26 6.5 ± 0.35
6.0 60 65 4.4 ± 0.25 10.4 ± 0.45 2.2 ± 0.07 4.46 ± 0.03
Maltose 1.0 50 58 2.9 ± 0.30 9.5 ± 0.35 1.76 ± 0.15 2.53 ± 0.37
2.0 55 60 6.4 ± 0.25 11.4 ± 0.40 3.4 ± 0.1 3.9 ± 0.50
3.0 62 65 7.7 ± 0.1 15.7 ± 0.36 3.9 ± 0.35 6.6 ± 0.23
4.0 65 70 9.4 ± 0.41 19.6 ± 0.23 5.3 ± 0.37 7.5 ±0.15
5.0 55 65 4.5 ± 0.16 12.5 ± 0.28 3.43 ± 0.32 5.5 ± 0.14
6.0 50 60 2.4 ± 0.40 8.2 ± 0.15 1.4 ± 0.29 2.6 ± 0.15

58
Vol.2 (1) 54-61 January 2017, ISSN 2455
Fig.1. Effect of different carbon sources at different concentrations and silver nitrate concentration on
shoot morphogenesis from axillary bud
mg/l AgNO3. A-B) Glucose (2.0 %)
Fructose (3.0 %) H) Fructose (3.0 %) I) Fructose (4.0 %).
Effect of silver nitrate on in vitro
vitro derived shoots at a length of 3
separated from shoot clumps and transferred to
half strength MS rooting medium supplemented
with different auxins such as NAA, IAA or IBA
(1.0-3.0mg/l) along with AgNO
fortified with 3% sucrose. Among the different
auxins tried with half strength MS medium, IBA at
(2.0mg/l) resulted in inducing maximum number
of in vitro roots per shoot (39.4) with a maximum
shoot length of (5.4cm), (Table 2; Fig. 2).
Presence of silver nitrate in in vitro
showed marked significance in almost all
parameters under present investigation. Media
without silver nitrate showed lesser response. This
may be due to presence of silver nitrate, which
might have suppressed the activity of excess of
2017, ISSN 2455-5053
Effect of different carbon sources at different concentrations and silver nitrate concentration on
shoot morphogenesis from axillary bud explants cultured on MS + 2.0 mg/l BAP + 0.5 mg/l NAA and 0.4
Glucose (2.0 %) C) Glucose (4.0 %) D-E) Sucrose (2.0 %) F) Sucrose (3.0 %)
Fructose (3.0 %) H) Fructose (3.0 %) I) Fructose (4.0 %).
in vitro Rooting: In
derived shoots at a length of 3-5cm were
separated from shoot clumps and transferred to
half strength MS rooting medium supplemented
with different auxins such as NAA, IAA or IBA
th AgNO3 (0.4mg/l)
fortified with 3% sucrose. Among the different
auxins tried with half strength MS medium, IBA at
(2.0mg/l) resulted in inducing maximum number
roots per shoot (39.4) with a maximum
shoot length of (5.4cm), (Table 2; Fig. 2).
in vitro propagation
showed marked significance in almost all
parameters under present investigation. Media
without silver nitrate showed lesser response. This
may be due to presence of silver nitrate, which
have suppressed the activity of excess of
ethylene present in the in vitro
further promoted for easy translocation and
assimilation of these energy sources available in
the media by the explants resulting in cell division
and leading to vigorous growth. Similar type of
results was documented in Decalepis hamiltonii
(Bais et al., 2000) Vanilla planifolia
al., 2001).
Acclimatization and hardening:
shoots were removed from the culture tubes and
washed thoroughly to remove the traces of agar.
The plantlets of in vitro grown
with well developed roots and shoots were
transplanted to plastic cups containing autoclaved
vermiculite and soil (1:1). About 90% of the
transplanted plantlets surv
Science Spectrum
Effect of different carbon sources at different concentrations and silver nitrate concentration on
explants cultured on MS + 2.0 mg/l BAP + 0.5 mg/l NAA and 0.4
Sucrose (3.0 %) G)
culture tubes and
further promoted for easy translocation and
assimilation of these energy sources available in
the media by the explants resulting in cell division
igorous growth. Similar type of
Decalepis hamiltonii
Vanilla planifolia (Giridhar et
Acclimatization and hardening: The well rooted
shoots were removed from the culture tubes and
ed thoroughly to remove the traces of agar.
grown Solanum nigrum
with well developed roots and shoots were
transplanted to plastic cups containing autoclaved
vermiculite and soil (1:1). About 90% of the
transplanted plantlets survived after
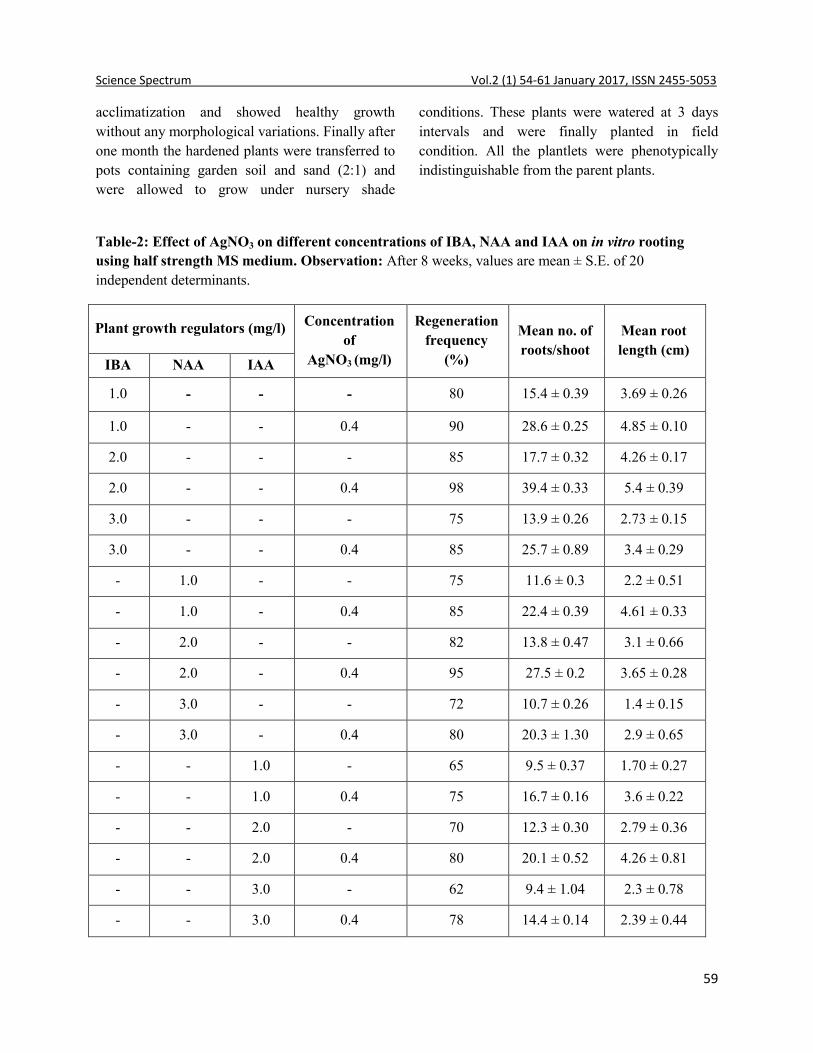
59
Science Spectrum Vol.2 (1) 54-61 January 2017, ISSN 2455-5053
acclimatization and showed healthy growth
without any morphological variations. Finally after
one month the hardened plants were transferred to
pots containing garden soil and sand (2:1) and
were allowed to grow under nursery shade
conditions. These plants were watered at 3 days
intervals and were finally planted in field
condition. All the plantlets were phenotypically
indistinguishable from the parent plants.
Table-2: Effect of AgNO3 on different concentrations of IBA, NAA and IAA on in vitro rooting
using half strength MS medium. Observation: After 8 weeks, values are mean ± S.E. of 20
independent determinants.
Plant growth regulators (mg/l) Concentration
of
AgNO3 (mg/l)
Regeneration
frequency
(%)
Mean no. of
roots/shoot
Mean root
length (cm) IBA NAA IAA
1.0 - - - 80 15.4 ± 0.39 3.69 ± 0.26
1.0 - - 0.4 90 28.6 ± 0.25 4.85 ± 0.10
2.0 - - - 85 17.7 ± 0.32 4.26 ± 0.17
2.0 - - 0.4 98 39.4 ± 0.33 5.4 ± 0.39
3.0 - - - 75 13.9 ± 0.26 2.73 ± 0.15
3.0 - - 0.4 85 25.7 ± 0.89 3.4 ± 0.29
- 1.0 - - 75 11.6 ± 0.3 2.2 ± 0.51
- 1.0 - 0.4 85 22.4 ± 0.39 4.61 ± 0.33
- 2.0 - - 82 13.8 ± 0.47 3.1 ± 0.66
- 2.0 - 0.4 95 27.5 ± 0.2 3.65 ± 0.28
- 3.0 - - 72 10.7 ± 0.26 1.4 ± 0.15
- 3.0 - 0.4 80 20.3 ± 1.30 2.9 ± 0.65
- - 1.0 - 65 9.5 ± 0.37 1.70 ± 0.27
- - 1.0 0.4 75 16.7 ± 0.16 3.6 ± 0.22
- - 2.0 - 70 12.3 ± 0.30 2.79 ± 0.36
- - 2.0 0.4 80 20.1 ± 0.52 4.26 ± 0.81
- - 3.0 - 62 9.4 ± 1.04 2.3 ± 0.78
- - 3.0 0.4 78 14.4 ± 0.14 2.39 ± 0.44

60
Vol.2 (1) 54-61 January 2017, ISSN 2455-5053 Science Spectrum
Fig.4. Rooting and acclimatization of Solanum nigrum: A, B) Root formation from shootlets inoculated
on MS media with IBA (1.0 mg/l) and AgNO3 (0.4 mg/l) C) Plantlet showing elongated root system D)
Hardened plantlet in polybags containing soil and vermiculate in 1:1 ratio E) Plantlet in field condition
Conclusion
It can be concluded that among the different
carbon sources tested, fructose along with silver
nitrate (0.4mg/l) showed better response followed
by sucrose, glucose and maltose in terms of
multiple shoot induction. Since fructose and
sucrose are the better carbohydrate sources for in
vitro shoot multiplication of Solanum nigrum.
However, further research is required to explore
the effect of different carbon sources on in vitro
plant regeneration.
References
1. C.E. Palmer, Plant Cell Rep. 1992, 11,
541–545.
2. D.D. Songstad, C.L. Armstrong, W.L.
Petersen, Plant Cell Rep. 1991, 9, 699–
702.
3. D.S. Vijaya Chitra, G. Padmaja, Scientia
Horti. 2002, 92, 55–68.
4. E. E. P. Lemos, D. A. Baker, Plant
Growth Ragul. 1998, 25, 105-112.
5. E. Rugini, P. Tarini, M.E. Rossodivita,
Acta. Hort. 1987, 212, 177–183.
6. E.M. Beyer, Plant Physiol. 1976, 58, 268–
271.
E D
C B A

61
Science Spectrum Vol.2 (1) 54-61 January 2017, ISSN 2455-5053
7. G.R.M. Perez, L.A. Perez, D.L.M. Garcia,
M.H. Sossa, J. Ethanopharmacol. 1998,
62, 43-48.
8. H. Anwar Md, Md. Taslim Hossain, Md.
Raihanali, S. M. Mahbubur Rahman, Pak.
J. Biol. Sci. 2005, 8, 963 – 965.
9. H. Hisashi, M. Yasuhiro, Plant Cell, Tiss.
and Org. Cult. 1996, 40, 159–167.
10. H. Lipavska, H. Konradova, In Vitro Cell
Dev. Biol. Plant. 2004, 40, 23-30.
11. H.P. Bais, G. Sudha, B. Suresh, G.A.
Ravishankar, Curr. Sci. 2000, 79, 894-8.
12. J.P. Roustan, A. Latche, J. Fallot, Plant
Science. 1990, 67, 89-95.
13. K. E. Koch, Annu. Rev. Plant Physiol.
Plant Mol. Biol. 1996, 47, 509–540.
14. K.M. Chraibi, A. Latche, J.P. Roustan, J.
Fallot, Plant Cell Rep. 1991, 10, 204– 207.
15. M. S. Aktar, M. Muni, J.
Ethanopharmacol. 1989, 27, 163-176.
16. M. Thomson, T. Thorpe, Metabolic and
nonmetabolic roles of carbohydrates. In:
J. M. Bonga and D. J. Durgan (Eds.). Cell
and Tissue Culture in Forestry. Martinus
Nijhoff Publishers, Dordrecht, 1987, pp
89-112.
17. M.A. Hossain, M.T. Hossain, M.R. Ali,
S.M. Rahman, Pak. J. Bio. Sci. 2005, 8,
963 – 965.
18. N.L. Biddington, Plant Growth Regul.
1992, 11, 173–187.
19. P. Giridhar, B.O. Reddy, G.A.
Ravishankar, Curr. Sci. 2001, 81, 1166-
1170.
20. P. Sujana, C.V. Naidu, J. Phytol. 2011, 3,
36-40.
21. S. R. L. Fuents, M. B. P. Calheiros, J.
Manetti-Filho, L. G. E. Vieira, Plant Cell,
Tiss. Org. Cult. 2000, 60, 5-13.
22. T. Kozai, In Vitro Cell. Dev. Biol. Plant.
1991a, 27, 47-51.
23. T. Murashige, F. Skoog. Physiol. Plant.
1962, 15, 473-497.
24. Y. C.Kim, C. Q. Ming, A. A. Gunatilaka,
D. G. Kingston, Plant Cell, Tiss. Org.
Cult. 1996, 57, 71–73.

62
Vol.2 (1) 62-71 January 2017, ISSN 2455-5053 Science Spectrum
Synthesis and Spectral characterization and DNA Binding properties of Copper(II) complexes with Nicotinoyl and Isonicotinoylhydrazones
S. Chandrasekhar & K. Hussain Reddy*
Department of Chemistry, Sri Krishnadevaraya University, Anantapur- 515 003, India *For Correspondence: [email protected]
Abstract
Copper (II) complexes with series of ligands viz.
2-formylpyridine nicotinoylhydrazone (FPNH), 2-
acetylpyridine nicotinoylhydrazone (APNH) and
2-benzoylpyridine nicotinoylhydrazone (BPNH)
2-formylpyridine isonicotinoylhydrazone
(FPINH),2-acetylpyridine isonicotinoylhydrazone
(APINH) and 2-benzoylpyridine isonicotinoyl-
hydrazone (BPINH) have been synthesized and
characterized based on physico-chemical and
spectral data. The complexes are characterized
based on electronic, IR and ESR spectral studies.
Molar conductivity data suggest that the
complexes are 1:2 electrolytes IR data suggest that
the ligands act as neutral tridentate ligands in all
copper complexes. Copper complexes are
investigated both in solid state and in solution state
at room temperature and at liquid nitrogen
temperature. The spin Hamiltonian, orbital
reduction and bonding parameters of complexes
are calculated. The redox behavior of the
complexes has been investigated by cyclic
voltammetry. Cu (II) complexes undergo one
electron reduction to their respective Cu(I)
complexes. The non-equivalent current in cathodic
and anodic peaks (ic/ia = 0.465–0.728 at 100 mV s-
1) indicate quasi-reversible behavior. Structures of
the complexes are proposed based on physico-
chemical and spectral data.
Keywords: Copper (II) Complexes, Isonicotinoyl
hydrazones, Spectral Characterization and DNA
Binding.
Introduction
Interaction of transition metal complexes with
nucleic acids and investigation of the cleavage
mechanisms have gained much more attention due
to their great importance in the design of new
chemotherapeutic agents, manipulation of genes,
development of tools or probes for the study of
nucleic acid structures (Sigman and Chen 1990;
Cowan, 2001). Chemical nucleases have some
advantages when compared with enzymatic
nucleases. They are smaller in size and thus they
can reach more sterically hindered regions of a
nucleic acid molecule. In addition, the efficiencies
of chemical nucleases in binding followed by a
scission reaction (Sigman et al., 1979; Travers et
al., 1993) making them popular in pharmacology
and biotechnology. Investigations of isonicotinoyl
hydrazones is of interest, especially due to their
pharmacological properties (Shechter et al., 2003;
Rehder, 2001; Thompson and Orvig, 2001).
Isonicotinic acid hydrazide (INH) is the first line
medication in the prevention and treatment of
tuberculosis. It is one of the first anti-depressive
drugs discovered. It is also used in the treatment of
a wide range of bacterial diseases (Rollas and
Güniz, 2007, Mazza et al., 1992 Ianelli et al.,
1995; Cesur et al., 1990; Bottari et al., 2000) .
Hydrazones derived from condensation of
isonicotinylhydrazine with pyridine carbonyls
have been found to show better anti-tubercular
activity (Kümmerle et al., 2009) rather than INH.
Metal complexes of isonicotinoyl hydrazones
exhibit increased antitumour (Verquin et al., 2004)
and antibacterial activity (N. Raman et al 2004).

63
Science Spectrum Vol.2 (1) 62-71 January 2017, ISSN 2455-5053
Copper complexes are known to have a broad
spectrum of biological actions (Crouch et al.,
1986). Many copper complexes are used as anti-
inflammatory, anti-arthritic, anti-ulcer, anti-
convulsant and anti-tumour agents (Sorenson et
al., 1982; Apelgot et al., 1986). It has been shown
that copper accumulates in tumours due to the
selective permeability of cancer cell membranes to
copper compounds (Renade and Panday, 1984) .
Because of this, a number of copper complexes
have been screened for anti-cancer activity and
some of them were found active both in vivo and
in vitro (Hall et al., 1997)
In the light of the above and in continuation
of our ongoing research work (Murali Krishna et
al., 2008; Pragathi and Hussain Reddy, 2014;
Moksharagni et al., 2015; Chandrasekhar and
Hussain Reddy 2016), a series of heterocyclic
isonicotinoyl hydrazones (Figure 1) and their
copper(II) complexes have been synthesized and
characterized. DNA binding properties of Copper
(II) complexes are also uncovered using
absorption spectrophotometry.
Fig.1. A general structure for six
hydrazone ligands
Where,
R1 R2
H nicotine 2-form ylpyridine nicotinoylhydrazone (FPNH)
CH3 nicotine 2-acetylpyridine nicotinoylhydrazone (APNH)
C6H5 nicotine2-benzoylpyridine nicotinoylhydrazone (BPNH)
H isonicotine2-formylpyridine isonicotinoylhydrazone (FPINH)
CH3 isonicotine2-acetylpyridine isonicotinoylhydrazone (APINH)
C6H5 isonicotine2-benzoylpyridine isonicotinoylhydrazone (BPINH)
Experimental
Materials and Methods: Analytical grade
Cu(NO3)2. 3H2O was obtained from Merck. The
solvents used for synthesis of copper(II)
complexes were distilled before use. Calf thymus
DNA (CT-DNA) was purchased from Genie Bio
labs, Bangalore, India. Solutions of CT-DNA in
50 µM Tris-HCl (pH, 7.0) gave the ratio of UV
absorbance at 260 and 280 nm of 1.8 indicating
that the DNA was sufficiently free of protein. The
DNA concentration was determined by UV
absorbance at 260 nm using molar absorption
coefficient 6600 M-1. Stock solutions were kept at
4oC and used after not more than four days. DNA
binding studies were performed in 50 mM
NaCl/5mM Tris- base, pH, 7.0 buffer.
Physical measurements: The molar conductance
of the complexes in DMF (10 −3 M) solution was
measured at 28 °C with a Systronic Model 303
direct reading conductivity bridge. The electronic
spectra were recorded in DMF with a Perkin
Elmer UV Lamda−50 spectrophotometer. FT–IR
spectra in KBr disc were recorded in the range
4000–400 cm−1 with a Perkin Elmer spectrum 100
Spectrometer. The cyclic voltammetry was
performed with a CH instruments 660C
electrochemical analyzer and a conventional three
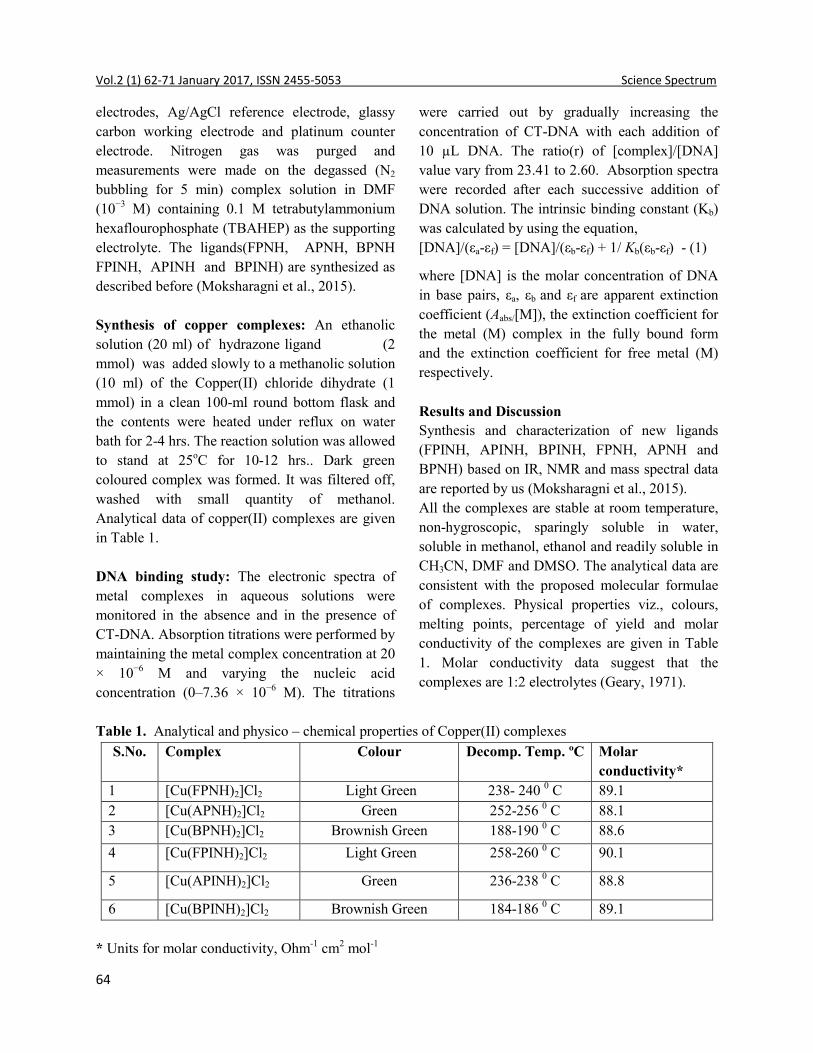
64
Vol.2 (1) 62-71 January 2017, ISSN 2455-5053 Science Spectrum
electrodes, Ag/AgCl reference electrode, glassy
carbon working electrode and platinum counter
electrode. Nitrogen gas was purged and
measurements were made on the degassed (N2
bubbling for 5 min) complex solution in DMF
(10−3 M) containing 0.1 M tetrabutylammonium
hexaflourophosphate (TBAHEP) as the supporting
electrolyte. The ligands(FPNH, APNH, BPNH
FPINH, APINH and BPINH) are synthesized as
described before (Moksharagni et al., 2015).
Synthesis of copper complexes: An ethanolic
solution (20 ml) of hydrazone ligand (2
mmol) was added slowly to a methanolic solution
(10 ml) of the Copper(II) chloride dihydrate (1
mmol) in a clean 100-ml round bottom flask and
the contents were heated under reflux on water
bath for 2-4 hrs. The reaction solution was allowed
to stand at 25oC for 10-12 hrs.. Dark green
coloured complex was formed. It was filtered off,
washed with small quantity of methanol.
Analytical data of copper(II) complexes are given
in Table 1.
DNA binding study: The electronic spectra of
metal complexes in aqueous solutions were
monitored in the absence and in the presence of
CT-DNA. Absorption titrations were performed by
maintaining the metal complex concentration at 20
× 10−6 M and varying the nucleic acid
concentration (0–7.36 × 10⁻⁶ M). The titrations
were carried out by gradually increasing the
concentration of CT-DNA with each addition of
10 µL DNA. The ratio(r) of [complex]/[DNA]
value vary from 23.41 to 2.60. Absorption spectra
were recorded after each successive addition of
DNA solution. The intrinsic binding constant (Kb)
was calculated by using the equation,
[DNA]/(εa-εf) = [DNA]/(εb-εf) + 1/ Kb(εb-εf) - (1)
where [DNA] is the molar concentration of DNA
in base pairs, εa, εb and εf are apparent extinction
coefficient (Aabs/[M]), the extinction coefficient for
the metal (M) complex in the fully bound form
and the extinction coefficient for free metal (M)
respectively.
Results and Discussion
Synthesis and characterization of new ligands
(FPINH, APINH, BPINH, FPNH, APNH and
BPNH) based on IR, NMR and mass spectral data
are reported by us (Moksharagni et al., 2015).
All the complexes are stable at room temperature,
non-hygroscopic, sparingly soluble in water,
soluble in methanol, ethanol and readily soluble in
CH3CN, DMF and DMSO. The analytical data are
consistent with the proposed molecular formulae
of complexes. Physical properties viz., colours,
melting points, percentage of yield and molar
conductivity of the complexes are given in Table
1. Molar conductivity data suggest that the
complexes are 1:2 electrolytes (Geary, 1971).
Table 1. Analytical and physico – chemical properties of Copper(II) complexes
S.No. Complex Colour Decomp. Temp. ºC Molar
conductivity*
1 [Cu(FPNH)2]Cl2 Light Green 238- 240 0 C 89.1
2 [Cu(APNH)2]Cl2 Green 252-256 0 C 88.1
3 [Cu(BPNH)2]Cl2 Brownish Green 188-190 0 C 88.6
4 [Cu(FPINH)2]Cl2 Light Green 258-260 0 C 90.1
5 [Cu(APINH)2]Cl2 Green 236-238 0 C 88.8
6 [Cu(BPINH)2]Cl2 Brownish Green 184-186 0 C 89.1
* Units for molar conductivity, Ohm-1 cm2 mol-1

65
Science Spectrum Vol.2 (1) 62-71 January 2017, ISSN 2455-5053
Electronic spectral studies: The electronic
spectral data of copper (II) complexes are recorded
in dimethylformamide (DMF). Typical electronic
spectrum of [Cu (APNH)2]Cl2 complex is shown
in Fig. 2. The complexes show strong intense
bands in the range 34589-38150 cm-1 are assigned
to intra ligand transitions. One medium intensity
band observed in the range 24235-26320 cm-1 is
due to metal to ligand charge transfer transition
(MLCT). Whereas one broad band observed in the
region 14500-16718 cm-1 is assigned to d-d
transition (Lever, 1984)26 in favour of octahedral
structure. Important electronic spectral bands of
copper (II) complexes are given in Table 2.
Fig. 2. Electronic spectrum of [Cu(APNH)2]Cl2 complex
Table 2. Electronic spectral data (cm-1) of copper (II) complexes.
S.No. Complex π-π*
Transition
CT
Transition
d-d
Transition
1 [Cu(FPNH)2]Cl2 37615 25324 15275
2 [Cu(APNH)2]Cl2 37250 26320 14500
3 [Cu(BPNH)2]Cl2 36500 26145 16325
4 [Cu(FPINH)2]Cl2 34569 24235 16378
5 [Cu(APINH)2]Cl2 34589 24582 16718
6 [Cu(BPINH)2]Cl2 38150 25575 16587

66
Vol.2 (1) 62-71 January 2017, ISSN 2455-5053 Science Spectrum
Infrared spectral studies: IR spectra of
hydrazone ligands are compared with those of
copper complexes to determine donor atoms of
ligand. Important IR spectral bands and their
assignment are given in Table 3. The IR spectra of
the ligands have several prominent bands due to
νN-H and νC=O and νC=N stretching modes. The νN-H
bands are appeared in spectra of all complexes
indicating that the ligands do not undergo
enolization due to complexation. The bands due to
νC=O and νC=N are shifted to lower frequency
suggesting the involvement of azomethine
nitrogen and amide oxygen in chelation. IR data
suggest that the ligands act as neutral tridentate
ligands in all the copper complexes. Based on
molar conductance, electronic and IR spectral
data, a tentative and general structure for the
copper (II) complexes are assigned. A general
structure for complexes is given in Figure 3.
Table 3. IR spectral data of ligands and their copper (II) complexes
Ligand/Complex ν (N-H) ν (C=O) ν (C=N)
FPNH 3496 1670 1610
[Cu(FPNH)2]Cl2 3370 1665 1595
APNH 3211 1662 1605
[Cu(APNH)2]Cl2 3280 1625 1585
BPNH 3352 1691 1602
[Cu(BPNH)2]Cl2 3350 1675 1590
FPINH 3294 1668 1615
[Cu(FPINH)2]Cl2 3362 1662 1601
APINH 3189 1668 1607
[Cu(APINH)2]Cl2 3385 1650 1590
BPINH 3434 1690 1628
[Cu(BPINH)2]Cl2 3385 1675 1605
N
C=N
R1
HN
C
O
Cu
C
O
NH
R1
N
2 Cl-
R2
R2
2+
N=C
Fig.3. A general structure for Copper(II) complexes

67
Science Spectrum Vol.2 (1) 62-71 January 2017, ISSN 2455-5053
ESR Spectral studies: ESR spectra of copper
complexes were recorded in solid state and in
DMF solution at room temperature and at liquid
nitrogen temperature. X-band powder and DMF
solution ESR spectra of [Cu(APNH)2]Cl2
complex are given in Figure 4 .
The spin Hamiltonian, orbital reduction and
bonding parameters of complexes are given in
Table 4. The g|| and g┴ are computed from the
spectra using TCNE free radicals as g marker. The
observed g|| values for complexes {BPNH Cu}, is
less than 2.3 suggesting significant covalent
character of metal ligand bond in agreement with
observation of Kivelson. The g|| and g┴ were more
than 2, corresponding to an axial symmetry. The
trend The g|| > g┴ >ge (2.0023) observed for these
complexes suggests that the unpaired is localized
in the dx2-y
2 orbital (Kivelson et al., 1961) of the
copper ion. The axial symmetry parameter G is
defined as (Narang and Singh, 1996)
G = [�║��.����]
[�┴��.����]
The calculated G values for these complexes
indicate that there are strong interactions between
the copper centers in DMF medium. g||, g┴ , A||, A┴
of complexes and the energies of the d–d
transitions are used to calculate the orbital
reduction parameters (K║, K┴), the bonding
parameter(α2).The factor α2 which is usually taken
as a measure of covalency is evaluated by the
expression,
α2 = A║/ p + ( g|| -2.0023)3/7(g┴ -2.0023) + 0.004
The observed K║ > K┴ relation indicates the
significant in-plane π-bonding.
Fig. 4. X-band powder and DMF solution ESR spectra of [Cu(APNH)2]Cl2 complex at (A) 300K and
(B) at LNT (C) at 300K and (D) at LNT.
Cyclic voltammetric studies: The redox
behavior of the complexes has been investigated
by cyclic voltammetry in DMF using 0.1 M
tetrabutylammonium hexafluorophosphate as
supporting electrolyte. The cyclicvoltammogram
of [Cu (FPNH)2]Cl2 complex is given in Figure
5 and the electrochemical data of copper(II)
complexes are summarized in Table 5.
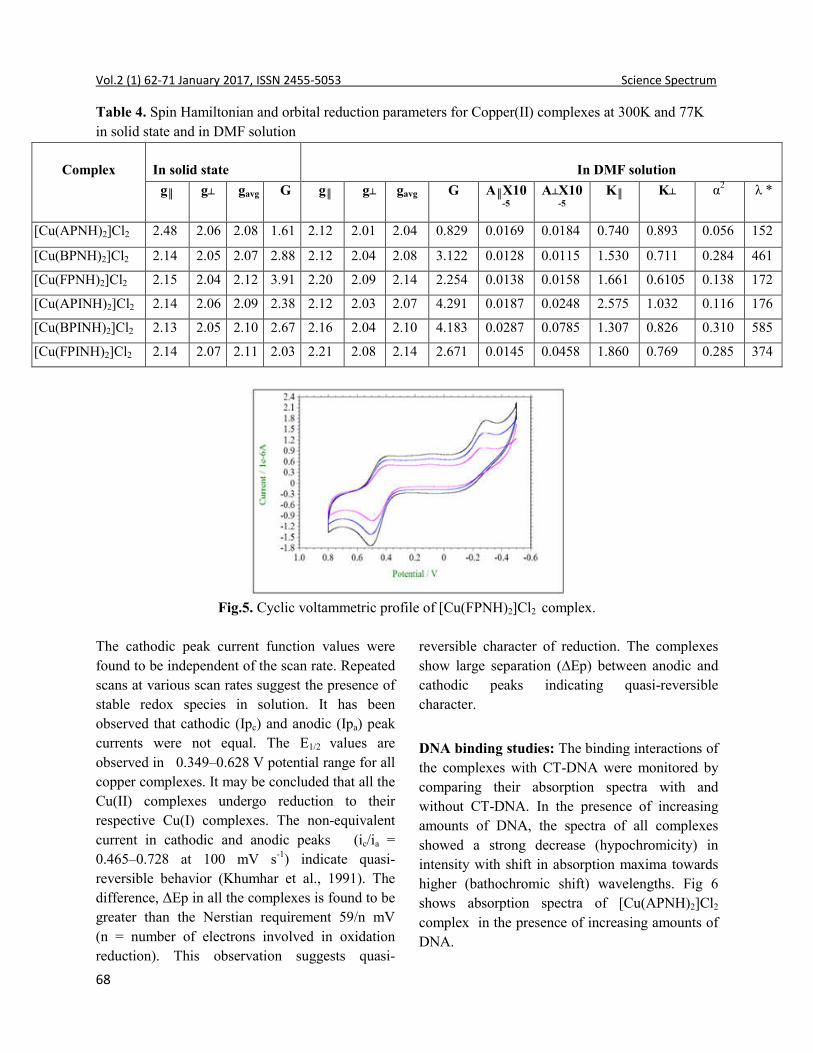
68
Vol.2 (1) 62-71 January 2017, ISSN 2455-5053 Science Spectrum
Table 4. Spin Hamiltonian and orbital reduction parameters for Copper(II) complexes at 300K and 77K
in solid state and in DMF solution
Complex
In solid state
In DMF solution
g║ g┴ gavg G g║ g┴ gavg G A║X10-5
A┴X10-5
K║ K┴ α2 λ *
[Cu(APNH)2]Cl2 2.48 2.06 2.08 1.61 2.12 2.01 2.04 0.829 0.0169 0.0184 0.740 0.893 0.056 152
[Cu(BPNH)2]Cl2 2.14 2.05 2.07 2.88 2.12 2.04 2.08 3.122 0.0128 0.0115 1.530 0.711 0.284 461
[Cu(FPNH)2]Cl2 2.15 2.04 2.12 3.91 2.20 2.09 2.14 2.254 0.0138 0.0158 1.661 0.6105 0.138 172
[Cu(APINH)2]Cl2 2.14 2.06 2.09 2.38 2.12 2.03 2.07 4.291 0.0187 0.0248 2.575 1.032 0.116 176
[Cu(BPINH)2]Cl2 2.13 2.05 2.10 2.67 2.16 2.04 2.10 4.183 0.0287 0.0785 1.307 0.826 0.310 585
[Cu(FPINH)2]Cl2 2.14 2.07 2.11 2.03 2.21 2.08 2.14 2.671 0.0145 0.0458 1.860 0.769 0.285 374
Fig.5. Cyclic voltammetric profile of [Cu(FPNH)2]Cl2 complex.
The cathodic peak current function values were
found to be independent of the scan rate. Repeated
scans at various scan rates suggest the presence of
stable redox species in solution. It has been
observed that cathodic (Ipc) and anodic (Ipa) peak
currents were not equal. The E1/2 values are
observed in 0.349–0.628 V potential range for all
copper complexes. It may be concluded that all the
Cu(II) complexes undergo reduction to their
respective Cu(I) complexes. The non-equivalent
current in cathodic and anodic peaks (ic/ia =
0.465–0.728 at 100 mV s-1) indicate quasi-
reversible behavior (Khumhar et al., 1991). The
difference, ΔEp in all the complexes is found to be
greater than the Nerstian requirement 59/n mV
(n = number of electrons involved in oxidation
reduction). This observation suggests quasi-
reversible character of reduction. The complexes
show large separation (∆Ep) between anodic and
cathodic peaks indicating quasi-reversible
character.
DNA binding studies: The binding interactions of
the complexes with CT-DNA were monitored by
comparing their absorption spectra with and
without CT-DNA. In the presence of increasing
amounts of DNA, the spectra of all complexes
showed a strong decrease (hypochromicity) in
intensity with shift in absorption maxima towards
higher (bathochromic shift) wavelengths. Fig 6
shows absorption spectra of [Cu(APNH)2]Cl2
complex in the presence of increasing amounts of
DNA.

69
Science Spectrum Vol.2 (1) 62-71 January 2017, ISSN 2455-5053
Table 5. Cyclic voltammetric profile of copper (II) complexes
Fig. 6. Absorption spectra of [Cu(APNH)2]Cl2 complex in the absence and in the presence of increasing
concentration of CT-DNA; [top most spectrum is recorded in the absence of DNA and below spectra on
addition of 10µl DNA each time. A plot of [DNA] / (Ea - Ef) vs [DNA] is shown in the insert]
The binding constant values are given in Table 6.
On addition of DNA, the absorbance of the
complexes decreases (hypochromism) and
absorption maximum of all complexes is shifted to
higher wavelength (bathochromism).The binding
of an intercalative molecule to DNA is generally
characterized by large hypochromism and
significant red shift due to strong stacking
interactions of aromatic chromophore between
base pairs of DNA. The extent of hypochromism
and red shift is commonly consistent with the
strength of intercalative interaction (Usha and
Palaniander, 1994). However, in the present case,
the magnitude of hypochromism (up to 25.62 %)
is as expected for typical classical intercalators.
The binding constants (Table 6) suggest that the
complexes bind DNA very strongly via
intercalation.
S.
No.
Complex Redox
couple Peak Potentials (V) ΔEP
(mv)
E1/2 -ic/ ia log kca ΔG◦b
Epc Epa
1 [Cu(APNH)2]Cl2 II/I 0.368 0.549 181 0.458 0.692 0.186 1067
2 [Cu(BPNH)2]Cl2 II/I 0.382 0.492 110 0.628 0.719 0.301 1728
3 [Cu(FPNH)2]Cl2 II/I 0.292 0.516 224 0.404 0.679 0.152 872
4 [Cu(APINH)2]Cl2 II/I 0.212 0.487 275 0.349 0.728 0.124 712
5 [Cu(BPINH)2]Cl2 II/I 0.301 0.556 255 0.428 0.465 0.138 1136
6 [Cu(FPINH)2]Cl2 II/I 0.312 0.462 150 0.387 0.558 0.221 1286

70
Vol.2 (1) 62-71 January 2017, ISSN 2455-5053 Science Spectrum
Table 6. Electronic absorption data upon addition of CT-DNA to Cu(II) complexes.
Conclusions
Copper(II) complexes of a series of nicotinoyl and
isonicotinoyl hydrazones have been synthesized.
These complexes are characterized based on
conductivity measurements, UV-Vis, IR and ESR
spectral studies. Electrochemical behavior of these
complexes has been studied by using cyclic
voltammetry. DNA binding properties are
uncovered using UV-Visible spectrophotometry.
Absorption spectral data and binding constants
(Kb) suggest that the complexes bind DNA
strongly via intercalation.
Acknowledgements:
One of the authors (Chandrasekhar) is thankful to
University Grants Commission, New Delhi, India
for the award of BSR Junior Research Fellowship.
The authors are thankful to UGC, New Delhi
(Sanction No. Lr.No.F40-80/2011 (SR)) for
financial support. The authors also thank UGC and
DST for providing equipment facility under SAP
and FIST programs respectively. KHR is thankful
to UGC for the sanction of one-time grant
(Sanction Lr. No.F.19-106/2013 (BSR)) for
financial support.
References
1. A. A. Khumhar, S. B. Rendye, D. X. West, A.
E. Libert, Trans. Met. Chem, 1991, 16, 276-
281.
2. A. B. P. Lever, Inorganic electronic
spectroscopy, 2nd. Edn,(Elsevier, Amsterdam),
1984.
3. A.A. Travers, DNA-protein interactions,
London: 1993 Chapman and Hall.
4. A.E. Kümmerle, J.M. Raimundo, C.M. Leal,
G.S. Da Silva, T. L. Balliano, M. A. Pereira,
C.A. De Simone, R. T.Sudo, G. Zapata-Sudo,
C.A. M. Fraga, E.J. Barreiro, Eur J Med
Chem, 2009, 44, 4004- 4009.
5. B. Bottari , R. Maccari , F. Monforte , E.
Ottanar, E. Rotondo , M.G. Vitoria, Bioinorg
Med. Chem. Lett, 2000, 10, 657 - 660.
6. B. Moksharagni, K. Dileep Kumar, S.
Chandrasekhar K. Hussain Reddy, Int. J.
Pharm. Bio. Sci., 2015, 6, 11 – 18.
7. D. Rehder, Inorg. Chem. Commun, 2003, 6,
604-617.
8. D. Kivelson, R. Neiman, J. Chem. Phys, 1961,
35, 149-155.
9. D. S. Sigman, C.B. Chen, Annual Review of
Biochemistry, 1990, 59, 207–236.
10. D.S.Sigman, D.R.Graham, V.D’Aurura, A.M.
Stern, The Journal of Biological Chemistry,
1979, 254, 12269–12272.
Sl.
No.
Complex λmax Δλ/nm H% Kb-1 (M-1)
Free Bound
1 [Cu(APNH)2]Cl2 373 374 1 +25.62 3.21 x 10⁶
2 [Cu(BPNH)2]Cl2 371 372 1 +17.52 2.81 x 10⁶
3 [Cu(FPNH)2]Cl2 368 372 4 +5.03 4.18 x 10⁶
4 [Cu(APINH)2]Cl2 358 358 0 +4.81 4.51 x 10⁶
5 [Cu(BPINH)2]Cl2 355 358 3 +8.79 2.32 x 10⁶
6 [Cu(FPINH)2]Cl2 356 356 0 +11.36 3.51 x 10⁶

71
Science Spectrum Vol.2 (1) 62-71 January 2017, ISSN 2455-5053
11. G. Verquin, G. Fourtane, M. Bria, E.
Zhilinskaya, E. Abi-Azad , A. Baldeyron ,
C.Bailly, J.L. Bernier, J Biol. Inorg Chem,
2004, 9, 345 - 350.
12. H.I. Hall, K. Taylor, M.C. Miller, X. Dothan,
M.A. Khan, F.M. Bouet, Anticancer Res.,
1997, 17, 2411–2418.
13. J. A. Cowan, Current Opinion in Chemical
Biology, 2001, 5, 634–642.
14. J.R.J. Sorenson., in Metal Ions in Biological
Systems (ed. Sigel, H.), Marcel Dekker, New
York, 1982, 14, 77.
15. K. K. Narang, P. V. Singh, Transition. Met.
Chem, 1996, 21, 507-511.
16. K.H. Thompson, C. Orvig, Coord. Chem.
Rev., 219 (2001) 1033-1053.
17. M. Pragathi M, Hussain Reddy, Inorg. Chim.
Acta, 2014, 41, 174- 186.
18. N. Raman, A. Kulandaisamy, K. J.
Subramanian, Synt React Inorg Met-Org Chem,
2004, 34, 17- 24.
19. P. Mazza, M. Orcesi, C. Pelizzi, G. Pelizzi, G.
Predieri, F. Zaini, J. Inorg. Biochem, 1992, 48,
251-270.
20. P. Murali Krishna, K. Hussain Reddy, J.P.
Pandeya, S. Dayananda Transition Met.
Chem, 2008, 33, 661-668.
21. R.K. Crouch, T. W. Kensler, L.W. Oberley,
J.R.J. Sorenson, in Possible Medicinal Uses
of Copper Complexes:Biological and
Inorganic Copper Chemistry (eds Karlin, K. D
and Zubieta, J.), Adenine Press, NY, 1986.
22. S. Apelgot, J. Coppey, A. Fromentin, E.
Guille, M.F. Poupon, A. Roussel, Anticancer
Res., 1986, 6, 159 – 164.
23. S. Chandrasekhar, K. Hussain Reddy,
International Journal of Pharmaceutical
Sciences and Research, 2016, 7, 4204-4213.
24. S. Ianelli, P. Mazza, M. Orcesi, C. Pelizzi, G.
Pelizzi, G. Predieri, F. Zaini, J. Inorg
Biochem, 1995, 60, 89- 108.
25. S. Rollas, S.K. Güniz , Molecules, 2007, 12,
1910-1939.
26. S. Usha, M. Palaniandavar, J. Chem. Soc.
Dalton.Trans., 1994, 15, 2277- 2283.
27. S.S. Renade, V.K. Panday, Sci. Total Environ.
1984, 40, 245-257.
28. W.J. Geary, J. Coord. Chem. Rev, 1971, 7,
81-122.
29. Y. Shechter, I. Goldwash , M. Micronchik , M.
Fridkin , D. Gefel , Coord Chem Rev., 2003,
237, 3-11.
30. Z. Cesur, N. Buyuktimkin, S. Derbentli ,
Archiov der Pharmazie, 1990, 323, 41-45.
72
Vol.2 (1) 72-76 January 2017, ISSN 2455-5053 Science Spectrum
Total Coloring and Chromatic Number of Strong Intuitionistic Fuzzy Graph
S. Narayanamoorthy∗ and P. Karthick Department of Mathematics, Bharathiar University, Coimbatore - 641 046, India.
*For Correspondence: [email protected]
Abstract
In this paper, we introduce the concept of k-fuzzy
total coloring on strong intutionistic fuzzy graph.
We determine the chromatic number for strong
intuitionistic fuzzy graph G∗ k, with intuitionistic
fuzzy set of vertices and intuitionistic fuzzy set of
edges in terms of family of intuitionistic fuzzy
sets.
Keywords: intuitionistic fuzzy graph, fuzzy total
coloring, chromatic number.
2010 Mathematics Subject Classification:
05C65, 68R10, 05C72.
Introduction
Graph coloring serves as a model for conflict
resolution in problems of the combinatorial
optimization. A k- coloring φk is a coloring
function with no more than k different colors φk :
X → {1, 2, ..., k}. A graph is k-colored if it admits
a k - coloring. The chromatic number χ (G) of a
graph G is the minimum k for which G is k-
colorable. As an advancement fuzzy coloring of a
fuzzy graph was defined by authors Eslahchi and
Onagh in 2004, and later developed by them as
fuzzy vertex coloring in 2006. This fuzzy vertex
coloring was extended to fuzzy total coloring in
terms of family of fuzzy sets by S. Lavanya and R.
Sattanathan in 2009. The k-fuzzy total coloring to
complete fuzzy graph introduced by V. Nivethana
and A. Parvathi (2013).
In 1986, K.T. Atanassov (Atanassov, 1999)
introduced the concept of intuitionistic fuzzy set as
a generalization of fuzzy sets. Intuitionistic fuzzy
set has been applied to a wide variety of fields
including computer science, engineering,
mathematics, medicine, chemistry and economics.
Muhammad Akram, Bijan Davvaz introduced the
notion of strong intuitionistic fuzzy graph in
(Akram and Bijan, 2012). In this paper, we define
fuzzy total coloring to strong intuitionistic fuzzy
graph satisfying certain conditions. The fuzzy total
chromatic number is the minimum value of k such
that k-fuzzy total coloring exists. Here we consider
strong intuitionistic fuzzy graph by taking
intuitionistic fuzzy set of vertices and intuitionistic
fuzzy set of edges.
Preliminary definitions
In this section, we discuss some basic notations
and definitions used throughout this paper, G
denotes graph, Gˆ denotes fuzzy graph, Gˆk
denotes complete fuzzy graph, G∗ denotes
intuitionistic fuzzy graph, G∗k denotes strong
intuitionistic fuzzy graph.
Definition.1
Let X be a nonempty set. A fuzzy set A in X is
characterized by its membership function
µA : X → [0, 1] and µA(x) is interpreted as the
degree of membership of element x in fuzzy set A
for each x ∈ X.
Definition.2
Let X be a finite nonempty set. The triple G^ = (X,
σ, µ) is called a fuzzy graph on X, where σ
and µ are fuzzy sets on X and E (X × X)
respectively, such that µ({x, y}) ≤ min{σ(x),
σ(y)}for all x, y ∈ X. We use µ(xy) for µ({x, y}) .
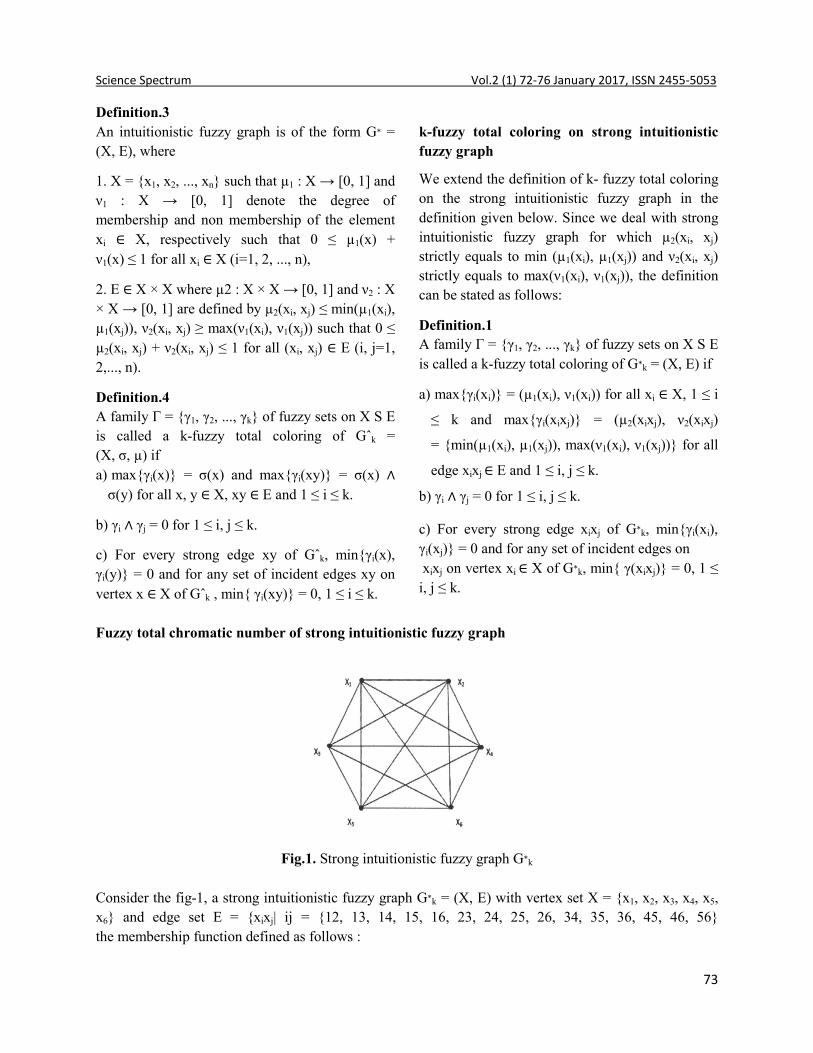
73
Science Spectrum Vol.2 (1) 72-76 January 2017, ISSN 2455-5053
Definition.3
An intuitionistic fuzzy graph is of the form G∗ =
(X, E), where
1. X = {x1, x2, ..., xn} such that µ1 : X → [0, 1] and
ν1 : X → [0, 1] denote the degree of
membership and non membership of the element
xi ∈ X, respectively such that 0 ≤ µ1(x) +
ν1(x) ≤ 1 for all xi ∈ X (i=1, 2, ..., n),
2. E ∈ X × X where µ2 : X × X → [0, 1] and ν2 : X
× X → [0, 1] are defined by µ2(xi, xj) ≤ min(µ1(xi),
µ1(xj)), ν2(xi, xj) ≥ max(ν1(xi), ν1(xj)) such that 0 ≤
µ2(xi, xj) + ν2(xi, xj) ≤ 1 for all (xi, xj) ∈ E (i, j=1,
2,..., n).
Definition.4
A family Γ = {γ1, γ2, ..., γk} of fuzzy sets on X S E
is called a k-fuzzy total coloring of Gˆk =
(X, σ, µ) if
a) max{γi(x)} = σ(x) and max{γi(xy)} = σ(x) ∧
σ(y) for all x, y ∈ X, xy ∈ E and 1 ≤ i ≤ k.
b) γi ∧ γj = 0 for 1 ≤ i, j ≤ k.
c) For every strong edge xy of Gˆk, min{γi(x),
γi(y)} = 0 and for any set of incident edges xy on
vertex x ∈ X of Gˆk , min{ γi(xy)} = 0, 1 ≤ i ≤ k.
k-fuzzy total coloring on strong intuitionistic
fuzzy graph
We extend the definition of k- fuzzy total coloring
on the strong intuitionistic fuzzy graph in the
definition given below. Since we deal with strong
intuitionistic fuzzy graph for which µ2(xi, xj)
strictly equals to min (µ1(xi), µ1(xj)) and ν2(xi, xj)
strictly equals to max(ν1(xi), ν1(xj)), the definition
can be stated as follows:
Definition.1
A family Γ = {γ1, γ2, ..., γk} of fuzzy sets on X S E
is called a k-fuzzy total coloring of G∗k = (X, E) if
a) max{γi(xi)} = (µ1(xi), ν1(xi)) for all xi ∈ X, 1 ≤ i
≤ k and max{γi(xixj)} = (µ2(xixj), ν2(xixj)
= {min(µ1(xi), µ1(xj)), max(ν1(xi), ν1(xj))} for all
edge xixj ∈ E and 1 ≤ i, j ≤ k.
b) γi ∧ γj = 0 for 1 ≤ i, j ≤ k.
c) For every strong edge xixj of G∗k, min{γi(xi),
γi(xj)} = 0 and for any set of incident edges on
xixj on vertex xi ∈ X of G∗k, min{ γ(xixj)} = 0, 1 ≤
i, j ≤ k.
Fuzzy total chromatic number of strong intuitionistic fuzzy graph
Fig.1. Strong intuitionistic fuzzy graph G∗
k
Consider the fig-1, a strong intuitionistic fuzzy graph G∗k = (X, E) with vertex set X = {x1, x2, x3, x4, x5,
x6} and edge set E = {xixj| ij = {12, 13, 14, 15, 16, 23, 24, 25, 26, 34, 35, 36, 45, 46, 56}
the membership function defined as follows :

74
Vol.2 (1) 72-76 January 2017, ISSN 2455-5053 Science Spectrum
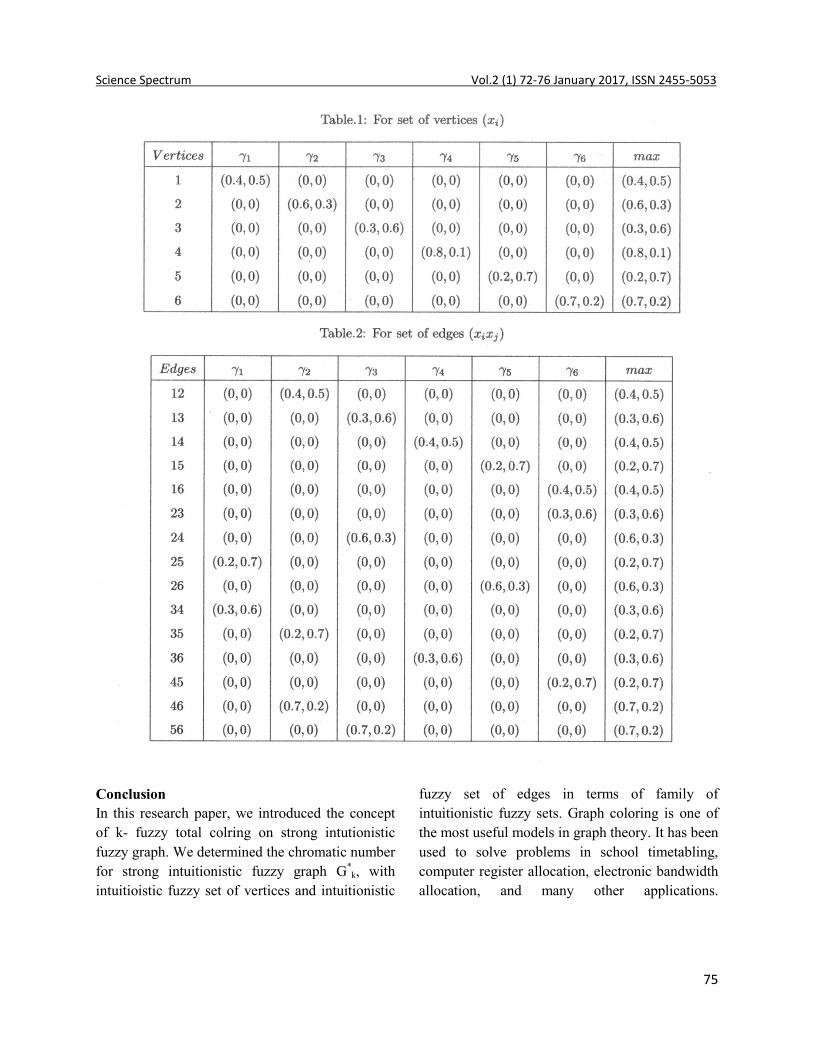
75
Science Spectrum Vol.2 (1) 72-76 January 2017, ISSN 2455-5053
Conclusion
In this research paper, we introduced the concept
of k- fuzzy total colring on strong intutionistic
fuzzy graph. We determined the chromatic number
for strong intuitionistic fuzzy graph G*k, with
intuitioistic fuzzy set of vertices and intuitionistic
fuzzy set of edges in terms of family of
intuitionistic fuzzy sets. Graph coloring is one of
the most useful models in graph theory. It has been
used to solve problems in school timetabling,
computer register allocation, electronic bandwidth
allocation, and many other applications.

76
Vol.2 (1) 72-76 January 2017, ISSN 2455-5053 Science Spectrum
References
1. A. Shannon, K.T. Atanassov, A first step to a
theory of the intuitionistic fuzzy graphs,
Proceeding of FUBEST (Lakov, D., Ed.),
Sofia, 1994, 59-61.
2. Eslahchi, B. N. Onagh, Vertex Strength of
Fuzzy Graphs, International Journal of
Mathematics and Mathematical Sciences,
2006.
3. H. P. Yap, Total Colorings of Graphs, Lecture
Notes in Mathematics, Springer-Verlag,
Berlin, 1996.
4. K. T. Atanassov, Intuitionistic Fuzzy Sets,
Theory and Applications, Springer, 1999.
5. M. Akram, D. Bijan, Strong intuitionistic
fuzzy graphs, Filomat 26:1(2012), 177-196.
6. S. Lavanya, R. Sattanathan, Fuzzy Total
Coloring Of Fuzzy Graphs, International
Journal of Information Technology and
Knowledge Management, Vol. 2, 2009, 37-39.
7. Siamak Firouzian, Mostafa Nouri Jouybari,
Coloring fuzzy graphs and traffic light
problem, The Journal of Mathematics and
Computer Science, Vol. 2, 2011, 431-435.
8. Susana Munoza, M. Teresa Ortunoa, Javier
Ramrezb, Javier Yaneza, Coloring fuzzy
graphs, 33, 2005, 211-221.
9. V. Nivethana, A. Parvathi, Fuzzy total
coloring and chromatic number of a complete
fuzzy graph, International Journal of
Emerging Trends in Engineering and
Development, Vol. 6, 2013, 377-384.

Instructions to Author The Andhra Pradesh Akademi of Sciences is established with an objective to provide a common platform for Scientists, Students and Researchers for disseminating the knowledge to the Society. APAS has started a scientific journal in view of the vast developments in Science and to proresearchers, an official scientific journal entitled “Science Spectrum” has been started. The researchers are requested to contribute Research papers/Reviews/Short Communications in various fields of Science. Thof format of the journal and address for correspondence have been provided hereunder.Invitation to Research Papers Research Articles are invited from researchers in Academic Institutions, Scientific laboratories and other institutions including industry pertaining to any of the following broad scientific fields including interdisciplinary areas: • Physical Sciences (PS) • Mathematical Sciences (MS) • • Agricultural Sciences (AS) • Life Sciences (LS) • Engineering Sciences (ES) • IT & Computer Sciences (IT &CS) • Earth including Ocean Sciences (EOS)• Space and Atmospheric Sciences (SAS)Guidelines for Submission Title: It should be bold, 14 point, centered to theAuthors: Names should be in bold, 12 point, in the order corresponding author(s) name should be marked with a ‘*’ and provided with his/her email address.Address: It should be normal, 10 point, with full postal details of department, institute.Abstract: A short abstract, 12 point, 10Keywords: A list of 5-6 keywords to be presented below the abstract, in 10 poText: The text, 12 point, should be divided into subConclusions, Acknowledgements, References.References should be provided in parentheses with author name and year in text of the MS (for exaet al., 2008; Hecht and Huc, 2007). The format of the references to be given in references is as follows: M. Siedlecka, G. Goch, A. Ejchart, H. Sticht, A. Bierzynski, Proc. Natl. Acad. Sci. USA 1999, 96, 903A.L. Jochim, P. S. Arora, Acc. Chem. Res. 2008, 41, 1289Properties and Applications, Wiley-VCH: Weinheim, Germany, 2007. (b) C. Shellman, In Protein Folding; Jaenicke, R., Ed.; Elsevier: Amsterdam, 1980, pp 53 64Mode of Submission: The manuscript should be submitted essentially as a soft copy with all high quality figures/digital images/photographs/ statistical diagrams or charts/tables etc., along with a covering letter through email: [email protected]. The cover letter should describe the Title, Authors, their email IDscertifying the following statements: • The manuscript is submitted exclusively to APAS. The contents partially or totally were not submitted to any other journal simultaneously. • I have taken the consent of all the co• I have verified the manuscript for plagiarism before submitting and I have obtained necessary copyright permissions wherever necessary. Reviewers: The authors should provide names of 4 experts/reviewers in respective subjective area, along with the details of address, phone/fax / e mail for consideration of the Editorial Board. The manuscripts are to be reviewed by two referees and positive assessment from both the referees is essential for final acceptance.Short Research Communications: These communications cover the preliminary research findings from the authors own research work. They are fast-tracked for immediate public
Dr. I.V. Murali KrishnaPhone: +91 863 2293806; Email
For Individuals: Copy of the Publication Rs. 100/Institutions / Organizations / Universities / Colleges: i) Annual Subscription - ii) Life Subscription
Andhra Pradesh Akademi of Sciences, Amaravati
of Sciences is established with an objective to provide a common platform for Scientists, Students and Researchers for disseminating the knowledge to the Society. APAS has started a scientific journal in view of the vast developments in Science and to provide an opportunity for Scientists and young researchers, an official scientific journal entitled “Science Spectrum” has been started. The researchers are requested to contribute Research papers/Reviews/Short Communications in various fields of Science. Thof format of the journal and address for correspondence have been provided hereunder.
Research Articles are invited from researchers in Academic Institutions, Scientific laboratories and other industry pertaining to any of the following broad scientific fields including interdisciplinary
Mathematical Sciences (MS) • Chemical Sciences (CS) al Sciences (AS) • Life Sciences (LS) • Medical & Pharmaceutical Sciences (MPS)
• Engineering Sciences (ES) • IT & Computer Sciences (IT &CS) • Earth including Ocean Sciences (EOS)• Space and Atmospheric Sciences (SAS)
It should be bold, 14 point, centered to the page and brief in a maximum of two lines. Names should be in bold, 12 point, in the order - family name, middle name and last name. The
corresponding author(s) name should be marked with a ‘*’ and provided with his/her email address.should be normal, 10 point, with full postal details of department, institute.
A short abstract, 12 point, 10-15 lines (~100-150 words) describing the salient features.6 keywords to be presented below the abstract, in 10 point.
The text, 12 point, should be divided into sub-headings, such as: Introduction, Results and Discussions, Conclusions, Acknowledgements, References.
should be provided in parentheses with author name and year in text of the MS (for exaet al., 2008; Hecht and Huc, 2007). The format of the references to be given in references is as follows: M. Siedlecka, G. Goch, A. Ejchart, H. Sticht, A. Bierzynski, Proc. Natl. Acad. Sci. USA 1999, 96, 903
, P. S. Arora, Acc. Chem. Res. 2008, 41, 1289-1300. S. Hecht, I. Huc, (Eds.), Foldamers: Structure, VCH: Weinheim, Germany, 2007. (b) C. Shellman, In Protein Folding; Jaenicke,
R., Ed.; Elsevier: Amsterdam, 1980, pp 53 64. The manuscript should be submitted essentially as a soft copy with all high quality
figures/digital images/photographs/ statistical diagrams or charts/tables etc., along with a covering letter through [email protected]. The cover letter should describe the Title, Authors, their email IDs
• The manuscript is submitted exclusively to APAS. The contents partially or totally were not submitted to any
• I have taken the consent of all the co-authors before submitting the work, as the corresponding author.• I have verified the manuscript for plagiarism before submitting and I have obtained necessary copyright
The authors should provide names of 4 experts/reviewers in respective subjective area, along with the details of address, phone/fax / e mail for consideration of the Editorial Board. The manuscripts are to be reviewed
ees and positive assessment from both the referees is essential for final acceptance.Short Research Communications: These communications cover the preliminary research findings from the authors
tracked for immediate publications.
Dr. I.V. Murali Krishna, Editor of Publications Phone: +91 863 2293806; Email - [email protected]
Journal Subscription
For Individuals: Copy of the Publication Rs. 100/- per issue Institutions / Organizations / Universities / Colleges:
Rs. 2000/- - Rs. 7500/-
Andhra Pradesh Akademi of Sciences, AmaravatiJournal of APAS “Science Spectrum”
of Sciences is established with an objective to provide a common platform for Scientists, Students and Researchers for disseminating the knowledge to the Society. APAS has started a scientific
vide an opportunity for Scientists and young researchers, an official scientific journal entitled “Science Spectrum” has been started. The researchers are requested to contribute Research papers/Reviews/Short Communications in various fields of Science. The details
Research Articles are invited from researchers in Academic Institutions, Scientific laboratories and other industry pertaining to any of the following broad scientific fields including interdisciplinary
& Pharmaceutical Sciences (MPS) • Engineering Sciences (ES) • IT & Computer Sciences (IT &CS) • Earth including Ocean Sciences (EOS)
family name, middle name and last name. The corresponding author(s) name should be marked with a ‘*’ and provided with his/her email address.
150 words) describing the salient features.
headings, such as: Introduction, Results and Discussions,
should be provided in parentheses with author name and year in text of the MS (for example, Siedlecka et al., 2008; Hecht and Huc, 2007). The format of the references to be given in references is as follows: M. Siedlecka, G. Goch, A. Ejchart, H. Sticht, A. Bierzynski, Proc. Natl. Acad. Sci. USA 1999, 96, 903-908. (b) A. Patgiri,
1300. S. Hecht, I. Huc, (Eds.), Foldamers: Structure, VCH: Weinheim, Germany, 2007. (b) C. Shellman, In Protein Folding; Jaenicke,
The manuscript should be submitted essentially as a soft copy with all high quality figures/digital images/photographs/ statistical diagrams or charts/tables etc., along with a covering letter through
[email protected]. The cover letter should describe the Title, Authors, their email IDs and
• The manuscript is submitted exclusively to APAS. The contents partially or totally were not submitted to any
authors before submitting the work, as the corresponding author. • I have verified the manuscript for plagiarism before submitting and I have obtained necessary copyright
The authors should provide names of 4 experts/reviewers in respective subjective area, along with the details of address, phone/fax / e mail for consideration of the Editorial Board. The manuscripts are to be reviewed
ees and positive assessment from both the referees is essential for final acceptance. Short Research Communications: These communications cover the preliminary research findings from the authors
Andhra Pradesh Akademi of Sciences, Amaravati


![Math in Science - Mrs. Moore's Physics-Lyford HS...Math in Science [Page 2 of 5] Physics 1.3 – Math in Science Significant Figures • Significant figures – a method of reporting](https://static.documents.pub/doc/80x56/5fc9c88934294d7640473cdf/math-in-science-mrs-moores-physics-lyford-hs-math-in-science-page-2-of.jpg)


