

Analytics in Higher Education: A Closer Look at Online Learning Scott James Data Scientist, Hobsons
Analytics in Higher Ed
Learning Analytics Learner Analytics Academic Analytics Enrollment Analytics Marketing Analytics

Data and Analytics
Raw Data Descriptive Statistics (Descriptive Analytics) Predictive Modeling (Predictive Analytics) Explanatory Modeling (Prescriptive Analytics)

Raw Data
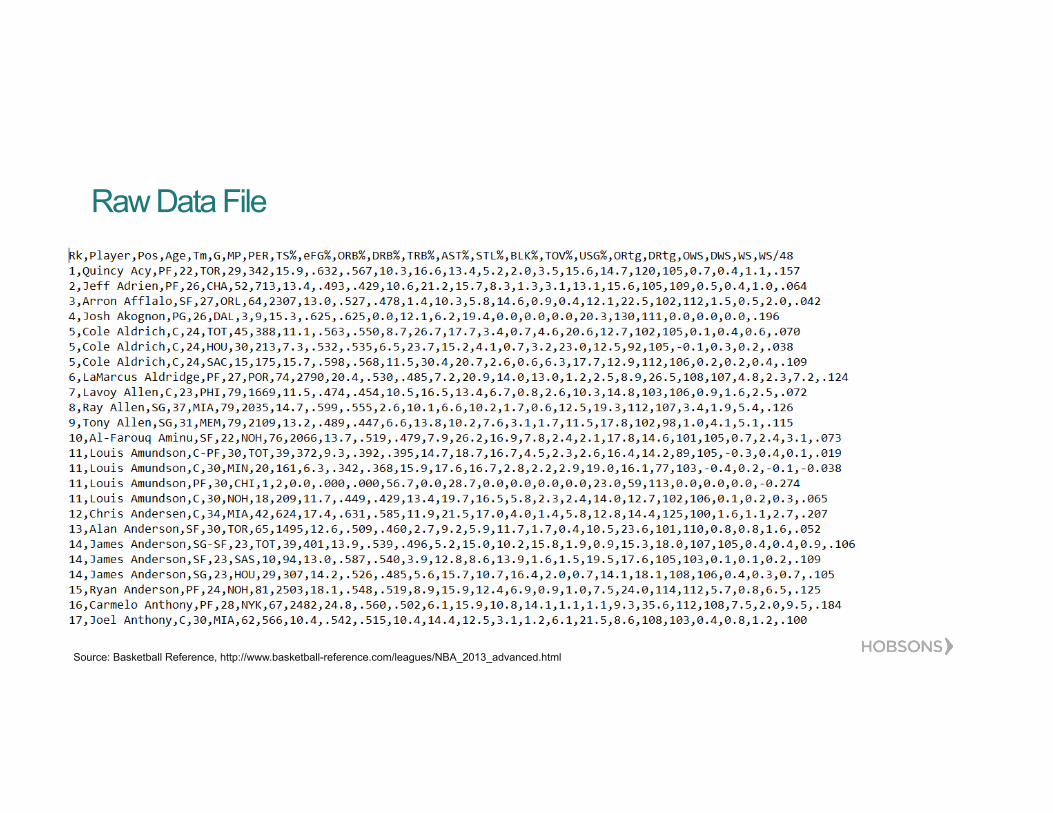
Raw Data File
Source: Basketball Reference, http://www.basketball-reference.com/leagues/NBA_2013_advanced.html

Raw Data Questions for Higher Ed
• How is data stored at your institution?
• Is academic data mapped to financial data? Student involvement data?
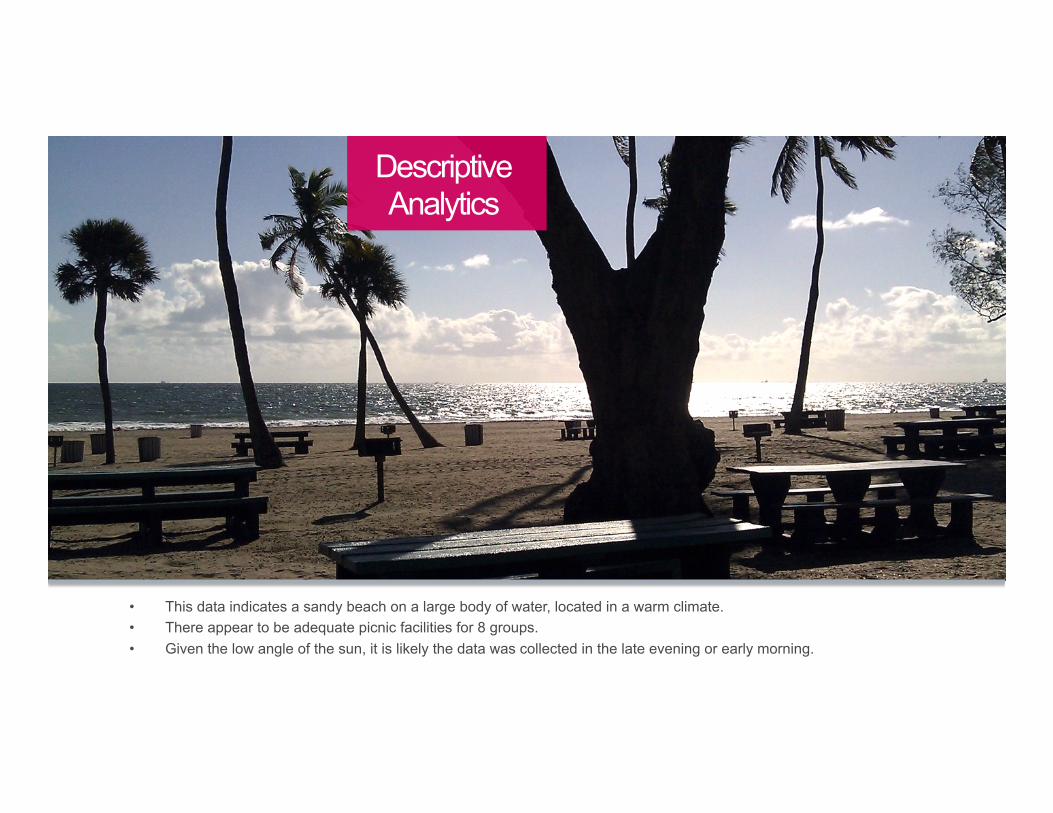
• This data indicates a sandy beach on a large body of water, located in a warm climate. • There appear to be adequate picnic facilities for 8 groups. • Given the low angle of the sun, it is likely the data was collected in the late evening or early morning.
Descriptive Analytics

Descriptive Questions for Higher Education
• How have second year retention rates changed over the past five years?
• How many of our current students are adult learners?
• What was last year’s retention rate for adult minority students?
• What percent of fully online students are part-time?

Notes on Example Data
• Contains a random sample of 15,000 students from a four year university who first enrolled between 2009 and 2014
– 10,000 past students to explore past data and build a model, and 5,000 ‘current’ students to build predictions for • Retention rates and predictions are based on retention to a second year
• Credits attempted and part-time/full time status are taken from a student’s first fall or spring term
• Fully Online: Students who took 100% of their course attempts in an online setting
• Fully Onground: Students who took 100% of their course attempts on-campus
• All Others: Students who took both online and onground courses, or courses in other delivery modes such as hybrid courses
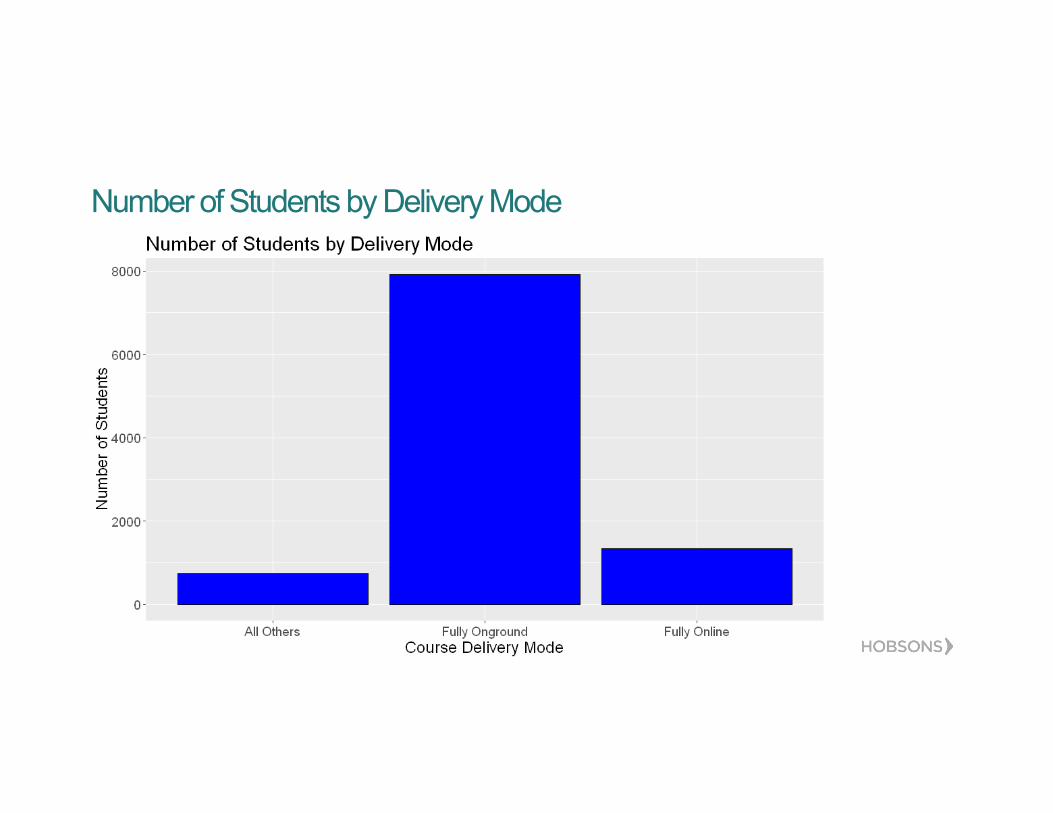
Number of Students by Delivery Mode

Percent of Students who are 25 and Older by Delivery Mode

Percent of Students who are Part-Time by Delivery Mode

Second Year Retention by Delivery Mode

• 80% chance that sunset occurred within an hour of this data collection point. • 85% chance that none of the grills are in use. • 90% chance of sunburn if the data collector is Scott.
Predictive Analytics

Prediction Questions for Higher Education
• How likely is a student to retain to the next year?
• How likely is a student to pass College Algebra?
• How likely is a student to graduate in four years?

Predicted Retention by Delivery Mode
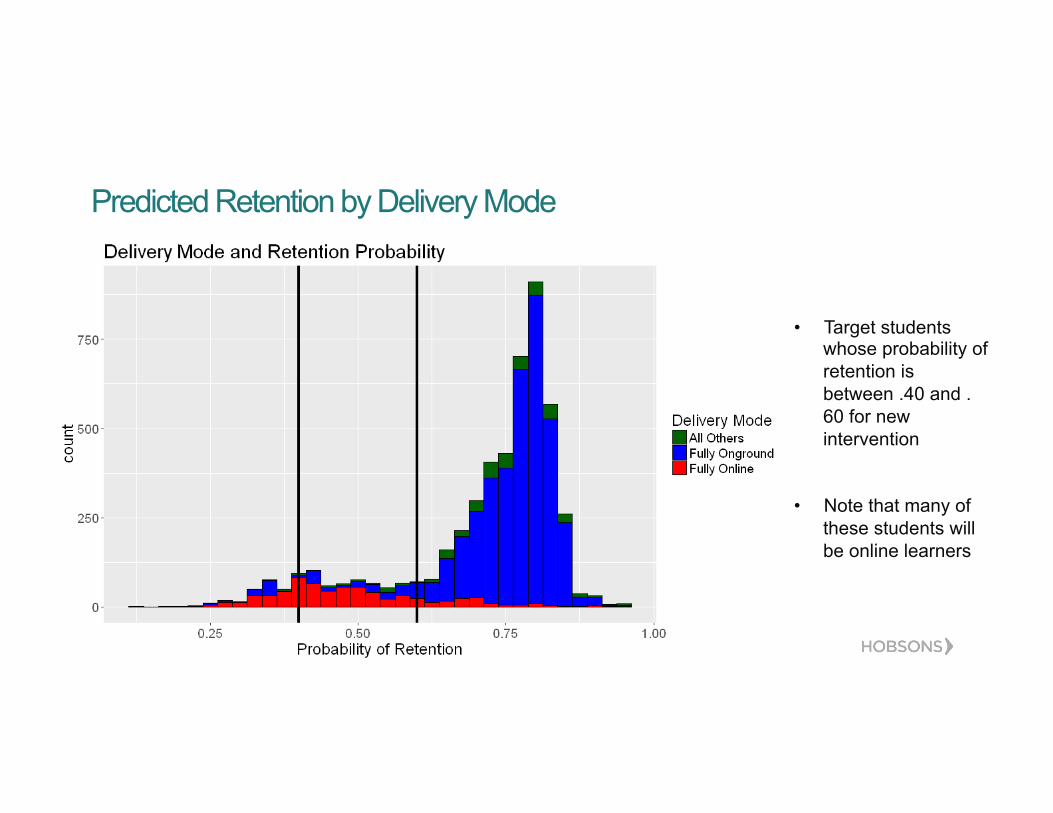
Predicted Retention by Delivery Mode
• Target students whose probability of retention is between .40 and .60 for new intervention
• Note that many of
these students will be online learners

Predictive Analytics Recap
• We used predictive analytics to score students by their probability of second year retention
• Used the probabilities to target students for new interventions
• Identified that many of the targeted students are online learners
• Will likely want to tailor at least one intervention to meet the specific needs of online learners
• Retention probabilities and individual student characteristics can be great information for advisors
Beware of the Jump to Causation
Causation

Jumping to Causation
Take action by: • Nudging online learners to take courses in person?
• Eliminating online degree offerings? We have identified online students are less likely to be retained. We have not identified a causal mechanism that explains this

• When you visit this location, wear casual attire appropriate for the beach in a warm climate. • Bring your own picnic supplies and food if you plan to eat. • Scott should apply sunscreen liberally.
Prescriptive Analytics

Prescriptive Questions for Higher Education
• How effective is the current tutoring program for entry math courses?
• What students benefit the most from student success courses? • How does online course taking impact a student’s chances of retention once other factors are
accounted for?
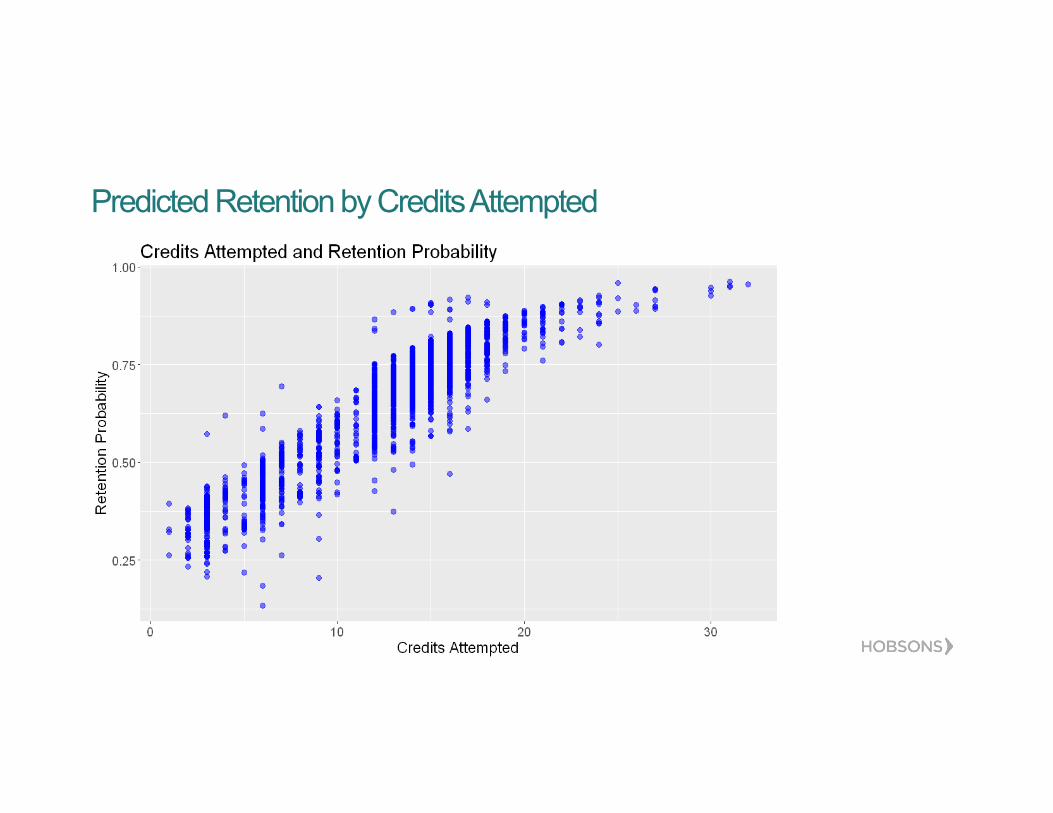
Predicted Retention by Credits Attempted

Predicted Retention by Credits Attempted and Delivery Mode

Predicted Retention by Credits Attempted
12 or more credits attempted
Less than 12 credits attempted
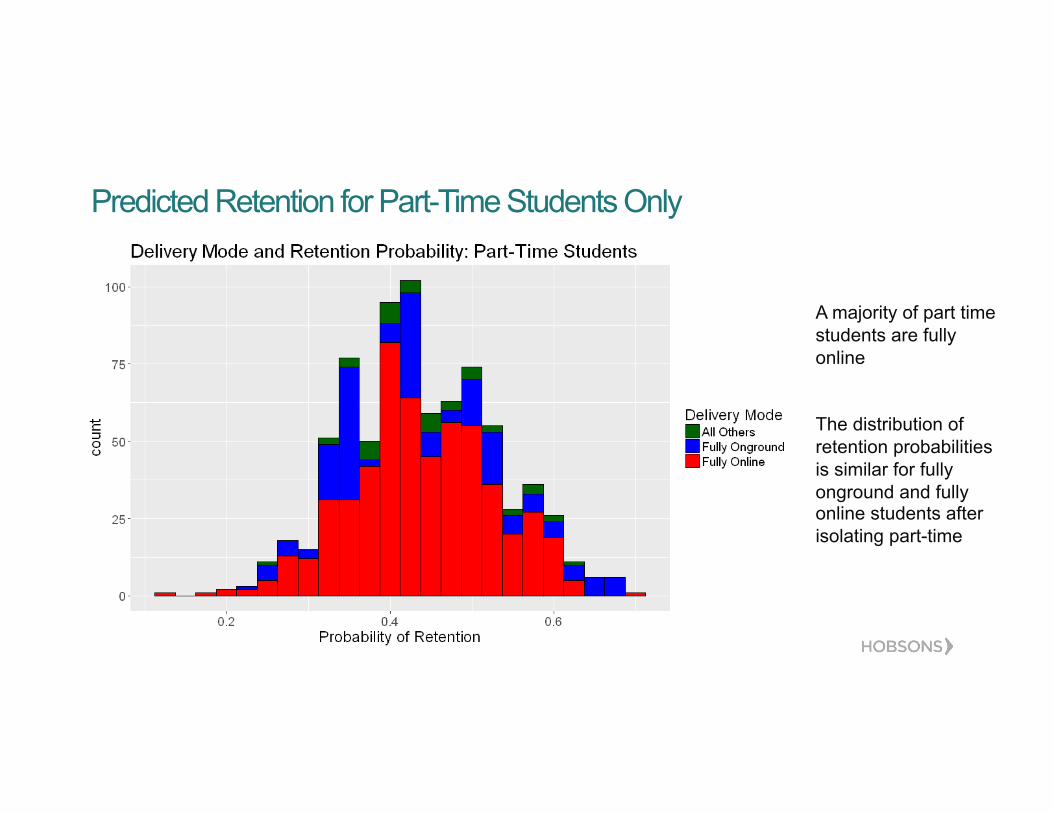
Predicted Retention for Part-Time Students Only
A majority of part time students are fully online The distribution of retention probabilities is similar for fully onground and fully online students after isolating part-time
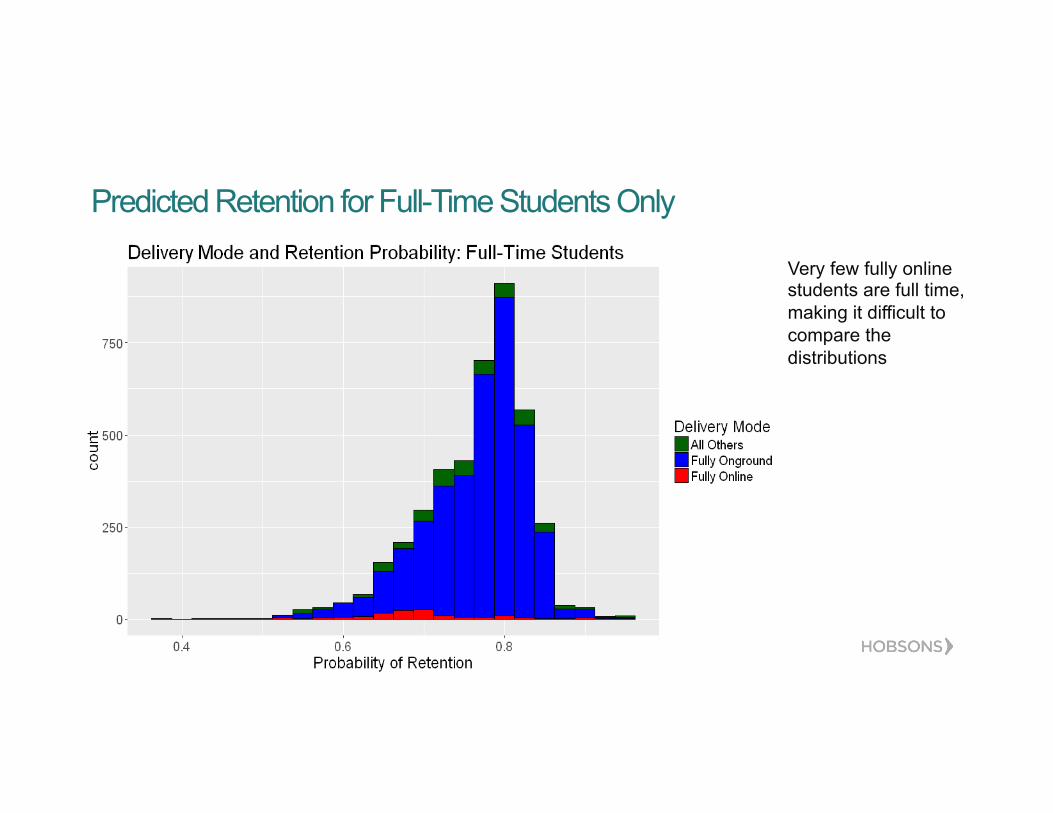
Predicted Retention for Full-Time Students Only
Very few fully online students are full time, making it difficult to compare the distributions

Research Question
Are online learners at risk of stopping out due to online course taking itself, or due to other factors that differentiate online learners from on-campus learners (i.e. Total Credit Attempts, Student Age, Financial Need, etc.)?

Research Findings
Variables Controlled For: • GED • Gender • Pell Grant • Race • Student Age • Transfer • Undeclared Major • Developmental Education
Course Attempts • Prior Credits • Course Credits Attempted

Research Findings
Fully Online students had 1.24 times greater odds of stopping out than Fully Onground students. This is a small effect.
Effect of Delivery Mode Estimate 95% Confidence Limits
Statistically Different from 1.0?
Effect Size
All Others vs Fully Ongound
1.12 (.98 , 1.3) No None
Fully Online vs Fully Onground
1.24 (1.07, 1.42) Yes Small
Interpretation and Action
Final Take-Aways
• Fully online students have lower probabilities of second year retention according to the model
• Differences in predicted retention between fully online and fully onground students are mostly explained by the amount of credits students are attempting and demographic factors

Interpretation and Action
Action Items • Meet with fully online students to better understand their unique needs
• Work to make degree plans more flexible and relevant to the needs of fully online learners
• Look for ways to make fully online students feel more connected to the university
Questions?


