

Sensorycharacteristicsandconsumeracceptanceofmechanically(canopycontactharvester)‐harvestedCaliforniablackolives:Reportfor2010‐2011
SohMinLee,ChiratSirimuangmoon,KalmonateKitsawad,LouiseFerguson,
andJean‐XavierGuinard
MaterialsandMethods
The study examined the sensory properties and consumer acceptability of 10 California black tableolivesthatwereproducedaccordingtotheexperimentaldesignshowninFigure1below,andharvestedeithermanuallyorwiththecanopycontactharvestermethodofmechanicalharvesting.Thelabelsused
for the 10 samples throughout the report are shown in Table 1. Our two industrial partners in thisproject(MuscoFamilyOlivesandBell‐Carter)receivedidenticalsamplesthatwerethenprocessedwithtwo different methods. Thus, 8 treatments, with the olive fruits being harvested either by hand or
mechanically[i.e.2harvestingmethods],thenshippedtoprocessorAandB[i.e.2processors],andthenprocessed fresh or after being held in storage tanks [i.e. 2 processing methods], and 2 commercialproducts,onefromeachprocessor,wereusedinthestudy(Figure1andTable1).
Figure1–Experimentaldesignforoliveproductionandharvest

Table1–Tableolivesamples
SampleAbbreviations Processors Commercial Harvesting
methodsProcessingmethods
A_Comm A Commercial ‐ ‐
A_Hand_F A ‐ Hand Fresholives
A_Hand_S A ‐ Hand Storedolives
A_Mach_F A ‐ Machine Fresholives
A_Mach_S A ‐ Machine Storedolives
B_Comm B Commercial ‐ ‐
B_Hand_F B ‐ Hand Fresholives
B_Hand_S B ‐ Hand Storedolives
B_Mach_F B ‐ Machine Fresholives
B_Mach_S B ‐ Machine Storedolives
Descriptiveanalysis
Thesensorypropertiesof theolivesweremeasuredbydescriptiveanalysiswitha trainedpanelof10
judges(8female,2male),allofthemareundergraduateandgraduatestudentsatUCDavis.
This year, thepaneldevelopedascorecardwith34attributesofappearance, flavor (tasteandsmell),
texture,mouthfeelandafter‐taste(Table2).Afterthepaneltraining,alltheproductswereevaluatedin
triplicate, followinga randomizedcompleteblockdesign.Oliveswerepresentedat roomtemperature
(20°C),inasphericalglasscoveredwithaplasticlid(3wholeolivesandoneslicedinhalf).Theintensity
of the attributeswas ratedon a category line scale labeledwith “low” and “high” at the ends of the
scale,exceptforsomeoftheappearanceattributesandthelastingflavorwhichusedthelabelsshown
inTable2below.

Table2–Sensoryattributesevaluatedinthedescriptiveanalysis
Attribute References Attribute References
Briny/Salty Olivebrine Size Small‐‐‐big
Ocean‐like Seaweed* Shape Round‐‐‐Oval
Sugary/Sweetsmell 1)Honey*
2)brownsugar*
Glossy/Shiny Matte‐‐‐Glossy
Fermented/Vinegar 1)Sauerkraut*
2)applecidervinegar*
Surfaceroughness Smooth‐‐‐Rough
Sautéedmushroom Sautéedmushroom* Degreeofdiscoloration
Earthy/Musty Pottingsoil* Skinbrownness (Darkbrowncolorscale)
Metallic/Canned Irontabletsolution* Gradation(Flesh) Lessgradient‐‐‐Moregradient
Green/Grassy Parsley* Brightness‐Grey/Green(Flesh)
(Grey/greencolorscale)
Floral Chrysanthemum* Brightness‐Grey/Brown(Flesh)
(Lightbrowncolorscale)
Painty/Solvent‐like Correctionfluid* Innerroughness Smooth/soft‐‐‐Rough
SMELL(AROMA)
Rancid/Oxidized Rancidoliveoil*
APP
EARA
NCE
Overallflavor ‐ Firmness
Saltiness NaClsolution Crunchiness
Umami MSG+brine Chewiness
Bitterness Caffeinesolution Juicy/Moisturerelease
Sweetness Sugarsolution Astringency/Dryness Steepedgreentea
TASTE/FLAVOR
Buttery* Meltedbutter
TEXT
URE/MOUTH
FEEL
Mouthcoating
Aftertaste FlavorLasting
*mixedwitholives

Consumertesting
Theolivesampleswerealsoevaluatedby109consumerswhowererecruitedamongPicnicDayvisitors
andDavisFarmer’sMarketcustomers.ThescreeningcriteriaforparticipationweretobeUSResidents
andblacktableolivesusersandliker.
Each consumer was presented with 11 samples, with the first sample serving as a primer, for the
purposeofeliminating thefirst‐ordereffecttypicallyencounteredinconsumertests–thefirstsample
receives a higher hedonic score than the subsequent samples in the serving order. The presentation
orderof theother10sampleswas randomizedacrossconsumers.Consumerswere instructed to rate
overalldegreeof likingofeachsample,followedbydegreeof likingofappearance,flavor,andtexture
on the 9‐point hedonic scale, from ‘dislike extremely’ to ‘like extremely,’ and with ‘neither like nor
dislike’ in the middle. Two whole olives were served in plastic cups covered with lids at room
temperature (20 °C). Crackers and water were provided for rinsing and palate cleansing. Upon
completionof the tasting, consumers filledan exit surveywithdemographic,attitudeandolive usage
information.
Dataanalysis
Thedescriptiveanalysisdatawasanalyzedusingacombinationofunivariateandmultivariatestatistics.
Analysisofvariance(ANOVA)wasusedtoexaminetheeffectofeachsourceofvariationsinthedesign.
Principalcomponentanalysis(PCA)wasthenappliedtothematrixofmeanintensityratingsacrossthe
samplestovisuallysummarizethesimilaritiesanddifferencesamongtheproductsinthedesign.
The consumerhedonic ratingswere also analyzedusing a combinationof univariate andmultivariate
statistics.ANOVAwasfirstperformedtoobservetheeffectofeachsourceofvariationinthedesign.The
matrixofhedonic ratingsof samplesacrossconsumerswas thenanalyzedbypreferencemapping–a
combination of factor analysis and classification methods designed to assess preference market
segmentationanddriversoflikingidentificationforproductoptimizationpurposes.Partialleastsquare
(PLS)regressionwasperformedtoexaminetherelationbetweenthehedonicratingsbyconsumersand
thesensoryattributesmeasuredbythedescriptiveanalysispanel.

Resultsanddiscussion
Descriptiveanalysis
Therewerenosignificantdifferencesbetweenmechanically‐andhand‐harvestedolivesformostofthe
aroma, taste/flavor and texture/mouthfeel attributes. However, the harvesting methods were
significantlydifferentinseveralappearanceandafter‐tasteattributes,aslistedbelow(Table3):
Flavor–Earthy
Taste‐Bitterness
Appearance–Size,Surfaceroughness,Degreeofdiscoloration,SkinbrownnessandBrightness
ofgrey/green(flesh)
After‐taste–flavorlasting
Thisyear’sresultconfirmstheresultfromyearof2008‐2009whencanopycontactharvesterwasalso
appliedthatthedifferencesbetweenhandandmachineharvestedolivesmostlyliesinappearanceand
after‐taste characteristics. Compared to theyearof 2009‐2010when trunkshakerwasapplied, there
werefewerdifferences insensoryattributesbetweenmechanically‐andhand‐harvestedolives,though
thedifferencesintheappearanceandafter‐tasteattributesstillremain.
Thereweremanysignificantdifferencesacrossa rangeofappearance, flavor, texture,mouthfeeland
aftertaste attributes mainly between fresh‐processed olives and olives stored before processing (i.e.
Processingmethod);andalso,betweenthe2commercialolivesandtheothersamples(i.e.commercial
vs.non‐commercial).
Table3.F‐valuesforpartitionedproductsourceofvariation.
Commercial
vs.non‐
commercial
Harvesting
method
(handvs.
machine)
Processing
method
(freshvs.
stored)
Processors
(Avs.B)
Harvesting
methodx
Processing
method
Harvesting
methodx
Processor
Processorx
Processing
method
Briny/Salty 6.38 0.32 4.64 0.14 0.32 0.08 0.61
Ocean‐like 6.91 1.60 28.39 0.23 1.36 0.58 1.27
Sugary/Sweetsmell 37.82 0.04 52.28 0.23 0.52 0.06 10.38
Fermented/Vinegar 39.58 1.35 39.78 0.11 1.24 1.69 9.91
Sautéedmushroom 3.72 1.79 4.73 1.44 0.13 0.14 12.88
Earthy/Musty 4.28 0.06 22.15 0.00 0.14 10.51 3.45

Metallic/Canned 44.60 2.58 76.47 0.28 1.63 2.17 17.17
Green/Grassy 22.91 2.49 68.01 2.09 1.35 0.82 4.44
Floral 9.27 0.02 1.64 2.48 2.19 0.13 1.26
Painty/Solvent‐like 35.85 0.94 74.26 4.81 0.06 1.35 2.69
Rancid/Oxidized 30.35 3.10 30.61 0.24 0.26 3.10 0.03
Overallflavor 13.34 3.66 1.97 1.68 0.14 1.71 1.22
Saltiness 31.75 0.00 2.14 0.07 0.46 1.21 4.32
Umami 12.96 0.06 36.04 0.07 0.00 3.57 1.63
Bitterness 4.64 2.54 94.93 18.55 5.20 0.93 11.21
Sweetness 12.00 0.06 70.46 0.05 2.66 0.41 0.35
Buttery 3.90 1.47 133.38 3.94 3.23 0.05 1.61
Size 34.66 4.63 23.50 15.73 10.16 7.73 1.86
Shape 4.37 0.02 0.10 0.13 0.02 0.87 0.02
Glossy 7.91 0.44 0.45 6.32 0.18 0.32 0.00
Surfaceroughness 25.62 0.49 3.45 7.21 2.69 4.08 17.46
Degreeofdiscoloration 34.66 4.63 23.50 15.73 10.16 7.73 1.86
Skinbrownness 11.18 35.68 26.51 59.45 5.69 20.56 1.53
Gradation(Flesh) 12.13 1.93 5.53 0.52 1.24 0.13 0.13
Brightness‐Grey/Green(Flesh) 22.91 2.49 68.01 2.09 1.35 0.82 4.44
Brightness‐Grey/Brown(Flesh) 0.60 4.26 12.61 2.33 1.33 1.27 76.31
Innerroughness 29.29 1.30 37.59 3.91 0.97 0.08 2.88
Firmness 74.22 0.19 6.97 6.29 0.40 0.34 13.29
Crunchiness 72.08 0.52 3.76 1.80 0.26 0.02 7.05
Chewiness 23.39 2.30 3.80 6.09 0.04 0.58 1.30
Juicy/Moisturerelease 22.71 2.73 91.11 4.17 0.33 0.09 7.10
Astringency/Dryness 1.11 1.11 26.36 18.72 3.04 1.21 0.27
Mouthcoating 0.38 0.28 55.18 3.26 0.42 0.44 2.34
FlavorLasting 2.09 4.39 7.63 4.53 0.50 2.60 0.16

Bolddenotessignificantsourceofvariation(P<0.05)
Principal component analysis (PCA) was employed to illustrate the relationships among the sensory
attributesandtheproductsina2‐dimensionalsensorymap.Theprincipalcomponent(PC)biplotshows
themainsensoryfeaturesofeachtableolivesample–attributeslocatedclosetoagivensampletendto
behigherforthatsample,whereasattributeswhicharefoundawayfromthatsampletendtobelower.
Italsodepictstherelationshipsamongthesensoryattributes–attributeswhicharepositivelycorrelated
tendtoformsmallangleswitheachotherortobeclustered togetheron theplot,whereasattributes
whicharenegativelycorrelatedarefoundatoppositeendsoftheplot.
Thebiplotof PC1 vs.PC2 is shown inFigure2below. PC1andPC2 explained75.49%of the variation
betweenproducts.
Figure2‐Principalcomponentanalysisofthedescriptiveanalysisdatashowingtheproducts(left)and
sensoryattributes(right).
• The main difference among products was observed between processing method (fresh
processed vs. non‐fresh (i.e. stored and commercial)), as shown by PC1 (54.25%). Fresh‐
processedolives,regardlessofharvestingmethodandprocessor,werecharacterizedbygreen
flesh,higherskinbrownness,surfaceroughness,ocean‐like,sugary,sautéedmushroomaroma,
umami, sweetbuttery flavorand juiciermouthfeel. Olivesheld in storage tanks,especiallyby
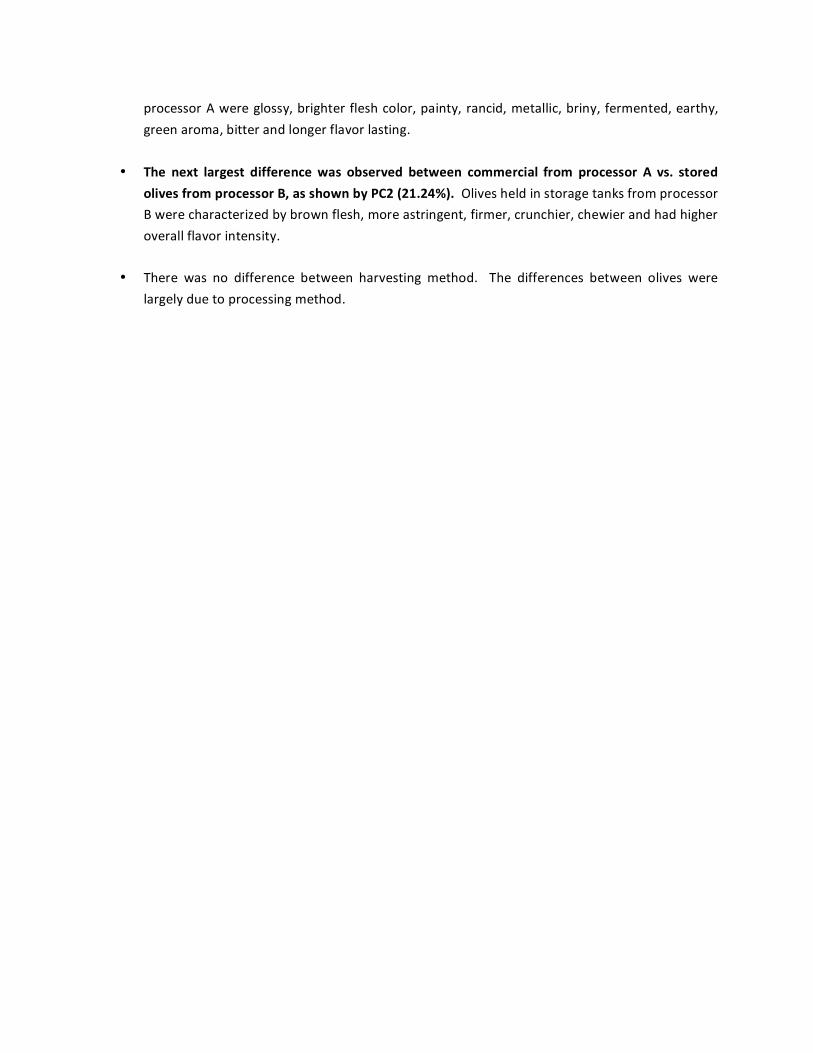
processorAwereglossy,brighterfleshcolor,painty, rancid,metallic,briny,fermented,earthy,
greenaroma,bitterandlongerflavorlasting.
• The next largest differencewas observed between commercial from processor A vs. stored
olivesfromprocessorB,asshownbyPC2(21.24%).Olivesheldinstoragetanksfromprocessor
Bwerecharacterizedbybrownflesh,moreastringent,firmer,crunchier,chewierandhadhigher
overallflavorintensity.
• There was no difference between harvesting method. The differences between olives were
largelyduetoprocessingmethod.

Consumertest
There was a significant difference in consumer acceptance between processing method (fresh vs.stored).Processingmethodwasthelargestsourceofvariationinoverallandflavorliking.Commercialvs.non‐commercialwasaratherimportantsourceofvariationfortextureliking,followedbyprocessing
method. Appearancelikingwasaffectedbytheinteractioneffectsbetweenprocessorandprocessingmethod(Table4).
Table4–F‐valuesforpartitionedproductsourceofvariation
Commercial
vs.non‐
commercial
Harvesting
method
(handvs.
machine)
Processing
method
(freshvs.
stored)
Processors
(Avs.B)
Harvesting
methodx
Processing
method
Harvesting
methodx
Processor
Processorx
Processing
method
Overalldegreeofliking
0.75 0.00 6.52 0.56 0.62 0.00 0.37
Appearanceliking 0.36 0.14 1.43 0.95 2.76 0.01 6.66
Flavorliking 0.72 0.07 8.89 0.71 0.25 0.27 0.01
Texture/Mouthfeelliking
12.42 0.07 6.21 1.16 0.13 0.18 2.15
Bolddenotessignificantsourceofvariation(P<0.05).

An examinationof themean hedonic ratings confirms theobservations above (Figure 3). Themeanhedonicratingsforoveralllikingindicatedfresh‐processedoliveswerepreferredoverstored‐processed
olives (Figure 3a). There was no significant difference between mechanically‐ and hand‐harvestedolives.Thefindingsweretrueforflavorandtextureliking,buttoalesserextentforappearanceliking(Figure3b).Therewasahigherdegreeofappearancelikingforstored‐processedolivesfromprocessor
B.Inconclusion,thelargestsourceofvariationinconsumeracceptancewas‘processingmethod.’
(a)
(b)
Figure3–LSmeansforhedonicratingsofthe10olivesamplesfor(a)overalldegreeoflikingand(b)
includingappearanceliking,flavorliking,andtextureliking(N=109consumers)

Theoveralldegreeoflikingshowedthehighestcorrelationtoflavorliking,andthentotexturelikingandappearance liking(Table5,Figure4b),similartowhatweobservedlastyear.Thissuggeststhat
flavorcharacteristicsarethemostimportantdeterminantsofconsumelikingfortableolives.
Table5–Pearson’scorrelationcoefficientsamonghedonicratingsbyconsumers
Variables Overalldegreeofliking Appearanceliking Flavorliking TexturelikingOveralldegreeof
liking 1 0.596 0.914 0.734
*Valuesinboldaresignificantlydifferentfrom0withasignificancelevelalpha=0.05

Preferencemappingandconsumersegmentation
Figure 4 showed the results of the internal preference mapping analysis as bi‐plot of the first twoprincipal components; showing the main direction (as vectors) of each individual consumer’spreferences for the 10 olives tested (i.e. each dot represents each individual consumer’s main
preferencedirection).
Thepreferencemapshowedthatanumberofconsumerswere locatedonbottomareaof theplot,wherefresh‐processedolivesampleswerelocated.Thestored‐processedolivesampleswereontheupperarea,withthosefromprocessorBlocatedontheupperrightsidewhilethosefromprocessorA
locatedon the left sideof theplot. Thisobservation is comparable to thepreviousyear’s result (i.e.fresh‐processedoliveswerelikedoverstored‐processedolives).Unlikelastyear,however,thelocationsof mechanically‐ and hand‐harvesting methods were placed closely on the plot. This indicated that
harvesting method have little influence on consumer acceptance. The preference map also showeddifferencesamong the four stored‐processedolives,whichweredue todifferentprocessor. Thiswasnotthecaseinlastyear’sresearch.
Figure4–Internalpreferencemapgeneratedbasedonoveralldegreeofliking,showingindividual
consumersandtheolivesamples(N=109)
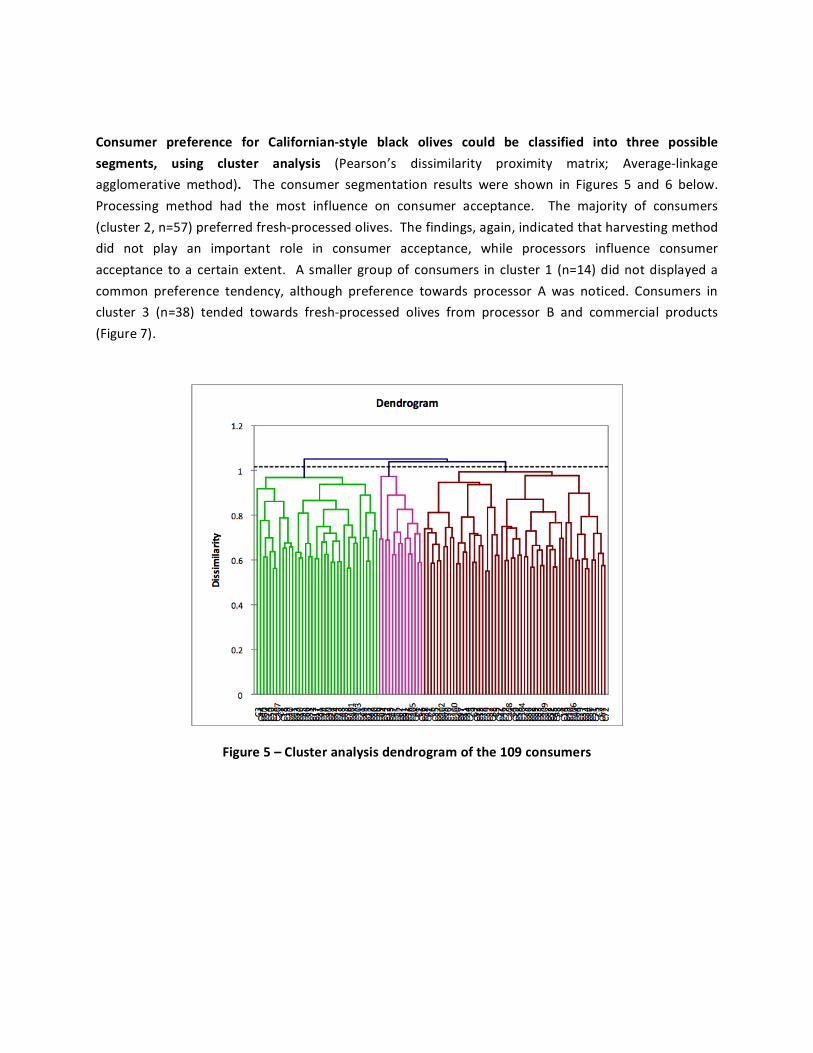
Consumer preference for Californian‐style black olives could be classified into three possible
segments, using cluster analysis (Pearson’s dissimilarity proximity matrix; Average‐linkage
agglomerative method). The consumer segmentation results were shown in Figures 5 and 6 below.
Processing method had the most influence on consumer acceptance. The majority of consumers
(cluster2,n=57)preferredfresh‐processedolives.Thefindings,again,indicatedthatharvestingmethod
did not play an important role in consumer acceptance, while processors influence consumer
acceptance toacertain extent. A smallergroupof consumers incluster1 (n=14)didnotdisplayeda
common preference tendency, although preference towards processor A was noticed. Consumers in
cluster 3 (n=38) tended towards fresh‐processed olives from processor B and commercial products
(Figure7).
Figure5–Clusteranalysisdendrogramofthe109consumers

Figure6–Internalpreferencemappingwithsegmentation
Examination of the interaction between cluster and product indicated that the three clustersweresignificantlydifferentinoverallliking,flavorlikingandtextureliking,butnotappearanceliking(Table
6). Mean hedonic scores for overall liking (Figure 7) supports the findings above. Mean scores forappearanceliking,flavorlikingandtexturelikingforeachclusterwereshowninFigure7.
Table6–F‐valuesfordifferencesinlikingamongconsumerclusters
Variables Overalldegreeofliking Appearanceliking Flavorliking Textureliking
Clusterxproduct 5.68 1.31 4.49 2.59
Bolddenotessignificantsourceofvariation(P<0.05)

(a)
(b)

(c)
(d)
Figure7–Meanhedonicscoresof10olivesamplesforeachcluster,showing(a)overallliking,(b)
appearanceliking,(c)flavorlikingand(d)textureliking.

Theoveralldegreeoflikingshowedthehighestcorrelationtoflavorliking,andthentotexturelikingand appearance liking (Table 7), similar towhatweobserved in the overall sample. This confirmed
thatflavorcharacteristicsarethemostimportantdeterminantsofconsumelikingfortableolives.
Table7–Pearson’scorrelationcoefficientsamonghedonicratingsbyeachcluster
Variables Overalldegreeofliking Appearanceliking Flavorliking TexturelikingCluster1overalldegreeofliking 1 0.562 0.882 0.678
Cluster2overalldegreeofliking 1 0.556 0.905 0.778
Cluster3overalldegreeofliking 1 0.678 0.937 0.692
*Valuesinboldaresignificantlydifferentfrom0withasignificancelevelalpha=0.05

Identificationofdriversofliking
PLS‐regressionwasperformedinordertoexaminesensorydriversofconsumerlikingforblacktable
olives(Figure8).Thisanalysisprovidesaclearerinsightoftheblacktableolivespreferencecharacteristicof each consumer segment. The analysis displayed the sensory attributes that were associated withoverall degree of liking by each cluster, and more specifically, the appearance attributes that were
associatedwith liking for appearance of olives (Figure 8b), the flavor attributes thatwere associatedwith likingof flavorofolives (Figure8c)and the textureattributes thatwereassociatedwith likingoftextureofolives(Figure8d).
(a)

(b)
(c)

(d)

Figure10–PLS2‐Regressionofeachclusterhedonicratings(i.e.a)overallliking,b)appearanceliking,c)flavorlikingandd)textureliking)ontothesensoryattributesfromthedescriptiveanalysis

Consumer segment profiles, including demographics and behavioral information are shown in Table 8and9.
Table8–Demographicprofilesofblacktableolivesconsumersegments
Cluster1(%) Cluster2(%) Cluster3(%) Overall(%) (n=14) (n=57) (n=38) (N=109)
Gender Male 57.1 40.4 36.8 41.3 Female 42.9 59.6 63.2 58.7
Age 18‐29 42.9 40.4 28.9 36.7 30‐39 21.4 14.0 7.9 12.8 40‐49 28.6 8.8 2.6 9.2 50‐59 7.1 19.3 39.5 24.8 60‐69 0.0 10.5 15.8 11.0 ≥70 0.0 5.3 5.3 4.6Ethnicity African/African
American0.0 0.0 2.6 0.9
Asian/AsianAmerican 21.4 10.5 18.4 14.7
Caucasion(non‐hispanic)
64.3 75.4 57.9 67.9
Hispanic/Latino 7.1 3.5 7.9 5.5 MiddleEastern 0.0 0.0 2.6 0.9 NativeAmerican 0.0 0.0 0.0 0.0 PacificIslanders 0.0 0.0 0.0 0.0 Other(specify) 7.1 10.5 10.5 10.1
Maritalstatus single 35.7 40.4 34.2 37.6 married 42.9 52.6 60.5 54.1 divorced/separated 14.3 3.5 0.0 3.7 widowed 0.0 1.8 2.6 1.8Numberofchildrenunder18yearsold
none 71.4 75.4 86.8 78.9
1 7.1 14.0 10.5 11.9 2 14.3 5.3 2.6 5.5 3ormore 7.1 5.3 0.0 3.7Student 35.7 31.6 15.8 26.6
Occupation unemployedstudent 21.4 19.3 10.5 16.5 retired 0.0 14.0 15.8 12.8 unemployed 14.3 1.8 7.9 5.5 employed 64.3 64.9 63.2 64.2
Exercise? everyday 28.6 15.8 23.7 20.2 2‐3/week 50.0 56.1 47.4 52.3 onceaweek 14.3 22.8 13.2 18.3

onceamonth 0.0 5.3 7.9 5.5 never 7.1 0.0 7.9 3.7
Highesteducation HSdiploma/GED 21.4 21.1 13.2 18.3 BachelorsDegree 57.1 40.4 44.7 44.0 Masters 7.1 19.3 15.8 16.5 Ph.D 14.3 10.5 23.7 15.6 ProfessionalDegree 0.0 8.8 0.0 4.6
Income lessthan$50,000 28.6 33.3 26.3 30.3 $50,000‐$100,000 21.4 21.1 23.7 22.0 $100,000+ 35.7 35.1 28.9 33.0
Don'tknow/prefernoanswer 14.3 10.5 18.4 13.8
Table9–Behavioralinformationofblacktableolivesconsumersegments
Cluster1(%) Cluster2(%) Cluster3(%) Overall(%) (n=14) (n=57) (n=38) N=109)
Didyoueatolivesin… canape 7.1 24.6 7.9 16.5 pasta 57.1 63.2 65.8 63.3 pizza 92.9 86.0 89.5 88.1 salad 64.3 78.9 78.9 77.1 sandwich 64.3 38.6 42.1 43.1 cocktail 21.4 26.3 13.2 21.1 others(description) 21.4 31.6 18.4 25.7Didyoueatolivesbythemselves?
71.4 77.2 71.1 74.3
Consumptionfrequency ≥2‐3timesaweek 14.3 17.5 15.8 16.5 onceaweek 14.3 35.1 26.3 29.4 onceeveryotherweek 35.7 21.1 28.9 25.7 onceamonth 7.1 14.0 52.6 26.6 lessthanonceamonth 28.6 8.8 26.3 17.4Ofteneatolivesbythemselves 2‐3+timesaweek 0.0 14.0 5.3 9.2 onceaweek 14.3 17.5 7.9 13.8 onceeveryotherweek 35.7 14.0 18.4 18.3 onceamonth 21.4 19.3 71.1 37.6 lessthanonceamonth 28.6 31.6 94.7 53.2Doyoubuy... black(whole) 57.1 82.5 84.2 79.8
black(sliced) 35.7 38.6 34.2 36.7 green(whole) 50.0 66.7 57.9 61.5 green(sliced) 0.0 14.0 7.9 10.1
flavored/spiced(black,whole) 35.7 35.1 18.4 29.4

flavored/spiced(black,sliced) 7.1 5.3 0.0 3.7
flavored/spiced(green,whole) 50.0 50.9 26.3 42.2
flavored/spiced(green,sliced) 14.3 7.0 2.6 6.4
stuffed(black,whole) 7.1 19.3 13.2 15.6 stuffed(green,whole) 71.4 57.9 50.0 56.9
Source can/jar 85.7 77.2 78.9 78.9 deli 57.1 63.2 44.7 56.0 makemyown 7.1 8.8 7.9 8.3
Purchasingfrequency ≥2‐3timesperweek 0.0 3.5 0.0 1.8 onceaweek 0.0 10.5 5.3 7.3
onceineveryotherweek
21.4 19.3 15.8 18.3
onceamonth 21.4 38.6 47.4 39.4 oncein3months 21.4 17.5 10.5 15.6
lessthanoncein3months
28.6 1.8 18.4 11.0
never 7.1 7.0 2.6 5.5Factorsinfluencingchoice Type 85.7 89.5 92.1 89.9
Variety 50.0 64.9 65.8 63.3 Origin 28.6 35.1 23.7 30.3 Local 28.6 36.8 44.7 38.5 Package 28.6 35.1 34.2 33.9 Nutrition 14.3 12.3 28.9 18.3 Brand 21.4 24.6 36.8 28.4 Price 85.7 63.2 71.1 68.8
Responsibleforgroceries yes,100% 42.9 38.6 42.1 40.4 yes,partially 35.7 54.4 42.1 47.7 no 21.4 5.3 13.2 10.1Consideryourself… conservative 0.0 0.0 2.6 0.9 somewhatconservative 0.0 10.5 5.3 7.3 neither 28.6 8.8 15.8 13.8 somewhatadventurous 28.6 40.4 50.0 42.2 adventurous 42.9 38.6 26.3 34.9

Conclusion
The main conclusion of this year’s research is that there were little differences in sensory quality
between mechanically‐ and hand‐harvested olives, which did not significantly influence consumer
acceptance.
Comparedtolastyear’sresearch,whenwefoundnotabledifferencesbetweenhand‐andmechanically
harvestedolives (butwith a trunk‐shaking device), this year’s results foundno significant differences
between the twoharvestingmethods inbothsensoryqualitiesand consumeracceptance. The result
was in linewith the researchdone in 2008‐2009 (with a canopy contact device, similar to thedevice
usedthisyear).Moreover,thereweresomedifferencesinsensorypropertiesandconsumeracceptance
of stored‐processed olives between the two processors. We were able to identify three consumer
segmentswhichdifferedinpreferenceforblacktableolives:
• Cluster1(n=14):Stored‐processedolives
• Cluster2(n=57):Fresh‐processedolives
• Cluster3(n=38):Commercialolivesandfresh‐processedolivesfromprocessorB.
Themajorityofconsumersexhibitedpreferencesforfresh‐processedolives,thusfresh‐processedolives
havestrongpotentialintheCalifornian‐olivemarket.


