

September 14, 2009

Plan Background and GoalsThe City of Santa Clara’s 2009 Bicycle Plan Update is a blueprint for expanding the bicycle network that will promote safer alternative modes of transportation and help position the City for future funding for bicycle projects and roadway improvements benefiting the cycling community. The current plan was last completed in 2002. The focus of the Bicycle Plan Update is adherence to the provision of the California Streets and Highways Code, in order to remain eligible for Bicycle Transportation Account (BTA) funds for City and County projects that improve safety and convenience for bicycle commuters. The following requirements are set forth by the Code and are listed alongside the section titles discussing these requirements:
891.2a An estimation of current and future bicycle commuters (Bicycle Survey Results) 891.2b A map of existing and proposed land uses including residential neighborhoods, schools, shopping centers, public buildings,
and major employment centers (Inside Map) 891.2c A map of existing and proposed bikeways (Inside Map) 891.2d A map of existing and proposed route end bicycle parking facilities (Inside Map) 891.2e A map of existing and proposed bicycle transport and parking facilities connecting with other transportation modes (Inside Map) 891.2f A map of publicly owned existing and proposed facilities for changing and storing clothes and equipment (Inside Map) 891.2g Bicycle safety and education programs, as well as California Vehicle Code bicycle enforcements efforts, and their effect on bicycle
collisions (Safety Programs) 891.2h Citizen and community involvement (Bicycle Survey Results & Plan Background and Goals) 891.2i Bicycle plan coordination with other local and regional planning efforts and bicycle incentive programs (Plan Background and Goals) 891.2j Proposed and prioritized bicycle design and education projects (Safety Programs Best Practices, Bike Facility Cross Sections,
and Bikeway Planning and Design–Appendix D) 891.2k Past bicycle facility expenditures and future project financial needs (Past Expenditures and Priority Ranking)
The update of the bicycle plan was completed in coordination with the bicycle plans from the neighboring cities of San Jose and Sunnyvale as well as the Santa Clara County bicycle plan which includes the cross county corridors listed in Appendix E and included herein. The Bicycle Advisory Committee (BAC) has been exposed to the 2009 update of the bicycle plan numerous times throughout the creation of the document and was active in providing suggestions and feedback. If any opportunities arise in the planning and construction of the California High Speed Rail project, the City is interested in potentially coordinating improvement projects in the City within the High Speed Rail study area.
Safety Programs Best PracticesOther bicycle plans were surveyed for the best practices, and are summarized below.
Educate cyclists and motorists of all ages on the rules and safety measures that lie within bicycling on roadways with vehicles. 1.
Offer cycling and motorists seminars/classes teaching attendees the rules and consequences of sharing the road with motorists on-2. road as well as in the classroom. Educating various age groups on safety topics:
Motorists a. Rules for motorists regarding cyclists & motoristsi. Precautions when opening doorsii. Parking in Bike Lanesiii. Maneuvering around cyclistsiv.
Cyclistsb. Use of lights and reflective clothing at night.i. Where to ride bicycleii. How to signal to motoristsiii. Preventing bicycle theftiv. Always show intentions to motoristsv. Proper helmet and safety equipmentvi. How to maneuver within trafficvii. Common collisions or instances where cyclists interfere with motorists or pedestriansviii. What to watch out for and avoidix.
Plan Background, Goals, and Safety Programs Best Practices
Safety Programs Best Practices (cont.)
Motorists & Cyclistsa. Traffic signs and signalsi. Right-of-wayii.
Offer web courses teaching attendees the rules and consequences of sharing the road with cyclists.1.
Offer courses demonstrating bicycling techniques for inexperienced riders.2. Make bicycle safety a part of traffic school curriculum.a. Administer bicycle safety education classes.b. For bicycle infractions (i.e. running stop signs), consider utilizing local League of American Bicyclists or other education c. programs as a “bicycle traffic school” in lieu of fines.
The City of Santa Clara has a Juvenile Traffic Diversion Program in place that provides a ticket to education i. through enforcement of bicycle, pedestrian and other non-motor vehicle violations and includes education of juveniles and encouragement of safety practices through helmet distribution and support. When law enforcement officers issue a citation, youth under the age of 18 years are offered the opportunity to attend a traffic safety class in lieu of paying the fines and fees associated with the ticket.
Offer Bike Mentor Programs to match experienced and beginner bicyclists. 3. Would provide a good opportunity for beginner bicyclists to learn first-hand from experienced bicyclists.a. Allows bicyclists to travel with someone, which may reduce safety concerns and provides companionship.b.
Survey bicyclists and motorists to determine safety issues in a particular corridor that can be improved. 4. Survey cyclists at common destinations to determine where many potential collisions may happen.a. Survey cyclists on improper signage and potholes or unsafe objects interfering with bike facility.b.
Offer brochures and pamphlets at popular cycling destinations informing proper techniques and rules on sharing the road.5. Develop a safety handbook outlining and explaining bicycle safety.a. Develop a map for cyclists displaying Bike Paths, Bike Lanes, and Bike Routes. b. Include a citywide bicycle facility map.c. Map in pamphlet should show facility types (Class I, II, or III) as well as suggested routes relative to bicyclist skill level d. (beginner, intermediate, advanced).
Coordinate with other local agencies and partners to inform the public about cycling.6. Develop outreach programs with various agencies:a.
Silicon Valley Bicycle Coalitioni. City of Santa Clara Police Departmentii. Santa Clara Universityiii. Local school districtsiv.
Work with schools to develop an Effective Cycling certification so that students understand bicycle 1. safety laws.Continue to work with schools on the Safe Routes to School program to educate students on basic 2. pedestrian and bicycle safety skills.
Sponsor events that promote bicycling.b. Work with local agencies to promote Bike to Work Day program and to implement Bike to School Day program.c. Help facilitate the development of employer incentive programs.d.

Bicycle Survey Results
An online survey was sent to City of Santa Clara employees as well as Santa Clara University faculty, staff, and students as members of a major employer or organization within the City and therefore a potential primary user of the bicycle network. The survey was created to help the City of Santa Clara assess the current status of the bicycle network as well as potential future priorities. The detailed results of the 630 survey responses received are included in Appendix A.
The results of the survey show that 87% of the participants own a bicycle and the majority of the participants ride their bicycle one to three days a week. Results also show that 60% of the survey participants ride their bicycles for recreation and exercise. Approximately 50% of all of the survey participants cycle to work or school. This statistic was found to be overstated due to the students who participated in the survey. Taking the Santa Clara University participants out of the result, only 13% of the survey participants bicycle to work.
The most common reasons that participants don’t commute to work or school by bike are that they don’t feel safe commuting by bike, there aren’t any showers or change facilities at their workplace or school, and that commuting by bicycle takes too much time.
The most common reasons that participants do commute to work or school by bike are that it is more economically beneficial and environmentally friendly to ride their bikes than using other forms of transportation and that riding a bike is good exercise.
The survey participants use the existing facilities on Homestead Road, Lafayette Street, Monroe Street, and Scott Boulevard more than other facilities in the City. New facilities are desired most on El Camino Real, Saratoga Road, and Benton Street as well as additional facilities are desired
on Scott Boulevard, Monroe Street, and Lafayette Street. With the existing bicycle facilities 35.5% of the survey participants ride their bicycles more than four days a week, for commuting and recreational purposes. With improved bicycle facilities an additional 15.5% of the survey participants (for a total of 51% of the participants) would ride their bicycle more than four days a week.
Past Expenditures The expenditures on bicycle facilities installed since the 2002 Bicycle Plan update are summarized below and included in Appendix C.
City of Santa Clara Bicycle Facilities Installed Since 2002BICYCLE TRAILS TOTAL COST
River Oaks Bicycle/Pedestrian Bridge (Santa Clara Contribution) $600,000
San Tomas Aquino Creek (Reach 1 - SR-237 to Agnew Rd) $3,276,359
Agnew Road At-Grade Signal @ San Tomas Aquino Creek (Reach 1) $220,750
San Tomas Aquino Creek (Reach 2 - Agnew Rd to Scott Blvd) $5,970,271
San Tomas Aquino Creek (Reach 3 - Scott Blvd to Monroe St) $7,479,180
Monroe Street At-Grade Signal @ San Tomas Aquino Creek (Reach 3) $503,855
Creek Trailhead @ Monroe Street & San Tomas Aquino Creek - Land Purchase $1,250,000
Creek Trailhead @ Monroe Street & San Tomas Aquino Creek $860,255
San Tomas Aquino Creek (Class I portion of Reach 4 - Creek Trailhead to Cabrillo Ave) $544,113
BICYCLE LANES
Bowers Avenue (US-101 to Chromite Dr) $81,286
Great America Parkway (Yerba Buena Way to US-101) $69,056
Homestead Road (Lawrence Expwy to Lafayette St - Bicycle Lane & Bicycle Route) $213,062
Hope Drive (Lafayette St to Lick Mill Blvd) $12,232
Lafayette Street (Calle De Luna to Agnew Rd) $24,166
Los Olivos Drive (Homestead Rd to Forbes Ave) $8,719
Mission College Boulevard (Marriott to Wyatt Dr) $12,556
Old Mountain View - Alviso Road (Sunnyvale City Limit to Great America Pkwy) $8,786
Poplar Street (Washington St to Park Ave) $6,806
The Alameda (Bellomy St to Mission St) $14,812
Winchester Boulevard (Bellomy St to Newhall St) $4,249
Scott Boulevard (Garrett Dr to Central Expwy) $74,503
BICYCLE ROUTES
Bowers Avenue (Chromite Dr to Cabrillo Ave) $8,116
Flora Vista Avenue (Benton St to Granada Ave) $743
Forbes Avenue (Harvard Ave to Los Padres Blvd) $33,062
Granada Avenue (Flora Vista Ave to Pomeroy Ave) $990
Park Avenue (Bellomy St to Newhall St) $11,060
Warburton Avenue (Los Padres Blvd to Monroe St) $1,733
TOTAL $21,290,719
Bicycle Survey Results, Past Expenditures and Collision Summary

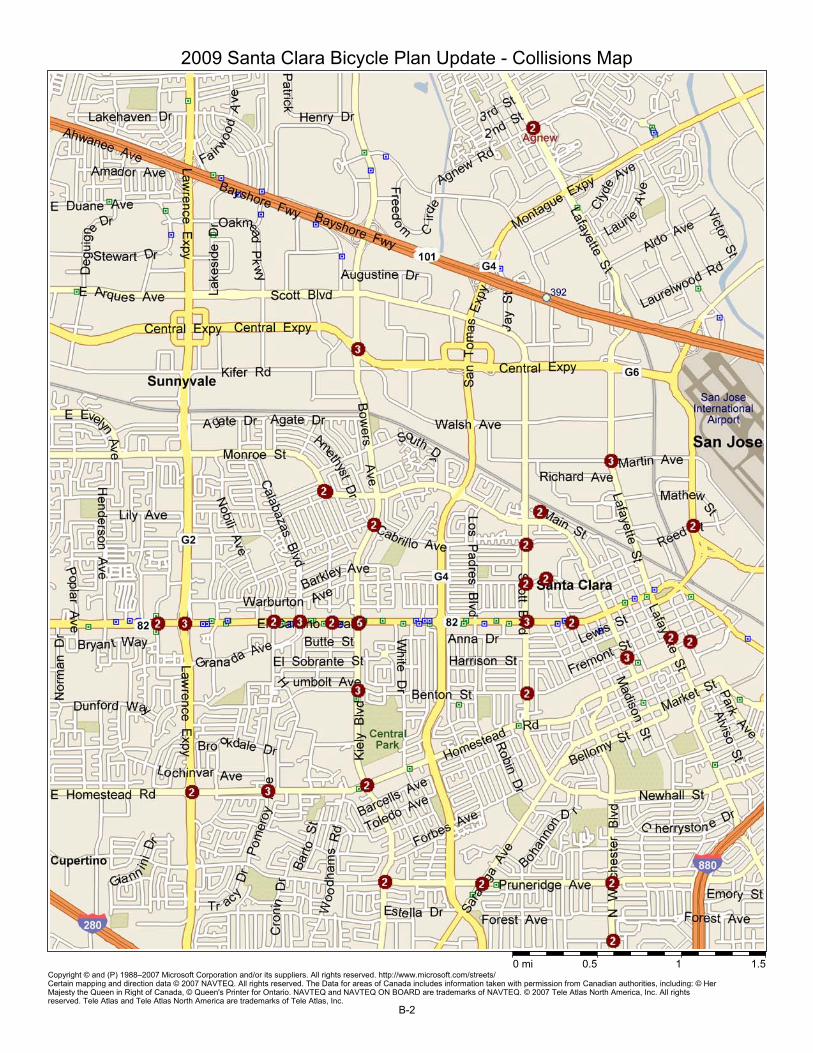
Bicycle Collision SummaryBicycle collision data was provided by the City of Santa Clara from 2002 through 2007 throughout the City. There were a total of 181 bicycle collisions during the time period analyzed. As seen in the Percent of Injury Collisions Summary table, 77% of the accidents resulted in an injury and none of the collisions resulted in a fatality. The remaining 23% of the accidents did not include an injury.
The Collision Time of Day Summary table shows that 81% of the accidents occurred during the day, and 19% occurred during nighttime hours.
The results of the two summaries are considered typical for collisions involving bicycles since injuries to cyclists during a collision occur at relatively low speeds and the population of cyclists is much greater during the daylight hours.
The Collision Summary by Street table lists the roadways with an average of at least one collision per year. It should be noted that most of the locations with the highest percentage of collisions are streets without existing bicycle facilities.
This plan proposes adding bicycle facilities to Lafayette Street, Monroe Street, Scott Boulevard, Benton Street, Bowers Avenue, Pruneridge Avenue, Winchester Boulevard, and Saratoga Avenue. The addition of bicycle facilities on these roadways will likely reduce the number of bicycle collisions in the future.
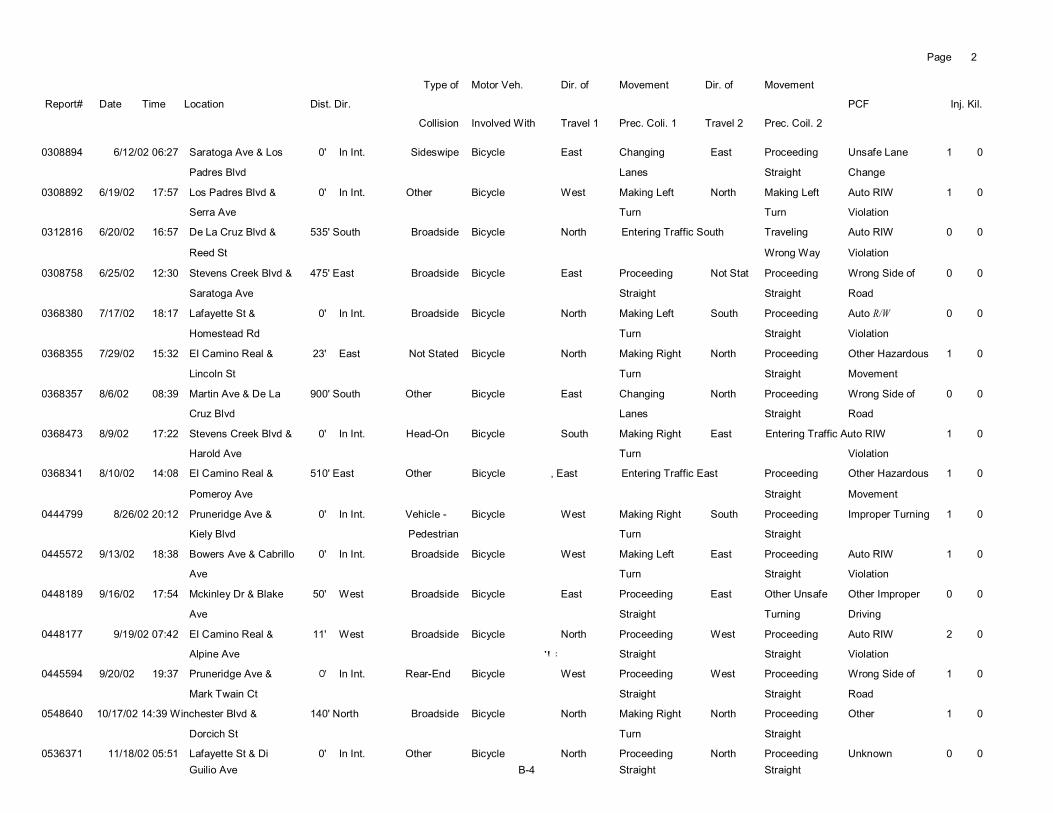
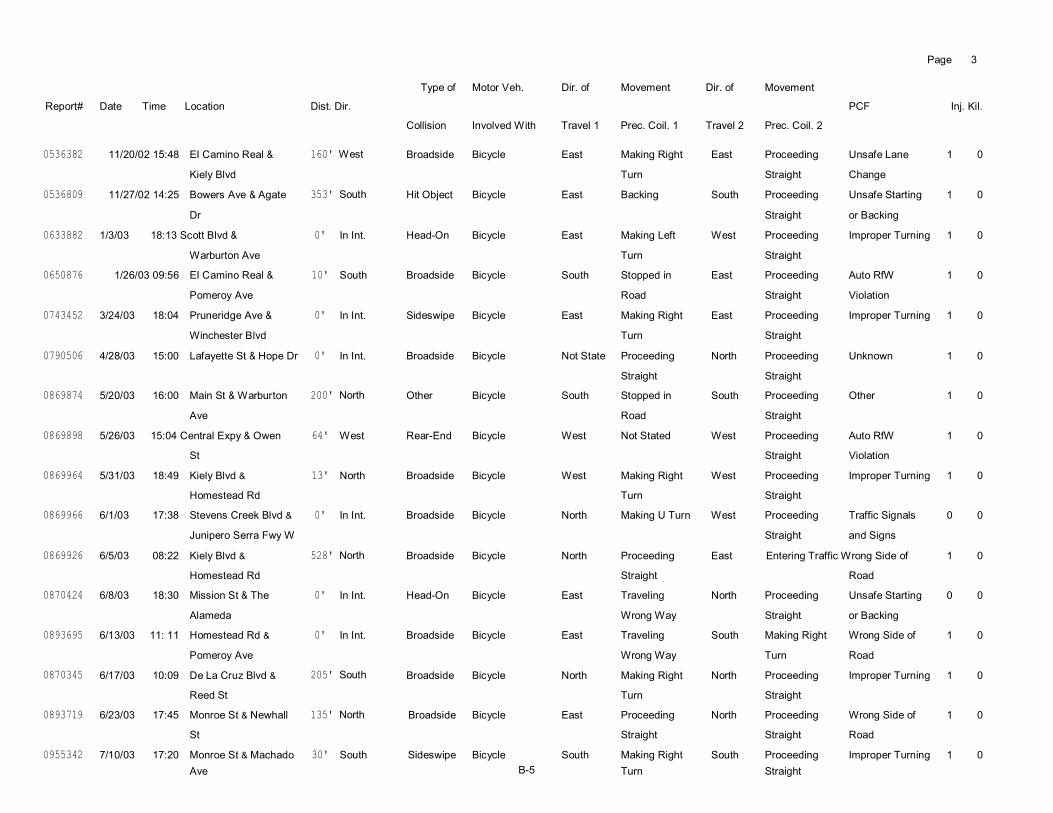
Additional information regarding the bicycle collisions that took place between 2002 and 2007 is included in the Appendix B.
Collision Summary by Street
Street Percentage
El Camino Real 10.0%
Lafayette Street 5.0%
Monroe Street 5.0%
Kiely Boulevard 4.4%
Scott Boulevard 4.2%
Homestead Road 3.9%
Benton Street 3.6%
Stevens Creek Boulevard 2.8%
Bowers Avenue 2.5%
Pruneridge Avenue 2.2%
Warburton Avenue 1.9%
Winchester Boulevard 1.9%
Saratoga Avenue 1.9%
Cabrillo Avenue 1.7%
Lawrence Expressway 1.7%
Calabezas Avenue 1.7%
Central Expressway 1.7%
Other Streets 43.9%
Total 100.0%
Collision Time of Day Summary
Year Daytime Nighttime Total
2002 24 77% 7 23% 31
2003 23 88% 3 12% 26
2004 22 88% 3 12% 25
2005 24 73% 9 27% 33
2006 23 72% 9 28% 32
2007 30 88% 4 12% 34
Total 146 81% 35 19% 181
Percent of Injury Collisions Summary
Year Injury Fatal None Total
2002 22 71% 0 0% 9 29% 31
2003 23 88% 0 0% 3 12% 26
2004 13 52% 0 0% 12 48% 25
2005 29 88% 0 0% 4 12% 33
2006 27 84% 0 0% 5 16% 32
2007 25 74% 0 0% 9 26% 34
Total 139 77% 0 0% 42 23% 181

8' 13' 11'Parking
8'ParkingTravel
12'TravelTravel
11'Travel
11'Sharrow
11'Sharrow
8' 12' 12'Parking
8'ParkingTwo-Way
Left-Turn Lane
6'Bike Lane
6'Bike LaneTravel
12'Travel
14' 12' 16'6'BikeLane
6'BikeLane
MEDIANTravel Travel12'
Travel14'
Travel
Class II FacilityNorthbound Lafayette Street between Yerba Buena and Calle de Luna
Class II Facility (with Road Diet) Eastbound Benton Street between Kiely Boulevard and White Drive
Class III Facility w/SharrowWestbound Monroe Street west of Calabazas Avenue
Below are examples of potential Class II Bike Lane, Class II Bike Lane with Road Diet, and Class III Bike Route with Sharrow cross-sections to be installed in Santa Clara with the proposed improvements included in this plan. These cross sections were chosen because they are considered to represent a typical application of a bicycle lane and sharrow facility. Actual design of bicycle facilities, implementation of a road diet, and use of sharows would be dependent on further study.
Bicycle Facility Cross Sections and Bicycle Detection

Santa Clara Bicycle Detection StrategyThe City of Santa Clara uses the following strategy for bicycle detection. Additional information is included in Appendix F.
Operational parameters1)
Video detection and in-pavement loop detectorsa)
Video detection is preferred but may not always be feasible, in which case in-pavement loop detectors may be utilized for i) detection
At locations where a striped bike lane is located between a left-turn lane and through lane, video detection may be used ii) but in-pavement detection is preferred to better control signal timing for cyclists.
Design and construction constraints2)
Not all controllers can accommodate bicycle detection technologya)
Consult traffic operations to discuss constraints of overall detection systemb)
Cost estimation3)
In-pavement loops are approximately $2,500 per approacha)
Video detection is approximately $7,500 per approach, but same camera unit can be used for vehicular detectionb)
Prioritization of locations for implementation4)
Rank intersections by:a)
Bicycle volumei)
Cycling peak-hour volume(1)
Proximity to schools and parks(2)
Safety ii)
Number of bicycle related accidents within a specific time window(1)
Citizen requestsiii)
Review history of public complaints within a specific time window(1)
Costiv)
Adopt policy that requires new installation of presence detection system to include bike detection on all Class II (1) facilities, and recommends bike detection on Class III facilities
Rank corridor by:b)
Bike Facility classificationi)
Available fundingii)
Safe routes to schooliii)
Ranking Criteria (as outlined in the “Ranking Criteria for Bicycle Detection Implementation at Signalized Intersections” c) document in Appendix F)

RankingThe project ranking was determined using the same methodology as the 2002 Bicycle Plan Update. The evaluation criteria used to identify the relative advantages of projects along specific corridors in the City of Santa Clara are:
• RiderStress(Evaluatesneedtoreduceriderstressandproject’sabilitytocreatecomfortablepassagethroughoutthecity) • CollisionHistory(Evaluatesnumberofbicyclecollisionsbetween2002and2007) • AverageDailyVehicularTrafficVolumes(Evaluatesthevehicularvolumeontheroadways) • GapClosure(Evaluatesabilitytoprovidealinkbetweenexistingfacilities) • Cost/Funding(Evaluatespreliminarycostestimates) • Connectivity(Evaluatesthelocationandnumberofactivitycentersalongthecorridor) • Complexity(EvaluatestheROWrequired,numberofagenciesinvolved,andthecommunityreaction)
The proposed bikeway segments were assessed to determine whether they rated a high, medium, low, or no rating for each criterion and given a numerical value of 3, 2, 1, or 0, respectively. Segments were rated for each evaluation criteria, the ratings were weighted giving a total maximum segment score of 3 points and a minimum score of 0 points. A detailed explanation of each factor is included in the Appendix G.
Priority Location Project Cost Estimate
Most of the corridors listed involve restriping existing travel lanes and adding appropriate signage to create new bicycle facilities. These signing and striping costs as well as other project costs such as engineering design, survey, mobilization, and project contingencies were evaluated to determine the total project costs and are included in the Appendix H.
Rank Roadway Recommended Facility Score Length Cost Outside
Funding City Match
1 Bowers Avenue (Cabrillo - El Camino) Class III 2.64 0.6 miles $24,500 $19,600 $4,900
2
Benton Street (Lawrence Expwy - San Tomas Expwy) Class II
2.32
2.4 miles $365,000 $292,000 $73,000
Benton Street (San Tomas Expwy - Monroe) Class III 1.7 miles $25,000 $20,000 $5,000
Benton Street (Monroe - El Camino Real) Class II 0.7 miles $68,000 $54,400 $13,600
3 North Winchester (Bellomy - Homestead) Class III 2.29 0.4 miles $5,500 $4,400 $1,100
4
Lafayette Street (Yerba Buena - Calle De Luna) Class II
2.22
0.7 miles $38,500 $30,800 $7,700
Lafayette Street (Laurelwood - Central Expwy) Class II 0.4 miles $40,500 $32,400 $8,100
Bassett (Agnew - Laurelwood) Class II 1.3 miles $144,500 $115,600 $28,900
5Monroe Street (Lawrence Expwy - San Tomas Aquino Creek Trail) Class III
2.171.8 miles $74,000 $59,200 $14,800
Monroe Street (San Tomas Aquino Creek Trail - Scott) Class II 0.4 miles $53,500 $42,800 $10,700
6 Market Street (Monroe - the Alameda) Class III 2.15 0.5 miles $12,500 $10,000 $2,500
7 Saratoga Avenue (San Tomas Expwy - Los Padres) Class II 2.12 0.7 miles $60,500 $48,400 $12,100
8Lick Mill Boulevard (Tasman - Hope) Class II
2.030.7 miles $8,000 $6,400 $1,600
Lick Mill Boulevard (Hope - Montague Expwy) Class III 0.8 miles $53,500 $42,800 $10,700
9Pruneridge Avenue (Pomeroy - San Tomas Expwy) Class II
1.991.3 miles $194,000 $155,200 $38,800
Pruneridge Avenue (San Tomas Expwy - Winchester) Class II 1.0 miles $136,500 $109,200 $27,300
10 Scott Boulevard (N/O Central Expwy - Monroe) Class II 1.77 0.9 miles $120,000 $96,000 $24,000
11 Woodhams Road (Stevens Creek - Homestead) Class III 1.68 1.1 miles $21,500 $17,200 $4,300
12Bohannon (Los Padres - Cypress) Class III
1.680.2 miles $2,500 $2,000 $500
Cypress (Bohannon - Stevens Creek) Class III 0.6 miles $13,000 $10,400 $2,600
13 Chromite Drive (Monroe - Bowers) Class III 1.59 0.4 miles $12,500 $10,000 $2,500
Priority Ranking and Project Costs
Prepared by:Kimley-Horn and Associates, Inc.111 W. Saint John Street, Suite 440San Jose, CA 95113
Prepared for:City of Santa Clara1500 Warburton AvenueSanta Clara, CA 95050

Sant
a C
lara
City
Lim
its
Exis
ting
Cla
ss I
Bike
Pat
h
Exis
ting
Cla
ss II
Bike
Lan
e
Exis
ting
Cla
ss II
I Bike
Rou
te w
/Sha
rrow
Exis
ting
Cla
ss II
I Bike
Rou
te
Exis
ting
Unp
aved
Bike
Pat
h
Exis
ting
Cou
nty
Bike
Fac
ilitie
s
Prop
osed
Cla
ss I
Bike
Pat
h
Prop
osed
Cla
ss II
Bike
Lan
e
Prop
osed
Cla
ss II
I Bike
Rou
te
Futu
re P
ropo
sed
Rou
tes
Futu
re P
artn
erin
g Ag
ency
Rou
te
Rai
l
Bicy
cle
Park
ing
Loca
tion
Show
ers
& Lo
cker
s
LE
GE
ND
TRAI
N / L
IGHT
RAI
L ST
ATIO
NS
1 Ac
e-G
reat
Am
eric
a St
atio
n
2 C
altra
in–S
anta
Cla
ra S
tatio
n
3 C
altra
in–L
awre
nce
Stat
ion
4
Bona
vent
ura
Stat
ion
5
Orc
hard
Sta
tion
6
Rive
r Oak
s St
atio
n
7 Ta
sman
Sta
tion
8
Cis
co W
ay S
tatio
n
9 Ba
ypoi
nte
Stat
ion
10
C
ham
pion
Sta
tion
11
Li
ck M
ill St
atio
n
12
Gre
at A
mer
ica
Stat
ion
13
O
ld Ir
onsi
des
Stat
ion
14
R
eam
woo
d St
atio
n
15
Vien
na S
tatio
n
ACTI
VITY
CEN
TERS
1
Agne
ws
His
toric
Par
k, M
ansi
on &
Aud
itoriu
m
2 C
entra
l Par
k Li
brar
y
3 C
ity H
all
4
City
Pla
za P
ark
& G
azeb
o
5 C
omm
unity
Rec
reat
ion
Cen
ter
6
Elm
er J
ohns
on B
allfi
eld
7
Geo
rge
F. H
aine
s In
tern
atio
nal S
wim
Cen
ter
8
Gre
at A
mer
ica
9
Gym
nast
ics
Cen
ter
10
Lo
u Vi
erra
Bas
ebal
l Fie
ld
11
Mis
sion
City
Cen
ter f
or P
erfo
rmin
g Ar
ts
12
Mis
sion
Lib
rary
Fam
ily R
eadi
ng C
ente
r
13
Ree
d St
reet
Dog
Par
k
14
Sant
a C
lara
Con
vent
ion
Cen
ter
15
Sa
nta
Cla
ra S
enio
r Cen
ter
16
Sa
nta
Cla
ra T
enni
s C
ente
r
17
Sant
a C
lara
You
th S
occe
r Par
k
18
Tow
nsen
d Fo
otba
ll Fi
eld/
Han
dbal
l Cou
rts
19
Trito
n M
useu
m o
f Art
20
W
alte
r E. S
chm
idt Y
outh
Act
ivity
Cen
ter,
Sk
ate
Park
, & T
een
Cen
ter
21
W
ashi
ngto
n Pa
rk B
aseb
all F
ield
&
War
Mem
oria
l Pla
ygro
und
22
49
er T
rain
ing
Cam
p Fi
elds
23
W
ilson
Adu
lt Ed
ucat
ion
Cen
ter
24
Po
st O
ffice
25
Po
st O
ffice
26
Sa
n To
mas
Aqu
ino
Cre
ek T
railh
ead
SCHO
OLS
1
Hug
hes
Elem
enta
ry
2 D
on C
alle
jon
Scho
ol
3 M
onta
gue
Elem
enta
ry
4 Br
ache
r Ele
men
tary
5
Wilc
ox H
igh
Scho
ol
6 Br
iarw
ood
Elem
enta
ry
7 N
ew V
alle
y H
igh
Scho
ol
8 Sa
nta
Cla
ra U
nifie
d Sc
hool
Dis
trict
9
Bow
ers
Elem
enta
ry
10
Cab
rillo
Mid
dle
Scho
ol
11
Scot
t Lan
e El
emen
tary
12
Bu
chse
r Mid
dle
Scho
ol
13
Was
hing
ton
Ope
n El
emen
tary
14
H
aman
Ele
men
tary
15
M
illiki
n Sc
hool
16
Sa
nta
Cla
ra H
igh
Scho
ol
17
Pom
eroy
Ele
men
tary
18
C
urtis
Sch
ool
19
La
urel
woo
d El
emen
tary
20
Su
tter E
lem
enta
ry
21
Eise
nhow
er E
lem
enta
ry
22
Car
den
Enca
nto
Scho
ol
23
Wes
twoo
d El
emen
tary
BRID
GES
A
Lafa
yette
Stre
et P
edes
trian
ove
r-cro
ssin
g
Sout
hern
Pac
ific
RR
(nea
r El C
amin
o)
B R
iver O
aks
Bicy
cle
Pede
stria
n Br
idge
ove
r
G
uada
lupe
Rive
r
C
Brid
ge o
ver S
an T
omas
Aqu
ino
Cre
ek (b
etw
een
Con
vent
ion
Cen
ter a
nd G
olf C
ours
e)
D
Pede
stria
n Br
idge
bet
wee
n Tr
acy
Driv
e an
d
Mau
ricia
Ave
nue
E
Pede
stria
n Br
idge
at B
rach
er P
ark
over
Bow
ers
F
Pede
stria
n Br
idge
to In
tel n
ear M
issi
on C
olle
ge
Boul
vard
(Priv
ate)
G
Pe
dest
rian
Brid
ge a
t old
3C
om s
ite n
ear O
ld
Mou
ntai
n Vi
ew-A
lvis
o R
oad
(Priv
ate)
H
Br
idge
ove
r Cal
abaz
as C
reek
at A
gate
Driv
e
I Br
idge
ove
r Cal
abaz
as C
reek
into
Sun
nyva
le
north
of M
issi
on C
olle
ge
J Br
idge
ove
r San
Tom
as E
xpre
ssw
ay n
ear
Sara
toga
Ave
nue
K
Bike
/Ped
land
-brid
ge M
auric
ia A
ve to
Alle
n
Way
/May
woo
d Pa
rk
L Tw
o bi
ke/p
ed b
ridge
s in
Cen
tral P
ark
Bent
on S
treet
In c
oncu
rrenc
e w
ith th
e Fe
asib
ility
Stud
y co
nduc
ted
by F
ehr &
Pee
rs in
Mar
ch 2
008,
a ro
ad
diet
is re
com
men
ded
on B
ento
n St
reet
bet
wee
n La
wre
nce
Expr
essw
ay a
nd S
an T
omas
Ex
pres
sway
. Th
e ro
ad d
iet w
ould
redu
ce th
e fo
ur-la
ne c
ross
sec
tion
to a
thre
e-la
ne c
ross
se
ctio
n (w
ith a
two-
way
-left-
turn
lane
) and
add
Cla
ss II
bic
ycle
lane
s on
the
road
way
. Th
e se
ctio
n of
Ben
ton
Stre
et b
etw
een
San
Tom
as E
xpre
ssw
ay a
nd M
onro
e St
reet
is p
ropo
sed
to b
e a
Cla
ss II
I bic
ycle
rout
e. A
cou
ple
of fe
et w
ill be
take
n fro
m th
e tra
vel l
anes
to p
rovi
de
mor
e ro
om in
eac
h di
rect
ion
for b
icyc
lists
. Be
nton
Stre
et b
etw
een
Mon
roe
Stre
et a
nd E
l C
amin
o R
eal i
s pr
opos
ed to
add
Cla
ss II
bic
ycle
lane
s by
rest
ripin
g th
e ex
istin
g tra
vel l
anes
in
this
sec
tion.
No
rem
oval
of p
arki
ng w
ill be
nec
essa
ry.
Boha
nnon
Driv
eBo
hann
on D
rive
is p
ropo
sed
to h
ave
a C
lass
III b
icyc
le ro
ute
from
Los
Pad
res
Boul
evar
d to
Cyp
ress
Driv
e. T
he e
xist
ing
trave
l lan
es w
ill be
nar
row
ed to
pro
vide
mor
e ro
om fo
r the
cy
clis
ts in
the
outs
ide
lane
.
Bow
ers
Aven
ueBo
wer
s Av
enue
is p
ropo
sed
to h
ave
a C
lass
III b
icyc
le ro
ute
from
the
exis
ting
C
lass
III f
acilit
y at
Cab
rillo
Ave
nue
sout
h to
El C
amin
o R
eal.
The
exi
stin
g tra
vel l
anes
will
be n
arro
wed
to p
rovi
de m
ore
room
for t
he c
yclis
ts in
the
outs
ide
lane
.
Chro
mite
Driv
eC
hrom
ite D
rive
is p
ropo
sed
to h
ave
a C
lass
III b
icyc
le ro
ute
from
Mon
roe
Stre
et to
Bow
ers
Aven
ue.
The
exis
ting
trave
l lan
es w
ill be
nar
row
ed to
pro
vide
mor
e ro
om fo
r the
cyc
lists
in
the
outs
ide
lane
.
Cypr
ess
Driv
eC
ypre
ss D
rive
is p
ropo
sed
to h
ave
a C
lass
III b
icyc
le ro
ute
from
Boh
anno
n D
rive
to
Stev
ens
Cre
ek B
oule
vard
. Th
e ex
istin
g tra
vel l
anes
will
be n
arro
wed
to p
rovi
de m
ore
room
fo
r the
cyc
lists
in th
e ou
tsid
e la
ne.
Lafa
yette
Stre
et –
Bas
sett
Stre
etLa
faye
tte S
treet
is p
ropo
sed
to h
ave
a C
lass
II b
icyc
le la
ne fr
om Y
erba
Bue
na W
ay to
th
e ex
istin
g bi
cycl
e la
ne a
t Cal
le d
e Lu
na.
At th
e so
uth
end
of th
e ex
istin
g bi
cycl
e la
ne
at A
gnew
Roa
d, th
e bi
cycl
e la
ne is
pro
pose
d to
con
tinue
sou
th o
nto
Bass
ett S
treet
, jus
t pa
ralle
l to
Lafa
yette
Stre
et o
n th
e w
est s
ide
of th
e ra
ilroa
d tra
cks.
The
rem
oval
of p
arki
ng
on th
e w
est s
ide
of B
asse
tt St
reet
wou
ld b
e ne
cess
ary
to in
clud
e a
Cla
ss II
bic
ycle
lane
fro
m A
gnew
Roa
d to
Lau
relw
ood
Driv
e, w
here
it w
ould
hea
d ea
st to
con
nect
bac
k to
La
faye
tte S
treet
. C
lass
II b
icyc
le la
nes
are
prop
osed
from
Lau
relw
ood
Driv
e so
uth
to
Cen
tral E
xpre
ssw
ay.
As a
n al
tern
ative
to th
is C
lass
II ro
ute,
a C
lass
I bi
cycl
e pa
th is
pr
opos
ed fr
om A
gnew
Roa
d on
Laf
ayet
te S
treet
to A
ldo
Aven
ue n
ear t
he U
nion
Pac
ific
Rai
lroad
(UPR
R) t
rack
s. T
here
is a
min
imum
of 1
2 fe
et o
f cle
aran
ce b
etw
een
Lafa
yette
St
reet
and
the
railr
oad
track
s w
here
a 6
- to
8-fo
ot b
ike p
ath
coul
d be
impl
emen
ted.
If t
he
City
is n
ot a
ble
to s
ucce
ssfu
lly c
oord
inat
e w
ith th
e U
PRR
on
this
pro
posa
l, th
en th
e th
ird
optio
n fo
r Laf
ayet
te S
treet
is a
Cla
ss II
I bic
ycle
rout
e be
twee
n C
entra
l Exp
ress
way
and
W
arbu
rton
Aven
ue.
Lick
Mill
Bou
leva
rdC
lass
II b
icyc
le la
nes
are
prop
osed
on
Lick
Mill
Boul
evar
d be
twee
n Ta
sman
Driv
e an
d H
ope
Driv
e. L
ick M
ill Bo
ulev
ard
is w
ide
enou
gh to
rest
ripe
the
exis
ting
trave
l lan
es to
mak
e ro
om fo
r bic
ycle
lane
s. A
sec
ond
alte
rnat
ive if
the
bicy
cle
lane
s ar
e no
t im
plem
ente
d is
to
add
a C
lass
III b
icyc
le ro
ute
to th
is s
ectio
n of
the
corri
dor.
Lick
Mill
Boul
evar
d fro
m H
ope
Driv
e to
Mon
tagu
e Ex
pres
sway
is p
ropo
sed
as a
Cla
ss II
I bic
ycle
rout
e. T
he tr
avel
lane
s w
ill be
nar
row
ed s
light
ly to
cre
ate
addi
tiona
l roo
m fo
r the
cyc
lists
.
Mar
ket S
treet
Mar
ket S
treet
is p
ropo
sed
to h
ave
a C
lass
III b
icyc
le ro
ute
from
Mon
roe
Aven
ue to
The
Al
amed
a. T
he e
xist
ing
trave
l lan
es w
ill be
nar
row
ed to
pro
vide
mor
e ro
om fo
r the
cyc
lists
in
the
outs
ide
lane
.
Mon
roe
Stre
etIt
is p
ropo
sed
to p
ut a
Cla
ss II
I bic
ycle
rout
e on
Mon
roe
Stre
et b
etw
een
Law
renc
e Ex
pres
sway
and
the
San
Tom
as A
quin
o C
reek
trai
l. T
he tr
avel
lane
s w
ill be
nar
row
ed
slig
htly
in th
is a
rea
to p
rovi
de m
ore
room
in e
ach
dire
ctio
n fo
r the
cyc
lists
. C
lass
II b
icyc
le
lane
s ar
e pr
opos
ed fr
om th
e Sa
n To
mas
Aqu
ino
Cre
ek tr
ail t
o Sc
ott B
oule
vard
, whe
re th
e ex
istin
g C
lass
II b
icyc
le la
nes
curre
ntly
beg
in o
n M
onro
e St
reet
. Fo
r the
mos
t par
t thi
s
sect
ion
of M
onro
e St
reet
is w
ide
enou
gh to
rest
ripe
lane
s bu
t for
a s
hort
sect
ion
near
San
To
mas
Exp
ress
way
som
e on
-stre
et p
arki
ng m
ay n
eed
to b
e re
mov
ed.
N. W
inch
este
r Bou
leva
rdN
. Win
ches
ter B
oule
vard
is p
ropo
sed
to h
ave
a C
lass
III b
icyc
le ro
ute
from
Hom
este
ad
Roa
d to
the
exis
ting
Cla
ss II
bic
ycle
lane
at B
ello
my
Stre
et a
nd a
gain
at t
he e
nd o
f the
C
lass
II fa
cilit
y no
rth o
f New
hall
Stre
et to
Pru
nerid
ge A
venu
e. T
he e
xist
ing
trave
l lan
es w
ill be
nar
row
ed to
pro
vide
mor
e ro
om fo
r the
cyc
lists
in th
e ou
tsid
e la
ne.
It is
pro
pose
d th
at
N. W
inch
este
r Bou
leva
rd b
e a
Cla
ss II
I bic
ycle
rout
e fro
m P
rune
ridge
Ave
nue
to S
teve
ns
Cre
ek B
oule
vard
.
Prun
erid
ge A
venu
eIn
con
curre
nce
with
the
Feas
ibilit
y St
udy
cond
ucte
d by
Feh
r & P
eers
in M
arch
200
8, a
road
di
et is
reco
mm
ende
d on
Pru
nerid
ge A
venu
e be
twee
n Po
mer
oy A
venu
e an
d N
. Win
ches
ter
Boul
evar
d. T
he ro
ad d
iet w
ould
redu
ce th
e fo
ur-la
ne c
ross
sec
tion
to a
thre
e-la
ne c
ross
se
ctio
n (w
ith a
two-
way
-left-
turn
lane
) and
add
Cla
ss II
bic
ycle
lane
s on
the
road
way
. A
seco
nd a
ltern
ative
if th
e ro
ad d
iet i
s no
t im
plem
ente
d is
to a
dd a
Cla
ss II
I bic
ycle
rout
e to
the
corri
dor.
No
rem
oval
of p
arki
ng w
ill be
nec
essa
ry. T
his
is a
n im
porta
nt e
ast-w
est
corri
dor t
hat w
ill co
nnec
t man
y ex
istin
g no
rth-s
outh
bic
ycle
faci
litie
s in
the
sout
hern
por
tion
of th
e C
ity o
f San
ta C
lara
. In
add
ition
, Pru
nerid
ge A
venu
e is
pro
pose
d to
hav
e a
Cla
ss II
bi
ke la
ne b
etw
een
Tant
au A
venu
e an
d Po
mer
oy A
venu
e.
Sara
toga
Ave
nue
Sara
toga
Ave
nue
is p
ropo
sed
to h
ave
Cla
ss II
bic
ycle
lane
s fro
m S
an T
omas
Exp
ress
way
to
Los
Pad
res
Boul
evar
d. T
he e
xist
ing
road
way
is w
ide
enou
gh to
rest
ripe
the
trave
l lan
es
and
inst
all b
icyc
le la
nes.
Fro
m L
os P
adre
s Bo
ulev
ard
to M
arke
t Stre
et, S
arat
oga
Aven
ue is
pr
opos
ed a
s a
Cla
ss II
I bic
ycle
rout
e.
Sara
toga
Cre
ek Tr
ail
It is
pro
pose
d to
put
a C
lass
I bi
cycl
e pa
th a
long
a p
ortio
n of
Sar
atog
a C
reek
. Th
e pa
th
wou
ld b
egin
on
the
wes
t sid
e of
Kie
ly B
oule
vard
at K
aise
r Driv
e an
d en
d w
here
Sar
atog
a C
reek
inte
rsec
ts th
e no
rth s
ide
of H
omes
tead
Roa
d.
Scot
t Bou
leva
rdIt
is p
ropo
sed
to e
xten
d th
e ex
istin
g C
lass
II b
icyc
le la
nes
on S
cott
Boul
evar
d fro
m th
e cu
rrent
term
inus
just
nor
th o
f Cen
tral E
xpre
ssw
ay to
Mon
roe
Stre
et.
Scot
t Bou
leva
rd is
w
ide
enou
gh to
rest
ripe
the
exis
ting
trave
l lan
es in
this
sec
tion
to h
ave
enou
gh ro
om fo
r bi
cycl
e la
nes
for t
he m
ost p
art.
On
Scot
t Bou
leva
rd b
etw
een
Mar
tin A
venu
e an
d W
alsh
Av
enue
ther
e is
exi
stin
g pa
rkin
g in
the
sout
hbou
nd d
irect
ion
but t
here
is o
ff-st
reet
par
king
fo
r tho
se b
usin
esse
s as
wel
l. If
park
ing
is re
mov
ed fo
r thi
s se
ctio
n th
en a
Cla
ss II
bic
ycle
la
ne is
feas
ible
bet
wee
n C
entra
l Exp
ress
way
and
Mon
roe
Stre
et (i
nclu
ding
ove
r the
brid
ge
sect
ion)
. A s
econ
d al
tern
ative
if b
icyc
le la
nes
are
not i
mpl
emen
ted
is to
add
a C
lass
III
bicy
cle
rout
e to
this
sec
tion
of th
e co
rrido
r.
Woo
dham
s Ro
adW
oodh
ams
Roa
d is
pro
pose
d to
hav
e a
Cla
ss II
I bic
ycle
rout
e fro
m H
omes
tead
Roa
d to
St
even
s C
reek
Bou
leva
rd.
The
exis
ting
trave
l lan
es w
ill be
nar
row
ed to
pro
vide
mor
e ro
om
for t
he c
yclis
ts in
the
outs
ide
lane
.
Futu
re P
ropo
sed
Rout
esTh
e fo
llow
ing
road
way
s ar
e co
nsid
ered
futu
re p
ropo
sed
bicy
cle
rout
es.
This
des
igna
tion
is b
ased
on
fore
cast
ed
high
cos
ts o
r oth
er m
ajor
des
ign
issu
es s
uch
as ri
ght-o
f-way
av
aila
bilit
y, re
mov
al o
f on-
stre
et p
arki
ng, o
r oth
er fa
ctor
s.
•Aga
teD
rive
•Alv
iso
Stre
et—
Palm
Driv
e •C
alab
azas
Cre
ekT
rail
•De
laC
ruz
Boul
evar
dTh
omas
Roa
d •H
arris
onS
treet
•G
arrit
yW
ay
•Kie
lyB
oule
vard
•L
aure
lwoo
dR
oad
•Mar
tinA
venu
e •M
issi
onC
olle
geB
oule
vard
•N
ewha
llSt
reet
•P
atric
kH
enry
Driv
e •S
arat
oga
Aven
ue
•Tas
man
Driv
e •W
alsh
Ave
nue
•War
burto
nAv
enue
•W
ashi
ngto
nSt
reet
•W
hite
Driv
e •W
inch
este
rBou
leva
rd
Futu
re P
artn
erin
g Ag
ency
Rou
tes
The
follo
win
g ro
adw
ays
are
desi
gnat
ed a
s fu
ture
par
tner
ing
agen
cy ro
utes
sin
ce th
ey a
re lo
cate
d ou
tsid
e of
the
City
’s ju
risdi
ctio
n. T
he C
ity o
f San
ta C
lara
see
ks to
par
tner
with
ne
ighb
orin
g ag
enci
es to
impr
ove
conn
ectiv
ity to
cyc
lists
en
terin
g an
d ex
iting
the
Sant
a C
lara
bic
ycle
faci
lity
netw
ork
thro
ugh
com
plet
ion
of th
ese
adja
cent
faci
litie
s:
Airp
ort B
oule
vard
; Cyp
ress
Ave
nue;
De
la C
ruz
Boul
evar
d;
El C
amin
o R
eal;
the
Gol
d St
reet
con
nect
or; G
uada
lupe
R
iver T
rail;
N. W
inch
este
r Bou
leva
rd; S
teve
ns C
reek
Bo
ulev
ard.

APPENDICES
A. BICYCLE SURVEY RESULTS
B. BICYCLE COLLISION SUMMARY
C. PAST EXPENDITURES
D. BIKEWAY PLANNING AND DESIGN
E. CROSS COUNTY BICYCLE CORRIDORS
F. BICYCLE DETECTION RANKING
G. PRIORITY RANKING
H. COST ESTIMATES FOR PROPOSED FACILITIES

APPENDIX A
BICYCLE SURVEY RESULTS

2009 Santa Clara Bicycle Plan Update City of Santa Clara
September 14, 2009
Survey Email
The following email was sent out to the City of Santa Clara employees as well as SantaClara University faculty, staff, and students requesting their participation in the onlinesurvey.
“You have been invited to participate in a brief 11 question online survey to helpthe City of Santa Clara assess the current status of the bicycle network as well aspotential future priorities. You have been selected for this survey as a member ofa major employer or organization within the City and therefore a potentialprimary user of the bicycle network. Your answers will help to set the path forthe 2008 City of Santa Clara Bicycle Plan update. No personal information isrequested, nor employer/ organization information collected. The survey shouldtake about 5 minutes to complete. The web link to the online survey is listedbelow. We would appreciate your response to the survey before October 31st,2008.
http://www.surveymonkey.com/s.aspx?sm=vOYmi3bowkHMiCDrmwwIgw_3d_3d
Thank you in advance or your cooperation and contributing to the understandingand improvement of the bicycle network in the City of Santa Clara!
Any questions concerning the online survey should be directed to Benjamin Huieat [email protected] (Engineering Consultant). Any questionsconcerning the overall project should be directed to Lorenzo Lopez [email protected] (City of Santa Clara Project Manager).”
A-1
Page 1
City of Santa Clara Bicycle SurveyCity of Santa Clara Bicycle SurveyCity of Santa Clara Bicycle SurveyCity of Santa Clara Bicycle Survey
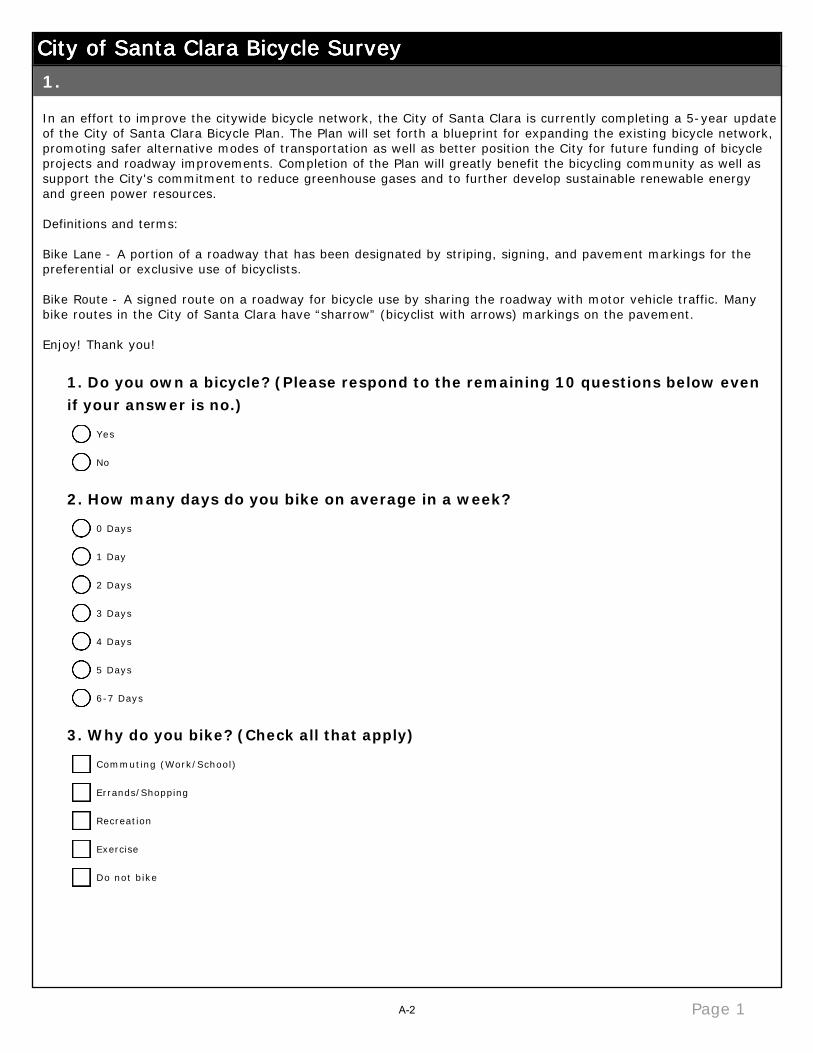
In an effort to improve the citywide bicycle network, the City of Santa Clara is currently completing a 5-year update of the City of Santa Clara Bicycle Plan. The Plan will set forth a blueprint for expanding the existing bicycle network, promoting safer alternative modes of transportation as well as better position the City for future funding of bicycle projects and roadway improvements. Completion of the Plan will greatly benefit the bicycling community as well as support the City's commitment to reduce greenhouse gases and to further develop sustainable renewable energy and green power resources.
Definitions and terms:
Bike Lane - A portion of a roadway that has been designated by striping, signing, and pavement markings for the preferential or exclusive use of bicyclists.
Bike Route - A signed route on a roadway for bicycle use by sharing the roadway with motor vehicle traffic. Many bike routes in the City of Santa Clara have “sharrow” (bicyclist with arrows) markings on the pavement.
Enjoy! Thank you!
1. Do you own a bicycle? (Please respond to the remaining 10 questions below even if your answer is no.)
2. How many days do you bike on average in a week?
3. Why do you bike? (Check all that apply)
1.
Yes
nmlkj
No
nmlkj
0 Days
nmlkj
1 Day
nmlkj
2 Days
nmlkj
3 Days
nmlkj
4 Days
nmlkj
5 Days
nmlkj
6-7 Days
nmlkj
Commuting (Work/School)
gfedc
Errands/Shopping
gfedc
Recreation
gfedc
Exercise
gfedc
Do not bike
gfedc
A-2

Page 2
City of Santa Clara Bicycle SurveyCity of Santa Clara Bicycle SurveyCity of Santa Clara Bicycle SurveyCity of Santa Clara Bicycle Survey4. If you do not commute by bike to work or school, why not? Please rate each reason.
5. If you do commute by bike to work or school, why? Please rate each reason.
Not True Somewhat True True
Work or school is too far
from home.nmlkj nmlkj nmlkj
I do not feel safe
commuting by bike.nmlkj nmlkj nmlkj
There is nowhere for me
to park or store my bike.nmlkj nmlkj nmlkj
There are no showers or
change facilities at school
or work.
nmlkj nmlkj nmlkj
There are no bike
facilities along my route
to school or work.
nmlkj nmlkj nmlkj
Commuting by bicycle will
take too long.nmlkj nmlkj nmlkj
I do not own a bike. nmlkj nmlkj nmlkj
Not True Somewhat True True
I work or go to school
close to home.nmlkj nmlkj nmlkj
The bicycle commute is
faster than by car.nmlkj nmlkj nmlkj
It is more economically
beneficial to ride my bike
than any other means of
transportation.
nmlkj nmlkj nmlkj
It is more
environmentally
beneficial to ride my bike
than any others means
of transportation.
nmlkj nmlkj nmlkj
Riding a bicycle is good
exercise.nmlkj nmlkj nmlkj
I have a shower or
changing facility at school
or work.
nmlkj nmlkj nmlkj
I can park my bike in a
safe place at school or
work.
nmlkj nmlkj nmlkj
I do not own a bike. nmlkj nmlkj nmlkj
A-3

Page 3
City of Santa Clara Bicycle SurveyCity of Santa Clara Bicycle SurveyCity of Santa Clara Bicycle SurveyCity of Santa Clara Bicycle Survey6. Which designated corridors with existing bike facilities do you use? (Check all that apply)
7. Would the addition of bike routes (designated bicycle facilities with no bike lane striping or bike icons on existing pavement) or bike lanes encourage you to cycle more?
None
gfedc
Great America Parkway / Bowers Avenue
gfedc
Calabazas Avenue
gfedc
Pomeroy Avenue
gfedc
Los Padres Boulevard
gfedc
Homestead Road
gfedc
Monroe Street
gfedc
Scott Boulevard
gfedc
Agnew Road
gfedc
Lafayette Street
gfedc
Yerba Buena Way
gfedc
Mission College Boulevard
gfedc
Cabrillo Avenue
gfedc
Market Street
gfedc
Bellomy Street
gfedc
Lawrence Expressway
gfedc
Central Expressway
gfedc
San Tomas Expressway
gfedc
Old Mountain View Alviso Road
gfedc
San Tomas Aquino Creek Trail
gfedc
Yes, I would be comfortable enough to cycle more with the addition of more bike routes.
nmlkj
Yes, I would be comfortable enough to cycle more with the addition of more bike lanes (as well as bike routes).
nmlkj
No, I will ride whether or not there are additional facilities.
nmlkj
No, I will continue to not ride my bike.
nmlkj
A-4
Page 4
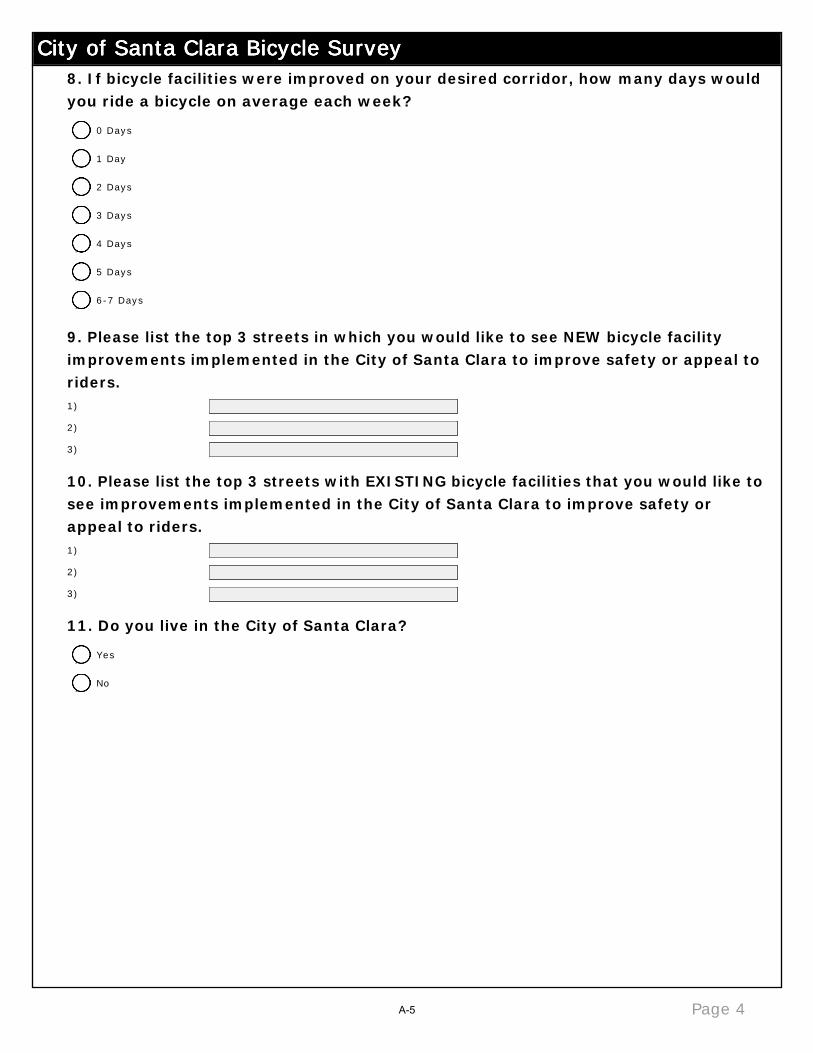
City of Santa Clara Bicycle SurveyCity of Santa Clara Bicycle SurveyCity of Santa Clara Bicycle SurveyCity of Santa Clara Bicycle Survey8. If bicycle facilities were improved on your desired corridor, how many days would you ride a bicycle on average each week?
9. Please list the top 3 streets in which you would like to see NEW bicycle facility improvements implemented in the City of Santa Clara to improve safety or appeal to riders.
10. Please list the top 3 streets with EXISTING bicycle facilities that you would like to see improvements implemented in the City of Santa Clara to improve safety or appeal to riders.
11. Do you live in the City of Santa Clara?
1)
2)
3)
1)
2)
3)
0 Days
nmlkj
1 Day
nmlkj
2 Days
nmlkj
3 Days
nmlkj
4 Days
nmlkj
5 Days
nmlkj
6-7 Days
nmlkj
Yes
nmlkj
No
nmlkj
A-5

City of Santa Clara Bicycle Survey Results
Response (%) Response (#)Yes……………………………………………………………………………………………..………… 86.9% 556No………………………………………………………………..………………………………………. 13.1% 84Total……………………………………………………..……………………………………………… 640
Response (%)0 Days………………………………………………………….………………………………………. 28.3%1-3 Days……………………………………….…………………...…………………………………. 36.4%More than 4 Days………………………………………………….……………………………….. 35.3%
Response (%)Exercise……………………………………………….……………………………………………….. 62.4%Recreation………………………………………………..……………………………………………. 59.5%Commuting (Work/School)…………………………………..…………………………………… 49.7%Errands/Shopping………………………………………..………………………………………….. 33.3%Do not bike………………………………………………..…………………………………………… 17.9%
Not True Somewhat True or TrueWork or school is too far from home…………………………….…………………………… 192 188I do not feel safe commuting by bike……………………………..……………..…………… 144 232There is nowhere for me to park or store my bike………………………………..……… 242 131There are no showers or change facilities at school or work…………………………. 187 193There are no bike facilities along my route to school or work………………………… 196 168Commuting by bicycle will take too long…………………………………….………………. 174 203I do not own a bike…………………………………………..………………..………………….. 294 79
Not True Somewhat True or TrueI work or go to school close to home……………………..………...……..……………….. 80 281The bicycle commute is faster than by car………………………..……..………………… 172 182It is more economically beneficial to ride my bike than any other means oftransportation…………………………….………………………………...………………………. 25 338It is more environmentally beneficial to ride my bike than any others means oftransportation……..………………..……..…………….……………………….…………………. 20 345Riding a bicycle is good exercise……………………………………………………….……… 10 355I have a shower or changing facility at school or work……………………………….… 170 185I can park my bike in a safe place at school or work……………………………………. 36 327I do not own a bike………………………………………….…………………………………….. 275 58
Q1. Do you own a bicycle?
Q2. How many days do you bike on average in a week?
Q3. Why do you bike? (Check all that apply)
Q4. If you do not commute by bike to work or school, why not?
Q5. If you do commute by bike to work or school, why?
A-6

Response (%)None………………………………………………………………………….…………………………. 42.6%Homestead Road………………………………………………………….………………………… 32.5%Lafayette Street………………………………………………………….………………………….. 26.8%Monroe Street…………………………………………………………..……………………………. 21.9%Market Street………………………………………………………….…………………………….. 19.8%Bellomy Street……………….………………………………….…………………………………… 19.3%Scott Boulevard……………………………………………………………………………………… 14.4%San Tomas Aquino Creek Trail………………………………………………………….……… 11.8%San Tomas Expressway…………………………………...…………………………………….. 10.9%Los Padres Boulevard………………………………….………………………………………….. 9.5%Central Expressway…………………………………….………………………………………….. 7.9%Great America Parkway / Bowers Avenue………………………………….……………….. 7.5%Lawrence Expressway…………………………………….………………………………………. 7.0%Pomeroy Avenue………………………………………………..…………………………………… 5.3%Cabrillo Avenue…………………………………………..………………………………………….. 4.6%Calabazas Avenue…………………………………..………………………………………………. 3.5%Mission College Boulevard………………………………………..………………………………. 3.5%Agnew Road……………………………………………….…………………………………………. 3.0%Old Mountain View Alviso Road…………………………………..…………………………….. 2.6%Yerba Buena Way……………………………………………..…………………………………….. 0.4%
Response (%)Yes, I would be comfortable enough to cycle more with the addition of morebike routes……………………………...…..………......……………..……..…………………… 14.1%Yes, I would be comfortable enough to cycle more with the addition of morebike lanes (as well as bike routes)……………………………………………………..…….. 52.8%No, I will ride whether or not there are additional facilities…………………………… 17.6%No, I will continue to not ride my bike………………………………….……………………. 15.5%
Response (%)0 Days………………………………………………………………..…………………………………. 17.6%1-3 Days…………………………………………………..……………………………………………. 31.7%More than 4 Days………………………………………..………………………………………….. 50.7%
Street Name Total %El Camino Real 126 18.2%Lafayette Street 74 10.7%The Alameda 50 7.2%Benton Street 34 4.9%Saratoga Road 34 4.9%Pruneridge Avenue 30 4.3%Winchester Boulevard 25 3.6%Monroe Street 22 3.2%Kiely Boulevard 21 3.0%Park Avenue 20 2.9%Homestead Road 18 2.6%Scott Boulevard 18 2.6%
Q7. Would the addition of bike routes (designated bicycle facilities with no bike lane striping or bike iconson existing pavement) or bike lanes encourage you to cycle more?
Q8. If bicycle facilities were improved on your desired corridor, how many days would you ride a bicycle onaverage each week?
Q9. List the top 3 streets you would like to see NEW bicycle facility improvements.
Q6. Which designated corridors with existing bike facilities do you use? (Check all that apply)
A-7

Street Name Total %Lafayette Street 51 12.6%Homestead Road 43 10.6%San Tomas Expressway 30 7.4%El Camino Real 28 6.9%Monroe Street 27 6.7%Scott Boulevard 21 5.2%Park Avenue 21 5.2%Market Street 16 3.9%Lawrence Expressway 15 3.7%Winchester Boulevard 13 3.2%Central Expressway 13 3.2%
Q10. List the top 3 streets with EXISTING bicycle facilities that you would like improvements implemented.
A-8

APPENDIX B
BICYCLE COLLISION SUMMARY

2009 Santa Clara Bicycle Plan Update City of Santa Clara
Street PercentageEl Camino Real 10.0%Lafayette Street 5.0%Monroe Street 5.0%Kiely Boulevard 4.4%Scott Boulevard 4.2%Homestead Road 3.9%Benton Street 3.6%Stevens Creek Boulevard 2.8%Bowers Avenue 2.5%Pruneridge Avenue 2.2%Warburton Avenue 1.9%
Year Total Winchester Boulevard 1.9%2002 24 77% 7 23% 31 Saratoga Avenue 1.9%2003 23 88% 3 12% 26 Cabrillo Avenue 1.7%2004 22 88% 3 12% 25 Lawrence Expressway 1.7%2005 24 73% 9 27% 33 Calabazas Boulevard 1.7%2006 23 72% 9 28% 32 Central Expressway 1.7%2007 30 88% 4 12% 34 Other Streets 43.9%Total 146 81% 35 19% 181 Total 100.0%
Year Total2002 22 71% 0 0% 9 29% 312003 23 88% 0 0% 3 12% 262004 13 52% 0 0% 12 48% 252005 29 88% 0 0% 4 12% 332006 27 84% 0 0% 5 16% 322007 25 74% 0 0% 9 26% 34Total 139 77% 0 0% 42 23% 181
Collision Summary by StreetBicycle collision data was provided by the City ofSanta Clara from 2002 through 2007 throughout theCity. There were a total of 181 bicycle collisionsduring the time period analyzed. The map on thefollowing page illustrates the number of collisionsbetween 2002 and 2007.
City of Santa Clara Collision Summary
Collision Time of Day Summary
Percent of Injury Collisions SummaryInjury Fatal None
Daytime Nighttime
Bicycle Collision Rates.xls September 14, 2009B-1
Copyright © and (P) 1988–2007 Microsoft Corporation and/or its suppliers. All rights reserved. http://www.microsoft.com/streets/Certain mapping and direction data © 2007 NAVTEQ. All rights reserved. The Data for areas of Canada includes information taken with permission from Canadian authorities, including: © HerMajesty the Queen in Right of Canada, © Queen's Printer for Ontario. NAVTEQ and NAVTEQ ON BOARD are trademarks of NAVTEQ. © 2007 Tele Atlas North America, Inc. All rights reserved. Tele Atlas and Tele Atlas North America are trademarks of Tele Atlas, Inc.
2009 Santa Clara Bicycle Plan Update - Collisions Map
0 mi 0.5 1 1.5
B-2

City of Santa Clara
Traffic Engineering Department
Collision Report Summary81412008Date Range Reported: 1/1/02 - 12/31/07Total Number of Collisions: 181
Page 1
Report# Date Time Location Dist. Dir.
Type of Motor Veh. Dir. of Movement Dir. of Movement
PCF Inj. Kil.
Collision Involved With Travel 1 Prec. Coli. 1 Travel 2 Prec. Coil. 2
0033653 1/10/02 08:33 Fordham Dr & Monroe 5' South Vehicle - Bicycle South Making Left West Proceeding Other 0 0St Pedestrian Turn Straight
0095146 2/4/02 11 :36 Stevens Creek Blvd & 0' In Int. Broadside Bicycle South Making Right East Proceeding Auto RIW 0 0
Winchester Blvd Turn Straight Violation
0010124 2/8/02 16:27 Alviso 8t & Franklin St 0' In Int. Sideswipe Bicycle South Proceeding South Parked Improper Turning 0 0Straight
0010129 2/12/02 18:54 Scott Blvd & EI 9' South Broadside Bicycle West Proceeding South Proceeding Wrong Side of 1 0
Camino Real Straight Straight Road
0010108 2/18/02 19:01 Calabazas Blvd & O' In Int. Broadside Bicycle South Proceeding West Proceeding Auto RIW 1 0Machado Ave Straight Straight Violation
0104589 3/12/02 11 :46 Homestead Rd & 0' In Int. Vehicle - Bicycle South Proceeding East Proceeding Wrong Side of 1 0Quince Ave Pedestrian Straight Straight Road
0134419 3/19/02 12:02 Tasman Dr & 50' East Sideswipe Bicycle West Making Left West Making Left Other 1 0Centennial Blvd Turn Turn
0104639 3/25/02 22:08 Homestead Rd & 120' East Broadside Bicycle North Proceeding East Proceeding Auto RIW 1 0
Lawrence Expy Straight Straight Violation
0160562 4/22/02 20:00 Cisco Way & Tasman O' In Int. Sideswipe Bicycle Not State Proceeding Not Stat Proceeding Other 1 0Dr Straight Straight
0198341 5/4/02 08:56 Scott Blvd & Benton St 80' North Broadside Bicycle North Proceeding East Making Right Wrong Side of 1 0Straight Turn Road
0198345 5/4/02 14:33 EI Camino Real & 0' In Int. Broadside Bicycle West Proceeding North Proceeding Traffic Signals 1 0Lafayette St Straight Straight and Signs
0307873 5/15/02 18:58 Lafayette St & Parker 50' North Br0C!dside Bicycle East Entering Traffic North Proceeding Unsafe Starting 1 0St Straight or Backing
0238957 5/29/02 11 :51 Central Expy & 0' In Int. Not Stated Bicycle North Proceeding East Proceeding Auto RIW 1 0Bowers Ave Straight Straight ViolationB-3
Page 2
Report# Date Time Location Dist. Dir.
Type of Motor Veh. Dir. of Movement Dir. of Movement
PCF Inj. Kil.
Collision Involved With Travel 1 Prec. Coli. 1 Travel 2 Prec. Coil. 2
0308894 6/12/02 06:27 Saratoga Ave & Los 0' In Int. Sideswipe Bicycle East Changing East Proceeding Unsafe Lane 1 0
Padres Blvd Lanes Straight Change
0308892 6/19/02 17:57 Los Padres Blvd & 0' In Int. Other Bicycle West Making Left North Making Left Auto RIW 1 0
Serra Ave Turn Turn Violation
0312816 6/20/02 16:57 De La Cruz Blvd & 535' South Broadside Bicycle North Entering Traffic South Traveling Auto RIW 0 0
Reed St Wrong Way Violation
0308758 6/25/02 12:30 Stevens Creek Blvd & 475' East Broadside Bicycle East Proceeding Not Stat Proceeding Wrong Side of 0 0
Saratoga Ave Straight Straight Road
0368380 7/17/02 18:17 Lafayette St & 0' In Int. Broadside Bicycle North Making Left South Proceeding Auto R/W 0 0
Homestead Rd Turn Straight Violation
0368355 7/29/02 15:32 EI Camino Real & 23' East Not Stated Bicycle North Making Right North Proceeding Other Hazardous 1 0
Lincoln St Turn Straight Movement
0368357 8/6/02 08:39 Martin Ave & De La 900' South Other Bicycle East Changing North Proceeding Wrong Side of 0 0
Cruz Blvd Lanes Straight Road
0368473 8/9/02 17:22 Stevens Creek Blvd & 0' In Int. Head-On Bicycle South Making Right East Entering Traffic Auto RIW 1 0
Harold Ave Turn Violation
0368341 8/10/02 14:08 EI Camino Real & 510' East Other Bicycle , East Entering Traffic East Proceeding Other Hazardous 1 0
Pomeroy Ave Straight Movement
0444799 8/26/02 20:12 Pruneridge Ave & 0' In Int. Vehicle - Bicycle West Making Right South Proceeding Improper Turning 1 0
Kiely Blvd Pedestrian Turn Straight
0445572 9/13/02 18:38 Bowers Ave & Cabrillo 0' In Int. Broadside Bicycle West Making Left East Proceeding Auto RIW 1 0
Ave Turn Straight Violation
0448189 9/16/02 17:54 Mckinley Dr & Blake 50' West Broadside Bicycle East Proceeding East Other Unsafe Other Improper 0 0
Ave Straight Turning Driving
0448177 9/19/02 07:42 EI Camino Real & 11' West Broadside Bicycle North Proceeding West Proceeding Auto RIW 2 0
Alpine Ave '! : Straight Straight Violation
0445594 9/20/02 19:37 Pruneridge Ave & O' In Int. Rear-End Bicycle West Proceeding West Proceeding Wrong Side of 1 0
Mark Twain Ct Straight Straight Road
0548640 10/17/02 14:39 Winchester Blvd & 140' North Broadside Bicycle North Making Right North Proceeding Other 1 0
Dorcich St Turn Straight
0536371 11/18/02 05:51 Lafayette St & Di 0' In Int. Other Bicycle North Proceeding North Proceeding Unknown 0 0Guilio Ave Straight StraightB-4
Page 3
Report# Date Time Location Dist. Dir.
Type of Motor Veh. Dir. of Movement Dir. of Movement
PCF Inj. Kil.
Collision Involved With Travel 1 Prec. Coil. 1 Travel 2 Prec. Coil. 2
0536382 11/20/02 15:48 EI Camino Real & 160' West Broadside Bicycle East Making Right East Proceeding Unsafe Lane 1 0
Kiely Blvd Turn Straight Change
0536809 11/27/02 14:25 Bowers Ave & Agate 353' South Hit Object Bicycle East Backing South Proceeding Unsafe Starting 1 0
Dr Straight or Backing
0633882 1/3/03 18:13 Scott Blvd & 0' In Int. Head-On Bicycle East Making Left West Proceeding Improper Turning 1 0
Warburton Ave Turn Straight
0650876 1/26/03 09:56 EI Camino Real & 10' South Broadside Bicycle South Stopped in East Proceeding Auto RfW 1 0
Pomeroy Ave Road Straight Violation
0743452 3/24/03 18:04 Pruneridge Ave & 0' In Int. Sideswipe Bicycle East Making Right East Proceeding Improper Turning 1 0
Winchester Blvd Turn Straight
0790506 4/28/03 15:00 Lafayette St & Hope Dr 0' In Int. Broadside Bicycle Not State Proceeding North Proceeding Unknown 1 0
Straight Straight
0869874 5/20/03 16:00 Main St & Warburton 200' North Other Bicycle South Stopped in South Proceeding Other 1 0
Ave Road Straight
0869898 5/26/03 15:04 Central Expy & Owen 64' West Rear-End Bicycle West Not Stated West Proceeding Auto RfW 1 0
St Straight Violation
0869964 5/31/03 18:49 Kiely Blvd & 13' North Broadside Bicycle West Making Right West Proceeding Improper Turning 1 0
Homestead Rd Turn Straight
0869966 6/1/03 17:38 Stevens Creek Blvd & 0' In Int. Broadside Bicycle North Making U Turn West Proceeding Traffic Signals 0 0
Junipero Serra Fwy W Straight and Signs
0869926 6/5/03 08:22 Kiely Blvd & 528' North Broadside Bicycle North Proceeding East Entering Traffic Wrong Side of 1 0
Homestead Rd Straight Road
0870424 6/8/03 18:30 Mission St & The 0' In Int. Head-On Bicycle East Traveling North Proceeding Unsafe Starting 0 0
Alameda Wrong Way Straight or Backing
0893695 6/13/03 11: 11 Homestead Rd & 0' In Int. Broadside Bicycle East Traveling South Making Right Wrong Side of 1 0
Pomeroy Ave Wrong Way Turn Road
0870345 6/17/03 10:09 De La Cruz Blvd & 205' South Broadside Bicycle North Making Right North Proceeding Improper Turning 1 0
Reed St Turn Straight
0893719 6/23/03 17:45 Monroe St & Newhall 135' North Broadside Bicycle East Proceeding North Proceeding Wrong Side of 1 0
St Straight Straight Road
0955342 7/10/03 17:20 Monroe St & Machado 30' South Sideswipe Bicycle South Making Right South Proceeding Improper Turning 1 0Ave Turn StraightB-5

Page 4
Report# Date Time Location Dist. Dir.
Type of Motor Veh. Dir. of Movement Dir. of Movement
PCF Inj. Kil.
Collision Involved With Travel 1 Prec. Coil. 1 Travel 2 Prec. Coil. 2
0955288 7/16/03 16: 15 Winchester Blvd & 7' South Head-On Bicycle North Traveling East Making Right Wrong Side of 1 0
University Sl (N) Wrong Way Turn Road
0955316 7/16/03 18:55 Lawrence Expy & EI 0' In In1. Broadside Bicycle East Entering Traffic South Proceeding Wrong Side of 1 0
Camino Real Straight Road
0955345 7/22/03 15:48 EI Camino Real & 16' East Broadside Bicycle West Proceeding North Making Right Wrong Side of 1 0
Lincoln St Straight Turn Road
0955272 8/1/03 07:55 Monroe St & 105' East Other Bicycle East Proceeding East Making Right Unsafe Speed 1 0
Lawrence Expy Straight Turn
1015081 8/16/03 19:21 Civic Center Dr & 400' South Broadside Bicycle North Proceeding East Entering Traffic Wrong Side of 1 0
Warburton Ave Straight Road
1016534 9/7/03 09:39 EI Camino Real & 0' In In1. Broadside Bicycle West Making Left East Proceeding Auto R/W 1 0
Bowers Ave Turn Straight Violation
1016572 9/19/03 05:56 Bowers Ave & Central 0' In In1. Broadside Bicycle South Making Right North Traveling Wrong Side of 1 0
Expy Turn Wrong Way Road
1073735 9/25/03 17:59 Tasman Dr & 0' In In1. Other Bicycle North Making Right East Proceeding Auto R/W 1 0
Centennial Blvd Turn Straight Violation
1070924 10/2/03 15:03 Granada Ave & 0' In In1. Rear-End Bicycle East Proceeding East Parked Unknown 0 0
Mcpherson St Straight
1127655 11/3/03 11 :32 Kiely Blvd & Benton St 150' South Other Bicycle South Traveling East Entering Traffic Wrong Side of 1 0
Wrong Way Road
1233311 12/16/03 20:11 EI Camino Real & 100' East Broadside Bicycle South Entering Traffic East Proceeding Auto R/W 1 0
Kiely Blvd Straight Violation
1233685 12/17/03 17:04 Pruneridge Ave & 132' West Broadside Bicycle West Traveling South Making Right Wrong Side of 1 0
Winchester Blvd Wrong Way Turn Road
1233389 1/14/04 19:14 Alviso St & Benton St 0' In In1. Broadside Bicycle North Proceeding South Making Left Lights 1 0
Straight Turn
1271234 1/16/04 15:04 Jackson St & Santa 0' In In1. Broadside Bicycle North Proceeding West Proceeding Traffic Signals 1 0
Clara St Straight Straight and Signs
1233369 1/21/04 08:00 Amethyst Dr & 0' In In1. Sideswipe Bicycle South Making Right South Proceeding Auto R/W 1 0
Manhattan PI Turn Straight Violation
1271226 1/28/04 10:09 Robinson Ave & 40' East Other Bicycle East Making Left West Proceeding Auto R/W 0 0Oswald PI Turn Straight ViolationB-6

Page 5
Time Dist. Dir.Type of Motor Veh. Dir. of Movement Dir. of Movement
PCF Inj. Kil.Report# Date Location Collision Involved With Travel 1 Prec. Coli. 1 Travel 2 Prec. Coil. 2
1316794 2/26/04 15:25 Central Expy & 300' West Sideswipe Bicycle East Proceeding East Proceeding Improper Turning 0 0
Bowers Ave Straight Straight
1349527 3/13/04 23:02 EI Camino Real & O' In Int. Broadside Bicycle South Crossed Into East Proceeding Auto RfW 1 0
Main St Opposing Straight Violation
1385169 3/31/04 14:37 Monroe St & Benton St 0' In Int. Broadside Bicycle North Entering Traffic North Making Right Auto RfW 0 0
Turn Violation
1410641 4/27/04 17:22 Jackson St & 200' North Broadside Bicycle South Traveling West Entering Traffic Wrong Side of 0 0
Homestead Rd Wrong Way Road
1410646 4/28/04 17:22 Franklin St & Alviso St 0' In Int. Broadside Bicycle North Entering Traffic East Proceeding Auto RfW 0 0
Straight Violation
1466209 5/23/04 19:06 Scott Blvd & O' In Int. Broadside Bicycle South Crossed Into North Proceeding Other Hazardous 0 0
Warburton Ave Opposing Straight Movement
1466251 6/4/04 19:47 Monroe St & Machado 57' South Hit Object Bicycle . North Proceeding North Making Right Unsafe Speed 0 0
Ave Straight Turn
1645176 7/8/04 17:40 Monroe St & Pacific Dr 195' West Broadside Bicycle North Proceeding West Proceeding Auto RfW 1 0
Straight Straight Violation
1543151 7/19/04 18:19 EI Camino Real & 300' East Broadside Bicycle North Proceeding East Proceeding Auto RfW 0 0
Halford Ave Straight Straight Violation
1569002 7/26/04 12:19 De La Cruz Blvd & 20' South Broadside Bicycle East Making Left South Proceeding Auto R/W 1 0
Clyde Ave Turn Straight Violation
1552208 7/29/04 13:59 EI Camino Real & 117' East Broadside Bicycle West Proceeding East Making Right Wrong Side of 1 0
Flora Vista Ave Straight Turn Road
1612052 8/25/04 15:38 Scott Blvd & Cabrillo 42' North Other Bicycle West Changing North Proceeding Unsafe Lane 1 0
Ave Lanes Straight Change
1612071 9/2/04 12:45 EI Camino Real & 230' West Broadside Bicycle East Proceeding South Entering Traffic Wrong Side of 0 0
Bowe Ave Straight Road
1639133 9/13/04 15:20 Monroe St & O' In Int. Broadside Bicycle North Proceeding West Proceeding Unknown 0 0
Homestead Rd Straight Straight
1657904 9/17/04 18:36 Civic Center Dr & 130' West Sideswipe Bicycle West Proceeding West Parked Improper Turning 1 0
Main St Straight
1657859 9/18/04 14:36 Benton St & Alice Dr 50' East Head-On Bicycle West Traveling East Proceeding Wrong Side of 1 0Wrong Way Straight Road
B-7

Page 6
Report# Date Time Location Dist. Dir.
Type of Motor Veh. Dir. of Movement Dir. of Movement
PCF Inj. Kil.
Collision Involved With Travel 1 Prec. Call. 1 Travel 2 Prec. Call. 2
1754789 11/17/04 16:23 Lafayette St & Civic 0' In Int. Broadside Bicycle South Making Left West Proceeding Improper Turning 1 0
Center Dr Turn Straight
1778470 11/30/04 07:45 Homestead Rd & 0' In Int. Broadside Bicycle West Proceeding North Stopped in Wrong Side of 1 0
Layton St Straight Road Road
1788927 12/7/04 15:23 Winchester Blvd & 21' South Broadside Bicycle South Making Left East Proceeding Auto R/W 0 0
Dorcich St Turn Straight Violation
1797009 12/19/04 16:13 EI Camino Real & EI 0' In Int. Broadside Bicycle South Making Right East Proceeding Auto RIW 1 0
Camino Real 2695 Turn Straight Violation
1827498 12/31/04 16:46 Scott Blvd & EI 90' North Rear-End Bicycle : West Traveling South Stopped in Other Hazardous 0 0
Camino Real Wrong Way Road Movement
1847223 1/21/05 13:16 Saint Lawrence Dr & 40' East Head-On Bicycle East Traveling West Proceeding Wrong Side of 1 0
Flora Vista Ave Wrong Way Straight Road
1859306 1/28/05 08:05 Benton St & Kiely Blvd 600' West Head-On Bicycle East Making Right West Proceeding Wrong Side of 1 0
Turn Straight Road
1892485 2/20/05 17:04 Hope Dr & 1620 Hope 0' In Int. Broadside Bicycle North Entering Traffic West Proceeding Auto RIW 1 0
Dr Straight Violation
1937872 3/9/05 14:30 Anna Dr & Block Dr 0' In Int. Broadside Bicycle West Making Left East Proceeding Auto RIW 1 0
Turn Straight Violation
1937912 3/15/05 17:05 EI Camino Real & 120' East Broadside Bicycle East Making Right East Proceeding Improper Turning 0 0
Kiely Blvd Turn Straight
1953736 3/17/05 14:41 Scott Blvd & Clifford St 42' South Broadside Bicycle North Proceeding East Proceeding Wrong Side of 1 0
Straight Straight Road
1976054 4/10/05 12:17 Nobili Ave & Flora 0' In Int. Broadside Bicycle East Proceeding South Proceeding Auto R/W 1 0
Vista Ave Straight Straight Violation
2011025 4/17/05 15:14 Homestead Rd & San 0' In Int. Broadside Bicycle East Making Left Not Stat Proceeding Unknown 0 0
Tomas Expy Turn Straight
2005823 4/25/05 17:37 Bowers Ave & EI 70' North Broadside Bicycle West Entering Traffic South Traveling Auto RIW 1 0
Camino Real Wrong Way Violation
2005787 5/3/05 22:47 Lincoln St & Clay St 0' In Int. Other Bicycle East Proceeding South Proceeding Auto RIW 1 0
Straight Straight Violation
2048479 5/16/05 18:50 Benton St & Lafayette 45' West Broadside Bicycle North Traveling East Proceeding Driving Under 1 0St Wrong Way Straight InfluenceB-8
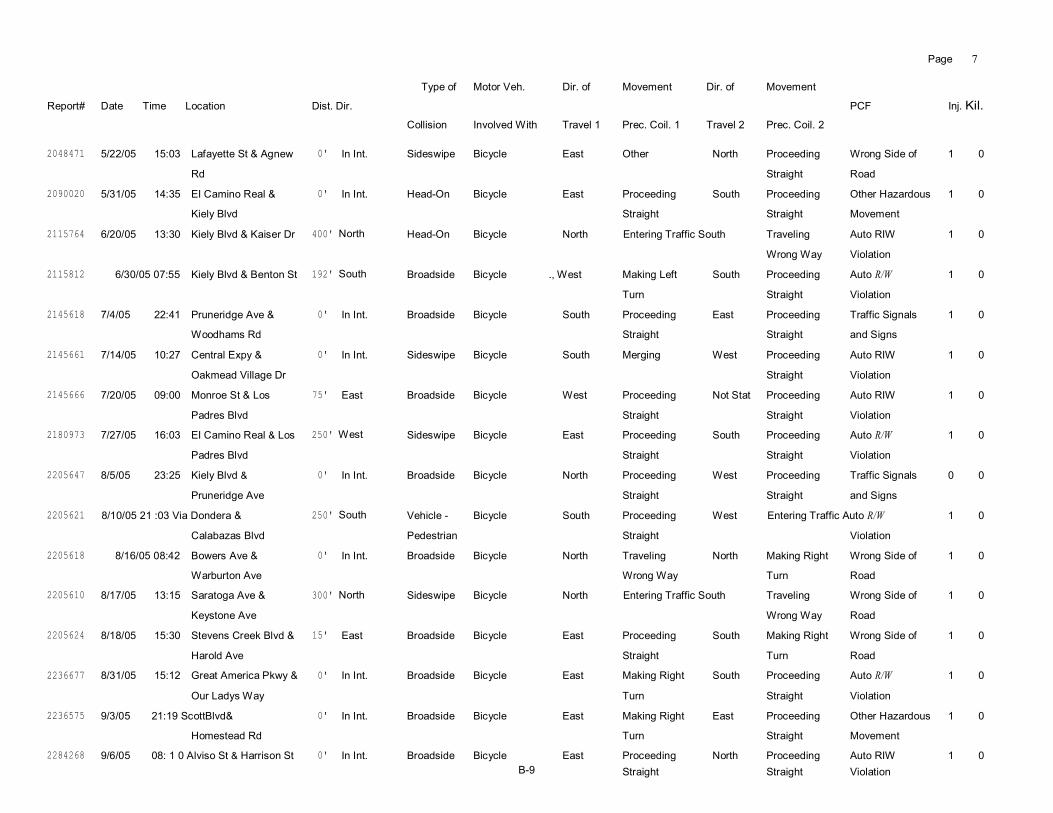
Page 7
Report# Date Time Location Dist. Dir.
Type of Motor Veh. Dir. of Movement Dir. of Movement
PCF Inj. Kil.Collision Involved With Travel 1 Prec. Coil. 1 Travel 2 Prec. Coil. 2
2048471 5/22/05 15:03 Lafayette St & Agnew 0' In Int. Sideswipe Bicycle East Other North Proceeding Wrong Side of 1 0
Rd Straight Road
2090020 5/31/05 14:35 EI Camino Real & 0' In Int. Head-On Bicycle East Proceeding South Proceeding Other Hazardous 1 0
Kiely Blvd Straight Straight Movement
2115764 6/20/05 13:30 Kiely Blvd & Kaiser Dr 400' North Head-On Bicycle North Entering Traffic South Traveling Auto RIW 1 0
Wrong Way Violation
2115812 6/30/05 07:55 Kiely Blvd & Benton St 192' South Broadside Bicycle ., West Making Left South Proceeding Auto R/W 1 0
Turn Straight Violation
2145618 7/4/05 22:41 Pruneridge Ave & 0' In Int. Broadside Bicycle South Proceeding East Proceeding Traffic Signals 1 0
Woodhams Rd Straight Straight and Signs
2145661 7/14/05 10:27 Central Expy & 0' In Int. Sideswipe Bicycle South Merging West Proceeding Auto RIW 1 0
Oakmead Village Dr Straight Violation
2145666 7/20/05 09:00 Monroe St & Los 75' East Broadside Bicycle West Proceeding Not Stat Proceeding Auto RIW 1 0
Padres Blvd Straight Straight Violation
2180973 7/27/05 16:03 EI Camino Real & Los 250' West Sideswipe Bicycle East Proceeding South Proceeding Auto R/W 1 0
Padres Blvd Straight Straight Violation
2205647 8/5/05 23:25 Kiely Blvd & 0' In Int. Broadside Bicycle North Proceeding West Proceeding Traffic Signals 0 0
Pruneridge Ave Straight Straight and Signs
2205621 8/10/05 21 :03 Via Dondera & 250' South Vehicle - Bicycle South Proceeding West Entering Traffic Auto R/W 1 0
Calabazas Blvd Pedestrian Straight Violation
2205618 8/16/05 08:42 Bowers Ave & 0' In Int. Broadside Bicycle North Traveling North Making Right Wrong Side of 1 0
Warburton Ave Wrong Way Turn Road
2205610 8/17/05 13:15 Saratoga Ave & 300' North Sideswipe Bicycle North Entering Traffic South Traveling Wrong Side of 1 0
Keystone Ave Wrong Way Road
2205624 8/18/05 15:30 Stevens Creek Blvd & 15' East Broadside Bicycle East Proceeding South Making Right Wrong Side of 1 0
Harold Ave Straight Turn Road
2236677 8/31/05 15:12 Great America Pkwy & 0' In Int. Broadside Bicycle East Making Right South Proceeding Auto R/W 1 0
Our Ladys Way Turn Straight Violation
2236575 9/3/05 21:19 ScottBlvd& 0' In Int. Broadside Bicycle East Making Right East Proceeding Other Hazardous 1 0
Homestead Rd Turn Straight Movement
2284268 9/6/05 08: 1 0 Alviso St & Harrison St 0' In Int. Broadside Bicycle East Proceeding North Proceeding Auto RIW 1 0Straight Straight ViolationB-9
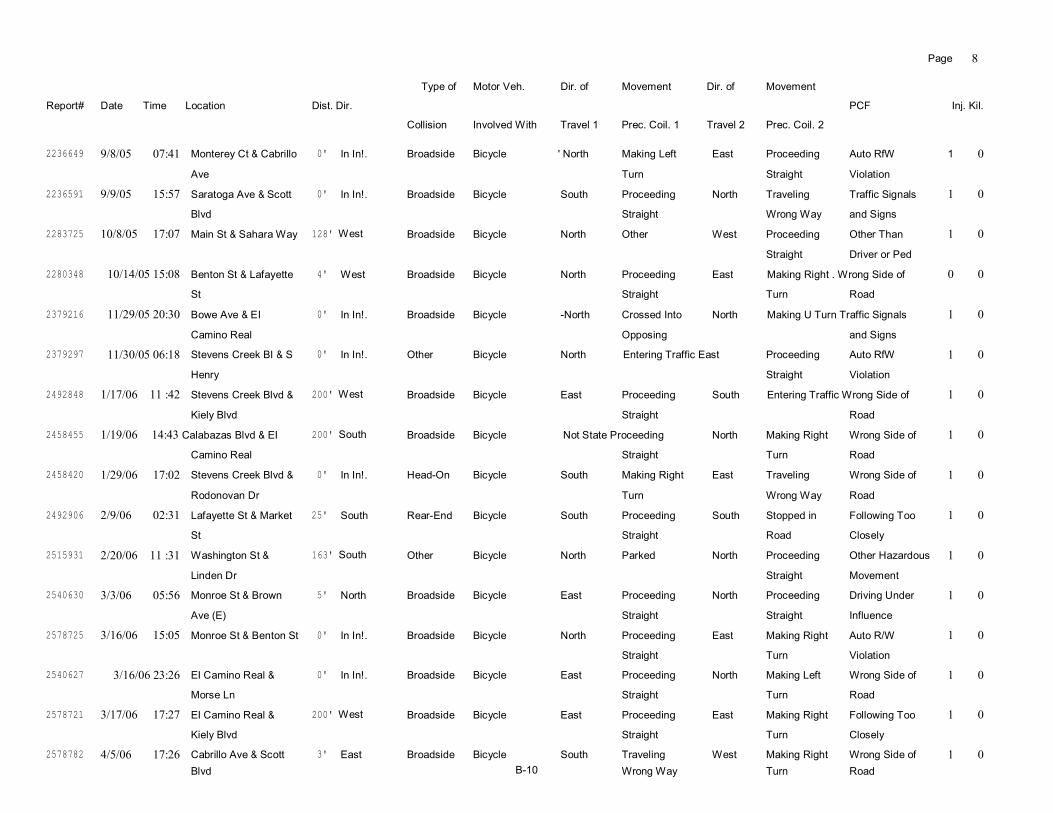
Page 8
Report# Date Time Location Dist. Dir.
Type of Motor Veh. Dir. of Movement Dir. of Movement
PCF Inj. Kil.
Collision Involved With Travel 1 Prec. Coil. 1 Travel 2 Prec. Coil. 2
2236649 9/8/05 07:41 Monterey Ct & Cabrillo 0' In In!. Broadside Bicycle ' North Making Left East Proceeding Auto RfW 1 0
Ave Turn Straight Violation
2236591 9/9/05 15:57 Saratoga Ave & Scott 0' In In!. Broadside Bicycle South Proceeding North Traveling Traffic Signals 1 0Blvd Straight Wrong Way and Signs
2283725 10/8/05 17:07 Main St & Sahara Way 128' West Broadside Bicycle North Other West Proceeding Other Than 1 0
Straight Driver or Ped
2280348 10/14/05 15:08 Benton St & Lafayette 4' West Broadside Bicycle North Proceeding East Making Right . Wrong Side of 0 0St Straight Turn Road
2379216 11/29/05 20:30 Bowe Ave & EI 0' In In!. Broadside Bicycle -North Crossed Into North Making U Turn Traffic Signals 1 0
Camino Real Opposing and Signs
2379297 11/30/05 06:18 Stevens Creek BI & S 0' In In!. Other Bicycle North Entering Traffic East Proceeding Auto RfW 1 0Henry Straight Violation
2492848 1/17/06 11 :42 Stevens Creek Blvd & 200' West Broadside Bicycle East Proceeding South Entering Traffic Wrong Side of 1 0
Kiely Blvd Straight Road
2458455 1/19/06 14:43 Calabazas Blvd & EI 200' South Broadside Bicycle Not State Proceeding North Making Right Wrong Side of 1 0Camino Real Straight Turn Road
2458420 1/29/06 17:02 Stevens Creek Blvd & 0' In In!. Head-On Bicycle South Making Right East Traveling Wrong Side of 1 0
Rodonovan Dr Turn Wrong Way Road
2492906 2/9/06 02:31 Lafayette St & Market 25' South Rear-End Bicycle South Proceeding South Stopped in Following Too 1 0St Straight Road Closely
2515931 2/20/06 11 :31 Washington St & 163' South Other Bicycle North Parked North Proceeding Other Hazardous 1 0Linden Dr Straight Movement
2540630 3/3/06 05:56 Monroe St & Brown 5' North Broadside Bicycle East Proceeding North Proceeding Driving Under 1 0Ave (E) Straight Straight Influence
2578725 3/16/06 15:05 Monroe St & Benton St 0' In In!. Broadside Bicycle North Proceeding East Making Right Auto R/W 1 0Straight Turn Violation
2540627 3/16/06 23:26 EI Camino Real & 0' In In!. Broadside Bicycle East Proceeding North Making Left Wrong Side of 1 0Morse Ln Straight Turn Road
2578721 3/17/06 17:27 EI Camino Real & 200' West Broadside Bicycle East Proceeding East Making Right Following Too 1 0Kiely Blvd Straight Turn Closely
2578782 4/5/06 17:26 Cabrillo Ave & Scott 3' East Broadside Bicycle South Traveling West Making Right Wrong Side of 1 0Blvd Wrong Way Turn RoadB-10

Page 9
Report# Date Time Location Dist. Dir.
Type of Motor Veh. Dir. of Movement Dir. of Movement
PCF Inj. Kil.
Collision Involved With Travel 1 Prec. Coil. 1 Travel 2 Prec. Coil. 2
2627883 4/30/06 20: 18 Cabrillo Ave & Bowers 0' In Int. Broadside Bicycle West Making Left East Proceeding Auto R/W 1 0
Ave Turn Straight Violation
2627848 5/8/06 17:43 Oi Guilio Ave & Avila 3' West Broadside Bicycle South Proceeding East Proceeding Auto R/W 1 0
Ave Straight Straight Violation
2709520 5/26/06 12:16 Monroe St & Francis 0' In Int. Sideswipe Bicycle South Making Right South Proceeding Improper Turning 1 0
Ave Turn Straight
2709553 5/31/06 11 :10 Stevens Creek Blvd & 210' West Sideswipe Bicycle West Parked Not Stat Proceeding Other Hazardous 1 0
Cronin Dr Straight Movement
2725078 6/1/06 08:56 Monroe St & Nobili Ave 0' In Int. Broadside Bicycle North Making Left West Proceeding Auto R/W 1 0
Turn Straight Violation
2739221 7/5/06 13:38 EI Camino Real & San 226' East Head-On Bicycle West Proceeding North Entering Traffic Wrong Side of 1 0
Tomas Expy Straight Road
2774966 7/25/06 17:48 EI Camino Real & 0' In Int. Broadside Bicycle East Proceeding North Making Left Traffic Signals 0 0
Bowe Ave Straight Turn and Signs
2775214 8/1/06 18:30 Main St & Sahara Way 166' East Head-On Bicycle West Making Right South Stopped in Other 1 0
Turn Road
2775262 8/3/06 08:00 Martin Ave & Lafayette 590' East Broadside Bicycle East Making Left West Proceeding Auto R/W 1 0
St Turn Straight Violation
2775257 8/7/06 15:03 Lincoln St & Market St 0' In Int. Broadside Bicycle West Proceeding South Proceeding Traffic Signals 1 0
Straight Straight and Signs
2786357 8/31/06 07:35 EI Camino Real & 0' In Int. Broadside Bicycle West Proceeding East Making Left Traffic Signals 1 0
Lawrence Expy Straight Turn and Signs
2786365 9/3/06 10:01 Lafayette St & 20' South Sideswipe Bicycle North Making Left North Proceeding Improper Turning 1 0
Shulman Ave Turn Straight
2816181 9/20/06 18:27 Agnew Rd & Lafayette 500' East Broadside Bicycle East Proceeding South Proceeding Wrong Side of 0 0
St Straight Straight Road
2872675 10/3/06 07:46 Monroe St & Benton St 0' In Int. Broadside Bicycle South Entering Traffic West Making Right Wrong Side of 1 0
Turn Road
2851808 10/4/06 16:13 Flora Vista Ave & 338' South Other Bicycle North Parked North Proceeding Other Hazardous 2 0
Granada Ave Straight Movement
2851836 10/13/06 06:24 Lafayette St & 9' South Sideswipe Bicycle North Proceeding East Making Right Wrong Side of 1 0Memorex Dr Straight Turn RoadB-11

Page 10
Report# Date Time Location Dist. Dir.
Type of MotorVeh. Dir. of Movement Dir. of Movement
PCF Inj. Kilo
Collision Involved With Travel 1 Prec. Coli. 1 Travel 2 Prec. Coli. 2
2872670 10/17/06 20:21 Homestead Rd & 233' East Broadside Bicycle North Making Left West Proceeding Auto RIW 1 0
Lawrence Expy Turn Straight Violation
2906714 11/3/06 14:45 Francis Ave & Monroe 50' South Rear-End Bicycle South Proceeding South Proceeding Unknown 1 0St Straight Straight
2883630 11/4/06 18:16 Winchester Blvd & 300' North Hit Object Bicycle North Stopped in South Proceeding Wrong Side of 0 0Fernwood Ave Road Straight Road
2927315 11/29/06 15:48 EI Camino Real & 6' West Broadside Bicycle South Entering Traffic East Proceeding Auto RIW 1 0
Alpine Ave Straight Violation
2963767 12/14/06 19:05 Newhall St & Saratoga 0' In Int. Not Stated Bicycle East Proceeding North Other Traffic Signals 0 0
Ave Straight and Signs
2963790 12/18/06 12:21 Pomeroy Ave & 40' South Sideswipe Bicycle South Making U Turn South Proceeding Improper Turning 0 0Homestead Rd Straight
3023222 1/13/07 15:22 San Tomas Expy & 0' In Int. Other Bicycle West Proceeding North Making Right Auto R/W 1 0
Cabrillo Ave Straight Turn Violation
3053117 2/6/07 07:40 Santa Clara St & 0' In Int. Broadside Bicycle Not State Making Left North Proceeding Auto R/W 1 0Lafayette St Turn Straight Violation
3053058 2/10/07 18:01 EI Camino Real & 0' In Int. Not Stated Bicycle East Making Left North Proceeding Ped RIW Violation 1 0Nobili Ave Turn Straight
3053188 2/16/07 15:31 Warburton Ave & 130' West Sideswipe Bicycle West Proceeding East Proceeding Wrong Side of 0 0Fillmore St Straight Straight Road
3098608 2/20/07 12:17 Kenneth St & Space 250' North Hit Object Bicycle North Parked North Proceeding Other Hazardous 1 0
Park Dr Straight Movement
3098336 3/5/07 17:39 Lafayette St & Reeve O' In Int. Broadside Bicycle West Making Left South Proceeding Auto RIW 0 0St Turn Straight Violation
3098383 3/19/07 12:15 Monroe St & Scott Blvd 150' East Rear-End Bicycle :West Proceeding West Not Stated Improper Turning 0 0Straight
3143472 3/29/07 09:43 Scott Blvd & EI 36' South Head-On Bicycle North Traveling Not Stat Making Right Wrong Side of 1 0
Camino Real Wrong Way Turn Road
3148007 4/3/07 18:15 Deborah Dr & Monroe 10' North Broadside Bicycle East . Proceeding South Proceeding Wrong Side of 1 0St Straight Straight Road
3149323 4/12/07 07:45 Warburton Ave & Civic 120' West Hit Object Bicycle Not State Making Right North Proceeding Wrong Side of 0 0Center Dr Turn Straight RoadB-12

Page 11
Report# Date Time Location Dist. Dir.
Type of MotorVeh. . Dir. of Movement Dir. of Movement
PCF Inj. Kil.
Collision Involved With Travel 1 Prec. Coli. 1 Travel 2 Prec. Coil. 2
3154367 4/23/07 18:25 Peacock Ct & Halford 75' East Broadside Bicycle East Other Unsafe West Proceeding Auto RIW 1 0
Ave Turning Straight Violation
3203727 5/10/07 13:39 Newhall St & 193' West Rear-End Bicycle East Proceeding East Proceeding Unsafe Speed 1 0
Washington St Straight Straight
3220212 5/29/07 09:54 Civic Center Dr & 86' East Sideswipe Bicycle West Parked West Proceeding Other Hazardous 1 0Lincoln St Straight Movement
I..
3220378 6/8/07 17:29 Scott Blvd & Benton St 0' In Int. Head-On Bicycle 'West Traveling North Stopped in Wrong Side of 1 0
Wrong Way Road Road
3237129 6/18/07 11 :25 Kiely Blvd & Butte St 120' North Broadside Bicycle North Proceeding East Proceeding Wrong Side of 0 0
Straight Straight Road
3161289 6/20/07 16:35 Coleman Ave & Carl St 610' North Broadside Bicycle : South Traveling West Stopped in Other Improper 1 0
Wrong Way Road Driving
3251706 6/29/07 11 :10 EI Camino Real & 75' West Other Bicycle West Proceeding North Entering Traffic Wrong Side of 0 0
Halford Ave Straight Road
3275336 7/7/07 22:37 Calabazas Blvd & EI 0' In In1. Sideswipe Bicycle Not State Making Right North Proceeding Auto RIW 1 0
Camino Real Turn Straight Violation
3305107 7/25/07 18:16 Lafayette St & Martin 370' North Sideswipe Bicycle South Making Right South Proceeding Improper Turning 1 0
Ave Turn Straight
3360708 8/1/07 18:50 Saratoga Ave & 10' North Other Bicycle North Making Right North Proceeding Improper Turning 1 0
Pruneridge Ave Turn Straight
3311474 8/8/07 15:34 Scott Blvd & Harrison 0' In Int. Sideswipe Bicycle West Making Right West Proceeding Auto RIW 1 0
St Turn Straight Violation
3311477 8/15/07 07:10 Stevens Creek Blvd & 300' West Head-On Bicycle East Making Left West Proceeding Improper Turning 0 0
Cabot Ave Turn Straight
3360720 8/15/07 16:37 Benton St & Las 0' In Int. Other Bicycle East Proceeding South Making Right Auto RIW 1 0
Palmas Dr Straight Turn Violation
3369007 8/26/07 17:30 EI Camino Real & 0' In In1. Sideswipe Bicycle East Changing East Making Left Unsafe Lane 1 0
Kiely Blvd Lanes Turn Change
3352983 8/30/07 18:24 EI Camino Real & 0' In In1. Other Bicycle South Proceeding East Making Right Wrong Side of 0 0
Lawrence Expy Straight Turn Road
3344224 9/4/07 20:34 Homestead Rd & 0' In Int. Broadside Bicycle East Proceeding South Proceeding Auto RIW 1 0Pomeroy Ave Straight Straight ViolationB-13

Page 12
Report# Date Time Location Dist. Dir.
Type of Motor Veh. Dir. of Movement Dir. of Movement
PCF Inj. Kil.
Collision Involved With Travel 1 Prec. Coil. 1 Travel 2 Prec. Coli. 2
3385313 9/11/07 15:22 EI Camino Real & 27' East Head-On Bicycle West Proceeding North Making Right Wrong Side of 1 0
Calabazas Blvd Straight Turn Road
3385301 9/15/07 08:15 Lafayette St & Martin O' In Int. Broadside Bicycle North Proceeding East Proceeding Traffic Signals 1 0
Ave Straight Straight and Signs
3406179 9/29/07 17:34 Great America Pkwy & O' In Int. Broadside Bicycle West Proceeding South Proceeding Traffic Signals 1 0Verba Buena Way Straight Straight and Signs
3406610 10/1/07 18:48 Central Expyw & 3' West Other Bicycle West Making Right West Proceeding Improper 1 0Scott blvd Turn Straight Turning
3446257 11/5/07 16:17 Saratoga Ave & 5’ East Broadside Bicycle East Proceeding South Proceeding Wrong Side 1 0Pruneridge Ave Straight Straight Of Road
3508820 11/13/07 15:38 Monroe St & O' In Int. Broadside Bicycle South Making Left East Proceeding Auto R/W 1 0Calabazas Blvd Turn Straight Violation
3508808 11/15/07 17:03 Hafford Ave & 8' North Sideswipe Bicycle South Stopped in North Proceeding Wrong SIde 0 0Tamarack Ln Road Straight Of Road
3540259 12/14/07 15:11 Francis Ave & 34' South Broadside Bicycle North Making Left South Proceeding Pedestrian 1 0Machado Av Turn Straight Violation
I I!
I!
II
B-14

APPENDIX C
PAST EXPENDITURES

2009 Santa Clara Bicycle Plan Update City of Santa Clara
SCBikePlan22.PastExpenditures-Appendix.doc September 14, 2009
Past Expenditures
The expenditures on bicycle facilities installed since the 2002 Bicycle Plan Update aresummarized below (as of September 2009).
BICYCLE TRAILS TOTAL COSTRiver Oaks Bicycle/Pedestrian Bridge (Santa Clara Contribution) $600,000San Tomas Aquino Creek (Reach 1 - SR-237 to Agnew Rd) $3,276,359Agnew Road At-Grade Signal @ San Tomas Aquino Creek (Reach 1) $220,750San Tomas Aquino Creek (Reach 2 - Agnew Rd to Scott Blvd) $5,970,271San Tomas Aquino Creek (Reach 3 - Scott Blvd to Monroe St) $7,479,180Monroe Street At-Grade Signal @ San Tomas Aquino Creek (Reach 3) $503,855Creek Trailhead @ Monroe Street & San Tomas Aquino Creek - Land Purchase $1,250,000Creek Trailhead @ Monroe Street & San Tomas Aquino Creek $860,255San Tomas Aquino Creek (Class I portion of Reach 4 - Creek Trailhead to Cabrillo Ave) $544,113
BICYCLE LANESBowers Avenue (US-101 to Chromite Dr) $81,286Great America Parkway (Yerba Buena Way to US-101) $69,056Homestead Road (Lawrence Expwy to Lafayette St - Bicycle Lane & Bicycle Route) $213,062Hope Drive (Lafayette St to Lick Mill Blvd) $12,232Lafayette Street (Calle De Luna to Agnew Rd) $24,166Los Olivos Drive (Homestead Rd to Forbes Ave) $8,719Mission College Boulevard (Marriott to Wyatt Dr) $12,556Old Mountain View - Alviso Road (Sunnyvale City Limit to Great America Pkwy) $8,786Poplar Street (Washington St to Park Ave) $6,806The Alameda (Bellomy St to Mission St) $14,812Winchester Boulevard (Bellomy St to Newhall St) $4,249Scott Boulevard (Garrett Dr to Central Expwy) $74,503
BICYCLE ROUTESBowers Avenue (Chromite Dr to Cabrillo Ave) $8,116Flora Vista Avenue (Benton St to Granada Ave) $743Forbes Avenue (Harvard Ave to Los Padres Blvd) $33,062Granada Avenue (Flora Vista Ave to Pomeroy Ave) $990Park Avenue (Bellomy St to Newhall St) $11,060Warburton Avenue (Los Padres Blvd to Monroe St) $1,733
$21,290,719TOTAL
City of Santa Clara Bicycle Facilities Installed Since 2002
C-1

APPENDIX D
BIKEWAY PLANNING ANDDESIGN

2009 Santa Clara Bicycle Plan Update City of Santa Clara
SCBikePlan04.Bikeway Planning and Design-Appendix.doc September 14, 2009
Bikeway Planning and DesignThe following outlines the rules and guidelines described in the following references:
American Association of State Highway and Transportation Officials (AASHTO) 1999Guide for the Development of Bicycle Facilities;Caltrans Highway Design Manual (HDM) Chapter 1000;California Manual of Uniform Traffic Control Devices (CA MUTCD) 2006, Part 9; and,Santa Clara Valley Transportation Authority Bicycle Technical Guidelines (BTG 2007).
Many roadways were originally designed for vehicle use only, therefore not adequatelyaddressing bicycle use. Illustrations of this include unsafe drainage grates, inadequate spacingfor multi-modal travel, no bicycle detection and no advanced signal timing for bicycles. Criticalfor improving the safety and reducing congestion of the roadway is the focus to provideadequate spacing for each user group of pedestrians, cyclists, and motorists utilizing sidewalks,bike lanes, and parking and travel lanes, respectively.
Paved shoulders can increase the existing roadway without decreasing lane width fromvehicles. Paved shoulders should be at least 4 feet wide and a recommended 5 feet wide whenup against a barrier or curb. Along rural roads and County expressways, shoulder width shouldbe increased to 6 feet for speeds of 40 mph or less and 8 feet for speeds of 45 mph or higher.
Lane width can also be considered when implementing a bicycle facility. On roadways with nobike designation, an outside lane width of 12 feet is recommended to allow vehicles andbicycles to share the lane. A lane width of 14 feet is recommended when there is a wide curblane. Lane widths are from lane stripe to edge stripe and do not include the gutter. Wherethere are rumble strips or reflector markings or drainage grates, 15 feet for the lane width isrecommended. However where a 15 foot lane width continues for a long time, multiple cars areencouraged to use the one lane and therefore is not recommended. When this situation arises,a bike lane or shoulder striping should be installed.
Often bicycles will be riding between parked cars and moving vehicles, so careful considerationshould be advised. Cyclists need to worry about moving vehicles to the left and swinging andopening doors on the right. A shared use of 13 feet combined for bike use and parking shouldbe implemented.
Class I: Bike Path
A Class I facility is a paved route not on a street or roadway and expressly reserved forbicycles. Bike paths or shared use paths are usually separated from vehicular traffic andare used by cyclists, pedestrians, animals and roller skaters. These paths are usually
D-1
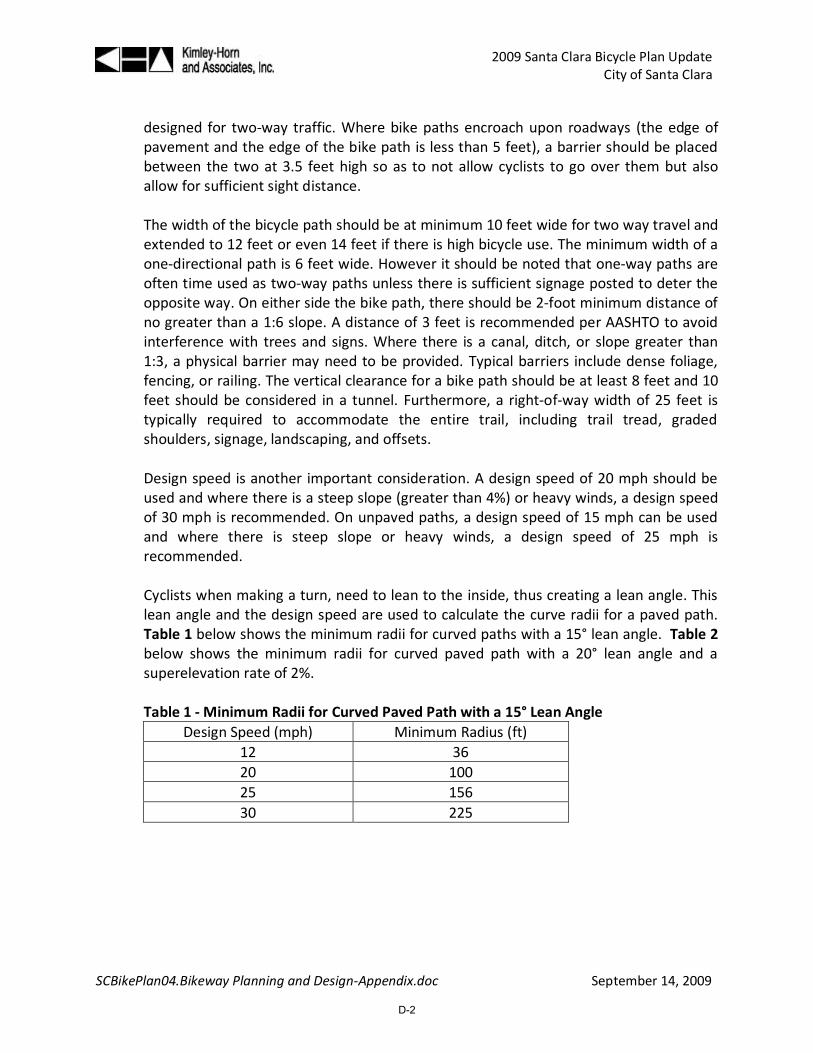
2009 Santa Clara Bicycle Plan Update City of Santa Clara
SCBikePlan04.Bikeway Planning and Design-Appendix.doc September 14, 2009
designed for two-way traffic. Where bike paths encroach upon roadways (the edge ofpavement and the edge of the bike path is less than 5 feet), a barrier should be placedbetween the two at 3.5 feet high so as to not allow cyclists to go over them but alsoallow for sufficient sight distance.
The width of the bicycle path should be at minimum 10 feet wide for two way travel andextended to 12 feet or even 14 feet if there is high bicycle use. The minimum width of aone-directional path is 6 feet wide. However it should be noted that one-way paths areoften time used as two-way paths unless there is sufficient signage posted to deter theopposite way. On either side the bike path, there should be 2-foot minimum distance ofno greater than a 1:6 slope. A distance of 3 feet is recommended per AASHTO to avoidinterference with trees and signs. Where there is a canal, ditch, or slope greater than1:3, a physical barrier may need to be provided. Typical barriers include dense foliage,fencing, or railing. The vertical clearance for a bike path should be at least 8 feet and 10feet should be considered in a tunnel. Furthermore, a right-of-way width of 25 feet istypically required to accommodate the entire trail, including trail tread, gradedshoulders, signage, landscaping, and offsets.
Design speed is another important consideration. A design speed of 20 mph should beused and where there is a steep slope (greater than 4%) or heavy winds, a design speedof 30 mph is recommended. On unpaved paths, a design speed of 15 mph can be usedand where there is steep slope or heavy winds, a design speed of 25 mph isrecommended.
Cyclists when making a turn, need to lean to the inside, thus creating a lean angle. Thislean angle and the design speed are used to calculate the curve radii for a paved path.Table 1 below shows the minimum radii for curved paths with a 15° lean angle. Table 2below shows the minimum radii for curved paved path with a 20° lean angle and asuperelevation rate of 2%.
Table 1 - Minimum Radii for Curved Paved Path with a 15° Lean AngleDesign Speed (mph) Minimum Radius (ft)
12 3620 10025 15630 225
D-2

2009 Santa Clara Bicycle Plan Update City of Santa Clara
SCBikePlan04.Bikeway Planning and Design-Appendix.doc September 14, 2009
Table 2 - Minimum Radii for Curved Paved Path with a 20° Lean Angle and aSuperelevation Rate of 2%
Design Speed (mph) Friction Factor Minimum Radius (ft)12 0.31 3020 0.28 9025 0.25 15530 0.20 260
Looking at grades, a 5% grade should not be exceeded for long periods of time. Listedbelow in Table 3 are grade restrictions and lengths.
Table 3 - Grade Restrictions and LengthsSlope Length (ft)5-6% 8007% 4008% 3009% 200
10% 10011%+ 50
Figure 1 below illustrates the stopping distance based on grade and speeds.
D-3

2009 Santa Clara Bicycle Plan Update City of Santa Clara
SCBikePlan04.Bikeway Planning and Design-Appendix.doc September 14, 2009
Figure 1 – Stopping Distance
Source: American Association of State Highway and Transportation Officials, 1999.
The two directions of traffic should be separated by a 4-inch wide yellow centerline. Forpassing other cyclists a broken line may be used with sufficient distance to pass.
Class II: Bike Lane
A Class II facility is a lane on a corridor expressly reserved for bicycles, existing on astreet or roadway in addition to any lanes for use by motorized vehicles. These bikelanes are implemented to differentiate lanes for bicycles and for vehicles. Bike lanesprovide a higher sense of security that vehicles will not interact with bikes. Bike lanesshould be one way and flow with the vehicular traffic. Bike lane widths are summarizedin Table 4 and Table 5 below.
D-4
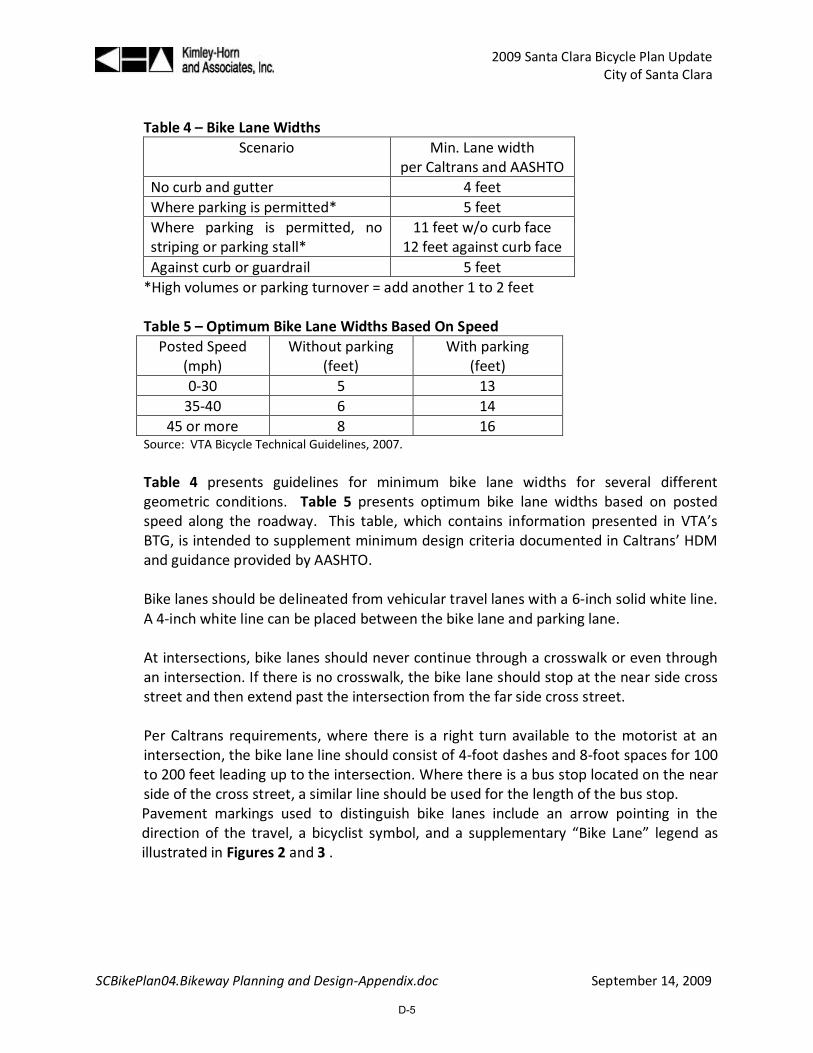
2009 Santa Clara Bicycle Plan Update City of Santa Clara
SCBikePlan04.Bikeway Planning and Design-Appendix.doc September 14, 2009
Table 4 – Bike Lane WidthsScenario Min. Lane width
per Caltrans and AASHTONo curb and gutter 4 feetWhere parking is permitted* 5 feetWhere parking is permitted, nostriping or parking stall*
11 feet w/o curb face12 feet against curb face
Against curb or guardrail 5 feet*High volumes or parking turnover = add another 1 to 2 feet
Table 5 – Optimum Bike Lane Widths Based On SpeedPosted Speed
(mph)Without parking
(feet)With parking
(feet)0-30 5 13
35-40 6 1445 or more 8 16
Source: VTA Bicycle Technical Guidelines, 2007.
Table 4 presents guidelines for minimum bike lane widths for several differentgeometric conditions. Table 5 presents optimum bike lane widths based on postedspeed along the roadway. This table, which contains information presented in VTA’sBTG, is intended to supplement minimum design criteria documented in Caltrans’ HDMand guidance provided by AASHTO.
Bike lanes should be delineated from vehicular travel lanes with a 6-inch solid white line.A 4-inch white line can be placed between the bike lane and parking lane.
At intersections, bike lanes should never continue through a crosswalk or even throughan intersection. If there is no crosswalk, the bike lane should stop at the near side crossstreet and then extend past the intersection from the far side cross street.
Per Caltrans requirements, where there is a right turn available to the motorist at anintersection, the bike lane line should consist of 4-foot dashes and 8-foot spaces for 100to 200 feet leading up to the intersection. Where there is a bus stop located on the nearside of the cross street, a similar line should be used for the length of the bus stop.Pavement markings used to distinguish bike lanes include an arrow pointing in thedirection of the travel, a bicyclist symbol, and a supplementary “Bike Lane” legend asillustrated in Figures 2 and 3 .
D-5

2009 Santa Clara Bicycle Plan Update City of Santa Clara
SCBikePlan04.Bikeway Planning and Design-Appendix.doc September 14, 2009
Figure 2 – Directional Arrow and Bike Lane Symbol
Source: California Manual on Uniform Traffic Control Devices, 2006.
Figure 3 – Supplementary “Bike Lane” Legend
Source: California Manual on Uniform Traffic Control Devices, 2006.
Class III: Bike Route
A Class III facility, which is a bike route, is shared with motorists and identified by signs.Additionally, some bike routes in the City are complimented with sharrow legends, asillustrated in Figure 4, to inform bicyclists and motorists of the presence of the shareduse lane along the Class III facility.
D-6

2009 Santa Clara Bicycle Plan Update City of Santa Clara
SCBikePlan04.Bikeway Planning and Design-Appendix.doc September 14, 2009
Figure 4 – Sharrow legend
Source: California Manual on Uniform Traffic Control Devices, 2006.
Bike routes are signed with Bike Route signs (Sign D11-1) along the sidewalks, oftentimes posted on street light fixtures or other poles. Bike routes often connect otherbicycle facilities to each other. Bike routes are usually characterized by high volumecorridors. Often times in the bike route direction traffic control devices are prioritizedfor the through movement as opposed to the side street movements.
Signing shared roadways should direct cyclists to a logical path to follow. In urban areassigns typically stand approximately every quarter mile, at all turns, and at majorintersections.
Bicycle Detectors
Bicycle detection at intersections is an important safety component at signalizedintersections. Detectors should give cyclists an extra 5 seconds of green time to crossthe intersection. Most vehicle detectors can also pick up bicycles adjacent to vehicles.Example detectors include quadruple and diagonal-type loops. Rectangular and dipoleloops can also detect bicycles if the sensitivity is heightened. The sensitivity levels ofmost detector amplifiers can be adjusted to allow detection of bicycles. This technology
D-7

2009 Santa Clara Bicycle Plan Update City of Santa Clara
SCBikePlan04.Bikeway Planning and Design-Appendix.doc September 14, 2009
allows for utilization of existing loops. Replacement of older detector amplifiers that donot have this capability is recommended.
Cost for bicycle detection varies depending on the type of technology chosen. Forexample, installation of in-pavement loops cost approximately $2,500 per approach, andoperates similarly to loops used for vehicular detection. Video detection costs areapproximately $7,500 per approach. This type of detection can also be used forvehicular detection with no additional costs.
Pavement markings should show where the optimum location for bicycles to wait inorder to actuate the signal.
An example of a pavement marking is shown below in Figure 5.
Figure 5 – Bicycle Detector Pavement Marking
Source: American Association of State Highway and Transportation Officials, 1999.
D-8

2009 Santa Clara Bicycle Plan Update City of Santa Clara
SCBikePlan04.Bikeway Planning and Design-Appendix.doc September 14, 2009
California MUTCD Signage Standards
Section 9B of the CA MUTCD provides the following guidance on the application and placementof signs pertaining to bicycle facilities:
Bicycle signs shall be standard in shape, legend, and color.All signs shall be retro reflectorized for use on bikeways, including shared-use pathsand bicycle lane facilities.Where signs serve both bicyclists and other road users, vertical mounting height andlateral placement shall be as specified in Part 2 of the CA MUTCD.On shared-use paths, lateral sign clearance shall be a minimum of 3 ft. and amaximum of 6 ft. from the near edge of the sign to the near edge of the path.Mounting height for ground-mounted signs on shared-use paths shall be a minimumof 4 ft. and a maximum of 5 ft., measured from the bottom edge of the sign to thenear edge of the path surface.When overhead signs are used on shared-use paths, the clearance from the bottomedge of the sign to the path surface directly under the sign shall be a minimum of 8ft.
Figure 6 illustrates the proper height and lateral distances for mounting bicycle andpedestrian facility signage.
Figure 6 – Sign Placement on Shared-Use Paths
Source: California Manual on Uniform Traffic Control Devices, 2006.
D-9

2009 Santa Clara Bicycle Plan Update City of Santa Clara
SCBikePlan04.Bikeway Planning and Design-Appendix.doc September 14, 2009
Pavement Quality
Because surface irregularities are hazardous to bicyclists, all efforts should be taken to ensure asmooth even surface for riders. Therefore, it is recommended that bike lane pavement andsub-base have the same depth and quality as the adjacent roadway.
When determining the pavement quality of bike lanes, special attention must be paid tomanhole cover and drainage grates. Typical drainage grates can be slippery, not flush with roadsurface, common deposit places for debris and water, and capable of trapping bike wheels. Allgrates, manhole covers, or other surface obstructions should be bike safe or kept out of bikelanes and intersections where bikes can encounter them.
D-10

APPENDIX E
CROSS COUNTY BICYCLE CORRIDORS

2009 Santa Clara Bicycle Plan UpdateCity of Santa Clara
Cross County Bicycle Corridors in Santa ClaraCentral ExpresswayLawrence ExpresswayMontague/San Tomas ExpresswayGuadalupe River TrailSan Tomas Aquino/Saratoga Creek TrailTasman DriveEl Camino RealHomestead - Monroe - BentonAgnew - Garrity - Lick Mill - Guadalupe River Trail (west bank) - River Oaks BridgeCalabazas Creek Trail - Mission College - Montague/San Tomas Expwy - Scott - MonroeArques - Scott - Central Expwy - De la Cruz - ColemanGreat America - Bowers - KielySan Tomas Aquino/Saratoga Creek Trail - Cabrillo - Calabazas - Pomeroy - PruneridgeAgate - Bowers - ChromiteStevens Creek BoulevardPruneridge AvenuePark AvenueWinchester - Bellomy
Taken from the 2008 Santa Clara Countywide Bicycle Plan
SCBikePlan.CrossCountyBicycleCorridors-Appendix.xls September 14, 2009E-1

APPENDIX F
BICYCLE DETECTIONRANKING

2009 Santa Clara Bicycle Plan Update City of Santa Clara
SCBikePlan17.BicycleDetectionRanking-Appendix.doc September 14, 2009
Ranking Criteria for Bicycle Detection Implementation at Signalized Intersections
The use of the ranking criteria described below is recommended for City staff to use when preparing alist of locations to implement bicycle detection.
There has been a significant push to better accommodate pedestrians, bicyclists, and motorists(motorcyclists and vehicles) on roadways and promote sharing of streets among the variousabovementioned modes of travel. Presence detection at most signalized intersections commonlyaccommodates only motorists (by various vehicular detection methods) and pedestrians by providingpedestrian push buttons.
Bicycle detection at signalized intersections has been a growing necessity. Assembly Bill 1581 (AB 1581),which was passed and signed on October 8, 2007, states that traffic actuated signals shall “to the extentfeasible and in conformance with professional traffic engineering practice, be installed and maintainedso as to detect lawful bicycle or motorcycle traffic on the roadway.”
Four major criterions are considered to assess the prioritization of locations to implement bicycledetection. These include the following criteria:
Bicycle volume
Safety
Citizen requests
Cost
The ranking system utilizes a 0 to 3 point scale, with 3 points reserved for higher prioritization efforts.The following discussions summarize the point system for the abovementioned criteria.
Bicycle VolumeThe purpose of this criterion is to give preference to potential locations that experience higher bicycletraffic. Priority should be given to locations that experience greater bicycle volumes as the benefits ofdetection would be more widespread. Intersections with at least 20 bicyclists for a given cycling peak-hour will be given a high rating (3 points). Intersections with 10-20 bicyclists for a given cycling peak-hour will be given a medium rating (2 points). Intersections with 1-10 bicyclists for a given cycling peak-hour will be given a low rating (1 point). Lastly, intersections with zero bicyclists for a given peak-hourwill be given 0 points.
Bicycle detection would ideally be on all facilities that are Class II bicycle facilities. For all intersectionsthat are along a Class II bicycle facility but do not currently provide bicycle detection, that location wasgiven 3 points regardless of the bicycle volume. The lack of bicycle detection may be deterring bicyclistsfrom using this intersection, thus falsifying the true demand at that particular location. Also, signalized
F-1

2009 Santa Clara Bicycle Plan Update City of Santa Clara
SCBikePlan17.BicycleDetectionRanking-Appendix.doc September 14, 2009
intersections in the immediate vicinity of a school or park, or ones that are along a designated SafeRoutes to School route, are given 3 points as well.
SafetyThe purpose of this criterion is to give preference to potential locations that would provide for saferconditions for bicyclists with detection. The most effective measure of bicyclist safety is accidentfrequency. Intersections with high bicycle accident rates will benefit from bicycle detection and receivehigh ratings.
The City of Santa Clara provided six years of bicycle accident data (2002-2007). Intersections with morethan 10 bicycle related accidents will be given a high rating (3 points). Intersections with 5-10 bicyclerelated accidents will be given a medium rating (2 points). Intersections with 1-5 bicycle relatedaccidents will be given a low rating (1 point). Lastly, intersections with zero bicycle related accidents willbe given 0 points.
Citizen RequestsThe purpose of this criterion is to give preference to potential locations that have been identified bycitizens who likely bike through it regularly. Similar to the bicycle volume criteria, this is a way toquantify the demand for bicycle detection. The Bicycle Advisory Committee (BAC) members may submitlocations for detection to City staff as well. This assumes that the City keeps records of citizencomplaints and BAC suggestions and has at least twelve months worth of feedback. Intersections withat least 3 citizen requests within the last twelve months will be given a high rating (3 points).Intersections with 2 citizen requests will be given a medium rating (2 points). Intersections with 1citizen request will be given a low rating (1 point). Lastly, intersections with zero citizen requests will begiven 0 points.
CostThe purpose of this criterion is to give preference to potential locations where implementation ofbicycle detection would be financially beneficial for the City. For example, at locations where videodetection is to be installed for vehicular detection, the implementation of video detection for bicyclistswould result in a nominal cost increase. The video detection system would just need to be calibrated todefine a detection zone at the bike lane approach, which would not result in a need for additionalmaterial costs. Instances such as this would be ideal to implement bicycle detection and, therefore, willbe given a high ranking (3 points). Also, as a means to improve detection while utilizing existing in-pavement detector loops, installation of bicycle sensitive detector amplifiers should be considered atlocations that do not currently have capable technology. Conversely, for signals that already havedetector amplifiers capable of adjusting sensitivity, adjustments can be made without additionalequipment. Because this can be relatively cheap, it would also be given a high ranking.
For instances where bicycle detection is installed as a part of a separate intersection and/or roadwayimprovement project, it is given a medium ranking (2 points). This is because it can be cost effective toconstruct bicycle detection when construction workers are already intending to perform other work in
F-2

2009 Santa Clara Bicycle Plan Update City of Santa Clara
SCBikePlan17.BicycleDetectionRanking-Appendix.doc September 14, 2009
the field. For example, construction of in-pavement loops will be cheaper when it can be doneconcurrent with a roadway repaving project, as there would be no need to sawcut the pavement toinstall the loops.
For instances where bicycle detection is installed, but is not constructed as a part of another project, theproject is given a low ranking (1 point). This is because it can be relatively costly to construct non-videobicycle detection (in-pavement loops) without having to perform any other work at the intersection.
Instances where video detection is installed solely for bike detection can be a costly improvement forthe City. This scenario would provide the option of using the video detection system for vehiculardetection as a backup method when the primary method fails (i.e. loops failure). However, due to theup-front costs associated with this detection option, it is given 0 points.
F-3

APPENDIX G
PRIORITY RANKING

Ranking 2009 Santa Clara Bicycle Plan UpdateCity of Santa Clara
Table 1 - 2009 Proposed Improvements
Rank Corridor RecommendedFacility Score Rider
StressCollisionHistory
ADTVolumes
GapClosure
Cost/Funding Connectivity Complexity
1 Bowers Avenue (Cabrillo Ave - El Camino Real) Class III 2.64 1.3 2.0 2.0 3.0 3.0 5.0 3.02 Benton Street Class II & III 2.32 1.3 3.0 1.0 3.0 1.0 5.2 3.03 North Winchester Boulevard (Bellomy St - Homestead Ave) Class III 2.29 1.3 2.0 3.0 3.0 3.0 3.0 2.04 Lafayette Street & Bassett Street Class II 2.22 1.3 3.0 2.0 3.0 2.0 3.3 2.35 Monroe Street (Lawrence Expwy - Scott Blvd) Class II & III 2.17 1.0 3.0 2.0 3.0 3.0 1.8 3.06 Market Street (Monroe St - the Alameda) Class III 2.15 1.0 0.0 1.0 3.0 3.0 4.0 3.07 Saratoga Avenue (N/O San Tomas Expwy) Class II & III 2.12 1.3 2.0 2.0 3.0 2.0 3.1 2.78 Lick Mill Boulevard Class II & III 2.03 1.3 0.0 1.0 2.0 2.5 4.4 2.39 Pruneridge Avenue Class II 1.99 1.3 2.0 2.0 3.0 1.0 3.5 2.7
10 Scott Boulevard (Central Expwy - Monroe St) Class II 1.77 1.7 3.0 2.0 3.0 1.0 1.1 2.011 Woodhams Road (Stevens Creek Blvd - Homestead Ave) Class III 1.68 1.3 0.0 1.0 1.0 3.0 1.8 2.712 Bohannon Avenue / Cypress Avenue (Los Padres Blvd- Stevens Creek Blvd) Class III 1.68 1.3 0.0 0.0 2.0 3.0 1.3 3.013 Chromite Drive (Monroe St- Bowers Ave) Class III 1.59 1.3 0.0 1.0 1.0 3.0 1.0 3.0
Ranking Criteria WeightRider Stress 0.3
Collision History 0.1ADT Volumes 0.05Gap Closure 0.1Cost/Funding 0.2Connectivity 0.15Complexity 0.1
Table 1 lists the Class II or Class III facilities proposed in the 2009 Bicycle Plan. Table 2 includes all of the facilities proposed in the 2002 Bicycle Plan as well as the 2009 Bicycle Plan and the proposedimprovement for each update.
September 14, 2009G-1

2009 Santa Clara Bicycle Plan UpdateCity of Santa Clara
Table 2 - 2002 vs. 2009 Recommended Facilities
Corridor From To 2002 Recommended Facility 2009 Recommended FacilityAgate Dr French St Bowers Ave Class III Future Proposed RouteAgnew Rd Mission College Blvd Montague Expwy Class II ExistingAlviso St/Palm Dr Harrison St Santa Clara St Class III Future Proposed RouteBassett St Agnew Rd Laurelwood Rd None Class IIBenton St Lawrence Expwy El Camino Real Class II Class II & IIIBohannon Dr Los Padres Blvd Cypress Dr None Class IIIBowers Ave US-101 El Camino Real Class II Existing & Class IIIChromite Dr Monroe St Bowers Ave Class II Class IIICypress Dr Bohannon Dr Stevens Creek Blvd None Class IIIDe La Cruz Blvd De La Cruz Tri-Level Central Expwy Class II Future Proposed RouteDe La Cruz Blvd Trimble Rd Montague Expwy Class III Future Proposed RouteEl Camino Real City Limits (west) The Alameda None Future Proposed RouteGarrity Way Agnew Rd Lick Mill Blvd None Future Proposed RouteGreat America Pkwy Yerba Buena Way US-101 Class II ExistingHarrison St Los Padres Blvd Alviso St Class III Future Proposed RouteHomestead Rd Lawrence Expwy Lafayette St Class II Existing & Class IIHope Dr Lafayette St Lick Mill Blvd Class II ExistingKiely Blvd El Camino Real Stevens Creek Blvd Class II Future Proposed RouteLafayette St SR-237 Agnew Rd Special Study Corridor Existing & Class IILafayette St Laurelwood Rd Warburton Ave Special Study Corridor Class II & Future Proposed RouteLick Mill Blvd Montague Expwy Tasman Dr Class II Class II & IIIMarket St Monroe St The Alameda None Class IIIMartin Ave Walsh Ave De La Cruz Blvd Class III Future Proposed RouteMission College Blvd Mission College Blvd Wyatt Dr Class II Existing & Class IIMission College Blvd Loop Mission College Blvd Mission College Blvd Class III Future Proposed RouteMonroe St Lawrence Expwy Scott Blvd Class II Class II & Class IIINewhall St Saratoga Ave Park Ave Class II Future Proposed RouteNorth Winchester Blvd N/O Pruneridge Ave Homestead Rd Class II & III Existing & Class IIIPatrick Henry Dr Great America Pkwy Old Mountain View Alviso Rd Class III Future Proposed RoutePruneridge Ave Lawrence Expwy Winchester Blvd Class II Class IISan Tomas Aquino Trail SR-237 Cabrillo Ave Class I Existing & Class ISaratoga Ave N/O San Tomas Expwy Market St Class II Class II & Future Proposed RouteSaratoga Creek Trail Kiely Blvd Homestead Rd None Class IScott Blvd Garrett Dr Monroe St Class II Existing & Class IISouthern Pacific Railroad Lawrence Expwy Benton St Special Study Corridor None1
Stevens Creek Blvd Cronin Dr Santana Row Class II Future Proposed RouteTasman Dr Calabazas Creek Lafayette St Class II Future Proposed RouteThomas Rd/Laurelwood Rd Montague Expwy Lafayette St Class III Future Proposed RouteWalsh Ave Bowers Ave Lafayette St Class III Future Proposed RouteWarburton Ave Lawrence Expwy Lafayette St Class III Existing & Future Proposed RouteWashington St Homestead Rd I-880 Class III Future Proposed RouteWhite Dr Homestead Rd El Camino Real Class III Future Proposed RouteWoodhams Rd Stevens Creek Blvd Homestead Rd Class III Class III1The Southern Pacific Railroad Trail is removed from the plan due to other more feasible near-by options
September 14, 2009G-2
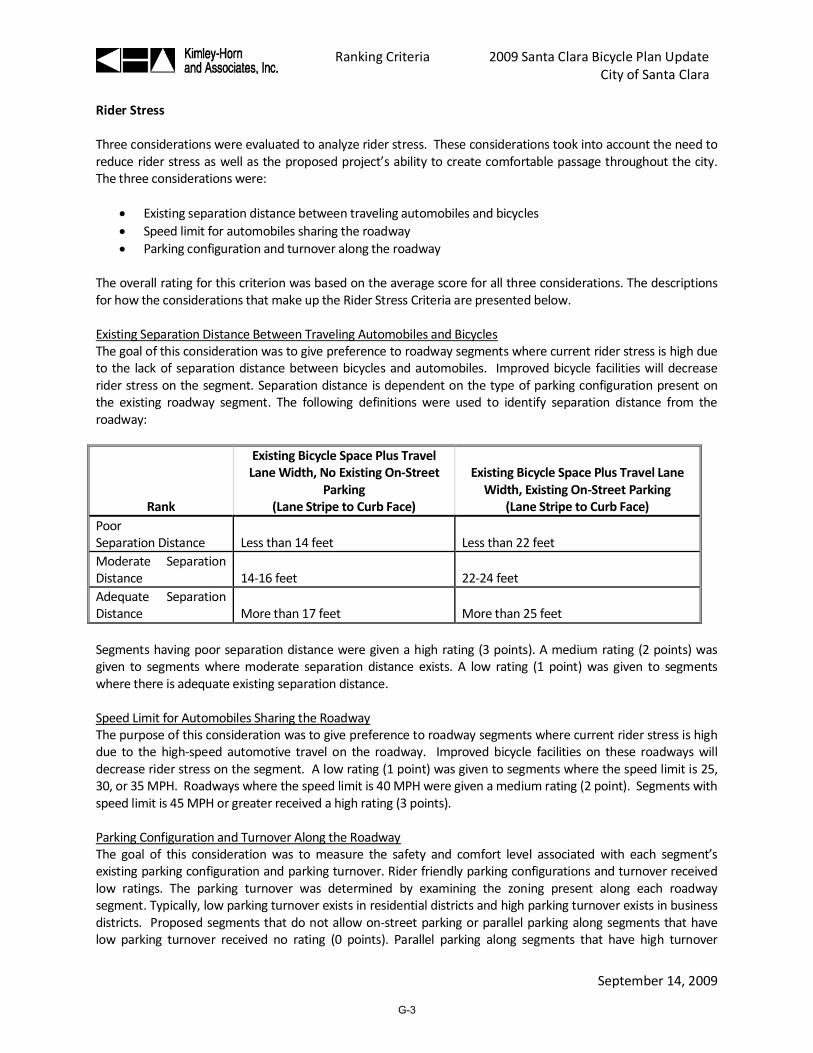
Ranking Criteria 2009 Santa Clara Bicycle Plan Update City of Santa Clara
September 14, 2009
Rider Stress
Three considerations were evaluated to analyze rider stress. These considerations took into account the need toreduce rider stress as well as the proposed project’s ability to create comfortable passage throughout the city.The three considerations were:
Existing separation distance between traveling automobiles and bicyclesSpeed limit for automobiles sharing the roadwayParking configuration and turnover along the roadway
The overall rating for this criterion was based on the average score for all three considerations. The descriptionsfor how the considerations that make up the Rider Stress Criteria are presented below.
Existing Separation Distance Between Traveling Automobiles and BicyclesThe goal of this consideration was to give preference to roadway segments where current rider stress is high dueto the lack of separation distance between bicycles and automobiles. Improved bicycle facilities will decreaserider stress on the segment. Separation distance is dependent on the type of parking configuration present onthe existing roadway segment. The following definitions were used to identify separation distance from theroadway:
Rank
Existing Bicycle Space Plus TravelLane Width, No Existing On-Street
Parking(Lane Stripe to Curb Face)
Existing Bicycle Space Plus Travel LaneWidth, Existing On-Street Parking
(Lane Stripe to Curb Face)PoorSeparation Distance Less than 14 feet Less than 22 feetModerate SeparationDistance 14-16 feet 22-24 feetAdequate SeparationDistance More than 17 feet More than 25 feet
Segments having poor separation distance were given a high rating (3 points). A medium rating (2 points) wasgiven to segments where moderate separation distance exists. A low rating (1 point) was given to segmentswhere there is adequate existing separation distance.
Speed Limit for Automobiles Sharing the RoadwayThe purpose of this consideration was to give preference to roadway segments where current rider stress is highdue to the high-speed automotive travel on the roadway. Improved bicycle facilities on these roadways willdecrease rider stress on the segment. A low rating (1 point) was given to segments where the speed limit is 25,30, or 35 MPH. Roadways where the speed limit is 40 MPH were given a medium rating (2 point). Segments withspeed limit is 45 MPH or greater received a high rating (3 points).
Parking Configuration and Turnover Along the RoadwayThe goal of this consideration was to measure the safety and comfort level associated with each segment’sexisting parking configuration and parking turnover. Rider friendly parking configurations and turnover receivedlow ratings. The parking turnover was determined by examining the zoning present along each roadwaysegment. Typically, low parking turnover exists in residential districts and high parking turnover exists in businessdistricts. Proposed segments that do not allow on-street parking or parallel parking along segments that havelow parking turnover received no rating (0 points). Parallel parking along segments that have high turnover
G-3

Ranking Criteria 2009 Santa Clara Bicycle Plan Update City of Santa Clara
September 14, 2009
received a low score (1 point). Diagonal or perpendicular parking that has low parking turnover received amedium rating (2 point). Segments with diagonal or perpendicular parking with high turnover received a highrating (3 points).
Collision History
The purpose of this criterion was to identify current roadway facilities with high bicycle accident frequency.The more frequent the accident occurrence, the greater the need for improved bicycle facilities. Roadwaysegments with high bicycle accident rates will benefit from bicycle facility improvements and received highratings.
The City of Santa Clara provided six years of bicycle accident data (2002-2007). Roadway segments with 12 ormore bicycle related accidents were given a high rating (3 points). Roadway segments with 6 to 11 bicyclerelated accidents were given a medium rating (2 points) and a low rating (1 point) was given to roadwaysegments with 1 to 5 bicycle related accidents. Roadway segments with zero bicycle related accidentsreceived 0 points.
Average Daily Traffic Volumes
This consideration gave preference to roadway segments where current bicycle travel is discouraged due to highvolumes of vehicle traffic. Average daily traffic volumes (ADT) were reviewed to determine which roadways havehigh daily vehicle volumes. Roadway segments with an ADT of 25,000 vehicles or greater were given a highrating (3 points). A medium rating (2 points) was given to segments with ADT ranging from 10,000 to 25,000vehicles. Roadways with an ADT between 2,000 and 10,000 vehicles were given a low rating (1 point). All othersegments were given 0 points for this consideration.
Gap Closure
Priority was given to proposed bicycle facilities that would provide a link between two existing bicyclefacilities. A proposed bicycle project received a high rating (3.0) if one of the following conditions were met:
Connects to existing bikeways at both endsBridges a gap in an existing bikewayServes as a collector of other bikeways or residential streetsCreates a cross-city bikewayConnects to an existing bikeway at one end and the Santa Clara City Limit at the other end
A proposed bicycle project received a medium rating (2.0) if one of the following conditions were met:
Provides an access link for another bikewayConnects to a county-wide bicycle route or Cross County Corridor designated by VTA
A proposed bicycle project received a low rating (1.0) if one of the following conditions were met:
G-4

Ranking Criteria 2009 Santa Clara Bicycle Plan Update City of Santa Clara
September 14, 2009
Connects to an existing bikeway on one end and a proposed bikeway on the other endConnects to a proposed bikeway on one end and the Santa Clara City Limit at the other endConnects to proposed bikeways on both ends
A proposed bicycle project received 0 points if it did not qualify for a high, medium, or low rating.
Cost/Funding
The bicycle improvement projects were evaluated based on the preliminary cost estimates and on theproject’s ability to compete for outside funding. Project competitiveness was accounted for by makingestimates of local contributions toward improvements. For example, the Benton Street from LawrenceExpressway to San Tomas Expressway improvements have an estimated cost of $355,500, but the project isexpected to compete well for federal and/or state funding, so only the expected local match will beconsidered a cost to the City. In this example, the local match is expected to be 20 percent of the total cost,so $71,100 would represent the cost (cost to the city) of the project. High priority will be given to theimprovements that are most cost efficient under this criterion (i.e., lowest cost per mile).
Total project costs and expected City contributions were developed for all project corridors. Citycontributions per mile were normalized over a 3-point scale. Proposed projects received a high rating if theirCity contribution costs were expected to be low on a per mile basis.
Connectivity
Priority for development of proposed bicycle improvements was based on the number of local and regionalactivity centers on or near the proposed facility. Activity centers included regional and local parks, shoppingcenters, schools, large employment centers, and multi-modal connections.
A bike facility was considered to be serving an activity center if it is located within a quarter mile ride of thecenter. The total number of activity centers served by each project (measured in activity centers per mile ofthe proposed project) was summed. The numbers for all projects were normalized over a 3-point scale. Arating of 3.0 was the highest rating, indicating that the facility serves more than the average number ofactivity centers. 0 points indicated that the facility does not serve any activity centers.
Complexity
The complexity criteria were evaluated using the following considerations:
Right-of-way (ROW) availabilityThe number of agencies involved in development of the segmentExpected community reactions
The overall complexity score was based on the average of the three considerations listed above.
ROW AvailabilityAvailability of right-of-way can be a key issue in the feasibility, timing and cost of a project. As such, it wasassessed as a condition of the complexity criteria. The ratings for this consideration were as follows:
G-5

Ranking Criteria 2009 Santa Clara Bicycle Plan Update City of Santa Clara
September 14, 2009
High rating (3 points) – ROW suitable and availableMedium rating (2 points) – ROW suitable and could easily be acquiredLow rating (1 point) – ROW suitable but acquisition may be difficult0 points – ROW not suitable or available
Agency InvolvementInteraction between agencies is often difficult and hard to facilitate. Therefore, the number of agenciesinvolved with each roadway segment was evaluated as a consideration for the complexity criteria. Theratings for this consideration were as follows:
High rating (3 points) – Only involved agency is the City of Santa ClaraMedium rating (2 points) – Two involved agenciesLow rating (1 point) – Three involved agencies0 points – More than three involved agencies
Expected Community ReactionThis consideration attempted to quantify the expected community reaction for each proposed bicyclesegment. The expected community reaction was based on the proposed bicycle improvement project and theproposed roadway modifications required by the improvement. For example, some bicycle improvementsrequire simple re-striping of the existing roadway and do not affect through vehicular traffic or roadwayparking capacities. These improvements are expected to have a high degree of community support. Otherbicycle improvements that require removal of travel lanes and/or parking facilities are expected to have alower degree of community support. The ranking system for this consideration was as follows:
High rating (3 points) – no parking or vehicular travel lanes will be affectedMedium rating (2 points) – small number of parking spaces affected or parking in very low demandareas affected; minor geometry or travel lane removal required (e.g. low demand right-turn lanes atintersections)Low rating (1 point) – significant parking removal; travel lane removal
Ranking Procedure
Each criterion was assigned a weighting factor based on the importance of the criteria. The “score” eachbicycle improvement segment’s criteria received was multiplied by its respective weighting factor. Thisallowed more desirable criteria, like Rider Stress and Cost/Funding, to influence the segment’s ranking moreso than less desirable criteria.
The ranking criteria were weighted as follows:
0.30 for Rider Stress0.10 for Collision History0.05 for Average Daily Vehicle Volumes0.10 for Gap Closure0.20 for Cost/Funding0.15 for Connectivity0.10 for Complexity
G-6

APPENDIXH
COST ESTIMATES FOR PROPOSED FACILITIES

2009 Santa Clara Bicycle Plan UpdateCity of Santa Clara
September 14, 2009
Bassett (Agnew to Laurelwood)Striping per Linear Foot CostsBassett, Agnew to Laurelwood = 6,900
Input cost per square foot of thermo plastic $5.00Input cost per each marker $5.00
Caltrans Striping SF Thermo SF Thermo No. of Markers No. of Markers $ per Removal Project No. Stripes No. StripesDetail No. per 96 LF per LF per 96 LF per LF $ Thermo $ Marker LF "=1/2 Length to add to remove Cost
1 9.33 0.0972 0 0.0000 $0.49 $0.00 $0.49 $0.24 3200 0 1 $77822 64.00 0.6667 4 0.0408 $3.33 $0.20 $3.54 $1.77 6900 1 0 $24,40822 64.00 0.6667 4 0.0408 $3.33 $0.20 $3.54 $1.77 3000 0 1 $5,306
27B 32.00 0.3333 0 0.0000 $1.67 $0.00 $1.67 $0.83 6900 1 0 $11,50039 48.00 0.5000 0 0.0000 $2.50 $0.00 $2.50 $1.25 6900 2 0 $34,500
$76,492
Miscellaneous Design Element CostsItem Unit Cost No. $$Sign and Post EA $325 24 $7,800Bike Detection EA $1,000 3 $3,000
$10,800
Pavement Markings Costs
Summary of CostsStriping Costs $76,492Legends $2,899Misc. $10,800Sub Total $90,191
SOFT COSTS FOR ENGINEERING,ADMINISTRATION, SURVEY, ETC.IS APPROX 35% $31,567ADD MOBILIZATION AT 5% $4,510ADD CONTINGENCY OF 20% $18,038
$144,305
Cost of Thermo per Sq. Foot $5.00Remove = .5 cost
Sq. Foot Add SF add remove SF removeLegend Thermo No. Quantity no. Quantity Cost
Type II Arrow (L or R & S) 45 0 0 1 45 $113Type IV Arrow (L or R) 15 1 15 1 15 $113Type VII Arrow (L or R & S) 27 0 0 0 0 $0RR Crossing Symbol 70 2 140 2 140 $1,050Bike Lane Symbol (MUTCD) 5 24 120 0 0 $60025 17.5 1 17.5 1 17.5 $131Ahead 31 1 31 1 31 $233Stop 22 4 88 4 88 $660
$2,899
H-1

2009 Santa Clara Bicycle Plan UpdateCity of Santa Clara
September 14, 2009
Benton (Lawrence to San Tomas)Striping per Linear Foot CostsBenton, Lawrence to San Tomas = 12,700 LF (2,650 already TWLTL)
Input cost per square foot of thermo plastic $5.00Input cost per each marker $5.00
Caltrans Striping SF Thermo SF Thermo No. of Markers No. of Markers $ per Removal Project No. Stripes No. StripesDetail No. per 96 LF per LF per 96 LF per LF $ Thermo $ Marker LF "=1/2 Length to add to remove Cost
9 9.33 0.0972 2 0.0204 $0.49 $0.10 $0.59 $0.29 12700 0 2 $7,47022 64.00 0.6667 4 0.0408 $3.33 $0.20 $3.54 $1.77 12700 0 1 $22,463
27B 32.00 0.3333 0 0.0000 $1.67 $0.00 $1.67 $0.83 12700 2 0 $42,33327B 32.00 0.3333 0 0.0000 $1.67 $0.00 $1.67 $0.83 6350 0 1 $5,29232 80.00 0.8333 10 0.1020 $4.17 $0.51 $4.68 $2.34 12700 1 0 $59,39633 80.00 0.8333 10 0.1020 $4.17 $0.51 $4.68 $2.34 2650 1 $6,19738 64.00 0.6667 4 0.0408 $3.33 $0.20 $3.54 $1.77 300 0 1 $53139 48.00 0.5000 0 0.0000 $2.50 $0.00 $2.50 $1.25 12700 2 0 $63,500
$207,181
Miscellaneous Design Element CostsItem Unit Cost No. $$Sign and Post EA $325 26 $8,450Bike Detection EA $1,000 6 $6,000
$14,450
Pavement Markings CostsCost of Thermo per Sq. Foot $5.00Remove = .5 cost
Sq. Foot Add SF add remove SF removeLegend Thermo No. Quantity no. Quantity Cost
Type IV Arrow (L or R) 15 26 390 8 120 $2,250Bike Lane Symbol (MUTCD) 5 26 130 0 0 $650Slow 23 4 92 4 92 $690School 35 4 140 4 140 $1,050Xing 21 8 168 8 168 $1,260Ped 18 4 72 4 72 $540
$6,440
Summary of CostsStriping Costs $207,181Legends $6,440Misc. $14,450Sub Total $228,071
Caltrans Striping
SOFT COSTS FOR ENGINEERING,ADMINISTRATION, SURVEY, ETC.IS APPROX 35% $79,825ADD MOBILIZATION AT 5% $11,404ADD CONTINGENCY OF 20% $45,614
$364,913
H-2

2009 Santa Clara Bicycle Plan UpdateCity of Santa Clara
September 14, 2009
Benton (Monroe to El Camino)Striping per Linear Foot CostsBenton, Monroe to El Camino = 3,200
Input cost per square foot of thermo plastic $5.00Input cost per each marker $5.00
Caltrans Striping SF Thermo SF Thermo No. of Markers No. of Markers $ per Removal Project No. Stripes No. StripesDetail No. per 96 LF per LF per 96 LF per LF $ Thermo $ Marker LF "=1/2 Length to add to remove Cost
27B 32.00 0.3333 0 0.0000 $1.67 $0.00 $1.67 $0.83 3200 2 0 $10,66739 48.00 0.5000 0 0.0000 $2.50 $0.00 $2.50 $1.25 3200 2 0 $16,000
$26,667
Miscellaneous Design Element CostsItem Unit Cost No. $$Sign and Post EA $325 28 $9,100Bike Detection EA $1,000 4 $4,000
$13,100
Pavement Markings CostsCost of Thermo per Sq. Foot $5.00Remove = .5 cost
Sq. Foot Add SF add remove SF removeLegend Thermo No. Quantity no. Quantity Cost
Bike Lane Symbol (MUTCD) 5 28 140 0 0 $700Xing 21 6 126 6 126 $945Ped 18 6 108 6 108 $810
$2,455
Summary of CostsStriping Costs $26,667Legends $2,455Misc. $13,100Sub Total $42,222
SOFT COSTS FORENGINEERING,ADMINISTRATION, SURVEY,ETC. IS APPROX 35% $14,778ADD MOBILIZATION AT 5% $2,111ADD CONTINGENCY OF 20% $8,444
$67,555
H-3
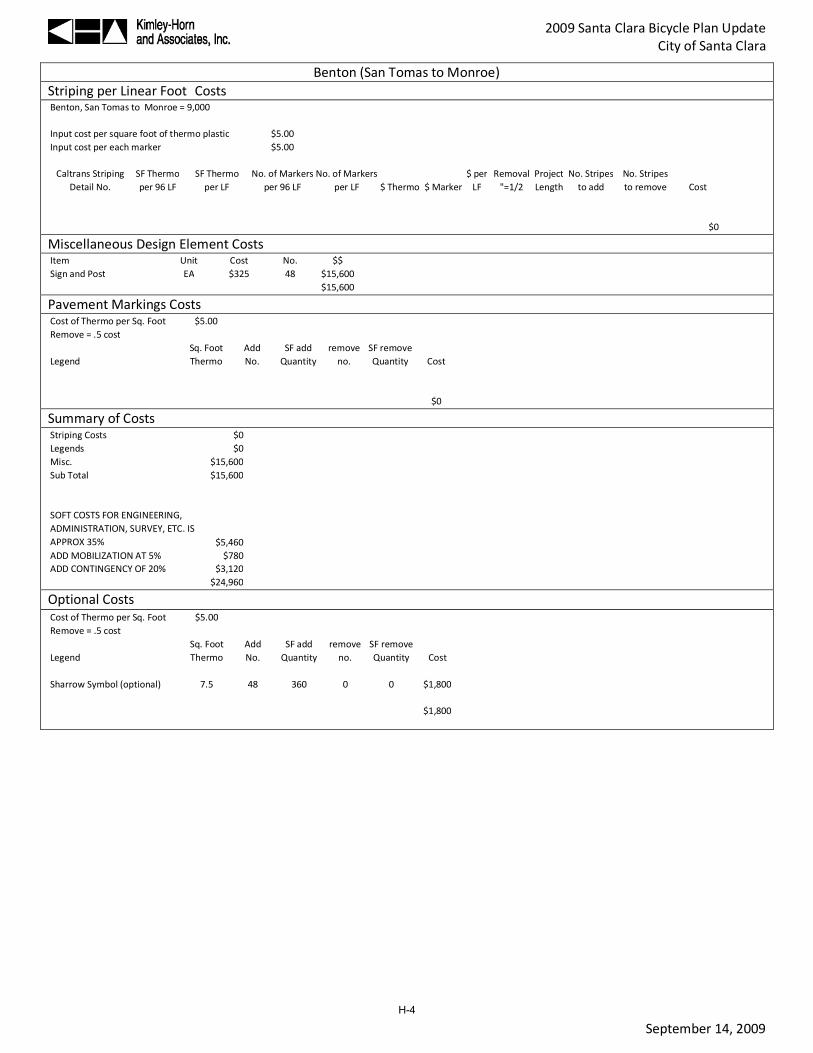
2009 Santa Clara Bicycle Plan UpdateCity of Santa Clara
September 14, 2009
Benton (San Tomas to Monroe)Striping per Linear Foot CostsBenton, San Tomas to Monroe = 9,000
Input cost per square foot of thermo plastic $5.00Input cost per each marker $5.00
Caltrans Striping SF Thermo SF Thermo No. of Markers No. of Markers $ per Removal Project No. Stripes No. StripesDetail No. per 96 LF per LF per 96 LF per LF $ Thermo $ Marker LF "=1/2 Length to add to remove Cost
$0
Miscellaneous Design Element CostsItem Unit Cost No. $$Sign and Post EA $325 48 $15,600
$15,600
Pavement Markings CostsCost of Thermo per Sq. Foot $5.00Remove = .5 cost
Sq. Foot Add SF add remove SF removeLegend Thermo No. Quantity no. Quantity Cost
$0
Summary of CostsStriping Costs $0Legends $0Misc. $15,600Sub Total $15,600
SOFT COSTS FOR ENGINEERING,ADMINISTRATION, SURVEY, ETC. ISAPPROX 35% $5,460ADD MOBILIZATION AT 5% $780ADD CONTINGENCY OF 20% $3,120
$24,960
Optional CostsCost of Thermo per Sq. Foot $5.00Remove = .5 cost
Sq. Foot Add SF add remove SF removeLegend Thermo No. Quantity no. Quantity Cost
Sharrow Symbol (optional) 7.5 48 360 0 0 $1,800
$1,800
H-4

2009 Santa Clara Bicycle Plan UpdateCity of Santa Clara
September 14, 2009
Bohannon (Los Padres to Cypress)Striping per Linear Foot CostsBohannon, Los Padres to Cypress = 1,060
Input cost per square foot of thermo plastic $5.00Input cost per each marker $5.00
Caltrans Striping SF Thermo SF Thermo No. of Markers No. of Markers $ per Removal Project No. Stripes No. StripesDetail No. per 96 LF per LF per 96 LF per LF $ Thermo $ Marker LF "=1/2 Length to add to remove Cost
$0
Miscellaneous Design Element CostsItem Unit Cost No. $$Sign and Post EA $325 4 $1,300
$1,300
Pavement Markings CostsCost of Thermo per Sq. Foot $5.00Remove = .5 cost
Sq. Foot Add SF add remove SF removeLegend Thermo No. Quantity no. Quantity Cost
$0
Summary of CostsStriping Costs $0Legends $0Misc. $1,300Sub Total $1,300
SOFT COSTS FOR ENGINEERING,ADMINISTRATION, SURVEY, ETC.IS APPROX 35% $455ADD MOBILIZATION AT 5% $65ADD CONTINGENCY OF 35% $455
$2,275
Optional CostsCost of Thermo per Sq. Foot $5.00Remove = .5 cost
Sq. Foot Add SF add remove SF removeLegend Thermo No. Quantity no. Quantity Cost
Sharrow Symbol 7.5 4 30 0 0 $150
$150
H-5
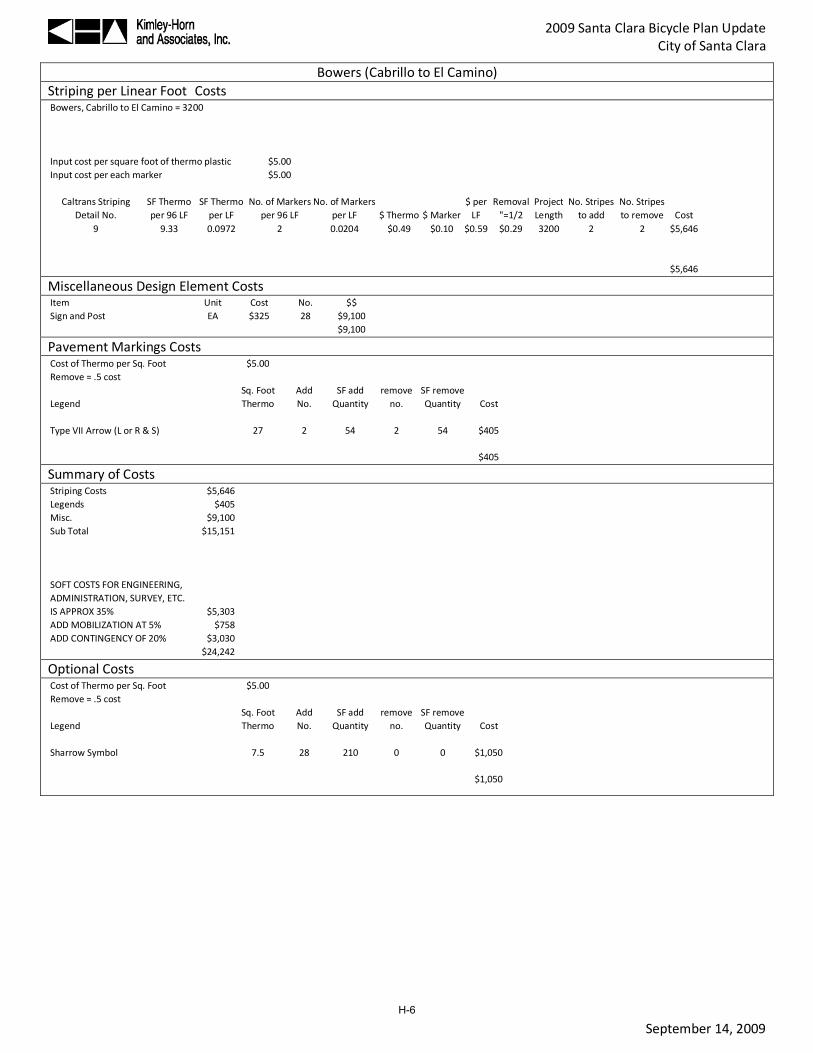
2009 Santa Clara Bicycle Plan UpdateCity of Santa Clara
September 14, 2009
Bowers (Cabrillo to El Camino)Striping per Linear Foot CostsBowers, Cabrillo to El Camino = 3200
Input cost per square foot of thermo plastic $5.00Input cost per each marker $5.00
Caltrans Striping SF Thermo SF Thermo No. of Markers No. of Markers $ per Removal Project No. Stripes No. StripesDetail No. per 96 LF per LF per 96 LF per LF $ Thermo $ Marker LF "=1/2 Length to add to remove Cost
9 9.33 0.0972 2 0.0204 $0.49 $0.10 $0.59 $0.29 3200 2 2 $5,646
$5,646
Miscellaneous Design Element CostsItem Unit Cost No. $$Sign and Post EA $325 28 $9,100
$9,100
Pavement Markings CostsCost of Thermo per Sq. Foot $5.00Remove = .5 cost
Sq. Foot Add SF add remove SF removeLegend Thermo No. Quantity no. Quantity Cost
Type VII Arrow (L or R & S) 27 2 54 2 54 $405
$405
Summary of CostsStriping Costs $5,646Legends $405Misc. $9,100Sub Total $15,151
SOFT COSTS FOR ENGINEERING,ADMINISTRATION, SURVEY, ETC.IS APPROX 35% $5,303ADD MOBILIZATION AT 5% $758ADD CONTINGENCY OF 20% $3,030
$24,242
Optional CostsCost of Thermo per Sq. Foot $5.00Remove = .5 cost
Sq. Foot Add SF add remove SF removeLegend Thermo No. Quantity no. Quantity Cost
Sharrow Symbol 7.5 28 210 0 0 $1,050
$1,050
H-6
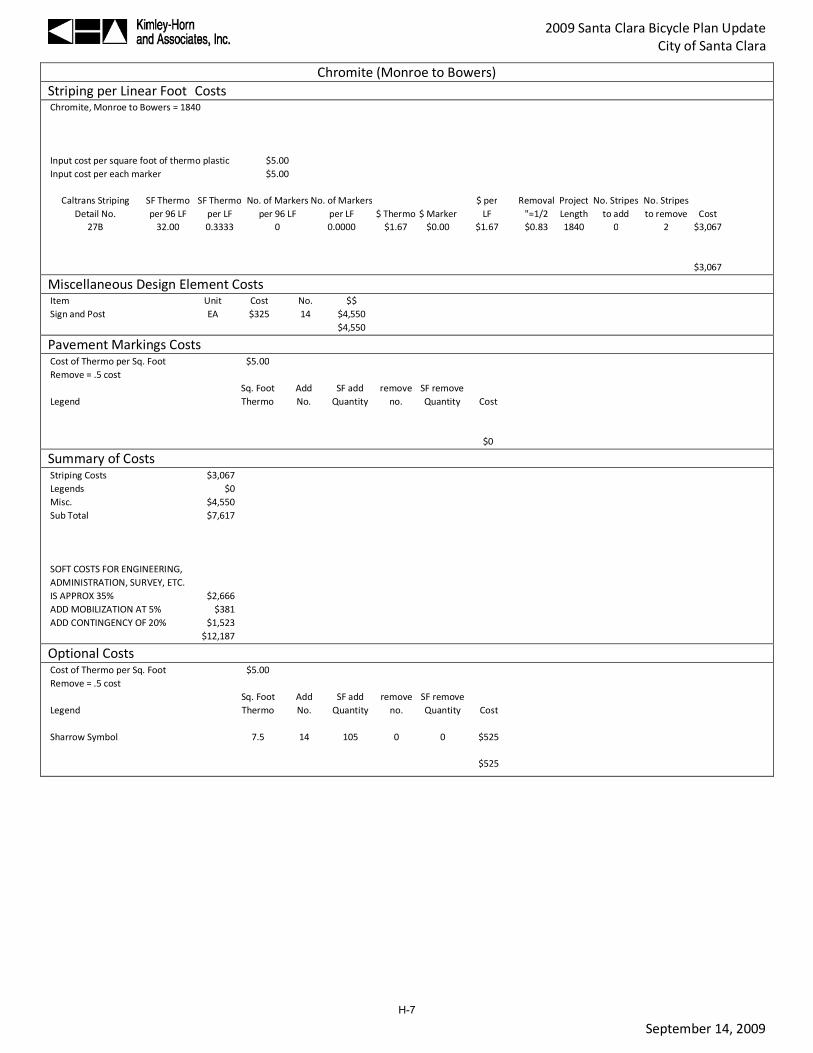
2009 Santa Clara Bicycle Plan UpdateCity of Santa Clara
September 14, 2009
Chromite (Monroe to Bowers)Striping per Linear Foot CostsChromite, Monroe to Bowers = 1840
Input cost per square foot of thermo plastic $5.00Input cost per each marker $5.00
Caltrans Striping SF Thermo SF Thermo No. of Markers No. of Markers $ per Removal Project No. Stripes No. StripesDetail No. per 96 LF per LF per 96 LF per LF $ Thermo $ Marker LF "=1/2 Length to add to remove Cost
27B 32.00 0.3333 0 0.0000 $1.67 $0.00 $1.67 $0.83 1840 0 2 $3,067
$3,067
Miscellaneous Design Element CostsItem Unit Cost No. $$Sign and Post EA $325 14 $4,550
$4,550
Pavement Markings CostsCost of Thermo per Sq. Foot $5.00Remove = .5 cost
Sq. Foot Add SF add remove SF removeLegend Thermo No. Quantity no. Quantity Cost
$0
Summary of CostsStriping Costs $3,067Legends $0Misc. $4,550Sub Total $7,617
SOFT COSTS FOR ENGINEERING,ADMINISTRATION, SURVEY, ETC.IS APPROX 35% $2,666ADD MOBILIZATION AT 5% $381ADD CONTINGENCY OF 20% $1,523
$12,187
Optional CostsCost of Thermo per Sq. Foot $5.00Remove = .5 cost
Sq. Foot Add SF add remove SF removeLegend Thermo No. Quantity no. Quantity Cost
Sharrow Symbol 7.5 14 105 0 0 $525
$525
H-7
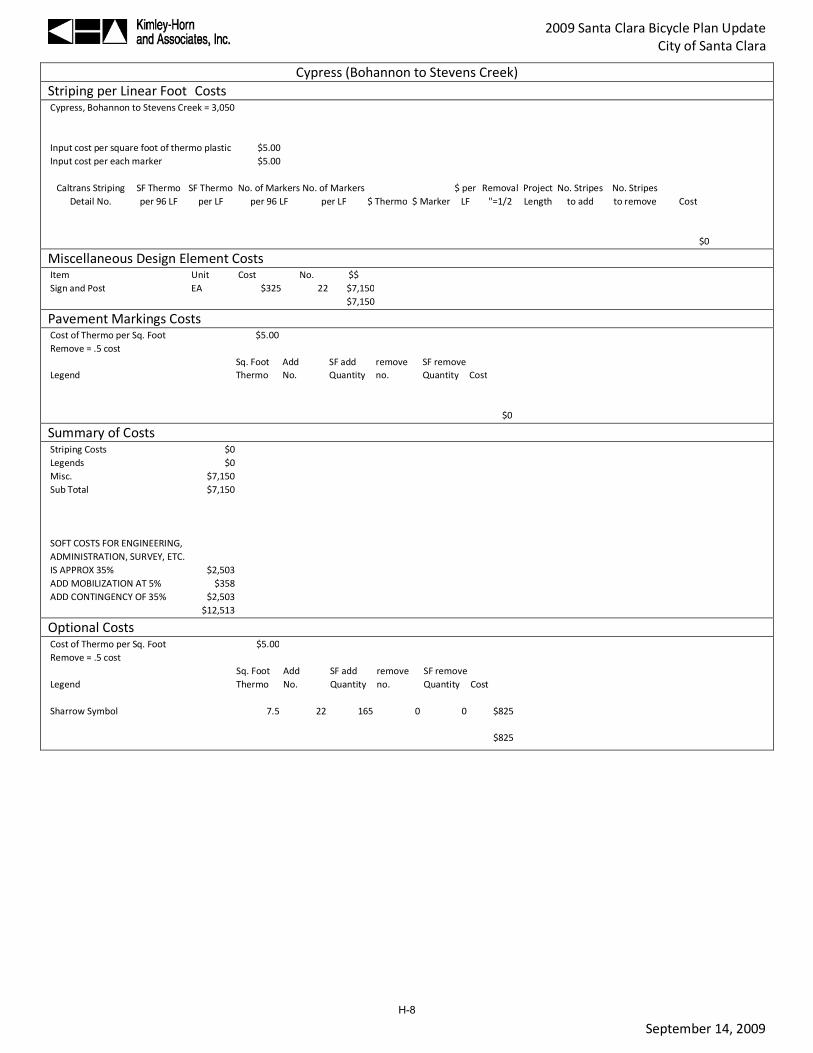
2009 Santa Clara Bicycle Plan UpdateCity of Santa Clara
September 14, 2009
Cypress (Bohannon to Stevens Creek)Striping per Linear Foot CostsCypress, Bohannon to Stevens Creek = 3,050
Input cost per square foot of thermo plastic $5.00Input cost per each marker $5.00
Caltrans Striping SF Thermo SF Thermo No. of Markers No. of Markers $ per Removal Project No. Stripes No. StripesDetail No. per 96 LF per LF per 96 LF per LF $ Thermo $ Marker LF "=1/2 Length to add to remove Cost
$0
Miscellaneous Design Element CostsItem Unit Cost No. $$Sign and Post EA $325 22 $7,150
$7,150
Pavement Markings CostsCost of Thermo per Sq. Foot $5.00Remove = .5 cost
Sq. Foot Add SF add remove SF removeLegend Thermo No. Quantity no. Quantity Cost
$0
Summary of CostsStriping Costs $0Legends $0Misc. $7,150Sub Total $7,150
SOFT COSTS FOR ENGINEERING,ADMINISTRATION, SURVEY, ETC.IS APPROX 35% $2,503ADD MOBILIZATION AT 5% $358ADD CONTINGENCY OF 35% $2,503
$12,513
Optional CostsCost of Thermo per Sq. Foot $5.00Remove = .5 cost
Sq. Foot Add SF add remove SF removeLegend Thermo No. Quantity no. Quantity Cost
Sharrow Symbol 7.5 22 165 0 0 $825
$825
H-8

2009 Santa Clara Bicycle Plan UpdateCity of Santa Clara
September 14, 2009
Lafayette (Laurelwood to Central)Striping per Linear Foot CostsLafayette, Laurelwood to Central = 2,100
Input cost per square foot of thermo plastic $5.00Input cost per each marker $5.00
Caltrans Striping SF Thermo SF Thermo No. of Markers No. of Markers $ per Removal Project No. Stripes No. StripesDetail No. per 96 LF per LF per 96 LF per LF $ Thermo $ Marker LF "=1/2 Length to add to remove Cost
9 9.33 0.0972 2 0.0204 $0.49 $0.10 $0.59 $0.29 1050 0 1 $3099 9.33 0.0972 2 0.0204 $0.49 $0.10 $0.59 $0.29 550 1 0 $323
39 48.00 0.5000 0 0.0000 $2.50 $0.00 $2.50 $1.25 2100 2 0 $18,500
$19,132
Miscellaneous Design Element CostsItem Unit Cost No. $$Sign and Post EA $325 11 $3,575Bike Detection EA $1,000 2 $2,000
$5,575
Pavement Markings CostsCost of Thermo per Sq. Foot $5.00Remove = .5 cost
Sq. Foot Add SF add remove SF removeLegend Thermo No. Quantity no. Quantity Cost
Type VII Arrow (L or R & S) 27 1 27 1 27 $203Bike Lane Symbol (MUTCD) 5 11 55 0 0 $275
$478
Summary of CostsStriping Costs $19,132Legends $478Misc. $5,575Sub Total $25,185
SOFT COSTS FOR ENGINEERING,ADMINISTRATION, SURVEY, ETC.IS APPROX 35% $8,815ADD MOBILIZATION AT 5% $1,259ADD CONTINGENCY OF 20% $5,037
$40,296
H-9

2009 Santa Clara Bicycle Plan UpdateCity of Santa Clara
September 14, 2009
Lafayette (Yerba Buena to Calle de Luna)Striping per Linear Foot CostsLafayette, Yerba Buena to Calle de Luna = 3,650 3,700
Input cost per square foot of thermo plastic $5.00Input cost per each marker $5.00
Caltrans Striping SF Thermo SF Thermo No. of Markers No. of Markers $ per Removal Project No. Stripes No. StripesDetail No. per 96 LF per LF per 96 LF per LF $ Thermo $ Marker LF "=1/2 Length to add to remove Cost
39 48.00 0.5000 0 0.0000 $2.50 $0.00 $2.50 $1.25 3700 2 0 $18,500
$18,500
Miscellaneous Design Element CostsItem Unit Cost No. $$Sign and Post EA $325 13 $4,225Bike Detection EA $1,000 1 $1,000
$5,225
Pavement Markings CostsCost of Thermo per Sq. Foot $5.00Remove = .5 cost
Sq. Foot Add SF add remove SF removeLegend Thermo No. Quantity no. Quantity Cost
Bike Lane Symbol (MUTCD) 5 13 65 0 0 $325
$325
Summary of CostsStriping Costs $18,500Legends $325Misc. $5,225Sub Total $24,050
SOFT COSTS FOR ENGINEERING,ADMINISTRATION, SURVEY, ETC.IS APPROX 35% $8,418ADD MOBILIZATION AT 5% $1,203ADD CONTINGENCY OF 20% $4,810
$38,480
H-10

2009 Santa Clara Bicycle Plan UpdateCity of Santa Clara
September 14, 2009
Lick Mill (Hope to Montague)Striping per Linear Foot CostsLick Mill, Hope to Montague = 4,250
Input cost per square foot of thermo plastic $5.00Input cost per each marker $5.00
Caltrans Striping SF Thermo SF Thermo No. of Markers No. of Markers $ per Removal Project No. Stripes No. StripesDetail No. per 96 LF per LF per 96 LF per LF $ Thermo $ Marker LF "=1/2 Length to add to remove Cost
9 9.33 0.0972 2 0.0204 $0.49 $0.10 $0.59 $0.29 4250 2 0 $4,9999 9.33 0.0972 2 0.0204 $0.49 $0.10 $0.59 $0.29 4250 0 2 $2,500
27B 32.00 0.3333 0 0.0000 $1.67 $0.00 $1.67 $0.83 5650 1 1 $14,125
$21,624
Miscellaneous Design Element CostsItem Unit Cost No. $$Sign and Post EA $325 11 $3,575
$3,575
Pavement Markings CostsCost of Thermo per Sq. Foot $5.00Remove = .5 cost
Sq. Foot Add SF add remove SF removeLegend Thermo No. Quantity no. Quantity Cost
Type III Arrow (L or R) 42 9 378 2 84 $2,100Type IV Arrow (L or R) 15 0 0 7 105 $263Bike Lane Symbol (MUTCD) 5 11 55 0 0 $275Slow 23 8 184 8 184 $1,380School 35 8 280 8 280 $2,100Xing 21 10 210 10 210 $1,575Ped 18 2 36 2 36 $270
$7,963
Summary of CostsStriping Costs $21,624Legends $7,963Misc. $3,575Sub Total $33,161
SOFT COSTS FOR ENGINEERING,ADMINISTRATION, SURVEY, ETC.IS APPROX 35% $11,607ADD MOBILIZATION AT 5% $1,658ADD CONTINGENCY OF 20% $6,632
$53,058
H-11

2009 Santa Clara Bicycle Plan UpdateCity of Santa Clara
September 14, 2009
Lick Mill (Tasman to Hope)Striping per Linear Foot CostsLick Mill, Tasman to Hope = 3,700
Input cost per square foot of thermo plastic $5.00Input cost per each marker $5.00
Caltrans Striping SF Thermo SF Thermo No. of Markers No. of Markers $ per Removal Project No. Stripes No. StripesDetail No. per 96 LF per LF per 96 LF per LF $ Thermo $ Marker LF "=1/2 Length to add to remove Cost
$0
Miscellaneous Design Element CostsItem Unit Cost No. $$Sign and Post EA $325 8 $2,600Bike Detection EA $1,000 2 $2,000
$4,600
Pavement Markings CostsCost of Thermo per Sq. Foot $5.00Remove = .5 cost
Sq. Foot Add SF add remove SF removeLegend Thermo No. Quantity no. Quantity Cost
Bike Lane Symbol (MUTCD) 5 8 40 0 0 $200
$200
Summary of CostsStriping Costs $0Legends $200Misc. $4,600Sub Total $4,800
Caltrans Striping
SOFT COSTS FOR ENGINEERING,ADMINISTRATION, SURVEY, ETC.IS APPROX 35% $1,680ADD MOBILIZATION AT 5% $240ADD CONTINGENCY OF 20% $960
$7,680
H-12

2009 Santa Clara Bicycle Plan UpdateCity of Santa Clara
September 14, 2009
Market (Monroe to the Alameda)Striping per Linear Foot CostsMarket, Monroe to the Alameda = 2,450
Input cost per square foot of thermo plastic $5.00Input cost per each marker $5.00
Caltrans Striping SF Thermo SF Thermo No. of Markers No. of Markers $ per Removal Project No. Stripes No. StripesDetail No. per 96 LF per LF per 96 LF per LF $ Thermo $ Marker LF "=1/2 Length to add to remove Cost
$0
Miscellaneous Design Element CostsItem Unit Cost No. $$Sign and Post EA $325 22 $7,150
$7,150
Pavement Markings CostsCost of Thermo per Sq. Foot $5.00Remove = .5 cost
Sq. Foot Add SF add remove SF removeLegend Thermo No. Quantity no. Quantity Cost
$0
Summary of CostsStriping Costs $0Legends $0Misc. $7,150Sub Total $7,150
SOFT COSTS FOR ENGINEERING,ADMINISTRATION, SURVEY, ETC.IS APPROX 35% $2,503ADD MOBILIZATION AT 5% $358ADD CONTINGENCY OF 35% $2,503
$12,513
Optional CostsCost of Thermo per Sq. Foot $5.00Remove = .5 cost
Sq. Foot Add SF add remove SF removeLegend Thermo No. Quantity no. Quantity Cost
Sharrow Symbol 7.5 22 165 0 0 $825
$825
H-13

2009 Santa Clara Bicycle Plan UpdateCity of Santa Clara
September 14, 2009
Monroe (Lawrence to San Tomas Aquino Creek)Striping per Linear Foot CostsMonroe, Lawrence to San Tomas Aquino Creek = 9,500
Input cost per square foot of thermo plastic $5.00Input cost per each marker $5.00
Caltrans Striping SF Thermo SF Thermo No. of Markers No. of Markers $ per Removal Project No. Stripes No. StripesDetail No. per 96 LF per LF per 96 LF per LF $ Thermo $ Marker LF "=1/2 Length to add to remove Cost
9 9.33 0.0972 2 0.0204 $0.49 $0.10 $0.59 $0.29 9500 2 2 $16,762
$16,762
Miscellaneous Design Element CostsItem Unit Cost No. $$Sign and Post EA $325 58 $18,850
$18,850
Pavement Markings CostsCost of Thermo per Sq. Foot $5.00Remove = .5 cost
Sq. Foot Add SF add remove SF removeLegend Thermo No. Quantity no. Quantity Cost
Slow 23 16 368 16 368 $2,760School 35 16 560 16 560 $4,200Xing 21 20 420 20 420 $3,150Ped 18 4 72 4 72 $540
$10,650
Summary of CostsStriping Costs $16,762Legends $10,650Misc. $18,850Sub Total $46,262
SOFT COSTS FOR ENGINEERING,ADMINISTRATION, SURVEY, ETC. ISAPPROX 35% $16,192ADD MOBILIZATION AT 5% $2,313ADD CONTINGENCY OF 20% $9,252
$74,020
Optional CostsCost of Thermo per Sq. Foot $5.00Remove = .5 cost
Sq. Foot Add SF add remove SF removeLegend Thermo No. Quantity no. Quantity Cost
Sharrow Symbol 7.5 58 435 0 0 $2,175
$2,175
H-14

2009 Santa Clara Bicycle Plan UpdateCity of Santa Clara
September 14, 2009
Monroe (San Tomas Aquino Creek to Scott)Striping per Linear Foot CostsMonroe, San Tomas Aquino Creek to Scott = 2100
Input cost per square foot of thermo plastic $5.00Input cost per each marker $5.00
Caltrans Striping SF Thermo SF Thermo No. of Markers No. of Markers $ per Removal Project No. Stripes No. StripesDetail No. per 96 LF per LF per 96 LF per LF $ Thermo $ Marker LF "=1/2 Length to add to remove Cost
9 9.33 0.0972 2 0.0204 $0.49 $0.10 $0.59 $0.29 2100 2 2 $3,70527B 32.00 0.3333 0 0.0000 $1.67 $0.00 $1.67 $0.83 2100 2 0 $7,00039 48.00 0.5000 0 0.0000 $2.50 $0.00 $2.50 $1.25 2100 2 0 $10,500
$21,205
Miscellaneous Design Element CostsItem Unit Cost No. $$Sign and Post EA $325 20 $6,500Bike Detection EA $1,000 5 $5,000
$11,500
Pavement Markings CostsCost of Thermo per Sq. Foot $5.00Remove = .5 cost
Sq. Foot Add SF add remove SF removeLegend Thermo No. Quantity no. Quantity Cost
Bike Lane Symbol (MUTCD) 5 20 100 0 0 $500
$500
Summary of CostsStriping Costs $21,205Legends $500Misc. $11,500Sub Total $33,205
SOFT COSTS FOR ENGINEERING,ADMINISTRATION, SURVEY, ETC.IS APPROX 35% $11,622ADD MOBILIZATION AT 5% $1,660ADD CONTINGENCY OF 20% $6,641
$53,129
H-15

2009 Santa Clara Bicycle Plan UpdateCity of Santa Clara
September 14, 2009
Pruneridge (Pomeroy to San Tomas)Striping per Linear Foot CostsPruneridge, Pomeroy to San Tomas = 6,600 LF
Input cost per square foot of thermo plastic $5.00Input cost per each marker $5.00
Caltrans Striping SF Thermo SF Thermo No. of Markers No. of Markers $ per Removal Project No. Stripes No. StripesDetail No. per 96 LF per LF per 96 LF per LF $ Thermo $ Marker LF "=1/2 Length to add to remove Cost
9 9.33 0.0972 2 0.0204 $0.49 $0.10 $0.59 $0.29 6600 0 2 $3,88222 64.00 0.6667 4 0.0408 $3.33 $0.20 $3.54 $1.77 6600 0 1 $11,673
27B 32.00 0.3333 0 0.0000 $1.67 $0.00 $1.67 $0.83 6600 2 0 $22,00032 80.00 0.8333 10 0.1020 $4.17 $0.51 $4.68 $2.34 6600 1 0 $30,86739 48.00 0.5000 0 0.0000 $2.50 $0.00 $2.50 $1.25 6600 2 0 $33,000
$101,423
Miscellaneous Design Element CostsItem Unit Cost No. $$Sign and Post EA $325 34 $11,050Bike Detection EA $1,000 6 $6,000
$17,050
Pavement Markings CostsCost of Thermo per Sq. Foot $5.00Remove = .5 cost
Sq. Foot Add SF add remove SF removeLegend Thermo No. Quantity no. Quantity Cost
Bike Lane Symbol (MUTCD) 5 34 170 0 0 $850Slow 23 2 46 2 46 $345School 35 2 70 2 70 $525Xing 21 4 84 4 84 $630Ped 18 2 36 2 36 $270
$2,620
Summary of CostsStriping Costs $101,423Legends $2,620Misc. $17,050Sub Total $121,093
SOFT COSTS FOR ENGINEERING,ADMINISTRATION, SURVEY, ETC.IS APPROX 35% $42,382ADD MOBILIZATION AT 5% $6,055ADD CONTINGENCY OF 20% $24,219
$193,748
H-16
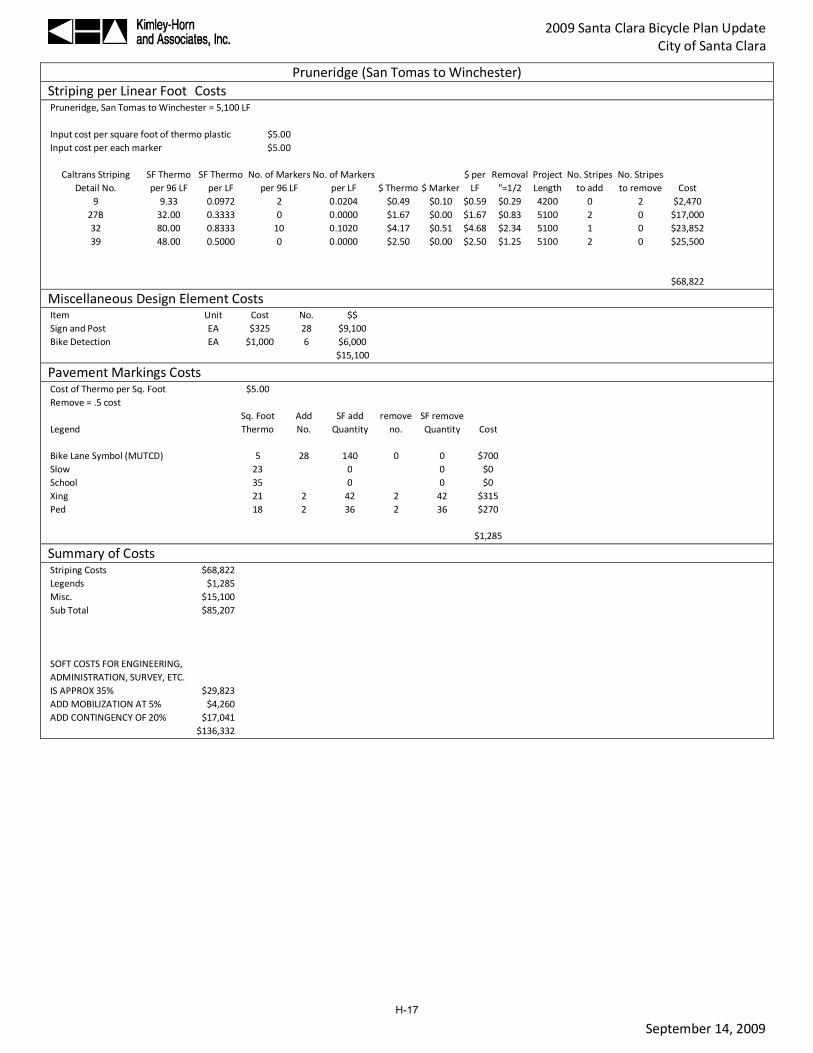
2009 Santa Clara Bicycle Plan UpdateCity of Santa Clara
September 14, 2009
Pruneridge (San Tomas to Winchester)Striping per Linear Foot CostsPruneridge, San Tomas to Winchester = 5,100 LF
Input cost per square foot of thermo plastic $5.00Input cost per each marker $5.00
Caltrans Striping SF Thermo SF Thermo No. of Markers No. of Markers $ per Removal Project No. Stripes No. StripesDetail No. per 96 LF per LF per 96 LF per LF $ Thermo $ Marker LF "=1/2 Length to add to remove Cost
9 9.33 0.0972 2 0.0204 $0.49 $0.10 $0.59 $0.29 4200 0 2 $2,47027B 32.00 0.3333 0 0.0000 $1.67 $0.00 $1.67 $0.83 5100 2 0 $17,00032 80.00 0.8333 10 0.1020 $4.17 $0.51 $4.68 $2.34 5100 1 0 $23,85239 48.00 0.5000 0 0.0000 $2.50 $0.00 $2.50 $1.25 5100 2 0 $25,500
$68,822
Miscellaneous Design Element CostsItem Unit Cost No. $$Sign and Post EA $325 28 $9,100Bike Detection EA $1,000 6 $6,000
$15,100
Pavement Markings CostsCost of Thermo per Sq. Foot $5.00Remove = .5 cost
Sq. Foot Add SF add remove SF removeLegend Thermo No. Quantity no. Quantity Cost
Bike Lane Symbol (MUTCD) 5 28 140 0 0 $700Slow 23 0 0 $0School 35 0 0 $0Xing 21 2 42 2 42 $315Ped 18 2 36 2 36 $270
$1,285
Summary of CostsStriping Costs $68,822Legends $1,285Misc. $15,100Sub Total $85,207
SOFT COSTS FOR ENGINEERING,ADMINISTRATION, SURVEY, ETC.IS APPROX 35% $29,823ADD MOBILIZATION AT 5% $4,260ADD CONTINGENCY OF 20% $17,041
$136,332
H-17
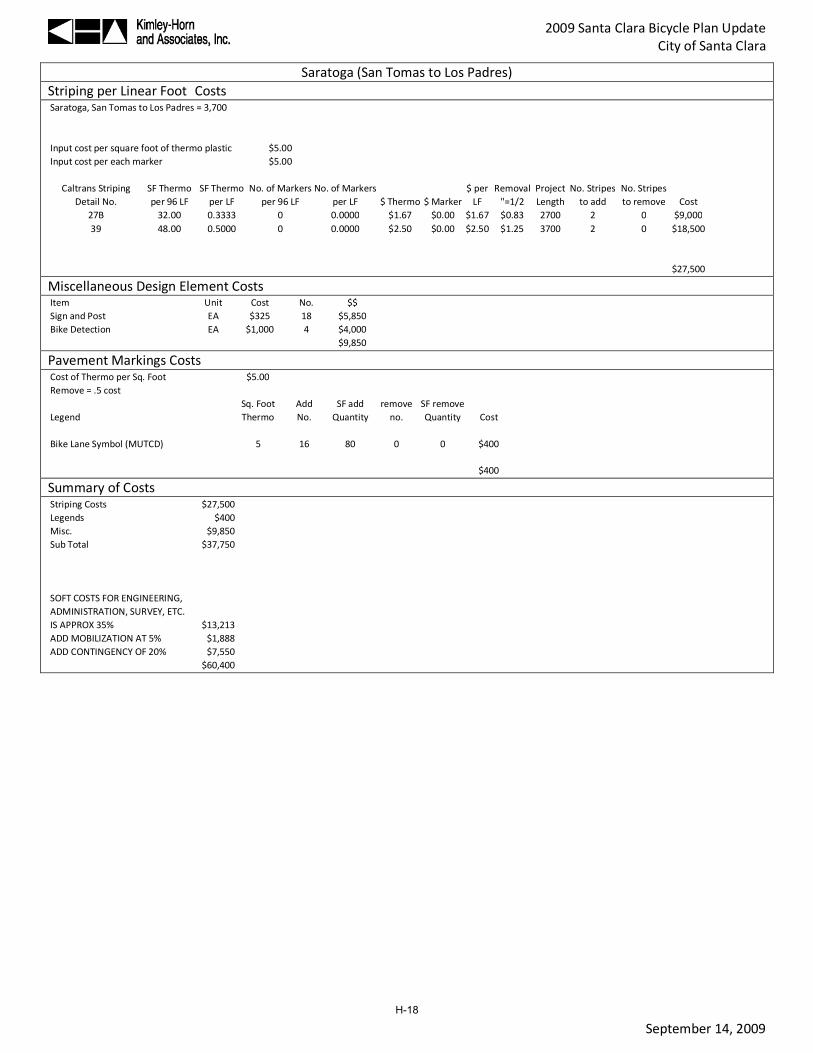
2009 Santa Clara Bicycle Plan UpdateCity of Santa Clara
September 14, 2009
Saratoga (San Tomas to Los Padres)Striping per Linear Foot CostsSaratoga, San Tomas to Los Padres = 3,700
Input cost per square foot of thermo plastic $5.00Input cost per each marker $5.00
Caltrans Striping SF Thermo SF Thermo No. of Markers No. of Markers $ per Removal Project No. Stripes No. StripesDetail No. per 96 LF per LF per 96 LF per LF $ Thermo $ Marker LF "=1/2 Length to add to remove Cost
27B 32.00 0.3333 0 0.0000 $1.67 $0.00 $1.67 $0.83 2700 2 0 $9,00039 48.00 0.5000 0 0.0000 $2.50 $0.00 $2.50 $1.25 3700 2 0 $18,500
$27,500
Miscellaneous Design Element CostsItem Unit Cost No. $$Sign and Post EA $325 18 $5,850Bike Detection EA $1,000 4 $4,000
$9,850
Pavement Markings CostsCost of Thermo per Sq. Foot $5.00Remove = .5 cost
Sq. Foot Add SF add remove SF removeLegend Thermo No. Quantity no. Quantity Cost
Bike Lane Symbol (MUTCD) 5 16 80 0 0 $400
$400
Summary of CostsStriping Costs $27,500Legends $400Misc. $9,850Sub Total $37,750
SOFT COSTS FOR ENGINEERING,ADMINISTRATION, SURVEY, ETC.IS APPROX 35% $13,213ADD MOBILIZATION AT 5% $1,888ADD CONTINGENCY OF 20% $7,550
$60,400
H-18
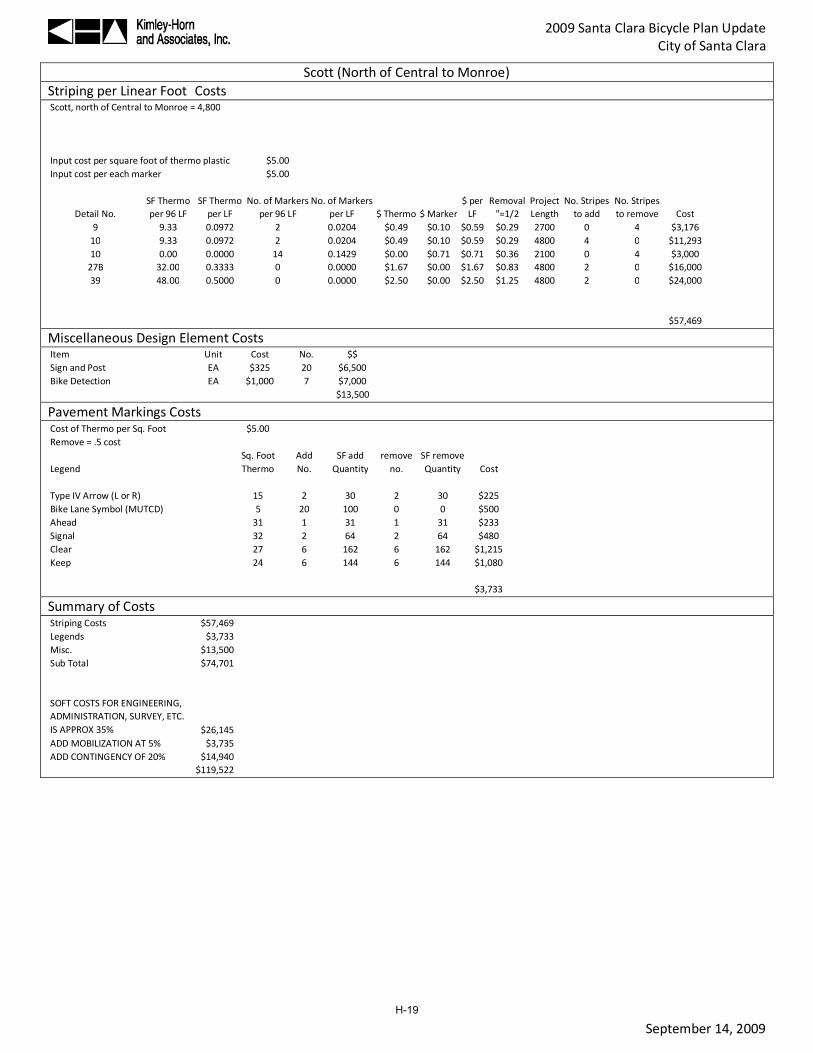
2009 Santa Clara Bicycle Plan UpdateCity of Santa Clara
September 14, 2009
Scott (North of Central to Monroe)Striping per Linear Foot CostsScott, north of Central to Monroe = 4,800
Input cost per square foot of thermo plastic $5.00Input cost per each marker $5.00
SF Thermo SF Thermo No. of Markers No. of Markers $ per Removal Project No. Stripes No. StripesDetail No. per 96 LF per LF per 96 LF per LF $ Thermo $ Marker LF "=1/2 Length to add to remove Cost
9 9.33 0.0972 2 0.0204 $0.49 $0.10 $0.59 $0.29 2700 0 4 $3,17610 9.33 0.0972 2 0.0204 $0.49 $0.10 $0.59 $0.29 4800 4 0 $11,29310 0.00 0.0000 14 0.1429 $0.00 $0.71 $0.71 $0.36 2100 0 4 $3,000
27B 32.00 0.3333 0 0.0000 $1.67 $0.00 $1.67 $0.83 4800 2 0 $16,00039 48.00 0.5000 0 0.0000 $2.50 $0.00 $2.50 $1.25 4800 2 0 $24,000
$57,469
Miscellaneous Design Element CostsItem Unit Cost No. $$Sign and Post EA $325 20 $6,500Bike Detection EA $1,000 7 $7,000
$13,500
Pavement Markings CostsCost of Thermo per Sq. Foot $5.00Remove = .5 cost
Sq. Foot Add SF add remove SF removeLegend Thermo No. Quantity no. Quantity Cost
Type IV Arrow (L or R) 15 2 30 2 30 $225Bike Lane Symbol (MUTCD) 5 20 100 0 0 $500Ahead 31 1 31 1 31 $233Signal 32 2 64 2 64 $480Clear 27 6 162 6 162 $1,215Keep 24 6 144 6 144 $1,080
$3,733
Summary of CostsStriping Costs $57,469Legends $3,733Misc. $13,500Sub Total $74,701
SOFT COSTS FOR ENGINEERING,ADMINISTRATION, SURVEY, ETC.IS APPROX 35% $26,145ADD MOBILIZATION AT 5% $3,735ADD CONTINGENCY OF 20% $14,940
$119,522
H-19

2009 Santa Clara Bicycle Plan UpdateCity of Santa Clara
September 14, 2009
Winchester (Homestead to Bellomy)Striping per Linear Foot CostsWinchester, Homestead to Bellomy = 2100 Currently has an edge stripe. Not included in estimate.
Input cost per square foot of thermo plastic $5.00Input cost per each marker $5.00
Caltrans Striping SF Thermo SF Thermo No. of Markers No. of Markers $ per Removal Project No. Stripes No. StripesDetail No. per 96 LF per LF per 96 LF per LF $ Thermo $ Marker LF "=1/2 Length to add to remove Cost
$0
Miscellaneous Design Element CostsItem Unit Cost No. $$Sign and Post EA $325 10 $3,250
$3,250
Pavement Markings CostsCost of Thermo per Sq. Foot $5.00Remove = .5 cost
Sq. Foot Add SF add remove SF removeLegend Thermo No. Quantity no. Quantity Cost
25 17.5 0 0 0 0 $0Xing 21 0 0 0 0 $0Ped 18 0 0 0 0 $0
$0
Summary of CostsStriping Costs $0Legends $0Misc. $3,250Sub Total $3,250
SOFT COSTS FOR ENGINEERING,ADMINISTRATION, SURVEY, ETC. ISAPPROX 35% $1,138ADD MOBILIZATION AT 5% $163ADD CONTINGENCY OF 20% $650
$5,200
Optional CostsCost of Thermo per Sq. Foot $5.00Remove = .5 cost
Sq. Foot Add SF add remove SF removeLegend Thermo No. Quantity no. Quantity Cost
Sharrow Symbol 7.5 10 75 0 0 $375
$375
H-20

2009 Santa Clara Bicycle Plan UpdateCity of Santa Clara
September 14, 2009
Woodhams (Homestead to Stevens Creek)Striping per Linear Foot CostsWoodhams, Homestead to Stevens Creek = 5800
Input cost per square foot of thermo plastic $5.00Input cost per each marker $5.00
Caltrans Striping SF Thermo SF Thermo No. of Markers No. of Markers $ per Removal Project No. Stripes No. StripesDetail No. per 96 LF per LF per 96 LF per LF $ Thermo $ Marker LF "=1/2 Length to add to remove Cost
$0
Miscellaneous Design Element CostsItem Unit Cost No. $$Sign and Post EA $325 40 $13,000
$13,000
Pavement Markings CostsCost of Thermo per Sq. Foot $5.00Remove = .5 cost
Sq. Foot Add SF add remove SF removeLegend Thermo No. Quantity no. Quantity Cost
Stop 22 2 44 2 44 $330
$330
Summary of CostsStriping Costs $0Legends $330Misc. $13,000Sub Total $13,330
SOFT COSTS FOR ENGINEERING,ADMINISTRATION, SURVEY, ETC.IS APPROX 35% $4,666ADD MOBILIZATION AT 5% $667ADD CONTINGENCY OF 20% $2,666
$21,328
Optional CostsCost of Thermo per Sq. Foot $5.00Remove = .5 cost
Sq. Foot Add SF add remove SF removeLegend Thermo No. Quantity no. Quantity Cost
Sharrow Symbol 7.5 40 300 0 0 $1,500
$1,500
H-21


