

Seven Year Performance of City of Shoreview's Pervious Concrete Project
Bernard Igbafen Izevbekhai, Principal InvestigatorOffice of Materials and Road ResearchMinnesota Department of Transportation
December 2017
Research ProjectFinal Report 2017-47
• mndot.gov/research

To request this document in an alternative format, such as braille or large print, call 651-366-4718 or 1-800-657-3774 (Greater Minnesota) or email your request to [email protected]. Please request at least one week in advance.

Technical Report Documentation Page 1. Report No. 2. 3. Recipients Accession No. MN/RC 2017-47 4. Title and Subtitle 5. Report Date Seven Year Performance of City of Shoreview’s Pervious Concrete Project
December 2017 6.
7. Author(s) 8. Performing Organization Report No. Bernard Igbafen Izevbekhai P.E. (MN) PhD. Collin Schroeder E.I.T.
9. Performing Organization Name and Address 10. Project/Task/Work Unit No.
Minnesota Department of Transportation Office of Materials and Roads Research 1400 Gervais Avenue Maplewood, MN 55109
11. Contract (C) or Grant (G) No.
12. Sponsoring Organization Name and Address 13. Type of Report and Period Covered Minnesota Department of Transportation Research Services & Library 395 John Ireland Boulevard, MS 330 St. Paul, Minnesota 55155-1899
Final Report 14. Sponsoring Agency Code
15. Supplementary Notes http:// mndot.gov/research/reports/2017/201747.pdf 16. Abstract (Limit: 250 words)
Stormwater runoff from the Woodbridge neighborhood of Shoreview had previously been drained to Lake Owasso. City of Shoreview built the Woodbridge neighborhood’s local roads using pervious concrete pavements in 2009. Pervious concrete pavements exhibit high hydraulic conductivity and sound absorption ability. To evaluate the functional performance of the City of Shoreview’s pervious concrete pavements researchers from Minnesota Department of Transportation (MnDOT) measured sound absorption, hydraulic conductivity, and ride quality periodically. This report assesses the seven year performance of Shoreview’s pervious concrete pavements using the above pavement performance metrics from data twice a year on average between 2009 and 2012. Sound absorption coefficient was found to be decreasing over time mainly due to clogging and traffic load impact. Ride quality was also observed to decrease through time as pavements clogging became increasingly observable over time. Clogging enhances freeze-thaw susceptibility that leads to various distresses. Traffic load impact also seemed to reduce the sound absorption and hydraulic conductivity of the pervious pavements. To improve the hydraulic conductivity of the pervious concrete pavements, frequent vacuuming with appropriate equipment method is recommended. This research calculated the stormwater infiltration benefits and compared life cycle cost of pervious and non-pervious alternative, concluding that pervious concrete may still be a better alternative than storm water structures in that location.
17. Document Analysis/Descriptors 18. Availability Statement Concrete pavements, Porous pavements, Diamond grinding, Rolling resistance, Tire/pavement noise, Texture, Friction, Ride quality
No restrictions. Document available from: National Technical Information Services, Alexandria, Virginia 22312
19. Security Class (this report) 20. Security Class (this page) 21. No. of Pages 22. Price Unclassified Unclassified 62

SEVEN YEAR PERFORMANCE OF CITY OF SHOREVIEW’S PERVIOUS
CONCRETE PROJECT
FINAL REPORT
Prepared by:
Bernard Igbafen Izevbekhai, P.E., PhD
Collin Schroeder, B.C.E., E.I.T.
Minnesota Department of Transportation
Office of Materials and Road Research
December 2017
Published by:
Minnesota Department of Transportation
Research Services & Library
395 John Ireland Boulevard, MS 330
St. Paul, Minnesota 55155-1899
This report represents the results of research conducted by the authors and does not necessarily represent the views or policies
of the Minnesota Department of Transportation. This report does not contain a standard or specified technique.
The authors and the Minnesota Department of Transportation do not endorse products or manufacturers. Trade or
manufacturers’ names appear herein solely because they are considered essential to this report.

ACKNOWLEDGEMENTS
Authors acknowledge Minnesota Department of Transportation, Office of Materials and Road Research
for active support of this research project. Appreciations are due to Mark Maloney and Tom
Wesolowski, Public Works Director and City Engineer respectively for the City of Shoreview for their
collaboration. Authors are also indebted to Steve Olson, Eddie Johnson, John Pantelis and Trenton Pray
who assisted with testing. Ataklti Bahta and Benjamin Ubani are acknowledged for helping with initial
data transcription. Appreciations are also due to Glenn Engstrom and Jeffrey Brunner, MnDOT Office of
Materials Director and Research Manager respectively, for their administrative and managerial
leadership.
TABLE OF CONTENTS
CHAPTER 1: INTRODUCTION ...............................................................................................................1
1.1 BACKGROUND INFORMATION ............................................................................................................ 1
1.2 PRELIMINARY PROJECT INFORMATION .............................................................................................. 3
CHAPTER 2: TEST METHODS AND EQUIPMENT USED ...........................................................................5
2.1 SOUND ABSORPTION .......................................................................................................................... 5
2.2 HYDRAULIC CONDUCTIVITY ................................................................................................................ 6
2.3 RIDE QUALITY ...................................................................................................................................... 9
CHAPTER 3: DATA ANALYSIS AND RESULTS ....................................................................................... 11
3.1 SOUND ABSORPTION ........................................................................................................................ 11
3.2 HYDRAULIC CONDUCTIVITY .............................................................................................................. 14
3.3 RIDE QUALITY (IRI) ............................................................................................................................ 17
CHAPTER 4: HYDROLOGIC EVALUATION ............................................................................................ 20
CHAPTER 5: LONG-TERM EVALUATION TESTING................................................................................ 24
5.1 SOUND ABSORPTION ........................................................................................................................ 24
5.2 HYDRAULIC CONDUCTIVITY .............................................................................................................. 27
5.3 RIDE QUALITY (IRI) ............................................................................................................................ 39
CHAPTER 6: COMPARATIVE ANALYSIS THROUGH LIFE-CYCLE COSTING .............................................. 41
CHAPTER 7: CONCLUSION AND RECOMMENDATION ......................................................................... 50
REFERENCES .................................................................................................................................... 51

LIST OF TABLES
Table 1 Dissipated Volumetric Rate (DVR) .................................................................................................. 36
Table 2 Dissipated Volumetric Rate (D.V.R.) and Sound Absorption Coefficient ....................................... 38
Table 3 Initial Cost for Pervious Option (Provided by the City) .................................................................. 41
Table 4 Initial Cost of Non-Pervious Option (Provided by the City) ............................................................ 42
Table 5 Investment Scenario Grinding Case 1: (Grinding after 10th Year) ................................................. 43
Table 6 Comparison through Life Cycle Analysis (Case 2: No Grinding) ..................................................... 46

LIST OF FIGURES
Figure 1 Pervious Concrete Structure ........................................................................................................... 1
Figure 2 Pervious Concrete Pavements in the Woodbridge Neighborhood, Shoreview, MN ...................... 2
Figure 3 Woodbridge Neighborhood ............................................................................................................ 2
Figure 4 Sound Absorption Measurement with Impedance Tube. ............................................................... 5
Figure 5 Original Falling Head Tube. ............................................................................................................. 7
Figure 6 Modified Falling Head Tube with Valve. ......................................................................................... 8
Figure 7 Modified Hydraulic Conductivity Tube Improvised with Gate valve .............................................. 9
Figure 8 Lightweight Inertial Surface Analyzer ........................................................................................... 10
Figure 9 Sound Absorption Data at Various Locations ............................................................................... 12
Figure 10 Sound Absorption by Location .................................................................................................... 13
Figure 11 Average Volumetric Dissipated Rate vs Test Time ...................................................................... 15
Figure 12 Combined Sound absorption and Vol. Dissipation Rate Test Results of 2010 and 2011 ............ 16
Figure 13 Sound Absorption and Volume Dissipation Rate Test Results in 2010 and 2011 ....................... 16
Figure 14 Average IRI TRIODS Value versus Test Time ............................................................................... 18
Figure 15 ROLINE (Line Laser) Average IRI Value versus Test Time ............................................................ 19
Figure 16 Hydrologic Catchment Area (Thick Red Line Boxed Area) .......................................................... 20
Figure 17 Topographic Map of Shoreview Area ......................................................................................... 23
Figure 18 Sound Absorption versus Location ............................................................................................. 24
Figure 19 Sound Absorption versus Location at a Frequency of Roughly 1600 Hz .................................... 25
Figure 20 Sound Absorption versus Location at a Frequency of 1600 Hz .................................................. 26
Figures 21a Dissipated Volumetric Rate vs. Test Time for Wood Locations ............................................... 27
Figure 22 Dissipated Volumetric Rate vs. Test Time for Wood 3 Location ................................................. 28
Figure 23 D.V.R. vs. Test Time for Owasso Locations ................................................................................. 29

Figure 24 Dissipated Volumetric Rate vs. Test Time for Owasso 2 Location .............................................. 29
Figure 25 D.V.R. vs. Time for Edge 1 ........................................................................................................... 30
Figure 26 Dissipated Volumetric Rate vs. Test Time for Edge 2 Location ................................................... 30
Figure 27 Dissipated Volumetric Rate vs. Test Time for Soo 1 Location .................................................... 31
Figures 28a and 28b Dissipated Volumetric Rate vs. Test Time for Soo 2 Location ................................... 31
Figure 29 Dissipated Volumetric Rate vs. Test Time for Jerrold 1 Location ............................................... 32
Figure 30 Volumetric Dissipation Rate Test Results of 2010, 2011, and 2015 for each Location .............. 33
Figure 31 Image of Owasso Lane ................................................................................................................ 34
Figure 32 Close up image of Owasso Lane, showing the Standing Water .................................................. 35
Figure 33 Clogged Pores Overdue for Vacuuming ...................................................................................... 35
Figure 34 Average IRI ROLINE Value versus Test Time ............................................................................... 39
Figure 35 Investment Option with and Without Diamond Grinding for Restoration ................................. 45
Figure 36 Investment Options Pervious Alternatives Vs Non Pervious Alternative ................................... 49

EXCECUTIVE SUMMARY
Stormwater runoff from the Woodbridge neighborhood of the City of Shoreview had previously been
managed through culverts and other hydraulic structures. In adherence to the Clean Water Act, many
watersheds instituted limits to the percentage of storm water that may be allowed into certain lakes
and rivers. To minimize this runoff and the associated impacts in addition to the City’s sustainable design
initiative, the City of Shoreview built the Woodbridge neighborhood local roads using pervious concrete
pavements in 2009. Pervious concrete pavements exhibit high hydraulic conductivity and high sound
absorption coefficient in local or low-volume roads. They also provide cost savings through the
minimization of hydraulic structures. The pervious concrete was designed for an anticipated 23%
porosity and zero-slump. The design included a 7-inch pervious concrete pavement built over 18 inches
of pervious base. In the proximity of Owasso Lake, the subgrade materials are principally granular (very
drainable sands) that allow direct infiltration of runoff.
MnDOT researchers have monitored and evaluated the performance of these pervious concrete
pavements since 2009. Qualitatively, joints and pavement surfaces have been observed for raveling and
spalling, respectively. After 5 years, approximately 20% of the total length of transverse joints was
spalled. Approximately 15% of the surface was visibly raveled. The section where a deicing salt trial had
been performed was the most raveled. Quantitatively, sound absorption, hydraulic conductivity, and
ride quality (IRI) measurements were performed twice a year on average. After analyzing the data
collected, hydraulic conductivity and sound absorption were found to be decreasing over time, mainly
due to clogging and traffic load impact. Ride quality was also observed to decrease (IRI, increased) over
time. MnDOT’s Innovative Gate-Valve “Perveameter” facilitated hydraulic conductivity testing.
Ordinarily, ride quality measurements are not generally required for acceptance of city streets with
speeds less than 45 miles per hour. However for research purposes, IRI is an indicator of pavement
condition, especially when monitored over time. Ride measurements were frequently conducted to
detect changes in pavement condition using the research level light weight profiler. The results indicated
initially high IRI due to roller screed paving. However, there was noticeable increase in IRI in subsequent
years, but at 30 miles per hour, the changes may not be noticeable to the rider. One of the most
informative performance indices of pervious concrete is sound absorption coefficient. This value
indicates mechanical and gravimetric (including porosity) changes of the pavement. The impedance tube
which is the ASTM E-1050 modified for on-site testing was used to measure sound absorption over time.
The results showed some decrease in the coefficient with time. This is traceable to the possibility that
the pavements were not vacuumed frequently.
After finding the actual/average monthly total precipitation records for the City of Shoreview from the
proximate weather stations, the catchment area of the pervious concrete streets was defined. As part of
the monitoring and evaluation process, researchers analyzed the storm water benefits arising from the
use of pervious concrete. The yearly total volume of precipitation in the catchment area of the pervious
pavements was calculated. Based on annual rainfall, the topography and implied catchment area this

study estimated that 2-acre-feet of water might have infiltrated the pervious pavements within the 7-
year period. Though the cost of alternative hydraulic structures accentuate the advantages of a pervious
pavement where direct infiltration is possible, a long-term (10-year or more) performance curve will be
required to furnish a more tenable or comparative benefit cost analysis. However based on the seven
year performance history and a standard rate of maintenance as well as a projected grinding in the 10th
to 12th year performance, a life cycle cost analysis showed the pervious concrete alternative to be more
cost beneficial than the non-pervious alternative, although cost-effectiveness may not be evident from
initial cost consideration. This is predicated on the premise that by frequent vacuuming, the pavements
are prevented from going into a state of irreversible clogging that can potentially accelerate freeze-
thaw damage.
Results of tests performed in 2015 were different from preceding tests because they were not
conducted within a day of vacuuming. They did show evidence of loss of acoustic performance in some
spots where performance was validated by reduction in hydraulic conductivity. A power spectrum
density analysis of the ride measurement showed no evidence of detached or rocking panels. Proximity
of line and triple point laser accelerometer data ruled out anomalous texture effect on IRI. The pervious
concrete test cells still exhibit structural conditions indicative of many more years of performance. More
elaborate studies on clogging of pervious concretes in MnROAD test cells indicate the susceptibility of
clogged pervious pavements to freeze-thaw damage and raveling. Frequent vacuuming removes
clogging agents and minimizes the likelihood of irreversible clogging that could occur when layers of silt
and clay clog the cavities. Generally the pavements show potential to provide service for another 7
years if a maintenance strategy is intensified. A better prediction will be facilitated by a 10-year
evaluation, which is recommended. That evaluation should include a structural condition evaluation,
using a falling weight deflectometer.
1
CHAPTER 1: INTRODUCTION
1.1 BACKGROUND INFORMATION
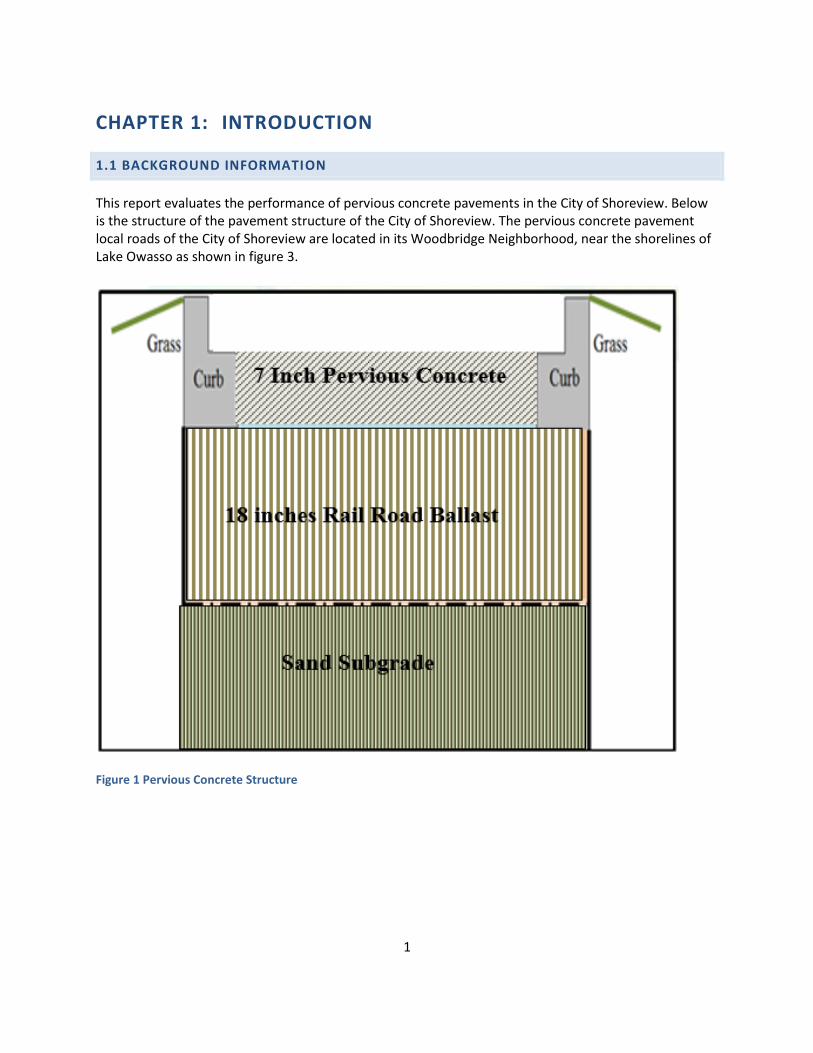
This report evaluates the performance of pervious concrete pavements in the City of Shoreview. Below is the structure of the pavement structure of the City of Shoreview. The pervious concrete pavement local roads of the City of Shoreview are located in its Woodbridge Neighborhood, near the shorelines of Lake Owasso as shown in figure 3.
Figure 1 Pervious Concrete Structure

2
Figure 2 Pervious Concrete Pavements in the Woodbridge Neighborhood, Shoreview, MN
Figure 3 Woodbridge Neighborhood
WOODBRIDGE STREET
3
Lake Owasso is one of the major water bodies in Shoreview. The City of Shoreview embarked on an
initiative to reduce run-off flowing to the lake. The City of Shoreview then decided to build its local roads
using a pervious concrete pavement as this pavement type has the ability to infiltrate a significant
amount of water to the ground through its pervious structure. The local pervious concrete pavement
roads shown in figures 2 and 3 were built in 2009. The primary objective of the project was the
reduction of the storm runoff water that has been flowing to Lake Owasso. Researchers used functional
performance monitoring devices to evaluate drainability, acoustic impedance and ride quality.
The Woodbridge Neighborhood’s pervious concrete system consists of a 7-inch concrete pavement and 18 to 24 inches of railroad ballast as base-course as shown in schematic figure 1. Cemstone Products Company designed and supplied the ready mix concrete for the pavements. The City used fixed form method of construction and established joints by sawing in spite of the fear that the slurry released during sawing could autogenously re-heal and clog the pervious cavities, decreasing hydraulic conductivity of the pavement and compromising its communicating void. After construction MnDOT provided research monitoring.
Run-off water from rainfall and snowmelt were regarded as the main sources of water that would infiltrate the pavements in a 100-year flood. Analysis performed in the similar structure on MnROAD cell 85 revealed that it would take 2 days of continuous rain, falling at 1 inch per hour to flood the pavements primarily because of the difference in the porosity of the pavement and base from that of the subgrade. The resulting detention would be occasioned by the difference between the rate of infiltration at the base into subgrade and the rate of infiltration from the surface into the pervious concrete and ballast base [2]. Consequently unless the void structure is compromised by poor construction or poor maintenance, only an excessive flood could overwhelm this design. Such a flood would more likely overwhelm an alternative design of pervious pavements and hydraulic structures to a larger degree.
1.2 PRELIMINARY PROJECT INFORMATION
The project replaced about 40 acres of development that had a preexisting 9000 square yards of existing asphalt road network. According to the City, storm drainage was a major concern and they needed to remove or replace the existing roadway, upgrade the municipal utilities and improve storm water management. The total estimated cost of this venture was $1.5 million. The pervious concrete option was considered based on the advantages of free-draining granular soils in the vicinity of Owasso Lake. Aggregate Ready Mix Association had collaborated with Minnesota Department of Transportation in 2006 to build a driveway [1] & [2]. In a very elaborate study of performance of pervious full-depth and pervious overlay, MnROAD cells 39, 85 and 89 were built in 2008 [2]. Izevbekhai & Akkari [2] had evaluated certain performance characteristics of pervious concrete that created a positive environment for implementation. Advancements in mix designs and placements techniques as well as a culture of maintenance were learned from the pervious full-depth the pervious overlay cells at MnROAD. The design consisted of 18” of crushed rock made up of a gradation meeting the requirements of railroad ballast. This was overlaid with 7 inches of pervious concrete placed and finished with a roller screed device. Curing was performed with fabric in lieu of the conventional 2 layers of polyethylene. Transverse joints were saw-cut within at 15-ft intervals and a longitudinal joint was sawcut at the

4
center-line. The City outlined a plan for vacuuming with a regenerative vacuum. Maintenance strategy included plowing and zero salting during the winter snow events. The next chapter discusses the tools employed in the functional valuation of the pervious concrete pavements.

5
CHAPTER 2: TEST METHODS AND EQUIPMENT USED
The previous section introduced the pervious concrete pavements and discussed the rational for their design. This section describes the data collection strategy and equipment used for functional evaluation of the pavements. The tests included sound absorption, hydraulic conductivity, and ride quality. The test cells (street names) of Shoreview’s pervious pavements from which data was collected are shown in Figure 2.
2.1 SOUND ABSORPTION
MnDOT did an annual routine measurement of sound absorption on the Shoreview pervious concrete pavements. Data was collected on September 2009, September 2010, May 2011 and August 2015. Generally pervious concrete pavements have better sound absorption capability than ordinary pavements due to the presence of interconnected voids within them. This is a by-product of the pervious void system. Sound absorption capacity of a pavement is described as sound absorption coefficient (∝) which is the ratio of the absorbed sound energy to the transmitted sound energy when a white noise (315Hz to 1800Hz) is generated and sent into the pavement within an impedance tube placed on the surface of the pavement. Figure 4 shows the in-situ sound absorption measurement system. The test procedure followed a modified version of ASTM E-1050 method which is called standard test method for impedance and absorption of acoustical materials using a tube, two microphones and a digital frequency analysis system. ([2] [3]
Figure 4 Sound Absorption Measurement with Impedance Tube.

6
During the sound absorption, test, the sound analyzed is not generated by the interaction of the rolling tire with pavement surface but by noise source above the impedance tube. On the BSWA 425 device, a white noise source is used. White noise is a random audio signal with a flat power spectral density that contains noise at the same power at all frequencies. During the test, the impedance tube is placed on the pavement surface and a set of sensitive microphones are attached to the pre-installed housing at the lower end of the tube. These microphones are also connected to an analyzer. The noise source sends the incident sound energy (white noise) to the surface and the incident and reflected waves are captured by the two microphones. Software windows the reflected waves and converts the data to the 3rd octave sound absorption coefficient at 315, 400, 500, 750, 1000, 1250 and 1650 Hertz. Thus, the coefficients need to between one and zero where a value of one would mean that all of the sound is being absorbed.
Sound absorption output is generated as a function of frequency as shown in equation 1 (below). Ordinarily, the result is generated in a narrow band but 3rd octave band results are reported. Berengier et al [4] discussed that the sound absorption coefficient (Rp) is expressed as a function of frequency:
|𝑅𝑃(𝑓)|2 = 1 −1
𝐾𝑟2
|𝑃𝑟(𝑓)
𝑃𝑑(𝑓)|
2
Where;
Kr = spreading factor
Pr = reflected sound energy
Pd = incident sound energy (3).
The output of a sound absorption factor is typically in the form of the sound absorption at the seven frequencies defined earlier. Hence, factor is therefore expressed as a function of frequency. With this information, the pervious surfaces can be analyzed to evaluate acoustical properties.
2.2 HYDRAULIC CONDUCTIVITY
The data collection frequency for this test was the same (three times per year) as the sound absorption test data collection period. The ability of pervious concrete pavements to infiltrate runoff water from rain and snow melt is measured by a hydraulic conductivity. Hydraulic conductivity results could trigger maintenance activities beyond the scheduled rate. It is obvious that the hydraulic conductivity of pervious pavements decrease through time due to clogging of the pores of the pavements. Sediments, falling leaves, and small plastics transported in the draining water tend to clog the voids of the pavements and hence decrease the volumetric dissipation rate of the pervious pavement. The falling head hydraulic conductivity test tube was utilized in two different ways. The original equipment consists of an approximately 70 centimeter long, 6 inch diameter clear tube contented to a water source tank with a hose (Figure 5).

7
Figure 5 Original Falling Head Tube.
The tube is placed vertically on the pavement surface and sealed using a duct seal compound. The tube is completely filled with the connected hose from the water tank. Before testing begins, the water is allowed to drain into the pavement until a smooth, steady flow is developed. Once it reaches a constant flow, the time it takes for the water to drain from the stabilized upper mark to the 10 cm mark is recorded. This recording was then used in the following equation to calculate the dissipated volumetric rate.
𝑑𝑖𝑠𝑠𝑖𝑝𝑎𝑡𝑒𝑑 𝑣𝑜𝑙𝑢𝑚𝑒𝑡𝑟𝑖𝑐 𝑟𝑎𝑡𝑒 =(𝑖𝑛𝑖𝑡𝑖𝑎𝑙 h𝑒𝑎𝑑 − 𝑓𝑖𝑛𝑎𝑙 h𝑒𝑎𝑑) × 𝑐𝑟𝑜𝑠𝑠 𝑠𝑒𝑐𝑡𝑖𝑜𝑛𝑎𝑙 𝑎𝑟𝑒𝑎
𝑚𝑒𝑎𝑠𝑢𝑟𝑒𝑑 𝑓𝑙𝑜𝑤 𝑡𝑖𝑚𝑒
The dissipated volumetric rate is not a direct measurement of the hydraulic conductivity of the pavement, but is a good indicator that provides qualitative data. Measurements taken using this device were primarily used for comparative purposes to investigate how the hydraulic conductivity of the pavements varies across the test cells as well as changes over time due to clogging and degradation of the pavements. Sustaining the original water level in the falling head tube proved to be a challenge due to the rapid flow of water via the open bottom of the tube into the pavement. The original falling head tube was modified to the mid-level of the tube, now with a release valve introduced to stop the flow of water before actual testing was started. The addition of the valve at the base of the testing tube increased the accuracy of the hydraulic test due to the absence of saturation of the pavement’s materials before hydraulic conductivity test begins. The introduction of the release valve, which is locked when water is being poured to the desired level of the test tube also simplifies the testing procedure. During the original falling head test it was difficult to record exact field measurements (for instance it took time for water to drop from upper head to lower head) due to the higher dissipation rate of the pervious pavements. The modified falling head test tube is shown in figure 6 below.

8
Figure 6 Modified Falling Head Tube with Valve.
Close/Release Valve
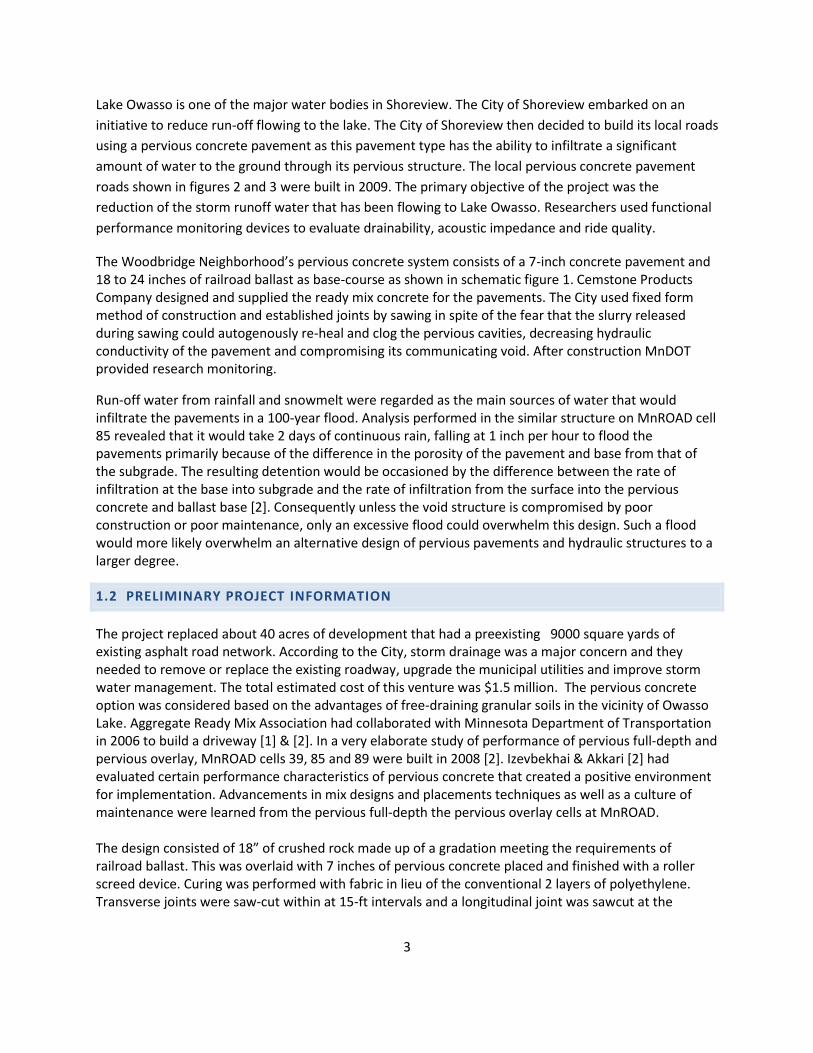
With the new modification to the device, a duct seal is used to seal the tube to the pavement and the gate valve is placed in the closed position. The tube is then fully filled with water. The actual starting test height is then calculated by sealing the tube to a non-porous surface, filling it to the top with the valve closed, and then releasing the valve to see where it drops to. After the tube has been filled when testing over pavement, the gate valve is released, allowing the water to drain into the pavement. The time it takes for the water to reach the zero centimeter mark for each test is then recorded (5). The detail of the modified testing tube is shown in Figure 7 below.
9
Figure 7 Modified Hydraulic Conductivity Tube Improvised with Gate valve
2.3 RIDE QUALITY
The international roughness index (IRI) ASTM E-950 is the universally accepted standard measure of ride quality and pavement smoothness. IRI is a mathematical property of a two-dimensional road profile, or elevation as it varies with longitudinal distance along a travelled path. The international roughness index is based on the vertical acceleration of a quarter car’s suspension in response to a pavement surface while riding at a speed of 50 miles per hour. More specifically, IRI is the sum of the quarter car’s vertical acceleration induced displacement from an assumed neutral plane surface per unit horizontal distance traveled. A consequence of this scenario is the frequency related response of the quarter car to emulate the human resonant frequencies in terms of ride comfort during ride measurements. Because the rider tends to be more sensitive to certain frequencies than others, the response multiplier algorithm is applied when calculating IRI to more accurately mimic the human response. The IRI multiplier algorithm is not uniform in all wavelengths. The gain algorithm peaks at the quarter car resonant frequencies as well as what are assumed to be the body excitation frequencies. Wavelengths that are considered to significantly reduce rider comfort receive higher gain in the IRI algorithm. The gain algorithm of the quarter car model thus provides for peak gains in axle hop and body bounce wavelengths of 32 ft and
10
68-ft respectively. A relatively smooth pavement with wavelength features close to these 2 peaks will, will ride rough according to the IRI algorithm.
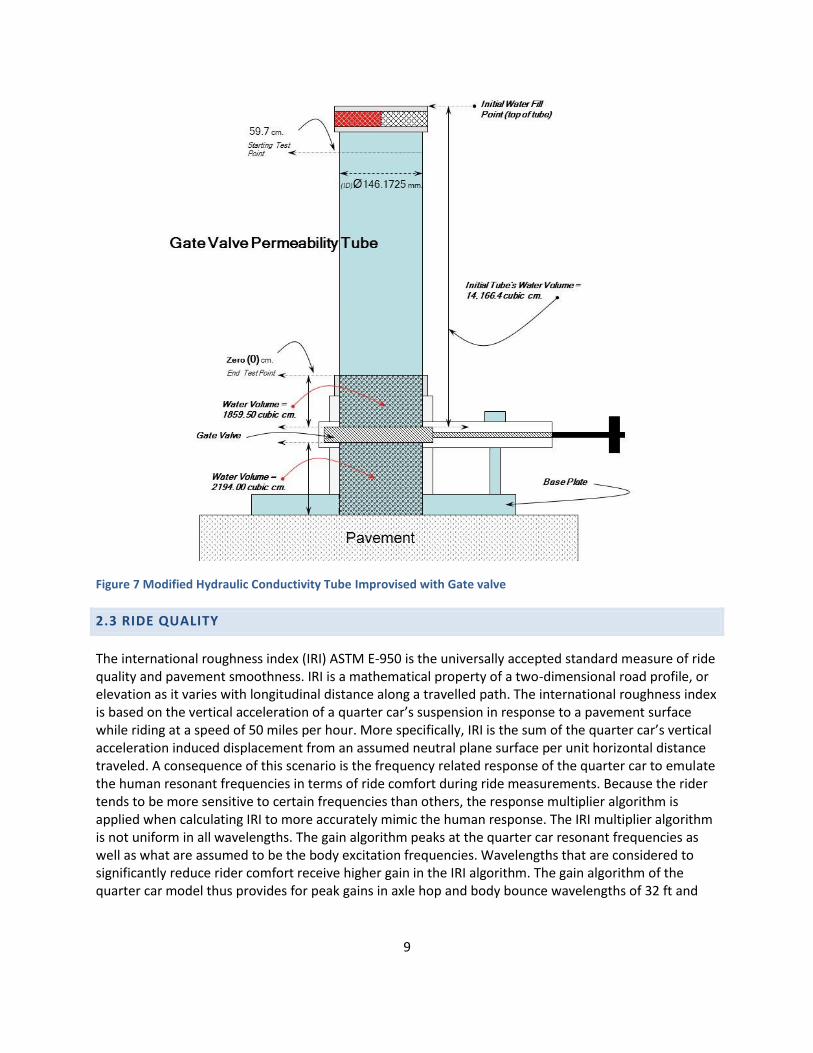
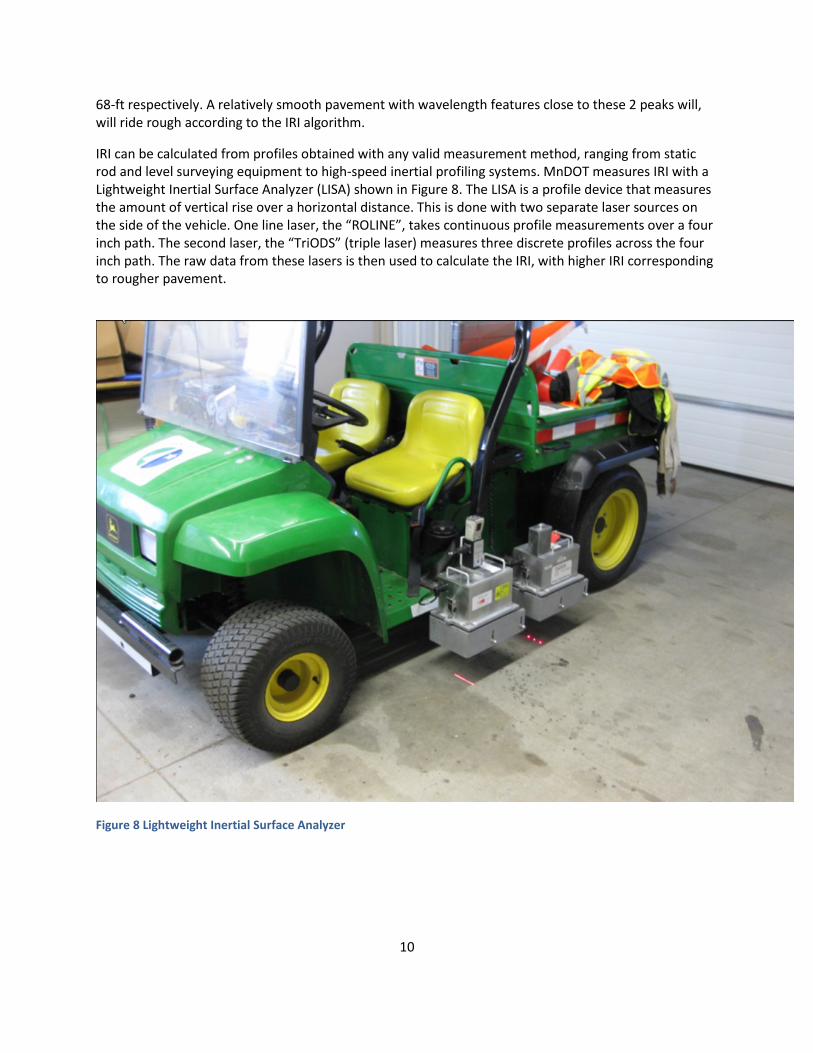
IRI can be calculated from profiles obtained with any valid measurement method, ranging from static rod and level surveying equipment to high-speed inertial profiling systems. MnDOT measures IRI with a Lightweight Inertial Surface Analyzer (LISA) shown in Figure 8. The LISA is a profile device that measures the amount of vertical rise over a horizontal distance. This is done with two separate laser sources on the side of the vehicle. One line laser, the “ROLINE”, takes continuous profile measurements over a four inch path. The second laser, the “TriODS” (triple laser) measures three discrete profiles across the four inch path. The raw data from these lasers is then used to calculate the IRI, with higher IRI corresponding to rougher pavement.
Figure 8 Lightweight Inertial Surface Analyzer

11
CHAPTER 3: DATA ANALYSIS AND RESULTS
The sound absorption, ride quality, and hydraulic conductivity for the Shoreview pervious concrete were examined and the results are presented and discussed below.
3.1 SOUND ABSORPTION
The typical sound absorption coefficient range for non-pervious concrete pavements is 0.03 to 0.05 [2]. Test results were compared to this range in evaluating the relative sound absorption coefficients of pervious concrete with reference to impervious concrete, hence they are the best choice to implement in low volume roads (LVR) to reduce noise pollution. Figure 7 below illustrates the average coefficients of sound absorption test results at a frequency of 1000 HZ of the road sections where data was collected for the years 2009, 2010, and 2011. It is important to note that all tests were conducted on the right lane of the right wheel path of roadway except for Jerold Street (denoted as Jerold 1) in (Figure 9). Sound absorption coefficient decreased for most of the road sections through time on Shoreview pervious concrete pavements. The decrease in sound absorption is attributed in part to clogging of the pervious voids of the pavement materials. The clogging particles were found to be debris from the pavement itself or carried by tires of moving vehicles, fallen leaves, or similar materials. However, the coefficient of sound absorption was increased for Jerold 1 and Edge 2 from 2010 to 2011. The increase was likely due to effective cleaning and vacuuming effect. Regular maintenance (cleaning and vacuuming) is important in pervious concrete pavements to maintain communicating void structure. The test results for Jerold 1 in 2010 is from data collected on its right lane of right wheel path whereas the test results for 2011 is from data collected at the center lane. The average coefficients of sound absorption were found to be 0.08 and 0.12, respectively for the years 2010 and 2011.

12
Figure 9 Sound Absorption Data at Various Locations
0
0.1
0.2
0.3
0.4
0.5
0.6
0.7
0.8
9/10/2009 8/18/2010 9/3/2010 5/17/2011
Co
eff
icie
nt
of
Sou
nd
Ab
sorp
tio
n[]
Sound Absorption Test Time[Year]
Edge 1
Edge 2
Jerrold 1
Mailbox 1
Owasso 1
Owasso 2
Soo 1
Soo 2
Wood 1
Wood 2
Wood 3

13
Figure 10 Sound Absorption by Location
0
0.1
0.2
0.3
0.4
0.5
0.6
0.7
0.8
9/10/2009 8/18/2010 9/3/2010 5/17/2011
Co
eff
icie
nt
of
Sou
nd
Ab
sorp
tio
n[]
Sound Absorption Test Time[Year]
Edge 1
Edge 2
Jerrold 1
Mailbox 1
Owasso 1
Owasso 2
Soo 1
Soo 2
Wood 1
Wood 2
Wood 3
From these results, (see figure 9 and 10) it can be concluded that the impact of traffic on the outer lane right wheel path was the reason why the sound absorption value (0.08) in 2010 was still smaller than the sound absorption value (0.12) in 2011. The center lane line of Jerold Street does not encounter much traffic, therefore it absorbs the least amount of sound. This accentuates the effect of porosity on the sound absorption material. As clogging progresses, the degree of irreversible clogging increases as well and sound absorption coefficient decreases. Izevbekhai [2] showed that the ultimate porosity of a clogging agent on a pervious concrete can be predicted from the initial unclogged porosity of the concrete and the natural (impacted) porosity of the agent.
Effective Porosity: When clogging occurs there is a loss of volume of cavities. This volume is occupied by the clogging agent that theoretically introduces its void content. Consider a fully clogged matrix of total volume (V) and pore / cavity system (Vp) The clogging agent introduces a void system (Va) into the cavities
𝑇ℎ𝑒 𝑛𝑎𝑡𝑢𝑟𝑎𝑙 𝑝𝑜𝑟𝑜𝑠𝑖𝑡𝑦 𝑜𝑓 𝑡ℎ𝑒 𝑎𝑔𝑒𝑛𝑡 = 𝑽𝒂
𝑽𝒑

14
𝑃𝑜𝑟𝑜𝑠𝑖𝑡𝑦 𝑏𝑒𝑓𝑜𝑟𝑒 𝑐𝑙𝑜𝑔𝑔𝑖𝑛𝑔 = 𝑽𝒑
𝑽
𝑃𝑜𝑟𝑜𝑠𝑖𝑡𝑦 𝑎𝑓𝑡𝑒𝑟 𝑐𝑙𝑜𝑔𝑔𝑖𝑛𝑔 = 𝑽𝒂
𝑽= (
𝑽𝒂
𝑽𝒑 ) (
𝑽𝒑
𝑽)
Porosity after Clogging = Natural Porosity of Clogging Agent X Porosity before Clogging.
In order for the assumptions above to be valid the pervious cavities are completely clogged and neither the clogging agent nor the pervious media is segregated. Izevbekhai [3] also showed that the water path through a clogged media is more tortuous than that of the media of an unclogged matrix. Decrease in the amount of voids may also be attributed to shoving and raveling of the surface aggregates by tire pavement interaction. Since porosity is the ratio of volume of voids to the total volume of a pervious concrete sample, porosity of the pervious pavement decreases due to traffic impact. It follows that both sound absorption and hydraulic conductivity decrease as the volume of traffic increases. Although density measurements were not conducted in this evaluation, results from MnROAD test cells indicate a negative correlation between density and sound absorption of pervious concrete. Even though that is not the goal for this report, it is very important to recognize that it can be used to measure the amount of voids present in a pervious concrete pavement which is also used to measure the performance of pervious pavement’s sound absorption and hydraulic conductivity.
3.2 HYDRAULIC CONDUCTIVITY
Figure 11 below illustrates the volumetric dissipation rates of the rainwater test results for the data collected in September 3, 2010 and May 2, 2011.

15
Figure 11 Average Volumetric Dissipated Rate vs Test Time
050
100150200250300350400450500550600
9/3/2010 5/2/2011
Dis
sip
ate
d V
olu
me
Rat
e[c
m3
/s]
Day
Average Dissipated Volume Rates
Edge 1
Edge 2
Jerrold 1
Owasso 1
Owasso 2
Soo 1
Soo 2
Wood 1
Wood 2
Wood 3
From Figure 11 the general time trend from 2010 to 2011 shows a decrease in dissipated volumetric rate for most of the road sections. Conversely the rates for Edge 1, Jerold 1, and Owasso 2 had increased on May 5, 2011. As discussed in the sound absorption section, the decrease in volumetric dissipation rate is due to clogging and in some instances due to the impact of traffic. There is an abrupt dissipation rate decrease in Owasso 1 and an abrupt increase in Jerold 1. The rapid decrease happened in Owasso 1 may not have an immediate explanation but the sudden increase in Jerold Street (Jerold 1) is due to the an actual difference in the spot tested. By observing figures 10, 11 and 12, both the coefficient of sound absorption and volumetric dissipation rate of pervious concrete pavements are found to be decreasing through time mainly due to clogging of the porous media of the pavement structure. Figure 11 and 12 below show the combined data results of coefficients of sound absorption and volumetric dissipation rates for 2010 and 2011.

16
Figure 12 Combined Sound absorption and Vol. Dissipation Rate Test Results of 2010 and 2011
0
0.1
0.2
0.3
0.4
0.5
0.6
0.7A
ver
ag
e D
issi
pa
ted
Vo
lum
etri
c R
ate
[cm
3/s
]
Road Section
2010 SA
2011 SA
Figure 13 Sound Absorption and Volume Dissipation Rate Test Results in 2010 and 2011
0
100
200
300
400
500
600
700
Ave
rage
Dis
sip
ate
d V
olu
me
tric
Rat
e[c
m3
/s]
Road Section
2010 Perm.
2011 Perm.

17
As explained earlier, figure 13b illustrates the decrease of coefficient of sound absorption and hydraulic conductivity rate over time.
Figure 13b SA and HC Correlation
y = 1.2673e9.3695x
R² = 0.9582
0.00
100.00
200.00
300.00
400.00
500.00
600.00
700.00
800.00
900.00
0 0.1 0.2 0.3 0.4 0.5 0.6 0.7 0.8
Dis
ipat
ed V
olu
met
ric
Rat
e (c
m3
/s)
1000HZ Sound Absorption
SA VS DVR
A correlation between HC and SA was established as shown in Figure 13b. The SA values used here were those at 1000 Hz. The relationship is exponential meaning that at high dissipated volume rates, changes in SA are only marginal or infinitesimal.
3.3 RIDE QUALITY (IRI)
Ride quality described through the international roughness index (IRI) method is a measure of the smoothness of a road section (the pervious concrete pavement in our case). It is a measure of the vertical acceleration of a vehicle moving on a roadway and its unit is expressed in in/mi or m/km. It is important that transportation facilities be designed to standard of drivers’ comfort. Research has showed that an IRI value of less than 2.7 m/km is tolerable by drivers but a value above it is an indication of a concrete pavement roadway with poor ride quality. If there is a frequent elevation difference along the longitudinal direction of a roadway, this clearly is evidence of a low comfort pavement section as drivers will experience a lot of ups and downs (hence vertical acceleration) throughout their ride time. Figures 14 and 15 demonstrate the test results of Shoreview’s pervious concrete pavements for years 2009, 2010, and 2012 for the ODS1 (Single laser) and ODS2 (TRIODS / triple laser) respectively.

18
Figure 14 Average IRI TRIODS Value versus Test Time
180
190
200
210
220
230
240
Edgewater-Soo Edgewater-Soo Owasso Woodbridge
Ave
rage
Tri
OD
S IR
I[in
/mi]
Road Section
5/17/2009
5/17/2010
5/18/2012
5/31/2012

19
Figure 15 ROLINE (Line Laser) Average IRI Value versus Test Time
180
190
200
210
220
230
240
Edgewater-Soo Edgewater-Soo Owasso Woodbridge
Av
era
ge
Ro
lin
e IR
I [i
n/m
i]
Road Section
5/17/2009
5/17/2010
5/18/2012
5/31/2012
As Figures 14 and 15 above show, the IRI value increases over time. The increase in IRI, which shows a decrease in ride quality, is expected as the pavement roadway becomes deteriorated through time with a lot of dips and bumps which force the driver’s vehicle to oscillate up and down (accelerate vertically) as it rides over the concrete pavement roadway. The two figures above also illustrate that there is not any substantial difference between the ROLINE and TriODs IRI values of test results. The ROLINE is a line sweeping laser and the TriODS is a Triple Point Laser. The proximity of ROLINE to TRIODS indicates that texture influences on IRI on these surfaces are minimal and inconsequential unlike certain textures that necessitate IRI correction due to texture. It exposes the fact that there is no subtle anisotropy in the pervious surface. Certain textures though isotropic, when analyzed in various orders of wavelength are found in some to be anisotropic. Such hidden features can confound predictions of pavement performance.

20
CHAPTER 4: HYDROLOGIC EVALUATION
After finding the actual/average monthly total precipitation records for the City of Shoreview from the proximate weather stations, the catchment area of the City pervious concrete streets were identified. Note that the area delineated in the inset of figure 16 below is assumed to be the catchment area of Woodbridge Neighborhood and all of the storm water runoff from it is assumed to flow to Lake Owasso. The yearly total volume of runoff from the Woodbridge Neighborhood catchment area to Lake Owasso was calculated.
Figure 16 Hydrologic Catchment Area (Thick Red Line Boxed Area)
In Figure 36, a polygon encircles the catchment area for the pervious pavements. It is assumed for the purpose of computation that every precipitation within the catchment area that does not infiltrate the grassed area gets into the pervious concrete. Calculations are based on the given rainfall, land use type and an assumed time of concentration since the singular rainfall events are not individually analyzed but the annual rainfall is used.

21
Given:
Curve Number (CN) of the land use type of Woodbridge Neighborhood is 30(AMCII) i.e. Meadow land use type.
Then calculating Potential abstraction (S) of the land use as follows
𝑆 =1000
𝐶𝑁− 10 =
1000
30− 10 = 23.33
Then calculate actual/average yearly total runoff volume from 2008 to 2012 as follows.
𝑄 =(𝑃 − 0.2𝑆)2
(𝑃 + 0.8𝑆)
General Equation to Calculate Runoff Volume
Where: P= Rainfall depth in inches and S is as described earlier
Q= Direct runoff in inches
For Year 2008 (Run-off): Actual /Average yearly total precipitation respectively is 6.90 and 16.99 inches respectively.
𝑄𝑎𝑐𝑡𝑢𝑎𝑙 =(6.90 − (0.2 ∗ 23.33))2
(6.90 + (0.8 ∗ 23.33))= 0.195 𝑖𝑛𝑐ℎ𝑒𝑠
The area of the delineated Woodbridge Neighborhood watershed is 1403297.718 square feet (using 𝐺𝑜𝑜𝑔𝑙𝑒 𝑀𝑎𝑝’𝑠 𝐿𝑎𝑏 𝑎𝑝𝑝𝑙𝑖𝑐𝑎𝑡𝑖𝑜𝑛)
= 1,403,297.718𝑓𝑡2 ∗1𝑎𝑐𝑟𝑒
43,560𝑓𝑡2= 32.215 𝑎𝑐𝑟𝑒𝑠
𝑄𝐴𝑐𝑡𝑢𝑎𝑙𝑉𝑜𝑙𝑢𝑚𝑒 = 𝑄𝑎𝑐𝑡𝑢𝑎𝑙 ∗ 𝑊𝑎𝑡𝑒𝑟𝑠ℎ𝑒𝑑 𝑎𝑟𝑒𝑎 = 0.195𝑖𝑛𝑐ℎ𝑒𝑠 ∗ 32.215𝑎𝑐𝑟𝑒𝑠 ∗1𝑓𝑡
12𝑖𝑛𝑐ℎ𝑒𝑠= 0.523 𝑎𝑐𝑟𝑒𝑠 − 𝑓𝑡
Similarly, the total runoff volume of the remaining years can be calculated and is given below.
Year 2009 Infiltration:
𝑄𝐴𝑐𝑡𝑢𝑎𝑙𝑉𝑜𝑙𝑢𝑚𝑒 = 𝑄𝑎𝑐𝑡𝑢𝑎𝑙 ∗ 𝑊𝑎𝑡𝑒𝑟𝑠ℎ𝑒𝑑 𝑎𝑟𝑒𝑎 = 0.062 𝑖𝑛𝑐ℎ𝑒𝑠 ∗ 32.215 𝑎𝑐𝑟𝑒𝑠 ∗ 1𝑓𝑡
12𝑖𝑛𝑐ℎ𝑒𝑠= 0.166 𝑎𝑐𝑟𝑒𝑠 − 𝑓𝑡

22
Year 2010:
𝑄𝐴𝑐𝑡𝑢𝑎𝑙𝑉𝑜𝑙𝑢𝑚𝑒 = 𝑄𝑎𝑐𝑡𝑢𝑎𝑙 ∗ 𝑊𝑎𝑡𝑒𝑟𝑠ℎ𝑒𝑑 𝑎𝑟𝑒𝑎 = .033𝑖𝑛𝑐ℎ𝑒𝑠 ∗ 32.215 𝑎𝑐𝑟𝑒𝑠 ∗ 1𝑓𝑡
12 𝑖𝑛𝑐ℎ𝑒𝑠= 0.109 𝑎𝑐𝑟𝑒𝑠 − 𝑓𝑡
Year 2011 Infiltration.
𝑄𝐴𝑐𝑡𝑢𝑎𝑙𝑉𝑜𝑙𝑢𝑚𝑒 = 𝑄𝑎𝑐𝑡𝑢𝑎𝑙 ∗ 𝑊𝑎𝑡𝑒𝑟𝑠ℎ𝑒𝑑 𝐴𝑟𝑒𝑎 = 0.08344 𝑖𝑛𝑐ℎ𝑒𝑠 ∗ 32.215 𝑎𝑐𝑟𝑒𝑠 ∗ 1𝑓𝑡
12 𝑖𝑛𝑐ℎ𝑒𝑠= .239 𝑎𝑐𝑟𝑒𝑠 − 𝑓𝑡
Year 2012 Infiltration:
𝑄𝐴𝑐𝑡𝑢𝑎𝑙𝑉𝑜𝑙𝑢𝑚𝑒 = 𝑄𝑎𝑐𝑡𝑢𝑎𝑙 ∗ 𝑊𝑎𝑡𝑒𝑟𝑠ℎ𝑒𝑑 𝑎𝑟𝑒𝑎 = 1.003 𝑖𝑛𝑐ℎ𝑒𝑠 ∗ 32.215 𝑎𝑐𝑟𝑒𝑠 ∗ 1𝑓𝑡
12 𝑖𝑛𝑐ℎ𝑒𝑠= 0.269 𝑎𝑐𝑟𝑒𝑠 − 𝑓𝑡
The final actual/average total runoff volume for the five year period is the summation of yearly totals
from 2008 to 2012 and is given as follows:
𝑇𝑜𝑡𝑎𝑙 𝑄𝐴𝑐𝑡𝑢𝑎𝑙𝑉𝑜𝑙𝑢𝑚𝑒 = 0.523 + 0.166 + 0.109 + 0.239 + 0.269 = 34.889 𝑎𝑐𝑟𝑒𝑠 − 𝑓𝑡
Therefore a total actual/average volume storm-water runoff of 1.306 acres-ft may have infiltrated into the ground through the pervious pavements that otherwise would have run into Lake Owasso as a direct runoff into storm sewers if the pervious concrete pavements would not have been implemented by the City of Shoreview. This is a conservative evaluation.

23
Figure 17 Topographic Map of Shoreview Area

24
CHAPTER 5: LONG-TERM EVALUATION TESTING
The following sections within this chapter will discuss the most recent measurements of sound absorption, ride quality, and hydraulic conductivity for the Shoreview pervious concrete road sections near Lake Owasso. There has been a significant amount of time between the test data discussed in the preceding chapter of this report and the following data that will be presented in this chapter, which was collected in 2015. Because of this considerable lapse in time between the data being collected, it can be expected that each pavement attribute analyzed will show a significant decrease in performance due to the clogging in the pervious concrete voids, as well as the traffic load impact the pervious concrete has experienced. The goal in presenting this current testing data is to show how severely the clogging of the pores within the pervious concrete can affect the primary benefits to the utilization of pervious concrete. This will potentially accentuate the benefits of relentless maintenance of the pervious concrete in order to prolong derivable benefits.
5.1 SOUND ABSORPTION
The most recent sound absorption data collected using the Impedance Tube was obtained in November, 2015. Sound absorption values were collected at 9 different locations on these pervious concrete road sections, as opposed to the 11 locations presented in the previous chapter. These sound absorption values were collected using 7 different frequency values that were applied from the white noise source On the Impedance Tube. Similar to the sound absorption data presented in the previous chapter, all tests were conducted on the right wheel path of the each roadway. However, there have been two sound absorption values collected at each location to account for the different directions of traffic. The two following graphs display the sound absorption at each location.
Figure 18 Sound Absorption versus Location
-14.0
-12.0
-10.0
-8.0
-6.0
-4.0
-2.0
0.0
So
und
Ab
sorp
tio
n
Location and Direction
Freq. =…

25
Figure 19 Sound Absorption versus Location at a Frequency of Roughly 1600 Hz
-3.0
-2.5
-2.0
-1.5
-1.0
-0.5
0.0
0.5
So
und
Ab
sorp
tio
n
Location and Direction
Freq. = 398.364 Hz
Freq. = 500.647 Hz
Freq. = 629.846 Hz
Freq. = 802.112 Hz
Freq. = 1001.294 Hz
Freq. = 1248.926 Hz

26
Figure 20 Sound Absorption versus Location at a Frequency of 1600 Hz
-3.0
-2.5
-2.0
-1.5
-1.0
-0.5
0.0
0.5
So
un
d A
bso
rpti
on
Frequency (HZ)
Edge 1 EB
Edge 1 WB
Edge 2 EB
Edge 2 WB
Owasso 1
NBOwasso 1
SBOwasso 2
NBOwasso 2
SBSoo 1 NB
Soo 1 SB
Soo 2 NB
Soo 2 SB
Wood 1 NB
Wood 1 SB
Wood 2 NB
Wood 2 SB
Wood 3 NB
Wood 3 SB
From results shown in Figures 19 and 20 it is evident that these sound absorption values are all negative with the exception of one (Edge 1 EB at a Frequency of roughly 630 Hz). Since the sound absorption is a ratio, all of these negative values can be thought of as sound absorption values that are equal to zero. When comparing the results displayed in Figures 18 and 19 to the results shown in Figure 10 in the previous chapter, it can be concluded that the sound absorption data for all locations has significantly
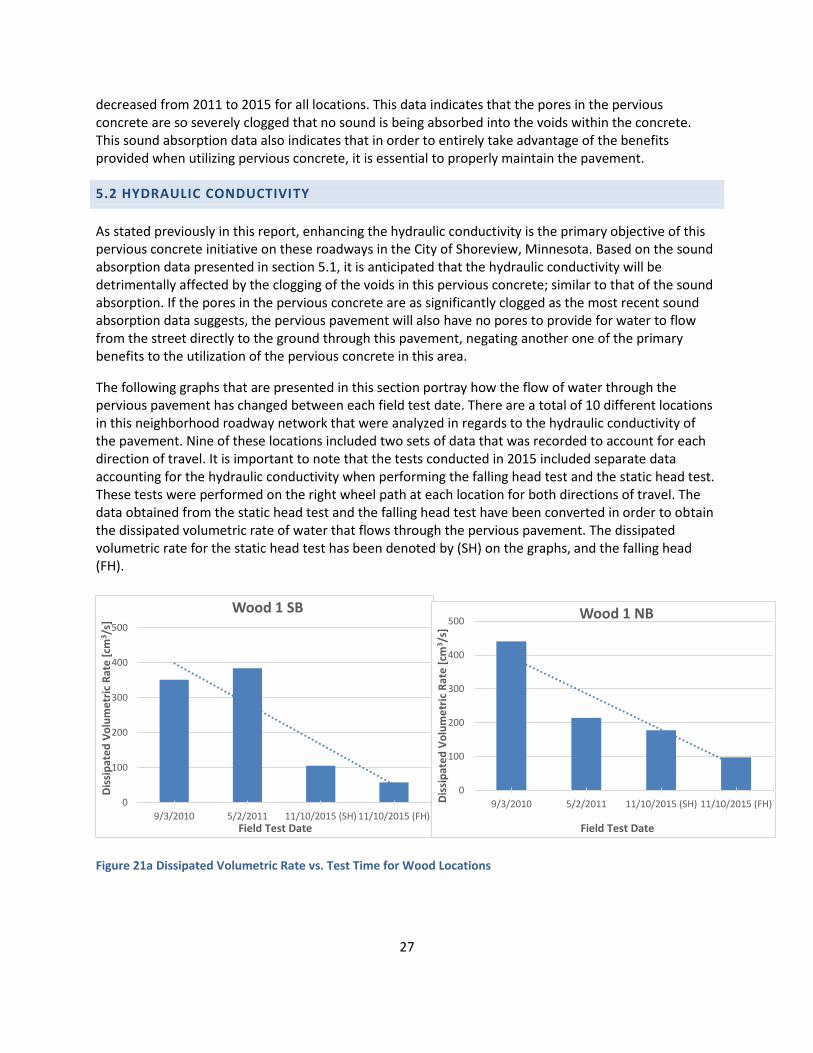
27
decreased from 2011 to 2015 for all locations. This data indicates that the pores in the pervious concrete are so severely clogged that no sound is being absorbed into the voids within the concrete. This sound absorption data also indicates that in order to entirely take advantage of the benefits provided when utilizing pervious concrete, it is essential to properly maintain the pavement.
5.2 HYDRAULIC CONDUCTIVITY
As stated previously in this report, enhancing the hydraulic conductivity is the primary objective of this pervious concrete initiative on these roadways in the City of Shoreview, Minnesota. Based on the sound absorption data presented in section 5.1, it is anticipated that the hydraulic conductivity will be detrimentally affected by the clogging of the voids in this pervious concrete; similar to that of the sound absorption. If the pores in the pervious concrete are as significantly clogged as the most recent sound absorption data suggests, the pervious pavement will also have no pores to provide for water to flow from the street directly to the ground through this pavement, negating another one of the primary benefits to the utilization of the pervious concrete in this area.
The following graphs that are presented in this section portray how the flow of water through the pervious pavement has changed between each field test date. There are a total of 10 different locations in this neighborhood roadway network that were analyzed in regards to the hydraulic conductivity of the pavement. Nine of these locations included two sets of data that was recorded to account for each direction of travel. It is important to note that the tests conducted in 2015 included separate data accounting for the hydraulic conductivity when performing the falling head test and the static head test. These tests were performed on the right wheel path at each location for both directions of travel. The data obtained from the static head test and the falling head test have been converted in order to obtain the dissipated volumetric rate of water that flows through the pervious pavement. The dissipated volumetric rate for the static head test has been denoted by (SH) on the graphs, and the falling head (FH).
Figure 21a Dissipated Volumetric Rate vs. Test Time for Wood Locations
0
100
200
300
400
500
9/3/2010 5/2/2011 11/10/2015 (SH) 11/10/2015 (FH)
Dis
sip
ate
d V
olu
me
tric
Rat
e [
cm3 /
s]
Field Test Date
Wood 1 SB
0
100
200
300
400
500
9/3/2010 5/2/2011 11/10/2015 (SH) 11/10/2015 (FH)Dis
sip
ate
d V
olu
me
tric
Rat
e [
cm3 /
s]
Field Test Date
Wood 1 NB

28
Figure 21b Dissipated Volumetric Rate vs. Test Time for Wood Locations
0
100
200
300
400
500
9/3/2010 5/2/2011 11/10/2015(SH)
11/10/2015(FH)
Dis
sip
ate
d V
olu
me
tric
Rat
e [
cm3 /
s]
Field Test Date
Wood 2 NB
0
100
200
300
400
500
9/3/2010 5/2/2011 11/10/2015(SH)
11/10/2015(FH)
Dis
sip
ate
d V
olu
me
tric
Rat
e [
cm3 /
s]
Field Test Date
Wood 2 SB
Figure 22 Dissipated Volumetric Rate vs. Test Time for Wood 3 Location
0
50
100
150
200
250
9/3/2010 5/2/2011 11/10/2015 (SH) 11/10/2015 (FH)
Dis
sip
ate
d V
olu
me
tric
Rat
e [
cm3 /
s]
Field Test Data
Wood 3 SB
0
50
100
150
200
250
9/3/2010 5/2/2011 11/10/2015 (SH) 11/10/2015 (FH)
Dis
sip
ate
d V
olu
me
tric
Rat
e [
cm3 /
s]
Field Test Date
Wood 3 NB

29
Figure 23 D.V.R. vs. Test Time for Owasso Locations
0
100
200
300
400
500
9/3/2010 5/2/2011 11/10/2015
(SH)
11/10/2015
(FH)
Dis
sip
ated
Vo
lum
etri
c R
ate
[cm
3/s
]
Field Test Date
Owasso 1 SB
0
100
200
300
400
500
600
9/3/2010 5/2/2011 11/10/2015
(SH)
11/10/2015
(FH)
Dis
sip
ated
Vo
lum
etri
c R
ate
[cm
3/s
]
Field Test Date
Owasso 1 NB
Figure 24 Dissipated Volumetric Rate vs. Test Time for Owasso 2 Location
0
5
10
15
20
25
30
35
9/3/2010 5/2/2011 11/10/2015
(SH)
11/10/2015
(FH)
Dis
sip
ated
Vo
lum
etri
c R
ate
[cm
3/s
]
Field Test Date
Owasso 2 SB
0
15
30
45
60
75
9/3/2010 5/2/2011 11/10/2015
(SH)
11/10/2015
(FH)
Dis
sip
ated
Vo
lum
etri
c R
ate
[cm
3/s
]
Field Test Date
Owasso 2 NB

30
Figure 25 D.V.R. vs. Time for Edge 1
0
5
10
15
20
25
30
35
9/3/2010 5/2/2011 11/10/2015 (SH) 11/10/2015 (FH)
Dis
sip
ate
d V
olu
me
tric
Rat
e [
cm3 /
s]
Field Test Date
Edge 1 EB
0
3
6
9
12
15
9/3/2010 5/2/2011 11/10/2015 (SH) 11/10/2015 (FH)
Dis
sip
ate
d V
olu
me
tric
Rat
e [
cm3 /
s]
Field Test Date
Edge 1 WB
Figure 26 Dissipated Volumetric Rate vs. Test Time for Edge 2 Location
0
3
6
9
12
15
18
9/3/2010 5/2/2011 11/10/2015
(SH)
11/10/2015
(FH)
Dis
sip
ated
Vo
lum
etri
c R
ate
[cm
3/s
]
Field Test Date
Edge 2 EB
0
2
4
6
8
10
9/3/2010 5/2/2011 11/10/2015
(SH)
11/10/2015
(FH)
Dis
sip
ated
Vo
lum
etri
c R
ate
[cm
3/s
]
Field Test Date
Edge 2 WB

31
Figure 27 Dissipated Volumetric Rate vs. Test Time for Soo 1 Location
0
200
400
600
800
1000
1200
9/3/2010 5/2/2011 11/10/2015
(SH)
11/10/2015
(FH)
Dis
sip
ated
Vo
lum
etri
c R
ate
[cm
3/s
]
Field Test Date
Soo 1 NB
0
200
400
600
800
1000
1200
1400
9/3/2010 5/2/2011 11/10/2015
(SH)
11/10/2015
(FH)
Dis
sip
ated
Vo
lum
etri
c R
ate
[cm
3/s
]
Field Test Date
Soo 1 SB
Figures 28a and 28b Dissipated Volumetric Rate vs. Test Time for Soo 2 Location
0
50
100
150
200
250
300
350
400
9/3/2010 5/2/2011 11/10/2015
(SH)
11/10/2015
(FH)
Dis
sip
ated
Vo
lum
etri
c R
ate
[cm
3/s
]
Field Test Date
Soo 2 NB
0
50
100
150
200
250
300
350
400
9/3/2010 5/2/2011 11/10/2015 (SH) 11/10/2015 (FH)
Dis
sip
ated
Vo
lum
etri
c R
ate
[cm
3/s
]
Field Test Date
Soo 2 SB
32
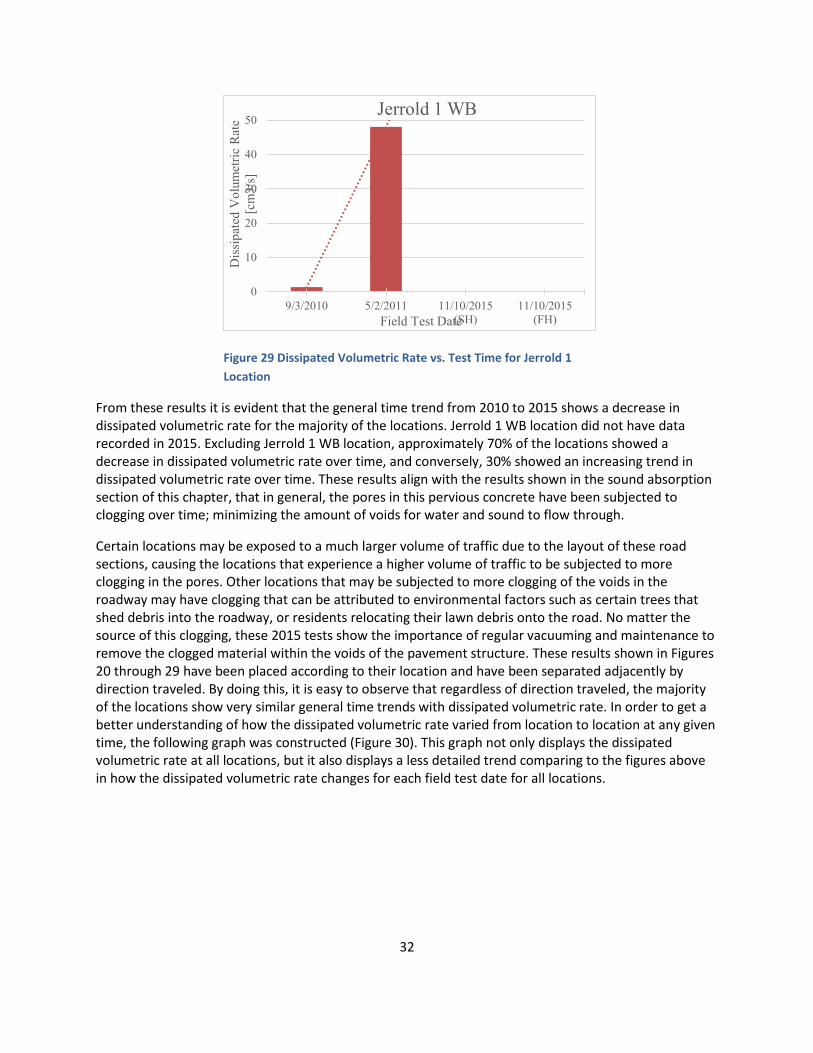
Figure 29 Dissipated Volumetric Rate vs. Test Time for Jerrold 1
Location
0
10
20
30
40
50
9/3/2010 5/2/2011 11/10/2015
(SH)
11/10/2015
(FH)
Dis
sip
ated
Vo
lum
etri
c R
ate
[cm
3/s
]
Field Test Date
Jerrold 1 WB
From these results it is evident that the general time trend from 2010 to 2015 shows a decrease in dissipated volumetric rate for the majority of the locations. Jerrold 1 WB location did not have data recorded in 2015. Excluding Jerrold 1 WB location, approximately 70% of the locations showed a decrease in dissipated volumetric rate over time, and conversely, 30% showed an increasing trend in dissipated volumetric rate over time. These results align with the results shown in the sound absorption section of this chapter, that in general, the pores in this pervious concrete have been subjected to clogging over time; minimizing the amount of voids for water and sound to flow through.
Certain locations may be exposed to a much larger volume of traffic due to the layout of these road sections, causing the locations that experience a higher volume of traffic to be subjected to more clogging in the pores. Other locations that may be subjected to more clogging of the voids in the roadway may have clogging that can be attributed to environmental factors such as certain trees that shed debris into the roadway, or residents relocating their lawn debris onto the road. No matter the source of this clogging, these 2015 tests show the importance of regular vacuuming and maintenance to remove the clogged material within the voids of the pavement structure. These results shown in Figures 20 through 29 have been placed according to their location and have been separated adjacently by direction traveled. By doing this, it is easy to observe that regardless of direction traveled, the majority of the locations show very similar general time trends with dissipated volumetric rate. In order to get a better understanding of how the dissipated volumetric rate varied from location to location at any given time, the following graph was constructed (Figure 30). This graph not only displays the dissipated volumetric rate at all locations, but it also displays a less detailed trend comparing to the figures above in how the dissipated volumetric rate changes for each field test date for all locations.

33
Figure 30 Volumetric Dissipation Rate Test Results of 2010, 2011, and 2015 for each Location
0
200
400
600
800
1000
1200
1400
AV
ER
AG
E D
ISS
IPA
TE
D V
OL
UM
ET
RIC
RA
TE
[C
M3
/S]
LOCATION AND DIRECTION
9/3/2010 5/2/2011 11/10/2015 (SH) 11/10/2015 (FH)
From Figure 30 it can be observed that there is a large distribution of dissipated volumetric rates from location to location. The locations Owasso 2, Edge 1, and Edge 2, in both directions of travel analyzed, show extremely small volume dissipation rates for all field test dates, regardless of their general time trend. The concern in regards to these three locations is that the 2010 dissipated volumetric rate is extremely small, which could indicate that there was an issue during construction of the pavement structure - leading to this poor initial hydraulic conductivity. The Soo 1 location shows the largest dissipated volumetric rate for both directions traveled, and it is also one of the few locations that shows an increasing trend in hydraulic conductivity. Aside from the four locations mentioned previously, all other locations portray initial dissipated volumetric rates that are relatively large, which is what was expected for this pavement structure. However, all these remaining locations still show either a steady or a rapid decrease in the dissipated volumetric rate over time. For the majority of these locations, by 2015 the volumetric dissipation rate is as bad as the Owasso 2, Edge 1, and Edge 2 locations. This

34
ultimately leads back to the impact that the clogging of the voids in this pavement structure have on the hydraulic conductivity in this pavement.
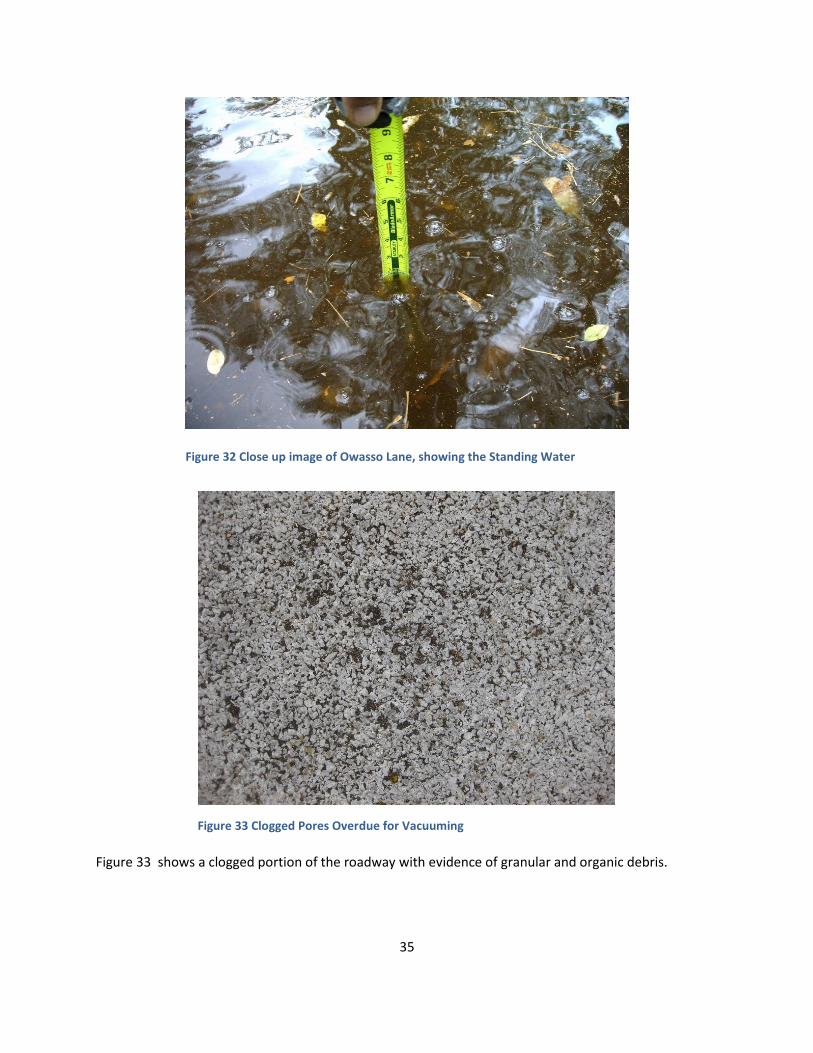
The Figures 31 and 32 were taken in 2011 on Owasso Lane. These images showed standing water on top of the pervious concrete, providing a glimpse of how severely clogged the pores are within this pavement structure at certain points within this road network. Standing water has the potential to freeze up and the resulting ice lenses exert sufficient lateral; pressure to damage the pervious concrete. This can only occur when the pores are clogged over time or are non-communicating on account of poor mix design. The latter does not apply. However this validates the earlier research [5] indicating that most of the clogging agents are organic (leaves). Clogging can result in poor acoustic properties [3] and [6]
Figure 31 Image of Owasso Lane
35
Figure 32 Close up image of Owasso Lane, showing the Standing Water
Figure 33 Clogged Pores Overdue for Vacuuming
Figure 33 shows a clogged portion of the roadway with evidence of granular and organic debris.

36
Table 1 Dissipated Volumetric Rate (DVR)
CEL
L
DA
Y
TIM
E
STA
TIO
N
OFF
SET
LAN
E
FLO
W_T
IME_
S
INIT
IAL-
HEA
D_
CM
FIN
AL-
HEA
D_
CM
PA
VEM
ENT_
THIC
KN
ESS_
CM
CR
OSS
_SEC
TIO
N_
AR
EA_C
M2
DIS
IPA
TED
_VO
LU
MET
RIC
_RA
TE_C
M3/S
Wood1 2-May-11 PM SB -9.5 Right 34.35 54 10 12 167.53 214.59
Wood1 2-May-11 PM NB 9.5 Right 17.88 51 10 12 167.53 384.16
Wood2 2-May-11 PM SB -9.5 Right 21.03 51 10 12 167.53 326.62
Wood2 2-May-11 PM NB 9.5 Right 39.34 58 10 12 167.53 204.41
Wood3 2-May-11 PM SB -9.5 Right 54.32 55 10 12 167.53 138.79
Wood3 2-May-11 PM NB 9.5 Right 57.1 56 10 12 167.53 134.96
Owasso1 2-May-11 PM SB -9.5 Right 18.47 49 10 12 167.53 353.74
Owasso1 2-May-11 PM NB 9.5 Right 140.6 61 10 12 167.53 60.77

37
Owasso2 2-May-11 PM SB -9.5 Right 227.06 57 10 12 167.53 34.68
Owasso2 2-May-11 PM NB 9.5 Right 180 61 43.5 12 167.53 16.29
Edge1 2-May-11 PM EB -9.5 Right 180 61 29.25 12 167.53 29.55
Edge1 2-May-11 PM WB 9.5 Right 180 61 53 12 167.53 7.45
Edge2 2-May-11 PM EB -9.5 Right 180 61 51.5 12 167.53 8.84
Edge2 2-May-11 PM WB 9.5 Right 180 63.5 60.8 12 167.53 2.51
Soo1 2-May-11 PM NB 9.5 Right 13.69 51 10 12 167.53 501.73
Soo1 2-May-11 PM SB -9.5 Right 10.71 48 10 12 167.53 594.41
Soo2 2-May-11 PM NB 9.5 Right 49.88 55 10 12 167.53 151.14
Soo2 2-May-11 PM SB -9.5 Right 17.6 47 10 12 167.53 352.19
Jerold1 2-May-11 PM WB 0 Center 180 61.6 10 12 167.53 48.03

38
Table 2 Dissipated Volumetric Rate (D.V.R.) and Sound Absorption Coefficient

39
5.3 RIDE QUALITY (IRI)
The ride quality of roadways is measured with the international roughness index (IRI) method as previously. As stated previously in this report, the IRI is quantified by the ratio of the total miniscule vertical displacements while traveling down a road section and the total horizontal displacement of the traveling vehicle. This value provides great insight in regards to the ride quality a driver experiencing while driving down a certain road section. A large IRI value indicates that the road section has low ride quality; therefore it is anticipated that the IRI values will be increasing overtime, unless the road section has been maintained or rehabilitated at some point between field tests. The following graphs show the average IRI at each locations for all field test dates between 2009 and 2015 for the ROLINE IRI and the TriODS IRI, respectively.
Figure 34 Average IRI ROLINE Value versus Test Time
150
200
250
300
350
400
450
500
550
Aver
age
Tri
OD
S I
RI
[in/m
i]
Road Section
5/17/2009
5/17/2010
8/18/2010
5/18/2012
5/31/2012
11/5/2015
40
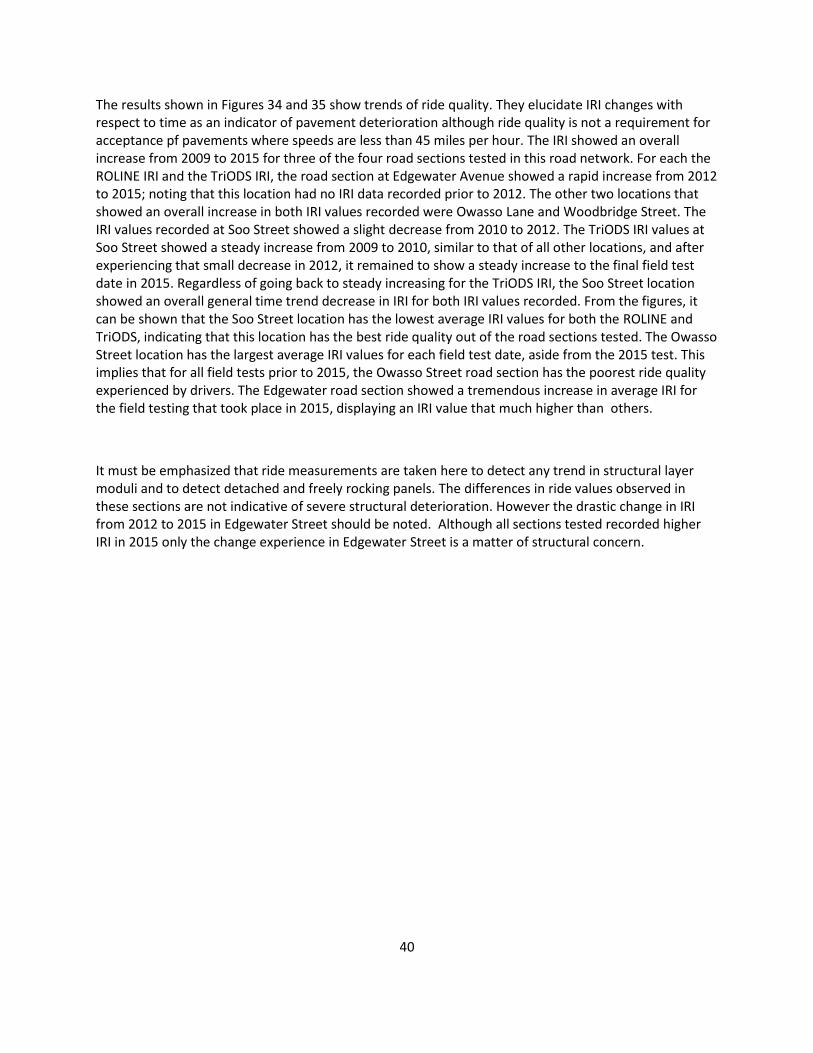
The results shown in Figures 34 and 35 show trends of ride quality. They elucidate IRI changes with respect to time as an indicator of pavement deterioration although ride quality is not a requirement for acceptance pf pavements where speeds are less than 45 miles per hour. The IRI showed an overall increase from 2009 to 2015 for three of the four road sections tested in this road network. For each the ROLINE IRI and the TriODS IRI, the road section at Edgewater Avenue showed a rapid increase from 2012 to 2015; noting that this location had no IRI data recorded prior to 2012. The other two locations that showed an overall increase in both IRI values recorded were Owasso Lane and Woodbridge Street. The IRI values recorded at Soo Street showed a slight decrease from 2010 to 2012. The TriODS IRI values at Soo Street showed a steady increase from 2009 to 2010, similar to that of all other locations, and after experiencing that small decrease in 2012, it remained to show a steady increase to the final field test date in 2015. Regardless of going back to steady increasing for the TriODS IRI, the Soo Street location showed an overall general time trend decrease in IRI for both IRI values recorded. From the figures, it can be shown that the Soo Street location has the lowest average IRI values for both the ROLINE and TriODS, indicating that this location has the best ride quality out of the road sections tested. The Owasso Street location has the largest average IRI values for each field test date, aside from the 2015 test. This implies that for all field tests prior to 2015, the Owasso Street road section has the poorest ride quality experienced by drivers. The Edgewater road section showed a tremendous increase in average IRI for the field testing that took place in 2015, displaying an IRI value that much higher than others.
It must be emphasized that ride measurements are taken here to detect any trend in structural layer moduli and to detect detached and freely rocking panels. The differences in ride values observed in these sections are not indicative of severe structural deterioration. However the drastic change in IRI from 2012 to 2015 in Edgewater Street should be noted. Although all sections tested recorded higher IRI in 2015 only the change experience in Edgewater Street is a matter of structural concern.

41
CHAPTER 6: COMPARATIVE ANALYSIS THROUGH LIFE-CYCLE
COSTING
The options examined are:
Pervious Concrete (Real)
Bituminous Road w/Underground Infiltration (Imaginary alternative)
Table 3 Initial Cost for Pervious Option (Provided by the City)
a)Actual Pervious Concrete Construction Costs
Common Excavation – 11,000CY($6.00/CY) = $ 66,000*
Fabric – 11,000SY($1.00/SY) = $ 11,000
1-1/2” Crushed Rock – 5000CY($52.00/CY) = $260,000*
7” Pervious Concrete – 8470SY($46.50/SY) = $394,000
Total Cost for Pervious Concrete System = $731,000
Total CostPer SY Cost for Pervious Concrete System = $ 86.30***Average depth
beneath concrete = 1.75-feet
SY = Square Yard and CY = Cubic Yards

42
Table 4 Initial Cost of Non-Pervious Option (Provided by the City)
Estimated Construction Costs from Feasibility Study
Estimated Bituminous Road Cost = $257,000
Estimated Underground Infiltration Cost = $417,500
Total Est Cost – Bit Road & Infiltration = $674,000
Total cost Per SY Est Cost – Bit Road & Infiltration
= $ 79.60**
**8.5% Increased Cost for Pervious Concrete
Pervious Alternative: Cost of Vacuuming every month $2000/year = $12000
Asphalt Alternative Bituminous Mill and Overlay $100000 at Year 10
Route and Seal $20,000 in the 3rd year (Too many leaves from trees in the neighborhood)
Sewer cleaning $10,000 /year
See Table 5 for investment outlay assuming the pervious concrete is frequently maintained and will be ground after 10th year. The asphalt option will be milled and overlaid at 15th year. Table 6 accentuates a scenario where the pervious concrete may not need to be ground because intensified vacuuming forestalls the need for grinding. Figures 36 and 37 plot the investment option.
For a life cycle cost a discount rate of 4% was used over an investment period of 20 years. Every expenditure is thus discounted to the first year, facilitating a calculation of net present value as shown in the table and plotted in the figures.

43
Table 5 Investment Scenario Grinding Case 1: (Grinding after 10th Year)
Vacuum Other Cumulative
Pervious
NPV
Pervious
Cumulative
Non
Pervious
Non Pervious Year Non
Pervious
Total
Non
Pervious
NPV
Total
2000 731000 733000 704808 650000 674000 2000 1 676000 650000 Initial Cost
2000 2000 704808 650000 2000 2 2000 650000
2000 2000 706657 651849 20000 2000 3 22000 651849
2000 2000 708435 671407 2000 4 2000 671407
2000 2000 710144 673117 2000 5 2000 673117
2000 2000 711788 674760 2000 6 2000 674760
2000 2000 713369 676341 2000 7 2000 676341
2000 2000 714889 677861 2000 8 2000 677861
2000 2000 716350 679322 2000 9 2000 679322
2000 2000 717755 680728 10000 2000 10 12000 680728 Edge drain
2000 2000 719106 688834 2000 11 2000 688834
2000 2000 720406 690133 2000 12 2000 690133
2000 2000 721655 691383 2000 13 2000 691383
2000 50000 52000 722856 692584 2000 14 2000 692584 Diamond
Grind
2000 2000 752885 693739 150000 2000 15 152000 693739 Mill& Olay
2000 2000 753995 778139 2000 16 2000 778139

44
2000 2000 755063 779207 2000 17 2000 779207
2000 2000 756090 780234 2000 18 2000 780234
2000 2000 757077 781221 2000 19 2000 781221
2000 2000 758026 782170 2000 20 2000 782170
758939 758939 783083 783083

45
Figure 35 Investment Option with and Without Diamond Grinding for Restoration
600000
620000
640000
660000
680000
700000
720000
740000
760000
780000
0 5 10 15 20 25
NP
V
Age
PERVIOUS NPV
PERV NPV NO-GRIND

46
Table 6 Comparison through Life Cycle Analysis (Case 2: No Grinding)
Vacuuming Other Cumulative
Pervious
NPV
Pervious
Cumulative
Non
Pervious
Non Pervious Year Non
Pervious
Total
2000 731000 733000 704808 650000 674000 2000 1 676000 Initial
Cost
650000
2000 2000 704808 650000 2000 2 2000 650000
2000 2000 706657 651849 20000 2000 3 22000 651849
2000 2000 708435 671407 2000 4 2000 671407
2000 2000 710144 673117 2000 5 2000 673117
2000 2000 711788 674760 2000 6 2000 674760
2000 2000 713369 676341 2000 7 2000 676341
2000 2000 714889 677861 2000 8 2000 677861

47
2000 2000 716350 679322 2000 9 2000 679322
2000 2000 717755 680728 10000 2000 10 12000 Edge
drain
680728
2000 2000 719106 688834 2000 11 2000 688834
2000 2000 720406 690133 2000 12 2000 690133
2000 2000 721655 691383 2000 13 2000 691383
2000 2000 722856 692584 2000 14 2000 Diamond
Grind
692584
2000 2000 724011 693739 150000 2000 15 152000 Mill&
Olay
693739
2000 2000 725121 778139 2000 16 2000 778139
2000 2000 726189 779207 2000 17 2000 779207
2000 2000 727216 780234 2000 18 2000 780234
48
2000 2000 728203 781221 2000 19 2000 781221
2000 2000 729152 782170 2000 20 2000 782170
730065 730065 783083 783083

49
Figure 36 Investment Options Pervious Alternatives Vs Non Pervious Alternative
600000
620000
640000
660000
680000
700000
720000
740000
760000
780000
800000
0 5 10 15 20 25
NP
V
Age
NON-PERVIOUS NPV
PERVIOUS NPV
PERV NPV NO-GRIND

50
CHAPTER 7: CONCLUSION AND RECOMMENDATION
This project was to evaluated performance of pervious concrete pavements in Shoreview by examining sound absorption, hydraulic conductivity, and ride quality of the pavements. Based on the evaluation and test carried out, pervious concrete pavements successfully provides an alternative to culverts in the Woodbridge neighborhood. The pervious pavements infiltrated storm-water into the ground below the pavement while enhancing sound absorption. After analyzing the collected data, sound absorption, hydraulic conductivity, and ride quality of the pavements were found to have decreased over time. Hydraulic conductivity of the pervious concrete decreased due to clogging of the voids of the pavements. As the amount of voids in the pavement structure decreased, the hydraulic conductivity and sound absorption of the pervious concrete pavement decreased as well. Traffic loading obviously accelerated clogging from where it follows that appropriate vacuuming is recommended to solve the decrease in hydraulic conductivity and sound absorption of pervious concrete pavements due to clogging. A hydrological evaluation shows that more than 1 acre-feet of water was conducted through the pervious pavements by 2012 using the rainfall, Infiltration coefficients, time of concentration and percentage of non-pervious surface in the established catchment area. Analyzing the alternative cost of hydraulic in comparison to cost of frequent vacuuming and one grinding within the 15-year analysis period reveals a savings in the cost of the pervious pavements. The benefits derivable from the Clean Water Act and the minimization of direct pollution to Owasso Lake were not included in the evaluation.
Finally, it is recommended that constant vacuuming be done at least 4 times a year. This practice will mitigate reversible clogging and its secondary problems. It will also increase hydraulic conductivity, restore sound absorption and decelerate the effect of freeze thaw cycles. Pervious concrete pavements lower the impact of storm-water runoff on environmental pollution and recharge the City’s ground water. The percentage of the test results that were preceded by vacuuming was not clear but the long-term measurements in 2015 that were not preceded by vacuuming showed obvious clogging with visible clogging agents and standing water. When such clogged sections go through freeze thaw cycles, ice lenses could exert tremendous pressure that could distress the concrete matrix and cause extensive damage.
51
REFERENCES
1) Izevbekhai, B.I and Eller A.J. (2009) 2009-19 MnROAD Cell 64 Pervious Concrete: Third Year Performance Report of Pervious Concrete Cell 64. MnDOT Report 2009-19. Feb Minnesota Department of Transportation 395 John Ireland Blvd 2019
2) Izevbekhai, Bernard Igbafen, and Alexandra Akkari. Pervious Concrete Cells on MnROAD Low-Volume Road. No. MN/RC 2011-23. 2011.
3) Izevbekhai B.I. (2012) Tire Pavement Interaction Noise of Concrete Pavements. A dissertation in Partial Fulfillment of the requirements for Doctor of Philosophy. University of Minnesota 2012.
4) Bérengier M.; Garai M. (2004) In-situ measurement of sound absorption Coefficient of Road pavements LCPC. Centre de Nantes, Route de Bouaye, and BP 4129, 44341 Bouguenais Cedex, France URL: http://www.icacommission.org/Proceedings/ICA2001Rome/405.pdf . Accessed 12/1/15
5) Sandberg U. and Descornet. G. Road surface influence on tire/road noise - part 1. Internoise, pages 259–272, Miami, 1980.
6) Vancura, Mary E., Kevin MacDonald, and Lev Khazanovich. "Location and depth of pervious concrete clogging material before and after void maintenance with common municipal utility vehicles." Journal of Transportation Engineering 138.3 (2012): 332-338.


