
SHALLOW GROUND-WATER CONDITIONS,
TOM GREEN COUNTY, TEXAS
U.S. GEOLOGICAL SURVEY
Water-Resources Investigations Report 86-4177
Prepared in cooperation with
TOM GREEN COUNTY and the
CITY OF SAN ANGELO
Austin, Texas
1986
DEPARTMENT OF THE INTERIOR
DONALD PAUL MODEL, Secretary
U.S. GEOLOGICAL SURVEY
Dallas L. Peck, Director
For additional information Copies of this report can Write to: be purchased from:
District Chief U.S. Geological SurveyU.S. Geological Survey Books and Open-File Reports649 Federal Building Federal Center, Building 41300 East 8th Street Box 25425,Austin, TX 78701 Denver, CO 80225
-ii-
CONTENTS
Page
Abstract 1Introduction-- 2
Purpose and scope 4Previous studies 4Description of study area 4Method of investigation 8Wel 1-numberi ng system 8Wel 1 constructi on 9
Occurrence of ground water in the shallow aquifer system 9Ground-water levels 10
Current (1983) conditions 15Hi stori cal changes 15
Ground-water quality 22Current (1983) conditions 22Disolved-solids concentrations 22Major inorganic constituents and physical properties 25
Leona aqui fer 25Leona and Choza and Choza aquifers 28Comanche Peak aquifer 28Tri nity aqui fer 29San Angelo aquifer 29Bullwagon and Vale aquifers 30Standpipe and Arroyo aquifers 30
Minor and trace elements- 30Bacteria and nutrients 31Pesticides- 33Hi stori cal changes 33
Leona and Choza aquifers 36Comanche Peak and Trinity aquifers 37San Angelo aquifer 37Bullwagon aqui fer 37Standpipe and Arroyo aquifers 38
Summary and conclusions 39Selected references 41Supplemental information 42
-m-
ILLUSTRATIONS
Page
Figure1-4. Maps showing:
1. Location of study area 32. Area! extent and potentiometric surfaces of Leona
and Comanche Peak and Trinity aquifers, 1982-83 113. Areal extent and potentiometric surfaces of San
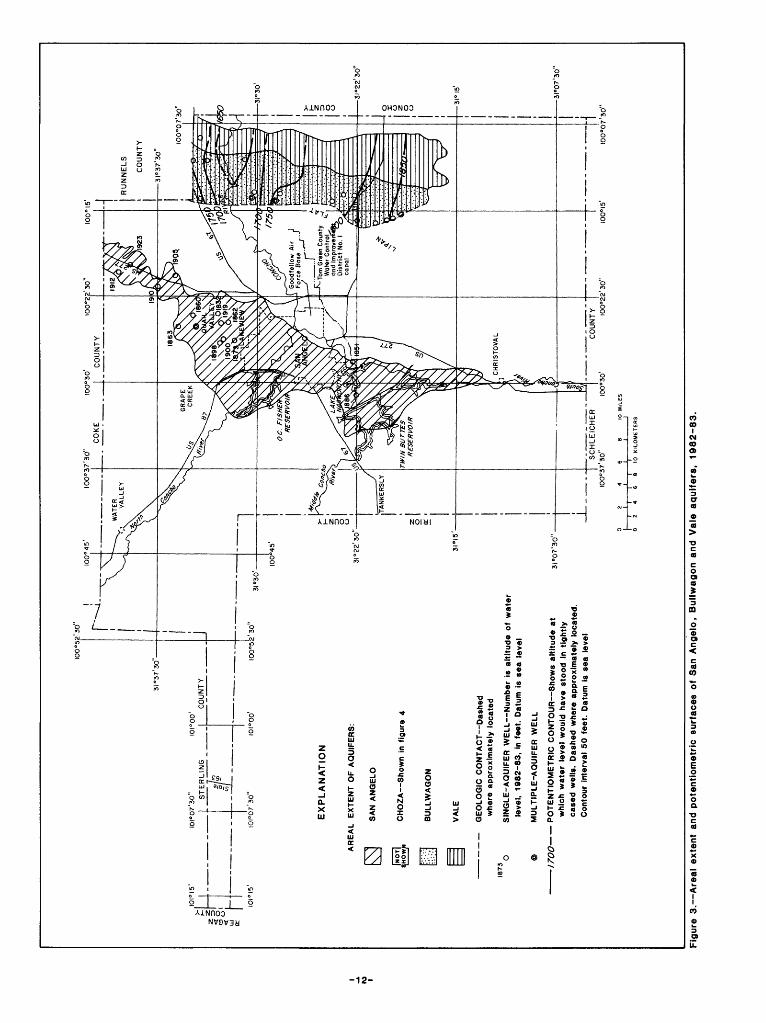
Angelo and Bullwagon and Vale aquifers, 1982-83 124. Area! extent and potentiometric surfaces of
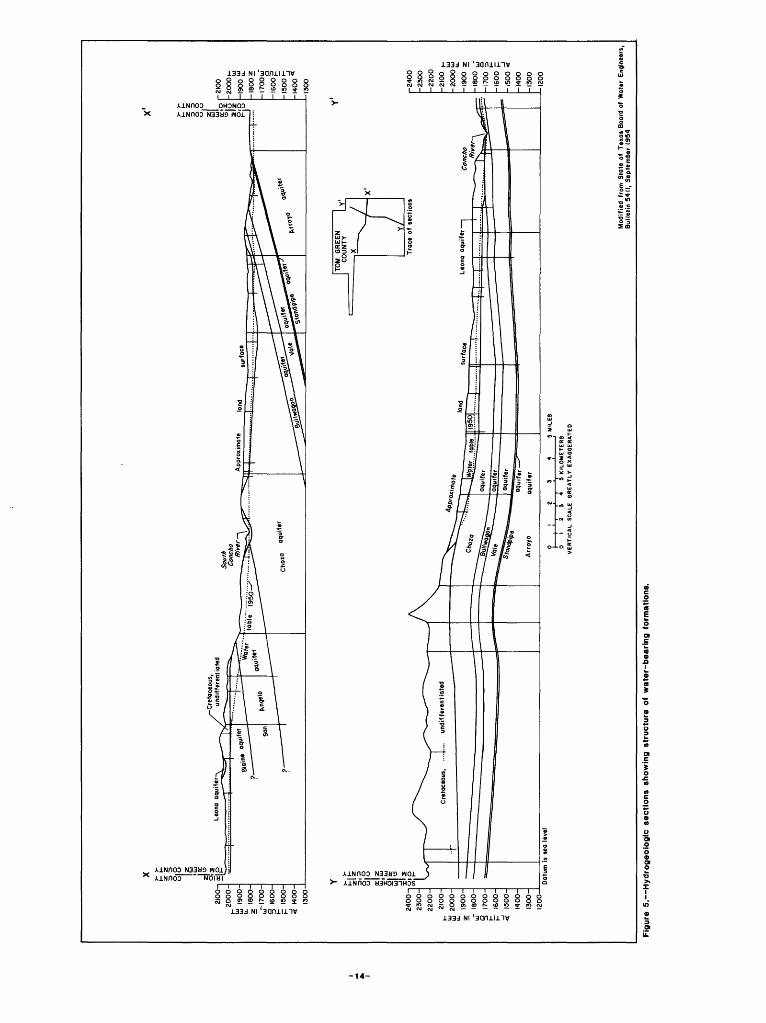
Choza and Standpipe and Arroyo aquifers, 1982-83 135. Hydrogeologic sections showing structure of water-
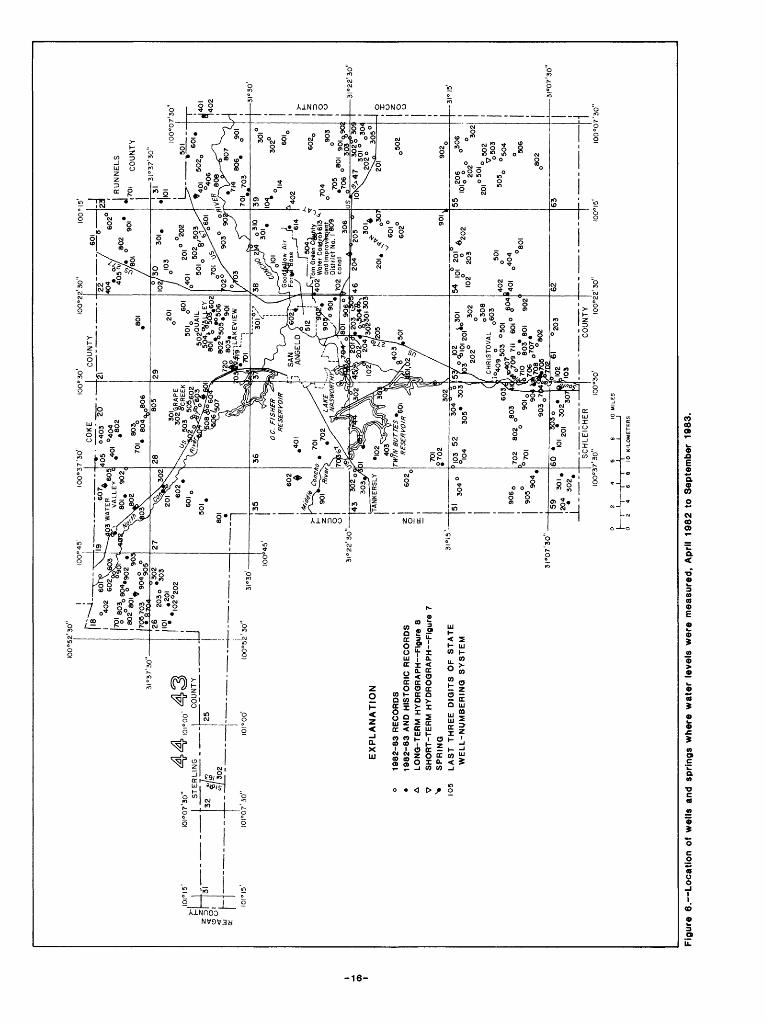
yielding formations 146. Map showing location of wells and springs where water
levels were measured, April 1982 to September 1983 167. Hydrographs for selected wells and monthly precipitation
at San Angelo, April 1982 to September 1983 178. Hydrographs for selected wells and average annual
precipitation at San Angelo, 1940-83 199. Map showing water-level changes in selected wells, 1941
or 1954 to 1982-83 2010. Map showing measured or estimated dissolved-solids
concentrations in water samples collected from wells and springs, 1982-83 23
11. Map showing distribution and relative concentrationsof major ions 26
12. Graph showing concentrations of major ions and dissolvedsolids categorized by aquifer 27
13. Map showing changes in dissolved-solids concentrations,by aquifer, from 1940-50 to 1983 and from 1969 to 1983 34
14. Map showing location of oil fields 35
-TV-
TABLES
Page
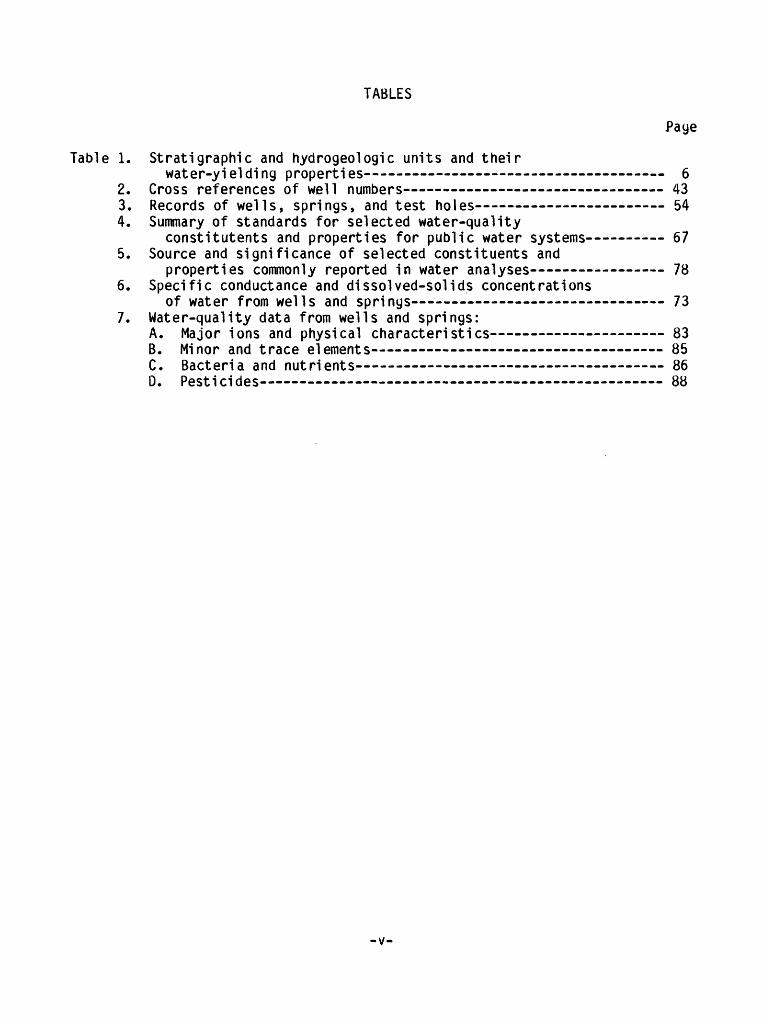
Table 1. Strati graphic and hydrogeologic units and theirwater-yielding properties 6
2. Cross references of well numbers 433. Records of wells, springs, and test holes 544. Summary of standards for selected water-quality
constitutents and properties for public water systems 675. Source and significance of selected constituents and
properties commonly reported in water analyses 786. Specific conductance and dissolved-solids concentrations
of water from wells and springs 737. Water-quality data from wells and springs:
A. Major ions and physical characteristics 83 B. Minor and trace elements 85 C. Bacteria and nutrients 86 0. Pesticides 88
-v-

METRIC CONVERSIONS
The Inch-pound units of measurements used 1n this report may be converted to metric (International System) units by using the following conversion fac tors:
Multiply Inch-pound unit By To obtain metric unit
Inch (In.)
foot (ft)
mile (ml)
acre-foot (acre-ft)
square mile (mi2)
foot per mile (ft/ml)
gallon per minute (gal/mln)
degree Fahrenheit (°F)
25.4
0.3048
1.609
0.001233
2.590
0.189
0.06306
0.003785
5/9(°F - 32)
millimeter
meter
kilometer
cubic hectometer
square kilometer
meter per kilometer
liter per second
cubic meter per minute
degree Celsius (°C)
-VI-
SHALLOW GROUND-WATER CONDITIONS,
TOM GREEN COUNTY, TEXAS
By
J. N. Lee
ABSTRACT
Most of the water needs of Tom Green County, Texas, are supplied by ground water; however, the city of San Angelo is supplied by surface water. Ground- water withdrawals during 1980 (latest year for which data are available) in Tom Green County totaled about 15,300 acre-feet, all derived from shallow aquifers. Shallow aquifers in this report refer to the ground-water system generally less than 400 feet deep that contains water with less than a 10,000 milligrams per liter concentration of dissolved solids; aquifers comprising this system include: The Leona, Comanche Peak, Trinity, Blaine, San Angelo, Choza, Bull- wagon, Vale, Standpipe, and Arroyo aquifers.
The current (1983) water levels in shallow aquifers in Tom Green County are relatively unchanged from those levels listed in previous reports. In most wells, the change in water level is less than 10 feet, and only a few isolated wells or areas have changes of more than 20 feet. Based on long-term hydrographs of selected wells and precipitation, water levels are directly related to pre cipitation and associated pumpage for irrigation. Current (1983) water levels probably are higher than normal due to the above-normal precipitation during 1980-81.
Ground water in Tom Green County commonly is very hard (greater than 180 milligrams per liter as calcium carbonate), and chemical types vary in the aquifers and in different parts of the county. The concentrations of dissolved solids range from 200 to 3,000 milligrams per liter, the dissolved-chloride concentrations range from about 40 to 1,000 milligrams per liter, and the dissolved-sulfate concentrations normally range from about 25 to 600 milligrams per liter. The dissolved-nitrate concentrations in samples from eight wells ranged from 2 to 37 milligrams per liter. Five of these samples exceeded the maximum contaminant level of 10 milligrams per liter set by the U.S. Environmen tal Protection Agency. Of the eight water samples analyzed for minor elements, two exceeded the maximum contaminant level for selenium, and one exceeded the maximum contaminant level for manganese. Samples from three wells were analyzed for selected pesticides; no pesticides were detected.
Two groups of ground-water samples were tested for bacteria in April and August 1983. The first group consisted of samples from 25 wells; no samples contained fecal-coliform bacteria, but 15 samples contained fecal-streptococci bacteria. The second group consisted of samples from 29 wells and 1 spring; twelve of these samples contained fecal-coliform bacteria and all 30 contained
fecal-streptococci bacteria. Water samples from seven wells were common to both groups, and the samples tested in August contained more bacteria. Counts of fecal-coliform bacteria ranged from 0 to 26 colonies per 100 milliliters with most less than 5 colonies per 100 milliliters. Counts of fecal-streptococci bacteria ranged from 0 to 400 colonies per 100 milliliters with most less than 20 colonies per 100 milliliters. The presence of fecal-coliform and fecal- streptococci bacteria in water is only an indicator that pollution from septic systems may be present and is not a positive check for fecal pollution. Generally, the aquifers are not contaminated by septic-system effluent, how ever, some individual wells or localized areas could be contaminated by nearby septic systems.
Using dissolved-solids concentrations as an indicator, historical and cur rent (1983) water-quality records were compared to determine if any changes in water quality had occurred. The quality of water from Cretaceous rocks under lying the Edwards Pleateau has not changed significantly; this water is the least mineralized ground water in the county. The quality of water from the Arroyo and Bullwagon aquifers in the eastern most part of the county also has not changed significantly; dissolved-solids concentrations range from 1,500 to 2,000 milligrams per liter. In the remainder of the county, dissolved-solids concentrations have increased from 10 to 500 milligrams per liter in ground water along the river valleys and in the Li pan Flat area and increases of 500 to 1,100 milligrams per liter have occurred in ground water southeast of San Angelo, west of Twin Buttes Reservoir, and about 10 miles east of San Angelo. Locally, dissolved-solids concentrations have increased by as much as 4,530 milligrams per liter in water from individual wells.
Pollution from oil-field activities may affect the quality of water in some isolated wells and in some areas in the county. No historical records are available for determining any changes in pesticides, minor elements, or bacteria.
INTRODUCTION
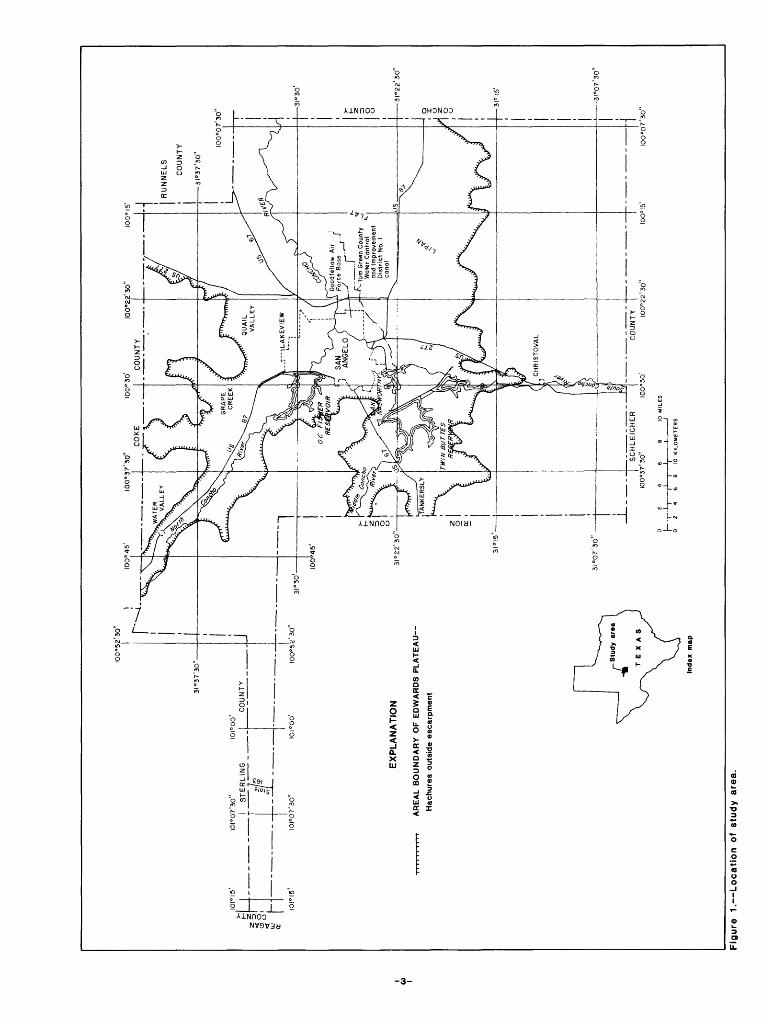
In Tom Green County, Texas, ground water is most readily available in the alluvial valley of the Concho River east of the city of San Angelo (fig. 1). In the other areas of the county, ground water generally is limited in quantity, and its quality may vary from fresh to saline. The total area of Tom Green County is 1,547 mi?. About 300 mi 2 is cropland of which about 22 mi 2 is irri gated, and about 1,100 mi 2 is rangeland. Major economic bases of the county are agriculture (sheep, cattle, grain sorghum, cotton, and dairy products), Goodfellow Air Force Base, oil and gas production, manufacturing, and San Angelo State University. The population of the county in 1980 was 84,780 (U.S. Bureau of the Census, 1980) of which 73,240 were residents of San Angelo, the county seat.
Demands on the ground-water resources of Tom Green County are expected to continue to increase, and concerns have been expressed regarding the future availability of water and the possible deterioration of the quality of water in the shallow aquifer system. Documentation of existing ground-water conditions for subsequent planning is needed for development, management, and utilization
-2-
I00
°52
' 30"
! i
I00°4
5'
I00
°37
'30
"(0
0°
15'
ST
ER
LIN
G
!OI«
07'3
0"
EX
PL
AN
AT
ION
Tom
Gr«
«n C
ount
y W
ater
Con
trol
<"
an
d im
prov
emen
t D
istr
ict
No.
I
cana
l
AR
EA
L B
OU
ND
AR
Y O
F E
DW
AR
DS
PL
AT
EA
U
Hac
hu
res
ou
tsid
e es
carp
men
t
I00
"07
'30
"
02
4
6
8 10
K
ILO
ME
TE
RS
Inde
x m
ap
Fig
ure
1
. L
oc
ati
on
of
stu
dy
area
.
of the water resources by individuals, commercial establishments, and goven- ment agencies. At the request of, and in cooperation with Tom Green County and the city of San Angelo, the U.S. Geological Survey began a study in 1982 with three major objectives:
1. To define the current (1983) altitude of the water table and the water- quality characteristics of the shallow aquifer system.
2. To determine the historical changes, if possible, in water levels and water-quality characteristics.
3. To identify, where possible, the causes of any detected changes in water levels and water-quality characteristics.
Purpose and Scope
This report presents results of a 3-year, county-wide study to describe the present (1983) characteristics of the shallow aquifer system and the histor ical changes in these characteristics. Discussion is limited to aquifers that generally are less than 400ft deep and that contain water with less than 10,000 mg/L (milligrams per liter) dissolved solids. Emphasis was placed on determin ing current (1983) ground-water levels and water-quality characteristics, as indicated by dissolved-solids concentrations, and on historical changes in these conditions. Attention was given to water-quality characteristics that included major inorganic constituents, minor and trace elements, bacteria, and pesticides. Much of the water-level and water-quality data included in this report were collected from 1967 to 1982 by the Texas Department of Water Resources (currently the Texas Water Commission) and its preceding agencies. A driller's-log file maintained by the Texas Department of Water Resources was helpful in the inventory of recent wells.
Previous Studies
An inventory of wells and springs in Tom Green County was made during 1940-41. These data, including laboratory analyses of water samples, were published by the Texas Board of Water Engineers in September 1941. The study was a project of the Work Projects Administration (1941) in cooperation with the Texas Board of Water Engineers and was under the technical supervision of the U.S. Geological Survey.
The groundnrfater resources of Tom Green County were first described by Will is (1954). This report contains data from well inventories, water levels, quality of water, and aquifer determinations. Mount and others (1967) described the ground-water resources of the Colorado River basin in general terms; and well data, pumpage, water levels, geology, and aquifer information for Tom Green County are briefly mentioned.
Description of Study Area
Tom Green County is located along the northern edge of the Edwards Plateau (fig. 1). The surface of the plateau in the northern, western, and southern parts of the county is characterized by low hills and few streams. An escarp ment with a maximum height of about 100 ft separates the plateau areas from
-4-
the plains in the central and northeastern parts of the county. Drainage is well developed in the plains. The altitude of the land surface ranges from about 2,570 ft above sea level in the southwest corner of the county to about 1,610 ft above sea level where the Concho River crosses the eastern boundary of Tom Green County.
The climate of Tom Green County is semi arid or steppe. Most precipitation occurs from convective showers and thunderstorms, with considerable variation in quantity, intensity, and areal coverage. The average annual precipitation at San Angelo is about 18 in., with about 80 percent occurriny between March and November. Yearly precipitation has ranged from 7.41 in. during 1956 to 40.40 in. during 1936. Because of low humidity, strong winds, and hot summers, the gross lake-surface evaporation averages about 80 in. per year (Kane, 1967).
The Concho River and its main tributaries, the North Concho, Middle Concho, and South Concho Rivers, are the principal streams in the county. The Concho River, formed by the confluence of the North and South Concho Rivers in down town San Angelo, flows easterly into Concho County. Several springs that flow from crevices in the Cretaceous limestone sustain the base flow of the Concho River in the southern and western parts of the county. Discharge from these springs increases after rainy seasons and decreases during droughts. Most tributaries of the principal streams are dry during most of the year.
There are three major reservoirs in the county. The oldest reservoir is Lake Nasworthy, which was built in 1930 and has a storage capacity of 12,390 acre-ft. The reservoir is located at the confluence of the South and Middle Concho Rivers about 3 mi south of downtown San Angelo. The 0. C. Fisher Reser voir was built in 1952, has a conservation storage of 115,700 acre-ft, and is located on the North Concho River on the northwestern edge of San Angelo. Twin Buttes Reservoir was completed in 1962 and has a conservation storage of 186,200 acre-ft. Twin Buttes Reservoir impounds water from both the Middle and South Concho Rivers just upstream from Lake Nasworthy.
Rock formations exposed in the county are of sedimentary origin. The oldest rocks are of Permian age (table 1) and are exposed in some parts of the plains and river valleys. The regional dip of the Permian rocks is westward at about 50 ft/mi. The hilly remnants of the Edwards Plateau are composed of rocks of Cretaceous age, which dip slightly to the southeast. Older Quaternary alluvium and the Pleistocene Leona Formation cover the Permian rocks in most of the plains area, and younger Quaternary alluvium is present in the stream valleys.
All water wells considered in this report are completed in the shallow aquifer system (generally less than 400 ft deep) and yield fresh to moderately saline water (less than 10,000 mg/L dissolved solids). Water found deeper than 400 ft in the county usually is too mineralized for most uses and is classified as very saline or brine (more than 10,000 mg/L dissolved solids). The natural salinity of the shallow aquifer system generally reflects the circulation of water within the system. In the shallow, more permeable layers of the system, the circulation is faster than in deeper, less permeable layers; consequently, water has less dissolved solids in the shallow layers. The salinity of the ground water also is related to the mineralogy of the geologic material.
-5-
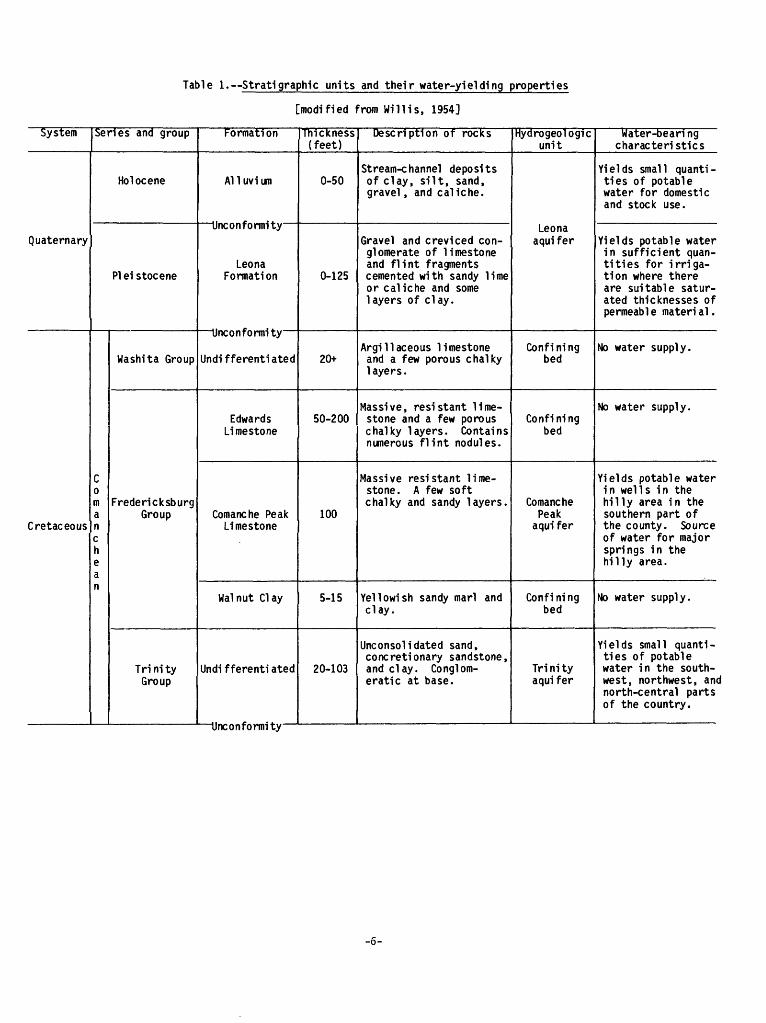
Table 1.--Stratigraphic units and their water-yielding properties
[modified from Will is, 1954]
System
Quaternary
Cretaceous
Sei
C0m a n c h e an
rles and group
Holocene
PI ei stocene
Washita Group
Frederic ksburg Group
Tri ni ty Group
Formation
A1 1 uvi urn
Unconformity
Leona Formation
Unconformity
Undifferentiated
Edwards Limestone
Comanche Peak Limestone
Walnut Clay
Undi f f erenti ated
Unconformity
Thickness (feet)
0-50
0-125
20+
50-200
100
5-15
20-103
Description of rocks
Stream-channel deposits of clay, silt, sand, gravel, and caliche.
Gravel and creviced con glomerate of limestone and flint fragments cemented with sandy lime or caliche and some layers of clay.
Argillaceous limestone and a few porous chalky layers.
Massive, resistant lime stone and a few porous chalky layers. Contains numerous flint nodules.
Massive resistant lime stone. A few soft chalky and sandy layers.
Yellowish sandy marl and clay.
Unconsoli dated sand, concretionary sandstone, and clay. Conglom eratic at base.
Hydrogeologic unit
Leona aqui f er
Confining bed
Confining bed
Comanche Peak
aquifer
Conf i ni ng bed
Tri ni ty aqui f er
Water-bearing characteristics
Yields small quanti ties of potable water for domestic and stock use.
Yields potable water in sufficient quan tities for irriga tion where there are suitable satur ated thicknesses of permeabl e materi al .
No water supply.
No water supply.
Yields potable water in wells in the hilly area in the southern part of the county. Source of water for major springs in the hilly area.
No water supply.
Yields small quanti ties of potable water in the south west, northwest, and north-central parts of the country.
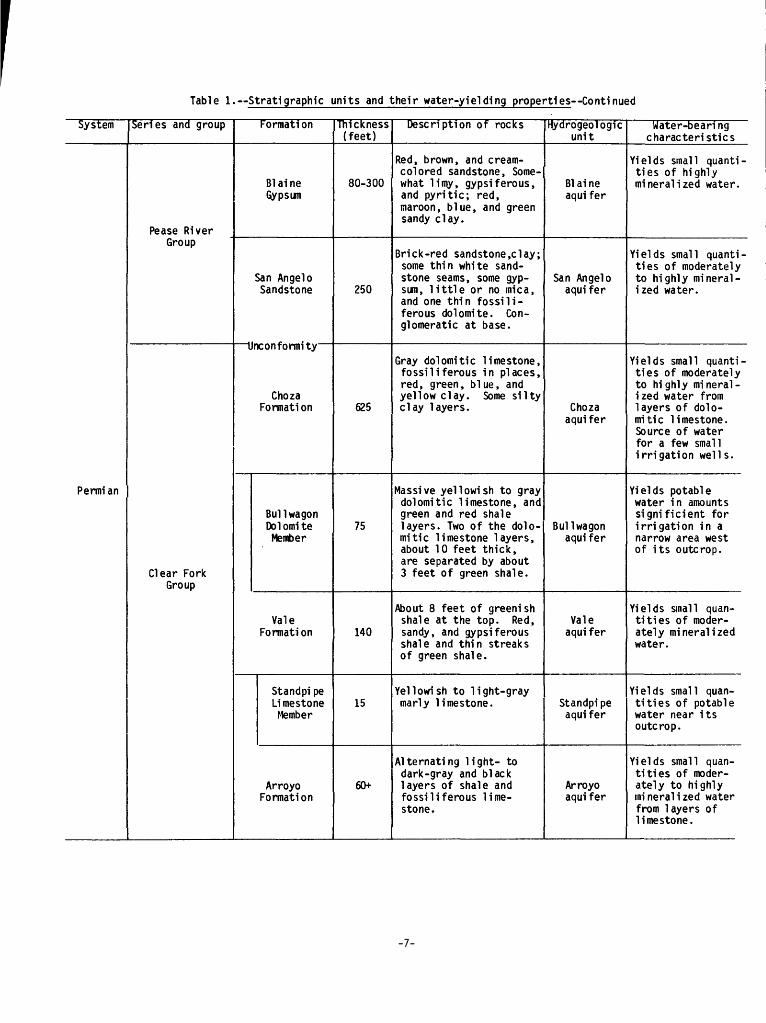
Table 1. Strati graphic units and their water-yielding properties Continued
System
Permian
Series and group
Pease RiverGroup
Clear Fork Group
Formation
Bl ai ne Gypsum
San Angel o Sandstone
Unconformity
Choza Formation
Bull wagon Dol omi te
Member
Vale Formation
Stand pi pe Limestone
Member
Arroyo Formation
Thickness (feet)
80-300
250
625
75
140
15
60+
Description of rocks
Red, brown, and cream- colored sandstone, Some what limy, gypsiferous, and pyritic; red, maroon, blue, and green sandy clay.
Brick-red sandstone ,c lay; some thin white sand stone seams, some gyp sum, little or no mica, and one thin fossil i- ferous dolomite. Con glomeratic at base.
Gray dolomitic limestone, fossil iferous in places, red, green, blue, and yellow clay. Some silty clay layers.
Massive yellowish to gray dolomitic limestone, and green and red shale layers. Two of the dolo mitic limestone layers, about 10 feet thick, are separated by about 3 feet of green shale.
About 8 feet of greenish shale at the top. Red, sandy, and gypsiferous shale and thin streaks of green shale.
Yellowish to light-gray marly limestone.
Alternating light- to dark-gray and black layers of shale and fossil iferous lime stone.
Hydrogeologic unit
Bl ai ne aqui fer
San Angel o aqui fer
Choza aquifer
Bull wagon aquifer
Vale aqui fer
Standpi pe aqui fer
Arroyo aqui fer
Water-bearing characteristics
Yields small quanti ties of highly mineralized water.
Yields small quanti ties of moderately to highly mineral ized water.
Yields small quanti ties of moderately to highly mineral ized water from layers of dolo mitic limestone. Source of water for a few small irrigation well s.
Yields potable water in amounts significient for irrigation in a narrow area west of its outcrop.
Yields small quan tities of moder ately mineralized water.
Yields small quan tities of potable water near its outcrop.
Yields small quan tities of moder ately to highly mineralized water from layers of limestone.
-7-
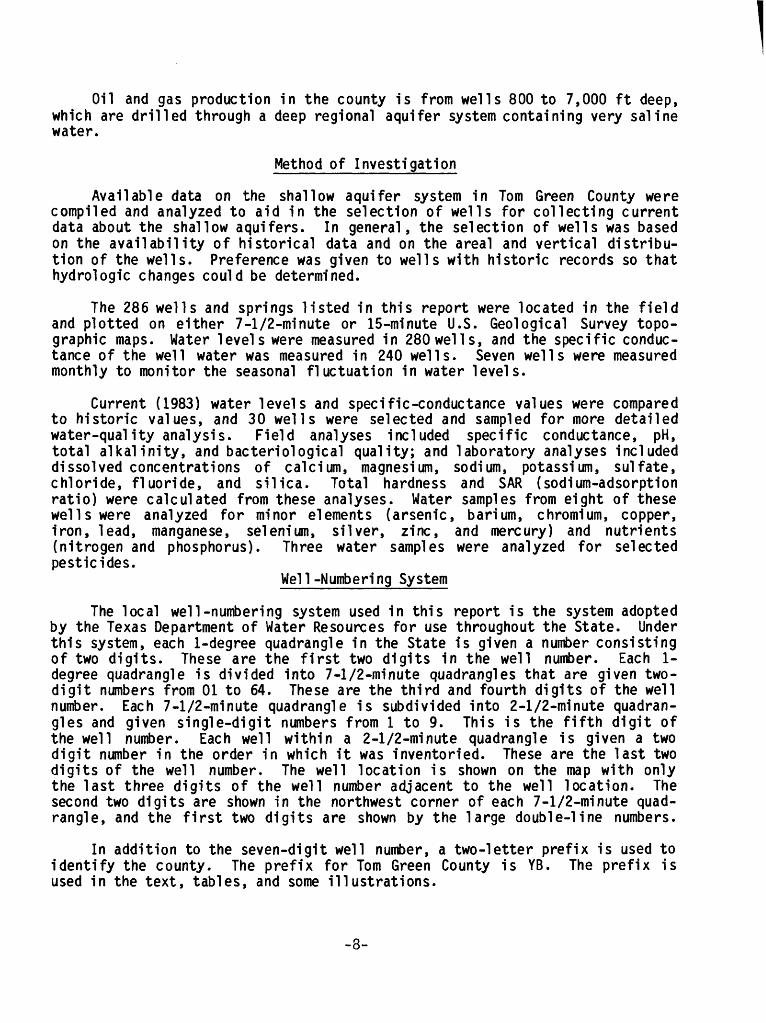
Oil and gas production in the county is from wells 800 to 7,000 ft deep, which are drilled through a deep regional aquifer system containing very saline water.
Method of Investigation
Available data on the shallow aquifer system in Tom Green County were compiled and analyzed to aid in the selection of wells for collecting current data about the shallow aquifers. In general, the selection of wells was based on the availability of historical data and on the areal and vertical distribu tion of the wells. Preference was given to wells with historic records so that hydrologic changes could be determined.
The 286 wells and springs listed in this report were located in the field and plotted on either 7-1/2-minute or 15-minute U.S. Geological Survey topo graphic maps. Water levels were measured in 280 wells, and the specific conduc tance of the well water was measured in 240 wells. Seven wells were measured monthly to monitor the seasonal fluctuation in water levels.
Current (1983) water levels and specific-conductance values were compared to historic values, and 30 wells were selected and sampled for more detailed water-quality analysis. Field analyses included specific conductance, pH, total alkalinity, and bacteriological quality; and laboratory analyses included dissolved concentrations of calcium, magnesium, sodium, potassium, sulfate, chloride, fluoride, and silica. Total hardness and SAR (sodium-adsorption ratio) were calculated from these analyses. Water samples from eight of these wells were analyzed for minor elements (arsenic, barium, chromium, copper, iron, lead, manganese, selenium, silver, zinc, and mercury) and nutrients (nitrogen and phosphorus). Three water samples were analyzed for selected pesticides.
Well-Numbering System
The local well-numbering system used in this report is the system adopted by the Texas Department of Water Resources for use throughout the State. Under this system, each 1-degree quadrangle in the State is given a number consisting of two digits. These are the first two digits in the well number. Each 1- degree quadrangle is divided into 7-1/2-minute quadrangles that are given two- digit numbers from 01 to 64. These are the third and fourth digits of the well number. Each 7-1/2-minute quadrangle is subdivided into 2-1/2-minute quadran gles and given single-digit numbers from 1 to 9. This is the fifth digit of the well number. Each well within a 2-1/2-minute quadrangle is given a two digit number in the order in which it was inventoried. These are the last two digits of the well number. The well location is shown on the map with only the last three digits of the well number adjacent to the well location. The second two digits are shown in the northwest corner of each 7-1/2-minute quad rangle, and the first two digits are shown by the large double-line numbers.
In addition to the seven-digit well number, a two-letter prefix is used to identify the county. The prefix for Tom Green County is YB. The prefix is used in the text, tables, and some illustrations.
-8-
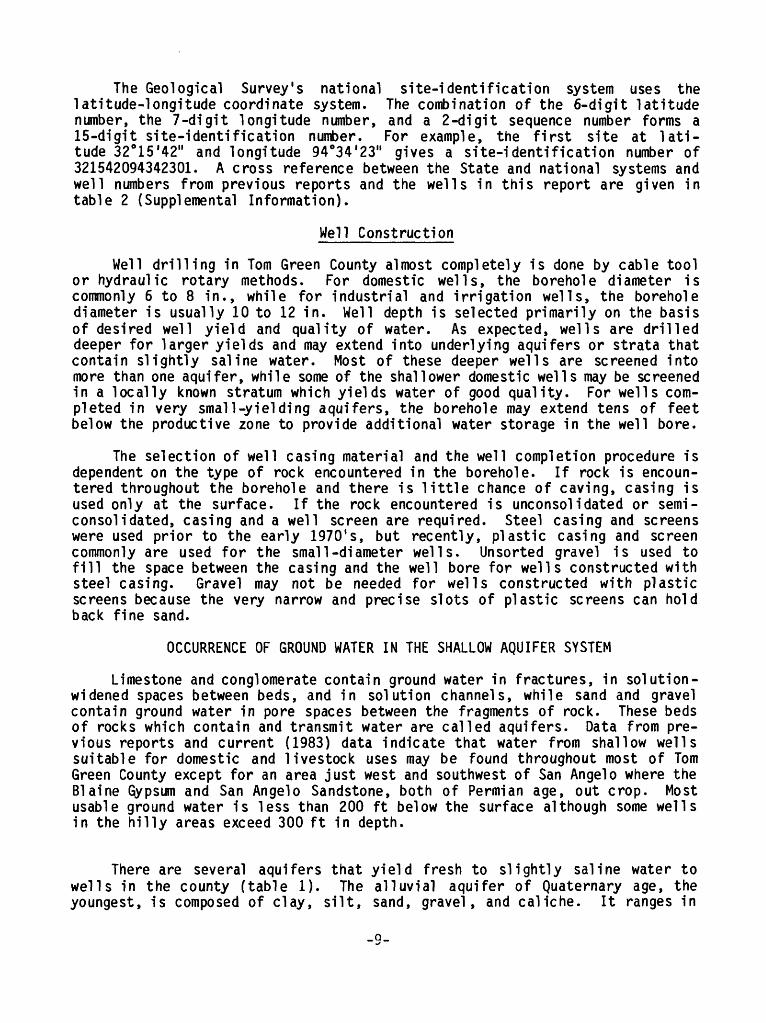
The Geological Survey's national site-identification system uses the latitude-longitude coordinate system. The combination of the 6-digit latitude number, the 7-digit longitude number, and a 2-digit sequence number forms a 15-digit site-identification number. For example, the first site at lati tude 32°15'42" and longitude 94°34'23" gives a site-identification number of 321542094342301. A cross reference between the State and national systems and well numbers from previous reports and the wells in this report are given in table 2 (Supplemental Information).
Well Construction
Well drilling in Tom Green County almost completely is done by cable tool or hydraulic rotary methods. For domestic wells, the borehole diameter is commonly 6 to 8 in., while for industrial and irrigation wells, the borehole diameter is usually 10 to 12 in. Well depth is selected primarily on the basis of desired well yield and quality of water. As expected, wells are drilled deeper for larger yields and may extend into underlying aquifers or strata that contain slightly saline water. Most of these deeper wells are screened into more than one aquifer, while some of the shallower domestic wells may be screened in a locally known stratum which yields water of good quality. For wells com pleted in very small-yielding aquifers, the borehole may extend tens of feet below the productive zone to provide additional water storage in the well bore.
The selection of well casing material and the well completion procedure is dependent on the type of rock encountered in the borehole. If rock is encoun tered throughout the borehole and there is little chance of caving, casing is used only at the surface. If the rock encountered is unconsolidated or semi- consolidated, casing and a well screen are required. Steel casing and screens were used prior to the early 1970's, but recently, plastic casing and screen commonly are used for the small-diameter wells. Unsorted gravel is used to fill the space between the casing and the well bore for wells constructed with steel casing. Gravel may not be needed for wells constructed with plastic screens because the very narrow and precise slots of plastic screens can hold back fine sand.
OCCURRENCE OF GROUND WATER IN THE SHALLOW AQUIFER SYSTEM
Limestone and conglomerate contain ground water in fractures, in solution- widened spaces between beds, and in solution channels, while sand and gravel contain ground water in pore spaces between the fragments of rock. These beds of rocks which contain and transmit water are called aquifers. Data from pre vious reports and current (1983) data indicate that water from shallow wells suitable for domestic and livestock uses may be found throughout most of Tom Green County except for an area just west and southwest of San Angelo where the Blaine Gypsum and San Angelo Sandstone, both of Permian age, out crop. Most usable ground water is less than 200 ft below the surface although some wells in the hilly areas exceed 300 ft in depth.
There are several aquifers that yield fresh to slightly saline water to wells in the county (table 1). The alluvial aquifer of Quaternary age, the youngest, is composed of clay, silt, sand, gravel, and caliche. It ranges in
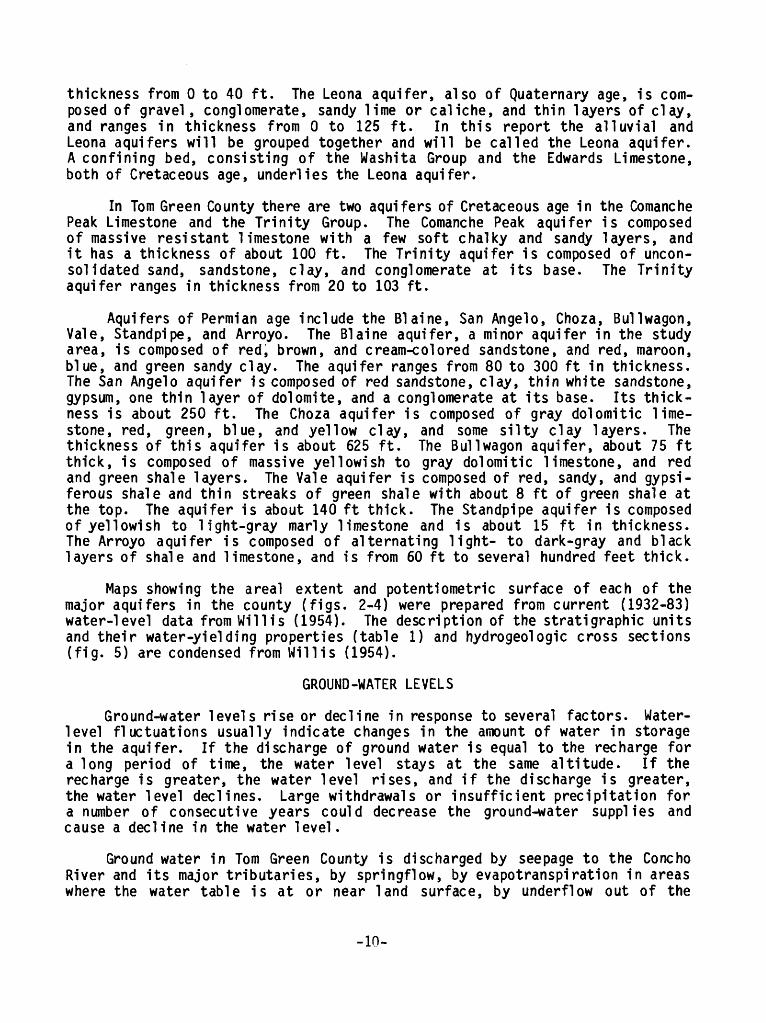
thickness from 0 to 40 ft. The Leona aquifer, also of Quaternary age, is com posed of gravel, conglomerate, sandy lime or caliche, and thin layers of clay, and ranges in thickness from 0 to 125 ft. In this report the alluvial and Leona aquifers will be grouped together and will be called the Leona aquifer. A confining bed, consisting of the Washita Group and the Edwards Limestone, both of Cretaceous age, underlies the Leona aquifer.
In Tom Green County there are two aquifers of Cretaceous age in the Comanche Peak Limestone and the Trinity Group. The Comanche Peak aquifer is composed of massive resistant limestone with a few soft chalky and sandy layers, and it has a thickness of about 100 ft. The Trinity aquifer is composed of uncon- solidated sand, sandstone, clay, and conglomerate at its base. The Trinity aquifer ranges in thickness from 20 to 103 ft.
Aquifers of Permian age include the Blaine, San Angelo, Choza, Bullwagon, Vale, Standpipe, and Arroyo. The Blaine aquifer, a minor aquifer in the study area, is composed of red, brown, and cream-colored sandstone, and red, maroon, blue, and green sandy clay. The aquifer ranges from 80 to 300 ft in thickness. The San Angelo aquifer is composed of red sandstone, clay, thin white sandstone, gypsum, one thin layer of dolomite, and a conglomerate at its base. Its thick ness is about 250 ft. The Choza aquifer is composed of gray dolomitic lime stone, red, green, blue, and yellow clay, and some silty clay layers. The thickness of this aquifer is about 625 ft. The Bull wagon aquifer, about 75 ft thick, is composed of massive yellowish to gray dolomitic limestone, and red and green shale layers. The Vale aquifer is composed of red, sandy, and gypsi- ferous shale and thin streaks of green shale with about 8 ft of green shale at the top. The aquifer is about 140 ft thick. The Standpipe aquifer is composed of yellowish to light-gray marly limestone and is about 15 ft in thickness. The Arroyo aquifer is composed of alternating light- to dark-gray and black layers of shale and limestone, and is from 60 ft to several hundred feet thick.
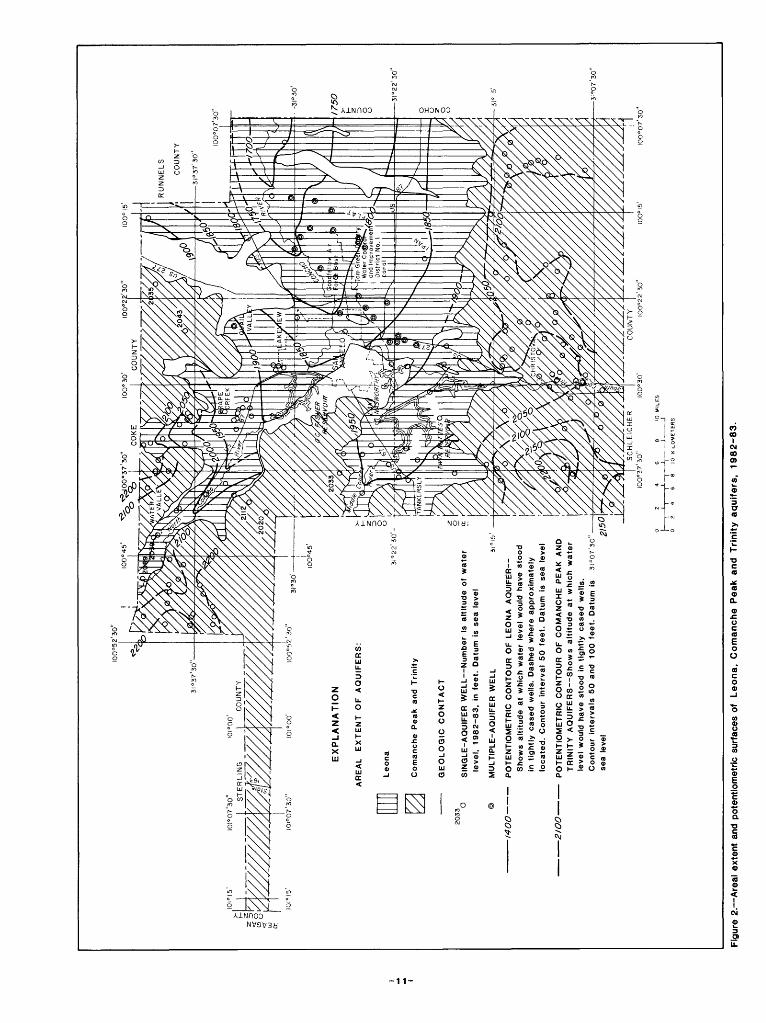
Maps showing the areal extent and potentiometric surface of each of the major aquifers in the county (figs. 2-4) were prepared from current (1932-83) water-level data fromWillis (1954). The description of the stratigraphic units and their water-yielding properties (table 1) and hydrogeologic cross sections (fig. 5) are condensed from Willis (1954).
GROUND-WATER LEVELS
Ground-water levels rise or decline in response to several factors. Water- level fluctuations usually indicate changes in the amount of water in storage in the aquifer. If the discharge of ground water is equal to the recharge for a long period of time, the water level stays at the same altitude. If the recharge is greater, the water level rises, and if the discharge is greater, the water level declines. Large withdrawals or insufficient precipitation for a number of consecutive years could decrease the ground-water supplies and cause a decline in the water level.
Ground water in Tom Green County is discharged by seepage to the Concho River and its major tributaries, by springflow, by evapotranspiration in areas where the water table is at or near land surface, by underflow out of the
-10-
I00"5
2'3
0"
EX
PL
AN
AT
ION
AR
EA
L
EX
TE
NT
O
F
AQ
UIF
ER
S:
-1400
-2IO
O-
SIN
GLE
-AQ
UIF
ER
WE
LL N
um
ber
is a
ltitu
de
of
wate
r
leve
l, 1982-8
3,
in f
eet. D
atu
m
is s
ea l
eve
l
MU
LT
IPL
E-A
QU
IFE
R
WE
LL
PO
TE
NT
IOM
ET
RIC
CO
NT
OU
R O
F L
EO
NA
A
QU
IFE
R
Show
s a
ltitu
de
at
whic
h w
ate
r le
vel
would
h
ave
sto
od
in
tig
htly c
ase
d w
ells
. D
ash
ed w
here
ap
pro
xim
ate
ly
loca
ted
. C
onto
ur
inte
rval
50 fe
et.
D
atu
m
is se
a le
vel
PO
TE
NT
IOM
ET
RIC
CO
NT
OU
R O
F
CO
MA
NC
HE
P
EA
K
AN
D
TR
INIT
Y A
QU
IFE
RS
Show
s altitude at
wh
ich
w
ate
r le
vel
would
have
sto
od
in
tig
htly cased w
ells
. C
onto
ur
inte
rvals
50
and
100 f
ee
t. D
atu
m i
s 3t°
07's
o'
sea l
evel
2
15
0
-i-.....
.....
I, i_
_i
Fig
ure
2. A
real
ext
ent
and
po
ten
tiom
etr
ic s
urfa
ces
of
Le
on
a,
Com
anch
e P
ea
k a
nd
T
rin
ity a
quifers
, 1982-8
3.
I00°5
2'3
0"
IOO
M5
'10
0° 3
7'3
0"
I00
022'3
0"
100°
15'
31°
30'
AR
EA
L
EX
TE
NT
OF
AQ
UIF
ER
S:
\|
SA
N A
NG
EL
O
CH
OZ
A S
ho
wn
in
fig
ure
4
|:-.:.
.yj
BU
LL
WA
GO
N
^3
VA
LE
L. ., I
-
GE
OL
OG
IC C
ON
TA
CT
Da
sh
ed
w
her
e ap
pro
xim
atel
y lo
cate
d
50
SIN
GL
E-A
QU
IFE
R W
EL
L N
um
ber
is a
ltit
ud
e of
wat
er
leve
l, 1982-8
3,
in f
eet.
Dat
um i
s se
a le
vel
©M
UL
TIP
LE
-AQ
UIF
ER
W
EL
L
-I7
OO
PO
TE
NT
IOM
ET
RIC
CO
NT
OU
R S
ho
ws
alti
tud
e at
w
hich
wat
er l
evel
wou
ld h
ave
sto
od
In
tig
htl
y ca
sed
wel
ls.
Das
hed
whe
re a
pp
roxi
mat
ely
loca
ted
. C
onto
ur i
nter
val
50 f
eet.
Dat
um i
s se
a le
vel
3I°
07
'30
"
IOO
°I5'
I00"0
7'3
0"
0
1 4
6
9
10
KIL
OM
ET
ER
S
Figu
re 3
. A
rea
l ex
ten
t an
d p
ote
nti
om
etri
c su
rfac
es o
f S
an A
ng
elo
, B
ullw
ago
n a
nd V
ale
aqu
ifer
s,
1982-8
3.

RU
NN
EL
S
CO
UN
TY
3i°3
7'30
"
IOO
°07'
JO"
iOI°
07'3
0" ST
ER
LIN
G
IOI°
d7 '3
0"
EX
PL
AN
AT
ION
AR
EA
L
EX
TE
NT
O
F
AQ
UIF
ER
S:
[JJJ
J C
HO
ZA
sfe
wl
BU
LL
WA
GO
N S
ho
wn
in
figure
3
sJHO
vyft
VA
LE
Sh
ow
n
in fig
ure
3
[\\^
S
TA
ND
PIP
E
Y/\
AR
RO
YO
-
GE
OLO
GIC
CO
NT
AC
T D
ash
ed
where
a
pp
roxim
ste
ly lo
ca
ted
O
SIN
GLE
-AQ
UIF
ER
W
ELL
©
MU
LT
IPLE
-AQ
UIF
ER
W
ELL
-I8
5O
PO
TE
NT
IOM
ET
RIC
C
ON
TO
UR
Sh
ow
s a
ltitu
de
at
whic
h w
ate
r le
vel
would
have
sto
od
in
tig
htly
case
d w
ells
. D
ash
ed w
here
appro
xim
ate
ly l
oca
ted.
Conto
ur
inte
rva
l 50 f
eet. D
atu
m i
s se
a le
vel
100"
15'
|_I_
iT_
ra_r
_L_
__
.0
24
6
8 10
K
ILO
ME
TE
RS
iOO
°07'
3Q"
Fig
ure
4. A
real
exte
nt
and p
ote
ntio
me
tric
surf
ace
s of
Ch
oza
, S
tan
dp
ipe
and A
rroyo aquifers
, 1982-8
3.
Dat
um i
s se
a le
vel
0
I 2
3 4
5 K
ILO
ME
TE
RS
Mod
ified
fro
m S
tate
of
Texa
s B
oard
of
Wat
er E
ngin
eers
, B
ulle
tin 5
411,
Sep
tem
ber
1954
Figu
re 5
. Hyd
roge
oiog
ic s
ecti
ons
show
ing
stru
ctur
e of
wat
er-b
eari
ng f
orm
atio
ns.
county, and by pumpage from wells. Nearly all of the irrigation wells in the county are completed in the Leona, Choza, or Bull wagon aquifers, and are located along the river valleys or in Li pan Flat.
Recharge to the shallow aquifer system is almost totally dependent on local precipitation in the county; a small volume of underflow enters the county from the north, south, and west. Some recharge occurs in Li pan Flat through seepage from the Tom Green County Water Control and Improvement District No. 1 Canal when there is sufficient water in Twin Buttes Reservoir for irriga tion (fig. 1). Also, excess irrigation water applied to crops will recharge the shallow aquifers through percolation. Additional recharge by seepage is believed to occur beneath the three reservoirs near San Angelo.
Current (1983) Conditions
Water levels in a representative number of wells (fig. 6) were measured from August 1982 through September 1983, and are listed in table 3 (Supplemental Information). The land-surface altitude at each well was estimated from 7.5- or 15-minute quadrangle maps, and the altitude of the water level was calculated from this datum. The water-level surfaces are highest in the hilly remnants of the Edwards Plateau and lowest along the Concho River and its tributaries (figs. 2-4).
Water levels in each aquifer generally are higher than in the underlying aquifers, indicating a downward flow. Along stretches of the Concho River, however, the head increases with depth and the flow is upward. This is expected because the Concho River is a discharge point for all the aquifers in the river valley. In the central and eastern part of the county, aquifers of Cretaceous and Permian age underlie the Leona aquifer (fig. 5) and are hydraulically inter connected. Water levels in the Comanche Peak and Trinity aquifers are similar and were contoured together (fig. 2), as were water levels in the Bull wagon and Vale aquifers (fig. 3), and in the Standpipe and Arroyo aquifers (fig. 4).
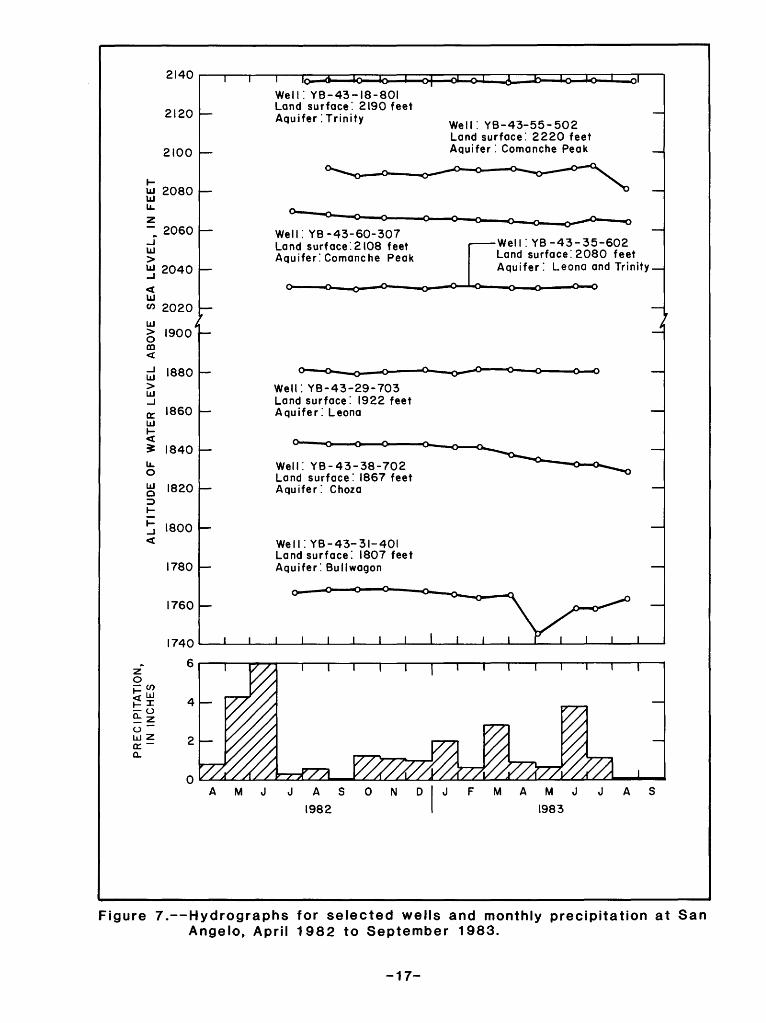
Because water-level measurements used to prepare the potentiometric-surface maps were collected over a 1-year period, the maps should be considered to represent a generalized surface. Short-term hydrographs (fig. 7) for selected wells measured during 1982-83 show no changes, slight changes, and changes of as much as 20 ft in water levels. Some of these selected wells are located in Lipan Flat, an area of extensive irrigation; the water levels in only a few wells were measured during periods of irrigation pumpage.
Historical Changes
Water-level changes over the last 30 to 40 years can be attributed to a number of factors such as different precipitation and pumping patterns, the construction of the Tom Green County Water Control and Improvement District No. 1 Canal, the formation of the Millersview-Doole Rural Water System, and changes in well construction after collapse or deterioration of casing. Errors in well identification or measurement also can result in apparent water-level change. Construction of the District No. 1 Canal allowed surface water to be brought to farms, thus farmers could substantially reduce or discontinue ground- water withdrawals for irrigation. Seepage from the canal and deep percolation
-15-
iOO
"52'
30"
JK
r
1982-8
3 R
EC
OR
DS
1982-8
3 A
ND
HIS
TO
RIC
R
EC
OR
DS
L
ON
G-T
ER
M H
YD
RG
RA
PH
Fig
ure
8
SH
OR
T-T
ER
M H
YD
RO
GR
AP
H F
igu
re 7
S
PR
ING
LA
ST
T
HR
EE
D
IGIT
S
OF
S
TA
TE
W
EL
L-N
UM
BE
RIN
G
SY
ST
EM
iOO
"07
'30
"
h-i-H
8
10
KIL
OM
ET
ER
S
Figu
re 6
. L
ocati
on
of
wel
ls a
nd s
prin
gs w
her
e w
ater
lev
els
wer
e m
easu
red
, A
pril
1982
to
Sep
tem
ber
1983
.
(D I>
I
3
«<
<Q
Q.
(D
-i
> T3
"O-^
3-
=: t
o_!.
-h
(O
Ooo
"
ro t
o (D^*
O
(D
CO
*+(D
<D
-D
Q.
^* (D
^
3
<D
CT =
(D
CO 0
-*
3co
a SB 1 O 3 CD
O 6
'S-
"
0> *+ o 3 0> ^* CO 0> 3
PR
EC
IPIT
AT
ION
, IN
IN
CH
ES
ALT
ITU
DE
O
F
WA
TE
R
LE
VE
L
AB
OV
E
SE
A LE
VE
L,
IN
FE
ET
co
ro
O
coco
en
o
co
co
o
roto
o
o
roo
o
ro
oro
o
o
o
ro co
o
ro o
o
ro ro
o
ro
I I
-i
CD
Oco
.,-»
c -
< -
i O3
I I
of excess irrigation water also provided recharge to the shallow aquifers. Likewise, the Millersview-Doole Rural Water System, which provides drinking water to rural residents, has resulted in a decrease in ground-water withdrawals for domestic use.
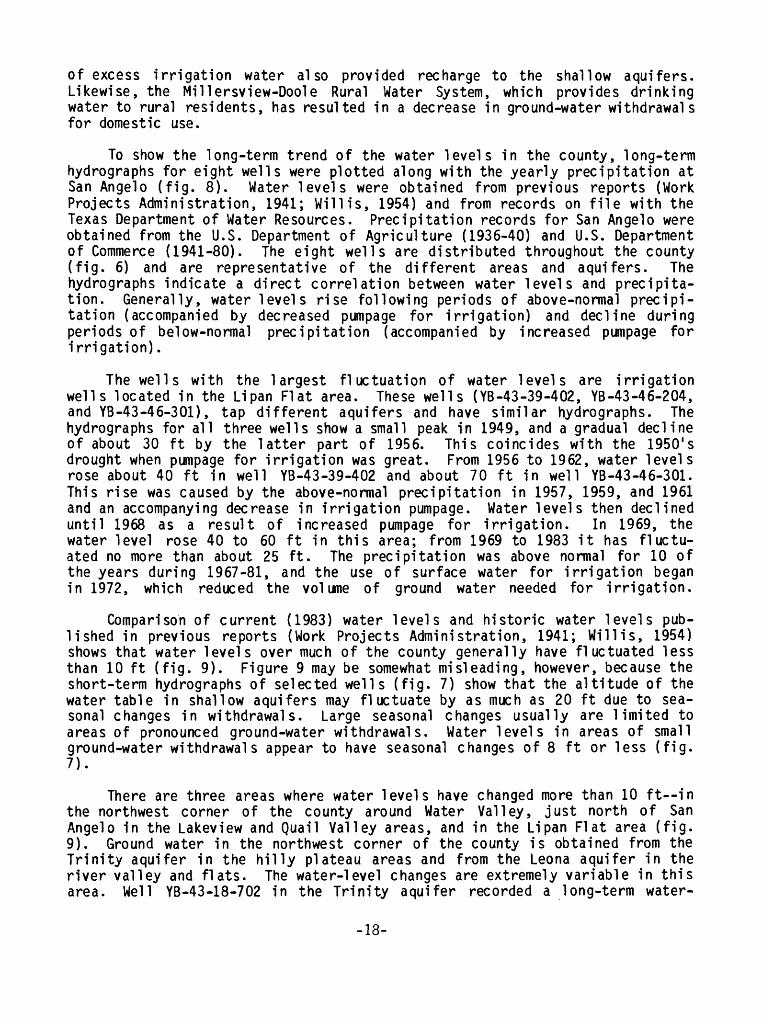
To show the long-term trend of the water levels in the county, long-term hydrographs for eight wells were plotted along with the yearly precipitation at San Angelo (fig. 8). Water levels were obtained from previous reports (Work Projects Administration, 1941; Will is, 1954) and from records on file with the Texas Department of Water Resources. Precipitation records for San Angelo were obtained from the U.S. Department of Agriculture (1936-40) and U.S. Department of Commerce (1941-80). The eight wells are distributed throughout the county (fig. 6) and are representative of the different areas and aquifers. The hydrographs indicate a direct correlation between water levels and precipita tion. Generally, water levels rise following periods of above-normal precipi tation (accompanied by decreased pumpage for irrigation) and decline during periods of below-normal precipitation (accompanied by increased pumpage for irrigation).
The wells with the largest fluctuation of water levels are irrigation wells located in the Lipan Flat area. These wells (YB-43-39-402, YB-43-46-204, and YB-43-46-301), tap different aquifers and have similar hydrographs. The hydrographs for all three wells show a small peak in 1949, and a gradual decline of about 30 ft by the latter part of 1956. This coincides with the 1950's drought when pumpage for irrigation was great. From 1956 to 1962, water levels rose about 40 ft in well YB-43-39-402 and about 70 ft in well YB-43-46-301. This rise was caused by the above-normal precipitation in 1957, 1959, and 1961 and an accompanying decrease in irrigation pumpage. Water levels then declined until 1968 as a result of increased pumpage for irrigation. In 1969, the water level rose 40 to 60 ft in this area; from 1969 to 1983 it has fluctu ated no more than about 25 ft. The precipitation was above normal for 10 of the years during 1967-81, and the use of surface water for irrigation began in 1972, which reduced the volume of ground water needed for irrigation.
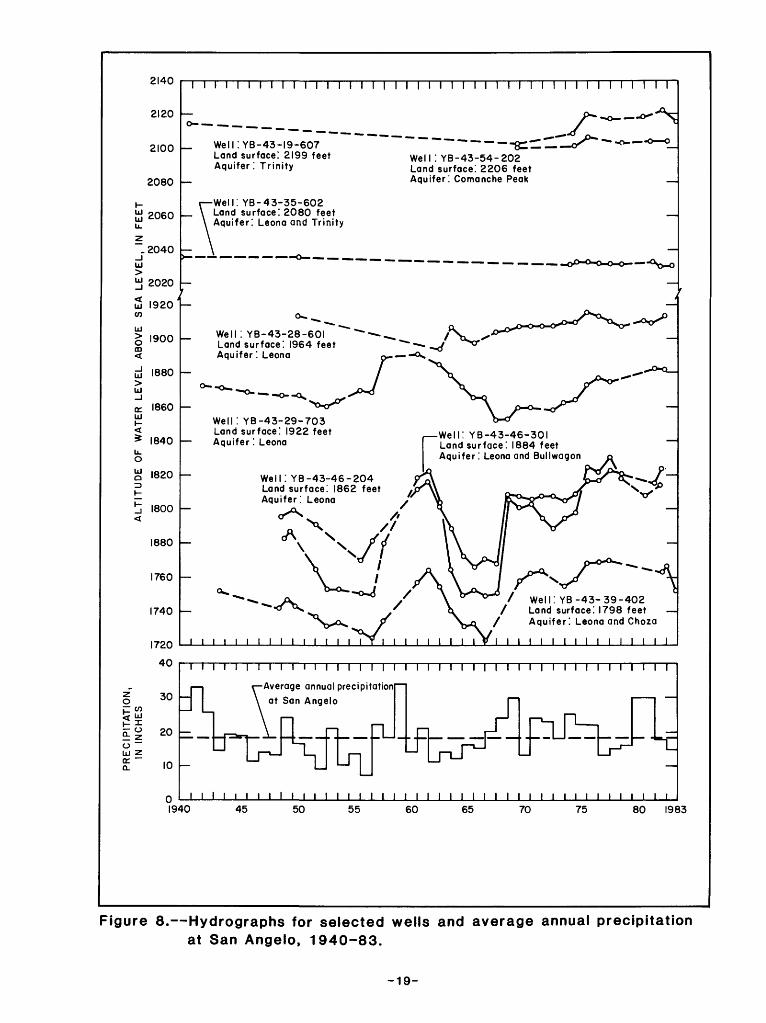
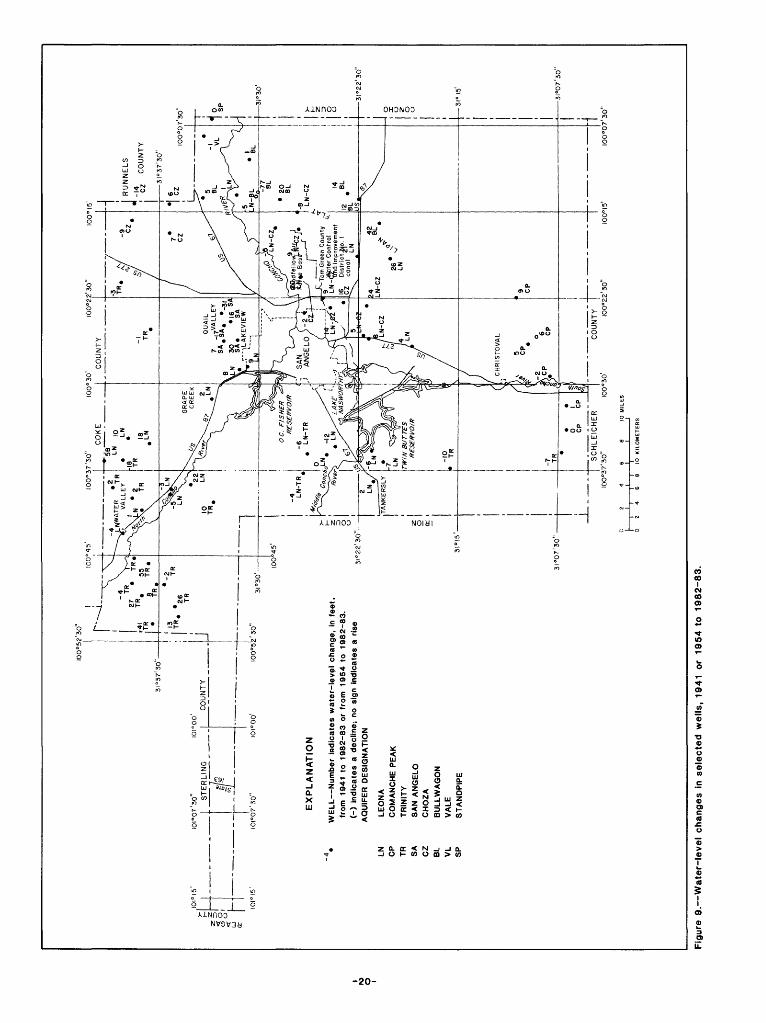
Comparison of current (1983) water levels and historic water levels pub lished in previous reports (Work Projects Administration, 1941; Will is, 1954) shows that water levels over much of the county generally have fluctuated less than 10 ft (fig. 9). Figure 9 may be somewhat misleading, however, because the short-term hydrographs of selected wells (fig. 7) show that the altitude of the water table in shallow aquifers may fluctuate by as much as 20 ft due to sea sonal changes in withdrawals. Large seasonal changes usually are limited to areas of pronounced ground-water withdrawals. Water levels in areas of small ground-water withdrawals appear to have seasonal changes of 8 ft or less (fig. 7).
There are three areas where water levels have changed more than 10 ft--in the northwest corner of the county around Water Valley, just north of San Angelo in the Lakeview and Quail Valley areas, and in the Lipan Flat area (fig. 9). Ground water in the northwest corner of the county is obtained from the Trinity aquifer in the hilly plateau areas and from the Leona aquifer in the river valley and flats. The water-level changes are extremely variable in this area. Well YB-43-18-702 in the Trinity aquifer recorded a long-term water-
-18-
2140
2120
2100
2080
ij 2060j.z .2040
UJ>y 2020
uj 1920CO
UJ
1900
1880
I860
1840
1800
1880
1760
1740
1720
40
20
10
Well!YB-43-l9-607 Land surface! 2199 feet Aquifer '. Trinity
Well! YB-43-35-602 Land surface! 2080 feet Aquifer! Leona and Trinity
-8=:Well ! YB-43-54-202 Land surface! 2206 feet Aquifer! Comanche Peak
Well! YB-43-28-60I Land surface! I964 feet Aquifer! Leona
Well ! YB-43-29-703 Land surface! 1922 feet Aquifer! Leona
Well! YB-43-46-301 Land surface! 1884 feet Aquifer! Leona and Bullwagon
Well! YB-43-46-204 Land surface! 1862 feet Aquifer! Leona
1^/ Well! YB-43-39-402
/ Land surface! 1798 feet/ Aquifer! Leona and Choza
-Average annual precipitation
at San Angelo
1940I I I i I l I I I I I I I l I I I I I I I I I I I I I I I I I I I l l I l I l l I
45 50 55 60 65 70 75 80 1983
Figure 8. Hydrographs for selected wells and average annual precipitation at San Angelo, 1940-83.
-19-
!00°2
2'3
0"
07'3
0"
oh
-i
I
EX
PLA
NA
TIO
N
-4
WE
LL N
um
ber
ipd
ica
tes
wate
r-le
vel
cha
ng
e,
in f
eet,
from
19
41
to 1
98
2-8
3 o
r fr
om
1954 t
o 1982-8
3.
(-)
ind
ica
tes a
de
clin
e;
no s
ign
indic
ate
s a
rise
A
QU
IFE
R D
ES
IGN
AT
ION
LN
LEO
NA
CP
C
OM
AN
CH
E P
EA
KTR
T
RIN
ITY
SA
S
AN
AN
GE
LOC
Z
CH
OZ
AB
L B
ULL
WA
GO
NV
L V
ALE
SP
S
TA
ND
PIP
E
3I«
07'3
0"
6
8
IO
KIL
OM
ET
ER
S
Fig
ure
9
. W
ate
r-le
ve
l ch
an
ge
s in
se
lecte
d w
ells
, 1
94
1
or
1954 t
o 1
98
2-8
3.
level decline of 41 feet, while well YB-43-18-905, also in the Trinity, and well YB-43-20-405 in the Leona aquifer had water-level rises of 55 and 58 ft, respectively. Although well YB-43-18-702 (with a 41-ft decline) is located in an area of generally rising water levels, the long-term decline, or apparent decline, in water level may be caused either by some change in the well itself (collapsed casing, plugged slots in casing, etc.) or by an erroneous measurement of the water level. The uncharacteristic long-term rise in water level at well YB-43-18-905 (with a 55-ft rise) may be caused by a water-level measurement taken during a heavily-pumped period in July 1950, or by an erroneous measure ment. The long-term rise in water level at well YB-43-20-405 (a rise of 58 ft) probably is correct. This well was measured in 1969 by State personnel and indicated a water-level rise of 26 ft from the initial measurement in 1950. If these three wells are disregarded, long-term water-level changes in the area around Water Valley range from a decline of 18 ft to a rise of 27 ft. A slight rise in water levels is typical of the area for the period of record and proba bly is the result of infiltration of above-normal precipitation just prior to the 1982-83 measurements. Most of the wells in the northwest part of the county are used for domestic and livestock purposes; therefore, the pumpage is small.
Wells located in the area just north of San Angelo obtain water primarily from the San Angelo aquifer. Of the five wells with long-term water-level records in this area (fig. 9), two wells show large water-level rises, two wells have large water-level declines, and one well shows a slight water-level rise. The well yields in this area usually are very small (less than 5 gal/ min), and some wells in the area have gone dry during periods of little pre cipitation. Sufficient data are not available to explain these differences in water-level changes.
The third area with large long-term water-level changes is located in the Li pan Flat area. Li pan Flat is the major farming area in the county and has most of the irrigation wells. Wells in this area produce water from the Leona, Choza, Bullwagon, or a combination of these aquifers. In general, this area has had a long-term rise in water levels, and only a few isolated wells have had declines. Only well YB-43-31-703 has had a water-level decline of more than 10 ft. This well produces water from the northern part of the Bull wagon aquifer and has had a water-level decline of 77 ft from 1948 to 1984. The water level declined 51 ft from 1948 to 1950 and then declined another 14 ft from 1950 to 1952. From 1952 to 1984 the water level declined only 12 ft. Well YB-43-46-301, located in the southern part of the Bullwagon aquifer, has had a rise of 42 ft, the largest rise in water levels in the Li pan Flat area. Water levels in well YB-43-46-301 and other wells located in areas of intensive pumpage for irrigation fluctuate greatly from wet years to dry years when irrigation demands are greater (fig. 8). If both wells mentioned above are discounted, there has been an average water-level rise of about 11 ft in the Li pan Flat area. This rise may be the result of a number of factors:
1. Below-normal precipitation resulted in more irrigation pumpage in the early 1950's than during 1982-83.
2. Surface water diverted into the area by the Tom Green County Water Control and Improvement District No. 1 Canal has caused less ground water to be used for irrigation. Since 1972, about 19,000 acre-ft of water per year has been provided to the District, which receives water from Twin Buttes Reservoir.
-21-
3. Irrigation water from Tom Green County Water Control and Improvement District No. 1 Canal and seepage from the canal provided increased recharge to the aquifer.
4. The Millerview-Doole Rural Water System, which obtains water from deep wells located east of Tom Green County, began supplying water for domestic and livestock uses throughout much of the area. Use of this imported water reduced the ground-water withdrawals from the shallow aquifers in the area.
GROUND-WATER QUALITY
Large variations occur in the chemical quality of ground water in Tom Green County. These variations are caused partly by the mineral composition of the geologic materials forming the different aquifers, but waters from the same aquifer also can have differing chemical qualities. To allow the reader to readily compare the quality of water found in the aquifers, public water-supply maximum contaminant levels established by the U.S. Environmental Protection Agency (1976; 1977a) for selected constituents and properties are provided in tables 4 and 5 (Supplemental Information). The location of the wells and springs which were sampled are shown in figure 6.
Current (1983) Conditions
To indicate the current (1983) ground-water-quality conditions in Tom Green County, the following measurements and laboratory determinations were made:
1. Specific conductance and dissolved-solids concentrations were deter mined in the field for 236 wells and 4 springs (table 6, Supplemental Infor mation).
2. Water samples for 46 wells were tested for bacteriological quality (fecal and fecal-streptococci coli forms) as an indication of possible septic pollution throughout the county (table 7, Supplemental Information). Twelve of the wells were in urban areas that had no central sewer systems and were served by septic systems.
3. Thirty wells were sampled for more detailed analysis (table 7). They were selected on the basis of comparisons between historic water-quality data and current (1983) water-quality data. Field and laboratory analyses included specific conductance, pH, total alkalinity, and bacteriological quality on all samples. U.S. Geological Survey laboratory analyses included: Dissolved con centrations of calcium, magnesium, sodium, potassium, chloride, fluoride, sul- fate, and silica on all 30 samples; arsenic, barium, cadmium, chromium, copper, iron, lead, manganese, mercury, selenium, silver, zinc, nitrogen, and phosphorus for 8 samples; and selected insecticides for 3 samples.
Di ssolved-Soli ds Concentrations
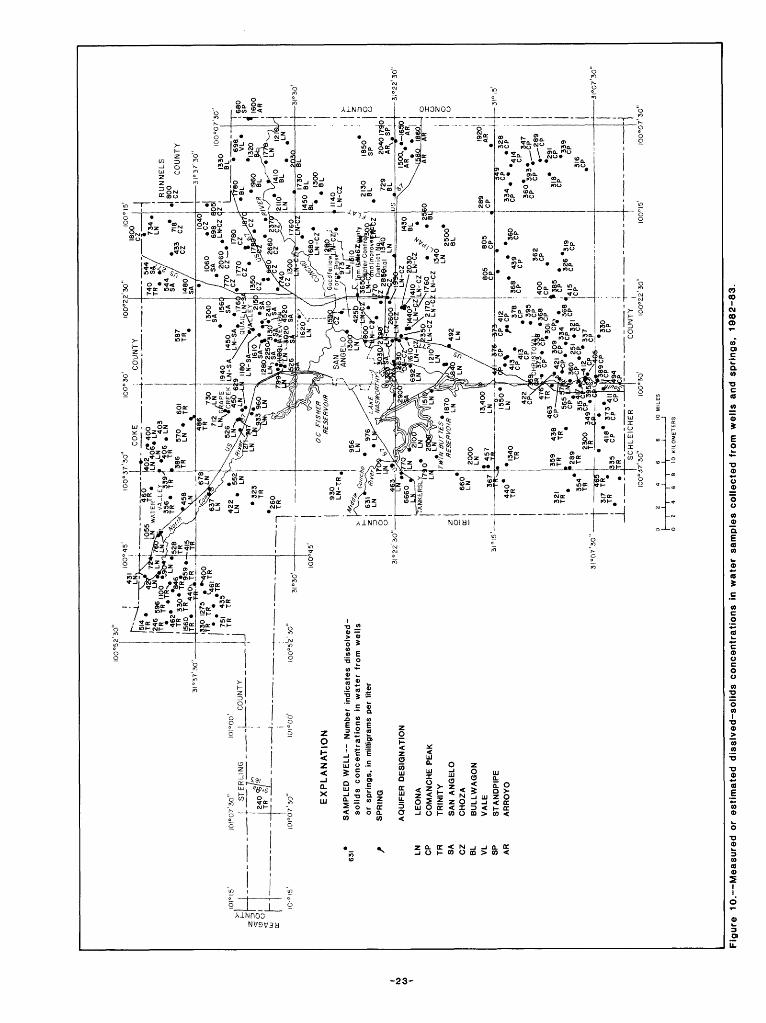
Di ssolved-solids concentrations are widely used in describing water qual ity and comparing water types. The distribution of measured or estimated dissolved-solids concentrations for wells and springs in Tom Green County is shown in figure 10. Dissolved-solids concentrations were measured in the laboratory analyses (table 7A) for samples collected from selected wells. For the remainder of the wells, the dissolved-solids concentrations were estimated
-22-
I00
°52
'50
"10
0° 5
0'IO
O°2
2'3G
"
SA
MP
LE
D W
EL
L
Nu
mb
er
ind
icat
es d
isso
lved
-
so
lid
s
co
nc
eri
tra
tio
ns
in
w
ate
r fr
om
w
ells
or
spri
ng
s, i
n m
illig
ram
s p
er l
iter
SP
RIN
G
AQ
UIF
ER
DE
SIG
NA
TIO
N
LEO
NA
CO
MA
NC
HE
PE
AK
TR
INIT
YS
AN
AN
GE
LO
CH
OZ
AB
UL
LW
AG
ON
VA
LE
ST
AN
DP
IPE
AR
RO
YO
1335
J .
I S
CH
LE
ICH
ER
I0
0°i
7'3
0"
S
10
K
ILO
ME
TE
RS
Fig
ure
1
0.
Me
as
ure
d o
r es
tim
ated
d
issl
ved
-so
lids
con
cen
trat
ion
s in
wa
ter
sam
ple
s co
llect
ed
from
wel
ls a
nd s
pri
ng
s,
1982-8
3.
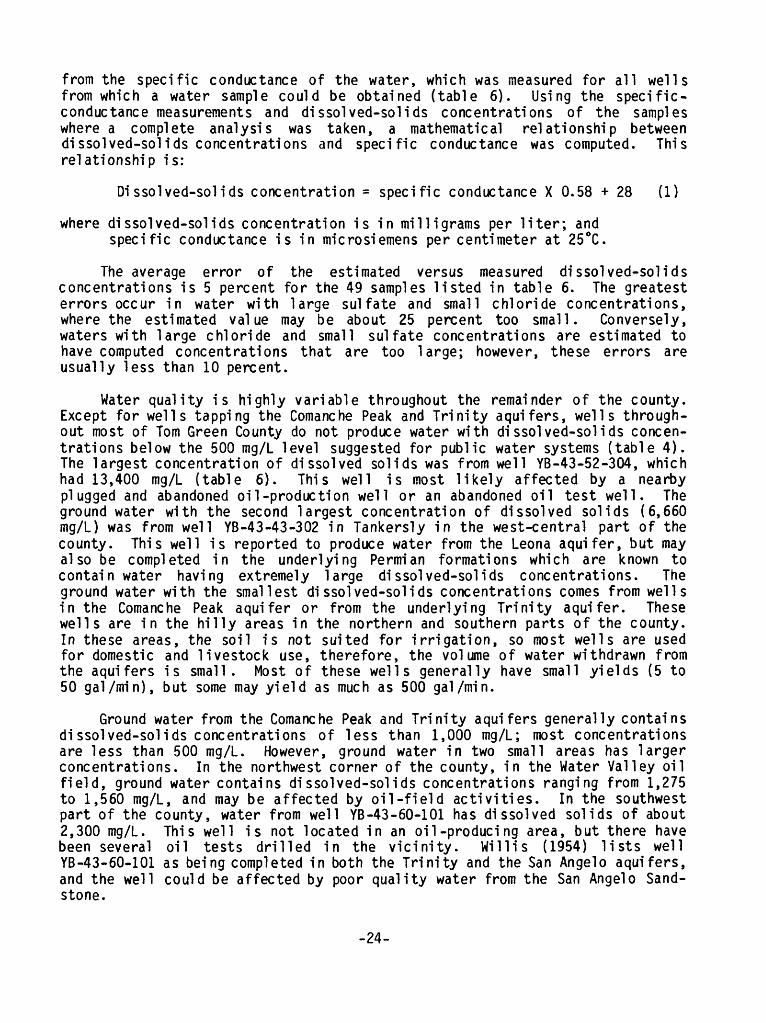
from the specific conductance of the water, which was measured for all wells from which a water sample could be obtained (table 6). Using the specific- conductance measurements and dissolved-solids concentrations of the samples where a complete analysis was taken, a mathematical relationship between dissolved-solids concentrations and specific conductance was computed. This relationship is:
Di ssolved-solids concentration = specific conductance X 0.58 + 28 (1)
where dissolved-solids concentration is in milligrams per liter; and specific conductance is in microsiemens per centimeter at 25°C.
The average error of the estimated versus measured dissolved-solids concentrations is 5 percent for the 49 samples listed in table 6. The greatest errors occur in water with large sul fate and small chloride concentrations, where the estimated value may be about 25 percent too small. Conversely, waters with large chloride and small sulfate concentrations are estimated to have computed concentrations that are too large; however, these errors are usually less than 10 percent.
Water quality is highly variable throughout the remainder of the county. Except for wells tapping the Comanche Peak and Trinity aquifers, wells through out most of Tom Green County do not produce water with dissolved-solids concen trations below the 500 mg/L level suggested for public water systems (table 4). The largest concentration of dissolved solids was from well YB-43-52-304, which had 13,400 mg/L (table 6). This well is most likely affected by a nearby plugged and abandoned oil-production well or an abandoned oil test well. The ground water with the second largest concentration of dissolved solids (6,660 mg/L) was from well YB-43-43-302 in Tankersly in the west-central part of the county. This well is reported to produce water from the Leona aquifer, but may also be completed in the underlying Permian formations which are known to contain water having extremely large dissolved-solids concentrations. The ground water with the smallest dissolved-solids concentrations comes from wells in the Comanche Peak aquifer or from the underlying Trinity aquifer. These wells are in the hilly areas in the northern and southern parts of the county. In these areas, the soil is not suited for irrigation, so most wells are used for domestic and livestock use, therefore, the volume of water withdrawn from the aquifers is small. Most of these wells generally have small yields (5 to 50 gal/min), but some may yield as much as 500 gal/min.
Ground water from the Comanche Peak and Trinity aquifers generally contains dissolved-solids concentrations of less than 1,000 mg/L; most concentrations are less than 500 mg/L. However, ground water in two small areas has larger concentrations. In the northwest corner of the county, in the Water Valley oil field, ground water contains dissolved-solids concentrations ranging from 1,275 to 1,560 mg/L, and may be affected by oil-field activities. In the southwest part of the county, water from well YB-43-60-101 has dissolved solids of about 2,300 mg/L. This well is not located in an oil-producing area, but there have been several oil tests drilled in the vicinity. Willis (1954) lists well YB-43-60-101 as being completed in both the Trinity and the San Angelo aquifers, and the well could be affected by poor quality water from the San Angel o Sand stone.
-24-
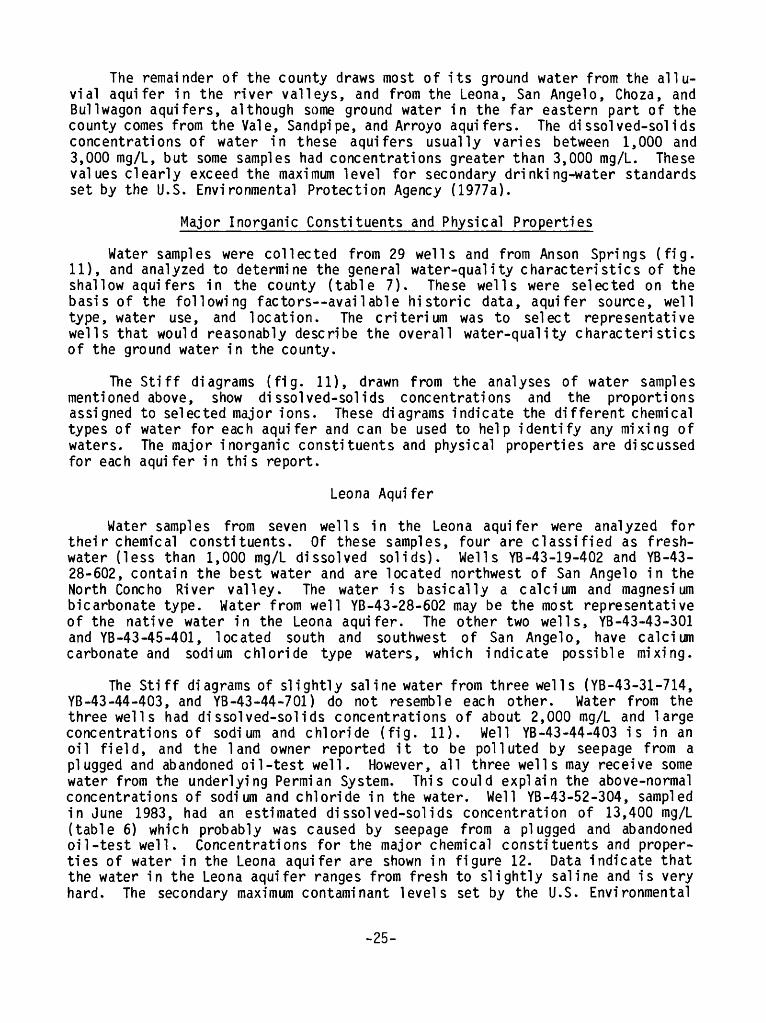
The remainder of the county draws most of its ground water from the allu vial aquifer in the river valleys, and from the Leona, San Angelo, Choza, and Bull wagon aquifers, although some ground water in the far eastern part of the county comes from the Vale, Sandpipe, and Arroyo aquifers. The dissolved-solids concentrations of water in these aquifers usually varies between 1,000 and 3,000 mg/L, but some samples had concentrations greater than 3,000 mg/L. These values clearly exceed the maximum level for secondary drinking-water standards set by the U.S. Environmental Protection Agency (1977a).
Major Inorganic Constituents and Physical Properties
Water samples were collected from 29 wells and from An son Springs (fig. 11), and analyzed to determine the general water-quality characteristics of the shallow aquifers in the county (table 7). These wells were selected on the basis of the following factors available historic data, aquifer source, well type, water use, and location. The criterium was to select representative wells that would reasonably describe the overall water-quality characteristics of the ground water in the county.
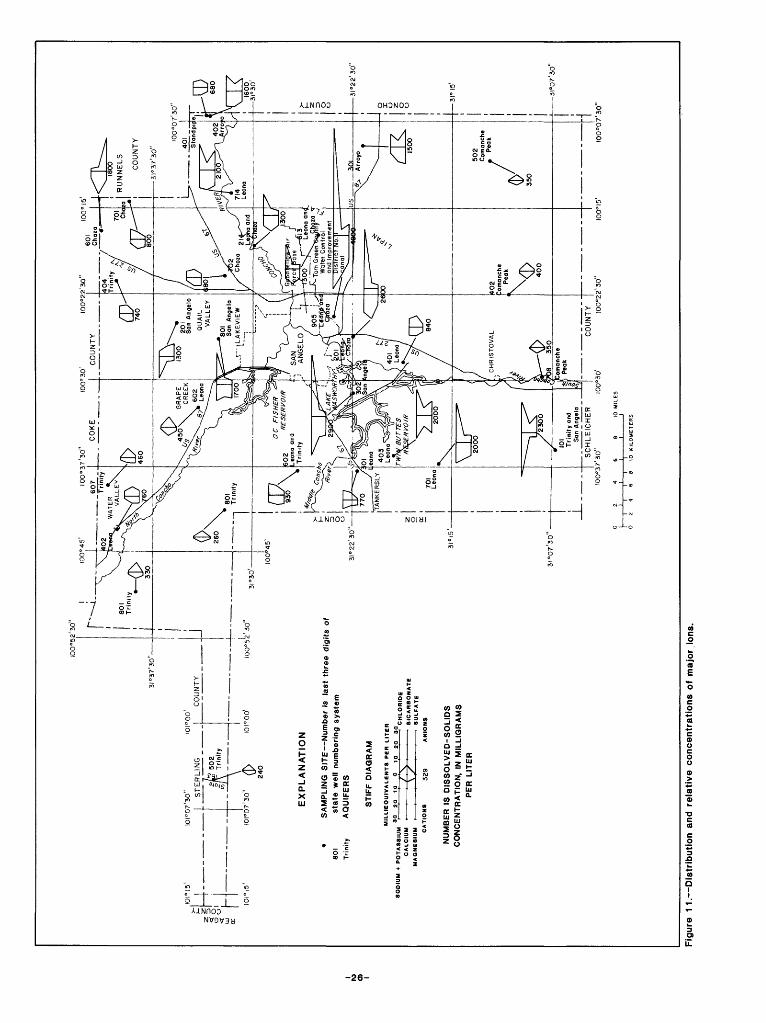
The Stiff diagrams (fig. 11), drawn from the analyses of water samples mentioned above, show dissolved-solids concentrations and the proportions assigned to selected major ions. These diagrams indicate the different chemical types of water for each aquifer and can be used to help identify any mixing of waters. The major inorganic constituents and physical properties are discussed for each aquifer in this report.
Leona Aquifer
Water samples from seven wells in the Leona aquifer were analyzed for their chemical constituents. Of these samples, four are classified as fresh water (less than 1,000 mg/L dissolved solids). Wells YB-43-19-402 and YB-43- 28-602, contain the best water and are located northwest of San Angelo in the North Concho River valley. The water is basically a calcium and magnesium bicarbonate type. Water from well YB-43-28-602 may be the most representative of the native water in the Leona aquifer. The other two wells, YB-43-43-301 and YB-43-45-401, located south and southwest of San Angelo, have calcium carbonate and sodium chloride type waters, which indicate possible mixing.
The Stiff diagrams of slightly saline water from three wells (YB-43-31-714, YB-43-44-403, and YB-43-44-701) do not resemble each other. Water from the three wells had dissol ved-solids concentrations of about 2,000 mg/L and large concentrations of sodium and chloride (fig. 11). Well YB-43-44-403 is in an oil field, and the land owner reported it to be polluted by seepage from a plugged and abandoned oil-test well. However, all three wells may receive some water from the underlying Permian System. This could explain the above-normal concentrations of sodium and chloride in the water. Well YB-43-52-304, sampled in June 1983, had an estimated dissolved-solids concentration of 13,400 mg/L (table 6) which probably was caused by seepage from a plugged and abandoned oil-test well. Concentrations for the major chemical constituents and proper ties of water in the Leona aquifer are shown in figure 12. Data indicate that the water in the Leona aquifer ranges from fresh to slightly saline and is very hard. The secondary maximum contaminant levels set by the U.S. Environmental
-25-
I00
°52
'30
"
ST
ER
LIN
G
3 A
? 502
Trinity
L _
___ _
____
CO
UN
TY
_
__
_J
\ 1
:
EX
PL
AN
AT
ION
S
AM
PLI
NG
SIT
E N
um
ber
is
last
thre
e d
igits o
f so
i sta
te w
ell
num
bering s
yste
mT
rinity
AQ
UIF
ER
S
ST
IFF
DIA
GR
AM
SO
DIU
M
+ P
OT
AS
SIU
M
CA
LC
IUM
MA
GN
ES
IUM
3o
2.0
10
a 10
20
30
CH
LO
RID
E
BIC
AR
BO
NA
TE
SU
LF
AT
E
CA
TIO
NS
3
29
NU
MB
ER
IS
DIS
SO
LV
ED
-SO
LID
SC
ON
CE
NT
RA
TIO
N.
IN
MIL
LIG
RA
MS
PE
R L
ITE
R
1HD
^j
68
0
fe
3I°
I5'-
_L
.
101
Tri
nit
y an
d Sa
n A
ngel
a
<?
0lo
nche
)
Pea
k
SC
HLE
ICH
ER
I0
0°3
7'3
0"
I00°
30'
0 2
4 6
8 10
M
ILE
SH
i
!i
l'
I 'l ' '
02
4
S 8
10
KIL
OM
ET
ER
S
J02 Pea
k ^<3>
CO
UN
TY I0
0°2
2'3
0"
502
Com
anch
e
Pea
k
V
100'
15'
I00°0
7'3
0"
Fig
ure
11. D
istr
ibution a
nd r
ela
tive
conce
ntr
atio
ns
of m
ajo
r io
ns.
CONCENTRATIONS, AQUIFER IN M|LLIGRAMS PER LITER
0 1000 2000 3000 4000 5000i i i
LEONA (LN) - *
LEONA & CHOZA (LN & CZ)~ - COMANCHE PEAK (CP) - *
TRINITY (TR) -% SAN ANGELO (SA) -
ARROYO (AR) - i i i
DISS
CONCENTRATIONS, IN MILLIGRAMS PER LITER 0 250 500 750 10(
r** I r
h
r- - i i i
>OLVED SOI
AQUIFER )0
LN LN & CZ
CP TR SA AR
.IDS
CONCENTRATIONS, IN MILLIGRAMS PER LITER 0 1000 2000 3000 4000
1 Mi
* ~
SODIUM AND POTASSIUM CHLORIDE
0 200 400 600 800 0 300 600 900 1200I 1 I
1 i 1
LN LN & CZ
CP TR SA AR
1 1
- »
1 1
1
-
1
CALCIUM SULFATE
0 100 200 300 400 0 1.0 2.0 3.0 4.0i I i
- *
-Alt
* i * i i
LN LN & CZ
CP TR SA AR
1 1
- I
1
MAGNESIUM FLUORIDE
0 600 1200 1800 2400 0 10 20 30 40l 1 1
I*
I -r
i i i
HARDNESS (as CaCO 3 )
LN LN & CZ
CP TR SA
AR1 1 1
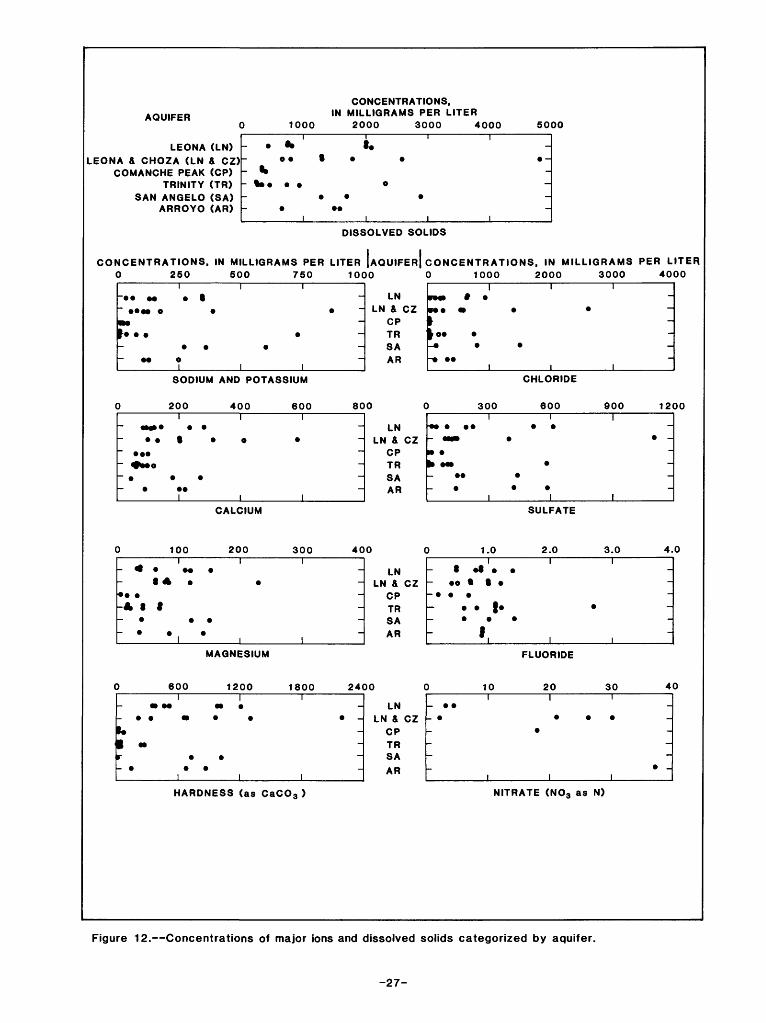
NITRATE (NO3 as N)
Figure 12. Concentrations of major ions and dissolved solids categorized by aquifer.
-27-

Protection Agency (table 4) for a public water system were exceeded in water samples from six wells for dissolved solids, from two wells for sulfate, and from four wells for chloride.
Leona and Choza and Choza Aquifers
Many of the wells in the Li pan Flat area penetrate both the Leona and Choza Formations and produce water with large dissolved-solids concentrations; these wells are included in the analyses of water samples from wells in the Choza aquifer. Drillers commonly screen most water-yielding sand layers to increase the well yield, and often the lower part of the Leona aquifer is screened along with the Choza aquifer.
Water samples from seven wells in the Leona and Choza and Choza aquifers were analyzed for their chemical constituents (table 7A). Water from only two of these wells (YB-43-23-701 and YB-43-30-702) have dissolved-solids concentra tions that are considered to be freshwater. The Stiff diagrams for these two wells (fig. 11) are similar; the major cations are calcium and magnesium in nearly equal proportions, the major anions are chloride and becarbonate in nearly equal proportions, and both have very little sodium or sulfate.
Well YB-43-22-601 in the northeast corner of the county is the only well in the Choza aquifer that had sulfate as the predominant anion. The well has a calcium sulfate type water with some sodium and magnesium and very little chlo ride or bicarbonate. This well is deep (238 ft) for this area of the county and is completed entirely in the Choza aquifer.
Two wells east of San Angelo (YB-43-38-214 and YB-43-38-613), one located near the Cone ho River and one located in the center of Li pan Flat, have almost identical Stiff diagrams and dissolved-solids concentrations (1,300 mg/L). The water is a calcium chloride type with large concentrations of sodium and magne sium and very little bicarbonate and sulfate.
The remaining two wells (YB-43-37-905 and YB-43-45-201) are located just southeast of San Angelo in an area that contains some of the largest dissolved- solids concentrations found in water wells during the study. Well YB-43-37-905 contains sodium chloride type water with large amounts of calcium and magnesium and very little bicarbonate and sulfate. The dissolved-solids concentration was 4,800 mg/L. Well YB-43-45-201 contains a calcium chloride type water with large concentrations of sodium and magnesium and very little bicarbonate and sulfate. The dissolved-solids concentration was 2,600 mg/L. Water from wells in the Leona and Choza and Leona aquifers ranges from fresh to moderately saline, is very hard, and exceeds the secondary maximum contaminant level set by the U.S. Environmental Protection Agency (table 4) for a public water system in two wells for sulfate, in five wells for chloride, and in three wells for nitrate (fig. 12).
Comanche Peak Aquifer
Water samples from Anson Springs and two wells in the Cornanche Peak aqui fer were analyzed for principal chemical constituents (fig. 12). Water from the Comanche Peak aquifer is similar to water from the Trinity aquifer. Stiff
-28-
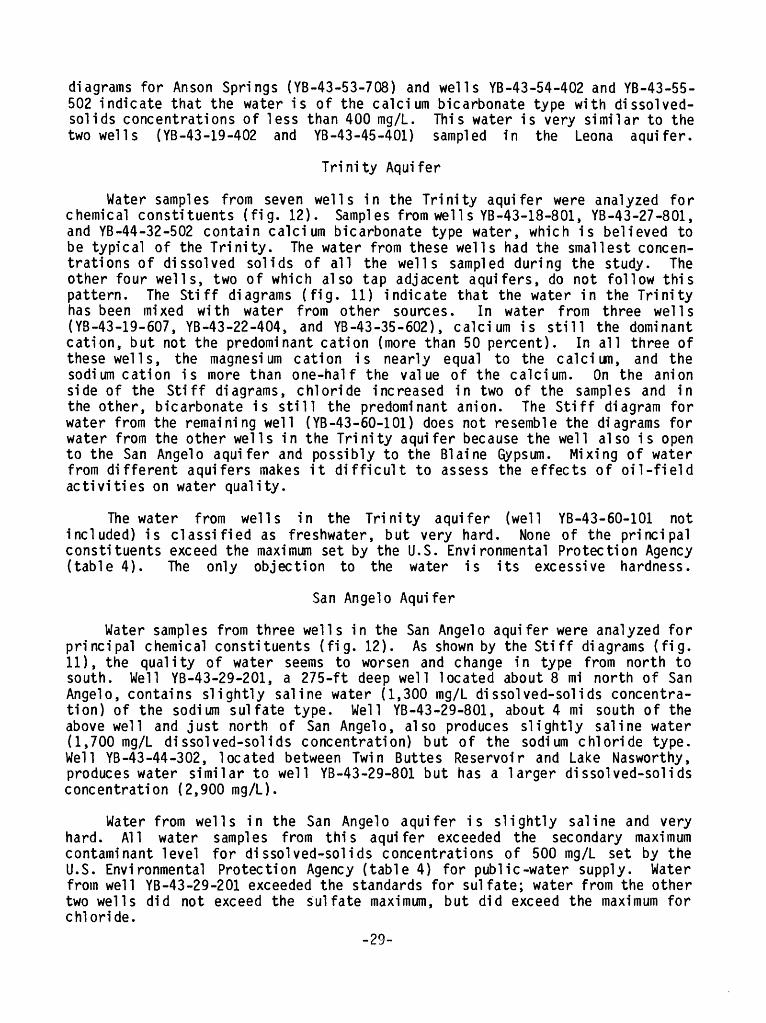
diagrams for Anson Springs (YB-43-53-708) and wells YB-43-54-402 and YB-43-55- 502 indicate that the water is of the calcium bicarbonate type with dissolved- solids concentrations of less than 400 mg/L. This water is very similar to the two wells (YB-43-19-402 and YB-43-45-401) sampled in the Leona aquifer.
Trinity Aquifer
Water samples from seven wells in the Trinity aquifer were analyzed for chemical constituents (fig. 12). Samples from well s YB-43-18-801, YB-43-27-801, and YB-44-32-502 contain calcium bicarbonate type water, which is believed to be typical of the Trinity. The water from these wells had the smallest concen trations of dissolved solids of all the wells sampled during the study. The other four wells, two of which also tap adjacent aquifers, do not follow this pattern. The Stiff diagrams (fig. 11) indicate that the water in the Trinity has been mixed with water from other sources. In water from three wells (YB-43-19-607, YB-43-22-404, and YB-43-35-602), calcium is still the dominant cation, but not the predominant cation (more than 50 percent). In all three of these wells, the magnesium cation is nearly equal to the calcium, and the sodium cation is more than one-half the value of the calcium. On the anion side of the Stiff diagrams, chloride increased in two of the samples and in the other, bicarbonate is still the predominant anion. The Stiff diagram for water from the remaining well (YB-43-60-101) does not resemble the diagrams for water from the other wells in the Trinity aquifer because the well also is open to the San Angelo aquifer and possibly to the Blaine Gypsum. Mixing of water from different aquifers makes it difficult to assess the effects of oil-field activities on water quality.
The water from wells in the Trinity aquifer (well YB-43-60-101 not included) is classified as freshwater, but very hard. None of the principal constituents exceed the maximum set by the U.S. Environmental Protection Agency (table 4). The only objection to the water is its excessive hardness.
San Angel o Aquifer
Water samples from three wells in the San Angel o aquifer were analyzed for principal chemical constituents (fig. 12). As shown by the Stiff diagrams (fig. 11), the quality of water seems to worsen and change in type from north to south. Well YB-43-29-201, a 275-ft deep well located about 8 mi north of San Angel o, contains slightly saline water (1,300 mg/L di ssolved-solids concentra tion) of the sodium sulfate type. Well YB-43-29-801, about 4 mi south of the above well and just north of San Angel o, also produces slightly saline water (1,700 mg/L di ssol ved-solids concentration) but of the sodium chloride type. Well YB-43-44-302, located between Twin Buttes Reservoir and Lake Nasworthy, produces water similar to well YB-43-29-801 but has a larger dissolved-solids concentration (2,900 mg/L).
Water from wells in the San Angel o aquifer is slightly saline and very hard. All water samples from this aquifer exceeded the secondary maximum contaminant level for dissolved-solids concentrations of 500 mg/L set by the U.S. Environmental Protection Agency (table 4) for public-water supply. Water from well YB-43-29-201 exceeded the standards for sulfate; water from the other two wells did not exceed the sulfate maximum, but did exceed the maximum for chloride.
-29-
Bull wagon and Vale Aquifers
Water samples from the Bull wagon and Vale aquifers were not collected for analysis of the principal chemical constituents. The Bullwagon Dolomite Mem ber of the Vale Formation, supplies water for many irrigation wells located west (downdip) of the outcrop in the eastern part of the county. The dissolved-solids concentrations computed from the specific conductance of water samples from 17 wells in the Bullwagon aquifer varied from 729 to 2,560 mg/L (table 6), which is similar to water from the Leona and Choza aquifers in the immediate area.
The other members of the Vale Formation yield little or no water. Only one well (YB-43-31-601) was inventoried and reported by Will is (1954) as draw ing water from a member of the Vale Formation other than the Bullwagon Dolomite Member. The small dissolved-solids concentrations (698 mg/L) of the water from this well indicates that the well may be misclassified and most likely is water from either the Leona or the Standpipe aquifers instead of the Vale aquifer.
Standpipe and Arroyo Aquifers
Water samples from three wells in the Standpipe and Arroyo aquifers were analyzed for their principal chemical constituents (fig. 12). Well YB-43-32-401 in the Standpipe aquifer yields freshwater (680 mg/L dissplved-solids concentra tion), with the principal cations being sodium and calcium in about equal pro portions; magnesium is about 50 percent less. The principal anions are bicar bonate and chloride in about equal proportions; sulfate is about 50 percent less. Well YB-43-32-402, which is about 300 ft south of the above well, is completed in the Arroyo aquifer. It yields more water, but of poorer quality. The well yields slightly saline water (1,600 mg/L dissolved-solids concentra tion), and the principal cations are sodium and calcium; magnesium is about 50 percent less. The principal anions are chloride and sulfate, with bicarbonate being somewhat less. The third well (YB-43-47-301) yields slightly saline water (1,500 mg/L dissolved-solids concentration), its principal cations are magnesium and calcium, and its principal anions are sulfate and chloride.
Water from the Arroyo aquifer varies from fresh to slightly saline. It has different types of water at different locations and depths. All the water is very hard. Water in all three wells exceeded the secondary maximum contami nant level for dissolved-solids concentrations, and in two wells the limits for sulfate and chloride concentrations were exceeded.
Minor and Trace Elements
Of the 30 samples analyzed for major chemical constituents, 8 also were analyzed for minor and trace elements (table 7B). The elements included arsenic, barium, cadmium, chromium, copper, iron, lead, manganese, mercury, selenium, silver, and zinc. Two of the samples were from the Leona aquifer, four from the Leona and Choza aquifer, one from the Comanche Peak aquifer, and one from the Standpipe aquifer. Selenium was the only minor or trace element whose concen tration exceeded or equaled the maximum contaminant level determined by the U.S. Environmental Protection Agency (table 4). The maximum contaminant level of 10 ug/L for selenium was exceeded in the water sample from well YB-43-37-905 (13 ug/L) and equaled in the water sample from well YB-43-38-613. Both wells
-30-
produce water from the Leona and Choza aquifer and are located in the Li pan Flat area. Because of the large concentration of dissolved solids and the bad taste, water from well YB-43-37-905 is not used for human consumption. Water from well YB-43-38-613 is used for irrigation but not for domestic supply.
Manganese was the only minor or trace element to exceed the secondary maximum contaminant level (50 ug/L) set by the U.S. Environmental Protection Agency (table 4). This occurred in the water sample from well YB-43-38-214 (80 ug/L). This well also produces water from the Leona and Choza aquifer and is used for livestock purposes only. The well is downslope from a nearby bypro ducts-rendering plant and a cattle feedlot that could be the source of the excessive manganese.
Bacteria and Nutrients
Water samples from 49 wells in the county were analyzed for fecal-coliform and fecal-streptococci bacteria (table 7C). The same wells and springs (eight) sampled for minor and trace elements also were sampled for nutrients; these well locations and analyses also are listed in table 7C.
Feeal-coliform bacteria, which are often used as an indication of the sani tary quality of the water, are present in the intestines or feces of warm blooded animals. In the laboratory, they are defined as all organisms that produce blue colonies within 24 hours when incubated at 44°C + 0.2°C on M-FC medium. The concentrations are expressed as the number of colonies per 100 mllli liters of sample. Fee al-coli form bacteria occurrences in water reflect the presence of fecal contamination, which also is the most likely source of pathogenic microorganisms. Because no satisfactory method is available for differentiating between fecal organisms of human and animal origin, it is necessary to consider the presence of all fecal organisms in water as an indi cation of recent and possible dangerous fecal pollution.
Fecal-streptococci bacteria also occur in the intestines of warm-blooded animals. In the laboratory, they are defined as all organisms that produce pink or red colonies within 48 hours at 35°C _+ 1.0°C on M-endo medium. The concentrations also are expressed as the number of colonies per 100 milliliters of sample. The presence of fecal-streptococci bacteria in ground water usually indicates fecal pollution, and their absence suggests little or no recent warm blooded animal pollution. However, two varieties of fecal-streptococci bacteria occur naturally in the environment. Therefore, fecal streptococci bacteria determinations are not used as the primary criteria for evaluation of the sani tary quality of water. Such determinations, however, are useful as a supplement to the fee al-coli form bacteria test when a more precise determination of the source of contamination is necessary.
The first group of samples tested for fecal-col iform and fecal-streptococci bacteria was taken from 25 wells in April 1983. Of the 25 samples, none were positive for fecal-col i form bacteria and 15 were positive for fecal-streptococci bacteria. The fecal-streptococci bacteria count varied from less than 1 to 29 cols./lOOmL (colonies per 100 milliliters). The second group of samples tested for feeal-coliform and fecal-streptococci bacteria were taken from 29 wells and 1 spring (Anson Springs) in August 1983. Of these samples, six were
-31-
from wells included in the first group of wells. Twelve of the samples tested in August 1983 were positive for fecal-coliform bacteria (one sample had tested negative in April). All well samples tested positive for fecal-streptococci bacteria (two samples had tested negative in April). The fecal-coliform bacteria count varied from less than 1 to 26 cols./lOO ml, and the fecal- streptococci bacteria count varied from 1 to 400 cols./lOO mL. The samples tested in August contained more fecal-coliform and fecal-streptococci bacteria.
Water from well YB-43-60-101 had the greatest number of bacteria (fecal col i form, 26 cols./lOO ml and fecal streptococci, 400 cols./lOO ml). This well is used for livestock and is located in the southwest corner of the county in a ranching area. It is near the ranch livestock pens, and livestock may be the contributing source of the bacteria.
Water from well YB-43-38-214 also had a high bacteria count (fecal col i form, 12 cols./lOO ml and fecal streptococci, 350 cols./lOO ml). This well is about 6 mi northeast of San Angel o near the Cone ho River in a ranching area. How ever, this well is near a byproducts-rendering plant and a commerical feedlot. Either area could be the source of the bacteria. The tenant reported that several years ago he became ill after drinking water from this well. Now water from the well is used only for livestock.
One other well (YB-43-32-401) tested high in bacteria (fecal coliform, 23 cols./lOO ml and fecal streptococci, 150 cols./lOO ml). This well is in the northeast corner of the county near the Concho County line in a plowed field. There is no apparent reason for the high bacteria count for this well.
There is concern that shallow ground water in suburban areas with a large population density and no central water or sewer systems might be affected by septic systems. Of the 48 wells tested, 18 were from suburban areas that did not have central water or sewer systems. Results obtained during this study indicate that these areas do not contain any more fecal-coliform or fecal- streptococci bacteria in the ground water than other areas. In general, the aquifers do not appear to be contaminated with bacteria; however, some individ ual wells or localized areas could be contaminated by nearby septic tanks.
The constituents included in the nutrient analyses included nitrate, nitrite, ammonia, and phosphorus; additional analyses also were determined for total organic nitrogen, ammonia plus total organic nitrogen, and total nitro gen. Of the eight samples collected, five had concentrations in excess of 10 mg/L total nitrate, which is the maximum contaminant level set by the U.S. Environmental Protection Agency (table 4). Most all nitrogen concentrations are in the form of nitrate. Large nitrate concentrations are known to cause infant cyanosis or "blue baby" disease (table 5).
Two of the wells (YB-43-19-402 and YB-43-28-602) where the water had acceptable concentrations of total nitrate are the same wells identified earlier as having the smallest dissolved-solids concentrations in the Leona aquifer. These wells are in the northwestern part of the county. The other well (YB-43-37-905) with an acceptable level of total nitrate concentration had the largest dissolved-solids concentration (4,800 mg/L) of the 30 samples collected for major inorganic constituents.
-32-
For the four sampled wells in the Leona and Choza aquifer, all except well YB-43-37-905 described earlier, had large nitrate concentrations. Water from well YB-43-38-214 had 30 mg/L of nitrate nitrogen and also had a relatively large bacteria count. The well is downslope from a nearby byproducts-rendering plant and cattle feedlot. The other two wells (YB-43-38-613 and YB-43-45-201) also are located in the Li pan Flat area east and southeast of San Angel o and produced water with nitrate-nitrogen concentrations of 21 and 26 mg/L, respec tively.
Water samples from a well tapping the Standpipe aquifer and from Anson Springs, which discharges from the Comanche Peak aquifer, had large concentra tions of nitrate nitrogen. Well YB-43-32-401 and spring YB-43-53-708 had nitrate nitrogen concentrations of 37 and 18 mg/L, respectively. Well YB-43-32- 401, described earlier as having relatively large bacteria counts, is located in a field and away from any houses.
The sampling of eight wells, of which five had unacceptable concentrations of nitrate for public supplies, did not produce sufficient data to assess the magnitude of the problem in terms of the occurrence of unsuitable drinking water. However, these results indicate that further investigation may be warranted.
Pesticides
In 1983, samples from three wells were analyzed for chlorinated hydrocar bon insecticides and chlorinated hydrocarbon herbicides (table 7D). Well YB-43-28-602 is completed in the Leona aquifer and is on the north edge of the Grape Creek community just northeast of San Angelo. Wells YB-43-38-613 and YB-43-45-201 are completed in the Leona and Choza aquifers and are in the Li pan Flat area. All three wells are in a farming area or near a farming area. None of the water samples taken from the wells contained insecticides or herbicides in concentrations above detection limits.
Historical Changes
Many of the wells inventoried for this study also were inventoried in pre vious reports (Work Projects Administration, 1941; Will is, 1954) and by the Texas Department of Water Resources in 1969. Current (1983) and historic water-quality data from wells were compared to determine if any changes had occurred (table 7). Changes in dissolved-solids concentrations and aquifer designation are shown in figure 13. These data show the general areas where the dissolved-solids concentrations of the ground water have changed, although some isolated wells in these areas may not follow the general trend.
The specific reasons for each the increases in dissolved-solids concentra tions shown in figure 13 are beyond the scope of this report and would require a more detailed study. There are isolated areas in which some wells may be affected by oil-field activity (fig. 14), but this is not believed to be the general cause for the increase in dissolved-solids concentration, or degrada tion, of the water quality. The probable cause of most contamination is water from the Blaine Gypsum, San Angel o Sandstone, and Choza Formation of the Permian System migrating upward and mixing with water from the Leona and Bull-
-33-
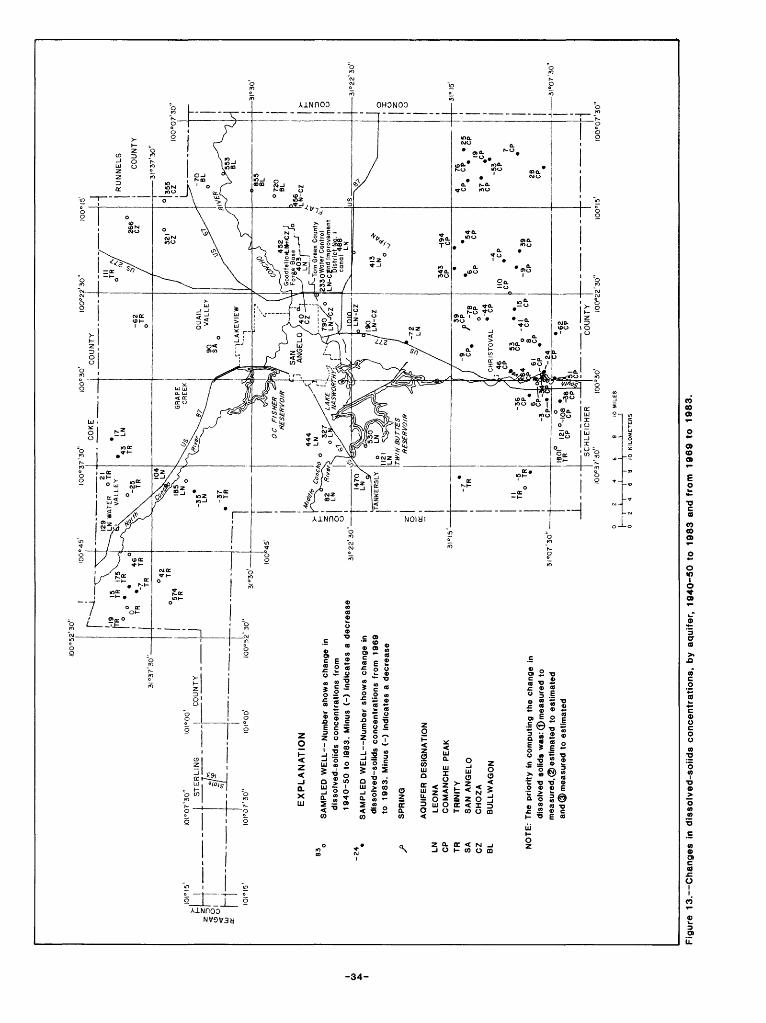
!OI°
i5'
LN
CP
T
R
SA
C
Z
BL
iOO
"22'
30"
0?
'30
"
i ^
K-T
om
Gre
en C
ount
y 23
30W
'ot«
r C
ontr
ol
LN
_C«n
d Im
prov
emen
t D
istr
ict
No.
!
cana
l
IOI^O
T'SO
"S
TE
RL
ING
IOI"
d?'
30
"
EX
PL
AN
AT
ION
SA
MP
LE
D W
EL
L N
um
ber
sho
ws
chan
ge
in
dis
solv
ed-s
oiid
s co
nce
ntr
atio
ns
fro
m
1940-5
0 t
o I
983.
Min
us
(-)
ind
ica
tes
a d
ec
rea
se
SA
MP
LE
D W
EL
L N
um
be
r sh
ow
s ch
ang
e in
d
isso
lved
-so
iids
con
cen
trat
ion
s fr
om
1969
to
1983.
Min
us
(-)
ind
icat
es a
decre
ase
SP
RIN
G
AQ
UIF
ER
DE
SIG
NA
TIO
N
LE
ON
AC
OM
AN
CH
E
PE
AK
T
RIN
ITY
S
AN
AN
GE
LO
C
HO
ZA
B
UL
LW
AG
ON
3I°
30
'
31°
15'
NO
TE
: T
he
pri
ori
ty i
n co
mp
uti
ng
th
e ch
ang
e in
d
isso
lved
so
lids
was
: (J
) mea
sure
d t
o
mea
sure
d.(
2) e
stim
ated
to
esti
mat
ed
and
©m
ea
su
red
to
est
imat
ed
3I»
07
'30
"
100°
15'
I00
°07
'30
"
h-T
6 8
10
KIL
OM
ET
ER
S
Fig
ure
1
3.
Ch
an
ge
s i
n d
iss
olv
ed
-so
iid
s c
on
ce
ntr
ati
on
s,
by a
qu
ifer
, 1940-5
0 t
o
1983 a
nd
fro
m
1969 t
o
19
83
.
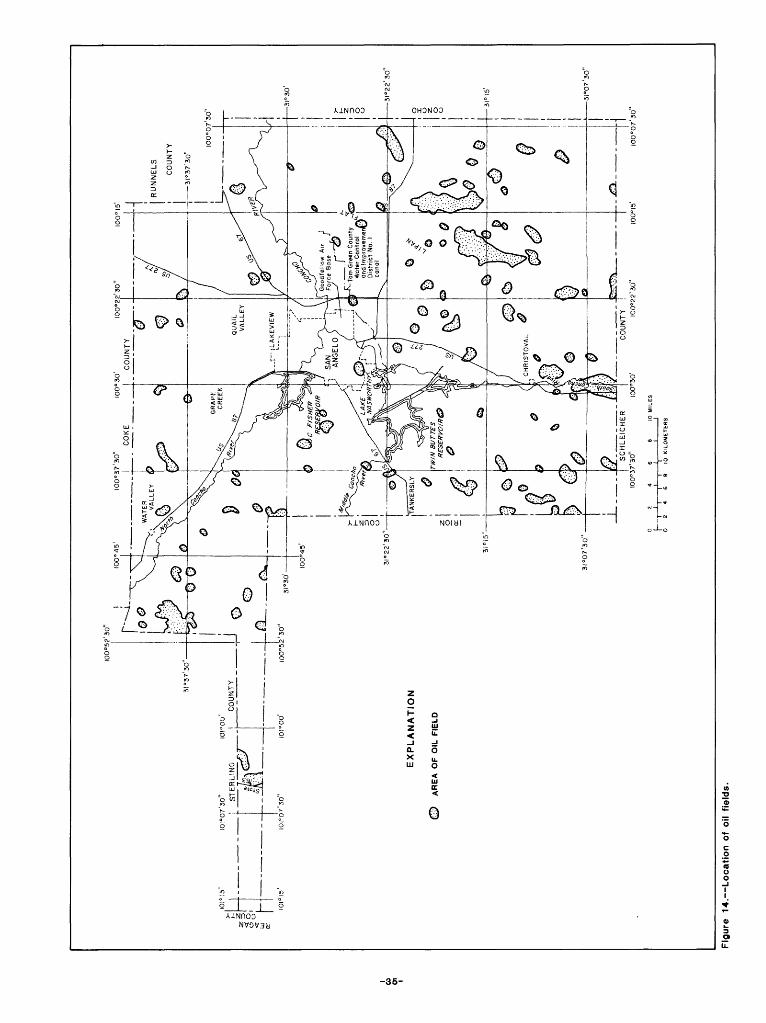
I00
05?'
30
"
,0,.,5
fin'
UJ
f
or
|
I0i°
07'3
0"
3i°
37
'30
"
I0i°
07
'30
" lO
I'OO
' I
ST
ER
LIN
G
! C
OU
NT
Y
__
__
(
EX
PL
AN
AT
ION
AR
EA
O
F O
IL F
IEL
D
r1
I ^~
~"T
^~ f - - "
10
&
\ V
--_
WA
TER
I00°0
7'5
0"
0 2
<1
8 10
KI
LOM
ETER
S
Fig
ure
14. L
ocati
on
of
oil
fiel
ds.

wagon aquifers and also from the deep percolation of irrigation water. Analy ses from earlier reports (Work Projects Administration, 1941; Willis, 1954) indicate that water from the San Angelo aquifer contained as much as 52,400 mg/L dissolved-solids concentrations and water from the Blaine Gypsum contained as much as 9,280 mg/L dissolved-solids concentrations. In 1940, a water sample from a 112-ft deep well located about 4 mi south of Wall in the Choza aquifer contained 14,000 mg/L dissolved-solids concentrations.
From these earlier analyses, it can be concluded that there may be very poor quality ground water in certain parts of the Blaine Gypsum and the San Angelo Sandstone, which outcrop to the west and north of San Angel o. Current (1983) water-table configurations (figs. 2-4) show that the water table in these areas is higher than the water table in the Li pan Flat area. Water from the Blaine and San Angelo aquifers could move to the east and into the aquifers that supply water in the Li pan Flat area. Also in the same area, the Choza aquifer lies just under the Leona aquifer and just over the Bull wagon aquifer. Water of poor quality from the Choza aquifer could be mixing with water in the Leona and Bullwagon aquifers, which supply most of the irrigation water in the county. As the better quality water is pumped out, it could be replaced by the lesser-quality from the Choza aquifer water. No historic records are available for determining changes in bacteria, minor elements, and pesticides. A discussion on the water-quality changes in each aquifer or combined aquifers follows.
Leona and Choza Aquifers
The changes in water quality in the Leona and Choza aquifers are discussed together because many of the wells in Tom Green County draw water from both aquifers, especially most wells in the Li pan Flat area. Generally, water in the aquifers has increased in dissolved-solids concentrations since the ini tial sampling. This increase ranges from less than 100 to 500 mg/L with the least change being in the North Concho River valley and the Lake View areas. In the Li pan Flat area, the increase in dissolved-solids concentrations in these aquifers averaged about 400 mg/L. Water in isolated wells, however, had increases as low as 40 mg/L (well YB-43-37-602) and as high as 2,330 mg/L (well YB-43-38-402).
Of all the shallow aquifers in the county, the Leona and Choza aquifers had the greatest change in water quality. Water from well YB-43-43-303, located in the community of Tankersly in the west-central part of the county, had the largest increase in dissolved-solids concentrations (4,530 mg/L). This well was reported by Willis (1954) to be producing water from the Leona aquifer. It is possible that this well may have been deepened to also produce water from the Blaine or San Angelo aquifers, which underlie the Leona in this part of the county; this would account for the large increase in dissolved solids. Water from other wells in this area have increases in dissolved-solids concentrations from 82 to 1,121 mg/L. The average increase in dissolved-solids concentrations for this area (excluding well YB-43-43-303) is about 500 mg/L. In the farming areas, deep percolation of irrigation water is believed to be a major cause of the increased salinity.
-36-
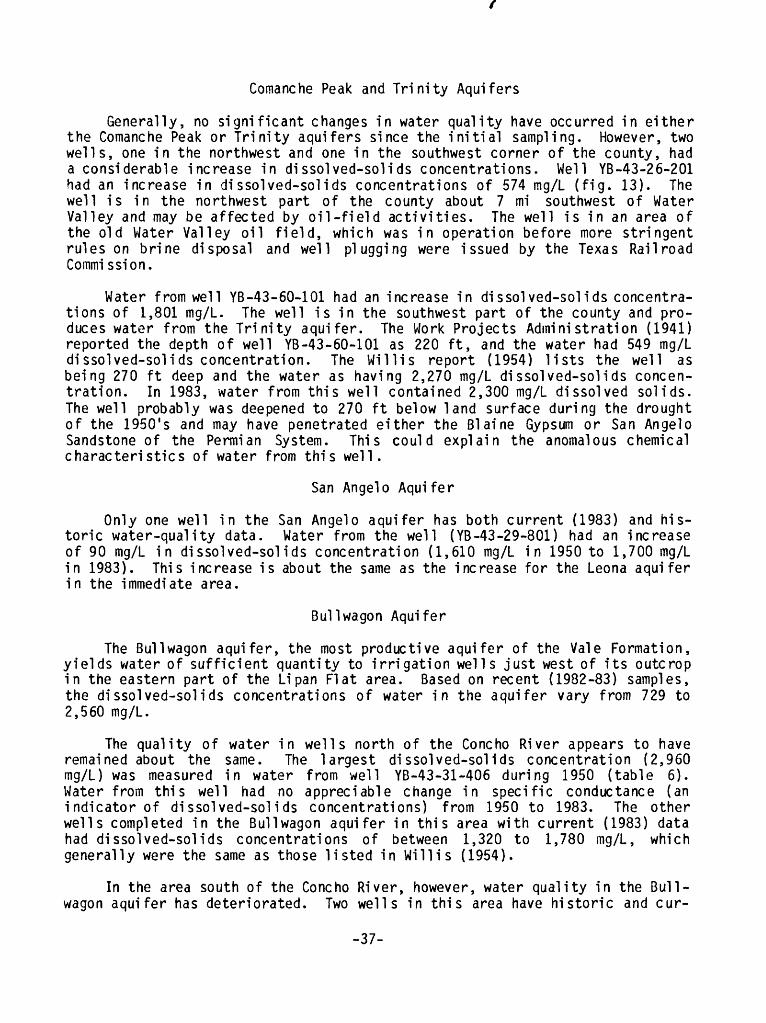
Comanche Peak and Trinity Aquifers
Generally, no significant changes in water quality have occurred in either the Comanche Peak or Trinity aquifers since the initial sampling. However, two wells, one in the northwest and one in the southwest corner of the county, had a considerable increase in dissolved-solids concentrations. Well YB-43-26-201 had an increase in dissolved-solids concentrations of 574 mg/L (fig. 13). The well is in the northwest part of the county about 7 mi southwest of Water Valley and may be affected by oil-field activities. The well is in an area of the old Water Valley oil field, which was in operation before more stringent rules on brine disposal and well plugging were issued by the Texas Railroad Commi ssion.
Water from well YB-43-60-101 had an increase in dissolved-solids concentra tions of 1,801 mg/L. The well is in the southwest part of the county and pro duces water from the Trinity aquifer. The Work Projects Administration (1941) reported the depth of well YB-43-60-101 as 220 ft, and the water had 549 mg/L dissolved-solids concentration. The Willis report (1954) lists the well as being 270 ft deep and the water as having 2,270 mg/L dissolved-solids concen tration. In 1983, water from this well contained 2,300 mg/L dissolved solids. The well probably was deepened to 270 ft below land surface during the drought of the 1950's and may have penetrated either the Blaine Gypsum or San Angelo Sandstone of the Permian System. This could explain the anomalous chemical characteristics of water from this well.
San Angelo Aquifer
Only one well in the San Angel o aquifer has both current (1983) and his toric water-quality data. Water from the well (YB-43-29-801) had an increase of 90 mg/L in dissolved-solids concentration (1,610 mg/L in 1950 to 1,700 mg/L in 1983). This increase is about the same as the increase for the Leona aquifer in the immediate area.
Bull wagon Aquifer
The Bull wagon aquifer, the most productive aquifer of the Vale Formation, yields water of sufficient quantity to irrigation wells just west of its outcrop in the eastern part of the Li pan Flat area. Based on recent (1982-83) samples, the dissolved-solids concentrations of water in the aquifer vary from 729 to 2,560 mg/L.
The quality of water in wells north of the Concho River appears to have remained about the same. The largest dissolved-solids concentration (2,960 mg/L) was measured in water from well YB-43-31-406 during 1950 (table 6). Water from this well had no appreciable change in specific conductance (an indicator of dissolved-solids concentrations) from 1950 to 1983. The other wells completed in the Bull wagon aquifer in this area with current (1983) data had dissolved-sol ids concentrations of between 1,320 to 1,780 mg/L, which generally were the same as those listed in Will is (1954).
In the area south of the Concho River, however, water quality in the Bull- wagon aquifer has deteriorated. Two wells in this area have historic and cur-
-37-

rent (1983) water-quality data. Water from wells YB-43-31-703 and YB-43-39-104 had increases of dissolved-solids concentrations of 855 and 720 mg/L, respec tively. These wells are located just south of the Concho River and indicate contamination of the aquifer, probably from infiltration of water from the Choza and Arroyo aquifers.
Standpipe and Arroyo Aquifers
Wells in the Standpipe and Arroyo aquifers having historic water-quality data could not be sampled for this study. Wells in these aquifers that were sampled for this study had water with dissolved-solids concentrations that varied from about 680 to about 2,000 mg/L. This range in dissolved solids is approximately the same as that reported by Willis (1954). Comparison of current (1983) and historic water-quality data indicates that the water quality in the aquifers has not significantly changed. One well reported to be affected by oil-field activities has been plugged and water samples could not be obtained to verify the contamination.
-38-

SUMMARY AND CONCLUSIONS
The current (1983) water levels in shallow aquifers in Tom Green County are relatively unchanged from those levels listed in previous reports (Work Projects Administration, 1941; Will is, 1954). In most wells, the changes in water levels are less than 10 ft (rise or decline), and only a few isolated wells or areas had changes over 20 ft. The largest decline in water levels was 77 ft, and the largest rise in water levels was 58 ft. Long-term hydrographs of selected wells plotted with precipitation indicate that water levels are directly related to precipitation and associated pumpage for irrigation. Current (1983) water levels probably are higher than normal because of the above normal precipitation for 1981-82. The average annual precipitation for San Angelo is 18.19 in.; in 1980 and 1981, the annual precipitation was about 30 in. each year. The shallow aquifer system in the county has a rather limited storage, but the ground-water supply in most of the county is sufficient for present needs. However, large withdrawals and/or insufficient precipitation over a long period of time could deplete the ground-water supplies and cause a decline in water levels.
Shallow ground water in Tom Green County usually is very hard (greater than 180 mg/L of calcium carbonate) and of different chemical types depending upon the aquifer and its location in the county. The concentrations of dis solved solids in the shallow aquifers range from 200 to 3,000 mg/L, the dissolved-chloride concentrations range from about 40 to 1,000 mg/L, and the dissolved-sulfate concentrations range from about 25 to 600 mg/L. Water samples from eight wells were analyzed for nitrate, and the dissolved-nitrate concentrations ranged from 2 to 37 mg/L; of these samples, five exceeded the maximum contaminant level of 10 mg/L set by the U.S. Environmental Protection Agency (1976). Of the eight water samples analyzed for minor elements, two exceeded the maximum contaminant level for selenium, and one exceeded the secondary maximum contaminant level for manganese. Water samples from three wells were analyzed for selected pesticides; no detectable limits were found for either chlorinated hydrocarbon insecticides or chlorinated-hydrocarbon herbicides.
Two groups (one in April 1983 and the other in August 1983) of ground-water samples were tested for bacteria. Of the 25 wells sampled in the first group, none were positive for f ecal-col i form bacteria and 15 were positive for fecal- streptococci bacteria. The second group consisted of samples from the 29 wells and 1 spring, and 12 of these samples were positive for f ecal-col i form bacteria and all 30 were positive for fecal-streptococci bacteria. Seven wells were common to both sets, and the samples tested in August contained more bacteria. Counts of f ecal-col i form bacteria ranged from 0 to 26 cols./lOO mL, with most counts below 5 cols./lOO mL. Counts of fecal-streptococci bacteria ranged from 0 to 400 cols./lOO mL. The presence of fecal-coliform and fecal-streptococci bacteria in water is only an indicator that septic pollution may be present and is not a positive check for fecal pollution.
There has been local concern that the shallow ground-water system in subur ban areas with high population density and no central sewer system might be affected by septic systems. However, results obtained during this study indi cate that ground water from these suburban areas contains no more bacteria than
-39-
the ground-water system in rural areas. In general, the aquifers are not affected by septic pollution, however, some individual wells or localized areas could be affected by nearby septic systems.
Historic and current (1983) water-quality records were compared using dissolved-solids concentrations as a standard, to determine if any changes had occurred. In general, no significant changes in dissolved-solids concentration were found in water from Cretaceous aquifers sampled from wells in the hilly areas in the northern and southern parts of the county, and in water from the Arroyo and Bull wagon aquifers sampled from wells located north of the Concho River in the eastern part of the county (fig. 13). Generally, ground water in the remainder of the county, including in the river valleys and in the Li pan Flat area, had increases of dissolved-solids concentrations ranging from less than 100 to 500 mg/L except for three areas which are just southeast of San Angelo, just west of Twin Buttes Reservoir, and about 10 mi east of San Angelo. Ground water in these areas had increases of between 500 and 1,100 mg/L, but individual well samples showed increases of dissolved-solids concentrations of as much as 4,530 mg/L.
Although there was concern over oil-field pollution, this does not seem to be the major cause of the degradation of water quality in Tom Green County. Most of the increase in dissolved-solids concentrations in ground water in the county, especially in areas of ground-water irrigation, probably is the result of better quality water being pumped out, resulting in less desirable water from the Choza, Blaine, and San Angel o aquifers mixing with the better quality water. Deep percolation of irrigation water probably also adds to the degrada tion of water in parts of the county. Pollution from oil-field activities is probable in some areas in the county and in some isolated wells. No historical records are available for determining any changes in pesticides, minor elements, or bacteria.
-40-
SELECTED REFERENCES
American Public Health Association and others, 1975, Standard methods for the examination of water and wastewater (14th ed.): Washington, D.C., Ameri can Public Health Association, 1193 p.
Hem, J. D., 1970, Study and interpretation of the chemical characteristics of natural water (2d ed.): U.S. Geological Survey Water-Supply Paper 1473, 363 p.
Kane, J. W., 1967, Monthly reservoir evaporation rates for Texas, 1940 through 1965: Texas Water Development Board Report 64, 111 p.
McKee, J. E., and Wolf, H. W., 1963, Water quality criteria (2d ed.): Cali fornia State Water Quality Board Publication no. 3-A, 548 p.
Mount, J. R., Rayner, F. A., Shamburger, V. M., Jr., Peckham, R. C., and Osborne, F. L., Jr., 1967, Reconnaisance investigation of the ground-water resources of the Colorado River basin, Texas: Texas Water Development Board Report 51, 107 p.
National Academy of Sciences, National Academy of Engineering, 1973 [1974], Water quality criteria, 1972: Washington, D.C., Report of the Committee on Water Quality Criteria, 594 p.
National Technical Advisory Committee to the Secretary of the Interior, 1968, Water quality criteria: Washington, D.C., U.S. Government Printing Office, 234 p.
Stiff, H. A., Jr., 1951, The interpretation of chemical water analysis by means of patterns: Journal of Petroleum Technology, v. 3, no. 10, p. 15-17.
U.S. Bureau of Census, 1980, U.S. Census of population 1980, characteristic of population, Texas: U.S. Department of Commerce, v. 1, pt. 45.
U.S. Department of Agriculture, 1936-40, Climatological data, Texas section, 1936-40: Weather Bureau, v. 41-45.
U.S. Department of Commerce, 1941-65, Climatological data, Texas section, 1941- 65: Weather Bureau, v. 46-70.
, 1966-70, Climatological data, Texas, 1966-70: Environmental Science Services Administration, Environmental Data Service, v. 71-75.
, 1971-77, Climatological data, Texas, 1971-77: National Oceanic and Atmospheric Administration, Environmental Data Service, v. 76-82.
, 1978-80, Climatological data, Texas, 1978-80: National Oceanic and Atmospheric Administration, Environmental Data and Information Service, v. 83-85.
U.S. Environmental Protection Agency, 1976, National interim primary drinking water regulations: Office of Water Supply, EPA-570/9-76-003, 159 p.
, 1977a, National secondary drinking water regulations: Federal Regis ter, v. 42, no. 62, pt. I, p. 17143-17147.
, 1977b, Quality criteria for water, 1976: U.S. Government Printing Office, 256 p.
Will is, Gordon, W., 1954, Ground-water resources of Tom Green County, Texas: Texas Board of Water Engineers Bulletin 5411, 101 p.
Winslow, A. G., and Kister, L. R., Jr., 1956, Saline water resources of Texas: U.S. Geological Survey Water-Supply Paper 1365, 105 p.
Work Projects Administration, 1941, Tom Green County, Texas, Records of wells and springs, drillers' logs, water analyses, and map showing location of wells and springs: Texas Board of Water Engineers, Work Projects Adminis tration Project 17276, 82 p.
-41-
Icv
Q_
Q_
to
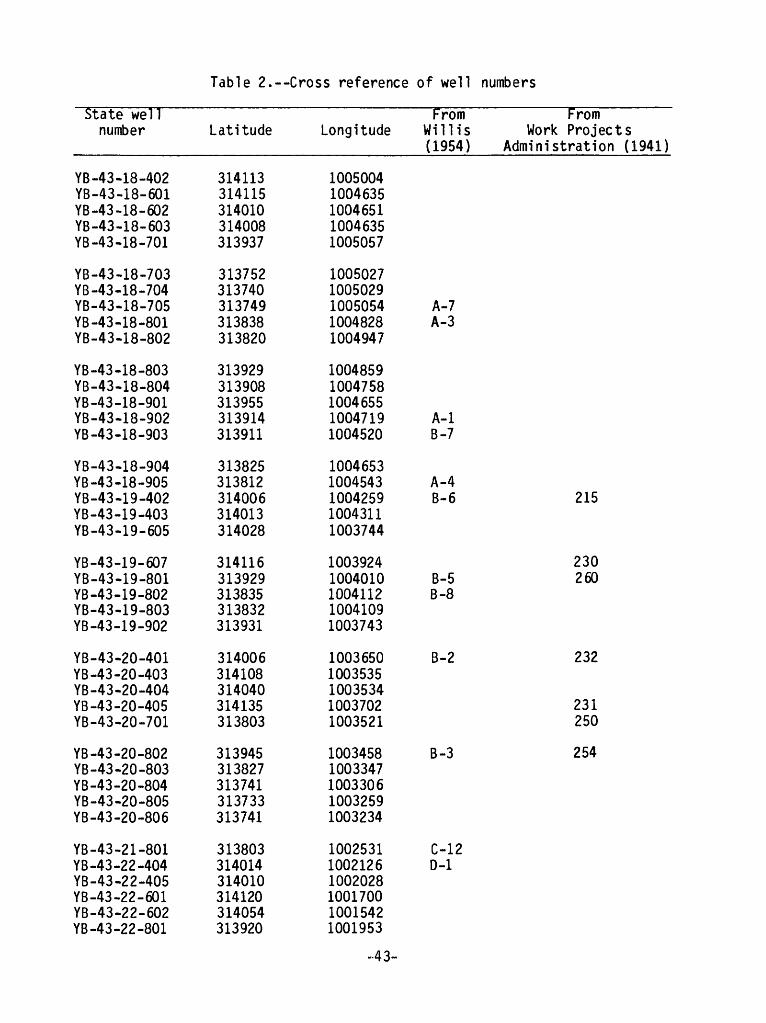
Table 2.--Cross reference of well numbers
State well number
YB-43-18-402YB-43-18-601YB-43-18-602YB-43-18-603YB-43-18-701
YB-43-18-703YB-43-18-704YB-43-18-705YB-43-18-801YB-43-18-802
YB-43-18-803YB-43-18-804YB-43-18-901YB-43-18-902YB -43-18-903
YB-43-18-904YB-43-18-905YB-43-19-402YB-43-19-403YB-43-19-605
YB-43-19-607YB-43-19-801YB-43-19-802YB-43-19-803YB-43-19-902
YB-43-20-401YB-43-20-403YB-43-20-404YB-43-20-405YB-43-20-701
YB-43-20-802YB-43-20-803YB-43-20-804YB-43-20-805YB-43-20-806
YB-43-21-801YB-43-22-404YB-43-22-405YB-43-22-601YB-43-22-602YB-43-22-801
Latitude
314113314115314010314008313937
313752313740313749313838313820
313929313908313955313914313911
313825313812314006314013314028
314116313929313835313832313931
314006314108314040314135313803
313945313827313741313733313741
313803314014314010314120314054313920
Longitude
10050041004635100465110046351005057
10050271005029100505410048281004947
10048591004758100465510047191004520
10046531004543100425910043111003744
10039241004010100411210041091003743
10036501003535100353410037021003521
10034581003347100330610032591003234
100253110021261002028100170010015421001953
From From Will is Work Projects (1954) Administration (1941)
A-7A-3
A-lB-7
A-4B-6
B-5B-8
B-2
B-3
C-12D-l
215
230260
232
231250
254
-43-
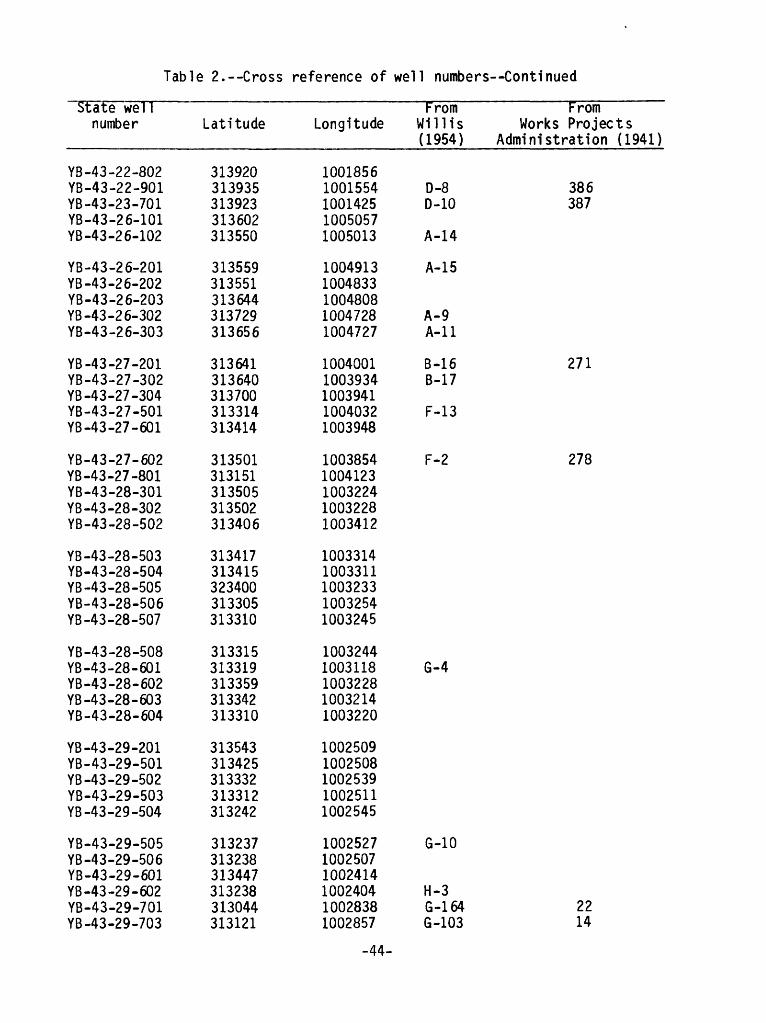
Table 2.--Cross reference of well numbers Continued
State well number
YB-43-22-802 YB-43-22-901 YB-43-23-701 YB-43-26-101 YB-43-26-102
YB-43-2 6-201 YB -43-26-202 YB-43-26-203 YB-43-26-302 YB-43-26-303
YB-43-27-201 YB-43-27-302 YB-43-27-304 YB-43-27-501 YB-43-27-601
YB-43-27-602 YB-43-27-801 YB-43-28-301 YB-43-28-302 YB-43-28-502
YB-43-28-503 YB-43-28-504 YB-43-28-505 YB-43-28-506 YB-43-28-507
YB-43-28-508 YB-43-28-601 YB-43-28-602 YB-43-28-603 YB-43-28-604
YB-43-29-201 YB-43-29-501 YB-43-29-502 YB-43-29-503 YB-43-29-504
YB-43-29-505 YB-43-29-506 YB-43-29-601 YB-43-29-602 YB-43-29-701 YB-43-29-703
Latitude
313920 313935 313923 313602 313550
313559 313551 313644 313729 313656
313641 313640 313700 313314 313414
313501 313151 313505 313502 313406
313417 313415 323400 313305 313310
313315 313319 313359 313342 313310
313543 313425 313332 313312 313242
313237 313238 313447 313238 313044 313121
Longitude
1001856 1001554 1001425 1005057 1005013
1004913 1004833 1004808 1004728 1004727
1004001 1003934 1003941 1004032 1003948
1003854 1004123 1003224 1003228 1003412
1003314 1003311 1003233 1003254 1003245
1003244 1003118 1003228 1003214 1003220
1002509 1002508 1002539 1002511 1002545
1002527 1002507 1002414 1002404 1002838 1002857
From From Will is Works Projects (1954) Administration (1941)
D-8 386 D-10 387
A-14
A-15
A-9 A-ll
B-16 271 B-17
F-13
F-2 278
G-4
G-10
H-3 G-164 22 G-103 14
-44-
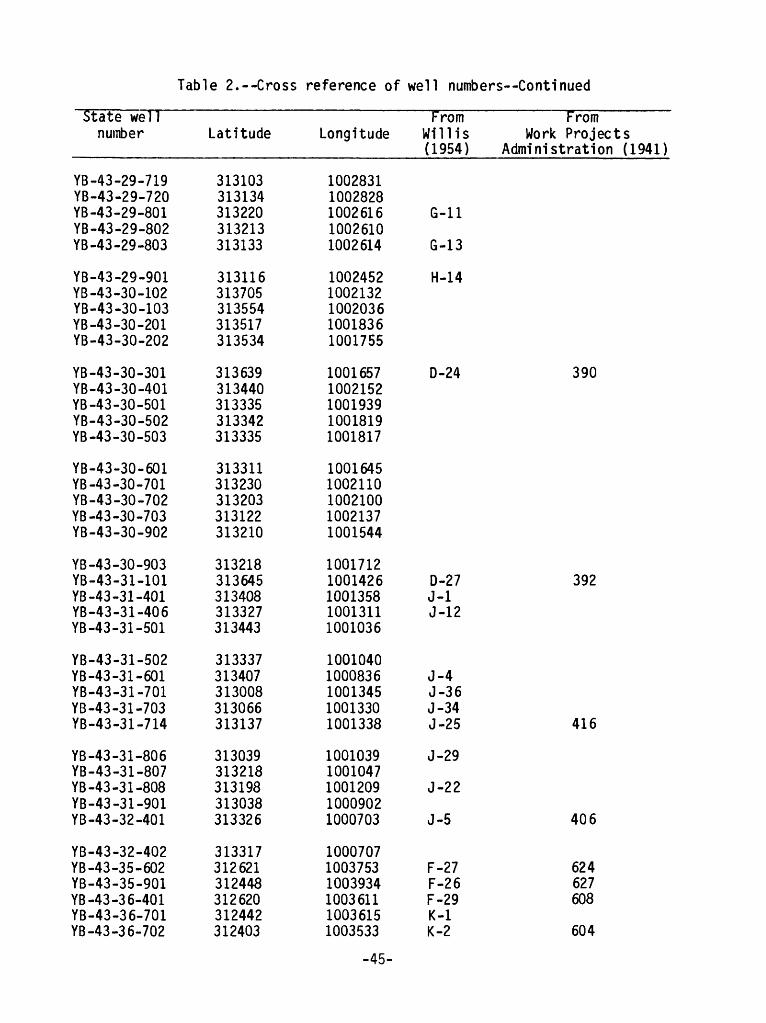
Table 2.--Cross reference of well numbers Continued
State well number
YB-43-29-719YB-43-29-720YB-43-29-801YB-43-29-802YB-43-29-803
YB-43-29-901YB-43-30-102YB-43-30-103YB-43-30-201YB-43-30-202
YB-43-30-301YB-43-30-401YB-43-30-501YB-43-30-502YB-43-30-503
YB-43-30-601YB-43-30-701YB-43-30-702YB-43-30-703YB-43-30-902
YB-43-30-903YB-43-31-101YB-43-31-401YB-43-31-406YB-43-31-501
YB-43-31-502YB-43-31-601YB-43-31-701YB-43-31-703YB-43-31-714
YB-43-31-806YB-43-31-807YB -43 -3 1-808YB-43-31-901YB-43-32-401
YB-43-32-402YB-43-35-602YB-43-35-901YB-43-36-401YB-43-36-701YB-43-36-702
Latitude
313103313134313220313213313133
313116313705313554313517313534
313639313440313335313342313335
313311313230313203313122313210
313218313645313408313327313443
313337313407313008313066313137
313039313218313198313038313326
313317312621312448312620312442312403
Longitude
10028311002828100261610026101002614
10024521002132100203610018361001755
10016571002152100193910018191001817
10016451002110100210010021371001544
10017121001426100135810013111001036
10010401000836100134510013301001338
10010391001047100120910009021000703
100070710037531003934100361110036151003533
From From Will is Work Projects (1954) Administration (1941)
G-ll
G-13
H-14
D-24
D-27J-lJ-12
J-4J-36J-34J-25
J-29
J-22
J-5
F-27F-26F-29K-lK-2
390
392
416
406
624627608
604
-45-
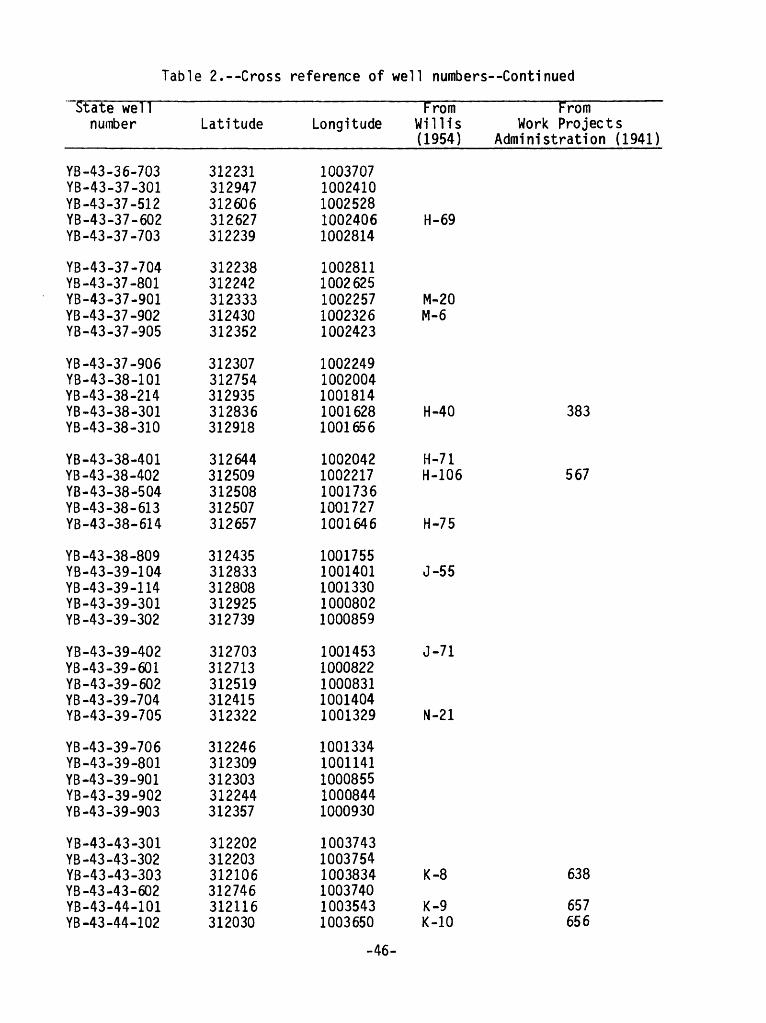
Table 2.--Cross reference of well numbers Continued
State well number
YB-43-36-703 YB-43-37-301 YB-43-37-512 YB-43-37-602 YB-43-37-703
YB-43-37-704 YB -43-37-801 YB-43-37-901 YB -43-37-902 YB-43-37-905
YB-43-37-906 YB-43-38-101 YB-43-38-214 YB-43-38-301 YB-43-38-310
YB-43-38-401 YB-43-38-402 YB-43-38-504 YB-43-38-613 YB-43-38-614
YB-43-38-809 YB-43-39-104 YB -43-39-114 YB-43-39-301 YB-43-39-302
YB-43-39-402 YB -43-39-601 YB-43-39-602 YB-43-39-704 YB-43-39-705
YB-43-39-706 YB-43-39-801 YB-43-39-901 YB-43-39-902 YB-43-39-903
YB-43-43-301 YB -43-43-302 YB-43-43-303 YB-43-43-602 YB-43-44-101 YB -43-44-102
Latitude
312231 312947 312606 312627 312239
312238 312242 312333 312430 312352
312307 312754 312935 312836 312918
312644 312509 312508 312507 312657
312435 312833 312808 312925 312739
312703 312713 312519 312415 312322
312246 312309 312303 312244 312357
312202 312203 312106 312746 312116 312030
Longitude
1003707 1002410 1002528 1002406 1002814
1002811 1002625 1002257 1002326 1002423
1002249 1002004 1001814 1001628 1001656
1002042 1002217 1001736 1001727 1001646
1001755 1001401 1001330 1000802 1000859
1001453 1000822 1000831 1001404 1001329
1001334 1001141 1000855 1000844 1000930
1003743 1003754 1003834 1003740 1003543 1003650
From From Will is Work Projects (1954) Administration (1941)
H-69
M-20 M-6
H-40 383
H-71 H-106 567
H-75
J-55
J-71
N-21
K-8 638
K-9 657 K-10 656
-46-
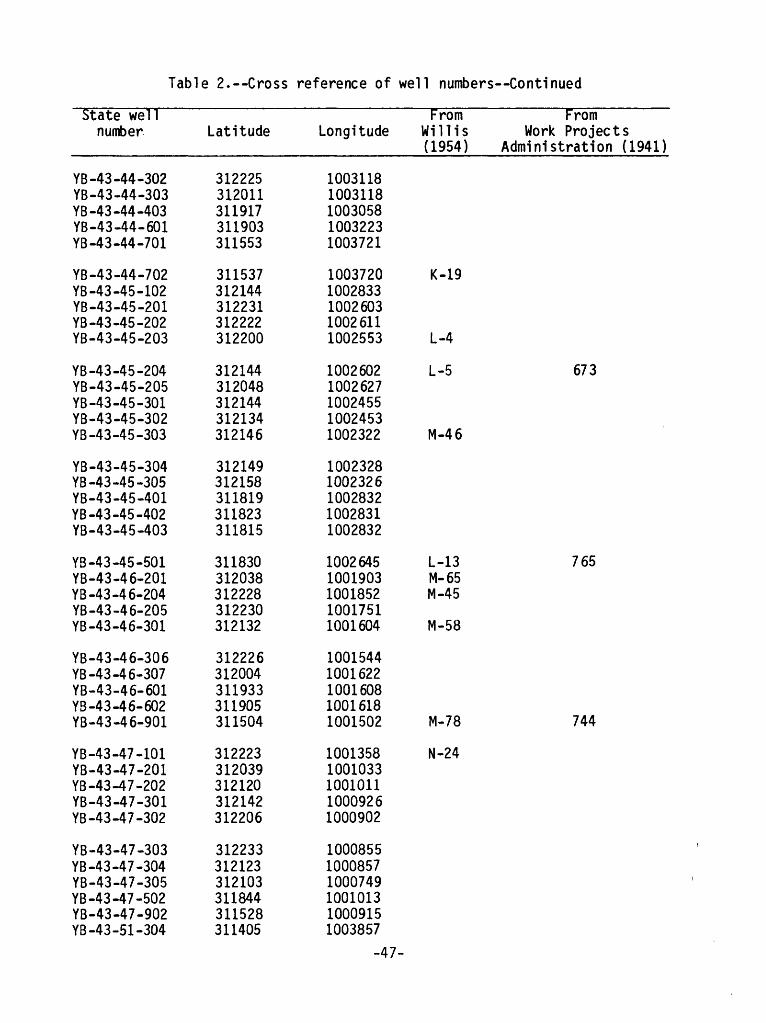
Table 2.--Cross reference of well numbers Continued
State well number
YB-43-44-302 YB-43-44-303 YB-43-44-403 YB-43-44-601 YB-43-44-701
YB-43-44-702 YB-43-45-102 YB-43-45-201 YB -43 -45 -202 YB-43-45-203
YB-43-45-204 YB-43-45-205 YB-43-45-301 YB-43-45-302 YB-43-45-303
YB-43-45-304 YB -43 -45 -305 YB-43-45-401 YB -43 -45 -402 YB-43-45-403
YB-43-45-501 YB-43-46-201 YB-43-46-204 YB-43-4 6-205 YB-43-46-301
YB-43-46-306 YB-43-4 6-307 YB-43-46-601 YB -43 -4 6- 602 YB-43-4 6-901
YB-43-47-101 YB-43-47-201 YB -43 -47 -202 YB-43-47-301 YB-43-47-302
YB-43-47-303 YB-43-47-304 YB-43-47-305 YB-43-47-502 YB-43-47-902 YB-43-51-304
Latitude
312225 312011 311917 311903 311553
311537 312144 312231 312222 312200
312144 312048 312144 312134 312146
312149 312158 311819 311823 311815
311830 312038 312228 312230 312132
312226 312004 311933 311905 311504
312223 312039 312120 312142 312206
312233 312123 312103 311844 311528 311405
Longitude
1003118 1003118 1003058 1003223 1003721
1003720 1002833 1002603 1002611 1002553
1002602 1002627 1002455 1002453 1002322
1002328 1002326 1002832 1002831 1002832
1002645 1001903 1001852 1001751 1001604
1001544 1001622 1001608 1001618 1001502
1001358 1001033 1001011 1000926 1000902
1000855 1000857 1000749 1001013 1000915 1003857
-47-
From From Will is Work Projects (1954) Administration (1941)
K-19
L-4
L-5 673
M-46
L-13 765 M-65 M-45
M-58
M-78 744
N-24
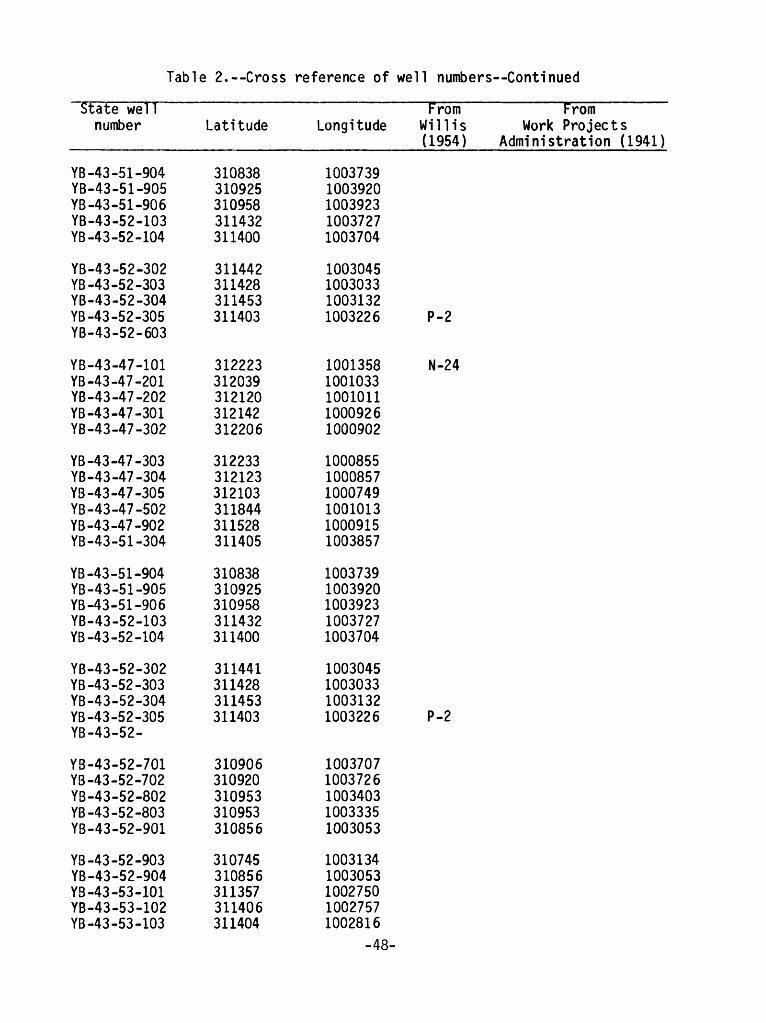
Table 2.--Cross reference of well numbers Continued
State well number
YB-43-51-904YB-43-51-905YB -43-51-906YB-43-52-103YB -43-52-104
Y8-43-52-302YB -43-52-303YB-43-52-304YB -43 -52 -305YB-43-52-603
YB-43-47-101Y8-43-47-201YB-43-47-202YB-43-47-301YB-43-47-302
YB-43-47-303YB-43-47-304YB -43-47-305Y8-43-47-502Y8-43-47-902Y8-43-51-304
YB-43-51-904Y8-43-51-905YB -43-51-906YB-43-52-103YB -43-52-104
YB-43-52-302YB -43 -52 -303Y8-43-52-304YB -43-52-305Y8-43-52-
Y8-43-52-701YB -43-52-702Y8-43-52-802YB -43-52-803Y8-43-52-901
YB -43-52-903YB-43-52-904Y8-43-53-101YB-43-53-102YB -43-53-103
Latitude
310838310925310958311432311400
311442311428311453311403
312223312039312120312142312206
312233312123312103311844311528311405
310838310925310958311432311400
311441311428311453311403
310906310920310953310953310856
310745310856311357311406311404
From From Longitude Will is Work Projects
(1954) Administration (1941)
10037391003920100392310037271003704
1003045100303310031321003226 P-2
1001358 N-241001033100101110009261000902
100085510008571000749100101310009151003857
10037391003920100392310037271003704
1003045100303310031321003226 P-2
10037071003726100340310033351003053
10031341003053100275010027571002816
-48-
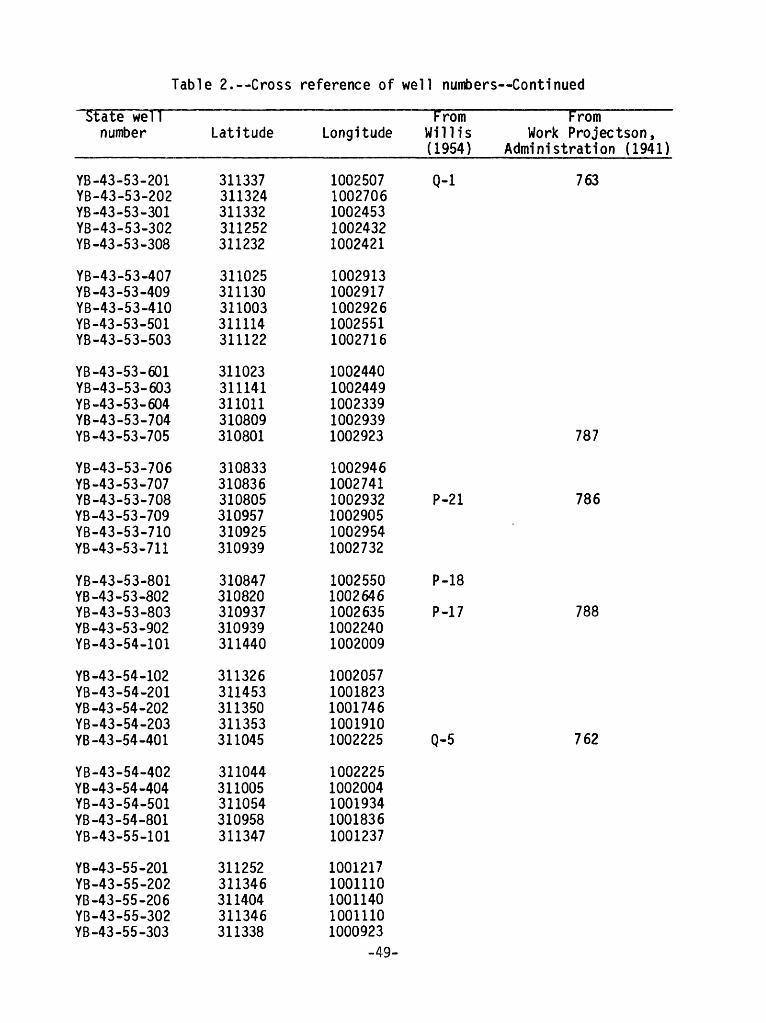
Table 2.--Cross reference of well numbers Continued
State well number
YB -43-53-201YB-43-53-202YB -43-53-301YB-43-53-302YB -43-53-308
YB-43-53-407YB -43-53-409YB-43-53-410YB-43-53-501YB-43-53-503
YB-43-53-601YB-43-53-603YB -43-53-604YB-43-53-704YB -43-53-705
YB-43-53-706YB -43-53-707YB-43-53-708YB-43-53-709YB-43-53-710YB -43-53-711
YB-43-53-801YB -43-53-802YB-43-53-803YB-43-53-902YB-43-54-101
YB -43-54-102YB-43-54-201YB -43-54-202YB-43-54-203YB -43-54-401
YB-43-54-402YB-43-54-404YB-43-54-501YB -43-54-801YB-43-55-101
YB-43-55-201YB-43-55-202YB -43-55-206YB-43-55-302YB-43-55-303
Latitude
311337311324311332311252311232
311025311130311003311114311122
311023311141311011310809310801
310833310836310805310957310925310939
310847310820310937310939311440
311326311453311350311353311045
311044311005311054310958311347
311252311346311404311346311338
From From Longitude Will is Work Projectson,
(1954) Administration (1941)
1002507 Q-l1002706100245310024321002421
10029131002917100292610025511002716
10024401002449100233910029391002923
100294610027411002932 P-21100290510029541002732
1002550 P-1810026461002635 P-1710022401002009
10020571001823100174610019101002225 Q-5
10022251002004100193410018361001237
10012171001110100114010011101000923
-49-
763
787
786
788
762
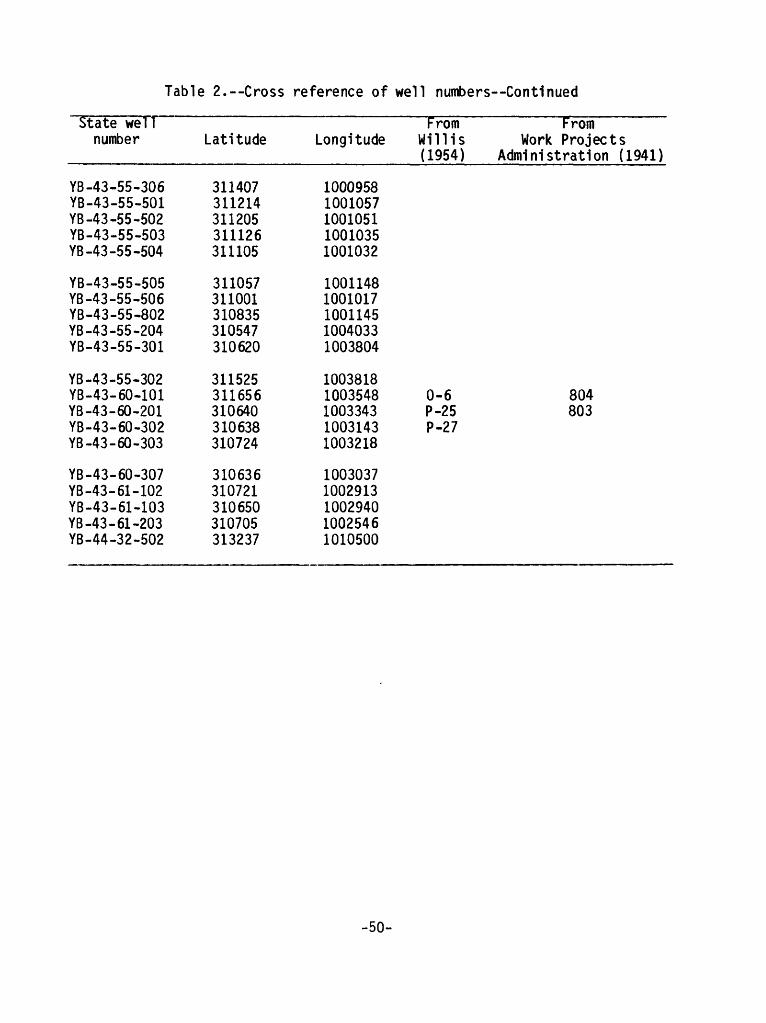
Table 2.--Cross reference of well numbers Continued
State well From Tromnumber Latitude Longitude Will is Work Projects
(1954) Administration (1941)
YB-43-55-306 YB-43-55-501 YB-43-55-502 YB-43-55-503 YB-43-55-504
YB-43-55-505 YB-43-55-506 YB-43-55-802 YB-43-55-204 YB-43-55-301
YB-43-55-302 YB-43-60-101 YB-43-60-201 YB-43-60-302 YB-43-60-303
YB-43-60-307 YB-43-61-102 YB-43-61-103 YB-43-61-203 YB-44-32-502
311407311214311205311126311105
311057311001310835310547310620
311525311656310640310638310724
310636310721310650310705313237
10009581001057100105110010351001032
10011481001017100114510040331003804
10038181003548100334310031431003218
10030371002913100294010025461010500
0-6P-25P-27
804803
-50-
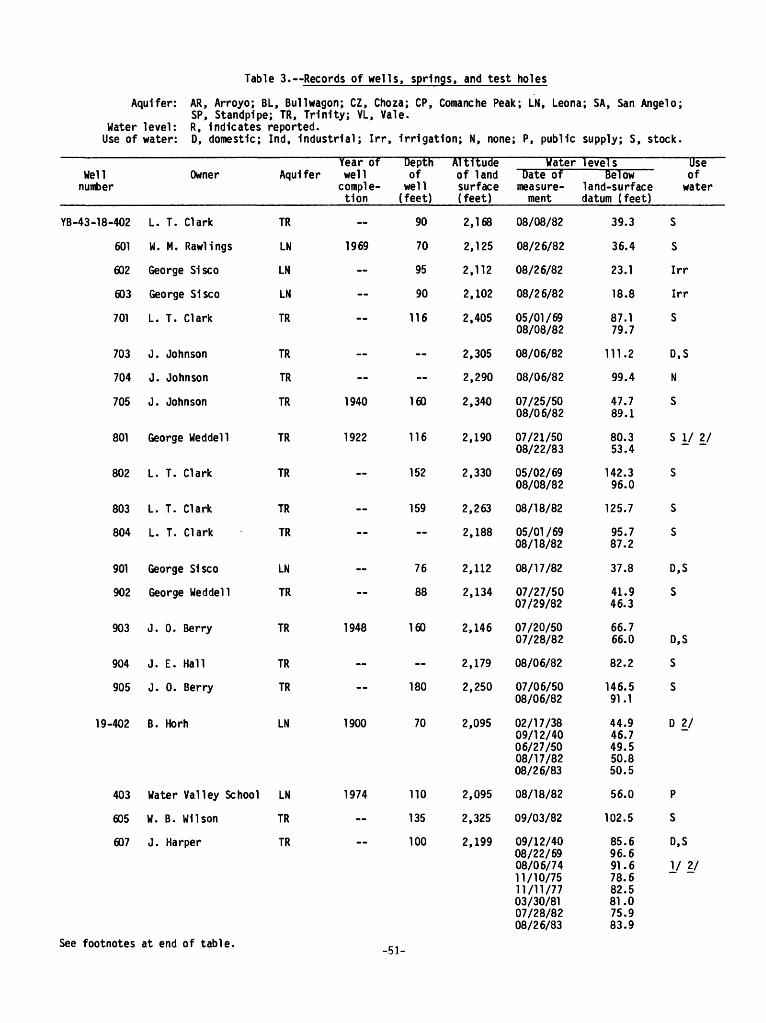
Table 3. Records of wells, springs, and test holes
Aquifer: AR, Arroyo; BL, Bullwagon; CZ, Choza; CP, Comanche Peak; LN, Leona; SA, San Angelo;SP, Standpipe; TR, Trinity; VL, Vale.
Water level: R, Indicates reported. Use of water: D, domestic; Ind, Industrial; Irr, Irrigation; N, none; P, public supply; S, stock.
Well number
YB-43 -18-402
601
602
603
701
703
704
705
801
802
803
804
901
902
903
904
905
19-402
403
605
607
Owner
L. T. Clark
W. M. Rawlings
George Slsco
George Slsco
L. T. Clark
J. Johnson
J. Johnson
J. Johnson
George Weddell
L. T. Clark
L. T. Clark
L. T. Clark
George Slsco
George Weddell
J. 0. Berry
J. E. Hall
J. 0. Berry
B. Horh
Water Valley School
W. B. Wilson
J. Harper
Aquifer
TR
LN
LN
LN
TR
TR
TR
TR
TR
TR
TR
TR
LN
TR
TR
TR
TR
LN
LN
TR
TR
Year of well
comple tion
1969
1940
1922
1948
1900
1974
Depth of
well (feet)
90
70
95
90
116
160
116
152
159
76
88
160
180
70
110
135
100
Altitude of land surface (feet)
2,168
2,125
2,112
2,102
2,405
2,305
2,290
2,340
2,190
2,330
2,263
2,188
2,112
2,134
2,146
2,179
2,250
2,095
2,095
2,325
2,199
WaterDate of
measure ment
08/08/82
08/26/82
08/26/82
08/26/82
05/01/69 08/08/82
08/06/82
08/06/82
07/25/50 08/06/82
07/21/50 08/22/83
05/02/69 08/08/82
08/18/82
05/01 /69 08/18/82
08/17/82
07/27/50 07/29/82
07/20/50 07/28/82
08/06/82
07/06/50 08/06/82
02/17/38 09/12/40 06/27/50 08/17/82 08/26/83
08/18/82
09/03/82
09/12/40 08/22/69 08/06/74 11/10/75 11/11/77 03/30/81 07/28/82 08/26/83
levelsBelow
land-surface datum (feet)
39.3
36.4
23.1
18.8
87.1 79.7
111.2
99.4
47.7 89.1
80.3 53.4
142.3 96.0
125.7
95.7 87.2
37.8
41.9 46.3
66.7 66.0
82.2
146.5 91.1
44.9 46.7 49.5 50.8 50.5
56.0
102.5
85.6 96.6 91.6 78.6 82.5 81.0 75.9 83.9
Use of
water
S
S
Irr
Irr
S
D,S
N
S
S I/ 2/
S
S
S
D,S
S
D,S
S
S
D 27
P
S
D,S
V 2/
See footnotes at end of table. -51-
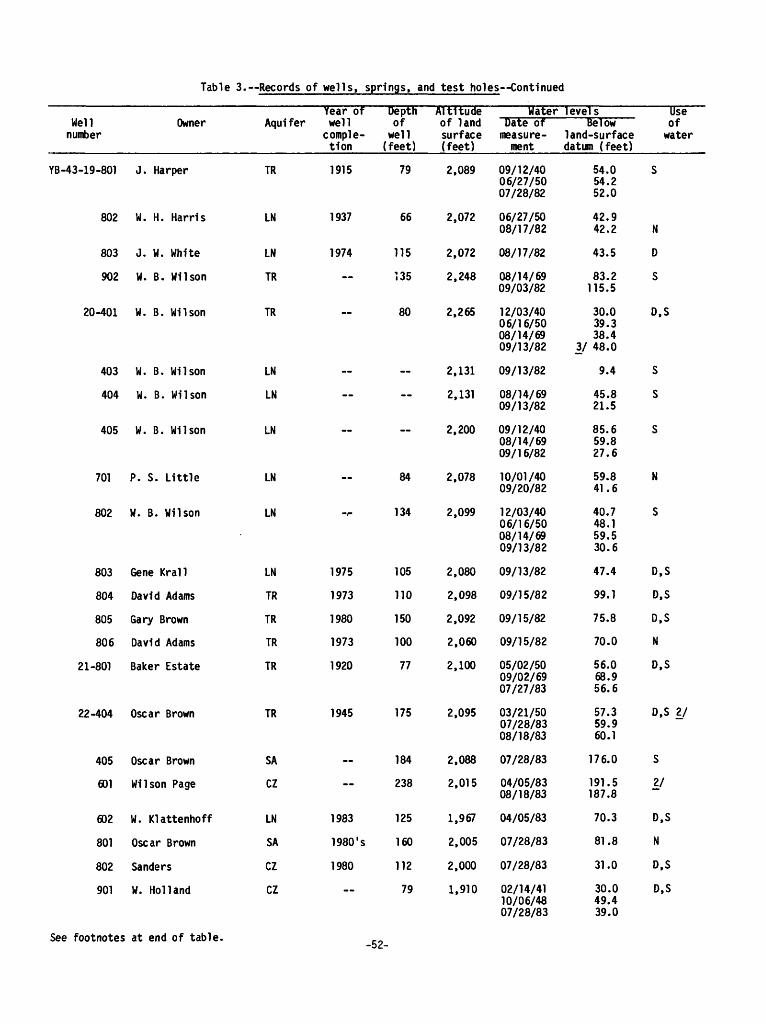
Table 3. Records of wells, springs, and test holes--Cont1nued
Well number
YB-43-19-801
802
803
902
20-401
403
404
405
701
802
803
804
805
806
21-801
22-404
405
601
602
801
802
901
Owner
J. Harper
W. H. Harris
J. W. White
W. B. Wilson
W. B. Wilson
W. B. Wilson
W. B. Wilson
W. B. Wilson
P. S. Little
W. B. Wilson
Gene Krall
David Adams
Gary Brown
David Adams
Baker Estate
Oscar Brown
Oscar Brown
Wilson Page
W. Klattenhoff
Oscar Brown
Sanders
W. Holland
Aqul f er
TR
LN
LN
TR
TR
LN
LN
LN
LN
LN
LN
TR
TR
TR
TR
TR
SA
CZ
LN
SA
CZ
CZ
Year of well
comple tion
1915
1937
1974
--
"
--
~
"^
1975
1973
1980
1973
1920
1945
--
1983
1980's
1980
Depth of
well (feet)
79
66
115
135
80
--
84
134
105
no150
100
77
175
184
238
125
160
112
79
Altitude of land surface (feet)
2,089
2,072
2,072
2,248
2,265
2,131
2,131
2,200
2,078
2,099
2,080
2,098
2,092
2,060
2,100
2,095
2,088
2,015
1,967
2,005
2,000
1,910
Water levelsDate of
measure ment
09/12/40 06/27/50 07/28/82
06/27/50 08/17/82
08/17/82
08/14/69 09/03/82
12/03/40 06/16/50 08/14/69 09/13/82
09/13/82
08/14/69 09/13/82
09/12/40 08/14/69 09/1 6/82
10/01/40 09/20/82
12/03/40 06/16/50 08/14/69 09/13/82
09/13/82
09/15/82
09/15/82
09/15/82
05/02/50 09/02/69 07/27/83
03/21/50 07/28/83 08/18/83
07/28/83
04/05/83 08/18/83
04/05/83
07/28/83
07/28/83
02/14/41 10/06/48 07/28/83
Below land-surface datum (feet)
54.0 54.2 52.0
42.9 42.2
43.5
83.2 115.5
30.0 39.3 38.4
3/ 48.0
9.4
45.8 21.5
85.6 59.8 27.6
59.8 41.6
40.7 48.1 59.5 30.6
47.4
99.1
75.8
70.0
56.0 68.9 56.6
57.3 59.9 60.1
176.0
191.5 187.8
70.3
81.8
31.0
30.0 49.4 39.0
Use of
water
S
N
D
S
D,S
S
S
S
N
S
D,S
D,S
D,S
N
D,S
D,S 2_/
S
yD,S
N
D,S
D,S
See footnotes at end of table. -52-
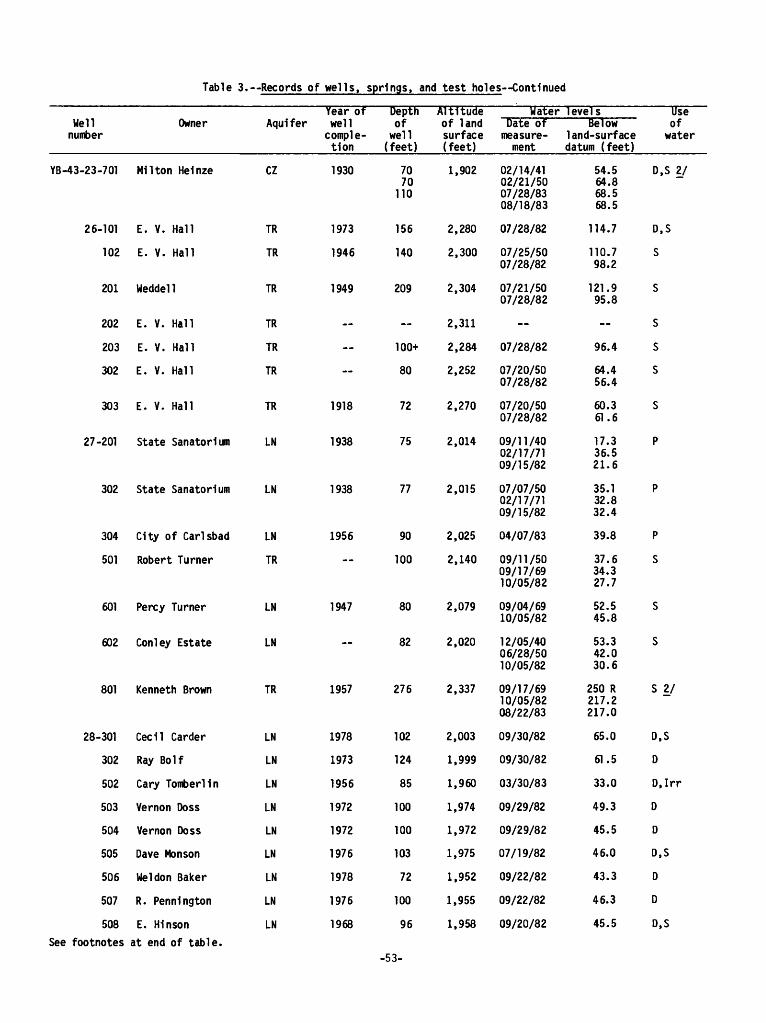
Table 3. Records of wells, springs, and test holes Continued
Well number
YB-43-23-701
26-101
102
201
202
203
302
303
27-201
302
304
501
601
602
801
28-301
302
502
503
504
505
506
507
508
Owner
Milton Heinze
E. V. Hall
E. V. Hall
Weddel 1
E. V. Hall
E. V. Hall
E. V. Hall
E. V. Hall
State Sanatorium
State Sanatorium
City of Carlsbad
Robert Turner
Percy Turner
Con ley Estate
Kenneth Brown
Cecil Carder
Ray Bo If
Cary Tomberlln
Vernon Doss
Vernon Doss
Dave Monson
Weldon Baker
R. Pennlngton
E. Hinson
Year of Aqu1 f er wel 1
comple tion
CZ
TR
TR
TR
TR
TR
TR
TR
LN
LN
LN
TR
LN
LN
TR
LN
LN
LN
LN
LN
LN
LN
LN
LN
1930
1973
1946
1949
1918
1938
1938
1956
--
1947
--
1957
1978
1973
1956
1972
1972
1976
1978
1976
1968
Depth of
well (feet)
70 70
110
156
140
209
100+
80
72
75
77
90
100
80
82
276
102
124
85
100
100
103
72
100
96
Altitude of land surface (feet)
1,902
2,280
2,300
2,304
2,311
2,284
2,252
2,270
2,014
2,015
2,025
2,140
2,079
2,020
2,337
2,003
1,999
1,960
1,974
1,972
1,975
1,952
1,955
1,958
Water 1 evel s UseDate of Below of
measure- land-surface water ment datum (feet)
02/14/41 02/21/50 07/28/83 08/18/83
07/28/82
07/25/50 07/28/82
07/21/50 07/28/82
07/28/82
07/20/50 07/28/82
07/20/50 07/28/82
09/11/40 02/17/71 09/15/82
07/07/50 02/17/71 09/15/82
04/07/83
09/11/50 09/17/69 10/05/82
09/04/69 10/05/82
12/05/40 06/28/50 10/05/82
09/17/69 10/05/82 08/22/83
09/30/82
09/30/82
03/30/83
09/29/82
09/29/82
07/19/82
09/22/82
09/22/82
09/20/82
54.5 64.8 68.5 68.5
114.7
110.7 98.2
121.9 95.8
96.4
64.4 56.4
60.3 61.6
17.3 36.5 21.6
35.1 32.8 32.4
39.8
37.6 34.3 27.7
52.5 45.8
53.3 42.0 30.6
250 R 217.2 217.0
65.0
61.5
33.0
49.3
45.5
46.0
43.3
46.3
45.5
D,S 2/
D,S
S
S
S
S
S
S
P
P
P
S
S
S
S 2/
D,S
D
D.Irr
D
D
D,S
D
D
D,S
See footnotes at end of table.-53-
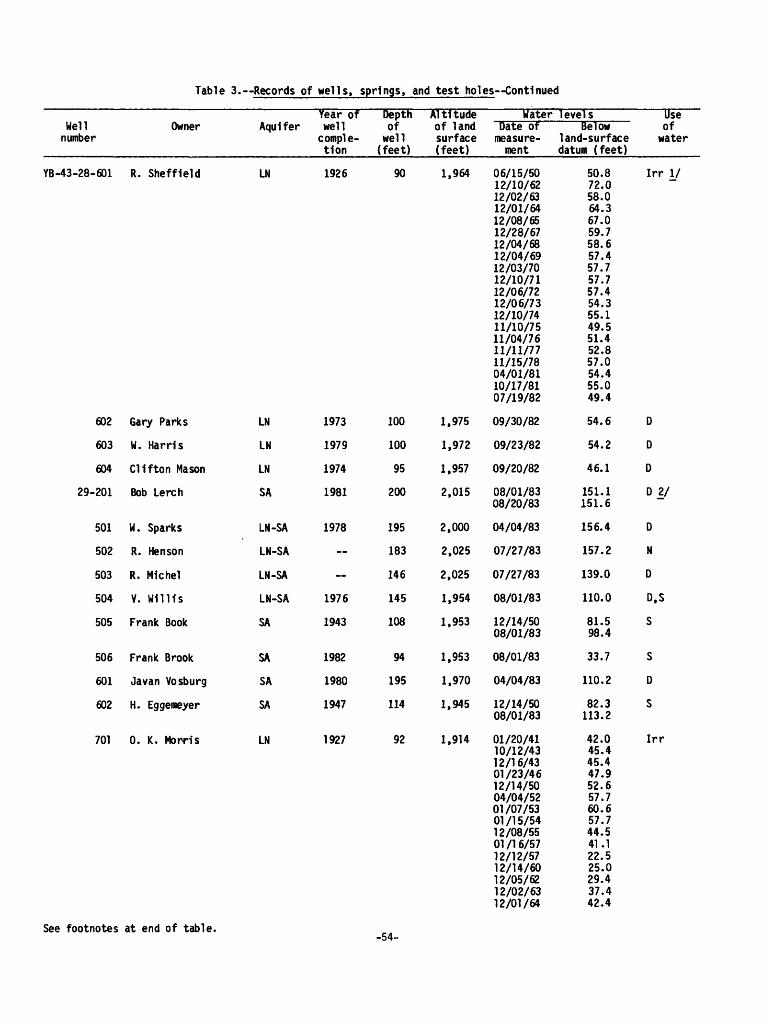
Table 3. Records of wells, springs, and test holes Continued
Well Owner number
YB-43-28-601 R. Sheffield
602 Gary Parks
603 W. Harris
604 Clifton Mason
29-201 Bob Lerch
501 W. Sparks
502 R. Hen son
503 R. Michel
504 V. Will Is
505 Frank Book
506 Frank Brook
601 Javan Vosburg
602 H. Eggemeyer
701 0. K. Morris
Year of Depth Aquifer well of
comple- well tlon (feet)
LN 1926 90
LN 1973 100
LN 1979 100
LN 1974 95
SA 1981 200
LN-SA 1978 195
LN-SA 183
LN-SA 146
LN-SA 1976 145
SA 1943 108
SA 1982 94
SA 1980 195
SA 1947 114
LN 1927 92
Altitude of land surface (feet)
1,964
1,975
1,972
1,957
2,015
2,000
2,025
2,025
1,954
1,953
1,953
1,970
1,945
1,914
WaterDate of
measure ment
06/15/5012/10/6212/02/6312/01/6412/08/6512/28/6712/04/6812/04/6912/03/7012/10/7112/06/7212/06/7312/10/7411/10/7511/04/7611/11/7711/15/7804/01/8110/17/8107/19/82
09/30/82
09/23/82
09/20/82
08/01/8308/20/83
04/04/83
07/27/83
07/27/83
08/01/83
12/14/5008/01/83
08/01/83
04/04/83
12/14/5008/01/83
01/20/4110/12/4312/16/4301/23/4612/14/5004/04/5201/07/5301/15/5412/08/5501/16/5712/12/5712/14/6012/05/6212/02/6312/01/64
levelsBelow
land-surface datum (feet)
50.872.058.064.367.059.758.657.457.757.757.454.355.149.551.452.857.054.455.049.4
54.6
54.2
46.1
151.1151.6
156.4
157.2
139.0
110.0
81.598.4
33.7
110.2
82.3113.2
42.045.445.447.952.657.760.657.744.541.122.525.029.437.442.4
Use of
water
Irr I/
D
D
D
D 21
D
N
D
D,S
S
S
D
S
Irr
See footnotes at end of table.-54-
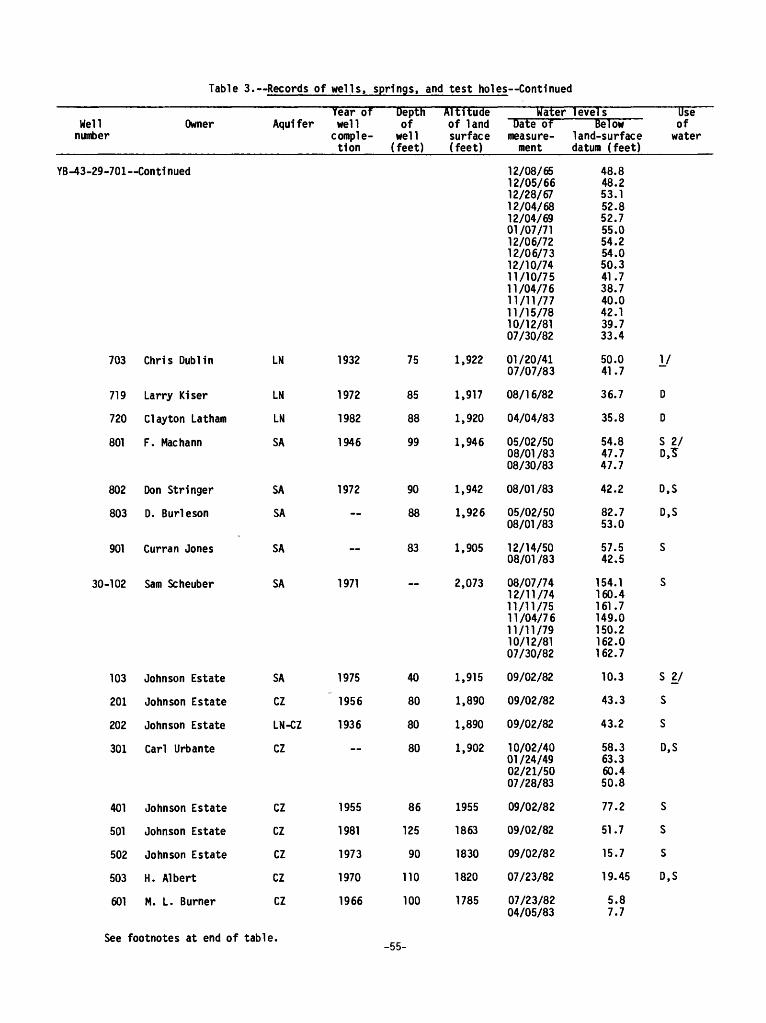
Table 3. Records of wells, springs, and test holes Continued
Well number
OwnerYear of
Aquifer well comple tion
Depth of
well (feet)
Altitude of land surface (feet)
YB-43-29-701 Continued
703
719
720
801
802
803
901
30-102
103
201
202
301
401
501
502
503
601
Chris Dublin
Larry K1ser
Clayton Latham
F. Machann
Don Stringer
D. Burleson
Curran Jones
Sam Scheuber
Johnson Estate
Johnson Estate
Johnson Estate
Carl Urbante
Johnson Estate
Johnson Estate
Johnson Estate
H. Albert
M. L. Burner
LN 1932
LN 1972
LN 1982
SA 1946
SA 1972
SA
SA
SA 1971
SA 1975
CZ 1956
LN-CZ 1936
CZ
CZ 1955
CZ 1981
CZ 1973
CZ 1970
CZ 1966
75
85
88
99
90
88
83
__
40
80
80
80
86
125
90
110
100
1,922
1,917
1,920
1,946
1,942
1,926
1,905
2,073
1,915
1,890
1,890
1,902
1955
1863
1830
1820
1785
WaterDate of
measure ment
12/08/6512/05/6612/28/6712/04/6812/04/6901/07/7112/06/7212/06/7312/10/7411/10/7511/04/7611/11/7711/15/7810/12/8107/30/82
01/20/4107/07/83
08/16/82
04/04/83
05/02/5008/01 /8308/30/83
08/01/83
05/02/5008/01/83
12/14/5008/01/83
08/07/7412/11/7411/11/7511/04/7611/11/7910/12/8107/30/82
09/02/82
09/02/82
09/02/82
10/02/4001/24/4902/21/5007/28/83
09/02/82
09/02/82
09/02/82
07/23/82
07/23/8204/05/83
levelsBelow
land-surface datum (feet)
48.848.253.152.852.755.054.254.050.341.738.740.042.139.733.4
50.041.7
36.7
35.8
54.847.747.7
42.2
82.753.0
57.542.5
154.1160.4161.7149.0150.2162.0162.7
10.3
43.3
43.2
58.363.360.450.8
77.2
51.7
15.7
19.45
5.87.7
Use of
water
I/
D
D
S 2/D/S~
D,S
D,S
S
S
S 2_/
S
S
D,S
S
S
S
D,S
See footnotes at end of table. -55-
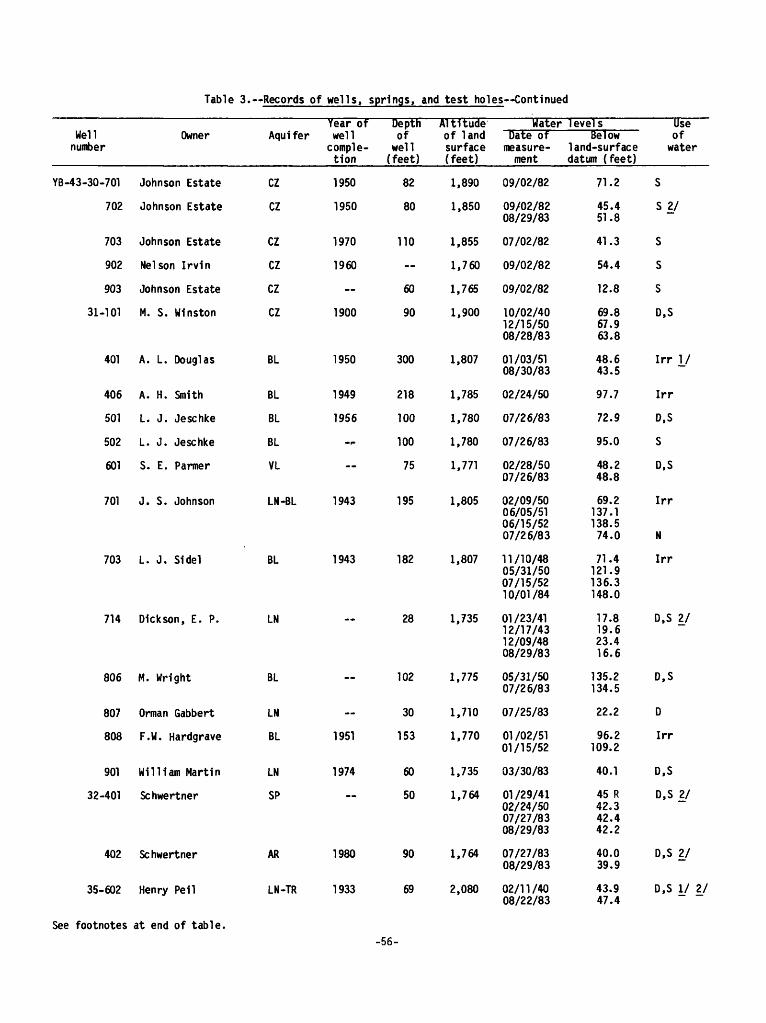
Table 3. Records of wells, springs, and test holes Continued
Well number
YB-43-30-701
702
703
902
903
31-101
401
406
501
502
601
701
703
714
806
807
808
901
32-401
402
35-602
Owner
Johnson Estate
Johnson Estate
Johnson Estate
Nelson Irvln
Johnson Estate
M. S. Winston
A. L. Douglas
A. H. Smith
L. J. Jeschke
L. J. Jeschke
S. E. Partner
J. S. Johnson
L. J. Sldel
Dickson, E. P.
M. WHght
Orman Gabbert
F.W. Hardgrave
Ml 11 1am Martin
Schwertner
Schwertner
Henry Pell
Aqul fer
CZ
CZ
CZ
CZ
CZ
CZ
BL
BL
BL
BL
VL
LN-BL
BL
LN
BL
LN
BL
LN
SP
AR
LN-TR
Year of well
comple tion
1950
1950
1970
1960
1900
1950
1949
1956
1943
1943
"
1951
1974
1980
1933
Depth of
well (feet)
82
80
110
60
90
300
218
100
100
75
195
182
28
102
30
153
60
50
90
69
Altitude of land surface (feet)
1,890
1,850
1,855
1,760
1,765
1,900
1,807
1,785
1,780
1,780
1,771
1,805
1,807
1,735
1,775
1,710
1,770
1,735
1,764
1,764
2,080
Water levelsDate of Below
measure- land-surface ment datum (feet)
09/02/82
09/02/82 08/29/83
07/02/82
09/02/82
09/02/82
10/02/40 12/15/50 08/28/83
01/03/51 08/30/83
02/24/50
07/26/83
07/26/83
02/28/50 07/26/83
02/09/50 06/05/51 06/15/52 07/26/83
11/10/48 05/31/50 07/15/52 10/01/84
01/23/41 12/17/43 12/09/48 08/29/83
05/31/50 07/26/83
07/25/83
01 /02/51 01/15/52
03/30/83
01/29/41 02/24/50 07/27/83 08/29/83
07/27/83 08/29/83
02/11/40 08/22/83
71.2
45.4 51.8
41.3
54.4
12.8
69.8 67.9 63.8
48.6 43.5
97.7
72.9
95.0
48.2 48.8
69.2 137.1 138.5 74.0
71.4 121.9 136.3 148.0
17.8 19.6 23.4 16.6
135.2 134.5
22.2
96.2 109.2
40.1
45 R 42.3 42.4 42.2
40.0 39.9
43.9 47.4
Use of
water
S
S 2/
S
S
S
D,S
Irr ]_/
Irr
D.S
S
D.S
Irr
N
Irr
D.S 2_/
D,S
D
Irr
D,S
D,S 2/
D,S 2/
D,S I/ 2/
See footnotes at end of table.-56-
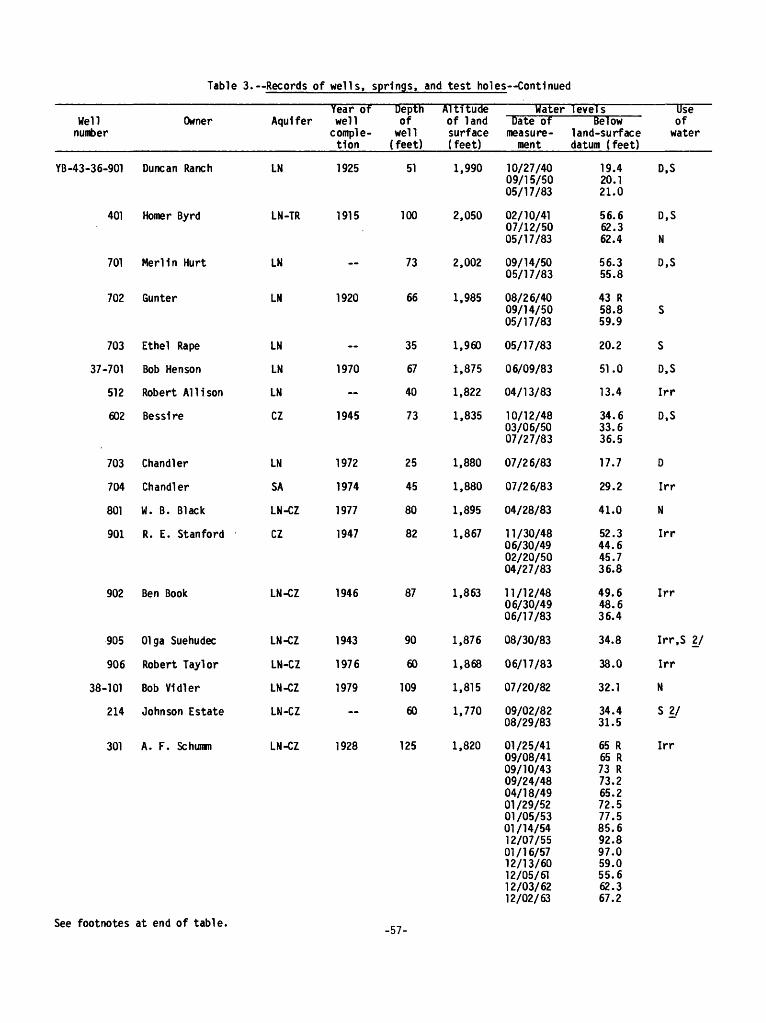
Table 3. Records of wells, springs, and test holes Continued
Well number
YB-43-36-901
401
701
702
703
37-701
512
602
703
704
801
901
902
905
906
38-101
214
301
Owner
Dune an Ranch
Homer Byrd
Merlin Hurt
Gunter
Ethel Rape
Bob Hen son
Robert Alii son
Besslre
Chandler
Chandler
U. B. Black
R. E. Stanford
Ben Book
01 ga Suehudec
Robert Taylor
Bob Vldler
Johnson Estate
A. F. Schumm
Year of Aqu1 f er wel 1
comple tion
LN 1925
LN-TR 1915
LN
LN 1920
LN
LN 1970
LN
CZ 1945
LN 1972
SA 1974
LN-CZ 1977
CZ 1947
LN-CZ 1946
LN-CZ 1943
LN-CZ 1976
LN-CZ 1979
LN-CZ
LN-CZ 1928
Depth of
well (feet)
51
100
73
66
35
67
40
73
25
45
80
82
87
90
60
109
60
125
Altitude of land surface ( feet)
1,990
2,050
2,002
1,985
1,960
1,875
1,822
1,835
1,880
1,880
1,895
1,867
1,863
1,876
1,868
1,815
1,770
1,820
Water levelsDate of Below
measure- land-surface ment datum (feet)
10/27/4009/15/5005/17/83
02/10/4107/12/5005/17/83
09/14/5005/17/83
08/26/4009/14/5005/17/83
05/17/83
06/09/83
04/13/83
10/12/4803/06/5007/27/83
07/26/83
07/26/83
04/28/83
11/30/4806/30/4902/20/5004/27/83
11/12/4806/30/4906/17/83
08/30/83
06/17/83
07/20/82
09/02/8208/29/83
01/25/4109/08/4109/10/4309/24/4804/18/4901/29/5201/05/5301/14/5412/07/5501/16/5712/13/6012/05/6112/03/6212/02/63
19.420.121.0
56.662.362.4
56.355.8
43 R58.859.9
20.2
51.0
13.4
34.633.636.5
17.7
29.2
41.0
52.344.645.736.8
49.648.636.4
34.8
38.0
32.1
34.431.5
65 R65 R73 R73.265.272.577.585.692.897.059.055.662.367.2
Use of
water
D,S
D,S
N
D,S
S
S
D,S
Irr
D,S
D
Irr
N
Irr
Irr
Irr.S 2/
Irr
N
S 2/
Irr
See footnotes at end of table. -57-
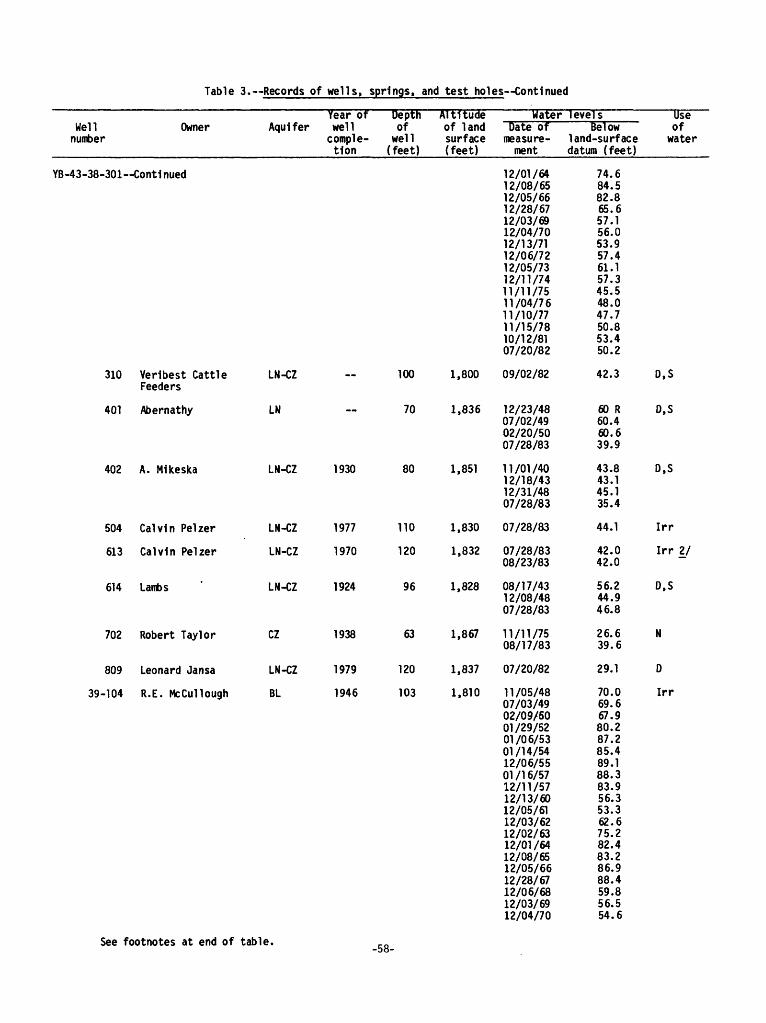
Table 3. Records of wells, springs, and test holes Continued
Year of Depth Altitude water levels UseWell
numberOwner
YB -43-38-301 Continued
310
401
402
504
613
614
702
809
39-104
Verlbest CattleFeeders
Abernathy
A. Mlkeska
Calvin Pelzer
Calvin Pelzer
Lambs
Robert Taylor
Leonard Jansa
R.E. McCul lough
Aquifer well of of land Date of Below of comple- well surface measure- land-surface water tlon (feet) (feet) ment datum (feet)
12/01/6412/08/6512/05/6612/28/6712/03/6912/04/7012/13/7112/06/7212/05/7312/11/7411/11/7511/04/7611/10/7711/15/7810/12/8107/20/82
LN-CZ 100 1,800 09/02/82
LN 70 1,836 12/23/4807/02/4902/20/5007/28/83
LN-CZ 1930 80 1,851 11/01/4012/18/4312/31/4807/28/83
LN-CZ 1977 110 1,830 07/28/83
LN-CZ 1970 120 1,832 07/28/8308/23/83
LN-CZ 1924 96 1,828 08/17/4312/08/4807/28/83
CZ 1938 63 1,867 11/11/7508/17/83
LN-CZ 1979 120 1,837 07/20/82
BL 1946 103 1,810 11/05/4807/03/4902/09/5001/29/5201/06/5301/14/5412/06/5501/16/5712/11/5712/13/6012/05/6112/03/6212/02/6312/01/6412/08/6512/05/6612/28/6712/06/6812/03/6912/04/70
74.684.582.865.657.156.053.957.461.157.345.548.047.750.853.450.2
42.3 D,S
60 R D,S60.460.639.9
43.8 D.S43.145.135.4
44.1 Irr
42.0 Irr 2/42.0
56.2 D,S44.946.8
26.6 N39.6
29.1 D
70.0 Irr69.667.980.287.285.489.188.383.956.353.362.675.282.483.286.988.459.856.554.6
See footnotes at end of table. -58-
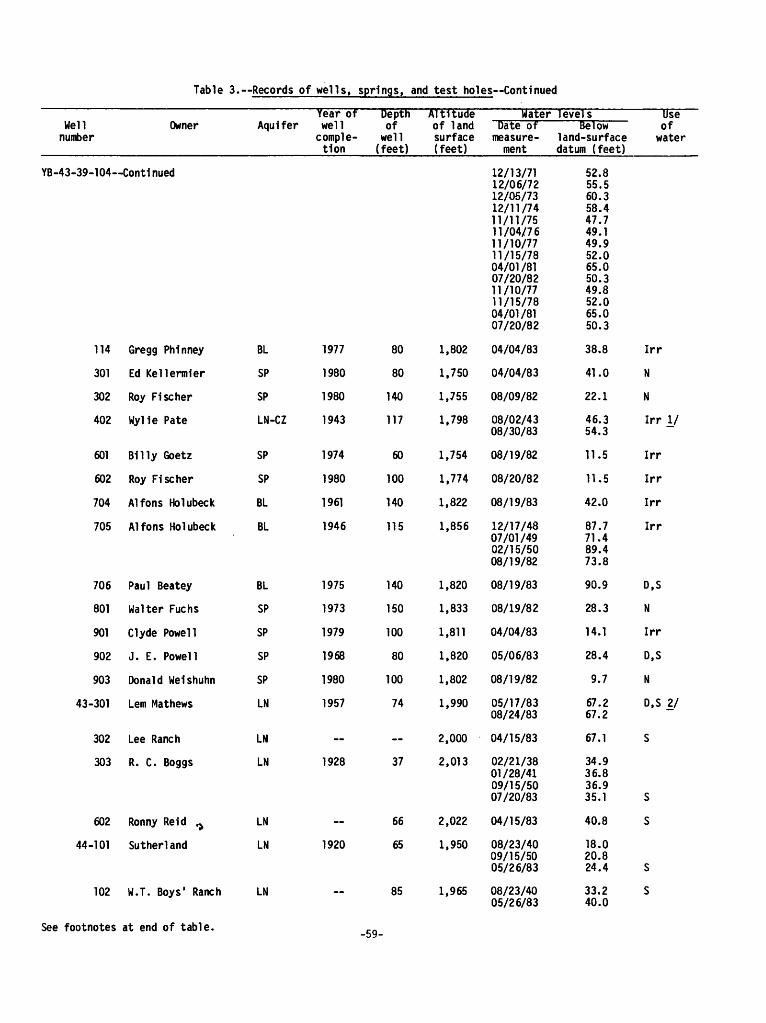
Table 3. Records of wells, springs, and test holes Continued
well number
Owner AquiferYear of well
comple tion
Depth of
well (feet)
Altitude of land surface (feet)
YB -43-39-104 Contl nued
114
301
302
402
601
602
704
705
706
801
901
902
903
43-301
302
303
602
44-101
102
Gregg Phlnney
Ed Kellermler
Roy Fischer
Wylie Pate
Billy Goetz
Roy Fischer
Alfons Holubeck
Alfons Holubeck
Paul Beatey
Walter Fuchs
Clyde Powell
J. E. Powell
Donald Weishuhn
Lem Mathews
Lee Ranch
R. C. Boggs
Ronny Reid .^
Sutherland
W.T. Boys' Ranch
BL
SP
SP
LN-CZ
SP
SP
BL
BL
BL
SP
SP
SP
SP
LN
LN
LN
LN
LN
LN
1977
1980
1980
1943
1974
1980
1961
1946
1975
1973
1979
1968
1980
1957
1928
1920
__
80
80
140
117
60
100
140
115
140
150
100
80
100
74
37
66
65
85
1,802
1,750
1,755
1,798
1,754
1,774
1,822
1,856
1,820
1,833
1,811
1,820
1,802
1,990
2,000
2,013
2,022
1,950
1,965
WaterDate of
measure ment
12/13/7112/06/7212/05/7312/11/7411/11/7511/04/7611/10/7711/15/7804/01/8107/20/8211/10/7711/15/7804/01/8107/20/82
04/04/83
04/04/83
08/09/82
08/02/4308/30/83
08/19/82
08/20/82
08/19/83
12/17/4807/01/4902/15/5008/19/82
08/19/83
08/19/82
04/04/83
05/06/83
08/19/82
05/17/8308/24/83
04/15/83
02/21/3801/28/4109/15/5007/20/83
04/15/83
08/23/4009/15/5005/26/83
08/23/4005/26/83
1 evel sBelow
land-surface datum (feet)
52.855.560.358.447.749.149.952.065.050.349.852.065.050.3
38.8
41.0
22.1
46.354.3
11.5
11.5
42.0
87.771.489.473.8
90.9
28.3
14.1
28.4
9.7
67.267.2
67.1
34.936.836.935.1
40.8
18.020.824.4
33.240.0
Use of
water
Irr
N
N
Irr y
Irr
Irr
Irr
Irr
D,S
N
Irr
D,S
N
D,S 2/
S
S
S
S
S
See footnotes at end of table. -59-
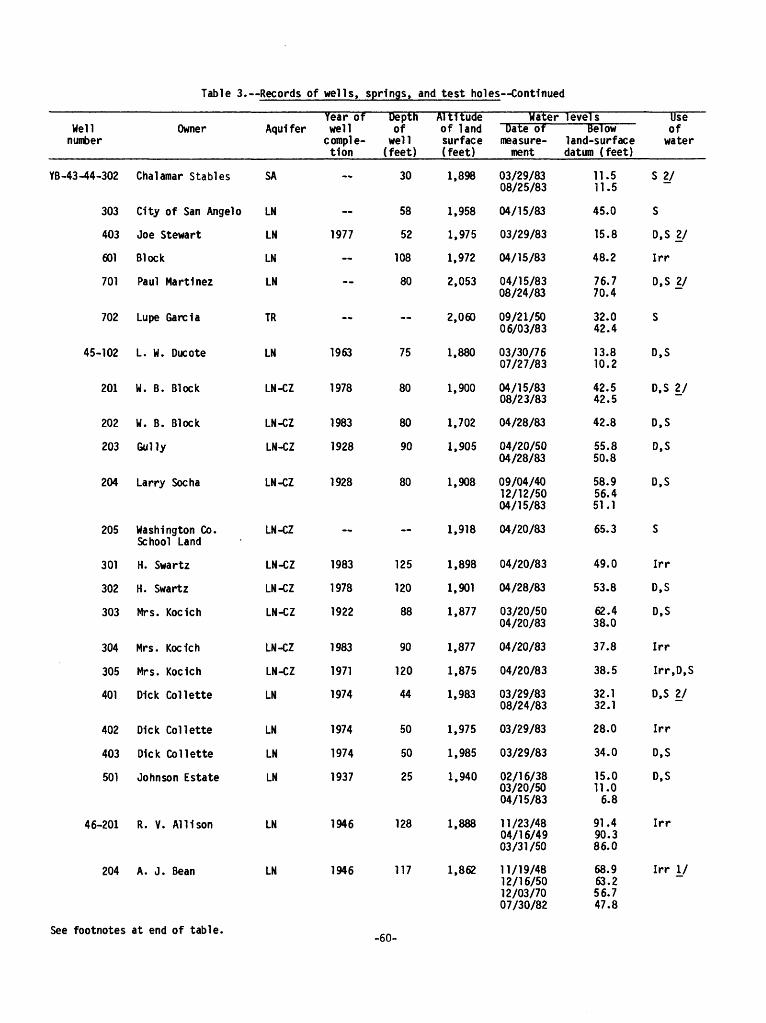
Table 3. Records of wells, springs, and test holes Continued
Well number
YB -43-44-302
303
403
601
701
702
45-102
201
202
203
204
205
301
302
303
304
305
401
402
403
501
46-201
204
Owner
Chalamar Stables
City of San Angel o
Joe Stewart
Block
Paul Marti nez
Lupe Garcia
L. W. Ducote
W. B. Block
W. B. Block
Gully
Larry Socha
Washington Co. School Land
H. Swartz
H. Swartz
Mrs. Koclch
Mrs. Koclch
Mrs. Koclch
D1ck Collette
Dick Collette
Dick Collette
Johnson Estate
R. V. Alii son
A. J. Bean
Aqu1 fer
SA
LN
LN
LN
LN
TR
LN
LN-CZ
LN-CZ
LN-CZ
LN-CZ
LN-CZ
LN-CZ
LN-CZ
LN-CZ
LN-CZ
LN-CZ
LN
LN
LN
LN
LN
LN
Year of well
comple tion
~
~
1977
1963
1978
1983
1928
1928
~
1983
1978
1922
1983
1971
1974
1974
1974
1937
1946
1946
Depth of
well (feet)
30
58
52
108
80
75
80
80
90
80
125
120
88
90
120
44
50
50
25
128
117
Altitude of land surface (feet)
1,898
1,958
1,975
1,972
2,053
2,060
1,880
1,900
1,702
1,905
1,908
1,918
1,898
1,901
1,877
1,877
1,875
1,983
1,975
1,985
1,940
1,888
1,862
WaterDate of
measure ment
03/29/83 08/25/83
04/15/83
03/29/83
04/15/83
04/15/83 08/24/83
09/21/50 06/03/83
03/30/76 07/27/83
04/15/83 08/23/83
04/28/83
04/20/50 04/28/83
09/04/40 12/12/50 04/15/83
04/20/83
04/20/83
04/28/83
03/20/50 04/20/83
04/20/83
04/20/83
03/29/83 08/24/83
03/29/83
03/29/83
02/16/38 03/20/50 04/15/83
11/23/48 04/16/49 03/31/50
11/19/48 12/16/50 12/03/70 07/30/82
levelsBelow
land-surface datum (feet)
11.5 11.5
45.0
15.8
48.2
76.7 70.4
32.0 42.4
13.8 10.2
42.5 42.5
42.8
55.8 50.8
58.9 56.4 51.1
65.3
49.0
53.8
62.4 38.0
37.8
38.5
32.1 32.1
28.0
34.0
15.0 11.0
6.8
91.4 90.3 86.0
68.9 63.2 56.7 47.8
Use of
water
S 2/
S
D,S 2/
Irr
D,S^/
S
D,S
D,S 2/
D,S
D,S
D,S
S
Irr
D,S
D,S
Irr
Irr.D.S
D,S 2/
Irr
D,S
D,S
Irr
Irr I/
See footnotes at end of table. -60-

Table 3.--Records of wells, springs, and test holes Continued
Well number
YB-43-46-301
306
307
601
602
47-101
201
202
301
302
303
304
305
502
902
See footnotes
Owner
Ripple Bros.
Wall Trading
Bobby Eggemeyer
Myrl Wilde
Wilbert Jost
Otto Strube
J. Hunt
J. Dusek
J. K. Roberts
H. Schwertner
Powell Trust
G. H. Jones
M. Goetz
Travls Alien
Mrs. D. A. Robinson
at end of table.
Year of Aquifer well
comple tion
LN-BL 1949
BL 1973
BL 1978
BL 1977
BL 1978
BL 1948
AR 1973
AR 1966
AR
AR
AR 1973
AR 1960
AR 1983
AR 1981
AR 1967
Depth of
well (feet)
214
130
160
160
150
122
80
100
100
100
100
80
100
120
100
Altitude of land surface (feet)
1,884
1,867
1,924
1,932
1,946
1,861
1,864
1,846
1,845
1,836
1,825
1,852
1,855
1,917
1,997
WaterDate of
measure ment
04/16/4906/30/4901/29/5201/07/5301/15/5412/07/5501/17/5712/12/5712/13/6012/05/6112/03/6212/02/6312/01/6412/08/6512/05/6612/27/6712/05/6812/04/6912/03/7012/10/7112/06/7212/05/7312/11/7411/11/7511/04/7611/10/7711/15/7810/17/8107/20/82
04/06/83
05/06/83
04/06/83
04/06/83
12/09/4804/17/5107/30/82
04/04/83
05/06/83
05/06/8308/17/83
05/06/83
05/06/83
05/06/83
04/04/83
04/04/83
04/05/83
1 evel sBelow
land-surface datum (feet)
104.599.7
122.5131.6131.0133.7134.7106.567.963.884.5
121.4135.0132.3134.6134.778.785.582.692.098.492.090.462.065.356.468.971.462.2
50.7
81.5
76.7
86.1
92.3105.680.4
18.3
33.5
57.243.4
39.6
32.8
33.6
31.7
47.6
90.4
Use of
water
Irr I/
N
Irr
Irr
Irr
Irr
Irr
Irr.S 27
D,S
D,S
S
D.S
S
S
-61-
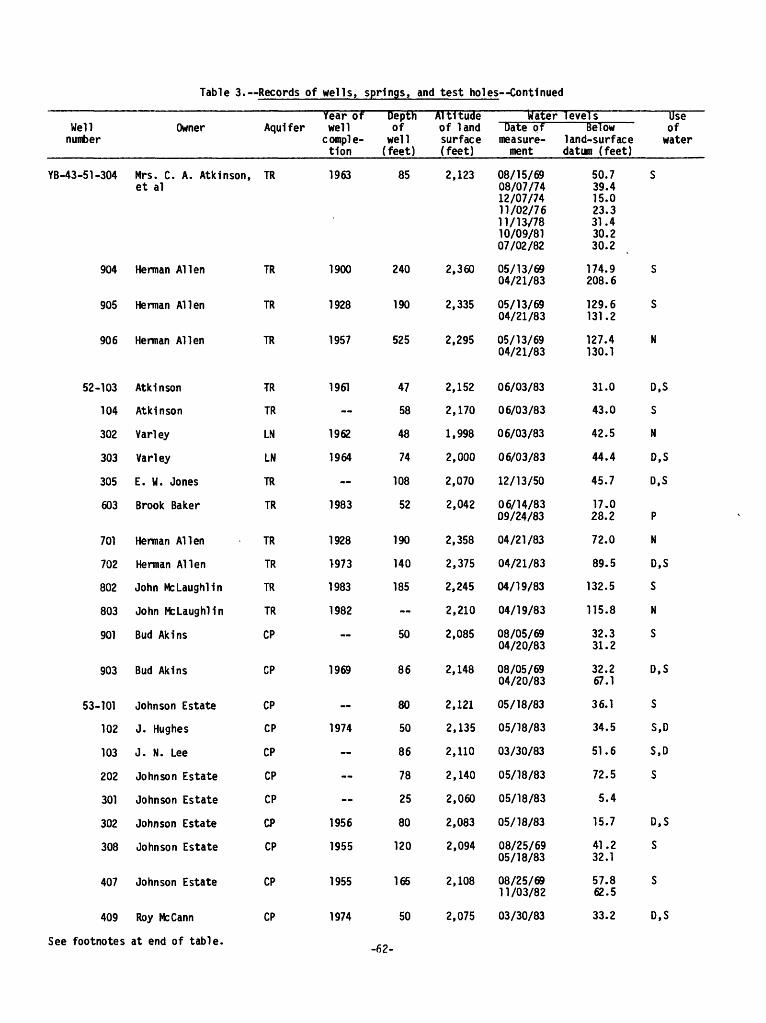
Table 3. Records of wells, springs, and test holes Continued
Well number
YB -43 -5 1-304
904
905
906
52-103
104
302
303
305
603
701
702
802
803
901
903
53-101
102
103
202
301
302
308
407
409
See footnotes
Owner
Mrs. C. A. Atklnson, et al
Herman Alien
Herman Alien
Herman Alien
Atklnson
Atklnson
Varley
Varley
E. W. Jones
Brook Baker
Herman Alien
Herman Alien
John McLaughlin
John McLaughlin
Bud Akins
Bud Akins
Johnson Estate
J. Hughes
J. N. Lee
Johnson Estate
Johnson Estate
Johnson Estate
Johnson Estate
Johnson Estate
Roy McCann
at end of table.
Year of Depth Aquifer well of
comple- well tlon (feet)
TR
TR
TR
TR
TR
TR
LN
LN
TR
TR
TR
TR
TR
TR
CP
CP
CP
CP
CP
CP
CP
CP
CP
CP
CP
1963
1900
1928
1957
1961
1962
1964
1983
1928
>973
1983
1982
~
1969
~
1974
~
1956
1955
1955
1974
85
240
190
525
47
58
48
74
108
52
190
140
185
50
86
80
50
86
78
25
80
120
165
50
-62-
Altltude of land surface (feet)
2,123
2,360
2,335
2,295
2,152
2,170
1,998
2,000
2,070
2,042
2,358
2,375
2,245
2,210
2,085
2,148
2,121
2,135
2,110
2,140
2,060
2,083
2,094
2,108
2,075
Water levelsDate of Below
measure- land-surface ment datum (feet)
08/15/69 08/07/74 12/07/74 11/02/76 11/13/78 10/09/81 07/02/82
05/13/69 04/21/83
05/13/69 04/21/83
05/13/69 04/21/83
06/03/83
06/03/83
06/03/83
06/03/83
12/13/50
06/14/83 09/24/83
04/21/83
04/21/83
04/19/83
04/19/83
08/05/69 04/20/83
08/05/69 04/20/83
05/18/83
05/18/83
03/30/83
05/18/83
05/18/83
05/18/83
08/25/69 05/18/83
08/25/69 11/03/82
03/30/83
50.7 39.4 15.0 23.3 31.4 30.2 30.2
174.9 208.6
129.6 131.2
127.4 130.1
31.0
43.0
42.5
44.4
45.7
17.0 28.2
72.0
89.5
132.5
115.8
32.3 31.2
32.2 67.1
36.1
34.5
51.6
72.5
5.4
15.7
41.2 32.1
57.8 62.5
33.2
Use of
water
S
S
S
N
D,S
S
N
D,S
D,S
P
N
D,S
S
N
S
D,S
S
S,D
S,D
S
D,S
S
S
D,S
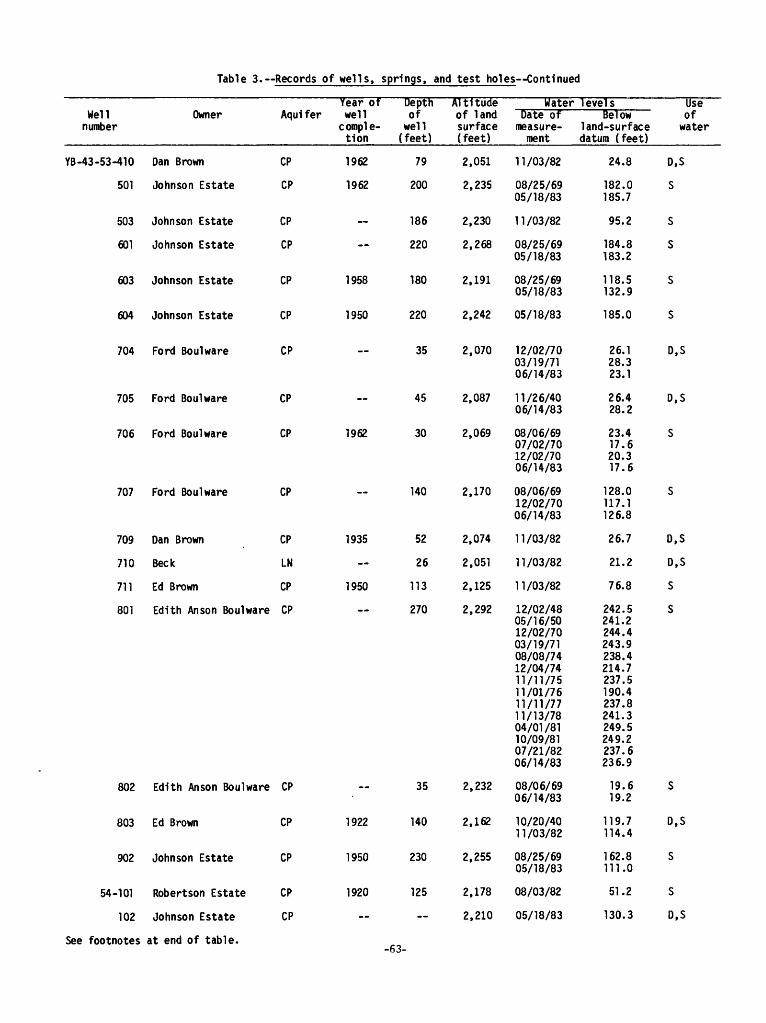
Table 3. Records of wells, springs, and test holes Continued
Well number
YB-43-53-410
501
503
601
603
604
704
705
706
707
709
710
711
801
802
803
902
54-101
102
Owner
Dan Brown
Johnson Estate
Johnson Estate
Johnson Estate
Johnson Estate
Johnson Estate
Ford Boulware
Ford Boulware
Ford Boulware
Ford Boulware
Dan Brown
Beck
Ed Brown
Edith An son Boulware
Edith An son Boulware
Ed Brown
Johnson Estate
Robertson Estate
Johnson Estate
Aqui fer
CP
CP
CP
CP
CP
CP
CP
CP
CP
CP
CP
LN
CP
CP
CP
CP
CP
CP
CP
Year of well
c ompl e- tion
1962
1962
__
1958
1950
-_
1962
__
1935
1950
__
__
1922
1950
1920
_.
Depth of
well (feet)
79
200
186
220
180
220
35
45
30
140
52
26
113
270
35
140
230
125
__
Altitude of land surface (feet)
2,051
2,235
2,230
2,268
2,191
2,242
2,070
2,087
2,069
2,170
2,074
2,051
2,125
2,292
2,232
2,162
2,255
2,178
2,210
WaterDate of
measure ment
11/03/82
08/25/6905/18/83
11/03/82
08/25/6905/18/83
08/25/6905/18/83
05/18/83
12/02/7003/19/7106/14/83
11/26/4006/14/83
08/06/6907/02/7012/02/7006/14/83
08/06/6912/02/7006/14/83
11/03/82
11/03/82
11/03/82
12/02/4805/16/5012/02/7003/19/7108/08/7412/04/7411/11/7511/01/7611/11/7711/13/7804/01/8110/09/8107/21/8206/14/83
08/06/6906/14/83
10/20/4011/03/82
08/25/6905/18/83
08/03/82
05/18/83
1 evel sBelow
land-surface datum (feet)
24.8
182.0185.7
95.2
184.8183.2
118.5132.9
185.0
26.128.323.1
26.428.2
23.417.620.317.6
128.0117.1126.8
26.7
21.2
76.8
242.5241.2244.4243.9238.4214.7237.5190.4237.8241.3249.5249.2237.6236.9
19.619.2
119.7114.4
162.8111.0
51.2
130.3
Use of
water
D,S
S
S
S
S
S
D,S
D,S
S
S
D,S
D,S
S
S
S
D,S
S
S
D,S
See footnotes at end of table. -63-

Table 3. Records of wells, springs, and test holes Continued
Well number
YB -43-54-202
203
401
402
404
501
801
55-101
201
202
206
302
306
501
502
Owner
J. 0. Robert son
Mary Bunyard
Johnson Estate
Johnson Estate
Johnson Estate
Johnson Estate
Johnson Estate
Joe Mertz
Lee Pfluger
Joe Mertz
Joe Mertz
Joe Mertz
Joe Mertz
Lee Pfluger
Lee Pfluger
Year of Aqu1 f er wel 1
comple tion
CP 1947
CP 1961
CP 1920
CP
CP
CP
CP 1930
CP 1925
CP 1956
CP
CP 1967
CP
CP
CP 1956
CP 1956
Depth of
well (feet)
110
260
110
100
215
166
175
100
200
100
100
91
100
225
201
Altitude of land surface (feet)
22206
2,327
2,145
2,138
2,287
2,262
2,272
2,170
2,221
2,155
2,094
2,096
2,105
2,212
2,220
WaterDate of
measure ment
05/13/6908/08/7411/11/7511/15/7804/01/8108/03/82
05/13/6908/03/82
10/10/4003/20/5011/04/82
08/26/6911/04/8208/17/83
08/26/6911/04/82
09/15/6911/04/82
09/15/6911/04/82
04/05/83
04/29/6910/18/82
09/23/6904/05/83
04/05/83
12/11/6709/23/6904/05/83
09/23/6904/05/83
04/29/6910/18/82
04/29/6908/08/7412/07/7411/11/7511/01/7611/15/7711/15/7809/01/8210/18/8211/05/8212/21/8201/28/8302/24/8304/06/8305/06/8306/17/8307/07/8308/17/83
levels UseBelow of
land-surface water datum (feet)
105.1 S105.499.6
103.6102.2103.0
252.4 S250.2
87.1 D,S73.378.2
71.8 D,S 2/70.476.0
178.4 S192.9
146.6 S160.3
157.0 D.S170.5
54.0 S
155.7 S157.9
81.5 S76.8
21.7 S
38.9 N38.438.6
45.2 S44.7
155.8 S118.8
129.9 D,S I/ 2/131.7 ~ ~130.0129.0128.6128.0131.5128.2131.7130.8131.9128.0129.8128.8130.9127.7136.6134.0
See footnotes at end of table. -64-
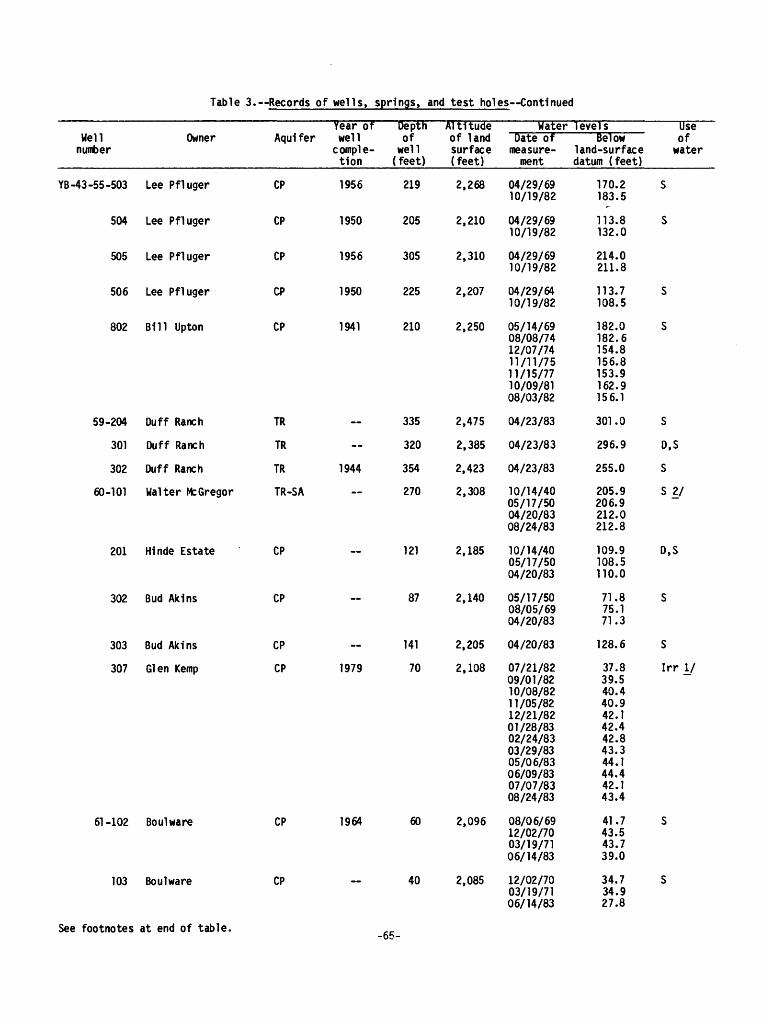
Table 3. Records of wells, springs, and test holes Continued
Well number
YB -43 -55 -503
504
505
506
802
59-204
301
302
60-101
201
302
303
307
61-102
103
Year of Owner Aqu1 fer wel 1
comple tion
Lee Pfluger CP 1956
Lee Pfluger CP 1950
Lee Pfluger CP 1956
Lee Pfluger CP 1950
Bill Upton CP 1941
Duff Ranch TR
Duff Ranch TR
Duff Ranch TR 1944
Walter McGregor TR-SA
H1nde Estate CP
Bud Aklns CP
Bud Aklns CP
Glen Kemp CP 1979
Boulware CP 1964
Boulware CP
Depth Altitude of of land
wel 1 surface ( feet) ( feet)
219 2,268
205 2,210
305 2,310
225 2,207
210 2,250
335 2,475
320 2,385
354 2,423
270 2,308
121 2,185
87 2,140
141 2,205
70 2,108
60 2,096
40 2,085
Water levels UseDate of Below of
measure- land-surface water ment datum (feet)
04/29/6910/19/82
04/29/6910/19/82
04/29/6910/19/82
04/29/6410/19/82
05/14/6908/08/7412/07/7411/11/7511/15/7710/09/8108/03/82
04/23/83
04/23/83
04/23/83
10/14/4005/17/5004/20/8308/24/83
10/14/4005/17/5004/20/83
05/17/5008/05/6904/20/83
04/20/83
07/21/8209/01/8210/08/8211/05/8212/21/8201/28/8302/24/8303/29/8305/06/8306/09/8307/07/8308/24/83
08/06/6912/02/7003/19/7106/14/83
12/02/7003/19/7106/14/83
170.2 S183.5
113.8 S132.0
214.0211.8
113.7 S108.5
182.0 S182.6154.8156.8153.9162.9156.1
301.0 S
296.9 D,S
255.0 S
205.9 S 2/206.9212.0212.8
109.9 D,S108.5110.0
71.8 S75.171.3
128.6 S
37.8 Irr I/39.540.440.942.142.442.843.344.144.442.143.4
41.7 S43.543.739.0
34.7 S34.927.8
See footnotes at end of table. -65-

Table 3. Records of wells, springs, and test holes Continued
Well number
YB-43-61-203
44-32-502
Owner
Boulware
El a Sugs
Aqul f er
CP
Tr
Year of well
comple tion
~
1957
Depth of
well (feet)
213
Altitude of land surface (feet)
2,163
2,568
WaterDate of
measure ment
12/02/70 03/19/71 06/14/83
09/26/67 08/22/83
1 evel sBelow
land-surface datum (feet)
77.8 78.5 73.8
165.9 141.6
Use of
water
S
S 2 /
I/ See figures 7 and 8.27 See table 7.?/ Water level measured while well pumping.
-66-
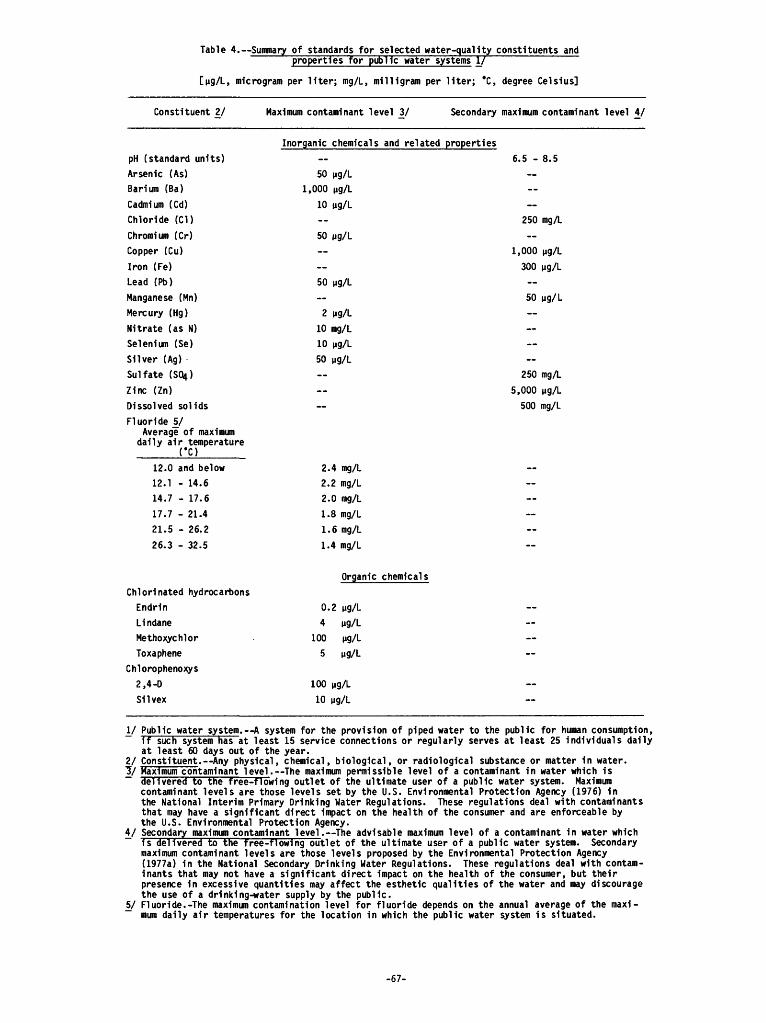
Table 4. Summary of standards for selected water-quality constituents and properties for public water systems I/
[Mg/L, microgram per liter; mg/L, milligram per liter; °C, degree Celsius]
Constituent 2] Maximum contaminant level _3/ Secondary maximum contaminant level V
Inorganic chemicals and related properties
pH (standard units) 6.5 - 8.5Arsenic (As) 50 ng/LBarium (Ba) 1,000 ng/L
Cadmium (Cd) 10 ug/L
Chloride (CD 250 mg/L
Chromium (Cr) 50 Mg/LCopper (Cu) 1,000 Mg/L
Iron (Fe) 300 ng/LLead (Pb) 50 ng/L
Manganese (Mn) 50 Mg/LMercury (Hg) 2 Mg/L
Nitrate (as N) 10 mg/LSelenium (Se) 10 \ig/L
Silver (Ag) 50 Mg/LSulfate ($04) 250 mg/L
Zinc (Zn) -- 5,000 ng/LDissolved solids 500 mg/L
Fluor ide S/Average of maximum
daily air temperatureCO
12.0 and below 2.4 mg/L12.1 - 14.6 2.2 mg/L14.7 - 17.6 2.0 mg/L
17.7 - 21.4 1.8 mg/L21.5 - 26.2 1.6 mg/L
26.3 - 32.5 1.4 mg/L
Organic chemicals
Chlorinated hydrocarbonsEndrin 0.2 ng/LLindane 4 ng/LMethoxychlor 100 ng/LToxaphene 5 ng/L
Chlorophenoxys2,4-D 100Sllvex 10
y Public water system. A system for the provision of piped water to the public for human consumption, if such system has at least 15 service connections or regularly serves at least 25 individuals dally at least 60 days out of the year.
21 Constituent. Any physical, chemical, biological, or radiological substance or matter in water.7/ Maximum contaminant level. The maximum permissible level of a contaminant in water which 1s
delivered to the free-flowing outlet of the ultimate user of a public water system. Maximum contaminant levels are those levels set by the U.S. Environmental Protection Agency (1976) in the National Interim Primary Drinking Water Regulations. These regulations deal with contaminants that may have a significant direct impact on the health of the consumer and are enforceable by the U.S. Environmental Protection Agency.
4_/ Secondary maximum contaminant level . The advisable maximum level of a contaminant in water which is delivered to the free-flowing outlet of the ultimate user of a public water system. Secondary maximum contaminant levels are those levels proposed by the Environmental Protection Agency (1977a) in the National Secondary Drinking Water Regulations. These regulations deal with contam inants that may not have a significant direct impact on the health of the consumer, but their presence in excessive quantities may affect the esthetic qualities of the water and may discourage the use of a drinking-water supply by the public.
5/ Fluoride.-The maximum contamination level for fluoride depends on the annual average of the maxi mum daily air temperatures for the location in which the public water system 1s situated.
-67-
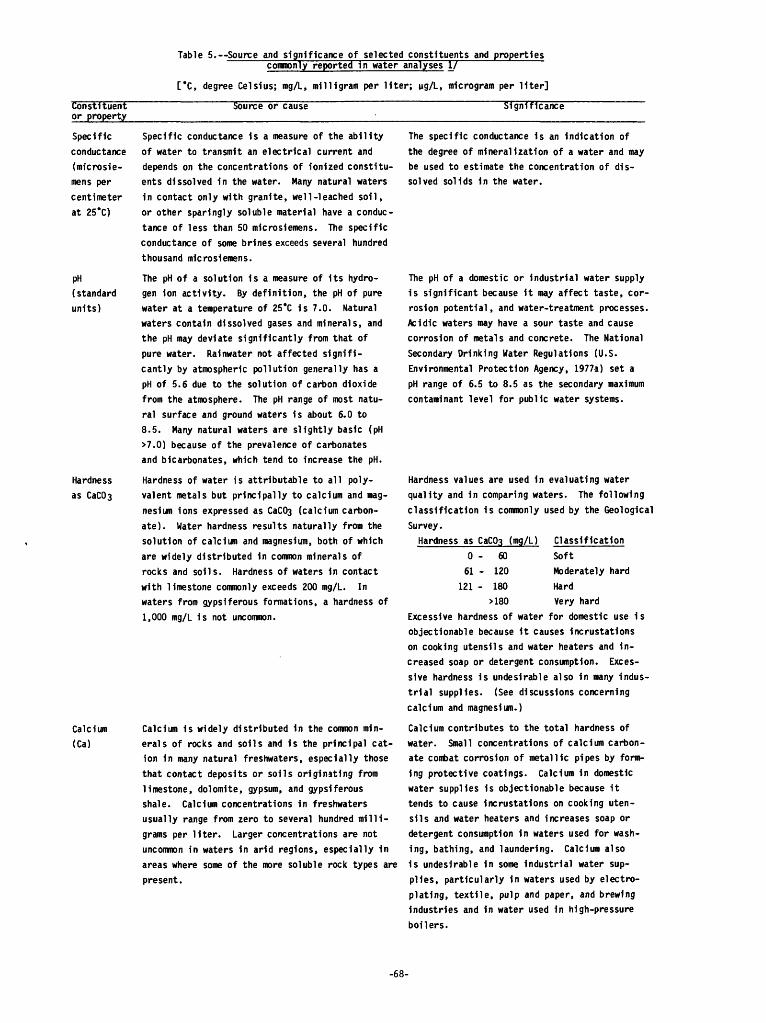
Table 5. Source and significance of selected constituents and properties commonly reported In water analyses I/
[*C, degree Celsius; mg/L, milligram per liter; ug/L, mlcrogram per liter]
Constituent or property
Source or cause significance
Specific
conductance
(microsie-
mens per
centimeter
at 25'O
PH
(standard
units)
Hardness
as
Calcium
(Ca)
Specific conductance is a measure of the ability
of water to transmit an electrical current and
depends on the concentrations of Ionized constitu
ents dissolved in the water. Many natural waters
in contact only with granite, well-leached soil,
or other sparingly soluble material have a conduc
tance of less than 50 microSiemens. The specific
conductance of some brines exceeds several hundred
thousand microsiemens.
The pH of a solution is a measure of its hydro
gen ion activity. By definition, the pH of pure
water at a temperature of 25"C Is 7.0. Natural
waters contain dissolved gases and minerals, and
the pH may deviate significantly from that of
pure water. Rainwater not affected signifi
cantly by atmospheric pollution generally has a
pH of 5.6 due to the solution of carbon dioxide
from the atmosphere. The pH range of most natu
ral surface and ground waters is about 6.0 to
8.5. Many natural waters are slightly basic (pH
>7.0) because of the prevalence of carbonates
and bicarbonates, which tend to increase the pH.
Hardness of water is attributable to all poly
valent metals but principally to calcium and mag
nesium ions expressed as CaCOs (calcium carbon
ate). Water hardness results naturally from the
solution of calcium and magnesium, both of which
are widely distributed in common minerals of
rocks and soils. Hardness of waters in contact
with limestone commonly exceeds 200 mg/L. In
waters from gypsiferous formations, a hardness of
1,000 mg/L is not uncommon.
Calcium is widely distributed in the common min
erals of rocks and soils and is the principal cat
ion in many natural freshwaters, especially those
that contact deposits or soils originating from
limestone, dolomite, gypsum, and gypsiferous
shale. Calcium concentrations in freshwaters
usually range from zero to several hundred milli
grams per liter. Larger concentrations are not
uncommon in waters in arid regions, especially in
areas where some of the more soluble rock types are
present.
The specific conductance is an indication of
the degree of mineralization of a water and may
be used to estimate the concentration of dis
solved solids in the water.
The pH of a domestic or industrial water supply
is significant because it may affect taste, cor
rosion potential, and water-treatment processes.
Acidic waters may have a sour taste and cause
corrosion of metals and concrete. The National
Secondary Drinking Water Regulations (U.S.
Environmental Protection Agency, 1977a) set a
pH range of 6.5 to 8.5 as the secondary maximum
contaminant level for public water systems.
Hardness values are used in evaluating water
quality and in comparing waters. The following
classification is commonly used by the Geological
Survey.
Hardness as CaCOs (mg/L) Classification
0 - 60 Soft
61 - 120 Moderately hard
121 - 180 Hard
>180 Very hard
Excessive hardness of water for domestic use is
objectionable because it causes incrustations
on cooking utensils and water heaters and in
creased soap or detergent consumption. Exces
sive hardness is undesirable also in many indus
trial supplies. (See discussions concerning
calcium and magnesium.)
Calcium contributes to the total hardness of
water. Small concentrations of calcium carbon
ate combat corrosion of metallic pipes by form
ing protective coatings. Calcium in domestic
water supplies is objectionable because it
tends to cause incrustations on cooking uten
sils and water heaters and increases soap or
detergent consumption in waters used for wash
ing, bathing, and laundering. Calcium also
is undesirable in some industrial water sup
plies, particularly in waters used by electro
plating, textile, pulp and paper, and brewing
industries and in water used in high-pressure
boilers.
-68-
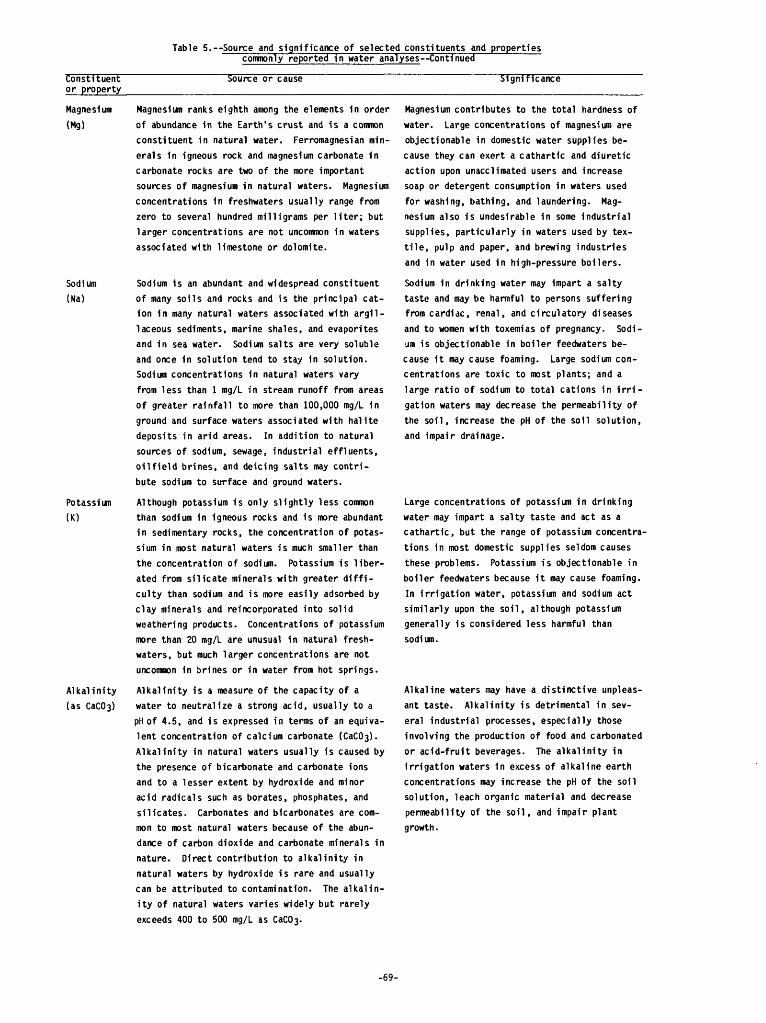
Table 5. Source and significance of selected constituents and properties commonly reported in water analyses Continued
Constituent or property
Source or cause Significance
Magnesium Magnesium ranks eighth among the elements in order
(Mg) of abundance in the Earth's crust and is a common
constituent in natural water. Ferromagnesian min
erals in igneous rock and magnesium carbonate in
carbonate rocks are two of the more important
sources of magnesium in natural waters. Magnesium
concentrations in freshwaters usually range from
zero to several hundred milligrams per liter; but
larger concentrations are not uncommon in waters
associated with limestone or dolomite.
Sodium Sodium is an abundant and widespread constituent
(Na) of many soils and rocks and is the principal cat
ion in many natural waters associated with argil
laceous sediments, marine shales, and evaporites
and in sea water. Sodium salts are very soluble
and once in solution tend to stay in solution.
Sodium concentrations in natural waters vary
from less than 1 mg/L in stream runoff from areas
of greater rainfall to more than 100,000 mg/L in
ground and surface waters associated with halite
deposits in arid areas. In addition to natural
sources of sodium, sewage, industrial effluents,
oilfield brines, and deicing salts may contri
bute sodium to surface and ground waters.
Potassium Although potassium is only slightly less common
(K) than sodium In igneous rocks and is more abundant
in sedimentary rocks, the concentration of potas
sium in most natural waters is much smaller than
the concentration of sodium. Potassium is liber
ated from silicate minerals with greater diffi
culty than sodium and is more easily adsorbed by
clay minerals and reincorporated into solid
weathering products. Concentrations of potassium
more than 20 mg/L are unusual in natural fresh-
waters, but much larger concentrations are not
uncommon in brines or in water from hot springs.
Alkalinity Alkalinity is a measure of the capacity of a
(as CaC03) water to neutralize a strong acid, usually to a
pH of 4.5, and is expressed in terms of an equiva
lent concentration of calcium carbonate (CaC03).
Alkalinity in natural waters usually is caused by
the presence of bicarbonate and carbonate ions
and to a lesser extent by hydroxide and minor
acid radicals such as borates, phosphates, and
silicates. Carbonates and bicarbonates are com
mon to most natural waters because of the abun
dance of carbon dioxide and carbonate minerals in
nature. Direct contribution to alkalinity in
natural waters by hydroxide is rare and usually
can be attributed to contamination. The alkalin
ity of natural waters varies widely but rarely
exceeds 400 to 500 mg/L as CaC03-
Magnesium contributes to the total hardness of
water. Large concentrations of magnesium are
objectionable in domestic water supplies be
cause they can exert a cathartic and diuretic
action upon unacclimated users and increase
soap or detergent consumption in waters used
for washing, bathing, and laundering. Mag
nesium also is undesirable in some industrial
supplies, particularly in waters used by tex
tile, pulp and paper, and brewing industries
and in water used in high-pressure boilers.
Sodium in drinking water may impart a salty
taste and may be harmful to persons suffering
from cardiac, renal, and circulatory diseases
and to women with toxemias of pregnancy. Sodi
um is objectionable in boiler feedwaters be
cause it may cause foaming. Large sodium con
centrations are toxic to most plants; and a
large ratio of sodium to total cations in irri
gation waters may decrease the permeability of
the soil, increase the pH of the soil solution,
and impair drainage.
Large concentrations of potassium in drinking
water may impart a salty taste and act as a
cathartic, but the range of potassium concentra
tions in most domestic supplies seldom causes
these problems. Potassium is objectionable in
boiler feedwaters because it may cause foaming.
In Irrigation water, potassium and sodium act
similarly upon the soil, although potassium
generally is considered less harmful than
sodium.
Alkaline waters may have a distinctive unpleas
ant taste. Alkalinity is detrimental in sev
eral industrial processes, especially those
involving the production of food and carbonated
or acid-fruit beverages. The alkalinity in
Irrigation waters in excess of alkaline earth
concentrations may increase the pH of the soil
solution, leach organic material and decrease
permeability of the soil, and impair plant
growth.
-69-
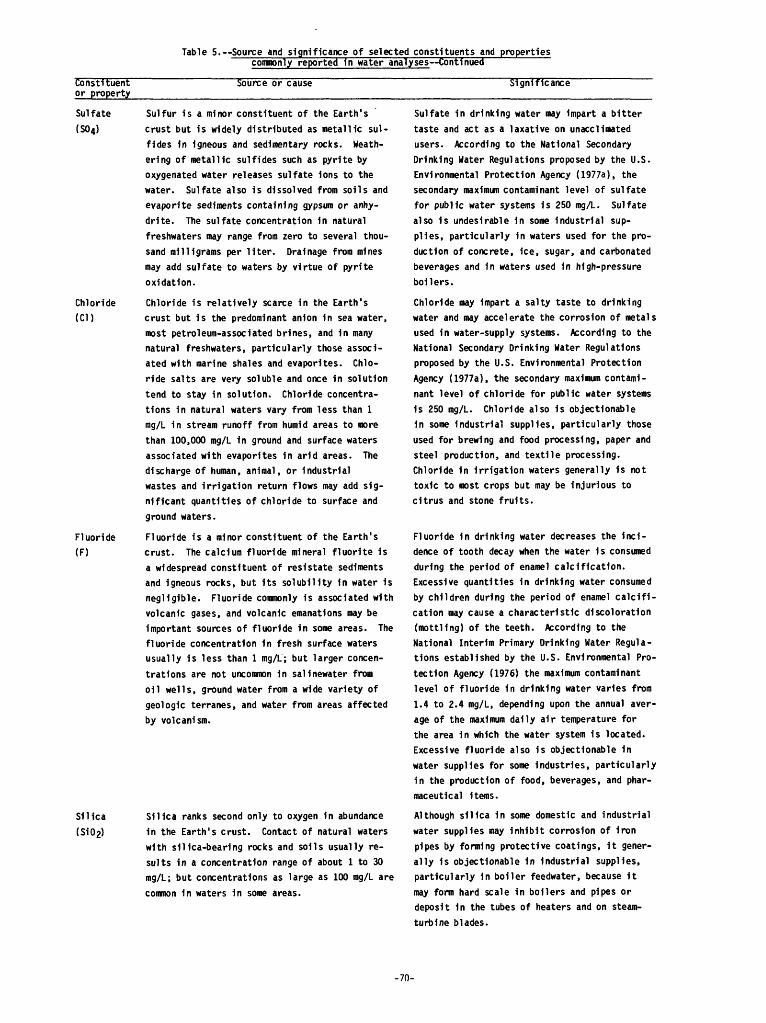
Table 5. Source and significance of selected constituents and properties commonly reported In water analyses Continued
Constituent or property
Source or cause Significance
Sulfate
(S0 4)
Chloride
(CD
Fluoride
(F)
Silica
(S10 2)
Sulfur is a minor constituent of the Earth's
crust but is widely distributed as metallic sul-
fides in igneous and sedimentary rocks. Weath
ering of metallic sulfides such as pyrite by
oxygenated water releases sulfate ions to the
water. Sulfate also 1s dissolved from soils and
evaporite sediments containing gypsum or anhy
drite. The sulfate concentration in natural
freshwaters may range from zero to several thou
sand milligrams per liter. Drainage from mines
may add sulfate to waters by virtue of pyrite
oxidation.
Chloride is relatively scarce in the Earth's
crust but is the predominant anion in sea water,
most petroleum-associated brines, and in many
natural freshwaters, particularly those associ
ated with marine shales and evaporites. Chlo
ride salts are very soluble and once in solution
tend to stay in solution. Chloride concentra
tions in natural waters vary from less than 1
mg/L in stream runoff from humid areas to more
than 100,000 mg/L in ground and surface waters
associated with evaporites in arid areas. The
discharge of human, animal, or industrial
wastes and irrigation return flows may add sig
nificant quantities of chloride to surface and
ground waters.
Fluoride is a minor constituent of the Earth's
crust. The calcium fluoride mineral fluorlte is
a widespread constituent of resistate sediments
and igneous rocks, but Its solubility in water 1s
negligible. Fluoride commonly is associated with
volcanic gases, and volcanic emanations may be
important sources of fluoride in some areas. The
fluoride concentration 1n fresh surface waters
usually is less than 1 mg/L; but larger concen
trations are not uncommon in sallnewater from
oil wells, ground water from a wide variety of
geologic terranes, and water from areas affected
by volcanism.
Silica ranks second only to oxygen in abundance
1n the Earth's crust. Contact of natural waters
with silica-bearing rocks and soils usually re
sults in a concentration range of about 1 to 30
mg/L; but concentrations as large as 100 mg/L are
common in waters in some areas.
Sulfate 1n drinking water may impart a bitter
taste and act as a laxative on unacelimated
users. According to the National Secondary
Drinking Water Regulations proposed by the U.S.
Environmental Protection Agency (1977a), the
secondary maximum contaminant level of sulfate
for public water systems is 250 mg/L. Sulfate
also 1s undesirable in some industrial sup
plies, particularly in waters used for the pro
duction of concrete, ice, sugar, and carbonated
beverages and in waters used in high-pressure
boilers.
Chloride may impart a salty taste to drinking
water and may accelerate the corrosion of metals
used in water-supply systems. According to the
National Secondary Drinking Water Regulations
proposed by the U.S. Environmental Protection
Agency (1977a), the secondary maximum contami
nant level of chloride for public water systems
1s 250 mg/L. Chloride also is objectionable
in some industrial supplies, particularly those
used for brewing and food processing, paper and
steel production, and textile processing.
Chloride in Irrigation waters generally is not
toxic to most crops but may be injurious to
citrus and stone fruits.
Fluoride 1n drinking water decreases the inci
dence of tooth decay when the water 1s consumed
during the period of enamel calcification.
Excessive quantities in drinking water consumed
by children during the period of enamel calcifi
cation may cause a characteristic discoloration
(mottling) of the teeth. According to the
National Interim Primary Drinking Water Regula
tions established by the U.S. Environmental Pro
tection Agency (1976) the maximum contaminant
level of fluoride in drinking water varies from
1.4 to 2.4 mg/L, depending upon the annual aver
age of the maximum daily air temperature for
the area in which the water system is located.
Excessive fluoride also 1s objectionable 1n
water supplies for some industries, particularly
in the production of food, beverages, and phar
maceutical items.
Although silica in some domestic and industrial
water supplies may Inhibit corrosion of Iron
pipes by forming protective coatings, it gener
ally 1s objectionable in industrial supplies,
particularly in boiler feedwater, because 1t
may form hard scale in boilers and pipes or
deposit 1n the tubes of heaters and on steam-
turbine blades.
-70-
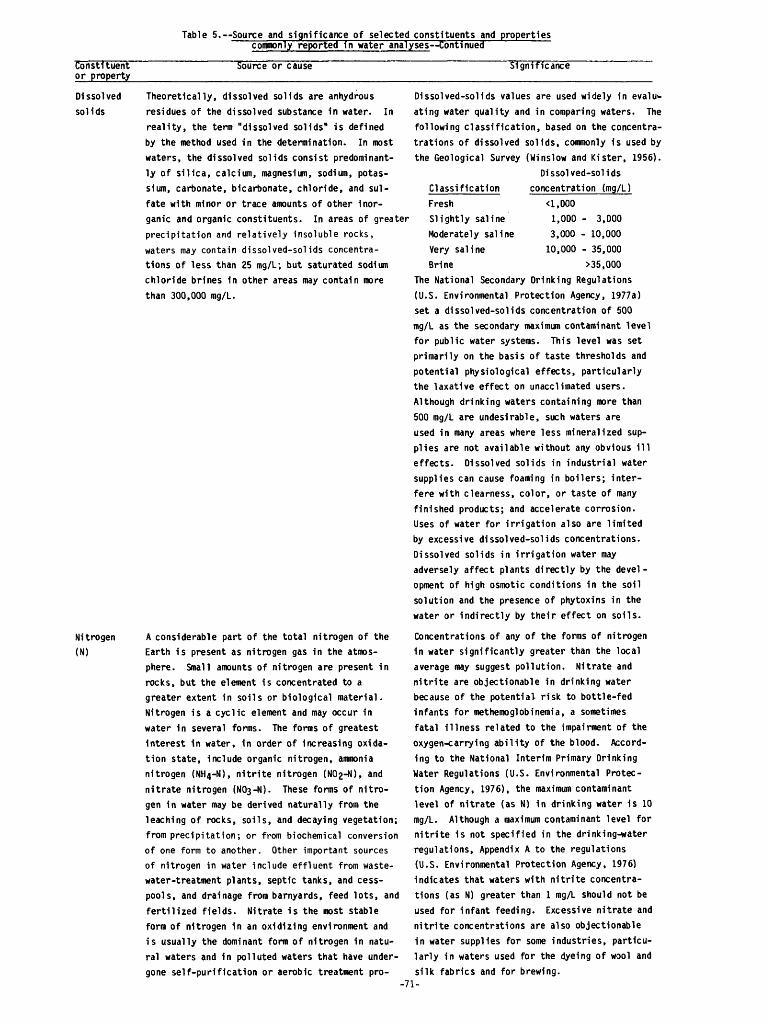
Table 5. Source and significance of selected constituents and properties commonly reported tn water analyses Continued
Constituent or property
Source or cause Significance
Dissolved
solids
Nitrogen
(N)
Theoretically, dissolved solids are anhydrous
residues of the dissolved substance 1n water. In
reality, the term "dissolved sol Ids" is defined
by the method used in the determination. In most
waters, the dissolved sol Ids consist predominant
ly of silica, calcium, magnesium, sodium, potas
sium, carbonate, bicarbonate, chloride, and sul-
fate with minor or trace amounts of other Inor
ganic and organic constituents. In areas of greater
precipitation and relatively insoluble rocks,
waters may contain dissolved-solids concentra
tions of less than 25 mg/L; but saturated sodium
chloride brines in other areas may contain more
than 300,000 mg/L.
D1ssolved-sol1ds values are used widely in evalu-
ating water quality and in comparing waters. The
following classification, based on the concentra-
trations of dissolved solids, commonly is used by
the Geological Survey (Winslow and Kister, 1956).
Dissolved-solids
Classification concentration (mg/L)
<1,DOO
A considerable part of the total nitrogen of the
Earth is present as nitrogen gas in the atmos
phere. Small amounts of nitrogen are present 1n
rocks, but the element 1s concentrated to a
greater extent in soils or biological material.
Nitrogen 1s a cyclic element and may occur in
water in several forms. The forms of greatest
Interest in water, 1n order of increasing oxida
tion state, Include organic nitrogen, ammonia
nitrogen (NH4-N), nitrite nitrogen (N02-N), and
nitrate nitrogen (N03-N). These forms of nitro
gen 1n water may be derived naturally from the
leaching of rocks, soils, and decaying vegetation;
from precipitation; or from biochemical conversion
of one form to another. Other important sources
of nitrogen in water include effluent from waste-
water-treatment plants, septic tanks, and cess
pools, and drainage from barnyards, feed lots, and
fertilized fields. Nitrate 1s the most stable
form of nitrogen in an oxidizing environment and
is usually the dominant form of nitrogen 1n natu
ral waters and in polluted waters that have under
gone self-purification or aerobic treatment pro-
Fresh
Slightly saline
Moderately saline
Very saline
Brine
1,000 - 3,0003,000 - 10,000
10,000 - 35,000>35,000
The National Secondary Drinking Regulations
(U.S. Environmental Protection Agency, 1977a)
set a dissolved-solids concentration of 500
mg/L as the secondary maximum contaminant level
for public water systems. This level was set
primarily on the basis of taste thresholds and
potential physiological effects, particularly
the laxative effect on unacclimated users.
Although drinking waters containing more than
500 mg/L are undesirable, such waters are
used in many areas where less mineralized sup
plies are not available without any obvious ill
effects. Dissolved solids in industrial water
supplies can cause foaming in boilers; inter
fere with clearness, color, or taste of many
finished products; and accelerate corrosion.
Uses of water for irrigation also are limited
by excessive dissolved-solids concentrations.
Dissolved sol Ids in irrigation water may
adversely affect plants directly by the devel
opment of high osmotic conditions in the soil
solution and the presence of phytoxins in the
water or Indirectly by their effect on soils.
Concentrations of any of the forms of nitrogen
in water significantly greater than the local
average may suggest pollution. Nitrate and
nitrite are objectionable in drinking water
because of the potential risk to bottle-fed
infants for methemoglobinemia, a sometimes
fatal illness related to the impairment of the
oxygen-carrying ability of the blood. Accord-
Ing to the National Interim Primary Drinking
Water Regulations (U.S. Environmental Protec
tion Agency, 1976), the maximum contaminant
level of nitrate (as N) 1n drinking water is 10
mg/L. Although a maximum contaminant level for
nitrite 1s not specified in the drinking-water
regulations, Appendix A to the regulations
(U.S. Environmental Protection Agency, 1976)
indicates that waters with nitrite concentra
tions (as N) greater than 1 mg/L should not be
used for Infant feeding. Excessive nitrate and
nitrite concentrations are also objectionable
in water supplies for some industries, particu
larly in waters used for the dyeing of wool and
silk fabrics and for brewing. 71-
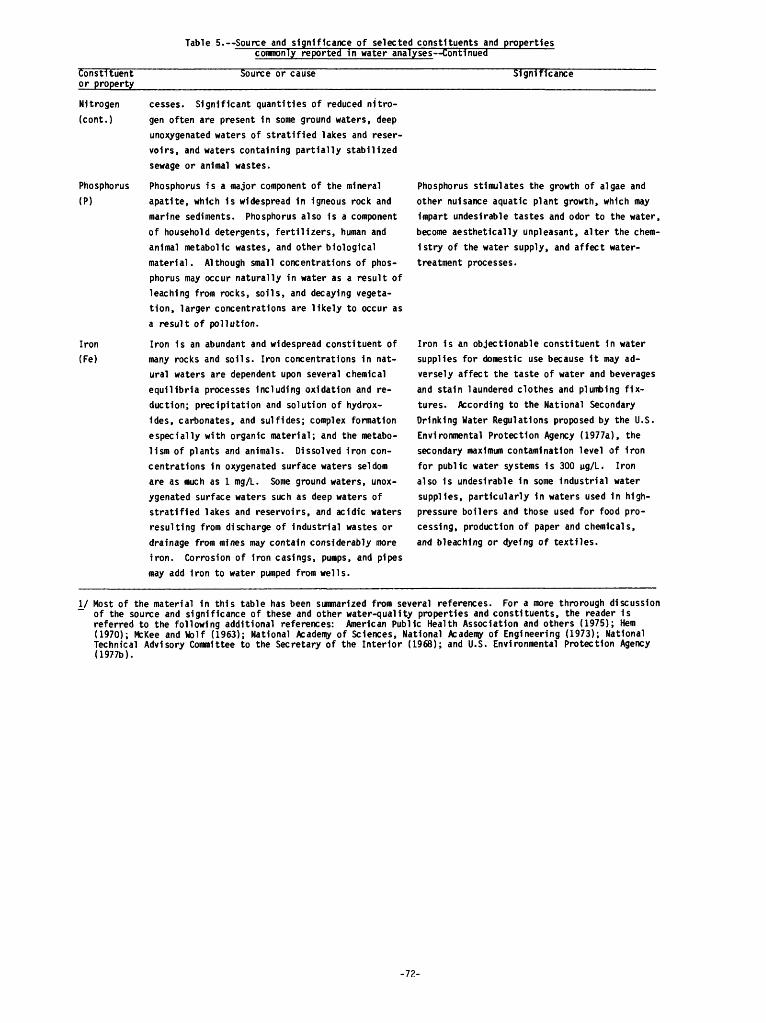
Table 5. Source and significance of selected constituents and properties commonly reported In water analyses Continued
Constituent or property
Source or cause Significance
Nitrogen cesses. Significant quantities of reduced nitro- (cont.) gen often are present in some ground waters, deep
unoxygenated waters of stratified lakes and reser voirs, and waters containing partially stabilized sewage or animal wastes.
Phosphorus Phosphorus Is a major component of the mineral (P) apatite, which 1s widespread in Igneous rock and
marine sediments. Phosphorus also Is a component of household detergents, fertilizers, human and animal metabolic wastes, and other biological material. Although small concentrations of phos phorus may occur naturally in water as a result of leaching from rocks, soils, and decaying vegeta tion, larger concentrations are likely to occur as a result of pollution.
Iron Iron is an abundant and widespread constituent of (Fe) many rocks and soils. Iron concentrations in nat
ural waters are dependent upon several chemical equilibria processes including oxidation and re duction; precipitation and solution of hydrox ides, carbonates, and sulfides; complex formation especially with organic material; and the metabo lism of plants and animals. Dissolved iron con centrations in oxygenated surface waters seldom are as much as 1 mg/L. Some ground waters, unox ygenated surface waters such as deep waters of stratified lakes and reservoirs, and acidic waters resulting from discharge of Industrial wastes or drainage from mines may contain considerably more iron. Corrosion of iron casings, pumps, and pipes may add iron to water pumped from wells.
Phosphorus stimulates the growth of algae and other nuisance aquatic plant growth, which may impart undesirable tastes and odor to the water, become aesthetically unpleasant, alter the chem istry of the water supply, and affect water- treatment processes.
Iron is an objectionable constituent in water supplies for domestic use because it may ad versely affect the taste of water and beverages and stain laundered clothes and plumbing fix tures. According to the National Secondary Drinking Water Regulations proposed by the U.S. Environmental Protection Agency (1977a), the secondary maximum contamination level of iron for public water systems is 300 ug/L. Iron also is undesirable in some Industrial water supplies, particularly In waters used in high- pressure boilers and those used for food pro cessing, production of paper and chemicals, and bleaching or dyeing of textiles.
I/ Most of the material in this table has been summarized from several references. For a more throrough discussion of the source and significance of these and other water-quality properties and constituents, the reader is referred to the following additional references: American Public Health Association and others (1975); Hem (1970); McKee and Wolf (1963); National Academy of Sciences, National Academy of Engineering (1973); National Technical Advisory Committee to the Secretary of the Interior (1968); and U.S. Environmental Protection Agency (1977b).
-7?.-
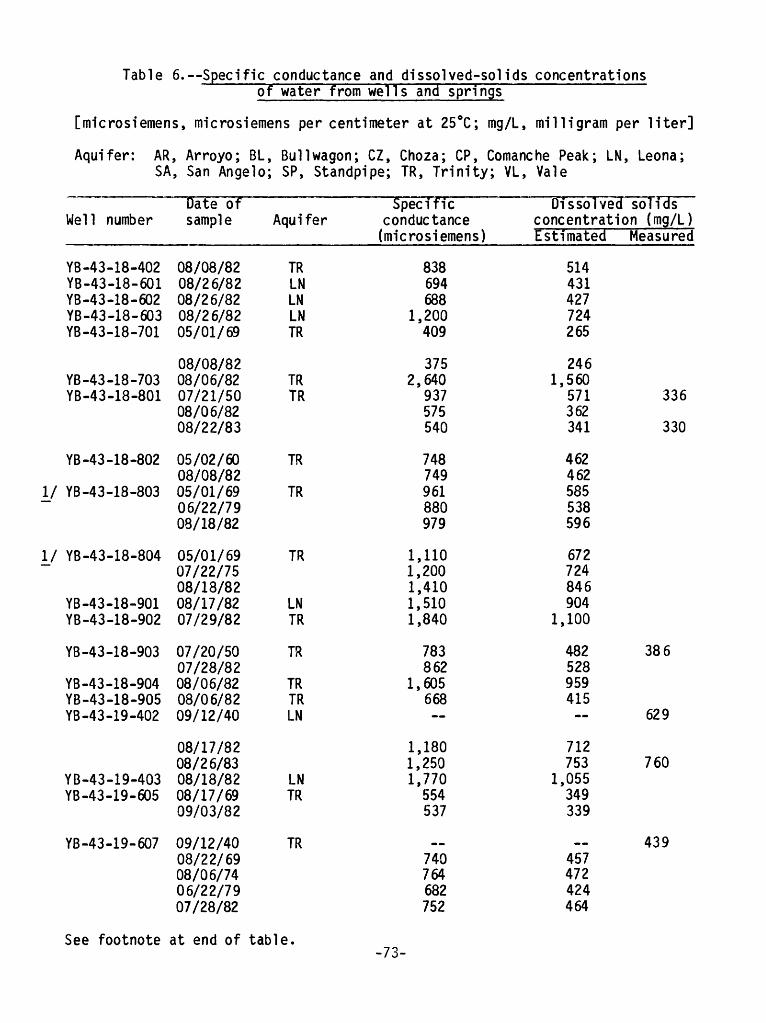
Table 6.--Specific conductance and dissolved-solids concentrationsof water from wells and springs
[microsiemens, microsiemens per centimeter at 25°C; mg/L,
Aquifer: AR, Arroyo; BLSA, San Angelo
Date ofWell number sample
YB-43-18-402 08/08/82YB-43-18-601 08/26/82YB-43-18-602 08/26/82YB-43-18-603 08/26/82YB-43-18-701 05/01/69
08/08/82YB-43-18-703 08/06/82YB-43-18-801 07/21/50
08/06/8208/22/83
YB-43-18-802 05/02/6008/08/82
I/ YB-43-18-803 05/01/6906/22/7908/18/82
I/ YB-43-18-804 05/01/6907/22/7508/18/82
YB-43-18-901 08/17/82YB-43-18-902 07/29/82
YB-43-18-903 07/20/5007/28/82
YB-43-18-904 08/06/82YB-43-18-905 08/06/82YB-43-19-402 09/12/40
08/17/8208/26/83
YB-43-19-403 08/18/82YB-43-19-605 08/17/69
09/03/82
YB-43-19-607 09/12/4008/22/6908/06/7406/22/7907/28/82
, Bull wagon;
milligram per liter]
CZ, Choza; CP, Comanche Peak; LN,; SP, Standpipe; TR, Trinity; VL,
Aquifer
TRLNLNLNTR
TRTR
TR
TR
TR
LNTR
TR
TRTRLN
LNTR
TR
Specificconductance
(microsiemens)
838694688
1,200409
3752,640
937575540
748749961880979
1,1101,2001,4101,5101,840
783862
1,605668
1,1801,2501,770
554537
__740764682752
Vale
Dissolved
Leona;
solidsconcentration (mg/L)Estimated
514431427724265
2461,560
571362341
462462585538596
672724846904
1,100
482528959415
712753
1,055349339
__457472424464
Measured
336
330
386
629
760
439
See footnote at end of table.-73-
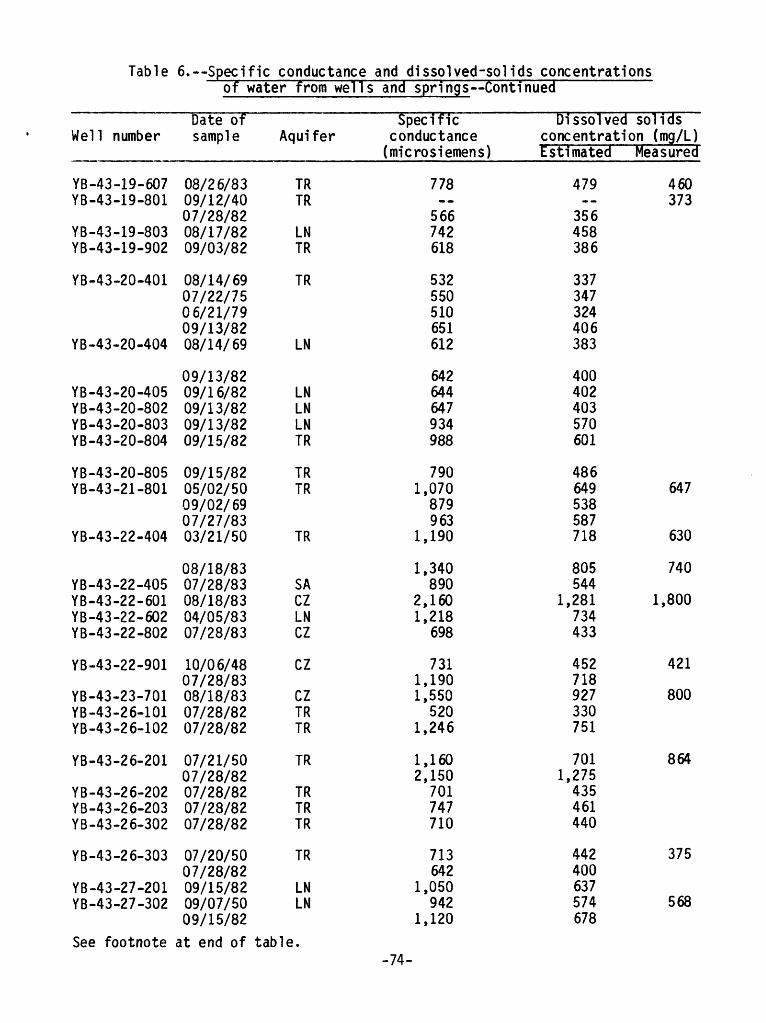
Table 6.--Specific conductance and dissolved-solids concentrationsof water from we!
Well number
YB-43-19-607YB-43-19-801
YB-43-19-803YB-43-19-902
YB-43-20-401
YB-43-20-404
YB-43-20-405YB-43-20-802YB-43-20-803YB-43-20-804
YB-43-20-805YB-43-21-801
YB-43-22-404
YB-43-22-405YB-43-22-601YB-43-22-602YB-43-22-802
YB-43-22-901
YB-43-23-701YB-43-26-101YB-43-2 6-102
YB-43-26-201
YB-43-26-202YB-43-26-203YB-43-2 6-302
YB-43-2 6-303
YB-43-27-201YB-43-27-302
Date of sample
08/26/8309/12/4007/28/8208/17/8209/03/82
08/14/6907/22/7506/21/7909/13/8208/14/69
09/13/8209/16/8209/13/8209/13/8209/15/82
09/15/8205/02/5009/02/6907/27/8303/21/50
08/18/8307/28/8308/18/8304/05/8307/28/83
10/06/4807/28/8308/18/8307/28/8207/28/82
07/21/5007/28/8207/28/8207/28/8207/28/82
07/20/5007/28/8209/15/8209/07/5009/15/82
Aquifer
TRTR
LNTR
TR
LN
LNLNLNTR
TRTR
TR
SACZLNCZ
CZ
CZTRTR
TR
TRTRTR
TR
LNLN
Is and springs Continued
Specific conductance
(microsiemens)
778--
566742618
532550510651612
642644647934988
7901,070
879963
1,190
1,340890
2,1601,218
698
7311,1901,550
5201,246
1,1602,150
701747710
713642
1,050942
1,120
Dissolved solids concentration (mg/L)Estimated
479--
356458386
337347324406383
400402403570601
486649538587718
805544
1,281734433
452718927330751
7011,275
435461440
442400637574678
Measured
460373
647
630
740
1,800
421
800
864
375
568
See footnote at end of table.-74-

Table 6.--Specific conductance and dissolved-solids concentrationsof water from we!
Well number
YB-43-27-501YB-43-27-601
I/YB-43-27-602
YB-43-27-801
YB-43-28-301YB-43-28-302YB-43-28-502
YB-43-28-503YB-43-28-504YB-43-28-508
I/ YB-43-28-601YB-43-28-602
YB-43-28-603YB-43-28-604YB-43-29-201YB-43-29-501
YB-43-29-502YB-43-29-503YB-43-29-504YB-43-29-505YB-43-29-506
YB-43-29-601YB-43-29-602YB-43-29-701YB-43-29-703YB-43-29-719
YB-43-29-720YB-43-29-801
YB-43-29-802YB-43-29-803
YB-43-29-901YB-43-30-102
YB-43-30-103YB-43-30-201
Date of sample
10/05/8209/11/6910/05/8212/05/4010/05/82
09/17/6908/22/8309/30/8209/30/8203/30/83
09/29/8209/29/8209/20/8206/15/5009/30/82
08/23/8309/23/8209/20/8208/30/8304/04/83
07/27/8307/27/8308/01/8308/01/8308/01/83
04/04/8308/01/8306/25/7911/04/8208/16/82
04/04/8305/02/5008/30/8308/01/8308/01/83
08/01/8306/26/7907/30/8209/02/8209/02/82
Aquifer
TRLN
LN
TR
LNLNLN
LNLNLNLNLN
LNLNSALN-SA
LN-SALN-SALN-SASASA
SASALNLNLN
LNSA
SASA
SASA
SACZ
Is and springs Continued
Specific conductance
(microsiemens)
508740680..
904
553490
1,2101,1802,040
8591,2401,560
849788
7531,0361,6072,0402,460
3,2902,9801,9805,3504,110
2,6403,660
8591,3301,985
2,1602,9403,2503,8305,150
7,7402,1102,5101,7803,500
Dissolved solids concentration (mg/L)Estimated
323457422--
522
349312730712
1,211
526747933520485
465629960
1,2111,450
1,9401,7601,1803,1302,410
1,5602,150
526799
1,180
1,2801,7301,9102,2503,020
4,5201,2501,4801,0601,060
Measured
367
260
450
1,6101,700
See footnote at end of table.-75-
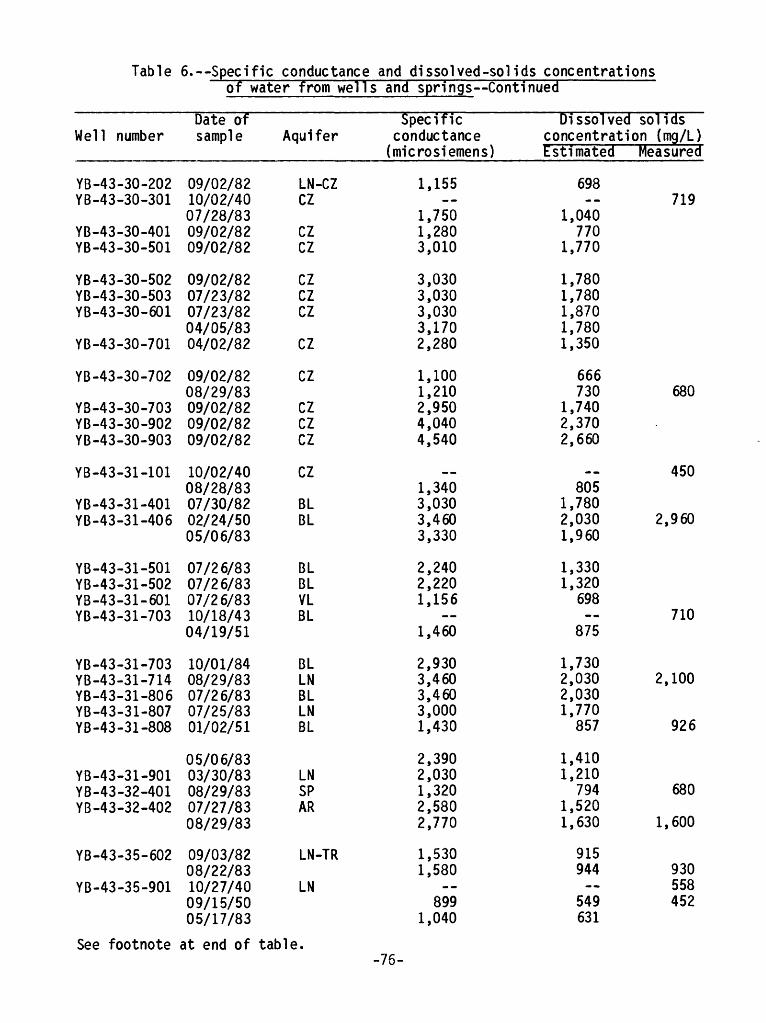
Table 6. Specific conductance and dissolved-solids concentrationsof water from wells and springs Continued
Well number
YB-43-30-202YB-43-30-301
YB-43-30-401YB-43-30-501
YB-43-30-502YB-43-30-503YB-43-30-601
YB-43-30-701
YB-43-30-702
YB-43-30-703YB-43-30-902YB-43-30-903
YB-43-31-101
YB-43-31-401YB-43-31-406
YB-43-31-501YB-43-31-502YB-43-31-601YB-43-31-703
YB-43-31-703YB-43-31-714YB-43-31-806YB-43-31-807YB-43-31-808
YB-43-31-901YB-43-32-401YB-43-32-402
YB-43-35-602
YB-43-35-901
See footnote
Date of sample
09/02/8210/02/4007/28/8309/02/8209/02/82
09/02/8207/23/8207/23/8204/05/8304/02/82
09/02/8208/29/8309/02/8209/02/8209/02/82
10/02/4008/28/8307/30/8202/24/5005/06/83
07/26/8307/26/8307/26/8310/18/4304/19/51
10/01/8408/29/8307/26/8307/25/8301/02/51
05/06/8303/30/8308/29/8307/27/8308/29/83
09/03/8208/22/8310/27/4009/15/5005/17/83
at end of
Aquifer
LN-CZCZ
CZCZ
CZCZCZ
CZ
CZ
CZCZCZ
CZ
BLBL
BLBLVLBL
BLLNBLLNBL
LNSPAR
LN-TR
LN
table.
Specific conductance
(microsiemens)
1,155
1,7501,2803,010
3,0303,0303,0303,1702,280
1,1001,2102,9504,0404,540
__1,3403,0303,4603,330
2,2402,2201,156
1,460
2,9303,4603,4603,0001,430
2,3902,0301,3202,5802,770
1,5301,580
--899
1,040
Dissolved solids concentration (mg/L)Estimated
698--
1,040770
1,770
1,7801,7801,8701,7801,350
666730
1,7402,3702,660
__805
1,7802,0301,960
1,3301,320
698
875
1,7302,0302,0301,770
857
1,4101,210
7941,5201,630
915944
549631
Measured
719
680
450
2,960
710
2,100
926
680
1,600
930558452
-76-
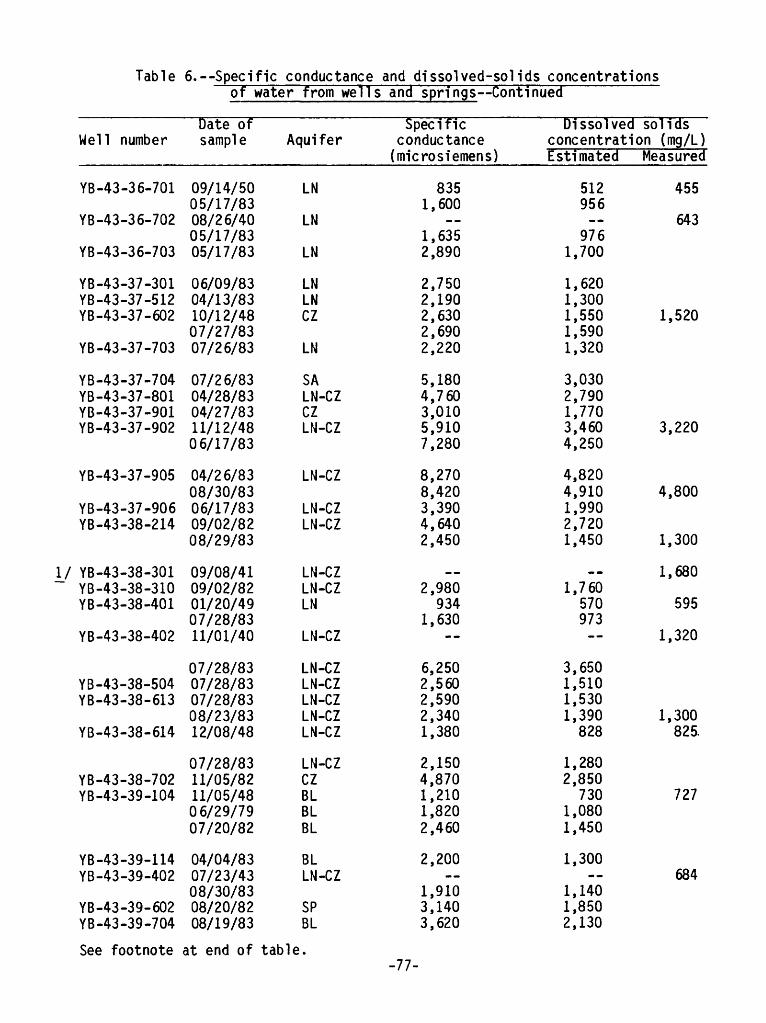
Table 6. Specific conductance and dissolved-solids concentrationsof water from we!
Well number
YB-43-36-701
YB-43-36-702
YB-43-36-703
YB-43-37-301YB-43-37-512YB-43-37-602
YB-43-37-703
YB-43-37-704YB-43-37-801YB-43-37-901YB-43-37-902
YB-43-37-905
YB-43-37-906YB-43-38-214
I/ YB-43-38-301YB-43-38-310YB-43-38-401
YB-43-38-402
YB-43-38-504YB-43-38-613
YB-43-38-614
YB-43-38-702YB-43-39-104
YB-43-39-114YB-43-39-402
YB-43-39-602YB-43-39-704
Date of sample
09/14/5005/17/8308/26/4005/17/8305/17/83
06/09/8304/13/8310/12/4807/27/8307/26/83
07/26/8304/28/8304/27/8311/12/4806/17/83
04/26/8308/30/8306/17/8309/02/8208/29/83
09/08/4109/02/8201/20/4907/28/8311/01/40
07/28/8307/28/8307/28/8308/23/8312/08/48
07/28/8311/05/8211/05/4806/29/7907/20/82
04/04/8307/23/4308/30/8308/20/8208/19/83
Aquifer
LN
LN
LN
LNLNCZ
LN
SALN-CZCZLN-CZ
LN-CZ
LN-CZLN-CZ
LN-CZLN-CZLN
LN-CZ
LN-CZLN-CZLN-CZLN-CZLN-CZ
LN-CZCZBLBLBL
BLLN-CZ
SPBL
Is and springs Continued
Specific conductance
(micro Siemens)
8351,600
--1,6352,890
2,7502,1902,6302,6902,220
5,1804,7603,0105,9107,280
8,2708,4203,3904,6402,450
__2,980
9341,630
--
6,2502,5602,5902,3401,380
2,1504,8701,2101,8202,460
2,200
1,9103,1403,620
Dissolved solids concentration (mg/L)Estimated
512956
9761,700
1,6201,3001,5501,5901,320
3,0302,7901,7703,4604,250
4,8204,9101,9902,7201,450
--1,760
570973--
3,6501,5101,5301,390
828
1,2802,850
7301,0801,450
1,300
1,1401,8502,130
Measured
455
643
1,520
3,220
4,800
1,300
1,680
595
1,320
1,300825.
727
684
See footnote at end of table.-77-
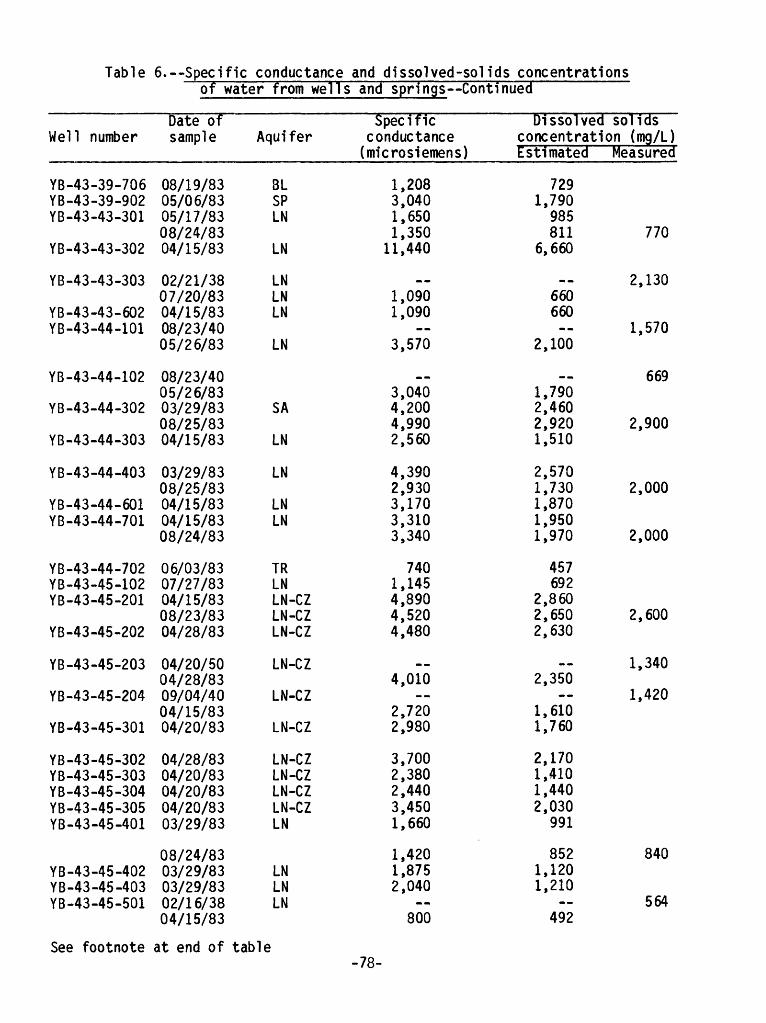
Table 6.--Specific conductance and dissolved-solids concentrationsof water from wells and springs Continued
Well number
YB-43-39-706YB-43-39-902YB-43-43-301
YB-43-43-302
YB-43-43-303
YB-43-43-602YB-43-44-101
YB-43-44-102
YB-43-44-302
YB-43-44-303
YB-43-44-403
YB-43-44-601YB-43-44-701
YB-43-44-702YB-43-45-102YB-43-45-201
YB-43-45-202
YB-43-45-203
YB-43-45-204
YB-43-45-301
YB-43-45-302YB-43-45-303YB-43-45-304YB-43-45-305YB-43-45-401
YB-43-45-402YB-43-45-403YB-43-45-501
Date of sample
08/19/8305/06/8305/17/8308/24/8304/15/83
02/21/3807/20/8304/15/8308/23/4005/26/83
08/23/4005/26/8303/29/8308/25/8304/15/83
03/29/8308/25/8304/15/8304/15/8308/24/83
06/03/8307/27/8304/15/8308/23/8304/28/83
04/20/5004/28/8309/04/4004/15/8304/20/83
04/28/8304/20/8304/20/8304/20/8303/29/83
08/24/8303/29/8303/29/8302/16/3804/15/83
Aquifer
3LSPLN
LN
LNLNLN
LN
SA
LN
LN
LNLN
TRLNLN-CZLN-CZLN-CZ
LN-CZ
LN-CZ
LN-CZ
LN-CZLN-CZLN-CZLN-CZLN
LNLNLN
Specific conductance
(microsiemens)
1,2083,0401,6501,350
11,440
__1,0901,090
3,570
__3,0404,2004,9902,560
4,3902,9303,1703,3103,340
7401,1454,8904,5204,480
__4,010
2,7202,980
3,7002,3802,4403,4501,660
1,4201,8752,040
800
Dissolved solids concentration (mg/L)Estimated
7291,790
985811
6,660
__660660
2,100
__1,7902,4602,9201,510
2,5701,7301,8701,9501,970
457692
2,8602,6502,630
__2,350
1,6101,760
2,1701,4101,4402,030
991
8521,1201,210
492
Measured
770
2,130
1,570
669
2,900
2,000
2,000
2,600
1,340
1,420
840
564
See footnote at end of table-78-
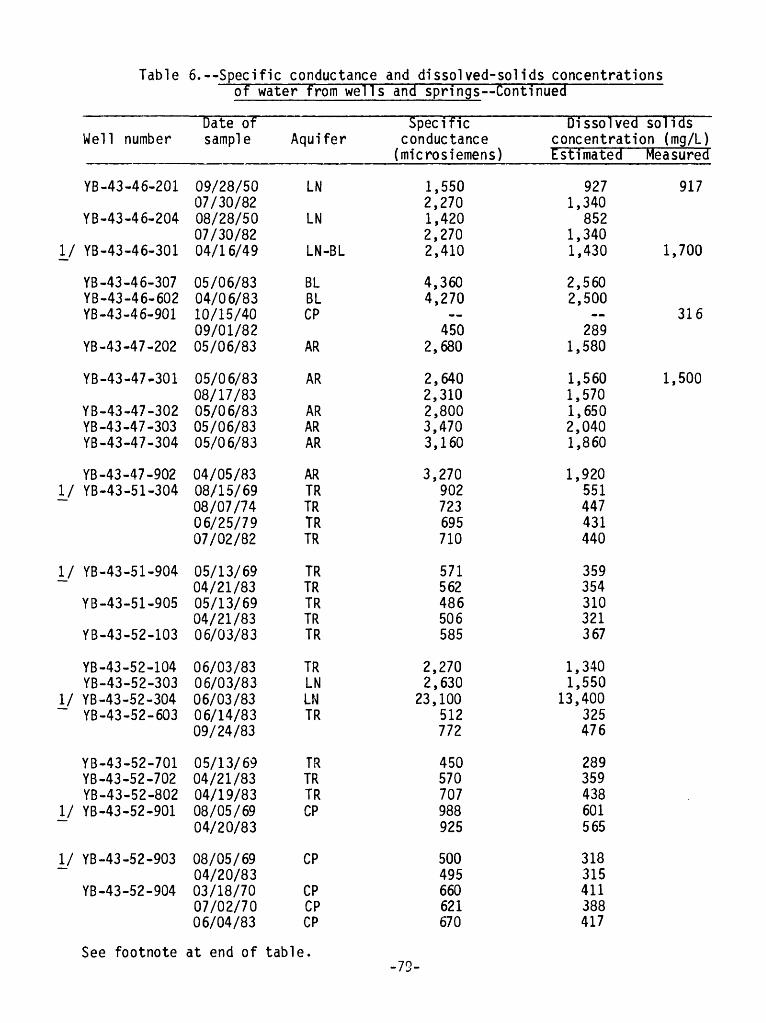
Table 6.--Specific conductance and dissolved-solids concentrationsof water from wells
Well number
YB-43-46-201
YB-43-4 6-204
I/ YB-43-4 6-301
YB -43-46-307YB-43-46-602YB-43-46-901
YB -43-47-202
YB-43-47-301
YB-43-47-302YB -43-47-303YB-43-47-304
YB -43-47-902I/ YB-43-51-304
I/ YB-43-51-904
YB-43-51-905
YB-43-52-103
YB-43-52-104YB-43-52-303
I/ YB-43-52-304~ YB-43-52-603
YB-43-52-701YB-43-52-702YB-43-52-802
I/ YB-43-52-901
I/ YB-43-52-903
YB -43-52-904
Date of sample
09/28/5007/30/8208/28/5007/30/8204/16/49
05/06/8304/06/8310/15/4009/01/8205/06/83
05/06/8308/17/8305/06/8305/06/8305/06/83
04/05/8308/15/6908/07/7406/25/7907/02/82
05/13/6904/21/8305/13/6904/21/8306/03/83
06/03/8306/03/8306/03/8306/14/8309/24/83
05/13/6904/21/8304/19/8308/05/6904/20/83
08/05/6904/20/8303/18/7007/02/7006/04/83
Aquifer
LN
LN
LN-BL
BLBLCP
AR
AR
ARARAR
ARTRTRTRTR
TRTRTRTRTR
TRLNLNTR
TRTRTRCP
CP
CPCPCP
and springs Continued
Specific conductance
(microsiemens)
1,5502,2701,4202,2702,410
4,3604,270
-450
2,680
2,6402,3102,8003,4703,160
3,270902723695710
571562486506585
2,2702,630
23,100512772
450570707988925
500495660621670
Dissolved solids concentration (mg/L)Estimated
9271,340
8521,3401,430
2,5602,500
2891,580
1,5601,5701,6502,0401,860
1,920551447431440
359354310321367
1,3401,550
13,400325476
289359438601565
318315411388417
Measured
917
1,700
316
1,500
See footnote at end of table.-79-
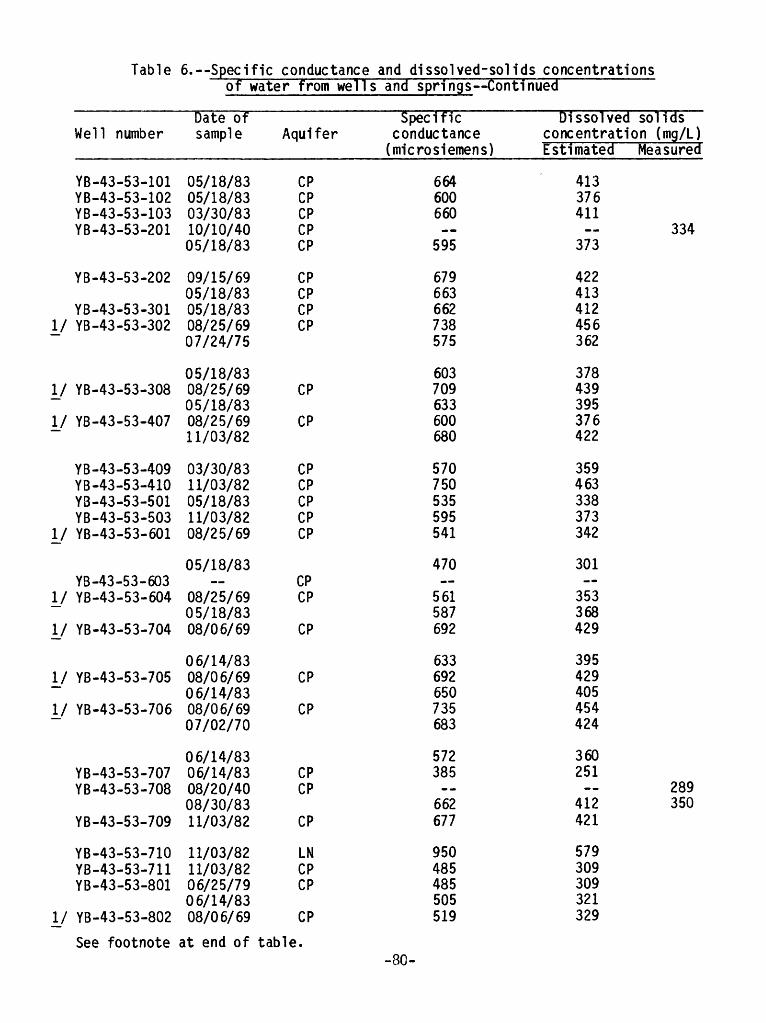
Table 6.--Specific conductance and dissolved-solids concentrationsof water from wells
Well number
YB-43-53-101YB-43-53-102YB-43-53-103YB-43-53-201
YB-43-53-202
YB-43-53-301I/ YB-43-53-302
I/ YB-43-53-308
I/ YB-43-53-407
YB-43-53-409YB-43-53-410YB-43-53-501YB-43-53-503
I/ YB-43-53-601
YB-43-53-603I/ YB-43-53-604
I/ YB-43-53-704
I/ YB-43-53-705
I/ YB-43-53-706
YB-43-53-707YB-43-53-708
YB-43-53-709
YB-43-53-710YB-43-53-711YB-43-53-801
I/ YB-43-53-802
Date of sample
05/18/8305/18/8303/30/8310/10/4005/18/83
09/15/6905/18/8305/18/8308/25/6907/24/75
05/18/8308/25/6905/18/8308/25/6911/03/82
03/30/8311/03/8205/18/8311/03/8208/25/69
05/18/83
08/25/6905/18/8308/06/69
06/14/8308/06/6906/14/8308/06/6907/02/70
06/14/8306/14/8308/20/4008/30/8311/03/82
11/03/8211/03/8206/25/7906/14/8308/06/69
Aquifer
CPCPCPCPCP
CPCPCPCP
CP
CP
CPCPCPCPCP
CPCP
CP
CP
CP
CPCP
CP
LNCPCP
CP
and springs Continued
Specific conductance
(microsiemens)
664600660--
595
679663662738575
603709633600680
570750535595541
470
561587692
633692650735683
572385--
662677
950485485505519
Dissolved solids concentration (mg/L)Estimated
413376411
373
422413412456362
378439395376422
359463338373342
301
353368429
395429405454424
360251
412421
579309309321329
Measured
334
289350
See footnote at end of table.-80-
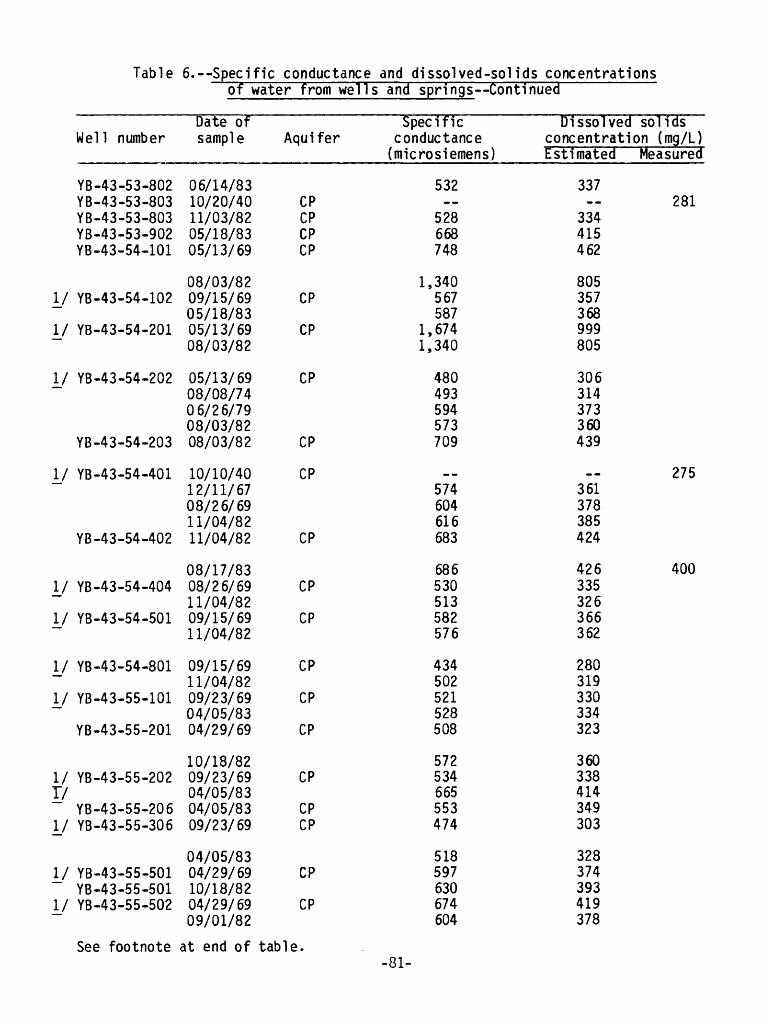
Table 6.--Specific conductance and dissolved-solids concentrationsof water from wells
Well number
YB-43-53-802YB-43-53-803YB-43-53-803YB-43-53-902YB-43-54-101
y YB-43-54-102
y YB-43-54-201
y YB-43-54-202
YB-43-54-203
y YB-43-54-401
YB-43-54-402
y YB-43-54-404
y YB-43-54-501
y YB-43-54-801
y YB-43-55-101
YB-43-55-201
I/ YB-43-55-202I/~ YB-43-55-206y YB-43-55-306
I/ YB-43-55-501YB-43-55-501
I/ YB-43-55-502
Date of sample
06/14/8310/20/4011/03/8205/18/8305/13/69
08/03/8209/15/6905/18/8305/13/6908/03/82
05/13/6908/08/7406/26/7908/03/8208/03/82
10/10/4012/11/6708/26/6911/04/8211/04/82
08/17/8308/26/6911/04/8209/15/6911/04/82
09/15/6911/04/8209/23/6904/05/8304/29/69
10/18/8209/23/6904/05/8304/05/8309/23/69
04/05/8304/29/6910/18/8204/29/6909/01/82
Aquifer
CPCPCPCP
CP
CP
CP
CP
CP
CP
CP
CP
CP
CP
CP
CP
CPCP
CP
CP
and springs Continued
Specific conductance
(microsiemens)
532--
528668748
1,340567587
1,6741,340
480493594573709
_«574604616683
686530513582576
434502521528508
572534665553474
518597630674604
Dissolved solids concentration (mg/L)Estimated
337--
334415462
805357368999805
306314373360439
__361378385424
426335326366362
280319330334323
360338414349303
328374393419378
Measured
281
275
400
See footnote at end of table.-81-
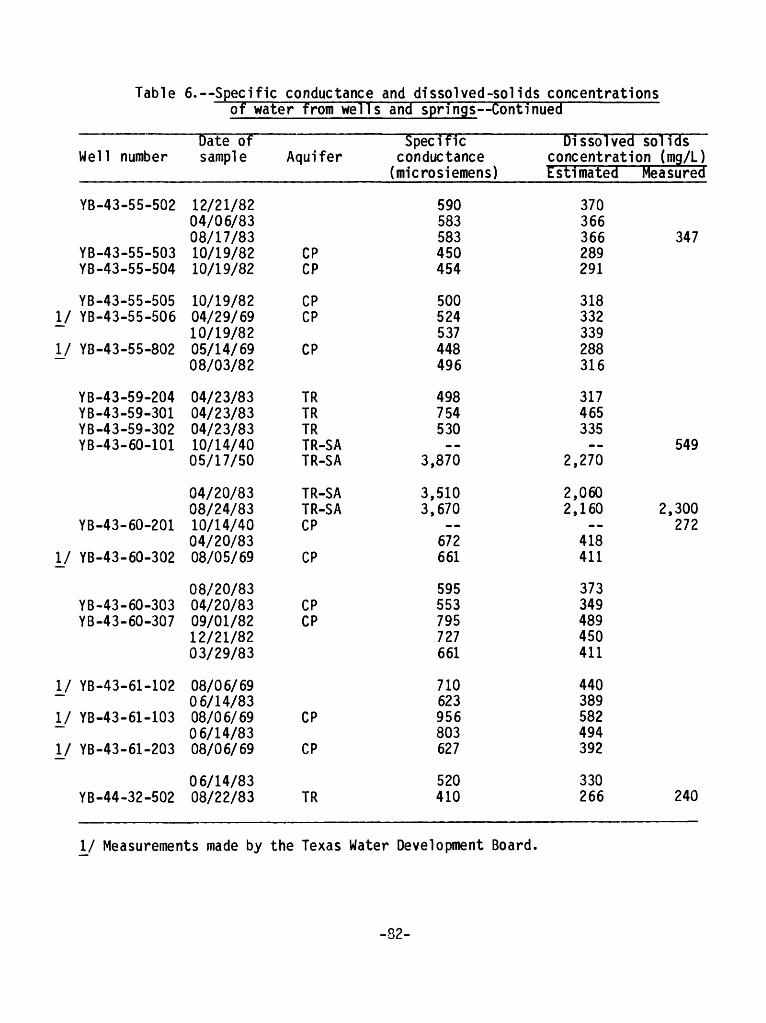
Table 6.--Specific conductance and dissolved-sol Ids concentrationsof water from wel
Well number
YB-43-55-502
YB-43-55-503YB-43-55-504
YB-43-55-505y YB-43-55-506
y YB-43-55-802
YB-43-59-204YB-43-59-301YB-43-59-302YB-43-60-101
YB-43-60-201
y YB-43-60-302
YB-43-60-303YB-43-60-307
y YB-43-61-102
y YB-43-61-103
y YB-43-61-203
YB-44-32-502
Date of sample
12/21/8204/06/8308/17/8310/19/8210/19/82
10/19/8204/29/6910/19/8205/14/6908/03/82
04/23/8304/23/8304/23/8310/14/4005/17/50
04/20/8308/24/8310/14/4004/20/8308/05/69
08/20/8304/20/8309/01/8212/21/8203/29/83
08/06/6906/14/8308/06/6906/14/8308/06/69
06/14/8308/22/83
Aquifer
CPCP
CPCP
CP
TRTRTRTR-SATR-SA
TR-SATR-SACP
CP
CPCP
CP
CP
TR
Is and springs Continued
Specific conductance
(microsiemens)
590583583450454
500524537448496
498754530--
3,870
3,5103,670
672661
595553795727661
710623956803627
520410
Dissolved solids concentration (mg/L)Estimated
370366366289291
318332339288316
317465335
2,270
2,0602,160
418411
373349489450411
440389582494392
330266
Measured
347
549
2,300272
240
y Measurements made by the Texas Water Development Board.
-82-
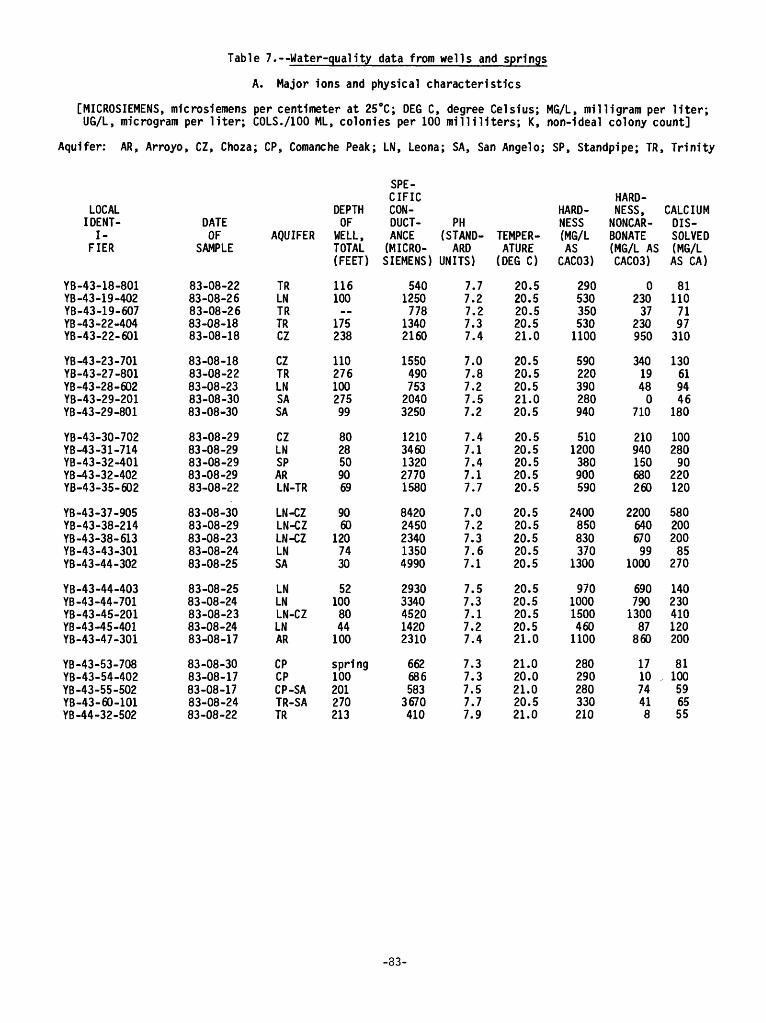
Table 7. Water-quality data from wells and springs
A. Major ions and physical characteristics
[MICROSIEMENS, microsiemens per centimeter at 25°C; DEG C, degree Celsius; MG/L, milligram per liter; UG/L, microgram per liter; COLS./IOO ML, colonies per 100 mi Hi liters; K, non-ideal colony count]
Aquifer: AR, Arroyo, CZ, Choza; CP, Comanche Peak; LN, Leona; SA, San Angelo; SP, Standpipe; TR, Trinity
LOCAL IDENT
I FIER
YB-43-18-801 YB-43-19-402 YB-43-19-607 YB-43-22-404 YB-43-22-601
YB-43-23-701 YB-43-27-801 YB-43-28-602 YB-43-29-201 YB-43-29-801
YB-43-30-702 YB-43-31-714 YB-43-32-401 YB-43-32-402 YB-43-35-602
YB-43-37-905 YB-43-38-214 YB-43-38-613 YB-43-43-301 YB-43-44-302
YB-43-44-403 YB-43-44-701 YB-43-45-201 YB-43-45-401 YB-43-47-301
YB-43-53-708 YB-43-54-402 YB-43-55-502 YB-43-60-101 YB-44-32-502
DATEOF
SAMPLE
83-08-22 83-08-26 83-08-26 83-08-18 83-08-18
83-08-18 83-08-22 83-08-23 83-08-30 83-08-30
83-08-29 83-08-29 83-08-29 83-08-29 83-08-22
83-08-30 83-08-29 83-08-23 83-08-24 83-08-25
83-08-25 83-08-24 83-08-23 83-08-24 83-08-17
83-08-30 83-08-17 83-08-17 83-08-24 83-08-22
AQUIFER
DEPTH OF
WELL, TOTAL
SPE CIFIC CON DUCT- PH ANCE (STAND- TEMPER- (MICRO- ARD ATURE
(FEET) SIEMENS) UNITS) (DEG C)
TRLNTRTRCZ
CZTRLNSASA
CZLNSPARLN-TR
LN-CZLN-CZLN-CZLNSA
LNLNLN-CZLNAR
CPCPCP-SATR-SATR
116100__
175238
11027610027599
8028509069
9060
1207430
521008044100
spring100201270213
5401250778
13402160
155049075320403250
12103460132027701580
84202450234013504990
29303340452014202310
6626865833670410
7.77.27.27.37.4
7.07.87.27.57.2
7.47.17.47.17.7
7.07.27.37.67.1
7.57.37.17.27.4
7.37.37.57.77.9
20.520.520.520.521.0
20.520.520.521.020.5
20.520.520.520.520.5
20.520.520.520.520.5
20.520.520.520.521.0
21.020.021.020.521.0
HARD- HARD- NESS, NESS NONCAR- (MG/L BONATE AS (MG/L AS
CAC03)
2905303505301100
590220390280940
5101200380900590
2400850830370
1300
970100015004601100
280290280330210
CAC03)
023037
230950
34019480
710
210940150680260
220064067099
1000
690790130087860
171074418
CALCIUM DIS SOLVED (MG/LAS CA)
811107197310
130619446
180
10028090
220120
58020020085
270
140230410120200
81100596555
-83-
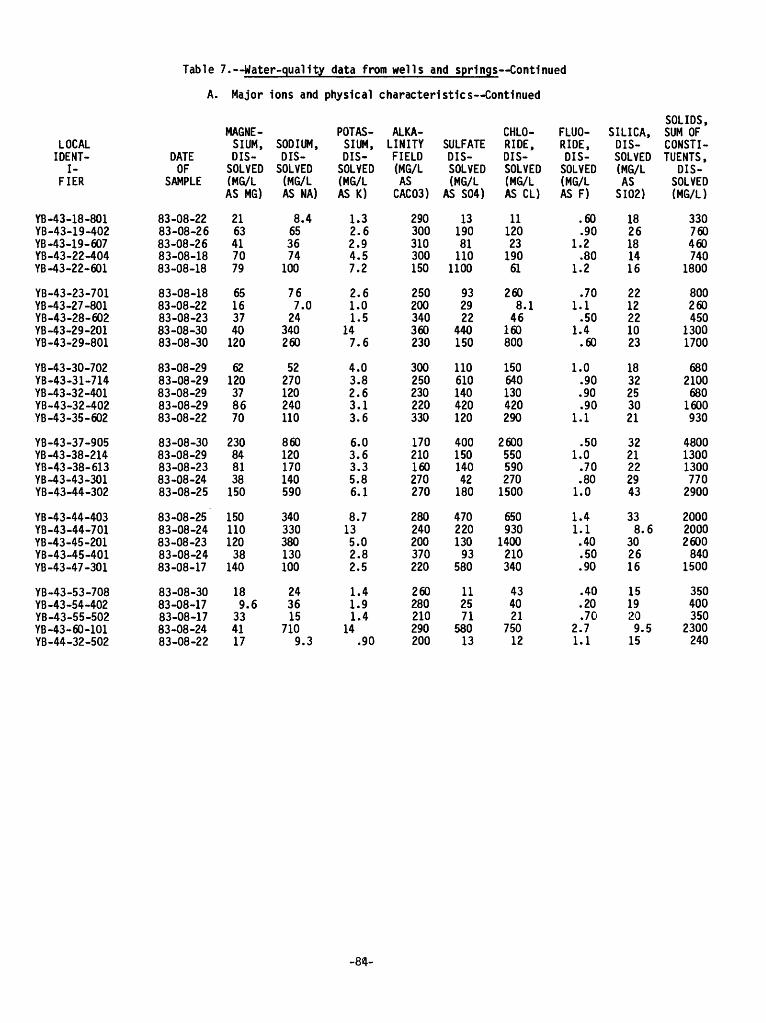
Table 7.---Water-quality data from wells and springs Continued
A. Major ions and physical characteristics Continued
LOCAL IDENT
I FIER
YB-43-18-801 YB-43-19-402 YB-43-19-607 YB-43-22-404 YB-43-22-601
YB-43-23-701 YB-43-27-801 YB-43-28-602 YB-43-29-201 YB-43-29-801
YB-43-30-702 YB-43-31-714 YB-43-32-401 YB-43-32-402 YB-43-35-602
YB-43-37-905 YB-43-38-214 YB-43-38-613 YB-43-43-301 YB-43-44-302
YB-43-44-403 YB-43-44-701 YB-43-45-201 YB-43-45-401 YB-43-47-301
YB-43-53-708 YB-43-54-402 YB-43-55-502 YB-43-60-101 YB-44-32-502
DATEOF
SAMPLE
83-08-2283-08-2683-08-2683-08-1883-08-18
83-08-1883-08-2283-08-2383-08-3083-08-30
83-08-2983-08-2983-08-2983-08-2983-08-22
83-08-3083-08-2983-08-2383-08-2483-08-25
83-08-2583-08-2483-08-2383-08-2483-08-17
83-08-3083-08-1783-08-1783-08-2483-08-22
MAGNESIUM,DISSOLVED(MG/LAS MG)
2163417079
65163740120
62120378670
230848138150
15011012038
140
189.6
334117
SODIUM,DISSOLVED(MG/LAS NA)
8.4653674
100
767.024
340260
52270120240110
860120170140590
340330380130100
243615
7109.3
POTASSIUM,DISSOLVED(MG/LAS K)
1.32.62.94.57.2
2.61.01.5
147.6
4.03.82.63.13.6
6.03.63.35.86.1
8.7135.02.82.5
1.41.91.4
14.90
ALKALINITYFIELD(MG/LAS
CAC03)
290300310300150
250200340360230
300250230220330
170210160270270
280240200370220
260280210290200
SULFATEDISSOLVED(MG/L
AS S04)
1319081110
1100
932922
440150
110610140420120
40015014042180
47022013093
580
112571
58013
CHLORIDE,DISSOLVED(MG/LAS CL)
111202319061
2608.146
160800
150640130420290
26005505902701500
650930
1400210340
434021
75012
FLUO-RIDE,DISSOLVED(MG/LAS F)
.60
.901.2.80
1.2
.701.1.50
1.4.60
1.0.90.90.90
1.1
.501.0.70.801.0
1.41.1.40.50.90
.40
.20
.702.71.1
SILICA,DISSOLVED(MG/LAS
SI02)
1826181416
2212221023
1832253021
3221222943
338.6
302616
1519209.515
SOLIDS,SUM OFCONSTITUENTS,
DISSOLVED(MG/L)
330760460740
1800
800260450
13001700
68021006801600930
4800130013007702900
200020002600840
1500
350400350
2300240
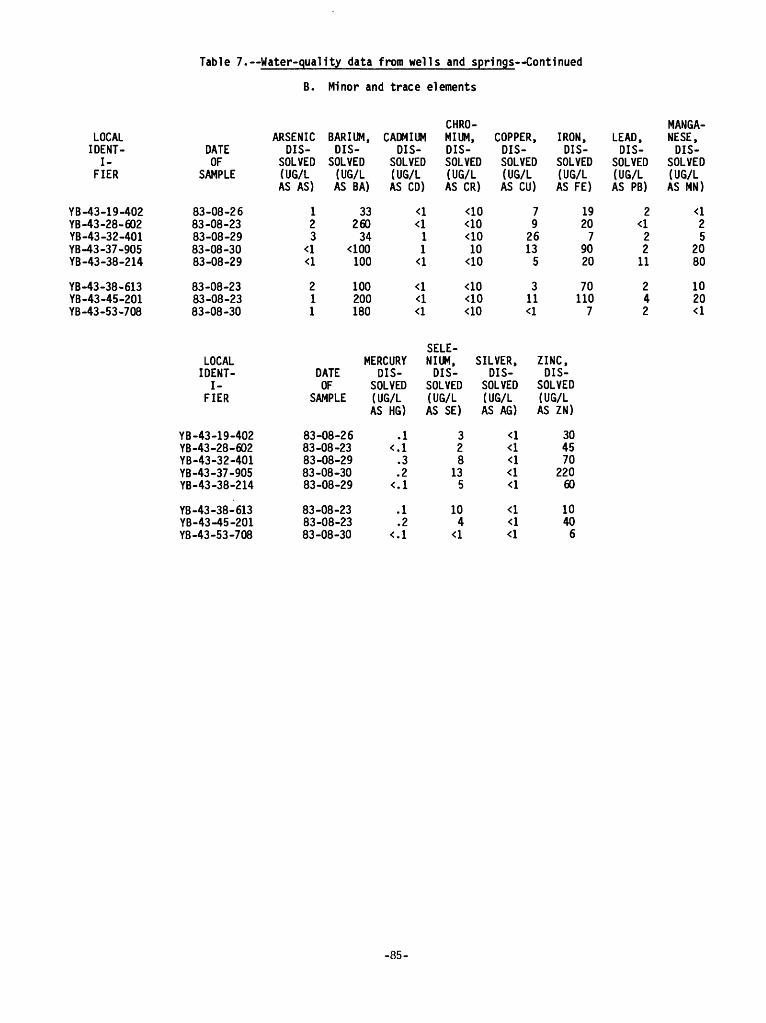
Table 7. Water-quality data from wells and springs Continued
LOCAL IDENT
I FIER
YB-43-19-402 YB-43-28-602 YB-43-32-401 YB-43-37-905 YB-43-38-214
YB-43-38-613 YB-43-45-201 YB-43-53-708
DATEOF
SAMPLE
83-08-2683-08-2383-08-2983-08-3083-08-29
83-08-2383-08-2383-08-30
LOCALIDENT
IFIER
YB-43-19-402YB-43-28-602YB-43-32-401YB-43-37-905YB-43-38-214
YB-43-38-613YB-43-45-201YB-43-53-708
B. Minor and trace elements
CHRO-ARSENIC BARIUM, CADMIUM MIUM, COPPER, IRON,
DIS- DIS- DIS- DIS- DIS- DISSOLVED SOLVED SOLVED SOLVED SOLVED SOLVED(U6/L (U6/L (UG/L (UG/L (UG/L (UG/LAS AS) AS BA) AS CD) AS CR) AS CU) AS FE)
1 33 <1 <10 7 192 260 <1 <10 9 203 34 1 <10 26 7
<1 <100 1 10 13 90<1 100 <1 <10 5 20
2 100 <1 <10 3 701 200 <1 <10 11 1101 180 <1 <10 <1 7
SELE-MERCURY NIUM, SILVER, ZINC,
DATE DIS- DIS- DIS- DIS-OF SOLVED SOLVED SOLVED SOLVED
SAMPLE (UG/L (UG/L (UG/L (UG/LAS HG) AS SE) AS AG) AS ZN)
83-08-26 .1 3 <1 3083-08-23 <.l 2 <1 4583-08-29 .3 8 <1 7083-08-30 .2 13 <1 22083-08-29 <.l 5 <1 60
83-08-23 .1 10 <1 1083-08-23 .2 4 <1 4083-08-30 <.l <1 <1 6
MANGA-LEAD, NESE,DIS- DIS
SOLVED SOLVED(UG/L (UG/LAS PB) AS MN)
2 <1<1 22 52 2011 80
2 104 202 <1
-85-
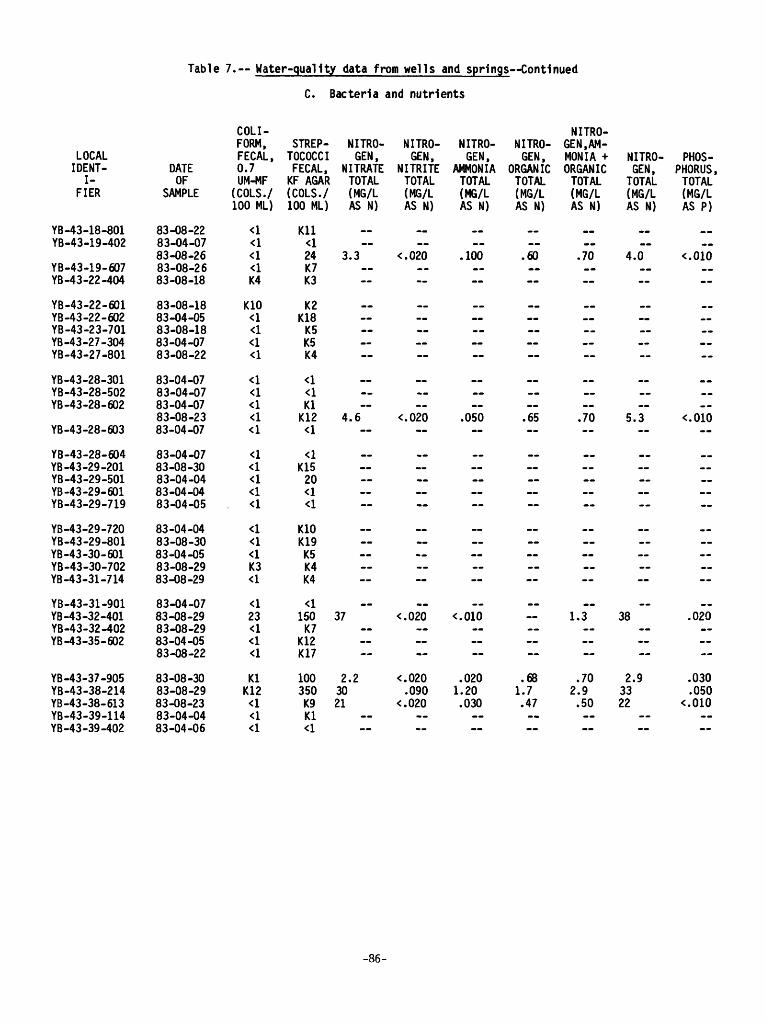
Table 7. Water-quality data from wells and springs Continued
LOCAL IDENT
I FIER
YB-43-18-801 YB-43-19-402
YB-43-19-607 YB-43-22-404
YB-43-22-601 YB-43-22-602 YB-43-23-701 YB-43-27-304 YB-43-27-801
YB-43-28-301 YB-43-28-502 YB-43-28-602
YB-43-28-603
YB-43-28-604 YB-43-29-201 YB-43-29-501 YB-43-29-601 YB-43-29-719
YB-43-29-720 YB-43-29-801 YB-43-30-601 YB-43-30-702 YB-43-31-714
YB-43-31-901 YB-43-32-401 YB-43-32-402 YB-43-35-602
YB-43-37-905 YB-43-38-214 YB-43-38-613 YB-43-39-114 YB-43-39-402
DATEOF
SAMPLE
83-08-22 83-04-07 83-08-26 83-08-26 83-08-18
83-08-18 83-04-05 83-08-18 83-04-07 83-08-22
83-04-07 83-04-07 83-04-07 83-08-23 83-04-07
83-04-07 83-08-30 83-04-04 83-04-04 83-04-05
83-04-04 83-08-30 83-04-05 83-08-29 83-08-29
83-04-07 83-08-29 83-08-29 83-04-05 83-08-22
83-08-30 83-08-29 83-08-23 83-04-04 83-04-06
C. Bacteria and nutrients
COLI-FORM,FECAL,0.7UM-MF
(COLS./100 ML)
<1
<!<1K4
K10<1<1<1<X
<J
<1
<\
<J
<!<1<1K3<l
23<1<1<1
KlK12<1<1
STREP- NITRO-TOCOCCI GEN,FECAL, NITRATEKF AGAR TOTAL(COLS./ (MG/L100 ML) AS N)
Kll
24 3.3K7K3
K2K18K5K5K4
KlK12 4.6
K1520
K10K19K5K4K4
150 37K7
K12K17
100 2.2350 30K9 21Kl
NITROGEN,
NITRITETOTAL(MG/LAS N)
<.020._
_ _ ....
<.020
-. ~
<.020-...
<.020.090
<.020
NITROGEN,
AMMONIATOTAL(MG/LAS N)
.100._
__..__..
.050
..
<.010-.-.
.0201.20.030
NITROGEN,
ORGANICTOTAL(MG/LAS N)
.60..
__......
.65
~
..-.
--
.681.7.47
NITRO-GEN, AMMONIA + NITRO-ORGANIC GEN,TOTAL TOTAL(MG/L (MG/LAS N) AS N)
.70 4.0..
__ __..__
.70 5.3
..
..
..
1.3 38
.70 2.92.9 33.50 22
PHOSPHORUS,TOTAL(MG/LAS P)
«
<.010__
______
<.010
__--
.020.-
.030
.050<.010
-86-

LOCAL IDENT
I FIER
Table 7. Water-quality data from wells and springs Continued
C. Bacteria and nutrients Continued
DATE OF
SAMPLE
COLI- FORM, FECAL, 0.7 UM-MF
(COLS./ 100 ML)
STREP TOCOCCI FECAL ,
KF AGAR (COLS./ 100 ML)
NITRO GEN,
NITRATE TOTAL (MG/L AS N)
NITRO GEN,
NITRITE TOTAL (MG/L AS N)
NITRO GEN,
AMMONIA TOTAL (MG/L AS N)
NITRO GEN,
ORGANIC TOTAL (MG/L AS N)
NITRO GEN, AM MONIA + ORGANIC TOTAL (MG/L AS N)
NITRO GEN, TOTAL (MG/L AS N)
PHOS PHORUS, TOTAL (MG/L AS P)
YB-43-39-704YB-43-43-301YB-43 -44-302
YB-43-44-403
YB-43-44-701YB-43-45-201YB-43-45-401YB-43-45-402
YB-43 -47 -301YB-43-53-103YB-43-53-409YB-43-53-708YB-43-54-402
YB-43-55-502
YB-43-60-101YB-43-60-307YB-44-32-502
83-04-0483-08-2483-04-0883-08-2583-04-08
83-08-2583-08-2483-08-2383-08-2483-04-08
83-08-1783-04-0883-04-0883-08-3083-08-17
83-04-0683-08-1783-08-2483-04-0883-08-22 .
<1<1<1<1<1
<!<1<1Kl<1
K4<1<1<1Kl
<1K226<1Kl
2921KlK7K9
K12K4
K1943K6
42KlK4
K13230
<142
400KlK5
26 <.020 .110 .59 .70 27 <.010
18 <.020 <.010 1.5 20 .020
-87-
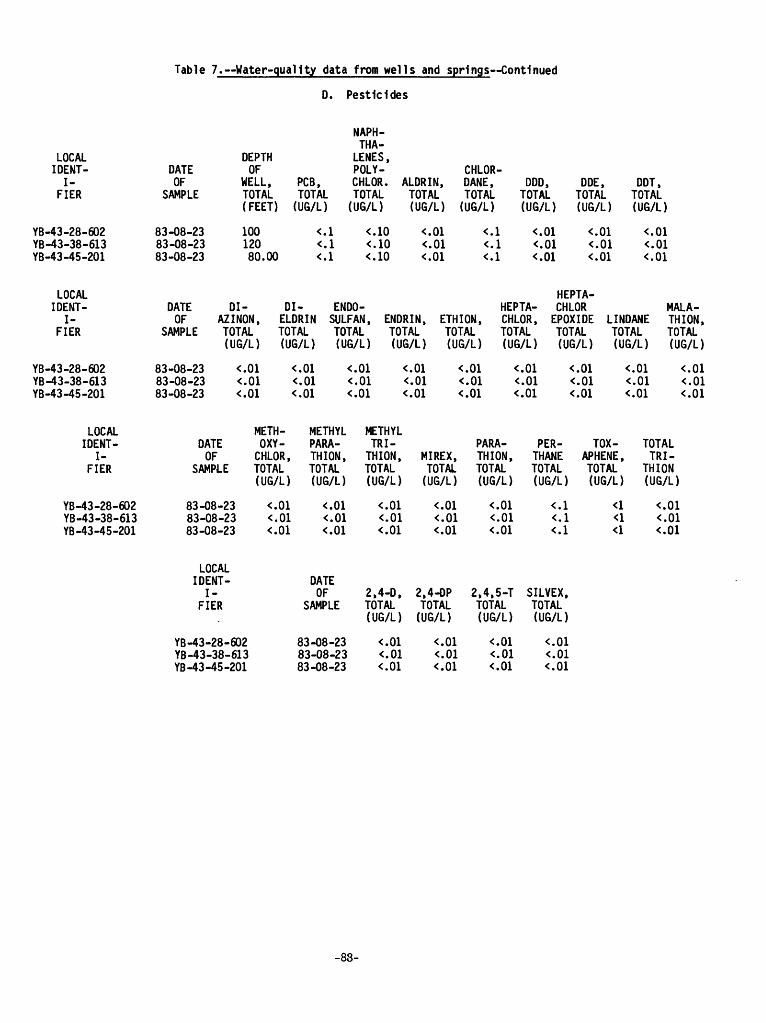
Table 7. Water-quality data from wells and springs Continued
D. Pesticides
LOCAL IDENT
I FIER
YB-43-28-602 YB-43-38-613 YB-43-45-201
DATEOF
SAMPLE
83-08-23 83-08-23 83-08-23
DEPTHOF
WELL, TOTAL
PCB, TOTAL
NAPH THA LENES,POLY- CHLOR- CHLOR. ALDRIN, DANE, TOTAL TOTAL TOTAL
(FEET) (UG/L) (UG/L) (UG/L) (UG/L)
100 <.l <.10 <.01 <.]120 <.l <.10 <.01 <.:80.00 <.l <.10 <.01 <.]
DDD, TOTAL (UG/L)
DDE, TOTAL (UG/L)
DDT, TOTAL (UG/L)
LOCAL IDENT
I FIER
YB-43-28-602 YB-43-38-613 YB-43-45-201
DATEOF
SAMPLE
83-08-23 83-08-23 83-08-23
DI-AZINON, TOTAL
DI- ENDO- HEPTA-HEPTA- CHLOR
ELDRIN SULFAN, ENDRIN, ETHION, CHLOR, EPOXIDE LINDANE TOTAL TOTAL TOTAL TOTAL TOTAL TOTAL TOTAL
(UG/L) (UG/L) (UG/L) (UG/L) (UG/L) (UG/L) (UG/L) (UG/L)
MALA- THION, TOTAL (UG/L)
LOCAL IDENT
I FIER
YB-43-28-602 YB-43-38-613 YB-43-45-201
DATEOF
SAMPLE
83-08-23 83-08-23 83-08-23
METH- OXY-
METHYL PARA-
METHYL TRI-
CHLOR, THION, THION, MIREX,PARA- THION,
TOTAL TOTAL TOTAL TOTAL TOTAL (UG/L) (UG/L) (UG/L) (UG/L) (UG/L)
PER- TOX- TOTALTHANE APHENE, TRI-TOTAL TOTAL THION(UG/L) (UG/L) (UG/L)
LOCAL IDENT
I FIER
YB-43-28-602 YB-43-38-613 YB-43-45-201
DATEOF 2,4-D, 2,4-DP
SAMPLE TOTAL TOTAL(UG/L) (UG/L)
83-08-23 <.01 <.0183-08-23 <.01 <.0183-08-23 <.01 <.OJ
2,4,5-T SILVEX,TOTAL TOTAL(UG/L) (UG/L)
-88-


