

Answers for industry.
Siemens PLM Software
NX CAM 10.0.3:
Tool Path Display and Analysis Graphically analyzing tool paths by color display.

2
About NX CAM
NXTM CAM software has helped many of the world’s leading manufacturers and job shops produce better
parts faster. You can also achieve similar benefits by making use of the unique advantages NX CAM
offers.
This is one of many hands-on demonstrations designed to introduce you to the powerful capabilities in
NX CAM 10.0.3. In order to run this demonstration, you will need access to NX CAM 10.0.3.
Visit the NX Manufacturing Forum to learn more, ask questions, and share comments about NX CAM.
3
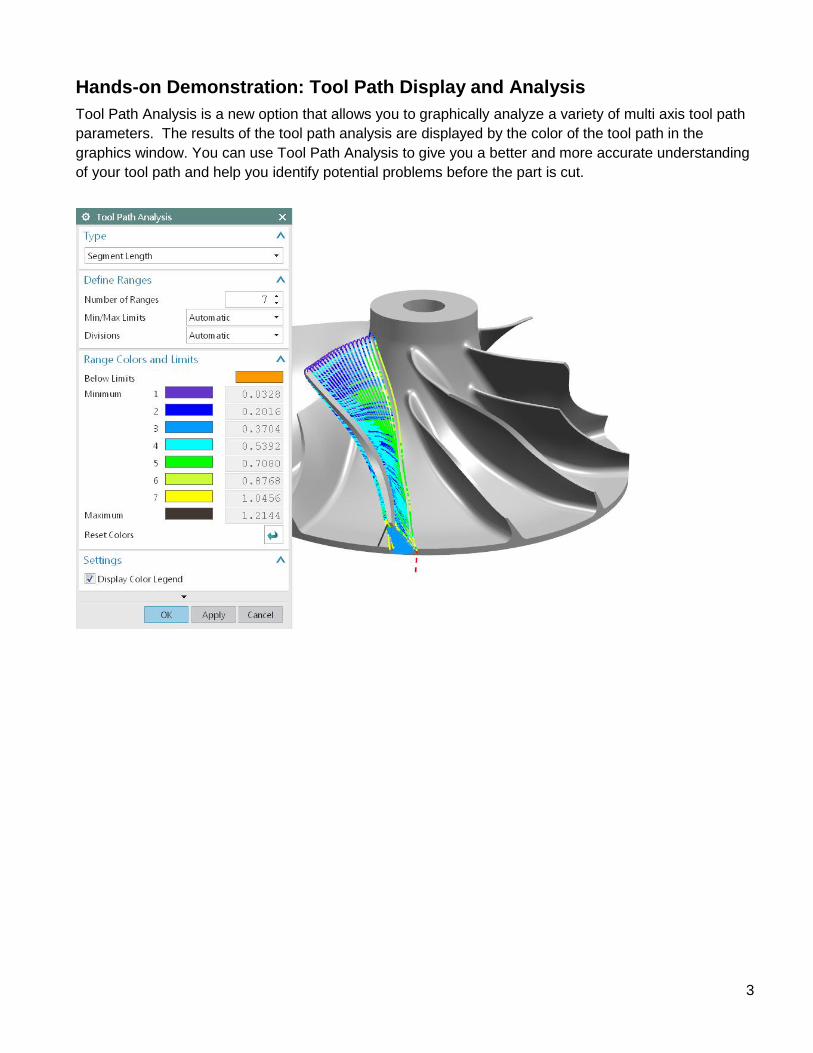
Hands-on Demonstration: Tool Path Display and Analysis
Tool Path Analysis is a new option that allows you to graphically analyze a variety of multi axis tool path
parameters. The results of the tool path analysis are displayed by the color of the tool path in the
graphics window. You can use Tool Path Analysis to give you a better and more accurate understanding
of your tool path and help you identify potential problems before the part is cut.

4
Prerequisites:
1. You will need access to NX CAM 10.0.3 in order to run this demonstration.
2. If you haven’t done so already, download and unzip tool_path_display_and_analysis.7z.
Demo:
1. Open tool_path_display_and_analysis.prt in NX.
2. In the Program Order view of the Operation Navigator, select BLADE_FINISH.
3. Refresh the graphics display to remove the blank geometry from the screen.
4. Select Tool Path Analysis from the Ribbon Bar.
5
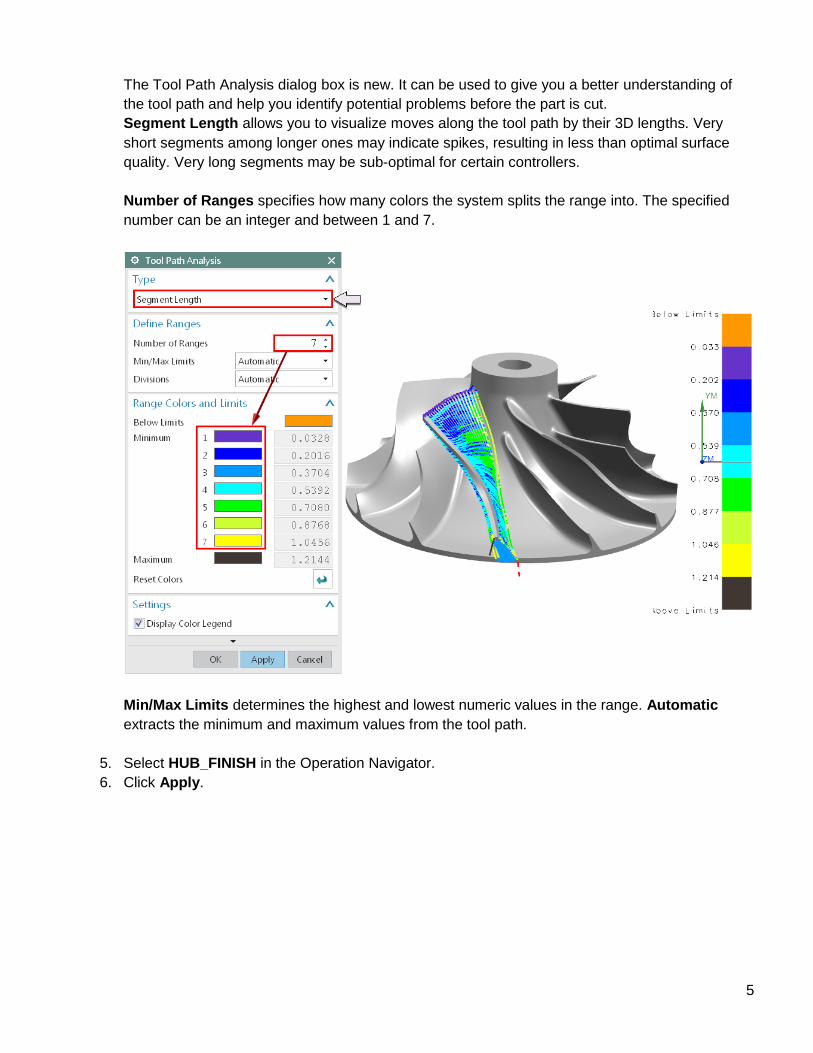
The Tool Path Analysis dialog box is new. It can be used to give you a better understanding of
the tool path and help you identify potential problems before the part is cut.
Segment Length allows you to visualize moves along the tool path by their 3D lengths. Very
short segments among longer ones may indicate spikes, resulting in less than optimal surface
quality. Very long segments may be sub-optimal for certain controllers.
Number of Ranges specifies how many colors the system splits the range into. The specified
number can be an integer and between 1 and 7.
Min/Max Limits determines the highest and lowest numeric values in the range. Automatic
extracts the minimum and maximum values from the tool path.
5. Select HUB_FINISH in the Operation Navigator.
6. Click Apply.
6
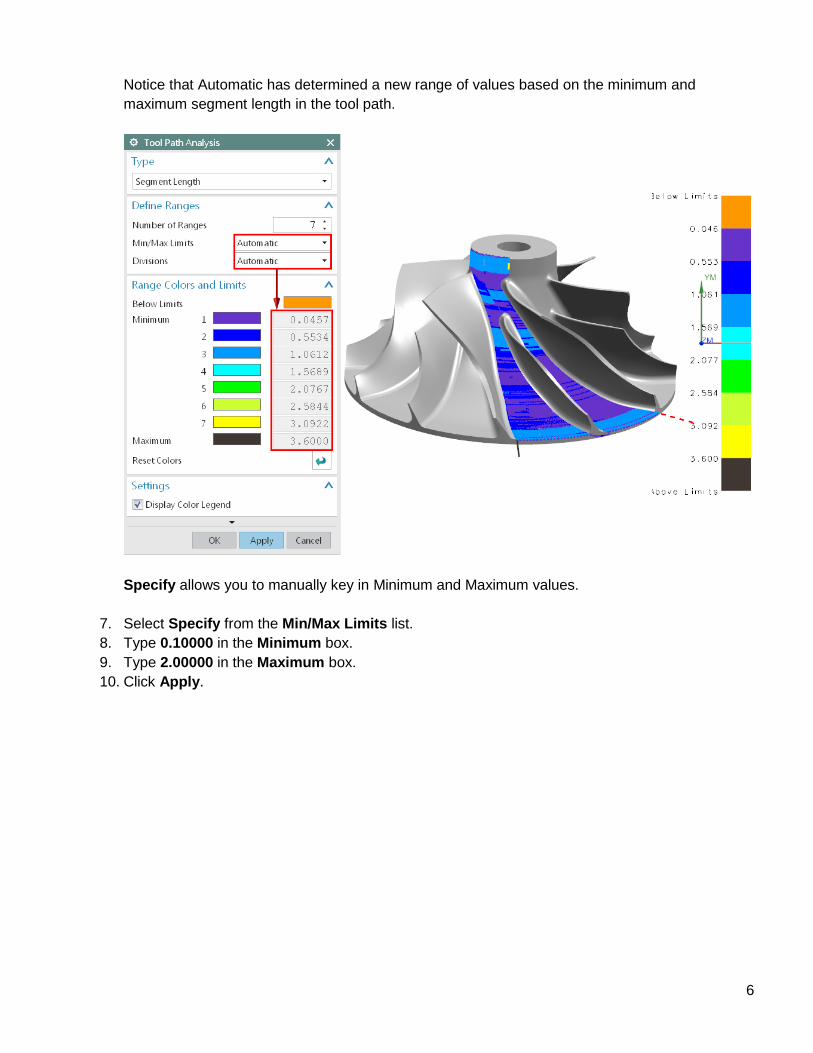
Notice that Automatic has determined a new range of values based on the minimum and
maximum segment length in the tool path.
Specify allows you to manually key in Minimum and Maximum values.
7. Select Specify from the Min/Max Limits list.
8. Type 0.10000 in the Minimum box.
9. Type 2.00000 in the Maximum box.
10. Click Apply.
7
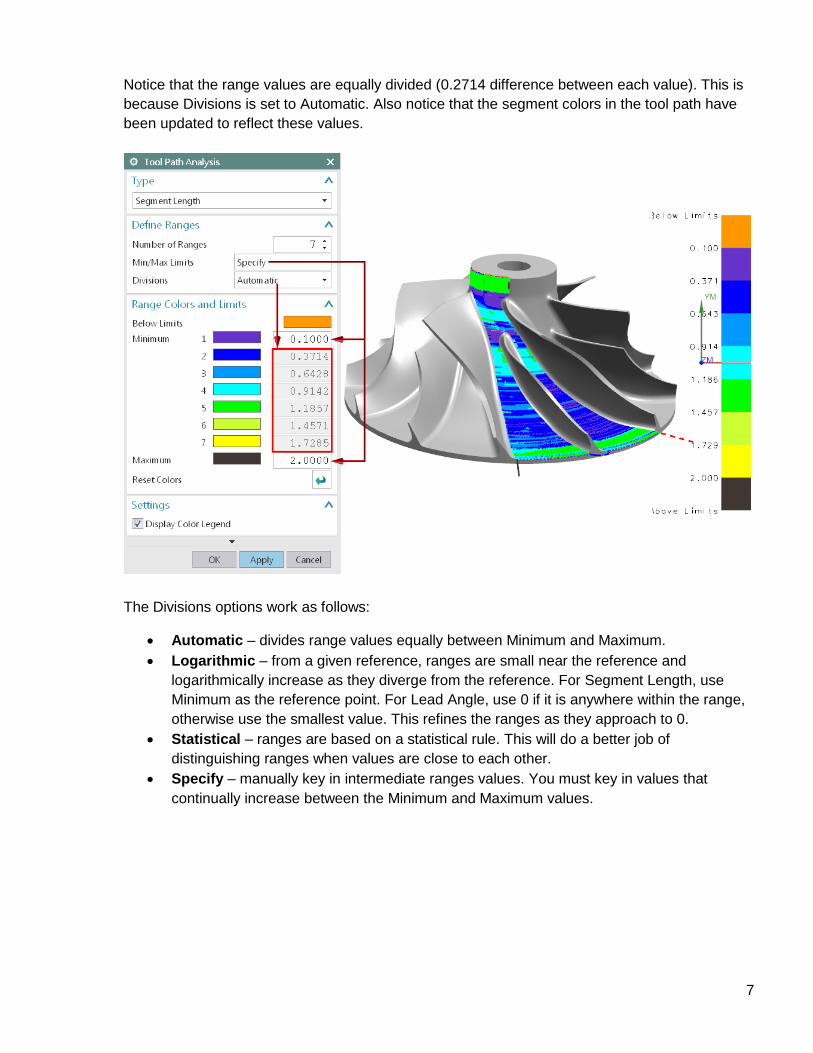
Notice that the range values are equally divided (0.2714 difference between each value). This is
because Divisions is set to Automatic. Also notice that the segment colors in the tool path have
been updated to reflect these values.
The Divisions options work as follows:
Automatic – divides range values equally between Minimum and Maximum.
Logarithmic – from a given reference, ranges are small near the reference and
logarithmically increase as they diverge from the reference. For Segment Length, use
Minimum as the reference point. For Lead Angle, use 0 if it is anywhere within the range,
otherwise use the smallest value. This refines the ranges as they approach to 0.
Statistical – ranges are based on a statistical rule. This will do a better job of
distinguishing ranges when values are close to each other.
Specify – manually key in intermediate ranges values. You must key in values that
continually increase between the Minimum and Maximum values.

8
You may customize the range colors.
11. Click the blue box in range 2.
12. Click any contrasting color not currently used in the range.
13. Click OK.
14. Click Apply.
15. Select Automatic from the Min/Max Limits list.

9
16. Click Apply.
The remaining Type options allow you to analyze other tool path parameters.
17. Select Lead Angle from the Type list.
When changing Type, there is no need to Apply.
The remaining Type options analyze the tool path as follows:
Lead Angle - The angle between the tool axis and path direction. Negative values may
indicate heal digging. The system colors the moves by the angle of tool axis orientation
from the plane perpendicular to the local path direction. When the tool leans backwards
relative to cut direction, the lead angle is negative. When leaning forward, it is positive.

10
Delta Lead Angle – The change in the tool lead angle along the path.
Swiveling Axis Angle – The angle between the tool axis and ZM.
For a 5-axis orthogonal milling machine with a C axis, this reflects the A or B axis value.
Values near 0 might indicate pole transition. Check to be sure the Maximum value is
supported by your machine tool.
Swiveling Axis Speed – The speed of change of the angle between tool axis and ZM.
For a 5-axis orthogonal milling machine with a C axis, this is the speed of A or B axis.
Rotary Axis Angle - The angle between the tool axis projected on the X-Y plane with
respect to XM. For a 5-axis orthogonal milling machine with a C axis, this is the C axis
value.
Rotary Axis Speed - The speed of change of the angle between the tool axis projected
on the X-Y plane. For a 5-axis orthogonal milling machine with a C axis, this is the speed
of the C axis.
18. Continue analyzing the tool paths in this part and experimenting with different tool path analysis
settings.
19. Close the part without saving.
11
About Siemens PLM Software
Siemens PLM Software, a business unit of the
Siemens Industry Automation Division, is a leading global
provider of product lifecycle management (PLM) software
and services with seven million licensed seats and more than
71,000 customers worldwide. Headquartered in Plano,
Texas, Siemens PLM Software works collaboratively with
companies to deliver open solutions that help them turn
more ideas into successful products. For more information
on Siemens PLM Software products and services, visit
www.siemens.com/plm.
© 2015 Siemens Product Lifecycle Management
Software Inc. Siemens and the Siemens logo are registered
trademarks of Siemens AG. D-Cubed, Femap, Geolus,
GO PLM, I-deas, Insight, JT, NX, Parasolid, Solid Edge,
Teamcenter, Tecnomatix and Velocity Series are trademarks
or registered trademarks of Siemens Product Lifecycle
Management Software Inc. or its subsidiaries in the United
States and in other countries. All other logos, trademarks,
registered trademarks or service marks used herein are the
property of their respective holders.
03/15
www.siemens.com/plm/nxmanufacturingforum
Siemens Industry Software
Headquarters
Granite Park One
5800 Granite Parkway
Suite 600
Plano, TX 75024
USA
+1 972 987 3000
Americas
Granite Park One
5800 Granite Parkway
Suite 600
Plano, TX 75024
USA
+1 314 264 8499
Europe
Stephenson House
Sir William Siemens Square
Frimley, Camberley
Surrey, GU16 8QD
+44 (0) 1276 413200
Asia-Pacific
Suites 4301-4302, 43/F
AIA Kowloon Tower, Landmark East
100 How Ming Street
Kwun Tong, Kowloon
Hong Kong
+852 2230 3308


