

Sin Taxes: Sobering Reality
Scott Pattison
Executive Director
NASBO
April 2, 2015

Overall
www.nasbo.org
2
▫ Modest Growth (Mirror Economy)
▫ Most States: Good/Decent
▫ Tough Decisions
▫ Some States Very Difficult (Oil prices, etc.)

3
Long Term Spending Pressures:
Medicaid and Health Care
K-12 and Higher Education
Demographic Changes
Corrections
Infrastructure
Pensions
Retiree Health Care
www.nasbo.org

Slow Budget Growth Continues
www.nasbo.org
4
-8
-6
-4
-2
0
2
4
6
8
10
12
%
General Fund Expenditure Growth (%)
*Average
*37-year historical average annual rate of growth is 5.5 percent *Fiscal 2015 numbers are enacted
Source: NASBO Fall 2014 Fiscal Survey of States
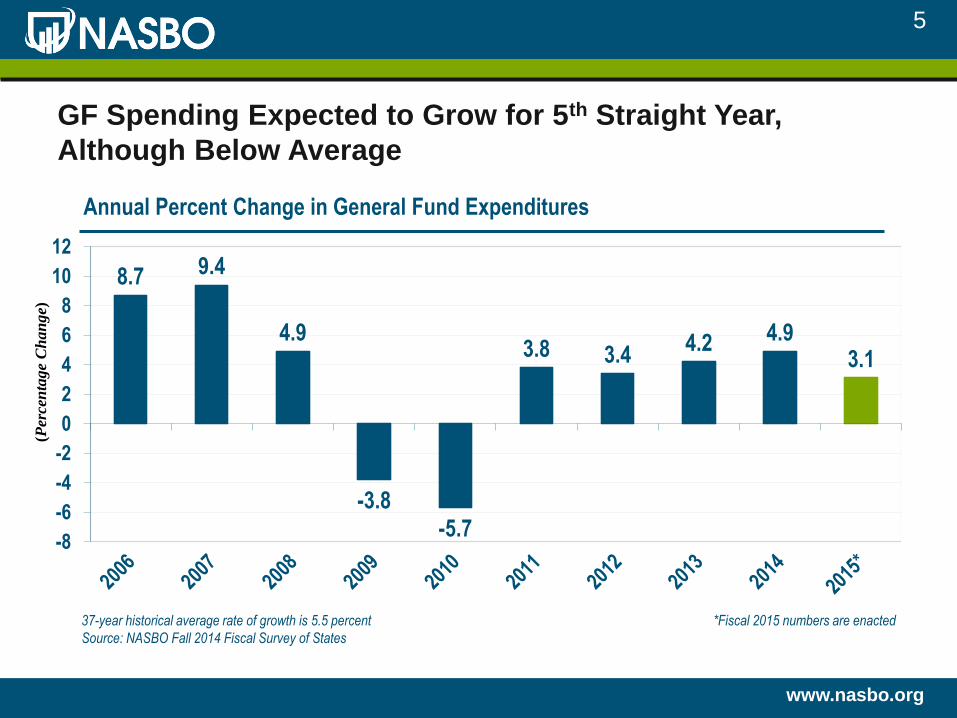
GF Spending Expected to Grow for 5th Straight Year,
Although Below Average
www.nasbo.org
5
8.7 9.4
4.9
-3.8-5.7
3.8 3.44.2 4.9
3.1
-8
-6
-4
-2
0
2
4
6
8
10
12
(Per
cen
tage
Ch
an
ge)
Annual Percent Change in General Fund Expenditures
37-year historical average rate of growth is 5.5 percent *Fiscal 2015 numbers are enacted
Source: NASBO Fall 2014 Fiscal Survey of States
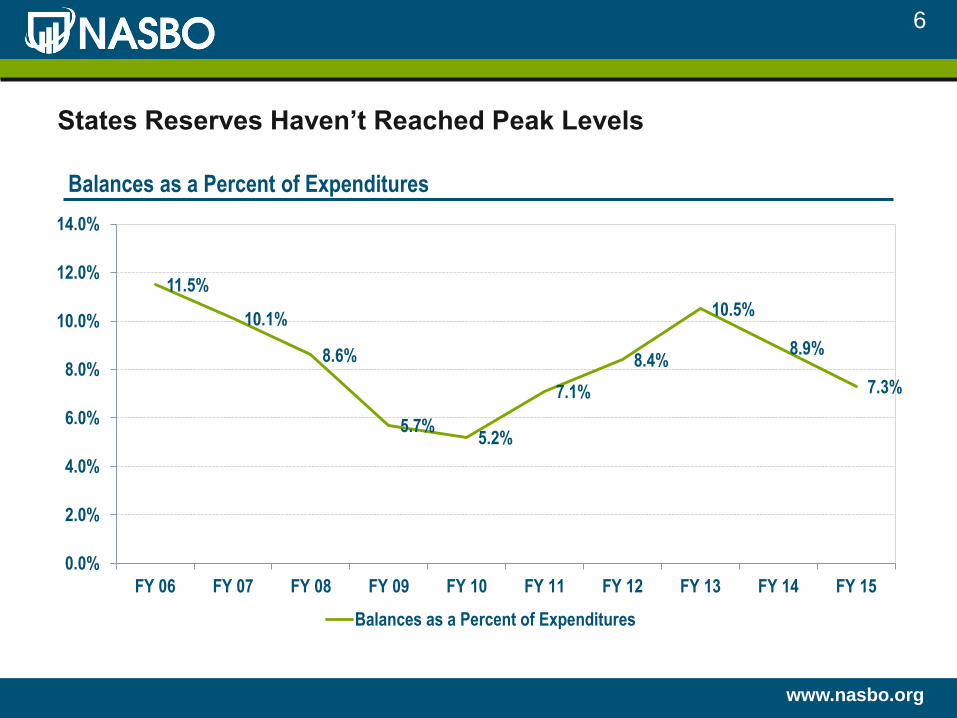
States Reserves Haven’t Reached Peak Levels
11.5%
10.1%
8.6%
5.7%5.2%
7.1%
8.4%
10.5%
8.9%
7.3%
0.0%
2.0%
4.0%
6.0%
8.0%
10.0%
12.0%
14.0%
FY 06 FY 07 FY 08 FY 09 FY 10 FY 11 FY 12 FY 13 FY 14 FY 15
Balances as a Percent of Expenditures
Balances as a Percent of Expenditures
www.nasbo.org
6
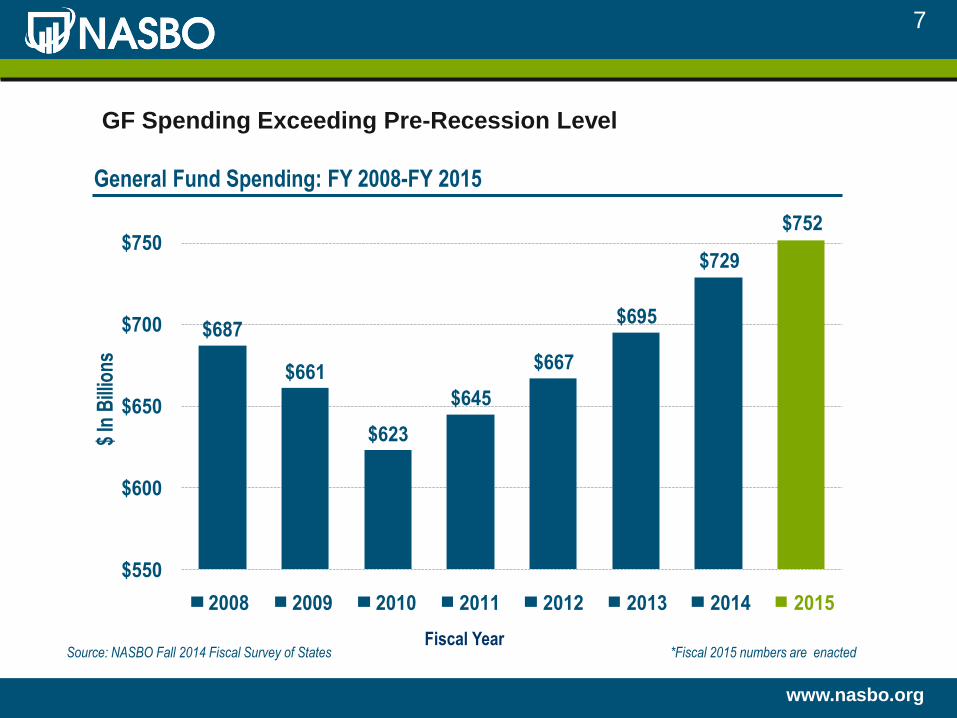
GF Spending Exceeding Pre-Recession Level
www.nasbo.org
7
Source: NASBO Fall 2014 Fiscal Survey of States *Fiscal 2015 numbers are enacted
$687
$661
$623
$645
$667
$695
$729
$752
$550
$600
$650
$700
$750
$ In
Bill
ions
2008 2009 2010 2011 2012 2013 2014 2015
General Fund Spending: FY 2008-FY 2015
Fiscal Year

GF Spending Still Below Pre-Recession Peak Adjusted for Inflation
$655
$687
$661
$623$645
$667
$695
$729$752
$771
$500
$550
$600
$650
$700
$750
$800
FY 2007 FY 2008 FY 2009 FY 2010 FY 2011 FY 2012 FY 2013 FY 2014 FY 2015
General Fund Spending: FY 2007-FY 2015
*
www.nasbo.org
8
Source: NASBO Fall 2014 Fiscal Survey of States; Fiscal 2015 numbers are enacted
*Aggregate spending levels would need to be at $771 billion to remain equivalent with real 2008 spending levels.

GF Revenue Also Below Pre-Recession Peak Adjusted for Inflation
$655
$680
$626$610
$650
$669
$716$726
$748$763
$500
$550
$600
$650
$700
$750
$800
FY 2007 FY 2008 FY 2009 FY 2010 FY 2011 FY 2012 FY 2013 FY 2014 FY 2015
General Fund Revenue: FY 2007-FY 2015
www.nasbo.org
9
Source: NASBO Fall 2014 Fiscal Survey of States; Fiscal 2015 numbers are enacted
*Aggregate revenue levels would need to be $763 billon to remain equivalent with real 2008 revenue levels.
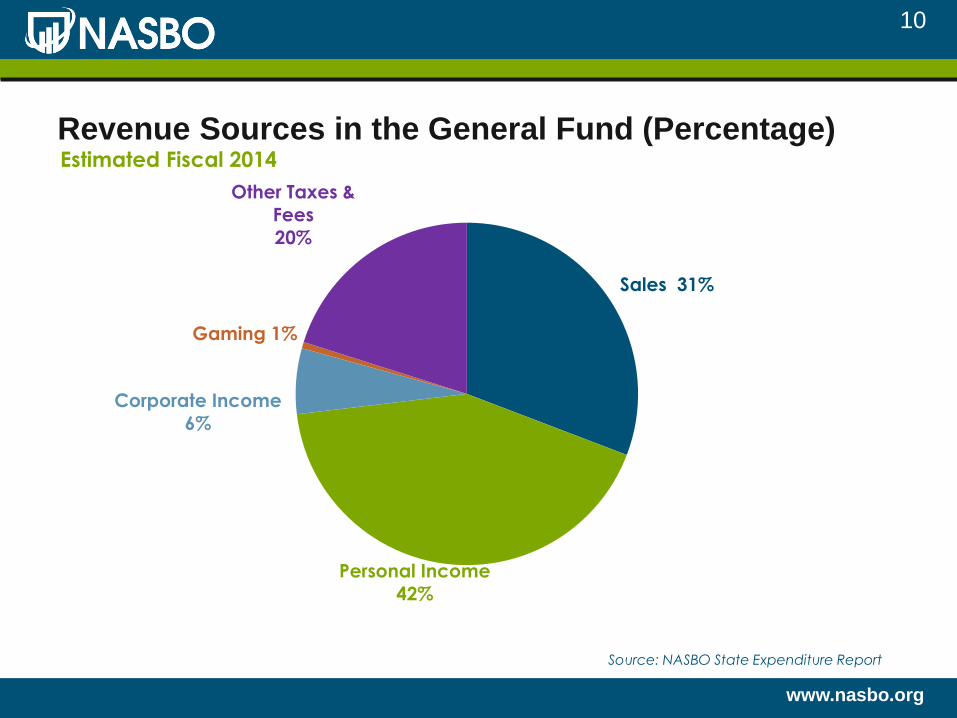
Revenue Sources in the General Fund (Percentage)
Sales 31%
Personal Income
42%
Corporate Income
6%
Gaming 1%
Other Taxes &
Fees
20%
Estimated Fiscal 2014
www.nasbo.org
Source: NASBO State Expenditure Report
10
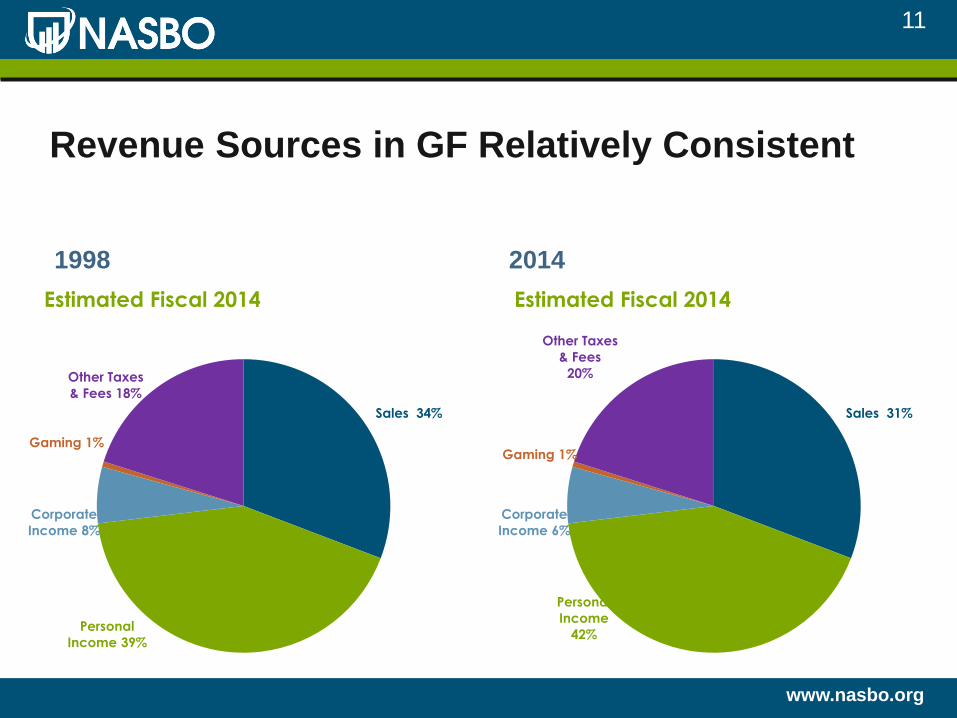
Revenue Sources in GF Relatively Consistent
1998 2014
11
www.nasbo.org
Sales 34%
Personal
Income 39%
Corporate
Income 8%
Gaming 1%
Other Taxes
& Fees 18%
Estimated Fiscal 2014
Sales 31%
Personal
Income
42%
Corporate
Income 6%
Gaming 1%
Other Taxes
& Fees
20%
Estimated Fiscal 2014

Percent Change in FY 2014 and 2015 Collections by
Major Tax
Fiscal 2014 revenues increased by 1.3%, slow growth partly due to federal tax changes▫ PIT grew by 0.9%, sales 4.9%, and CIT 0.7%
Fiscal 2015 revenues projected to increase by 3.1%▫ PIT projected to increase by 4.7%, sales 4.0%, and CIT 1.7%
www.nasbo.org
12
Source: Fall 2104 Fiscal Survey of States

General Fund Collections Compared to Projections
Fiscal 2014 ▫ Revenue collections outpaced projections in 25 states
▫ Were on target in 5 states
▫ And came in below estimates in 20 states
Fiscal 2015▫ Revenue collections have outpaced projections in 7 states
▫ Are on target in 26 states
▫ Are coming in below estimates in 10 states
www.nasbo.org
13
*Only 43 states reported collections compared to projections for fiscal 2015.

Fiscal 2015 Enacted Revenue Changes by Major Tax
Sales Taxes (-$248M): 5 states enacted increases,
13 enacted decreases
Personal Income (-$747M): 1 increase, 14 decreases
Corporate Income ($207M): 2 increases, 9 decreases
Cigarettes/Tobacco ($8M): 2 increases
Motor Fuels ($33M): 1 increase
Alcohol (-$0.2M): 1 increase, 1 decrease
Other Taxes (-$698M): 4 increases, 9 decreases
www.nasbo.org
14
Source: NASBO Fall 2014 Fiscal Survey of States
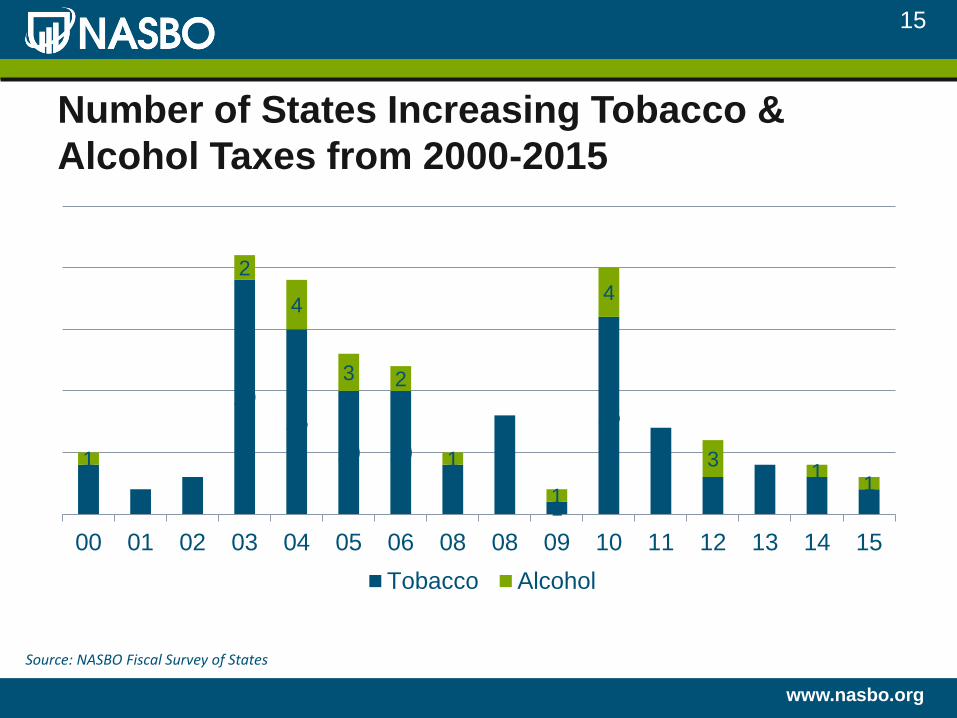
Number of States Increasing Tobacco &
Alcohol Taxes from 2000-2015
www.nasbo.org
15
42 3
1915
10 10
48
1
16
73 4 3 2
1
2
4
3 2
1
1
4
31
1
00 01 02 03 04 05 06 08 08 09 10 11 12 13 14 15
Tobacco Alcohol
Source: NASBO Fiscal Survey of States
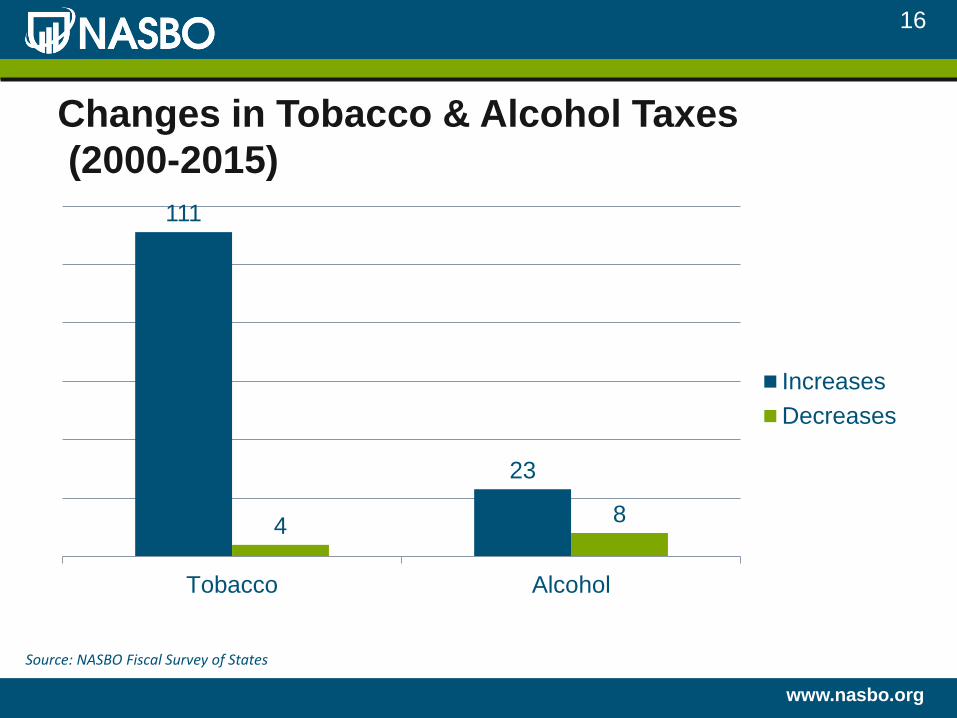
Changes in Tobacco & Alcohol Taxes
(2000-2015)
www.nasbo.org
16
111
23
48
Tobacco Alcohol
Increases
Decreases
Source: NASBO Fiscal Survey of States

Tobacco and Alcohol Revenue
According to Census, state and local tobacco
tax revenue was $17.6B in fiscal 2012
State and local alcohol revenue was $6.5B
Total state general fund revenue alone was
$672.8B in fiscal 2012, according to State
Expenditure Report
www.nasbo.org
17

State Gambling Revenue
Gambling revenue totaled $27.3 billion in fiscal 2014, according to Rockefeller Institute of Government▫ Lottery $18.1B, Casino $5.3B, Racino $3.2B, Video
Gaming $582M, Pari-mutel $140.5M
By comparison, total general fund revenue was $729.7 billion, according to State Expenditure Report
Gambling revenue increased 0.6% in fiscal 2014, but declined 0.8 percent after adjusting for inflation▫ Lotteries grew 0.6%, casinos declined 1.4%
www.nasbo.org
18

Colorado Marijuana revenue
Colorado is projected to receive $47.7M in medical and retail marijuana revenue in fiscal 2015▫ Original projection was $134M
By comparison, Colorado’s total projected general fund revenue for fiscal 2015 is $9.6B▫ Marijuana revenue would then represent 0.5%
January marijuana sales yielded $2.3M for schools▫ Colorado spent $7.9B on K-12 from all fund sources in
fiscal 2014
www.nasbo.org
19

Washington State Marijuana revenue
Washington State Economic and Revenue
Forecast Council is projecting $222M in
marijuana revenue over the next two-year
budget for fiscal 2016-2017
By comparison, Washington’s general fund
revenues are projected to be $16.8B in fiscal
2015 alone
www.nasbo.org
20
Budget View
Sin Taxes Not a Solution for Major Budget Problems
Good for: ▫ Some Extra Funds
▫ Pay for Regulatory Environment
▫ Discourage Use
Reasons and Justification Should be Discussed
Distraction from Major Fiscal Challenges
Marijuana Issue: Colorado Gov. John Hickenlooper stated that he thinks legalization was a bad idea (1/23/15 CNBC interview)
www.nasbo.org
21
www.nasbo.org
Scott D. Pattison
Executive Director
NASBO
202-624-8804
22
www.nasbo.org


