
See important disclosures, including any required research certifications, beginning on page 28
Singapore Consumer Discretionary
What's new: Singapore’s public transport landscape is set to undergo
extensive change. In the rail segment, details of regulatory reform and
asset acquisition are scant, and we believe these developments will only
gain traction after rail reliability obligations have been fulfilled, which we do
not expect to occur in the near term. Meanwhile, in the bus segment, the
transition to a new government contracting model (GCM) is imminent, and
we recommend that investors position themselves ahead of the events we
expect to play out in the run-up to, and following, the GCM’s
implementation in September 2016. We expect shares in the sector to be
rerated over the coming months as clarity increases.
What's the impact: Given that we are drawing close to the GCM’s
implementation, we incorporate its full impact into our forecasts despite the
lack of disclosure. Our recent discussions with new entrant Go-Ahead, as
well as our analysis of the London bus market, where a similar model has
been in place since 2000, strengthen our conviction that the transport
service providers under Daiwa’s coverage will be net beneficiaries of the
shift to the GCM, mainly as we foresee: 1) scope for operating-margin
enhancement as revenue risk is transferred to the government, 2) reduced
capex burdens as the government will assume asset ownership, and 3)
capital proceeds from a potential acquisition of existing bus assets.
After fine-tuning our margin assumptions for the bus segment, we estimate
the move to the GCM will account for 5-9% of our operating profit forecasts
for ComfortDelGro (CDG) for 2016-18E, and 4-7% of SMRT’s for FY17-
19E. In terms of asset acquisitions, we believe a direct acquisition remains
the most sensible option for the regulator, and estimate net inflows of
around SGD566m and SGD44.6m for CDG and SMRT respectively.
What we recommend: We have a Positive rating on the sector. We
reaffirm our Buy (1) call on CDG (CD SP, SGD2.97) with a higher DCF-
based 12-month TP of SGD3.59 (from SGD3.38) and Underperform (4)
rating on SMRT (MRT SP, SGD1.58), after raising our DCF-based TP to
SGD1.41 (from SGD1.34). We continue to prefer CDG over SMRT, as we
believe the former is better placed to leverage this operational shift given
the bus segment is CDG’s largest segment (32% of Singapore revenue vs.
SMRT’s 19%). Further, its superior FCF profile, stronger balance sheet (net
cash of SGD229.2m as at end-2015 vs SMRT’s net debt of SGD665.5m as
at end-FY15) and 2016E dividend yield of 3.3% looks attractive, while the
stock is trading at a 2016E PER of 19.7x (vs. SMRT’s 24.7x for FY17E).
How we differ: We believe the attractiveness of the new bus model in the
Singapore market could be under-appreciated by some in the market.
18 March 2016
Singapore Land Transport Sector
What will restructuring mean for the bus market in
2016?
In a pivotal year for the segment, we expect implementation of a new contracting model in September to be positive for existing operators
Government acquisition of CDG and SMRT’s bus assets could take place by 3Q16
We have a Positive sector rating; prefer CDG over SMRT for superior earnings growth and more attractive valuation
Key stock calls
Source: Daiwa forecasts
Jame Osman(65) 6321 3092
New Prev.
ComfortDelGro Corp (CD SP)
Rating Buy Buy
Target 3.590 3.380
Upside p 20.9%
SMRT Corp (MRT SP)
Rating Underperform Underperform
Target 1.410 1.340
Downside q 11%

2
Singapore Land Transport Sector: 18 March 2016
How do we justify our view?
Growth outlook Valuation Earnings revisions
Growth outlook Singapore Land Transport Sector: net profit growth forecasts
(% YoY)
While we expect the transition to a new bus model in
Singapore in September 2016 to drive an expansion in
operating profit margins for CDG and SMRT, we believe
CDG will be the main beneficiary of this move due to its
greater exposure to the bus segment.
Further, our forecast 6.5% YoY decline in SMRT’s FY17E
net profit (2016 forecasts in the chart) incorporates our
expectation of operating losses for its rail operation (MRT
and LRT), due to: 1) increased rail and maintenance
expenses, 2) the impact of the 1.9% fare reduction
implemented in December 2015, and 3) lower government
grants.
Source: Daiwa forecasts Note: SMRT FY17E forecasts shown above as 2016 forecasts due to March year-end
Valuation Singapore Land Transport Sector: 2016E valuations
The valuations of the land transport operators have seen a
rerating, likely driven by a positive shift in the market’s
outlook toward the public transport sector following
favourable policy announcements signalling the
government’s intention to encourage public transport
usage in the long term.
CDG’s valuations look reasonable to us in the context of
its superior free cash flow generation, stronger balance
sheet and 2016E dividend yield of 3.3%, as well as its
stronger earnings growth prospects, relative to SMRT.
(x) PER PBR EV/EBITDA Dividend yield
CDG 19.7 2.6 7.3 3.3%
SMRT 24.7 2.5 9.0 2.2%
Source: Companies, Daiwa forecasts Note: SMRT’s valuations are for FY17E (March year-end)
Earnings revisions Singapore Land Transport Sector: consensus earnings-forecasts revisions
The Bloomberg-consensus EPS forecasts for 2016-17
have seen downward revisions over the past 12 months,
mainly due to the announcement in October 2015 of a
1.9% reduction in fares by the government. SMRT has
seen sharper cuts due to its greater exposure to the
regulated fare environment (around 72% of revenue vs.
24% for CDG), as well as increased expectations of higher
repair and maintenance and staff costs arising from its rail-
enhancement projects.
2016 2017
EPS EBITDA EPS EBITDA
CDG (4) (4) (4) (7)
SMRT (29) (8) (31) (17)
Source: Bloomberg
-7%
-2%
3%
8%
13%
2016 2017 2018
CDG SMRT

3
Singapore Land Transport Sector: 18 March 2016
Sector stocks: key indicators
Source: Bloomberg, Daiwa forecasts
Singapore Land Transport: timeline of GCM-related events
Date Details
May-14 LTA announces plans for new Government Contracting Model
Oct-14 Tender for Bulim package opened
Apr-15 Tender for Loyang package opened
May-15 Winner of Bulim package announced
Aug-15 SBS Transit announces transfer of BSEP buses to LTA
Nov-15 Winner of Loyang package announced
Dec-15 LTA announces it will take over SBST's 2016/17 bus purchase contracts; acquires 50 of its existing buses at NBV
Upcoming
2Q16E Tender for third bus package (Mandai)
3Q16E Purchase of SBST/SMRT bus assets
4Q16E Award of third bus package
Sep-16 GCM takes effect - Tower Transit commences operations
Source: Companies, Land Transport Authority (LTA), Daiwa compiled
CDG: impact of GCM on Singapore bus segment operating forecasts
SMRT: impact of GCM on Singapore bus segment operating forecasts
SGD m 2014 2015E 2016E 2017E 2018E
Current model
Singapore bus revenues 777.4 848.8 883.1 918.7 955.8
YoY revenue growth
9.2% 4.0% 4.0% 4.0%
Operating profit margin 1.6% 1.6% 1.6% 1.6% 1.6%
Segment operating profit 12.4 13.6 14.1 14.7 15.3
Under proposed GCM
Singapore bus revenues 777.4 848.8 794.75 734.98 764.68
YoY revenue growth
9.2% -6.4% -7.5% 4.0%
Operating profit margin 1.6% 1.6% 4.8% 8.0% 8.0%
Segment operating profit 12.4 13.6 38.1 58.8 61.2
Incremental operating profit - - 24.0 44.1 45.9
% increase to overall operating profit forecasts
5.1% 8.8% 9.0%
Assumptions
First 3 GCM packages are not won by either incumbent
20% decline in revenues (according to % of bus routes lost)
SGD m FY15 FY16E FY17E FY18E FY19E
Current model
Bus segment revenues (non-consolidated) 238.6 250.7 260.8 271.3 282.3
YoY revenue growth
5.1% 4.0% 4.0% 4.0%
Operating profit margin -2.7% 4.0% 1.5% 1.5% 1.5%
Segment operating profit (6.5) 10.0 3.9 4.1 4.2
Under proposed GCM
Bus segment revenues 238.6 250.7 234.7 217.0 225.8
YoY revenue growth
5.1% -6.4% -7.5% 4.0%
Operating profit margin -2.7% 4.0% 3.8% 6.0% 6.0%
Segment operating profit (6.5) 10.0 8.9 13.0 13.5
Incremental operating profit - - 5.0 9.0 9.3
% increase to overall operating profit forecasts
4.1% 7.1% 7.0%
Assumptions
First 3 GCM packages are not won by either incumbent
20% decline in revenues (according to % of bus routes lost)
Source: Company, Daiwa estimates Note: CDG stopped disclosing segmental Singapore bus revenue in 4Q15; hence full-year
2015 Singapore bus revenue not available
Source: Company, Daiwa estimates
CDG: proceeds from the potential government acquisition of Singapore bus assets
SMRT: proceeds from the potential government acquisition of bus assets
(SGD m) Amount
SBST segmental bus assets (2014) at NBV 1,095
SBST segmental bus liabilities (2014) 411
Net asset value 684
Less: BSEP buses 118
Total potential net proceeds 566
Per share (SGD) 0.27
SBST accumulated profit (2014) 253
Potential payout at CDG level 0.12
(SGD m) Amount
SMRT segmental bus assets (FY15) 393.1
SMRT segmental bus liabilities (FY15) 348.5
Net asset value 44.6
Potential net proceeds 44.6
Per share (SGD) 0.02
Source: Company, Daiwa estimates
Source: Company, Daiwa estimates
Share
Company Name Stock code Price New Prev. New Prev. % chg New Prev. % chg New Prev. % chg
ComfortDelGro Corp CD SP 2.970 Buy Buy 3.590 3.380 6.2% 0.151 0.153 (1.6%) 0.167 0.171 (2.6%)
SMRT Corp MRT SP 1.585 Underperform Underperform 1.410 1.340 5.2% 0.069 0.069 0.0% 0.064 0.065 (1.8%)
Rating Target price (local curr.) FY1
EPS (local curr.)
FY2
4
Singapore Land Transport Sector: 18 March 2016
Table of contents
Spotlight on the bus segment ................................................................................. 5
A strong push toward greater public transport use .............................................................5
GCM: a recap ....................................................................................................................7
How could the market evolve? ...........................................................................................8
Assessing the impact on financials .................................................................................. 10
Key forecasts ................................................................................................................... 14
Valuations and ratings ..................................................................................................... 16
Key investment risks ........................................................................................................ 18
Company Section
ComfortDelGro Corp ........................................................................................................ 20
SMRT Corp ...................................................................................................................... 23

5
Singapore Land Transport Sector: 18 March 2016
Spotlight on the bus segment
A strong push toward greater public transport use
The public bus segment will see the biggest restructuring
2016 will be a pivotal year for the public transport landscape in Singapore, particularly in
the bus segment, with the transition to a new government contracting model (GCM) in
September 2016. We believe investors should position themselves ahead of the events
that we expect to happen in the lead-up to, and following, the GCM’s implementation.
Despite the likely increase in competition within the bus segment, we believe the transport
service providers under our coverage will still be net beneficiaries of the shift to the new
GCM. This is mainly because revenue and ridership risks will be transferred to the
government under the new system and, as a result, the operators will no longer be
subjected to a regulated fare pricing environment, which has historically been an
impediment to the segment’s profitability.
While there is uncertainty over the level at which margins for the operators could settle
post-GCM, our recent discussions with new entrant Go-Ahead, as well as our analysis of
the London bus market, where a similar bus model is in place, strengthen our conviction
that operating margins of the existing operators will expand significantly from current
levels. After fine-tuning our margin assumptions for the Singapore bus segment for CDG
and SMRT to improve to 6-8% by 2017 (from 8-10% previously), from around 0-2% levels
currently, we estimate the move to the GCM will account for 5-9% of our overall operating
profit forecasts for CDG for 2016-18, and 4-7% of our forecasts for SMRT for FY17-19E.
The other key event investors are waiting on is greater clarity over the potential acquisition
of bus assets of CDG and SMRT by the government. We believe that a direct acquisition
remains the most sensible option to ensure consistency among all operators. And recent
indicators suggest that this could indeed happen in the near term – the government
announced in December 2015 that it will purchase 50 of CDG’s newer buses at net book
value. We expect this to be the benchmark used going forward. Despite the overall lack of
disclosure from both the government and operators, we estimate net inflows of around
SGD566m and SGD44.6m for CDG and SMRT, respectively. We believe that an
acquisition could occur by 3Q16, and we may obtain further clarity as early as 24 March,
the date of the Singapore Budget 2016 announcement.
Singapore Land Transport: timeline of bus GCM-related events
Date Details
May-14 LTA announces plans for new Government Contracting Model
Oct-14 Tender for Bulim package opened
Apr-15 Tender for Loyang package opened
May-15 Winner of Bulim package announced
Aug-15 SBS Transit announces transfer of BSEP buses to LTA
Nov-15 Winner of Loyang package announced
Dec-15 LTA announces it will take over SBST's 2016/17 bus purchase contracts; acquires 50 of its existing buses at NBV
Upcoming
2Q16E Tender for third bus package (Mandai)
3Q16E Purchase of SBST/SMRT bus assets
4Q16E Award of third bus package
Sep-16 GCM takes effect - Tower Transit commences operations
Source: Companies, LTA, Daiwa compiled
Government policies remain strongly supportive of the sector
The new bus model underscores the Singapore government’s push toward greater usage
of public transport services in the land-scarce city state. In addition to the bus segment, the
government has undertaken a range of measures, both in the form of policy
implementation and greater infrastructure development, including: 1) curbing private
vehicle usage by reducing annual vehicle growth to just 0.5%, 2) plans to double the length
of the rail network to 360km by 2030, in addition to introducing new rail reform measures,
2016: a pivotal year for
Singapore public
transport

6
Singapore Land Transport Sector: 18 March 2016
and 3) committing a further SGD36bn to develop the public transport system over the next
5 years after spending SGD14bn in the past 5 years.
Recent news flow suggests to us that public transport ridership will continue to see robust
growth over the longer term. In a recent addendum to the President’s Address in January
2016, the Transport Minister outlined his aim to have 75% of commuters using public
transport as their main mode of travel by 2030. In addition, the General Household Survey
2015 indicated that around 58.7% of Singapore’s resident working population commutes to
work by public transport, up from 54.6% in 2010.
Singapore Land Transport Sector: average daily ridership (ADR) trends
Source: Land Transport Authority (LTA)
No clarity over rail reforms yet
Relative to the bus segment, little is known about the potential reforms in the rail segment,
even though negotiations between SMRT and the Land Transport Authority (LTA) has been
ongoing for 2 years. Comments made by the previous Transport Minister in July 2014
highlighting the “wide gap between SMRT’s expectations and LTA’s position”, as well as
the current minister’s comments in January 2016 flagging an improvement in rail reliability
as a “top priority” in the near term, suggest to us it would be in the best interests of the
government and the public for SMRT to fulfil all of its existing obligations with respect to
network efficiency before addressing asset acquisitions. The upshot: a timeline that could
stretch beyond 2018, in our view.
SMRT: potential impact of transition to new rail model on our current valuation
Operational assumptions Upside to Daiwa’s target price (SGD/share)
Asset sale proceeds Assets are acquired in a lump sum of around SGD463m, based on the existing NAV of the MRT segment
0.30
Capex savings SGD120m in annual capex reduction 0.72
Operating margin Assumption that FY19 margin improves to 5% from current forecasts 0.15
Total valuation impact Assuming no change to gearing levels 1.17
Source: Daiwa estimates
While a shift to an asset-light rail model would clearly be positive for SMRT, the timing,
magnitude and terms of such an event remain unclear to the market. As such, we focus
our attention on the bus segment, given the greater clarity over developments in the
coming months.
Positive sector view; we prefer CDG over SMRT
We have a Positive rating on the Singapore Land Transport Services sector, predicated on
our view that policy reform and government investment in public transport infrastructure
augurs well for operators, both in the near and long terms. Over the near term, we prefer
CDG over SMRT, mainly as the former is more exposed to the bus segment (32% of
Singapore revenue vs. SMRT’s 19%), on which there is greater clarity at this stage. CDG’s
experience in overseas markets such as the UK and Australia, where similar models have
been implemented, should also give it a solid base from which to navigate the new
operational landscape over the next few years, in our view.
500
1,000
1,500
2,000
2,500
3,000
3,500
4,000
2005 2006 2007 2008 2009 2010 2011 2012 2013 2014
MRT + LRT Bus Taxi
('000 passenger-trips)
Recent government
comments reinforce our
view

7
Singapore Land Transport Sector: 18 March 2016
We believe that CDG’s record of consistent earnings growth (4.1% net profit CAGR over
2005-15), superior free-cash-flow profile, strong balance sheet (net cash of SGD229.2m as
at end-2015 vs SMRT’s net debt of SGD665.5m as at end-FY15) and 2016E dividend yield
of 3.3% remain attractive attributes, even before considering the stock’s 2016E PER of
19.7x (vs. SMRT’s 24.7x for FY2017E). Further, we expect the company to see greater rail
segment revenue growth over the medium term, driven by the opening of DTL 3 as well as
the progressive ramp-up of both DTL 2 and 1. Last, we see greater potential earnings-
growth catalysts for CDG from overseas acquisitions or expansion with the excess capital
it should have on hand post-GCM.
GCM: a recap
The idea for a new bus model was first floated to the Singapore public in the regulator’s
(Land Transport Authority [LTA]) Land Transport Master Plan 2008, in which it outlined
plans to introduce a competitive tendering process based on packages of bus services.
The LTA later hired an external consultant to study the concept of a bus contracting model
to be applied in Singapore.
In May 2014, the LTA announced formal policy changes which would see a major shake-up
of the public bus system. It proposed a new GCM under which all bus routes in Singapore
would be divided into 12 packages – 3 of the 12 packages (each around 300-500 buses)
are to be tendered out between 2014 and mid-2016, while incumbents CDG and SMRT will
continue to operate the remaining 9 packages until August 2021. The government will use
the results of the initial 3 packages as a basis for negotiating the terms for the remaining 9
(which comprise around 80% of the existing bus fleet) with the 2 incumbents.
Singapore Land Transport Sector: key difference between the current and new bus models
Current bus model
New GCM
Licensing - Bus Service Operating Licences (BSOL) for SBS Transit & SMRT, which expire on 31 August 2016
- competitive tendering process to operate a package of bus routes for a period of 5 years + 2 year extension option
Revenue - fare prices set by the government
- operators keep fare revenue
- fare prices set by the government
- government keeps fare revenue
- operators paid according to contract bid, with additional incentive provisions for meeting operating standards
Costs - operators incur all operating costs
- government provides grants (training grants, BSEP grants etc.) to help defray certain costs
- operators incur all operating costs
Assets - operators own all operating assets (buses, fleet management systems, depots etc.)
- government owns all operating assets (buses, fleet management systems, depots etc.)
- operators lease and maintain these assets from the government
Source: LTA, Daiwa compiled
Under this new GCM, the LTA would pay operators to run bus services through competitive
contract tenders for each package, essentially on a ‘cost-plus’ basis. These contracts
would have a 5-year contract period, with an option for a 2-year extension, and be based
on bus routes and service standards (bus frequency, operating hours, etc) as set by the
LTA. Further incentive or bonus payments would be made (up to 10% of the annual service
fee) or correspondingly deducted to encourage operators to provide quality bus services
and ensure good maintenance of operating assets.
To date, the first (Bulim) and second (Loyang) packages have been awarded to UK-based
bus operators Tower Transit and Go-Ahead, respectively. While the third package (Mandai)
has yet to be put up for tender, we expect this to happen in 2Q16, with the winner to be
announced 6-7 months later (ie, in 4Q16). Our current expectations are for all 3 of the
tendered packages to go to new entrants.
CDG and SMRT will
continue to operate 9 of
12 packages until 2021
Contract-based with
incentives attached

8
Singapore Land Transport Sector: 18 March 2016
Details of the Bulim bus package tender Details of the Loyang bus package tender
Package details
Depot Bulim
Service areas Clementi, Jurong East and Bukit Batok bus interchanges
No. of routes 26
No. of buses 380, to grow progressively to about 500 by 2021
Shortlisted bidders
Company Country Bid amount (SGDm)
Go-Ahead Group UK 693
Woodlands Transport Singapore 684
SBS Transit Singapore 600
Busways Group Australia 568
Keolis SA France 559
Tower Transit Group (Winner) UK / Australia 556
RATP DEV Transdev Asia France 463
SMRT Corporation Singapore 453
Package details
Depot Loyang
Service areas Changi Airport, Changi Village Bus Terminals, Pasir Ris and Punggol Bus Interchanges
No. of routes 25
No. of buses 400, to grow progressively to about 500 by 2021
Shortlisted bidders
Company Country Bid amount (SGDm)
Busways Group Australia 631
RATP Dev Transdev Asia France 604
SMRT buses Singapore 598
Tian San Shipping & Kumho C&E Singapore/Korea 570
SBS Transit Singapore 546
Keolis SA France 535
Woodlands Transport Holdings Singapore 532
Go-Ahead Group (Winner) UK 498
Source: LTA Source: LTA
Why the need for a new bus model?
The new Singapore bus model aims to replicate the success seen in developed markets
such as the UK and Australia, where similar models have been implemented (see our case
study in the next section). Under the current system, bus operators shoulder revenue and
ridership risks. Despite the good ridership growth experienced over the past decade,
regulated fare pricing (governed by the Fare Review Mechanism Committee of the Public
Transport Council [PTC]) has restricted operators from raising fare prices in tandem even
in the face of rising costs.
As a result, both incumbent operators have posted poor operating-profit performances over
the past several years, as they have had to absorb escalations in labour and operating
costs in response to demand for higher bus-service standards. Besides this, operators
have been reluctant to increase fleet capacity and generally improve service standards at
the expense of further erosion in profitability. To tackle this, the Bus Service Enhancement
Program (BSEP) was introduced in March 2012 by the government as a transitionary
measure. This involved a commitment of SGD1.1bn to cover the purchase of an additional
1,000 buses to service 80 new bus routes over a 5-year period.
With the planned implementation of GCM in September 2016, the government’s ultimate
aim is to raise service standards for public transport commuters by being able to transmit
more effectively changes in bus services (frequency, punctuality, route details, etc.) as well
as managing fleet capacity, while balancing the interests of all key stakeholders (regulator,
commuters and operators).
For operators, the removal of revenue risk would mean that cost control and service quality
become 2 important aspects of profitability, given that cost savings accrue to the operator,
while meeting or exceeding operating standards would secure bonus/incentive payments.
How could the market evolve?
Case study: London public bus market
The London scheduled bus market is a useful reference point for how the Singapore bus
market could evolve operationally, as the proposed GCM is in many respects similar to
London’s existing bus model — unsurprising given that the Singapore regulator studied the
London model, which is seen as having efficiently raised service standards and commuter
satisfaction levels.
The evolution of the London bus market
Currently, bus services in London account for around 50% of all the city’s public transport
services, operating across 700 routes with a total fleet size of around 8,600 buses
managed by 21 bus operating companies (7 groups, 2 independent), according to
Transport for London (TfL). However, until 1985, all London bus services operated under a
nationalised model.
A careful balance
between each
stakeholder’s interests

9
Singapore Land Transport Sector: 18 March 2016
Over 1985-1999, the city’s government implemented a ‘gross cost’ model (fare revenue
retained by TfL, full operating cost paid to operator) and tendered out routes, while at the
same time splitting the public operator into smaller companies to compete with private-
market participants.
Subsequently, over the 1995-99 period, the government altered the model toward one
based on ‘net cost’ contracts (fare revenue and ridership risk retained by operators), as the
previous gross cost model did not incentivise operators to meet reliability standards.
However, the net cost model posed its own set of issues, as operators prioritised
profitability over service quality, making transmissions of network changes difficult and
contract negotiations tedious. In response, the quality incentive contract (QIC) model was
proposed in 2000 and is still in effect today.
London’s QIC-based model rewards operators for service outperformance and holds many
similarities with the proposed Singapore GCM – contracts are tendered to bidding
operators for a 5-year period (plus an extension for 2 years). The key differences between
the models: 1) London operators are asset owners for the depot/garages, as well as
buses, whereas the regulator will own all bus assets under the Singapore GCM, and 2)
contracts are individually tendered for 5-6 routes in London (over 700 routes altogether,
with around 20% put up for re-tendering every year), while in Singapore all routes have
been divided into 12 packages of 300-500 buses apiece.
Key comparison of Singapore and London bus models
Singapore London
Model Government Contracting Model (GCM) - gross cost model under an incentive framework based on 5 performance indicators
Quality Incentive Contract (QIC) - gross cost contract with incentive provisions (graduated payment scale)
Asset ownership
- regulator (LTA) owns all bus-related assets - operators own bus depots/garages and buses
Operating structure
- regulator keeps fare revenue and shoulders ridership risks
- operators can receive or be deducted up to 10% of annual service fees for meeting/failing performance indicators
- regulator keeps fare revenue and shoulders ridership risks
- operators are able to earn up to 15% of contract price in bonus payments or deducted up to 10% for poor performance
Tender process
- routes divided into 12 packages of 300-500 buses
- contract period of 5 years + 2-year extension option
- individual tender of tranches of 5-6 routes (around 20% of routes up for re-tender each year)
- contract period of 5 years + 2-year extension option
Source: News reports, LTA, TfL
Currently, there are around 7 key operators vying for bus contracts in London. With the
implementation of a competitive tender-based model, the overall bus market has seen
service reliability standards improve, leading to ridership growth and record commuter
satisfaction levels.
Go-Ahead Group: London bus segment revenue and operating profit trend
Source: Company
8.9%
9.0%
9.1%
9.2%
9.3%
9.4%
9.5%
9.6%
200
250
300
350
400
450
500
FY11 FY12 FY13 FY14 FY15
London bus revenue (LHS) Operating margin (RHS)
(GPP m)
Key comparison
between Singapore and
London models
10
Singapore Land Transport Sector: 18 March 2016
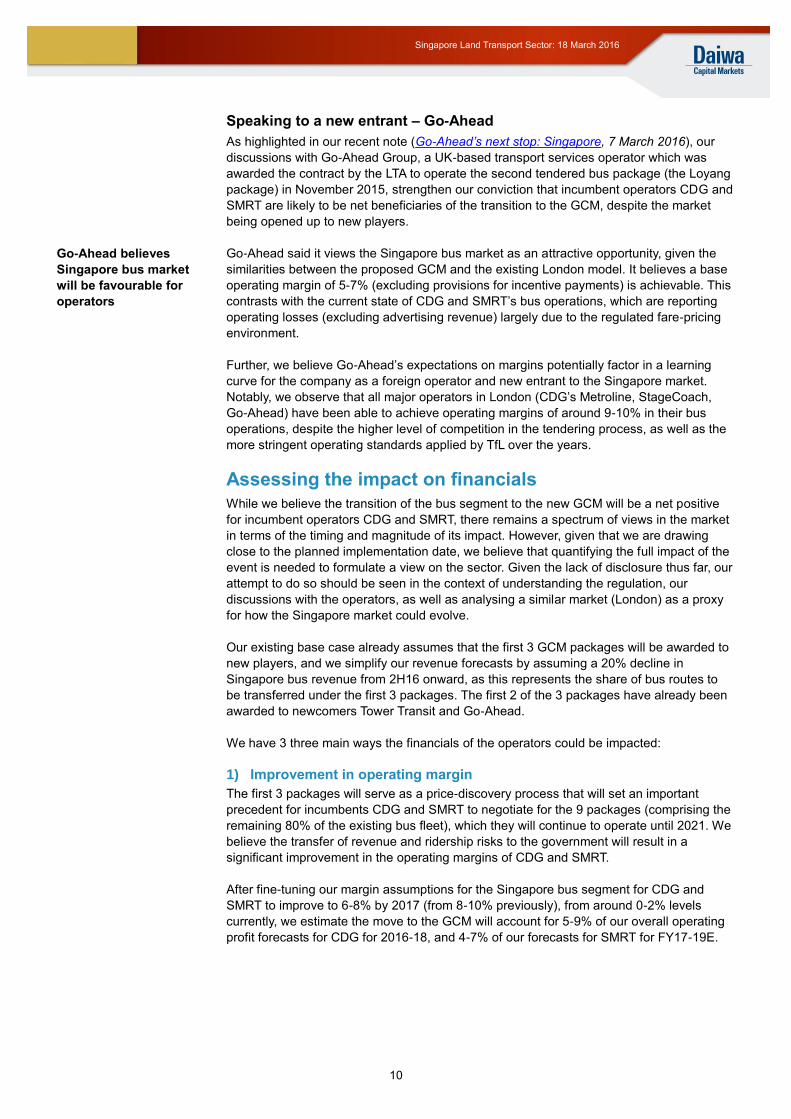
Speaking to a new entrant – Go-Ahead
As highlighted in our recent note (Go-Ahead’s next stop: Singapore, 7 March 2016), our
discussions with Go-Ahead Group, a UK-based transport services operator which was
awarded the contract by the LTA to operate the second tendered bus package (the Loyang
package) in November 2015, strengthen our conviction that incumbent operators CDG and
SMRT are likely to be net beneficiaries of the transition to the GCM, despite the market
being opened up to new players.
Go-Ahead said it views the Singapore bus market as an attractive opportunity, given the
similarities between the proposed GCM and the existing London model. It believes a base
operating margin of 5-7% (excluding provisions for incentive payments) is achievable. This
contrasts with the current state of CDG and SMRT’s bus operations, which are reporting
operating losses (excluding advertising revenue) largely due to the regulated fare-pricing
environment.
Further, we believe Go-Ahead’s expectations on margins potentially factor in a learning
curve for the company as a foreign operator and new entrant to the Singapore market.
Notably, we observe that all major operators in London (CDG’s Metroline, StageCoach,
Go-Ahead) have been able to achieve operating margins of around 9-10% in their bus
operations, despite the higher level of competition in the tendering process, as well as the
more stringent operating standards applied by TfL over the years.
Assessing the impact on financials
While we believe the transition of the bus segment to the new GCM will be a net positive
for incumbent operators CDG and SMRT, there remains a spectrum of views in the market
in terms of the timing and magnitude of its impact. However, given that we are drawing
close to the planned implementation date, we believe that quantifying the full impact of the
event is needed to formulate a view on the sector. Given the lack of disclosure thus far, our
attempt to do so should be seen in the context of understanding the regulation, our
discussions with the operators, as well as analysing a similar market (London) as a proxy
for how the Singapore market could evolve.
Our existing base case already assumes that the first 3 GCM packages will be awarded to
new players, and we simplify our revenue forecasts by assuming a 20% decline in
Singapore bus revenue from 2H16 onward, as this represents the share of bus routes to
be transferred under the first 3 packages. The first 2 of the 3 packages have already been
awarded to newcomers Tower Transit and Go-Ahead.
We have 3 three main ways the financials of the operators could be impacted:
1) Improvement in operating margin
The first 3 packages will serve as a price-discovery process that will set an important
precedent for incumbents CDG and SMRT to negotiate for the 9 packages (comprising the
remaining 80% of the existing bus fleet), which they will continue to operate until 2021. We
believe the transfer of revenue and ridership risks to the government will result in a
significant improvement in the operating margins of CDG and SMRT.
After fine-tuning our margin assumptions for the Singapore bus segment for CDG and
SMRT to improve to 6-8% by 2017 (from 8-10% previously), from around 0-2% levels
currently, we estimate the move to the GCM will account for 5-9% of our overall operating
profit forecasts for CDG for 2016-18, and 4-7% of our forecasts for SMRT for FY17-19E.
Go-Ahead believes
Singapore bus market
will be favourable for
operators
11
Singapore Land Transport Sector: 18 March 2016
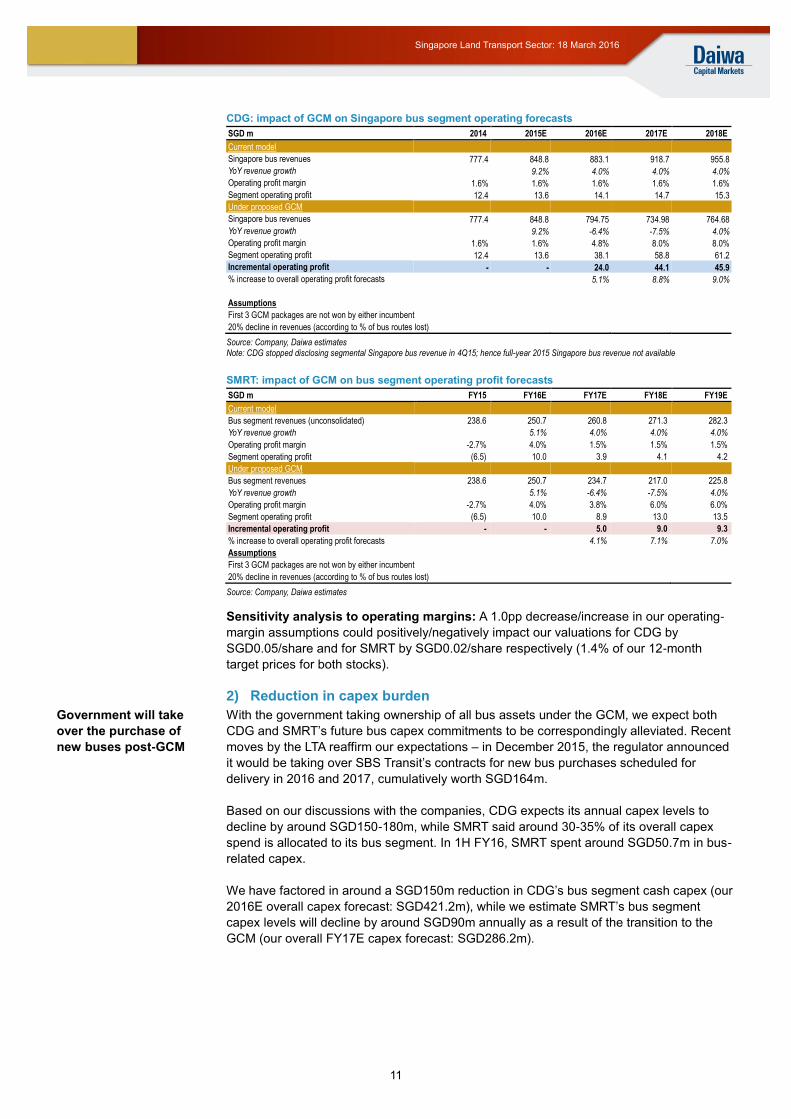
CDG: impact of GCM on Singapore bus segment operating forecasts
SGD m 2014 2015E 2016E 2017E 2018E
Current model
Singapore bus revenues 777.4 848.8 883.1 918.7 955.8
YoY revenue growth
9.2% 4.0% 4.0% 4.0%
Operating profit margin 1.6% 1.6% 1.6% 1.6% 1.6%
Segment operating profit 12.4 13.6 14.1 14.7 15.3
Under proposed GCM
Singapore bus revenues 777.4 848.8 794.75 734.98 764.68
YoY revenue growth
9.2% -6.4% -7.5% 4.0%
Operating profit margin 1.6% 1.6% 4.8% 8.0% 8.0%
Segment operating profit 12.4 13.6 38.1 58.8 61.2
Incremental operating profit - - 24.0 44.1 45.9
% increase to overall operating profit forecasts
5.1% 8.8% 9.0%
Assumptions
First 3 GCM packages are not won by either incumbent
20% decline in revenues (according to % of bus routes lost)
Source: Company, Daiwa estimates Note: CDG stopped disclosing segmental Singapore bus revenue in 4Q15; hence full-year 2015 Singapore bus revenue not available
SMRT: impact of GCM on bus segment operating profit forecasts
SGD m FY15 FY16E FY17E FY18E FY19E
Current model
Bus segment revenues (unconsolidated) 238.6 250.7 260.8 271.3 282.3
YoY revenue growth
5.1% 4.0% 4.0% 4.0%
Operating profit margin -2.7% 4.0% 1.5% 1.5% 1.5%
Segment operating profit (6.5) 10.0 3.9 4.1 4.2
Under proposed GCM
Bus segment revenues 238.6 250.7 234.7 217.0 225.8
YoY revenue growth
5.1% -6.4% -7.5% 4.0%
Operating profit margin -2.7% 4.0% 3.8% 6.0% 6.0%
Segment operating profit (6.5) 10.0 8.9 13.0 13.5
Incremental operating profit - - 5.0 9.0 9.3
% increase to overall operating profit forecasts
4.1% 7.1% 7.0%
Assumptions
First 3 GCM packages are not won by either incumbent
20% decline in revenues (according to % of bus routes lost)
Source: Company, Daiwa estimates
Sensitivity analysis to operating margins: A 1.0pp decrease/increase in our operating-
margin assumptions could positively/negatively impact our valuations for CDG by
SGD0.05/share and for SMRT by SGD0.02/share respectively (1.4% of our 12-month
target prices for both stocks).
2) Reduction in capex burden
With the government taking ownership of all bus assets under the GCM, we expect both
CDG and SMRT’s future bus capex commitments to be correspondingly alleviated. Recent
moves by the LTA reaffirm our expectations – in December 2015, the regulator announced
it would be taking over SBS Transit’s contracts for new bus purchases scheduled for
delivery in 2016 and 2017, cumulatively worth SGD164m.
Based on our discussions with the companies, CDG expects its annual capex levels to
decline by around SGD150-180m, while SMRT said around 30-35% of its overall capex
spend is allocated to its bus segment. In 1H FY16, SMRT spent around SGD50.7m in bus-
related capex.
We have factored in around a SGD150m reduction in CDG’s bus segment cash capex (our
2016E overall capex forecast: SGD421.2m), while we estimate SMRT’s bus segment
capex levels will decline by around SGD90m annually as a result of the transition to the
GCM (our overall FY17E capex forecast: SGD286.2m).
Government will take
over the purchase of
new buses post-GCM
12
Singapore Land Transport Sector: 18 March 2016
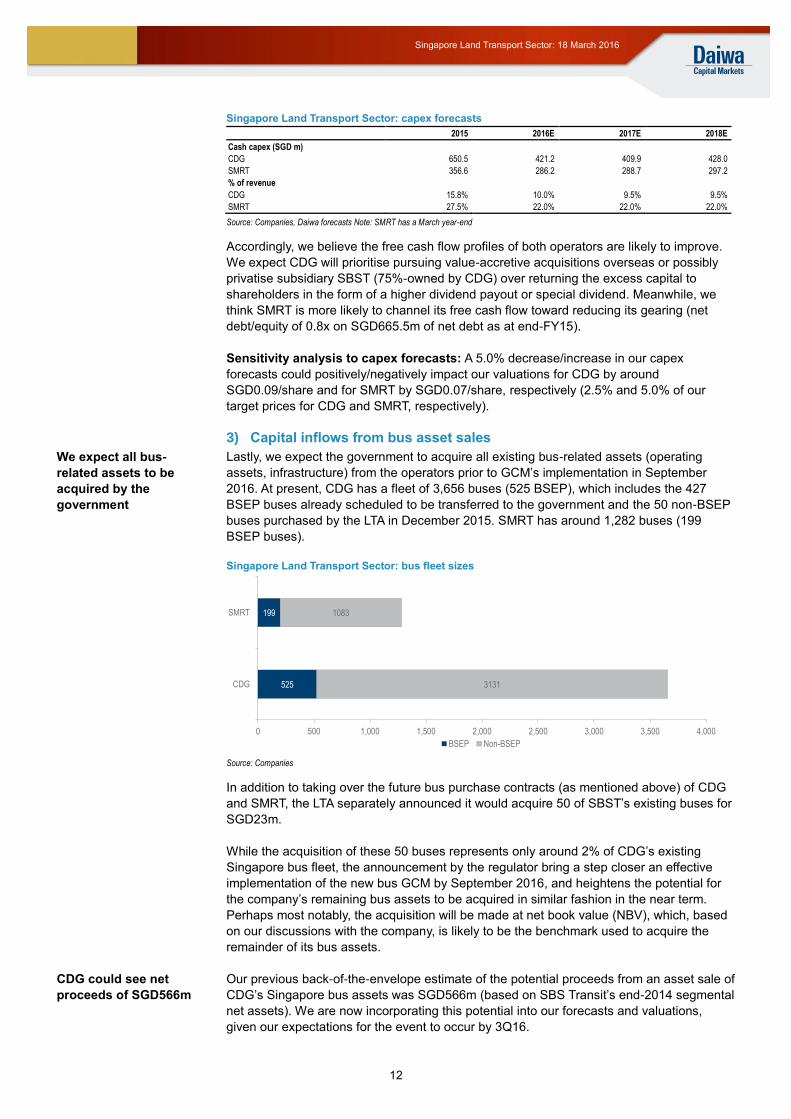
Singapore Land Transport Sector: capex forecasts
2015 2016E 2017E 2018E
Cash capex (SGD m)
CDG 650.5 421.2 409.9 428.0
SMRT 356.6 286.2 288.7 297.2
% of revenue
CDG 15.8% 10.0% 9.5% 9.5%
SMRT 27.5% 22.0% 22.0% 22.0%
Source: Companies, Daiwa forecasts Note: SMRT has a March year-end
Accordingly, we believe the free cash flow profiles of both operators are likely to improve.
We expect CDG will prioritise pursuing value-accretive acquisitions overseas or possibly
privatise subsidiary SBST (75%-owned by CDG) over returning the excess capital to
shareholders in the form of a higher dividend payout or special dividend. Meanwhile, we
think SMRT is more likely to channel its free cash flow toward reducing its gearing (net
debt/equity of 0.8x on SGD665.5m of net debt as at end-FY15).
Sensitivity analysis to capex forecasts: A 5.0% decrease/increase in our capex
forecasts could positively/negatively impact our valuations for CDG by around
SGD0.09/share and for SMRT by SGD0.07/share, respectively (2.5% and 5.0% of our
target prices for CDG and SMRT, respectively).
3) Capital inflows from bus asset sales
Lastly, we expect the government to acquire all existing bus-related assets (operating
assets, infrastructure) from the operators prior to GCM’s implementation in September
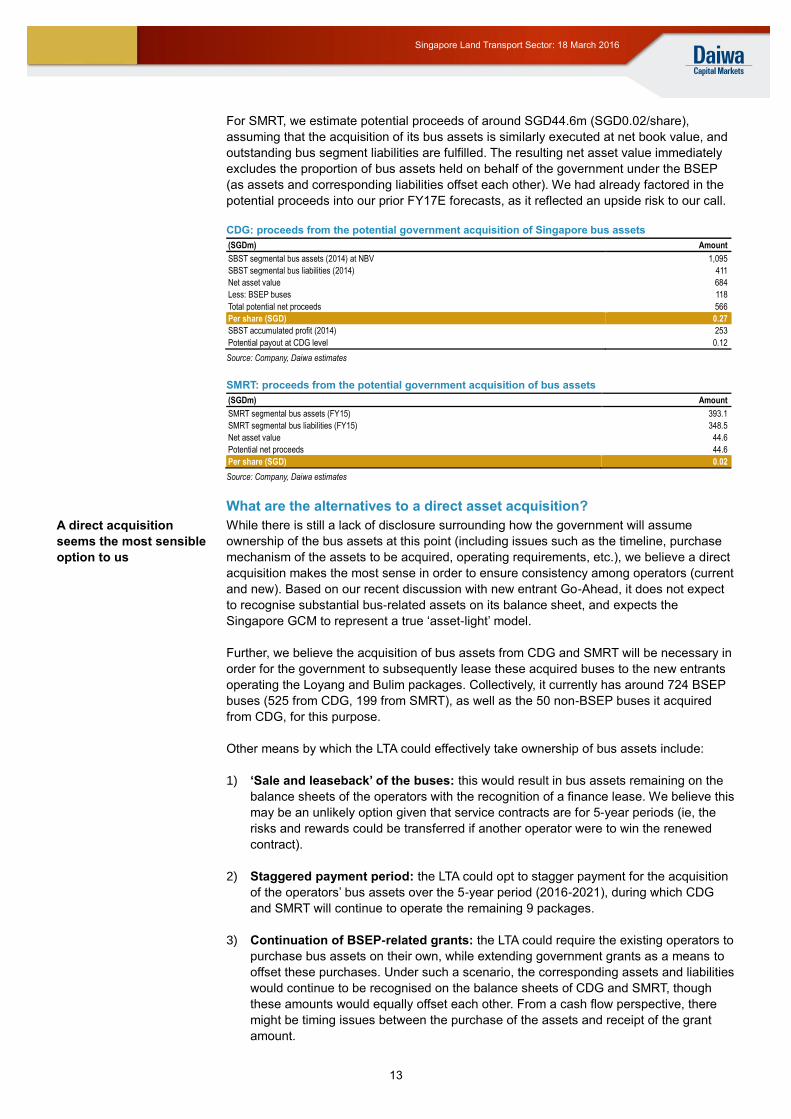
2016. At present, CDG has a fleet of 3,656 buses (525 BSEP), which includes the 427
BSEP buses already scheduled to be transferred to the government and the 50 non-BSEP
buses purchased by the LTA in December 2015. SMRT has around 1,282 buses (199
BSEP buses).
Singapore Land Transport Sector: bus fleet sizes
Source: Companies
In addition to taking over the future bus purchase contracts (as mentioned above) of CDG
and SMRT, the LTA separately announced it would acquire 50 of SBST’s existing buses for
SGD23m.
While the acquisition of these 50 buses represents only around 2% of CDG’s existing
Singapore bus fleet, the announcement by the regulator bring a step closer an effective
implementation of the new bus GCM by September 2016, and heightens the potential for
the company’s remaining bus assets to be acquired in similar fashion in the near term.
Perhaps most notably, the acquisition will be made at net book value (NBV), which, based
on our discussions with the company, is likely to be the benchmark used to acquire the
remainder of its bus assets.
Our previous back-of-the-envelope estimate of the potential proceeds from an asset sale of
CDG’s Singapore bus assets was SGD566m (based on SBS Transit’s end-2014 segmental
net assets). We are now incorporating this potential into our forecasts and valuations,
given our expectations for the event to occur by 3Q16.
525
199
3131
1083
0 500 1,000 1,500 2,000 2,500 3,000 3,500 4,000
CDG
SMRT
BSEP Non-BSEP
We expect all bus-
related assets to be
acquired by the
government
CDG could see net
proceeds of SGD566m
13
Singapore Land Transport Sector: 18 March 2016
For SMRT, we estimate potential proceeds of around SGD44.6m (SGD0.02/share),
assuming that the acquisition of its bus assets is similarly executed at net book value, and
outstanding bus segment liabilities are fulfilled. The resulting net asset value immediately
excludes the proportion of bus assets held on behalf of the government under the BSEP
(as assets and corresponding liabilities offset each other). We had already factored in the
potential proceeds into our prior FY17E forecasts, as it reflected an upside risk to our call.
CDG: proceeds from the potential government acquisition of Singapore bus assets
(SGDm) Amount
SBST segmental bus assets (2014) at NBV 1,095
SBST segmental bus liabilities (2014) 411
Net asset value 684
Less: BSEP buses 118
Total potential net proceeds 566
Per share (SGD) 0.27
SBST accumulated profit (2014) 253
Potential payout at CDG level 0.12
Source: Company, Daiwa estimates
SMRT: proceeds from the potential government acquisition of bus assets
(SGDm) Amount
SMRT segmental bus assets (FY15) 393.1
SMRT segmental bus liabilities (FY15) 348.5
Net asset value 44.6
Potential net proceeds 44.6
Per share (SGD) 0.02
Source: Company, Daiwa estimates
What are the alternatives to a direct asset acquisition?
While there is still a lack of disclosure surrounding how the government will assume
ownership of the bus assets at this point (including issues such as the timeline, purchase
mechanism of the assets to be acquired, operating requirements, etc.), we believe a direct
acquisition makes the most sense in order to ensure consistency among operators (current
and new). Based on our recent discussion with new entrant Go-Ahead, it does not expect
to recognise substantial bus-related assets on its balance sheet, and expects the
Singapore GCM to represent a true ‘asset-light’ model.
Further, we believe the acquisition of bus assets from CDG and SMRT will be necessary in
order for the government to subsequently lease these acquired buses to the new entrants
operating the Loyang and Bulim packages. Collectively, it currently has around 724 BSEP
buses (525 from CDG, 199 from SMRT), as well as the 50 non-BSEP buses it acquired
from CDG, for this purpose.
Other means by which the LTA could effectively take ownership of bus assets include:
1) ‘Sale and leaseback’ of the buses: this would result in bus assets remaining on the
balance sheets of the operators with the recognition of a finance lease. We believe this
may be an unlikely option given that service contracts are for 5-year periods (ie, the
risks and rewards could be transferred if another operator were to win the renewed
contract).
2) Staggered payment period: the LTA could opt to stagger payment for the acquisition
of the operators’ bus assets over the 5-year period (2016-2021), during which CDG
and SMRT will continue to operate the remaining 9 packages.
3) Continuation of BSEP-related grants: the LTA could require the existing operators to
purchase bus assets on their own, while extending government grants as a means to
offset these purchases. Under such a scenario, the corresponding assets and liabilities
would continue to be recognised on the balance sheets of CDG and SMRT, though
these amounts would equally offset each other. From a cash flow perspective, there
might be timing issues between the purchase of the assets and receipt of the grant
amount.
A direct acquisition
seems the most sensible
option to us
14
Singapore Land Transport Sector: 18 March 2016
Singapore Budget 2016 could provide more clues
Last year (Budget 2015), the government announced that in addition to the SGD14bn
investment in the public transport system over the past 5 years, a further SGD36bn would
be committed for the next 5 years. We expect that the government will provide more details
of its intended allocation for 2016 and shed light on a potential bus asset acquisition during
the Budget 2016 announcement (24 March), given the GCM’s scheduled implementation in
September 2016.
Key forecasts
CDG
We forecast CDG’s operating margin to improve by 1.4pp over 2015-18E, and its net profit
to see a 7.0% CAGR over the same period. We expect the improvement in its operating
margin to be driven by the Singapore bus segment, which should benefit from the
implementation of the GCM, as ridership and revenue risks are transferred to the
government.
We forecast CDG’s revenue to record a 3.1% CAGR over 2015-18E, driven mainly by the
18.4% revenue CAGR that we forecast for its rail segment, in which we expect to see
revenue contributions from the opening of its DTL Stages 2 and 3. This is offset by an
expected decline in its Singapore bus revenues, as we anticipate that all 3 tendered GCM
bus packages will go to new entrants.
Key changes to forecasts: We temper our assumptions for CDG’s Singapore bus
segment operating margin to reach 8% by 2017 (from 10% previously) and cut our net
profit forecasts by 2-3% over 2016-18E. Further, we incorporate the potential proceeds
from an asset sale of CDG’s Singapore bus assets of SGD566m into our forecasts and
valuation, given our expectations for the event to occur by 3Q16.
CDG better positioned to
leverage operational
shift from the new GCM
15
Singapore Land Transport Sector: 18 March 2016
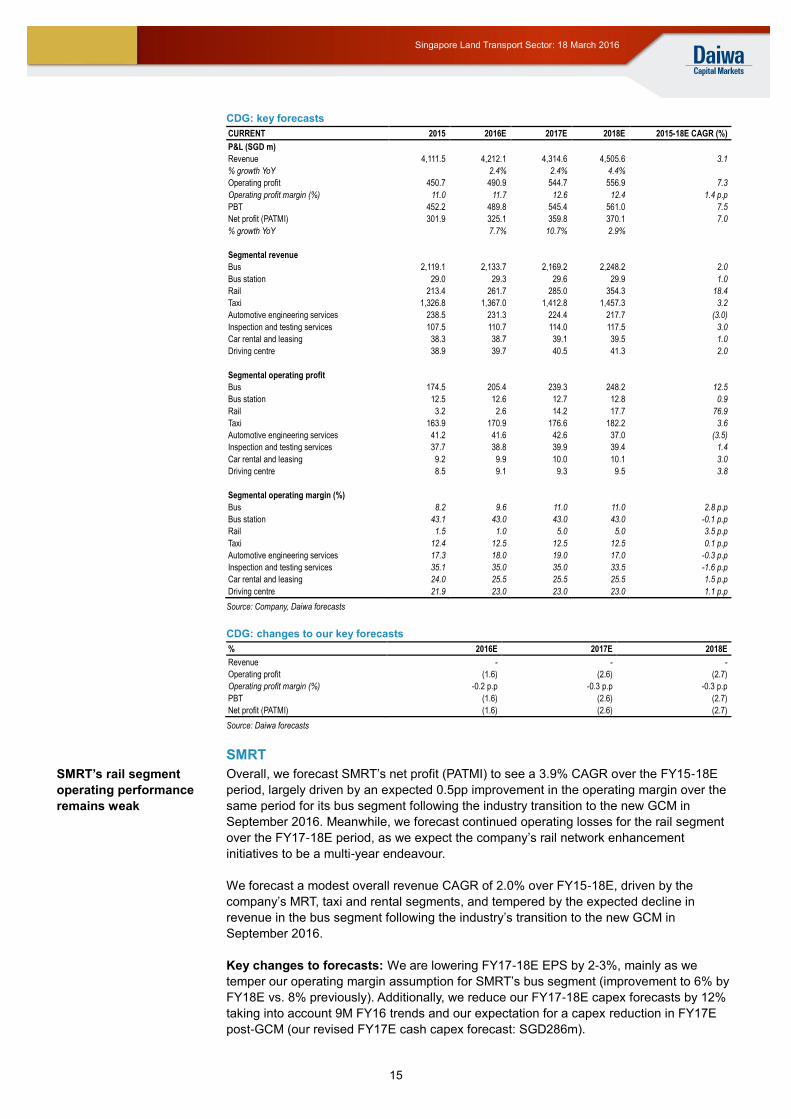
CDG: key forecasts
CURRENT 2015 2016E 2017E 2018E 2015-18E CAGR (%)
P&L (SGD m)
Revenue 4,111.5 4,212.1 4,314.6 4,505.6 3.1
% growth YoY
2.4% 2.4% 4.4%
Operating profit 450.7 490.9 544.7 556.9 7.3
Operating profit margin (%) 11.0 11.7 12.6 12.4 1.4 p.p
PBT 452.2 489.8 545.4 561.0 7.5
Net profit (PATMI) 301.9 325.1 359.8 370.1 7.0
% growth YoY
7.7% 10.7% 2.9%
Segmental revenue
Bus 2,119.1 2,133.7 2,169.2 2,248.2 2.0
Bus station 29.0 29.3 29.6 29.9 1.0
Rail 213.4 261.7 285.0 354.3 18.4
Taxi 1,326.8 1,367.0 1,412.8 1,457.3 3.2
Automotive engineering services 238.5 231.3 224.4 217.7 (3.0)
Inspection and testing services 107.5 110.7 114.0 117.5 3.0
Car rental and leasing 38.3 38.7 39.1 39.5 1.0
Driving centre 38.9 39.7 40.5 41.3 2.0
Segmental operating profit
Bus 174.5 205.4 239.3 248.2 12.5
Bus station 12.5 12.6 12.7 12.8 0.9
Rail 3.2 2.6 14.2 17.7 76.9
Taxi 163.9 170.9 176.6 182.2 3.6
Automotive engineering services 41.2 41.6 42.6 37.0 (3.5)
Inspection and testing services 37.7 38.8 39.9 39.4 1.4
Car rental and leasing 9.2 9.9 10.0 10.1 3.0
Driving centre 8.5 9.1 9.3 9.5 3.8
Segmental operating margin (%)
Bus 8.2 9.6 11.0 11.0 2.8 p.p
Bus station 43.1 43.0 43.0 43.0 -0.1 p.p
Rail 1.5 1.0 5.0 5.0 3.5 p.p
Taxi 12.4 12.5 12.5 12.5 0.1 p.p
Automotive engineering services 17.3 18.0 19.0 17.0 -0.3 p.p
Inspection and testing services 35.1 35.0 35.0 33.5 -1.6 p.p
Car rental and leasing 24.0 25.5 25.5 25.5 1.5 p.p
Driving centre 21.9 23.0 23.0 23.0 1.1 p.p
Source: Company, Daiwa forecasts
CDG: changes to our key forecasts
% 2016E 2017E 2018E
Revenue - - -
Operating profit (1.6) (2.6) (2.7)
Operating profit margin (%) -0.2 p.p -0.3 p.p -0.3 p.p
PBT (1.6) (2.6) (2.7)
Net profit (PATMI) (1.6) (2.6) (2.7)
Source: Daiwa forecasts
SMRT
Overall, we forecast SMRT’s net profit (PATMI) to see a 3.9% CAGR over the FY15-18E
period, largely driven by an expected 0.5pp improvement in the operating margin over the
same period for its bus segment following the industry transition to the new GCM in
September 2016. Meanwhile, we forecast continued operating losses for the rail segment
over the FY17-18E period, as we expect the company’s rail network enhancement
initiatives to be a multi-year endeavour.
We forecast a modest overall revenue CAGR of 2.0% over FY15-18E, driven by the
company’s MRT, taxi and rental segments, and tempered by the expected decline in
revenue in the bus segment following the industry’s transition to the new GCM in
September 2016.
Key changes to forecasts: We are lowering FY17-18E EPS by 2-3%, mainly as we
temper our operating margin assumption for SMRT’s bus segment (improvement to 6% by
FY18E vs. 8% previously). Additionally, we reduce our FY17-18E capex forecasts by 12%
taking into account 9M FY16 trends and our expectation for a capex reduction in FY17E
post-GCM (our revised FY17E cash capex forecast: SGD286m).
SMRT’s rail segment
operating performance
remains weak

16
Singapore Land Transport Sector: 18 March 2016
SMRT: key forecasts and assumptions
FY15 FY16E FY17E FY18E FY15-18E CAGR (%)
P&L (SGD m)
Revenue 1,235.5 1,296.7 1,301.0 1,312.4 2.0
% revenue growth YoY
5.0% 0.3% 0.9%
Operating profit 120.8 134.9 128.5 135.1 3.8
Operating profit margin (%) 9.8 10.4 9.9 10.3 0.5 p.p
Net profit (PATMI) 91.0 104.6 97.8 102.2 3.9
EPS (SGD cents) 6.0 6.9 6.4 6.7 3.8
% EPS growth YoY
14.5% -6.5% 4.5%
Segmental revenue
MRT 644.2 670.2 683.6 704.3 3.0
LRT 9.8 10.0 10.0 10.1 1.0
Bus 238.1 250.1 234.2 216.6 (3.1)
Taxi 142.9 150.1 153.1 157.0 3.2
Rental 120.4 134.1 136.3 138.3 4.7
Advertising 36.2 38.0 38.8 39.5 3.0
Engineering services 15.2 13.7 13.0 13.0 (5.1)
Other services 28.7 30.4 31.9 33.5 5.3
Segmental operating profit
MRT 13.4 0.7 (3.4) (3.5) (164.1)
LRT (3.8) (5.5) (5.0) (4.5) 6.2
Bus (6.5) 10.0 8.9 13.0 (225.9)
Taxi 13.7 19.5 15.3 15.7 4.6
Rental 79.6 84.5 84.5 85.8 2.5
Advertising 21.9 23.0 23.5 23.9 3.0
Engineering services (2.4) (0.7) (0.7) (0.7) (33.3)
Other services 2.4 2.5 2.7 2.8 5.3
Investment holding and support services 3.2 3.7 3.4 3.4 2.3
Segmental operating margin (%)
MRT 2.1 0.1 (0.5) (0.5) -2.6 p.p
LRT (38.7) (55.0) (50.0) (45.0) -6.3 p.p
Bus (2.7) 4.0 3.8 6.0 8.7 p.p
Taxi 9.6 13.0 10.0 10.0 0.4 p.p
Rental 66.1 63.0 62.0 62.0 -4.1 p.p
Advertising 60.0 60.0 60.0 60.0 0 p.p
Engineering services (14.4) (5.0) (5.0) (5.0) 9.4 p.p
Other services 8.1 8.1 8.1 8.1 0 p.p
Investment holding and support services 5.6 6.5 6.0 6.0 0.4 p.p
Source: Company, Daiwa forecasts
SMRT: changes to our key forecasts
FY16E FY17E FY18E
P&L (SGD m)
Revenue - - -
Operating profit - (1.7) (3.1)
Operating profit margin (%) 0 p.p -0.2 p.p -0.3 p.p
Net profit (PATMI) - (1.8) (3.4)
Source: Daiwa forecasts
Valuations and ratings
CDG
CDG is trading currently at a 2016E EV/EBITDA of 7.3x, which is more than 1SD above its
past-10-year historical mean of 6.2x. On a PER basis, the stock is trading at 19.7x, about
2SD above its past-10-year historical mean of 14.6x. The last time CDG traded at such
levels was in 2007.
In our view, CDG’s valuations are reasonable, as we believe its business is shifting gears.
Strong potential revenue growth in its rail businesses, a shift toward an asset-light bus-
contracting model in Singapore, and an enhanced balance sheet enabling potential value-
accretive acquisitions overseas all point towards longer-term earnings growth for the
company and a significant improvement in its cash flow, in our opinion.
CDG’s valuations appear
reasonable to us

17
Singapore Land Transport Sector: 18 March 2016
CDG: sensitivity of DCF analysis (2016-25E) CDG: sensitivity of DCF analysis (2016-25E)
WACC
Base
Terminal FCF 5.2% 5.7% 6.2% 6.7% 7.2% 7.7% 8.2% 8.7% 9.2%
0.0% 4.56 4.15 3.81 3.52 3.27 3.06 2.87 2.70 2.55
0.5% 4.90 4.42 4.03 3.70 3.42 3.18 2.97 2.79 2.63
Base 1.0% 5.32 4.75 4.29 3.91 3.59 3.32 3.09 2.89 2.71
1.5% 5.86 5.16 4.60 4.16 3.79 3.49 3.23 3.01 2.81
2.0% 6.56 5.67 4.99 4.46 4.03 3.68 3.39 3.14 2.92
Discount NPV of Enterprise Equity Per Share
Rate FCF Value Value (SGD)
4.7% 3,214.7 12,874.5 12,992.2 6.05
5.2% 3,152.6 11,307.0 11,424.7 5.32
5.7% 3,092.5 10,076.1 10,193.8 4.75
6.2% 3,034.2 9,084.7 9,202.4 4.29
6.7% 2,977.8 8,269.6 8,387.3 3.91
7.2% 2,923.0 7,588.1 7,705.8 3.59
7.7% 2,870.0 7,010.1 7,127.8 3.32
8.2% 2,818.5 6,514.1 6,631.8 3.09
8.7% 2,768.5 6,083.9 6,201.6 2.89
9.2% 2,720.1 5,707.5 5,825.2 2.71
9.7% 2,673.0 5,375.4 5,493.1 2.56
Source: Daiwa estimates Source: Daiwa estimates
CDG: 12-month-forward EV/EBITDA ratio (x) CDG: 12-month-forward PER (x)
Source: Bloomberg, Daiwa forecasts Source: Bloomberg, Daiwa forecasts
SMRT
SMRT is trading currently at a FY17E PER of 24.7x, which is above its past-10-year mean
of 20.6x. Our 12-month target price of SGD1.41 implies a 2017E PER of 21.9x. We believe
valuations are rich given the challenging outlook we see for the company’s key rail
segment.
While the market could possibly be pricing in expectations for a transition of the rail
segment to a new rail model including the acquisition of its operating assets, we believe
negotiations between the government and SMRT will only gain traction once the company
has fulfilled its obligations to return network reliability to satisfactory levels under its
existing licence requirements. In other words, we could be looking at a timeline stretching
beyond 2018.
SMRT: sensitivity of DCF analysis (FY16-25E) SMRT: sensitivity of DCF analysis (FY16-25E)
WACC
Base
Terminal FCF 5.2% 5.7% 6.2% 6.7% 7.2% 7.7% 8.2% 8.7% 9.2%
0.0% 2.02 1.76 1.55 1.37 1.22 1.08 0.97 0.87 0.78
0.5% 2.22 1.92 1.68 1.48 1.30 1.16 1.03 0.92 0.82
Base 1.0% 2.47 2.12 1.83 1.60 1.41 1.24 1.10 0.98 0.87
1.5% 2.79 2.36 2.02 1.75 1.53 1.34 1.18 1.05 0.93
2.0% 3.21 2.67 2.25 1.93 1.67 1.45 1.27 1.12 0.99
Discount NPV of Enterprise Equity Per Share
Rate FCF Value Value (SGD)
4.7% 988.3 5,118.6 4,453.7 2.93 5.2% 959.9 4,430.0 3,765.1 2.47 5.7% 932.6 3,890.4 3,225.6 2.12 6.2% 906.4 3,456.8 2,792.0 1.83 6.7% 881.0 3,101.3 2,436.4 1.60 7.2% 856.6 2,804.8 2,139.9 1.41 7.7% 833.1 2,554.0 1,889.2 1.24 8.2% 810.4 2,339.4 1,674.6 1.10 8.7% 788.5 2,153.9 1,489.1 0.98 9.2% 767.4 1,992.1 1,327.3 0.87 9.7% 747.0 1,849.9 1,185.0 0.78
Source: Daiwa estimates
Source: Daiwa estimates
4
5
6
7
8
9
10
Jan-
05
Jul-0
5
Jan-
06
Jul-0
6
Jan-
07
Jul-0
7
Jan-
08
Jul-0
8
Jan-
09
Jul-0
9
Jan-
10
Jul-1
0
Jan-
11
Jul-1
1
Jan-
12
Jul-1
2
Jan-
13
Jul-1
3
Jan-
14
Jul-1
4
Jan-
15
Jul-1
5
Jan-
16+2 stdev
+1 stdev
Mean
12M forward EV/EBITDA (x)
-1 stdev
-2 stdev10
12
14
16
18
20
22
24
Jan-
05
Jul-0
5
Jan-
06
Jul-0
6
Jan-
07
Jul-0
7
Jan-
08
Jul-0
8
Jan-
09
Jul-0
9
Jan-
10
Jul-1
0
Jan-
11
Jul-1
1
Jan-
12
Jul-1
2
Jan-
13
Jul-1
3
Jan-
14
Jul-1
4
Jan-
15
Jul-1
5
Jan-
16
+2 stdev
+1 stdev
Mean
12M forward PER (x)
-1 stdev
-2 stdev

18
Singapore Land Transport Sector: 18 March 2016
SMRT: 12-month-forward EV/EBITDA ratio (x) SMRT: 12-month-forward PER (x)
Source: Bloomberg, Daiwa forecasts Source: Bloomberg, Daiwa forecasts
Land transport service providers: peer comparison
Bloomberg Share price Market cap PER (x) EV/EBITDA (x) ROE (%) Dividend yield (%)
Company name code (local curr.) (USD m) 2015E 2016E 2017E 2015E 2016E 2017E 2015E 2016E 2017E 2015E 2016E 2017E
Regional peers
17-Mar-16
ComfortDelGro* CD SP 2.97 4,719 21.1 19.7 17.8 9.1 8.7 8.1 13% 14% 14% 3.0% 3.3% 3.7%
SMRT* MRT SP 1.59 1,783 23.1 24.7 23.6 9.2 9.0 8.6 12% 11% 10% 2.4% 2.2% 2.3%
MTR Corp 66 HK 37.95 28,670 24.1 21.6 23.7 14.7 13.4 14.1 6% 7% 6% 6.1% 6.2% 2.9%
Blue Bird BIRD IJ 6,175.00 1,179 18.1 15.4 13.1 8.6 7.5 6.5 23% 23% 23% 2.1% 2.3% 2.8%
Ekspress Transindo Utama TAXI IJ 211.00 35 6.9 4.9 5.0 4.3 4.0 4.3 7% 14% 9% 5.4% 4.4% 4.2%
BTS Group BTS TB 8.60 2,942 40.8 49.7 43.2 44.7 42.0 41.6 4% 5% 5% 7.8% 2.3% 2.2%
Average
22.3 22.7 21.1 15.1 14.1 13.9 11% 12% 11% 4.5% 3.4% 3.0%
Global peers
FirstGroup FGP LN 94.15 1,640 9.8 7.6 6.6 4.6 4.2 4.0 7% 9% 10% 0.6% 2.4% 3.6%
Go-Ahead Group GOG LN 2,641.00 1,642 14.4 12.9 11.6 4.4 3.9 3.7 74% 59% 47% 3.8% 4.2% 4.4%
Average 12.1 10.2 9.1 4.5 4.1 3.9 41% 34% 28% 2.2% 3.3% 4.0%
Source: Bloomberg, *Daiwa forecasts Note: SMRT has a March year-end
We prefer CDG to SMRT
While we expect both operators to be beneficiaries of the new operating landscape for the
transport services sector in Singapore, we recommend that investors switch from SMRT to
CDG, mainly as: 1) CDG is less exposed to Singapore’s regulated fare-pricing environment
(around 24% of revenue vs. 72% for SMRT), 2) CDG is more exposed to the bus
segment, for which we expect a rise in operating margin from a transition to a new asset-
light model, 3) CDG’s stronger balance-sheet position (net cash of SGD229.2m as at end-
2015 vs SMRT’s net debt of SGD665.5m as at end-FY15), 4) we see greater potential
earnings-growth catalysts from overseas acquisitions or expansion, and 5) we think CDG
has greater potential for a higher dividend payout or special dividend in the near term.
Key investment risks
We identify the following key risks to our Positive call on the sector:
Regulatory risks
The public transportation sector is closely regulated by the government. Unfavourable
shifts in the regulatory landscape could result in policies that have an adverse impact on
the businesses of the operators and pose downside risks to our earnings forecasts. This is
the primary risk to our call.
Manpower risks
Staff costs account for around 38% and 41% of CDG and SMRT’s operating expenses,
respectively, representing the biggest cost component to the land transport operators. The
tightening of government restrictions on foreign labour/foreign worker levies in Singapore
or an inability to retain trained and experienced drivers and engineers, could mean that the
operators have to raise wages in order to train or retain skilled staff for their operations,
posing downside risks to our earnings forecasts.
6
7
8
9
10
11
12
Jan-
05
Jul-0
5
Jan-
06
Jul-0
6
Jan-
07
Jul-0
7
Jan-
08
Jul-0
8
Jan-
09
Jul-0
9
Jan-
10
Jul-1
0
Jan-
11
Jul-1
1
Jan-
12
Jul-1
2
Jan-
13
Jul-1
3
Jan-
14
Jul-1
4
Jan-
15
Jul-1
5
Jan-
16
+2 stdev
+1 stdev
Mean
-1 stdev
-2 stdev
12M forward EV/EBITDA (x)
8
13
18
23
28
33
38
43
Jan-
05
Jul-0
5
Jan-
06
Jul-0
6
Jan-
07
Jul-0
7
Jan-
08
Jul-0
8
Jan-
09
Jul-0
9
Jan-
10
Jul-1
0
Jan-
11
Jul-1
1
Jan-
12
Jul-1
2
Jan-
13
Jul-1
3
Jan-
14
Jul-1
4
Jan-
15
Jul-1
5
Jan-
16
+2 stdev
+1 stdev
Mean
-1 stdev
-2 stdev
12M forward PER (x)

19
Singapore Land Transport Sector: 18 March 2016
Energy-related costs
Fuel costs (electricity and diesel) represent around 16% and 13% of CDG and SMRT’s
operating expenses, respectively. While operators tend to hedge both their fuel and
electricity requirements, typically on a one-year forward basis, not all their requirements
can be effectively covered. Hence, they remain exposed to price fluctuations in energy
costs and a sharp increase in fuel prices could have a negative impact on our earnings
forecasts.
See important disclosures, including any required research certifications, beginning on page 28
Singapore Industrials
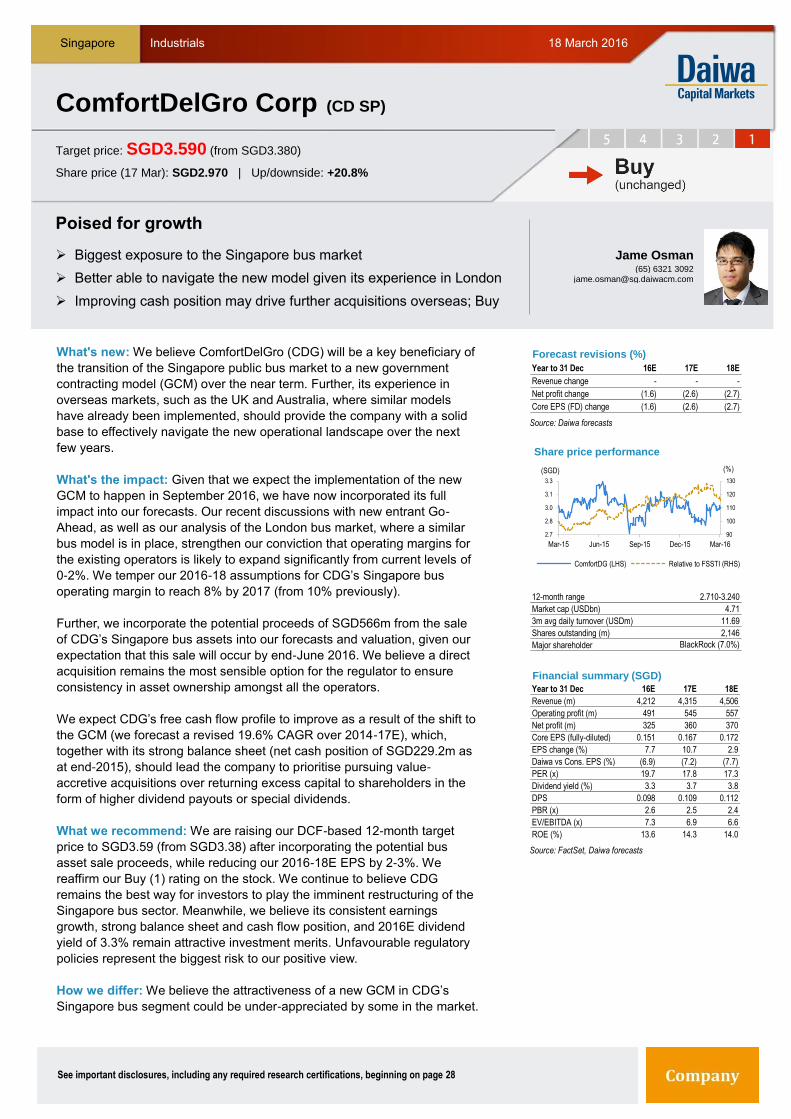
What's new: We believe ComfortDelGro (CDG) will be a key beneficiary of
the transition of the Singapore public bus market to a new government
contracting model (GCM) over the near term. Further, its experience in
overseas markets, such as the UK and Australia, where similar models
have already been implemented, should provide the company with a solid
base to effectively navigate the new operational landscape over the next
few years.
What's the impact: Given that we expect the implementation of the new
GCM to happen in September 2016, we have now incorporated its full
impact into our forecasts. Our recent discussions with new entrant Go-
Ahead, as well as our analysis of the London bus market, where a similar
bus model is in place, strengthen our conviction that operating margins for
the existing operators is likely to expand significantly from current levels of
0-2%. We temper our 2016-18 assumptions for CDG’s Singapore bus
operating margin to reach 8% by 2017 (from 10% previously).
Further, we incorporate the potential proceeds of SGD566m from the sale
of CDG’s Singapore bus assets into our forecasts and valuation, given our
expectation that this sale will occur by end-June 2016. We believe a direct
acquisition remains the most sensible option for the regulator to ensure
consistency in asset ownership amongst all the operators.
We expect CDG’s free cash flow profile to improve as a result of the shift to
the GCM (we forecast a revised 19.6% CAGR over 2014-17E), which,
together with its strong balance sheet (net cash position of SGD229.2m as
at end-2015), should lead the company to prioritise pursuing value-
accretive acquisitions over returning excess capital to shareholders in the
form of higher dividend payouts or special dividends.
What we recommend: We are raising our DCF-based 12-month target
price to SGD3.59 (from SGD3.38) after incorporating the potential bus
asset sale proceeds, while reducing our 2016-18E EPS by 2-3%. We
reaffirm our Buy (1) rating on the stock. We continue to believe CDG
remains the best way for investors to play the imminent restructuring of the
Singapore bus sector. Meanwhile, we believe its consistent earnings
growth, strong balance sheet and cash flow position, and 2016E dividend
yield of 3.3% remain attractive investment merits. Unfavourable regulatory
policies represent the biggest risk to our positive view.
How we differ: We believe the attractiveness of a new GCM in CDG’s
Singapore bus segment could be under-appreciated by some in the market.
18 March 2016
ComfortDel Gro C orp
Poised for growth
Biggest exposure to the Singapore bus market
Better able to navigate the new model given its experience in London
Improving cash position may drive further acquisitions overseas; Buy
Source: Daiwa forecasts
Source: FactSet, Daiwa forecasts
ComfortDelGro Corp (CD SP)
Target price: SGD3.590 (from SGD3.380)
Share price (17 Mar): SGD2.970 | Up/downside: +20.8%
Jame Osman(65) 6321 3092
Forecast revisions (%)
Year to 31 Dec 16E 17E 18E
Revenue change - - -
Net profit change (1.6) (2.6) (2.7)
Core EPS (FD) change (1.6) (2.6) (2.7)
90
100
110
120
130
2.7
2.8
3.0
3.1
3.3
Mar-15 Jun-15 Sep-15 Dec-15 Mar-16
Share price performance
ComfortDG (LHS) Relative to FSSTI (RHS)
(SGD) (%)
12-month range 2.710-3.240
Market cap (USDbn) 4.71
3m avg daily turnover (USDm) 11.69
Shares outstanding (m) 2,146
Major shareholder BlackRock (7.0%)
Financial summary (SGD)
Year to 31 Dec 16E 17E 18E
Revenue (m) 4,212 4,315 4,506
Operating profit (m) 491 545 557
Net profit (m) 325 360 370
Core EPS (fully-diluted) 0.151 0.167 0.172
EPS change (%) 7.7 10.7 2.9
Daiwa vs Cons. EPS (%) (6.9) (7.2) (7.7)
PER (x) 19.7 17.8 17.3
Dividend yield (%) 3.3 3.7 3.8
DPS 0.098 0.109 0.112
PBR (x) 2.6 2.5 2.4
EV/EBITDA (x) 7.3 6.9 6.6
ROE (%) 13.6 14.3 14.0
21
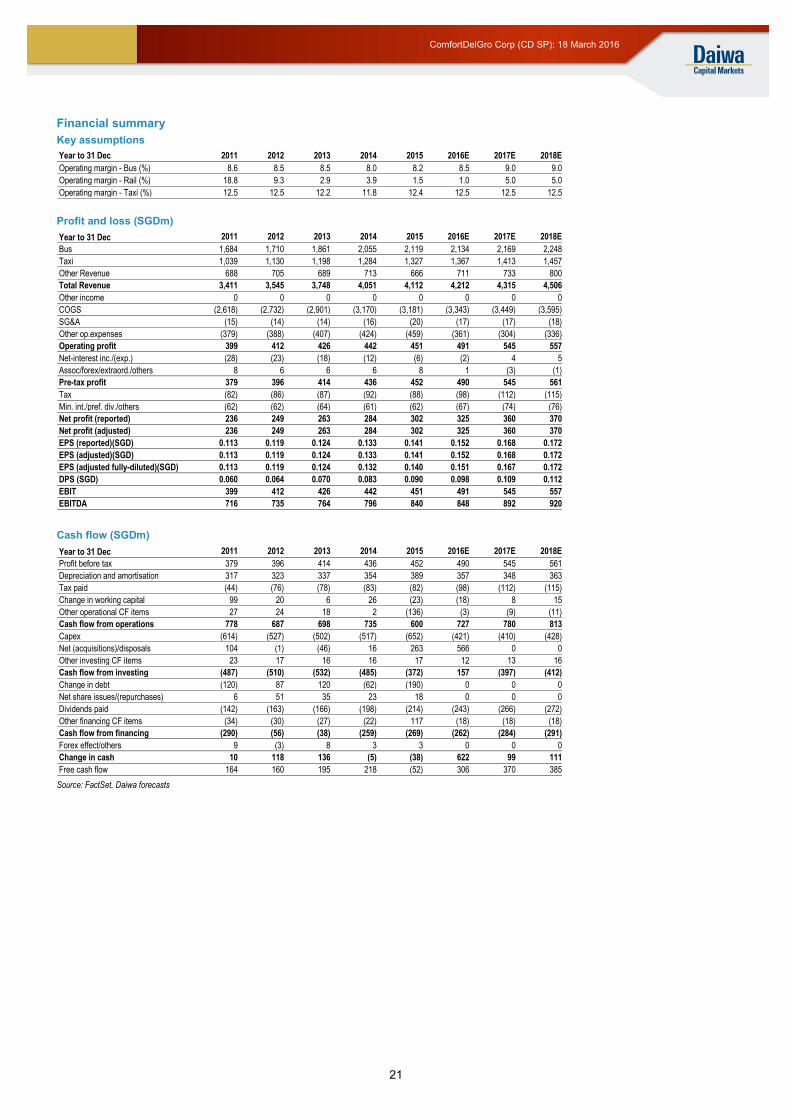
ComfortDelGro Corp (CD SP): 18 March 2016
Financial summary
Key assumptions
Profit and loss (SGDm)
Cash flow (SGDm)
Source: FactSet, Daiwa forecasts
Year to 31 Dec 2011 2012 2013 2014 2015 2016E 2017E 2018E
Operating margin - Bus (%) 8.6 8.5 8.5 8.0 8.2 8.5 9.0 9.0
Operating margin - Rail (%) 18.8 9.3 2.9 3.9 1.5 1.0 5.0 5.0
Operating margin - Taxi (%) 12.5 12.5 12.2 11.8 12.4 12.5 12.5 12.5
Year to 31 Dec 2011 2012 2013 2014 2015 2016E 2017E 2018E
Bus 1,684 1,710 1,861 2,055 2,119 2,134 2,169 2,248
Taxi 1,039 1,130 1,198 1,284 1,327 1,367 1,413 1,457
Other Revenue 688 705 689 713 666 711 733 800
Total Revenue 3,411 3,545 3,748 4,051 4,112 4,212 4,315 4,506
Other income 0 0 0 0 0 0 0 0
COGS (2,618) (2,732) (2,901) (3,170) (3,181) (3,343) (3,449) (3,595)
SG&A (15) (14) (14) (16) (20) (17) (17) (18)
Other op.expenses (379) (388) (407) (424) (459) (361) (304) (336)
Operating profit 399 412 426 442 451 491 545 557
Net-interest inc./(exp.) (28) (23) (18) (12) (6) (2) 4 5
Assoc/forex/extraord./others 8 6 6 6 8 1 (3) (1)
Pre-tax profit 379 396 414 436 452 490 545 561
Tax (82) (86) (87) (92) (88) (98) (112) (115)
Min. int./pref. div./others (62) (62) (64) (61) (62) (67) (74) (76)
Net profit (reported) 236 249 263 284 302 325 360 370
Net profit (adjusted) 236 249 263 284 302 325 360 370
EPS (reported)(SGD) 0.113 0.119 0.124 0.133 0.141 0.152 0.168 0.172
EPS (adjusted)(SGD) 0.113 0.119 0.124 0.133 0.141 0.152 0.168 0.172
EPS (adjusted fully-diluted)(SGD) 0.113 0.119 0.124 0.132 0.140 0.151 0.167 0.172
DPS (SGD) 0.060 0.064 0.070 0.083 0.090 0.098 0.109 0.112
EBIT 399 412 426 442 451 491 545 557
EBITDA 716 735 764 796 840 848 892 920
Year to 31 Dec 2011 2012 2013 2014 2015 2016E 2017E 2018E
Profit before tax 379 396 414 436 452 490 545 561
Depreciation and amortisation 317 323 337 354 389 357 348 363
Tax paid (44) (76) (78) (83) (82) (98) (112) (115)
Change in working capital 99 20 6 26 (23) (18) 8 15
Other operational CF items 27 24 18 2 (136) (3) (9) (11)
Cash flow from operations 778 687 698 735 600 727 780 813
Capex (614) (527) (502) (517) (652) (421) (410) (428)
Net (acquisitions)/disposals 104 (1) (46) 16 263 566 0 0
Other investing CF items 23 17 16 16 17 12 13 16
Cash flow from investing (487) (510) (532) (485) (372) 157 (397) (412)
Change in debt (120) 87 120 (62) (190) 0 0 0
Net share issues/(repurchases) 6 51 35 23 18 0 0 0
Dividends paid (142) (163) (166) (198) (214) (243) (266) (272)
Other financing CF items (34) (30) (27) (22) 117 (18) (18) (18)
Cash flow from financing (290) (56) (38) (259) (269) (262) (284) (291)
Forex effect/others 9 (3) 8 3 3 0 0 0
Change in cash 10 118 136 (5) (38) 622 99 111
Free cash flow 164 160 195 218 (52) 306 370 385

22
ComfortDelGro Corp (CD SP): 18 March 2016
Financial summary continued …
Balance sheet (SGDm)
Key ratios (%)
Source: FactSet, Daiwa forecasts
As at 31 Dec 2011 2012 2013 2014 2015 2016E 2017E 2018E
Cash & short-term investment 577 695 836 826 788 1,415 1,523 1,641
Inventory 57 58 71 72 75 75 77 80
Accounts receivable 133 129 111 117 139 122 125 130
Other current assets 213 213 222 224 278 246 211 220
Total current assets 979 1,094 1,240 1,239 1,280 1,857 1,936 2,072
Fixed assets 2,604 2,707 2,777 2,895 2,909 2,382 2,511 2,636
Goodwill & intangibles 553 569 687 686 673 664 658 652
Other non-current assets 453 476 381 411 355 355 355 355
Total assets 4,589 4,846 5,085 5,231 5,216 5,258 5,459 5,714
Short-term debt 198 96 218 243 126 126 126 126
Accounts payable 621 634 665 837 844 737 755 788
Other current liabilities 182 187 179 178 166 166 181 230
Total current liabilities 1,002 917 1,063 1,258 1,137 1,030 1,063 1,144
Long-term debt 434 608 590 494 432 432 432 432
Other non-current liabilities 680 684 638 640 635 635 635 635
Total liabilities 2,115 2,209 2,290 2,392 2,204 2,097 2,129 2,211
Share capital 569 585 623 646 666 666 666 666
Reserves/R.E./others 1,323 1,423 1,532 1,544 1,670 1,783 1,909 2,039
Shareholders' equity 1,892 2,008 2,155 2,190 2,335 2,449 2,575 2,704
Minority interests 582 629 640 649 678 712 754 798
Total equity & liabilities 4,589 4,846 5,085 5,231 5,216 5,258 5,459 5,714
EV 7,005 7,005 6,979 6,925 6,811 6,219 6,153 6,079
Net debt/(cash) 55 9 (28) (89) (229) (856) (964) (1,082)
BVPS (SGD) 0.905 0.955 1.014 1.024 1.086 1.141 1.200 1.260
Year to 31 Dec 2011 2012 2013 2014 2015 2016E 2017E 2018E
Sales (YoY) 6.4 3.9 5.7 8.1 1.5 2.4 2.4 4.4
EBITDA (YoY) 5.4 2.7 3.9 4.2 5.6 1.0 5.2 3.1
Operating profit (YoY) 2.8 3.3 3.4 3.7 1.9 8.9 11.0 2.2
Net profit (YoY) 3.1 5.6 5.7 7.7 6.5 7.7 10.7 2.9
Core EPS (fully-diluted) (YoY) 3.0 5.3 4.4 6.9 5.9 7.7 10.7 2.9
Gross-profit margin 23.2 22.9 22.6 21.8 22.6 20.6 20.1 20.2
EBITDA margin 21.0 20.7 20.4 19.6 20.4 20.1 20.7 20.4
Operating-profit margin 11.7 11.6 11.4 10.9 11.0 11.7 12.6 12.4
Net profit margin 6.9 7.0 7.0 7.0 7.3 7.7 8.3 8.2
ROAE 12.8 12.8 12.6 13.1 13.3 13.6 14.3 14.0
ROAA 5.3 5.3 5.3 5.5 5.8 6.2 6.7 6.6
ROCE 13.0 12.8 12.3 12.3 12.6 13.5 14.3 14.0
ROIC 12.5 12.5 12.4 12.6 13.1 15.4 18.5 18.5
Net debt to equity 2.9 0.4 n.a. n.a. n.a. n.a. n.a. n.a.
Effective tax rate 21.5 21.6 21.0 21.2 19.5 20.0 20.5 20.5
Accounts receivable (days) 12.7 13.5 11.7 10.3 11.4 11.3 10.4 10.3
Current ratio (x) 1.0 1.2 1.2 1.0 1.1 1.8 1.8 1.8
Net interest cover (x) 14.5 18.2 23.9 37.8 72.0 260.2 n.a. n.a.
Net dividend payout 53.2 53.8 56.3 62.1 64.0 65.0 65.0 65.0
Free cash flow yield 2.6 2.5 3.1 3.4 n.a. 4.8 5.8 6.0
Company profile
ComfortDelGro is a multi-modal land transport services provider, operating a fleet of over 46,000
vehicles across several countries, including Singapore, UK, Australia and China. The company was
formed following the merger of Comfort Group and DelGro Corporation in 2003.

See important disclosures, including any required research certifications, beginning on page 28
Singapore Industrials
What's new: In our view, SMRT’s recent share-price strength (up 18%
since its low in January 2016) more than adequately reflects the positives
from: 1) its better-than-expected 3Q FY16 results, 2) the transition to the
new bus government contracting model (GCM), and 3) the potential sale of
its rail operating assets. Meanwhile, we remain cautious, mainly as we see
several near-term risk factors weighing on its business.
What's the impact: While we expect SMRT to benefit from the transition of
its bus operations to the new GCM, its exposure to the segment is smaller
than ComfortDelGro’s (CDG) (19% of Singapore-derived revenue vs. 32%
for CDG). Our previous forecasts already factor in the positives we see
from the new bus model. We are lowering our FY17-18E EPS by 2-3%,
mainly after tempering our operating margin assumptions for SMRT’s bus
segment (to an improvement to 6% by FY18E from 8% previously).
Additionally, we reduce our FY17-18E capex by 12% taking into account
9M FY16 trends and our expectation for a capex reduction in FY17E post-
GCM (our revised FY17E cash capex forecast: SGD286m).
Further, although we believe rail reforms would almost certainly be positive
for SMRT’s operations, the timing, magnitude and terms of such a deal
remain unclear to us. In the near term, we expect the focus to remain on
ensuring SMRT fulfils its obligations to return rail network reliability to
satisfactory levels under its existing licence requirements. We remain
cautious on its operating prospects, due chiefly to: 1) its elevated rail
maintenance costs, which management still expects to increase to close to
50% of rail-segment revenue by 4Q FY16 (3Q FY16: 43%), 2) the opening
of Downtown Line 2 (DTL2) (operated by SBS Transit) in December 2015,
which we had previously highlighted could result in a shift of ridership
market share away from SMRT’s North-South East-West lines, and 3) the
impact of a 1.9% cut in fares in December 2015.
What we recommend: We raise our DCF-based 12-month TP to SGD1.41
(from SGD1.34) due mainly to our revised capex forecasts. We reaffirm our
Underperform (4) rating on the stock, as we think near-term visibility on
SMRT’s rail segment operating performance remains poor, while we expect
its FY16E free cash flow to remain in negative territory amid elevated
gearing levels (3Q FY16: net debt position of SGD683m vs. FY12: net cash
of SGD45m). The main upside risk: a near-term announcement on positive
rail reforms.
How we differ: Our FY17-18 EPS forecasts are 1-14% below consensus,
possibly as we believe the market could be expecting a sharper turnaround
in SMRT’s rail segment.
18 March 2016
SMRT C orp
Positives look priced in, but risks remain
Smaller exposure to the Singapore bus segment than ComfortDelGro
Outlook for key rail segment remains uncertain
Reaffirm Underperform (4) rating; raising target price to SGD1.41
Source: Daiwa forecasts
Source: FactSet, Daiwa forecasts
SMRT Corp (MRT SP)
Target price: SGD1.410 (from SGD1.340)
Share price (17 Mar): SGD1.585 | Up/downside: -11.0%
Jame Osman(65) 6321 3092
Forecast revisions (%)
Year to 31 Mar 16E 17E 18E
Revenue change - - -
Net profit change - (1.8) (3.4)
Core EPS (FD) change - (1.8) (3.4)
80
94
108
121
135
1.1
1.3
1.4
1.6
1.7
Mar-15 Jun-15 Sep-15 Dec-15 Mar-16
Share price performance
SMRT (LHS) Relative to FSSTI (RHS)
(SGD) (%)
12-month range 1.140-1.685
Market cap (USDbn) 1.78
3m avg daily turnover (USDm) 3.22
Shares outstanding (m) 1,522
Major shareholder Temasek Holdings (54.2%)
Financial summary (SGD)
Year to 31 Mar 16E 17E 18E
Revenue (m) 1,297 1,301 1,312
Operating profit (m) 135 128 135
Net profit (m) 105 98 102
Core EPS (fully-diluted) 0.069 0.064 0.067
EPS change (%) 14.9 (6.5) 4.5
Daiwa vs Cons. EPS (%) 5.5 (1.3) (14.1)
PER (x) 23.1 24.7 23.7
Dividend yield (%) 2.4 2.2 2.3
DPS 0.038 0.035 0.037
PBR (x) 2.7 2.5 2.4
EV/EBITDA (x) 9.2 9.0 8.6
ROE (%) 11.8 10.5 10.5
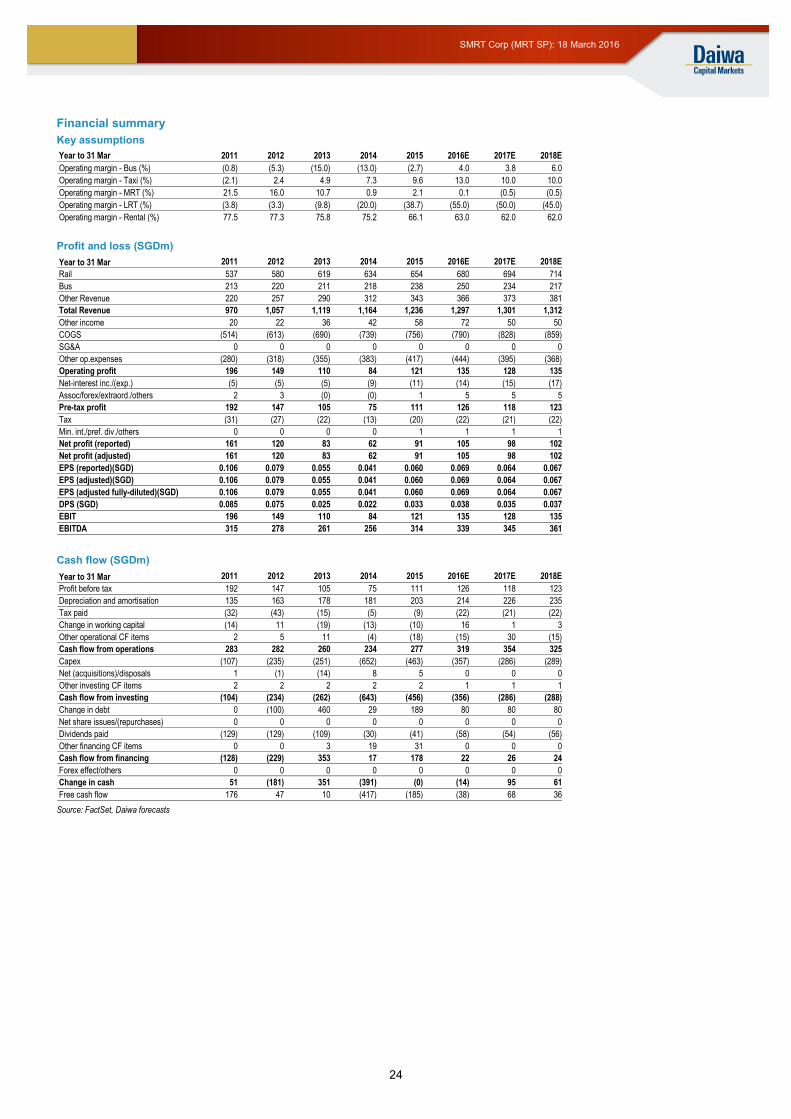
24
SMRT Corp (MRT SP): 18 March 2016
Financial summary
Key assumptions
Profit and loss (SGDm)
Cash flow (SGDm)
Source: FactSet, Daiwa forecasts
Year to 31 Mar 2011 2012 2013 2014 2015 2016E 2017E 2018E
Operating margin - Bus (%) (0.8) (5.3) (15.0) (13.0) (2.7) 4.0 3.8 6.0
Operating margin - Taxi (%) (2.1) 2.4 4.9 7.3 9.6 13.0 10.0 10.0
Operating margin - MRT (%) 21.5 16.0 10.7 0.9 2.1 0.1 (0.5) (0.5)
Operating margin - LRT (%) (3.8) (3.3) (9.8) (20.0) (38.7) (55.0) (50.0) (45.0)
Operating margin - Rental (%) 77.5 77.3 75.8 75.2 66.1 63.0 62.0 62.0
Year to 31 Mar 2011 2012 2013 2014 2015 2016E 2017E 2018E
Rail 537 580 619 634 654 680 694 714
Bus 213 220 211 218 238 250 234 217
Other Revenue 220 257 290 312 343 366 373 381
Total Revenue 970 1,057 1,119 1,164 1,236 1,297 1,301 1,312
Other income 20 22 36 42 58 72 50 50
COGS (514) (613) (690) (739) (756) (790) (828) (859)
SG&A 0 0 0 0 0 0 0 0
Other op.expenses (280) (318) (355) (383) (417) (444) (395) (368)
Operating profit 196 149 110 84 121 135 128 135
Net-interest inc./(exp.) (5) (5) (5) (9) (11) (14) (15) (17)
Assoc/forex/extraord./others 2 3 (0) (0) 1 5 5 5
Pre-tax profit 192 147 105 75 111 126 118 123
Tax (31) (27) (22) (13) (20) (22) (21) (22)
Min. int./pref. div./others 0 0 0 0 1 1 1 1
Net profit (reported) 161 120 83 62 91 105 98 102
Net profit (adjusted) 161 120 83 62 91 105 98 102
EPS (reported)(SGD) 0.106 0.079 0.055 0.041 0.060 0.069 0.064 0.067
EPS (adjusted)(SGD) 0.106 0.079 0.055 0.041 0.060 0.069 0.064 0.067
EPS (adjusted fully-diluted)(SGD) 0.106 0.079 0.055 0.041 0.060 0.069 0.064 0.067
DPS (SGD) 0.085 0.075 0.025 0.022 0.033 0.038 0.035 0.037
EBIT 196 149 110 84 121 135 128 135
EBITDA 315 278 261 256 314 339 345 361
Year to 31 Mar 2011 2012 2013 2014 2015 2016E 2017E 2018E
Profit before tax 192 147 105 75 111 126 118 123
Depreciation and amortisation 135 163 178 181 203 214 226 235
Tax paid (32) (43) (15) (5) (9) (22) (21) (22)
Change in working capital (14) 11 (19) (13) (10) 16 1 3
Other operational CF items 2 5 11 (4) (18) (15) 30 (15)
Cash flow from operations 283 282 260 234 277 319 354 325
Capex (107) (235) (251) (652) (463) (357) (286) (289)
Net (acquisitions)/disposals 1 (1) (14) 8 5 0 0 0
Other investing CF items 2 2 2 2 2 1 1 1
Cash flow from investing (104) (234) (262) (643) (456) (356) (286) (288)
Change in debt 0 (100) 460 29 189 80 80 80
Net share issues/(repurchases) 0 0 0 0 0 0 0 0
Dividends paid (129) (129) (109) (30) (41) (58) (54) (56)
Other financing CF items 0 0 3 19 31 0 0 0
Cash flow from financing (128) (229) 353 17 178 22 26 24
Forex effect/others 0 0 0 0 0 0 0 0
Change in cash 51 (181) 351 (391) (0) (14) 95 61
Free cash flow 176 47 10 (417) (185) (38) 68 36

25
SMRT Corp (MRT SP): 18 March 2016
Financial summary continued …
Balance sheet (SGDm)
Key ratios (%)
Source: FactSet, Daiwa forecasts
As at 31 Mar 2011 2012 2013 2014 2015 2016E 2017E 2018E
Cash & short-term investment 380 195 546 161 156 142 236 297
Inventory 54 54 60 84 81 85 85 86
Accounts receivable 65 64 86 99 168 176 177 178
Other current assets 1 0 0 0 0 15 31 48
Total current assets 499 313 692 344 405 417 529 609
Fixed assets 998 1,346 1,436 1,642 2,042 2,175 2,178 2,219
Goodwill & intangibles 35 14 14 14 14 14 14 14
Other non-current assets 74 83 83 73 76 76 76 76
Total assets 1,607 1,756 2,224 2,073 2,537 2,682 2,797 2,918
Short-term debt 100 0 2 156 9 9 9 9
Accounts payable 269 546 577 355 568 596 598 604
Other current liabilities 72 58 54 54 63 63 63 63
Total current liabilities 441 604 633 566 640 668 670 675
Long-term debt 150 150 607 480 813 893 973 1,053
Other non-current liabilities 217 210 216 225 226 216 206 196
Total liabilities 808 965 1,456 1,271 1,678 1,777 1,849 1,924
Share capital 165 166 167 168 169 169 169 169
Reserves/R.E./others 634 625 601 634 690 737 781 827
Shareholders' equity 799 791 768 802 860 907 951 997
Minority interests 0 0 0 (0) (1) (1) (2) (2)
Total equity & liabilities 1,607 1,756 2,224 2,073 2,537 2,682 2,797 2,918
EV 2,219 2,299 2,425 2,836 3,021 3,115 3,100 3,119
Net debt/(cash) (130) (45) 63 476 665 760 745 765
BVPS (SGD) 0.526 0.521 0.505 0.527 0.565 0.596 0.625 0.655
Year to 31 Mar 2011 2012 2013 2014 2015 2016E 2017E 2018E
Sales (YoY) 8.3 9.0 5.9 4.0 6.2 5.0 0.3 0.9
EBITDA (YoY) 0.2 (11.6) (6.3) (2.0) 22.9 8.1 1.6 4.7
Operating profit (YoY) (0.8) (24.0) (25.9) (23.6) 43.4 11.7 (4.8) 5.2
Net profit (YoY) (1.1) (25.6) (30.5) (25.7) 47.0 14.9 (6.5) 4.5
Core EPS (fully-diluted) (YoY) (1.2) (25.6) (30.5) (25.7) 46.9 14.9 (6.5) 4.5
Gross-profit margin 47.0 42.0 38.3 36.5 38.8 39.1 36.4 34.5
EBITDA margin 32.5 26.3 23.3 22.0 25.4 26.2 26.5 27.5
Operating-profit margin 20.2 14.1 9.8 7.2 9.8 10.4 9.9 10.3
Net profit margin 16.6 11.3 7.4 5.3 7.4 8.1 7.5 7.8
ROAE 20.5 15.1 10.7 7.9 11.0 11.8 10.5 10.5
ROAA 10.1 7.1 4.2 2.9 3.9 4.0 3.6 3.6
ROCE 18.9 14.9 9.5 6.0 7.7 7.7 6.9 6.8
ROIC 24.1 17.1 11.1 6.6 7.0 7.0 6.3 6.5
Net debt to equity n.a. n.a. 8.2 59.4 77.4 83.8 78.4 76.7
Effective tax rate 16.0 18.4 20.8 17.6 18.4 17.5 17.5 17.5
Accounts receivable (days) 22.4 22.2 24.5 29.0 39.4 48.4 49.5 49.3
Current ratio (x) 1.1 0.5 1.1 0.6 0.6 0.6 0.8 0.9
Net interest cover (x) 35.8 30.7 22.3 9.0 10.8 9.9 8.4 8.1
Net dividend payout 80.1 94.4 45.6 54.1 54.4 55.0 55.0 55.0
Free cash flow yield 7.3 2.0 0.4 n.a. n.a. n.a. 2.8 1.5
Company profile
SMRT is a multi-modal transport services provider in Singapore across rail, bus and taxi segments,
and is the operator of Singapore’s first mass rapid transit (MRT) network launched in 1987. The
company also derives rental and advertising income from leased space around its train stations.
The company was listed on the Singapore Exchange in July 2000.
26
Singapore Land Transport Sector: 18 March 2016
Daiwa’s Asia Pacific Research Directory
HONG KONG
Takashi FUJIKURA (852) 2848 4051 [email protected]
Regional Research Head
Kosuke MIZUNO (852) 2848 4949 / (852) 2773 8273
Regional Research Co-head
John HETHERINGTON (852) 2773 8787 [email protected]
Regional Deputy Head of Asia Pacific Research
Rohan DALZIELL (852) 2848 4938 [email protected]
Regional Head of Product Management
Kevin LAI (852) 2848 4926 [email protected]
Chief Economist for Asia ex-Japan; Macro Economics (Regional)
Junjie TANG (852) 2773 8736 [email protected]
Macro Economics (China)
Jonas KAN (852) 2848 4439 [email protected]
Head of Hong Kong and China Property
Cynthia CHAN (852) 2773 8243 [email protected]
Property (China)
Leon QI (852) 2532 4381 [email protected]
Banking (Hong Kong/China); Broker (China); Insurance (China)
Anson CHAN (852) 2532 4350 [email protected]
Consumer (Hong Kong/China)
Jamie SOO (852) 2773 8529 [email protected]
Gaming and Leisure (Hong Kong/China)
Dennis IP (852) 2848 4068 [email protected]
Power; Utilities; Renewables and Environment (Hong Kong/China)
John CHOI (852) 2773 8730 [email protected]
Head of Hong Kong and China Internet; Regional Head of Small/Mid Cap
Kelvin LAU (852) 2848 4467 [email protected]
Head of Automobiles; Transportation and Industrial (Hong Kong/China)
Brian LAM (852) 2532 4341 [email protected]
Transportation – Railway; Construction and Engineering (China)
Jibo MA (852) 2848 4489 [email protected]
Head of Custom Products Group
Thomas HO (852) 2773 8716 [email protected]
Custom Products Group
PHILIPPINES
Bianca SOLEMA (63) 2 737 3023 [email protected]
Utilities and Energy
SOUTH KOREA
Sung Yop CHUNG (82) 2 787 9157 [email protected]
Pan-Asia Co-head/Regional Head of Automobiles and Components; Automobiles; Shipbuilding; Steel
Mike OH (82) 2 787 9179 [email protected]
Banking; Capital Goods (Construction and Machinery)
Iris PARK (82) 2 787 9165 [email protected]
Consumer/Retail
SK KIM (82) 2 787 9173 [email protected]
IT/Electronics – Semiconductor/Display and Tech Hardware
Thomas Y KWON (82) 2 787 9181 [email protected]
Pan-Asia Head of Internet & Telecommunications; Software – Internet/On-line Game
Kevin JIN (82) 2 787 9168 [email protected]
Small/Mid Cap
TAIWAN
Rick HSU (886) 2 8758 6261 [email protected]
Head of Regional Technology; Head of Taiwan Research; Semiconductor/IC Design (Regional)
Christie CHIEN (886) 2 8758 6257 [email protected]
Banking; Insurance (Taiwan); Macro Economics (Regional)
Steven TSENG (886) 2 8758 6252 [email protected]
IT/Technology Hardware (PC Hardware)
Christine WANG (886) 2 8758 6249 [email protected]
IT/Technology Hardware (Automation); Pharmaceuticals and Healthcare; Consumer
Kylie HUANG (886) 2 8758 6248 [email protected]
IT/Technology Hardware (Handsets and Components)
Helen CHIEN (886) 2 8758 6254 [email protected]
Small/Mid Cap
INDIA
Punit SRIVASTAVA (91) 22 6622 1013 [email protected]
Head of India Research; Strategy; Banking/Finance
Saurabh MEHTA (91) 22 6622 1009 [email protected]
Capital Goods; Utilities
SINGAPORE
Ramakrishna MARUVADA (65) 6499 6543 [email protected]
Head of Singapore Research; Telecommunications (China/ASEAN/India)
Royston TAN (65) 6321 3086 [email protected]
Oil and Gas; Capital Goods
David LUM (65) 6329 2102 [email protected]
Banking; Property and REITs
Shane GOH (65) 64996546 [email protected]
Small/Mid Cap (Singapore)
Jame OSMAN (65) 6321 3092 [email protected]
Telecommunications (ASEAN/India); Pharmaceuticals and Healthcare; Consumer (Singapore)
27
Singapore Land Transport Sector: 18 March 2016
Daiwa’s Offices
Office / Branch / Affiliate Address Tel Fax
DAIWA SECURITIES GROUP INC
HEAD OFFICE Gran Tokyo North Tower, 1-9-1, Marunouchi, Chiyoda-ku, Tokyo, 100-6753 (81) 3 5555 3111 (81) 3 5555 0661
Daiwa Securities Trust Company One Evertrust Plaza, Jersey City, NJ 07302, U.S.A. (1) 201 333 7300 (1) 201 333 7726
Daiwa Securities Trust and Banking (Europe) PLC (Head Office) 5 King William Street, London EC4N 7JB, United Kingdom (44) 207 320 8000 (44) 207 410 0129
Daiwa Europe Trustees (Ireland) Ltd Level 3, Block 5, Harcourt Centre, Harcourt Road, Dublin 2, Ireland (353) 1 603 9900 (353) 1 478 3469
Daiwa Capital Markets America Inc. New York Head Office Financial Square, 32 Old Slip, New York, NY10005, U.S.A. (1) 212 612 7000 (1) 212 612 7100
Daiwa Capital Markets America Inc. San Francisco Branch 555 California Street, Suite 3360, San Francisco, CA 94104, U.S.A. (1) 415 955 8100 (1) 415 956 1935
Daiwa Capital Markets Europe Limited, London Head Office 5 King William Street, London EC4N 7AX, United Kingdom (44) 20 7597 8000 (44) 20 7597 8600
Daiwa Capital Markets Europe Limited, Frankfurt Branch Neue Mainzer Str. 1, 60311 Frankfurt/Main, Germany (49) 69 717 080 (49) 69 723 340
Daiwa Capital Markets Europe Limited, Paris Representative Office 17, rue de Surène 75008 Paris, France (33) 1 56 262 200 (33) 1 47 550 808
Daiwa Capital Markets Europe Limited, Geneva Branch 50 rue du Rhône, P.O.Box 3198, 1211 Geneva 3, Switzerland (41) 22 818 7400 (41) 22 818 7441
Daiwa Capital Markets Europe Limited, Moscow Representative Office
Midland Plaza 7th Floor, 10 Arbat Street, Moscow 119002, Russian Federation
(7) 495 641 3416 (7) 495 775 6238
Daiwa Capital Markets Europe Limited, Bahrain Branch 7th Floor, The Tower, Bahrain Commercial Complex, P.O. Box 30069, Manama, Bahrain
(973) 17 534 452 (973) 17 535 113
Daiwa Capital Markets Hong Kong Limited Level 28, One Pacific Place, 88 Queensway, Hong Kong (852) 2525 0121 (852) 2845 1621
Daiwa Capital Markets Singapore Limited 6 Shenton Way #26-08, OUE Downtown 2, Singapore 068809, Republic of Singapore
(65) 6220 3666 (65) 6223 6198
Daiwa Capital Markets Australia Limited Level 34, Rialto North Tower, 525 Collins Street, Melbourne, Victoria 3000, Australia
(61) 3 9916 1300 (61) 3 9916 1330
DBP-Daiwa Capital Markets Philippines, Inc 18th Floor, Citibank Tower, 8741 Paseo de Roxas, Salcedo Village, Makati City, Republic of the Philippines
(632) 813 7344 (632) 848 0105
Daiwa-Cathay Capital Markets Co Ltd 14/F, 200, Keelung Road, Sec 1, Taipei, Taiwan, R.O.C. (886) 2 2723 9698 (886) 2 2345 3638
Daiwa Securities Capital Markets Korea Co., Ltd. 20 Fl.& 21Fl. One IFC, 10 Gukjegeumyung-Ro, Yeongdeungpo-gu, Seoul, Korea
(82) 2 787 9100 (82) 2 787 9191
Daiwa Securities Co. Ltd., Beijing Representative Office Room 301/302,Kerry Center,1 Guanghua Road,Chaoyang District,
Beijing 100020, People’s Republic of China
(86) 10 6500 6688 (86) 10 6500 3594
Daiwa (Shanghai) Corporate Strategic Advisory Co. Ltd. 44/F, Hang Seng Bank Tower, 1000 Lujiazui Ring Road, Pudong, Shanghai China 200120 , People’s Republic of China
(86) 21 3858 2000 (86) 21 3858 2111
Daiwa Securities Co. Ltd., Bangkok Representative Office 18th Floor, M Thai Tower, All Seasons Place, 87 Wireless Road,
Lumpini, Pathumwan, Bangkok 10330, Thailand (66) 2 252 5650 (66) 2 252 5665
Daiwa Capital Markets India Private Ltd 10th Floor, 3 North Avenue, Maker Maxity, Bandra Kurla Complex, Bandra East, Mumbai – 400051, India
(91) 22 6622 1000 (91) 22 6622 1019
Daiwa Securities Co. Ltd., Hanoi Representative Office Suite 405, Pacific Palace Building, 83B, Ly Thuong Kiet Street, Hoan Kiem Dist. Hanoi, Vietnam
(84) 4 3946 0460 (84) 4 3946 0461
DAIWA INSTITUTE OF RESEARCH LTD
HEAD OFFICE 15-6, Fuyuki, Koto-ku, Tokyo, 135-8460, Japan (81) 3 5620 5100 (81) 3 5620 5603
MARUNOUCHI OFFICE Gran Tokyo North Tower, 1-9-1, Marunouchi, Chiyoda-ku, Tokyo, 100-6756 (81) 3 5555 7011 (81) 3 5202 2021
New York Research Center 11th Floor, Financial Square, 32 Old Slip, NY, NY 10005-3504, U.S.A. (1) 212 612 6100 (1) 212 612 8417
London Research Centre 3/F, 5 King William Street, London, EC4N 7AX, United Kingdom (44) 207 597 8000 (44) 207 597 8550
28
Singapore Land Transport Sector: 18 March 2016
Important Disclosures and Disclaimer
This publication is produced by Daiwa Securities Group Inc. and/or its non-U.S. affiliates, and distributed by Daiwa Securities Group Inc. and/or its non-U.S. affiliates, except to the extent expressly provided herein. This publication and the contents hereof are intended for information purposes only, and may be subject to change without further notice. Any use, disclosure, distribution, dissemination, copying, printing or reliance on this publication for any other purpose without our prior consent or approval is strictly prohibited. Neither Daiwa Securities Group Inc. nor any of its respective parent, holding, subsidiaries or affiliates, nor any of its respective directors, officers, servants and employees, represent nor warrant the accuracy or completeness of the information contained herein or as to the existence of other facts which might be significant, and will not accept any responsibility or liability whatsoever for any use of or reliance upon this publication or any of the contents hereof. Neither this publication, nor any content hereof, constitute, or are to be construed as, an offer or solicitation of an offer to buy or sell any of the securities or investments mentioned herein in any country or jurisdiction nor, unless expressly provided, any recommendation or investment opinion or advice. Any view, recommendation, opinion or advice expressed in this publication may not necessarily reflect those of Daiwa Securities Group Inc., and/or its affiliates nor any of its respective directors, officers, servants and employees except where the publication states otherwise. This research report is not to be relied upon by any person in making any investment decision or otherwise advising with respect to, or dealing in, the securities mentioned, as it does not take into account the specific investment objectives, financial situation and particular needs of any person. Daiwa Securities Group Inc., its subsidiaries or affiliates, or its or their respective directors, officers and employees from time to time have trades as principals, or have positions in, or have other interests in the securities of the company under research including market making activities, derivatives in respect of such securities or may have also performed investment banking and other services for the issuer of such securities. The following are additional disclosures. Ownership of Securities For “Ownership of Securities” information, please visit BlueMatrix disclosure link at https://daiwa3.bluematrix.com/sellside/Disclosures.action. Investment Banking Relationship For “Investment Banking Relationship”, please visit BlueMatrix disclosure link at https://daiwa3.bluematrix.com/sellside/Disclosures.action.
Japan
Daiwa Securities Co. Ltd. and Daiwa Securities Group Inc. Daiwa Securities Co. Ltd. is a subsidiary of Daiwa Securities Group Inc. Investment Banking Relationship Within the preceding 12 months, the subsidiaries and/or affiliates of Daiwa Securities Group Inc. * has lead-managed public offerings and/or secondary offerings (excluding straight bonds) of the securities of the following companies: Modern Land (China) Co. Ltd (1107 HK); econtext Asia Ltd (1390 HK); GF Securities Co Ltd (1776 HK); Mirae Asset Life Insurance Co Ltd (085620 KS); China Reinsurance Group Corporation (1508 HK).
*Subsidiaries of Daiwa Securities Group Inc. for the purposes of this section shall mean any one or more of: Daiwa Capital Markets Hong Kong Limited (大和資本市場香港有限公司), Daiwa
Capital Markets Singapore Limited, Daiwa Capital Markets Australia Limited, Daiwa Capital Markets India Private Limited, Daiwa-Cathay Capital Markets Co., Ltd., Daiwa Securities Capital Markets Korea Co., Ltd.
Hong Kong
This research is distributed in Hong Kong by Daiwa Capital Markets Hong Kong Limited (大和資本市場香港有限公司) (“DHK”) which is regulated by the Hong Kong Securities and Futures
Commission. Recipients of this research in Hong Kong may contact DHK in respect of any matter arising from or in connection with this research. Relevant Relationship (DHK) DHK may from time to time have an individual employed by or associated with it serves as an officer of any of the companies under its research coverage.
Singapore This research is distributed in Singapore by Daiwa Capital Markets Singapore Limited and it may only be distributed in Singapore to accredited investors, expert investors and institutional investors as defined in the Financial Advisers Regulations and the Securities and Futures Act (Chapter 289), as amended from time to time. By virtue of distribution to these category of investors, Daiwa Capital Markets Singapore Limited and its representatives are not required to comply with Section 36 of the Financial Advisers Act (Chapter 110) (Section 36 relates to disclosure of Daiwa Capital Markets Singapore Limited’s interest and/or its representative’s interest in securities). Recipients of this research in Singapore may contact Daiwa Capital Markets Singapore Limited in respect of any matter arising from or in connection with the research.
Australia
This research is distributed in Australia by Daiwa Capital Markets Australia Limited and it may only be distributed in Australia to wholesale investors within the meaning of the Corporations Act. Recipients of this research in Australia may contact Daiwa Capital Markets Stockbroking Limited in respect of any matter arising from or in connection with the research.
India This research is distributed in India to Institutional Clients only by Daiwa Capital Markets India Private Limited (Daiwa India) which is an intermediary registered with Securities & Exchange Board of India as a Stock Broker, Merchant Bank and Research Analyst. Daiwa India, its Research Analyst and their family members and its associates do not have any financial interest save as disclosed or other undisclosed material conflict of interest in the securities or derivatives of any companies under coverage. Daiwa India and its associates may have received compensation for any products other than Investment Banking (as disclosed) or brokerage services from the subject company in this report during the past 12 months. Unless otherwise stated in BlueMatrix disclosure link at https://daiwa3.bluematrix.com/sellside/Disclosures.action, Daiwa India and its associates do not hold more than 1% of any companies covered in this research report. There is no material disciplinary action against Daiwa India by any regulatory authority impacting equity research analysis activities as of the date of this report.
Taiwan This research is distributed in Taiwan by Daiwa-Cathay Capital Markets Co., Ltd and it may only be distributed in Taiwan to institutional investors or specific investors who have signed recommendation contracts with Daiwa-Cathay Capital Markets Co., Ltd in accordance with the Operational Regulations Governing Securities Firms Recommending Trades in Securities to Customers. Recipients of this research in Taiwan may contact Daiwa-Cathay Capital Markets Co., Ltd in respect of any matter arising from or in connection with the research.
Philippines This research is distributed in the Philippines by DBP-Daiwa Capital Markets Philippines, Inc. which is regulated by the Philippines Securities and Exchange Commission and the Philippines Stock Exchange, Inc. Recipients of this research in the Philippines may contact DBP-Daiwa Capital Markets Philippines, Inc. in respect of any matter arising from or in connection with the research. DBP-Daiwa Capital Markets Philippines, Inc. recommends that investors independently assess, with a professional advisor, the specific financial risks as well as the legal, regulatory, tax, accounting, and other consequences of a proposed transaction. DBP-Daiwa Capital Markets Philippines, Inc. may have positions or may be materially interested in the securities in any of the markets mentioned in the publication or may have performed other services for the issuers of such securities. For relevant securities and trading rules please visit SEC and PSE links at http://www.sec.gov.ph/irr/AmendedIRRfinalversion.pdf and http://www.pse.com.ph/ respectively.
Thailand
This research is distributed to only institutional investors in Thailand primarily by Thanachart Securities Public Company Limited (“TNS”).
This report is prepared by analysts who are employed by Daiwa Securities Group Inc. and/or its non-U.S. affiliates. This report is provided to you for informational purposes only and it is not, and is not to be construed as, an offer or an invitation to make an offer to sell or buy any securities. Neither Thanachart Securities Public Company Limited, Daiwa Securities Group Inc. nor any of their respective parent, holding, subsidiaries or affiliates, nor any of their respective directors, officers, servants and employees accept any liability whatsoever for any direct or consequential loss arising from any use of this research or its contents.
The information and opinions contained herein have been compiled or arrived at from sources believed to be reliable. However, Thanachart Securities Public Company Limited, Daiwa Securities Group Inc. nor any of their respective parent, holding, subsidiaries or affiliates, nor any of their respective directors, officers, servants and employees make no representation or warranty, express or implied, as to their accuracy or completeness. Expressions of opinion herein are subject to change without notice. The use of any information, forecasts and opinions contained in this report shall be at the sole discretion and risk of the user.
Daiwa Securities Group Inc. and/or its non-U.S. affiliates perform and seek to perform business with companies covered in this research. Thanachart Securities Public Company Limited, Daiwa Securities Group Inc., their respective parent, holding, subsidiaries or affiliates, their respective directors, officers, servants and employees may have positions and financial interest in securities mentioned in this research. Thanachart Securities Public Company Limited, Daiwa Securities Group Inc., their respective parent, holding, subsidiaries or affiliates may from time to time perform investment banking or other services for, or solicit investment banking or other business from, any entity mentioned in this research. Therefore, investors should be aware of conflict of interest that may affect the objectivity of this research.
United Kingdom This research report is produced by Daiwa Securities Co. Ltd. and/or its affiliates and is distributed in the European Union, Iceland, Liechtenstein, Norway and Switzerland. Daiwa Capital Markets Europe Limited is authorised and regulated by The Financial Conduct Authority (“FCA”) and is a member of the London Stock Exchange and Eurex. This publication is intended for investors who are not Retail Clients in the United Kingdom within the meaning of the Rules of the FCA and should not therefore be distributed to such Retail Clients in the United Kingdom. Should you enter into investment business with Daiwa Capital Markets Europe’s affiliates outside the United Kingdom, we are obliged to advise that the protection afforded by the United Kingdom regulatory system may not apply; in particular, the benefits of the Financial Services Compensation Scheme may not be available. Daiwa Capital Markets Europe Limited has in place organisational arrangements for the prevention and avoidance of conflicts of interest. Our conflict management policy is available at http://www.uk.daiwacm.com/about-us/corporate-governance-regulatory.
Germany
29
Singapore Land Transport Sector: 18 March 2016
This document is distributed in Germany by Daiwa Capital Markets Europe Limited, Niederlassung Frankfurt which is regulated by BaFin (Bundesanstalt fuer Finanzdienstleistungsaufsicht) for the conduct of business in Germany.
Bahrain This research material is distributed in Bahrain by Daiwa Capital Markets Europe Limited, Bahrain Branch, regulated by The Central Bank of Bahrain and holds Investment Business Firm – Category 2 license and having its official place of business at the Bahrain World Trade Centre, South Tower, 7th floor, P.O. Box 30069, Manama, Kingdom of Bahrain. Tel No. +973 17534452 Fax No. +973 535113
United States This report is distributed in the U.S. by Daiwa Capital Markets America Inc. (DCMA). It may not be accurate or complete and should not be relied upon as such. It reflects the preparer’s views at the time of its preparation, but may not reflect events occurring after its preparation; nor does it reflect DCMA’s views at any time. Neither DCMA nor the preparer has any obligation to update this report or to continue to prepare research on this subject. This report is not an offer to sell or the solicitation of any offer to buy securities. Unless this report says otherwise, any recommendation it makes is risky and appropriate only for sophisticated speculative investors able to incur significant losses. Readers should consult their financial advisors to determine whether any such recommendation is consistent with their own investment objectives, financial situation and needs. This report does not recommend to U.S. recipients the use of any of DCMA’s non-U.S. affiliates to effect trades in any security and is not supplied with any understanding that U.S. recipients of this report will direct commission business to such non-U.S. entities. Unless applicable law permits otherwise, non-U.S. customers wishing to effect a transaction in any securities referenced in this material should contact a Daiwa entity in their local jurisdiction. Most countries throughout the world have their own laws regulating the types of securities and other investment products which may be offered to their residents, as well as a process for doing so. As a result, the securities discussed in this report may not be eligible for sales in some jurisdictions. Customers wishing to obtain further information about this report should contact DCMA: Daiwa Capital Markets America Inc., Financial Square, 32 Old Slip, New York, New York 10005 (Tel no. 212-612-7000).
Ownership of Securities For “Ownership of Securities” information please visit BlueMatrix disclosure link at https://daiwa3.bluematrix.com/sellside/Disclosures.action.
Investment Banking Relationships For “Investment Banking Relationships” please visit BlueMatrix disclosure link at https://daiwa3.bluematrix.com/sellside/Disclosures.action. DCMA Market Making For “DCMA Market Making” please visit BlueMatrix disclosure link at https://daiwa3.bluematrix.com/sellside/Disclosures.action.
Research Analyst Conflicts For updates on “Research Analyst Conflicts” please visit BlueMatrix disclosure link at https://daiwa3.bluematrix.com/sellside/Disclosures.action. The principal research analysts who prepared this report have no financial interest in securities of the issuers covered in the report, are not (nor are any members of their household) an officer, director or advisory board member of the issuer(s) covered in the report, and are not aware of any material relevant conflict of interest involving the analyst or DCMA, and did not receive any compensation from the issuer during the past 12 months except as noted: no exceptions.
Research Analyst Certification For updates on “Research Analyst Certification” and “Rating System” please visit BlueMatrix disclosure link at https://daiwa3.bluematrix.com/sellside/Disclosures.action. The views about any and all of the subject securities and issuers expressed in this Research Report accurately reflect the personal views of the research analyst(s) primarily responsible for this report (or the views of the firm producing the report if no individual analysts[s] is named on the report); and no part of the compensation of such analyst(s) (or no part of the compensation of the firm if no individual analyst[s)] is named on the report) was, is, or will be directly or indirectly related to the specific recommendations or views contained in this Research Report.
The following explains the rating system in the report as compared to relevant local indices, unless otherwise stated, based on the beliefs of the author of the report. "1": the security could outperform the local index by more than 15% over the next 12 months. "2": the security is expected to outperform the local index by 5-15% over the next 12 months. "3": the security is expected to perform within 5% of the local index (better or worse) over the next 12 months. "4": the security is expected to underperform the local index by 5-15% over the next 12 months. "5": the security could underperform the local index by more than 15% over the next 12 months. Disclosure of investment ratings
Rating Percentage of total
Buy* 63.9%
Hold** 21.3%
Sell*** 14.8%
Source: Daiwa
Notes: data is for single-branded Daiwa research in Asia (ex Japan) and correct as of 31 December 2015. * comprised of Daiwa’s Buy and Outperform ratings. ** comprised of Daiwa’s Hold ratings. *** comprised of Daiwa’s Underperform and Sell ratings. Additional information may be available upon request.
Japan - additional notification items pursuant to Article 37 of the Financial Instruments and Exchange Law (This Notification is only applicable where report is distributed by Daiwa Securities Co. Ltd.)
If you decide to enter into a business arrangement with us based on the information described in materials presented along with this document, we ask you to pay close attention to the following items.
In addition to the purchase price of a financial instrument, we will collect a trading commission* for each transaction as agreed beforehand with you. Since commissions may be included in the purchase price or may not be charged for certain transactions, we recommend that you confirm the commission for each transaction.
In some cases, we may also charge a maximum of ¥ 2 million (including tax) per year as a standing proxy fee for our deposit of your securities, if you are a non-resident of Japan.
For derivative and margin transactions etc., we may require collateral or margin requirements in accordance with an agreement made beforehand with you. Ordinarily in such cases, the amount of the transaction will be in excess of the required collateral or margin requirements.
There is a risk that you will incur losses on your transactions due to changes in the market price of financial instruments based on fluctuations in interest rates, exchange rates, stock prices, real estate prices, commodity prices, and others. In addition, depending on the content of the transaction, the loss could exceed the amount of the collateral or margin requirements.
There may be a difference between bid price etc. and ask price etc. of OTC derivatives handled by us.
Before engaging in any trading, please thoroughly confirm accounting and tax treatments regarding your trading in financial instruments with such experts as certified public accountants. *The amount of the trading commission cannot be stated here in advance because it will be determined between our company and you based on current market conditions and the content of each transaction etc.
When making an actual transaction, please be sure to carefully read the materials presented to you prior to the execution of agreement, and to take responsibility for your own decisions regarding the signing of the agreement with us.
Corporate Name: Daiwa Securities Co. Ltd. Financial instruments firm: chief of Kanto Local Finance Bureau (Kin-sho) No.108 Memberships: Japan Securities Dealers Association, The Financial Futures Association of Japan Japan Securities Investment Advisers Association Type II Financial Instruments Firms Association

![SINGAPORE LAND TRANSPORT land transport statistics in brief 2012 public transport journeys ... road accident casualties 2010 2011 [11] fatalities injuries 193197 11,065 9,752 notes:](https://static.documents.pub/doc/80x56/5ad5a05b7f8b9a1a028d51d2/singapore-land-transport-land-transport-statistics-in-brief-2012-public-transport.jpg)


