
Six month report 2016LaGuardia Airport, New York, U.S.
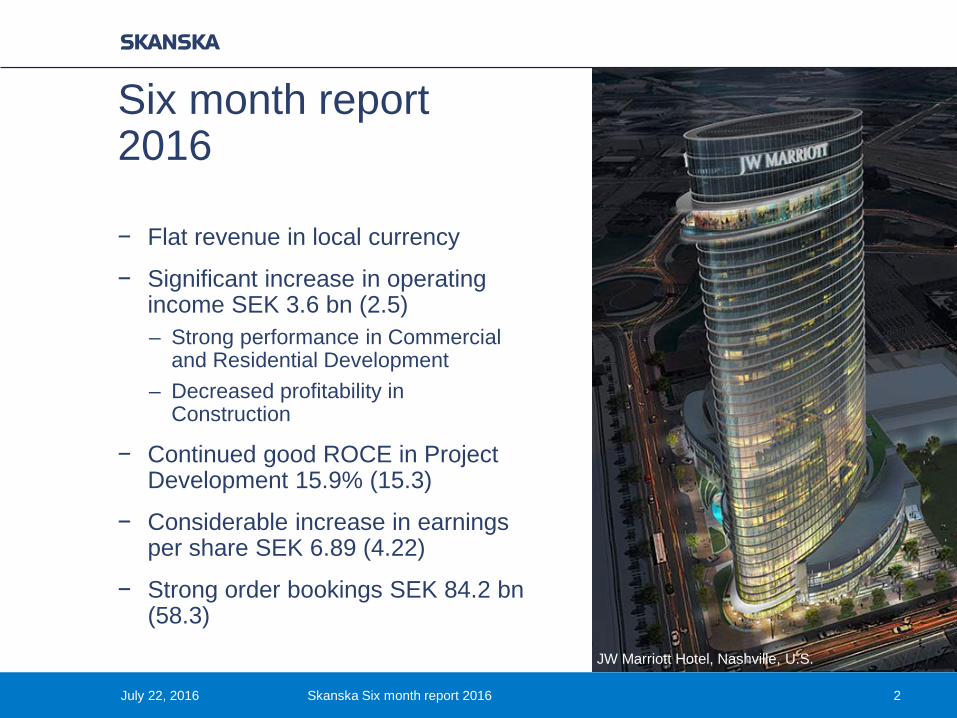
− Flat revenue in local currency
− Significant increase in operating income SEK 3.6 bn (2.5)– Strong performance in Commercial
and Residential Development – Decreased profitability in
Construction
− Continued good ROCE in Project Development 15.9% (15.3)
− Considerable increase in earnings per share SEK 6.89 (4.22)
− Strong order bookings SEK 84.2 bn(58.3)
JW Marriott Hotel, Nashville, U.S.
July 22, 2016 Skanska Six month report 2016 2
Six month report2016

July 22, 2016 Skanska Six month report 2016 3
Skanska: USD 70 M equity investmentUSD 2.8 billion construction contract
Term: 2016–2022 Construction2016–2050 Operations
PPP model: Airline and retail revenue, limited market risk
Financing: Debt, equity and milestone payments by PANYNJ
Scope: New Central Terminal, Central Hall, West Parking garage, supporting infrastructure
LaGuardia Central Terminal Building BNew York, U.S.

July 22, 2016 Skanska Six month report 2016 4
Skanska: USD 136 M equity investment USD 661 M construction
Term: 2012–2018 Construction, first tunnel opened six months ahead of schedule 2012–2070 Operations
PPP model: Revenue and toll risk
Scope: Construction of a two-lane submerged tunnel, improvements to the existing Midtown Tunnel and an extension of the MLK Freeway
Elizabeth River TunnelsVirginia, U.S.
Skanska: USD 73 M equity investment USD 920 M construction
Term: 2015–2021 Construction2015–2061 Operations
PPP model: Availability
Scope: 21-miles Express lanes, 140 bridges and 15 major interchanges
I-4 Ultimate Express LanesFlorida, U.S.
July 22, 2016 Skanska Six month report 2016 5
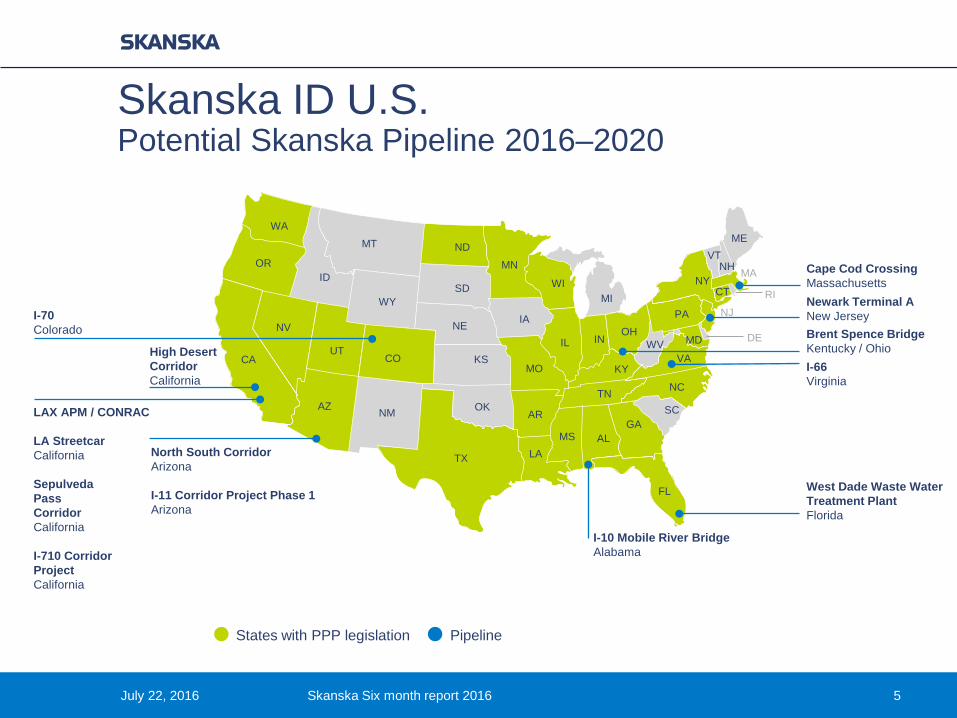
Skanska ID U.S. Potential Skanska Pipeline 2016–2020
OH
CACO
NY
VA
MA
RI
NJ
DE
States with PPP legislation
NM
WA
OR
CA
NV
UT
AZ
CO
WY
ID
MT ND
SD
NE
TX
OK
KS
IA
MN
WIMI
IL
MO
IN
KY
TN
AR
LA
OHPA
NY
VTNH
ME
WVVA
NC
SC
MS ALGA
FL
MD
CT
Pipeline
High DesertCorridorCalifornia
North South CorridorArizona
I-11 Corridor Project Phase 1Arizona
LAX APM / CONRAC
LA StreetcarCalifornia
SepulvedaPass CorridorCalifornia
I-710 CorridorProjectCalifornia
Cape Cod CrossingMassachusettsNewark Terminal ANew JerseyBrent Spence BridgeKentucky / Ohio
West Dade Waste WaterTreatment PlantFlorida
I-10 Mobile River BridgeAlabama
I-66Virginia
I-70Colorado
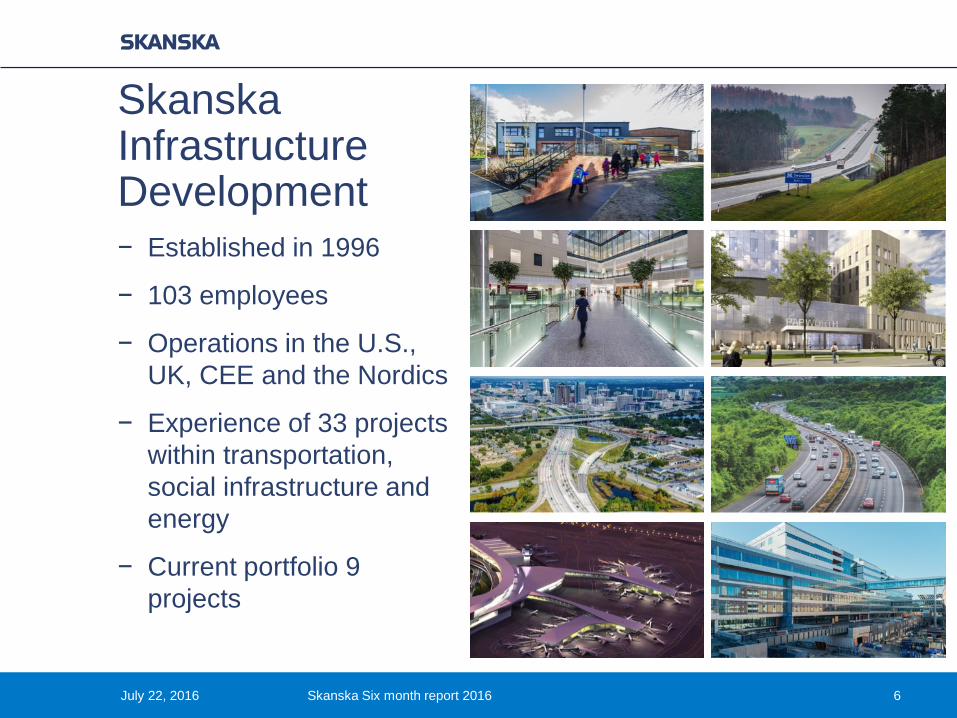
− Established in 1996
− 103 employees
− Operations in the U.S., UK, CEE and the Nordics
− Experience of 33 projects within transportation, social infrastructure and energy
− Current portfolio 9 projects
July 22, 2016 Skanska Six month report 2016 6
Skanska Infrastructure Development

− Operating income SEK 217 M (252)
− Project portfolio’s net present value SEK 5.2 bn, SEK 0.4 bn in underlying increase year-to-date
− ROCE 16.3% (26.7)
− Financial close of LaGuardia Airport achieved
− First phases of NKS delivered
Interstate 4, Orlando, Florida, U.S.
July 22, 2016 Skanska Six month report 2016 7
Infrastructure Development
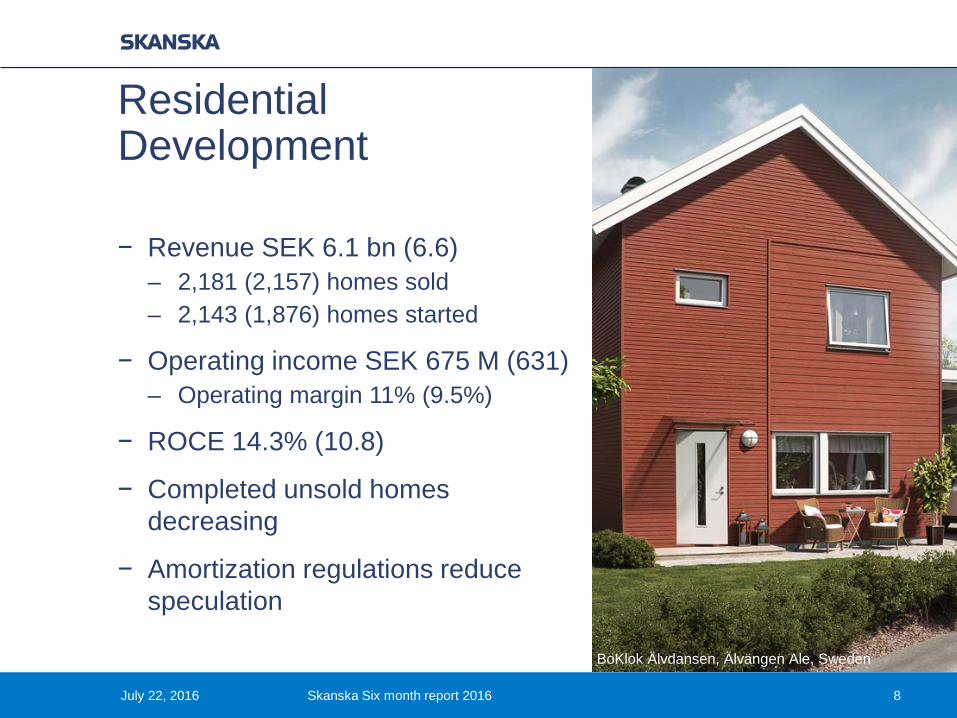
− Revenue SEK 6.1 bn (6.6) – 2,181 (2,157) homes sold – 2,143 (1,876) homes started
− Operating income SEK 675 M (631) – Operating margin 11% (9.5%)
− ROCE 14.3% (10.8)
− Completed unsold homes decreasing
− Amortization regulations reduce speculation
BoKlok Älvdansen, Älvängen Ale, Sweden
July 22, 2016 Skanska Six month report 2016 8
Residential Development
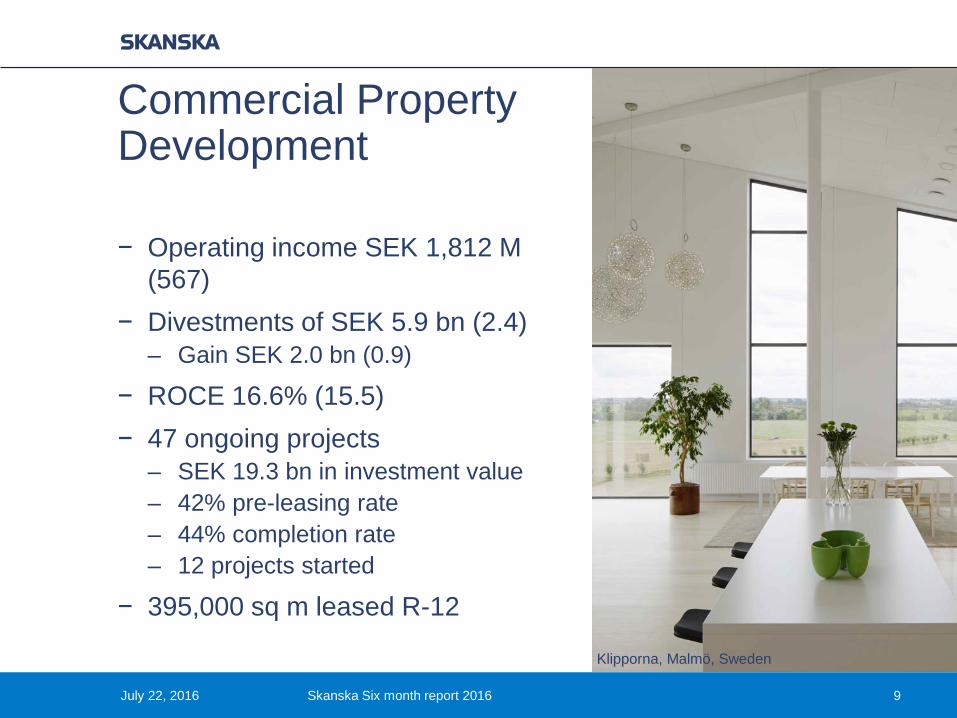
− Operating income SEK 1,812 M (567)
− Divestments of SEK 5.9 bn (2.4) – Gain SEK 2.0 bn (0.9)
− ROCE 16.6% (15.5)− 47 ongoing projects
– SEK 19.3 bn in investment value – 42% pre-leasing rate – 44% completion rate – 12 projects started
− 395,000 sq m leased R-12
Klipporna, Malmö, Sweden
July 22, 2016 Skanska Six month report 2016 9
Commercial Property Development
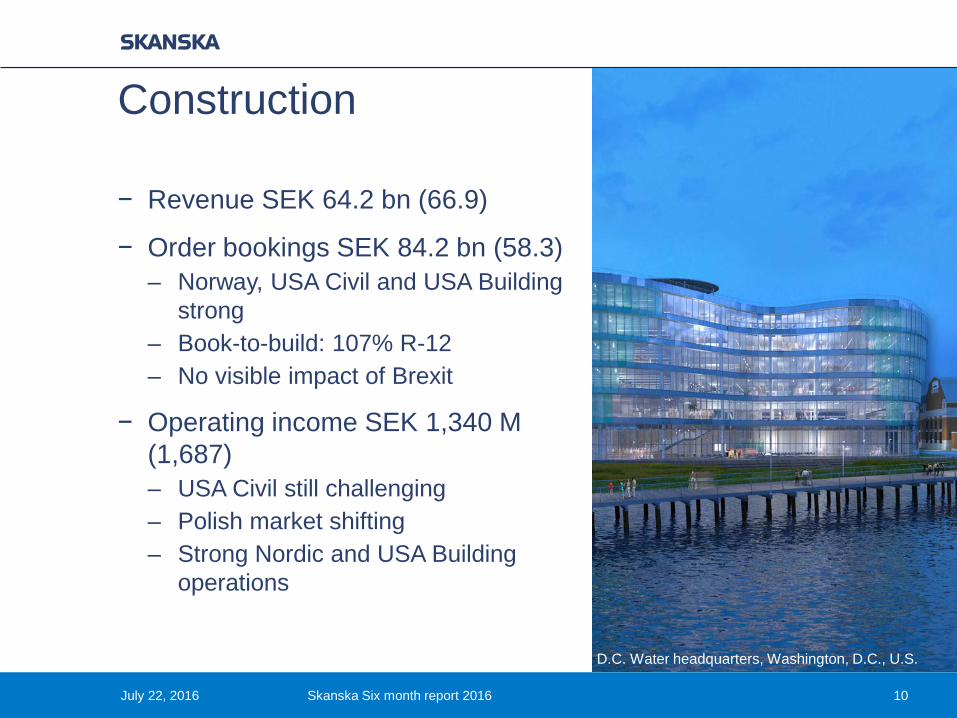
− Revenue SEK 64.2 bn (66.9)
− Order bookings SEK 84.2 bn (58.3) – Norway, USA Civil and USA Building
strong– Book-to-build: 107% R-12– No visible impact of Brexit
− Operating income SEK 1,340 M (1,687) – USA Civil still challenging – Polish market shifting– Strong Nordic and USA Building
operations
D.C. Water headquarters, Washington, D.C., U.S.
July 22, 2016 Skanska Six month report 2016 10
Construction
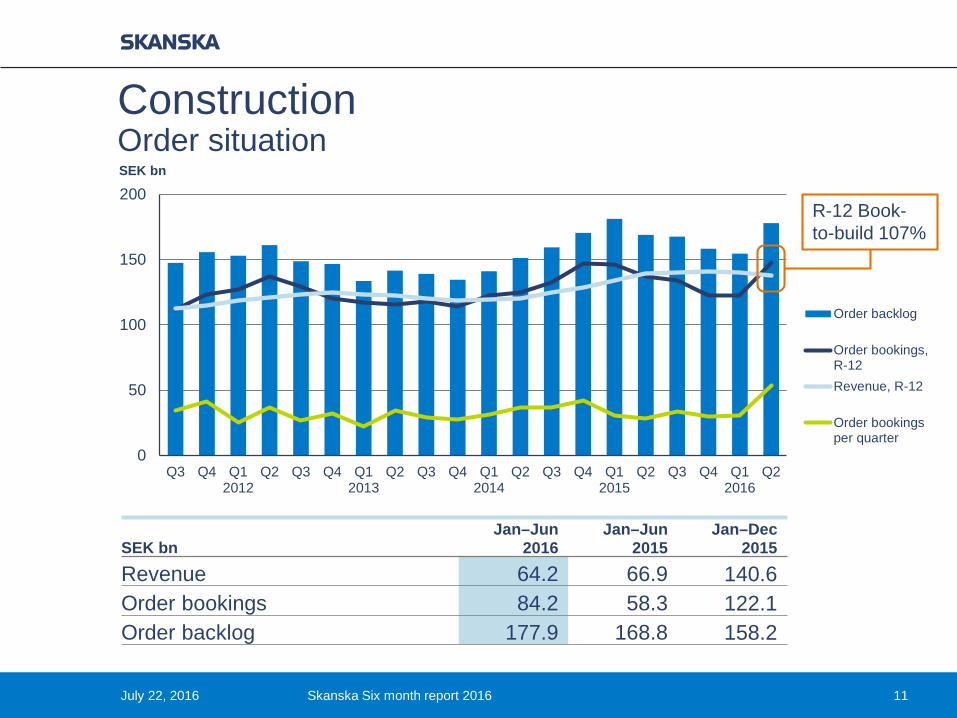
Construction Order situation
0
50
100
150
200
Q3 Q4 Q12012
Q2 Q3 Q4 Q12013
Q2 Q3 Q4 Q12014
Q2 Q3 Q4 Q12015
Q2 Q3 Q4 Q12016
Q2
SEK bn
Order backlog
Order bookings,R-12Revenue, R-12
Order bookingsper quarter
R-12 Book-to-build 107%
July 22, 2016 Skanska Six month report 2016 11
SEK bnJan–Jun
2016Jan–Jun
2015Jan–Dec
2015Revenue 64.2 66.9 140.6 Order bookings 84.2 58.3 122.1 Order backlog 177.9 168.8 158.2

July 22, 2016 Skanska Six month report 2016 12
Construction Order bookings
SEK bnJan–Jun
2016Jan–Jun
2015
Book-to-build,R-12, %
Months of production
Sweden 16.2 16.2 105 13Norway 6.7 5.5 130 13Finland 2.8 3.2 101 11Poland 4.5 4.1 106 9Czech Republic 1.7 3.1 85 11UK 7.4 13.8 65 15USA Building 29.6 5.5 131 16USA Civil 15.1 6.8 107 27Total 84.2 58.3 107 15
0
25
50
75
100
125
150
0
1
2
3
4
5
6
Q3 Q4 Q12012
Q2 Q3 Q4 Q12013
Q2 Q3 Q4 Q12014
Q2 Q3 Q4 Q12015
Q2 Q3 Q4 Q12016
Q2
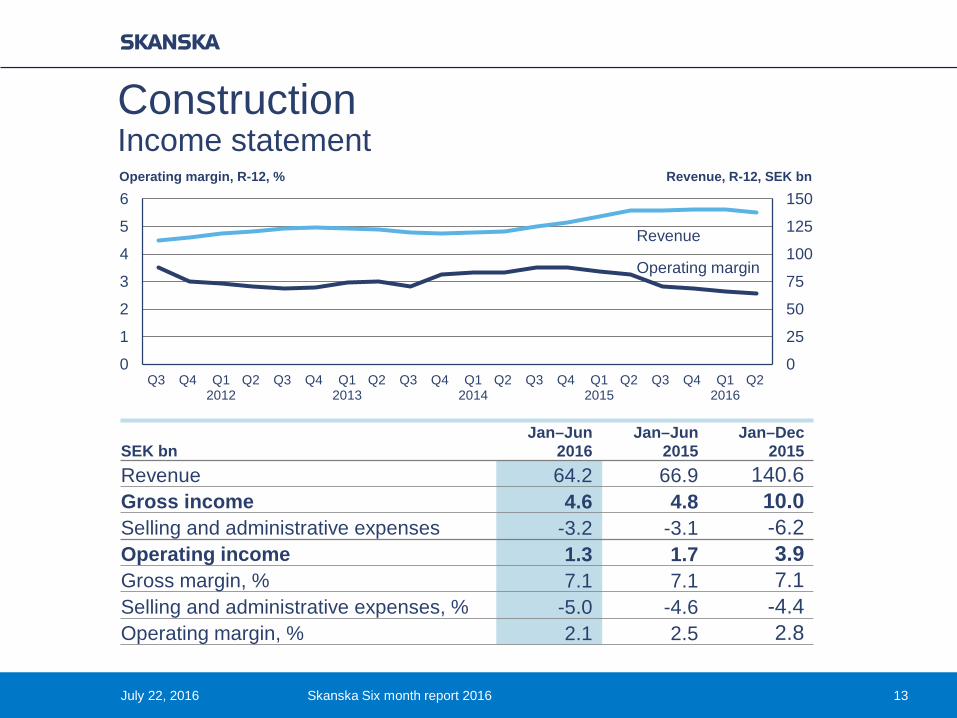
Construction Income statement
Revenue
Operating margin
Revenue, R-12, SEK bnOperating margin, R-12, %
July 22, 2016 Skanska Six month report 2016 13
SEK bnJan–Jun
2016Jan–Jun
2015Jan–Dec
2015Revenue 64.2 66.9 140.6 Gross income 4.6 4.8 10.0 Selling and administrative expenses -3.2 -3.1 -6.2Operating income 1.3 1.7 3.9 Gross margin, % 7.1 7.1 7.1 Selling and administrative expenses, % -5.0 -4.6 -4.4Operating margin, % 2.1 2.5 2.8

Construction Income statement
14
Operating income, SEK M Operating margin, %Jan–Jun
2016Jan–Jun
2015Jan–Jun
2016Jan–Jun
2015
Sweden 454 538 3.1 3.7 Norway 177 182 3.1 2.8 Finland 119 95 3.6 3.3 Poland -90 94 neg 3.0 Czech Republic -18 17 neg 0.8 UK 198 205 2.0 2.4 USA Building 233 101 1.3 0.5 USA Civil 267 455 3.1 4.4 Total 1,340 1,687 2.1 2.5
July 22, 2016 Skanska Six month report 2016

-5
0
5
10
15
-5
0
5
10
15
Q3 Q4 Q12012
Q2 Q3 Q4 Q12013
Q2 Q3 Q4 Q12014
Q2 Q3 Q4 Q12015
Q2 Q3 Q4 Q12016
Q2
Revenue
Operating margin
Operating margin, R-12, %
Residential Development Income statement, segment reporting
Revenue, R-12, SEK bn
July 22, 2016 Skanska Six month report 2016 15
SEK MJan–Jun
2016Jan–Jun
2015Jan–Dec
2015
Revenue 6,139 6,642 12,298 Gross income 974 937 1,724 Selling and administrative expenses -299 -306 -550Operating income 675 631 1,174Gross margin, % 15.9 14.1 14.0 Selling and administrative expenses, % -4.9 -4.6 -4.5Operating margin, % 11.0 9.5 9.5
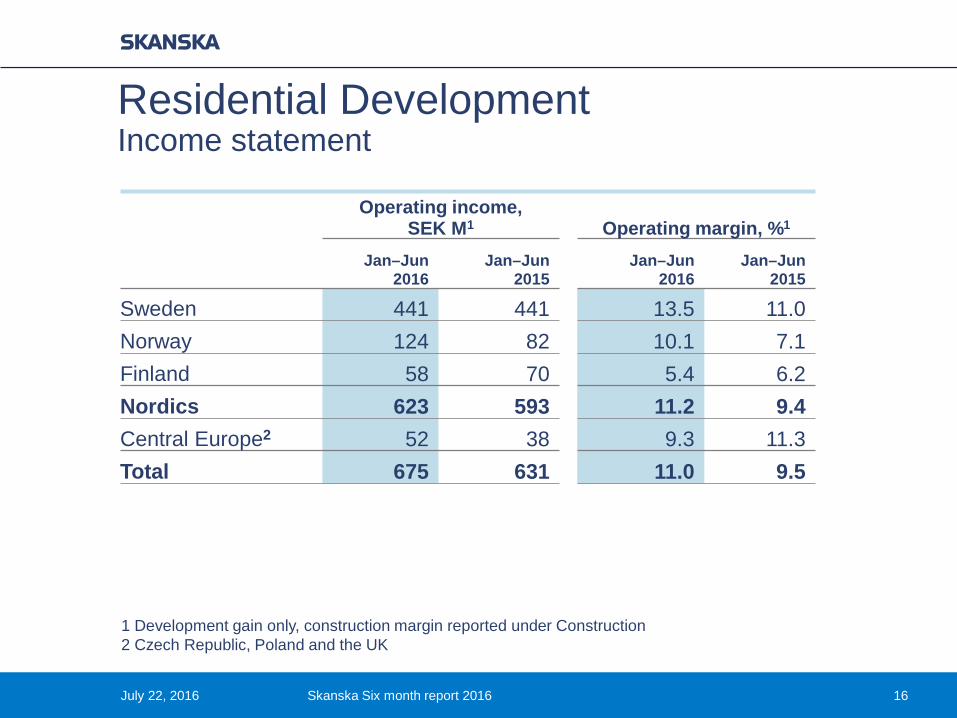
Residential Development Income statement
16
Operating income, SEK M1 Operating margin, %1
Jan–Jun2016
Jan–Jun 2015
Jan–Jun2016
Jan–Jun 2015
Sweden 441 441 13.5 11.0 Norway 124 82 10.1 7.1 Finland 58 70 5.4 6.2 Nordics 623 593 11.2 9.4 Central Europe2 52 38 9.3 11.3 Total 675 631 11.0 9.5
1 Development gain only, construction margin reported under Construction2 Czech Republic, Poland and the UK
July 22, 2016 Skanska Six month report 2016
0
1,000
2,000
3,000
4,000
5,000
Q3 Q4 Q12012
Q2 Q3 Q4 Q12013
Q2 Q3 Q4 Q12014
Q2 Q3 Q4 Q12015
Q2 Q3 Q4 Q12016
Q2
Homes
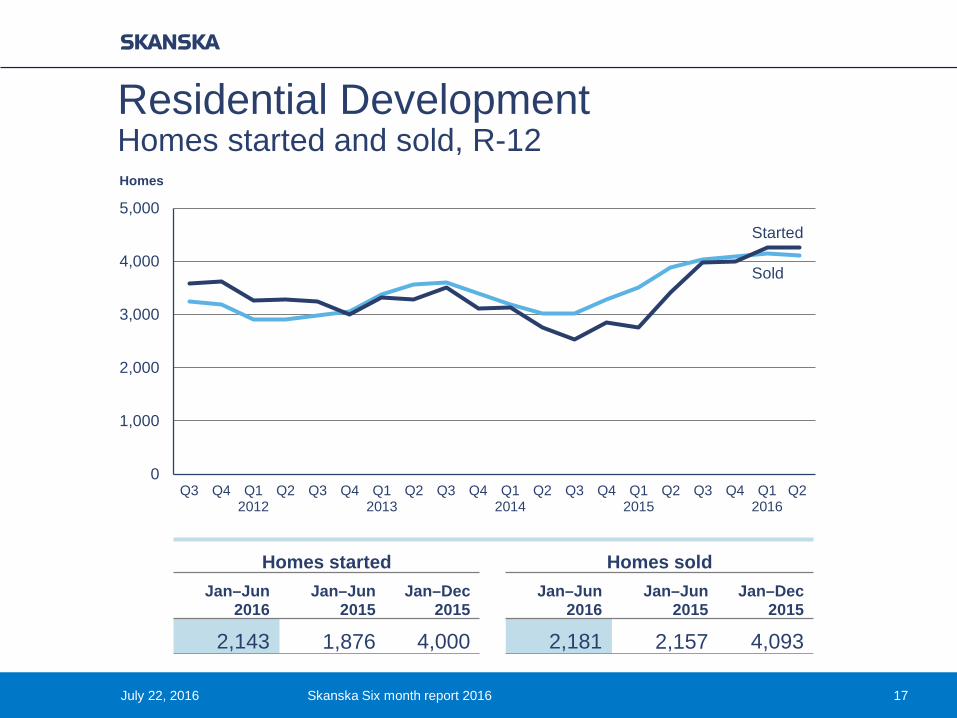
Residential Development Homes started and sold, R-12
Sold
Started
July 22, 2016 Skanska Six month report 2016 17
Homes started Homes soldJan–Jun
2016Jan–Jun
2015Jan–Dec
2015Jan–Jun
2016Jan–Jun
2015Jan–Dec
2015
2,143 1,876 4,000 2,181 2,157 4,093
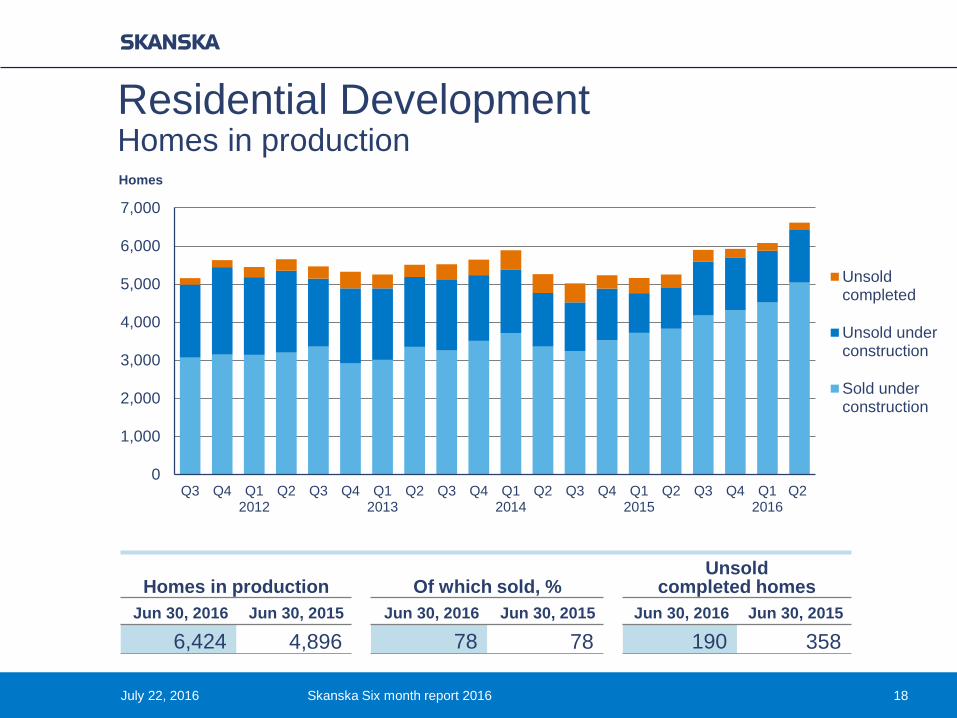
Residential Development Homes in production
July 22, 2016 Skanska Six month report 2016 18
0
1,000
2,000
3,000
4,000
5,000
6,000
7,000
Q3 Q4 Q12012
Q2 Q3 Q4 Q12013
Q2 Q3 Q4 Q12014
Q2 Q3 Q4 Q12015
Q2 Q3 Q4 Q12016
Q2
Homes
Unsoldcompleted
Unsold underconstruction
Sold underconstruction
Homes in production Of which sold, %Unsold
completed homesJun 30, 2016 Jun 30, 2015 Jun 30, 2016 Jun 30, 2015 Jun 30, 2016 Jun 30, 2015
6,424 4,896 78 78 190 358

Commercial Property Development Income statement, segment reporting
19
SEK MJan–Jun
2016Jan–Jun
2015Jan–Dec
2015
Revenue 6,214 2,659 9,034Gross income 2,167 877 2,661 Selling and administrative expenses -358 -316 -677Income from joint ventures andassociated companies 3 6 -37 Operating income 1,812 567 1,947
of which gain from divestments of properties1 2,040 856 2,564of which write downs/reversal of write downs – -50 -56
1 Additional gain included in eliminations 127 48 190
Development gain only, construction margin reported under Construction
July 22, 2016 Skanska Six month report 2016
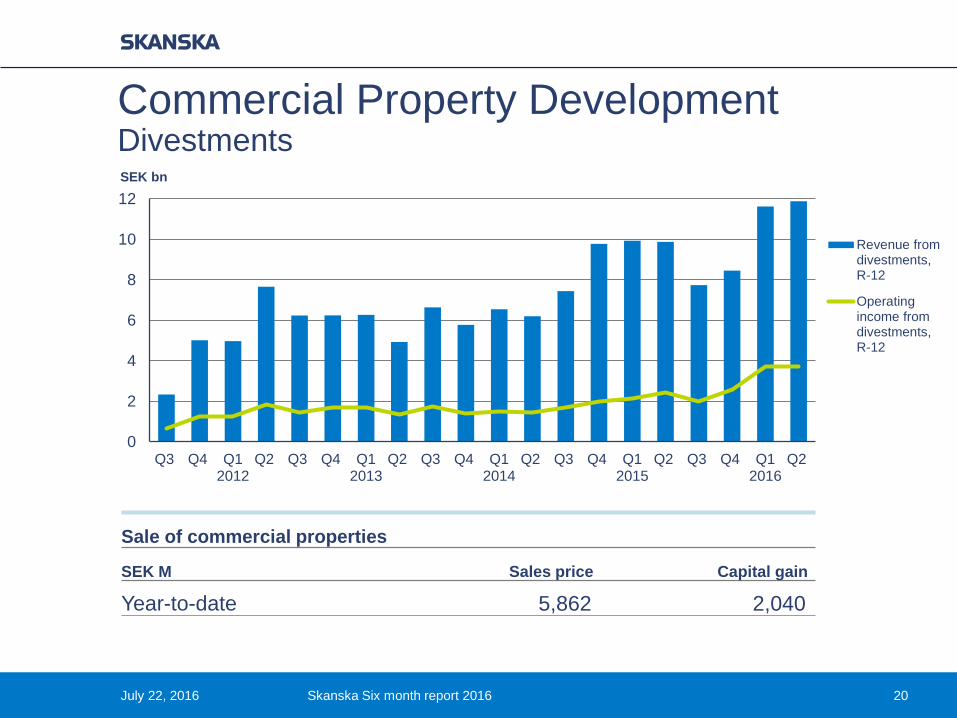
0
2
4
6
8
10
12
Q3 Q4 Q12012
Q2 Q3 Q4 Q12013
Q2 Q3 Q4 Q12014
Q2 Q3 Q4 Q12015
Q2 Q3 Q4 Q12016
Q2
Revenue fromdivestments,R-12
Operatingincome fromdivestments,R-12
SEK bn
Commercial Property Development Divestments
Sale of commercial properties
SEK M Sales price Capital gain
Year-to-date 5,862 2,040
July 22, 2016 Skanska Six month report 2016 20

July 22, 2016 Skanska Six month report 2016 21
Commercial Property Development Unrealized and realized gains
0
1
2
3
4
5
6
7
Q3 Q4 Q12012
Q2 Q3 Q4 Q12013
Q2 Q3 Q4 Q12014
Q2 Q3 Q4 Q12015
Q2 Q3 Q4 Q12016
Q2
SEK bn
Unrealized gains in: Land Ongoing projects Completed projects
Realized gains, R-12

0
50
100
150
200
250
300
350
400
450
Q3 Q4 Q12012
Q2 Q3 Q4 Q12013
Q2 Q3 Q4 Q12014
Q2 Q3 Q4 Q12015
Q2 Q3 Q4 Q12016
Q2
Leasing,quarterly
Leasing,R-12
000 sq m
Commercial Property Development Leasing
New leases of space were signed for 395,000 sq m, R-12
July 22, 2016 Skanska Six month report 2016 22
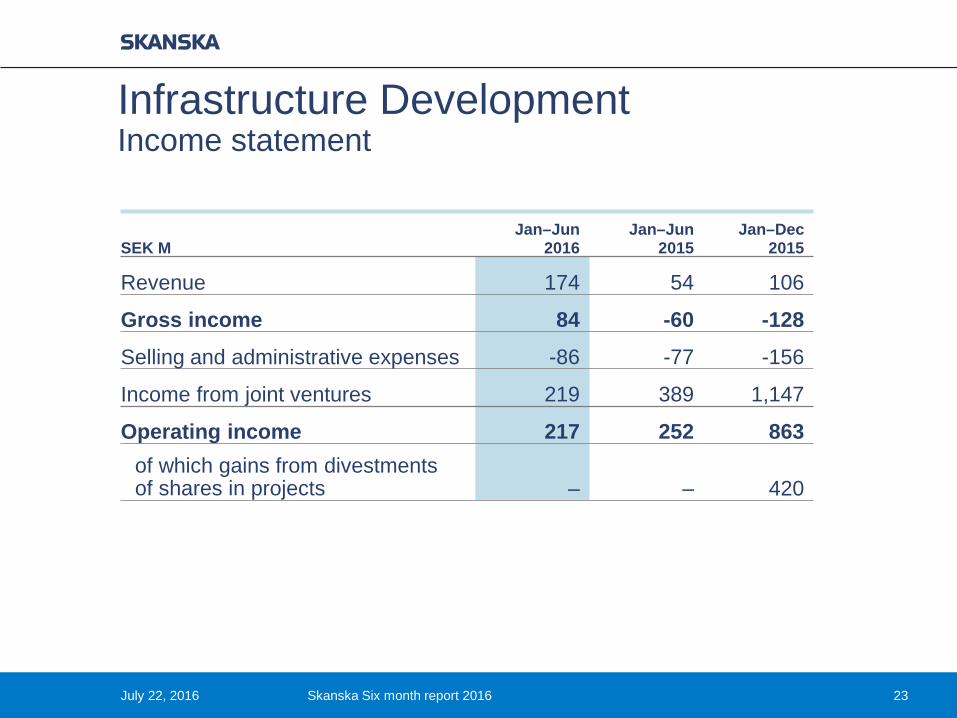
Infrastructure Development Income statement
23July 22, 2016 Skanska Six month report 2016
SEK MJan–Jun
2016Jan–Jun
2015Jan–Dec
2015
Revenue 174 54 106
Gross income 84 -60 -128
Selling and administrative expenses -86 -77 -156
Income from joint ventures 219 389 1,147
Operating income 217 252 863of which gains from divestmentsof shares in projects – – 420
July 22, 2016 Skanska Six month report 2016 24
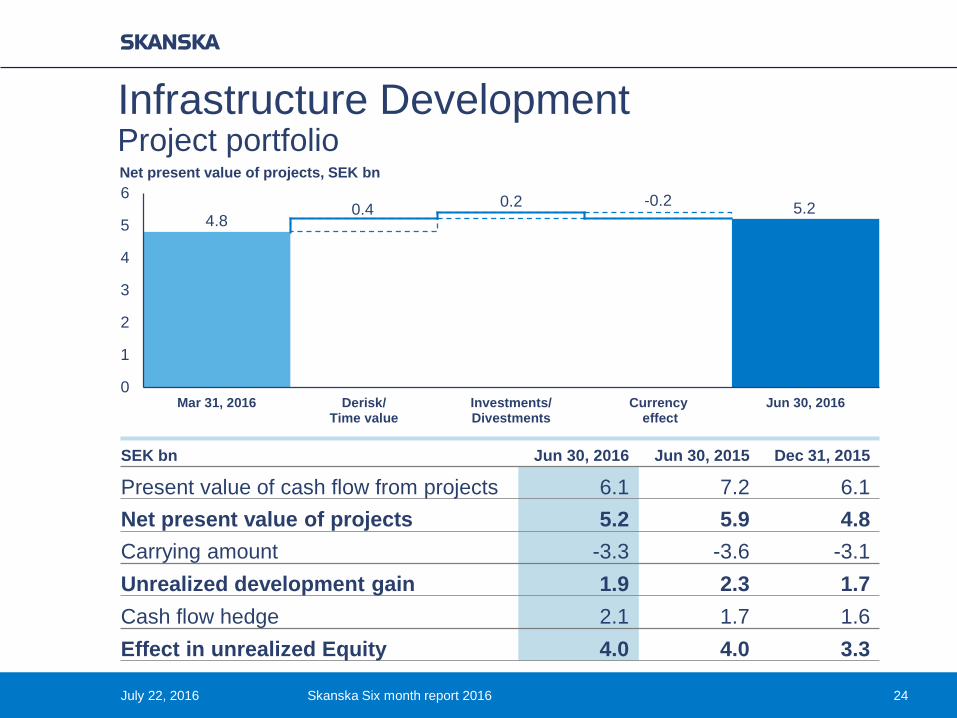
Infrastructure Development Project portfolioNet present value of projects, SEK bn
4.80.4 0.2 -0.2
0
1
2
3
4
5
6
Mar 31, 2016 Derisk/Time value
Investments/Divestments
Currency effect
Jun 30, 2016
5.2
SEK bn Jun 30, 2016 Jun 30, 2015 Dec 31, 2015
Present value of cash flow from projects 6.1 7.2 6.1 Net present value of projects 5.2 5.9 4.8Carrying amount -3.3 -3.6 -3.1Unrealized development gain 1.9 2.3 1.7Cash flow hedge 2.1 1.7 1.6 Effect in unrealized Equity 4.0 4.0 3.3

Group Income statement
25July 22, 2016 Skanska Six month report 2016
1 Latin American operations included from 1/1 2013
SEK MJan–Jun
2016Jan–Jun
2015Jan–Dec
2015
Operating income from business streams 4,044 3,137 7,858 Central1 -483 -603 -1,346 Eliminations 72 -34 -51Operating income 3,633 2,500 6,461 Net financial items -41 -244 -313Income after financial items 3,592 2,256 6,148 Taxes -755 -519 -1,219Profit for the period 2,837 1,737 4,929
Earnings per share, SEK 6.89 4.22 11.96 Tax rate, % 21 23 20

-6-4-202468
10
Q3 Q4 Q12012
Q2 Q3 Q4 Q12013
Q2 Q3 Q4 Q12014
Q2 Q3 Q4 Q12015
Q2 Q3 Q4 Q12016
Q2
SEK bn
Cash flowfrombusinessoperations,quarterly
R-12
GroupCash flow
July 22, 2016 Skanska Six month report 2016 26
SEK bnJan–Jun
2016Jan–Jun
2015Jan–Dec
2015
Cash flow from operations -1.9 -2.2 7.7Net strategic investments 0.1 – 0.5 Dividend etc. -3.6 -3.0 -3.2Cash flow before change in interest-bearing receivables and liabilities -5.3 -5.2 4.9
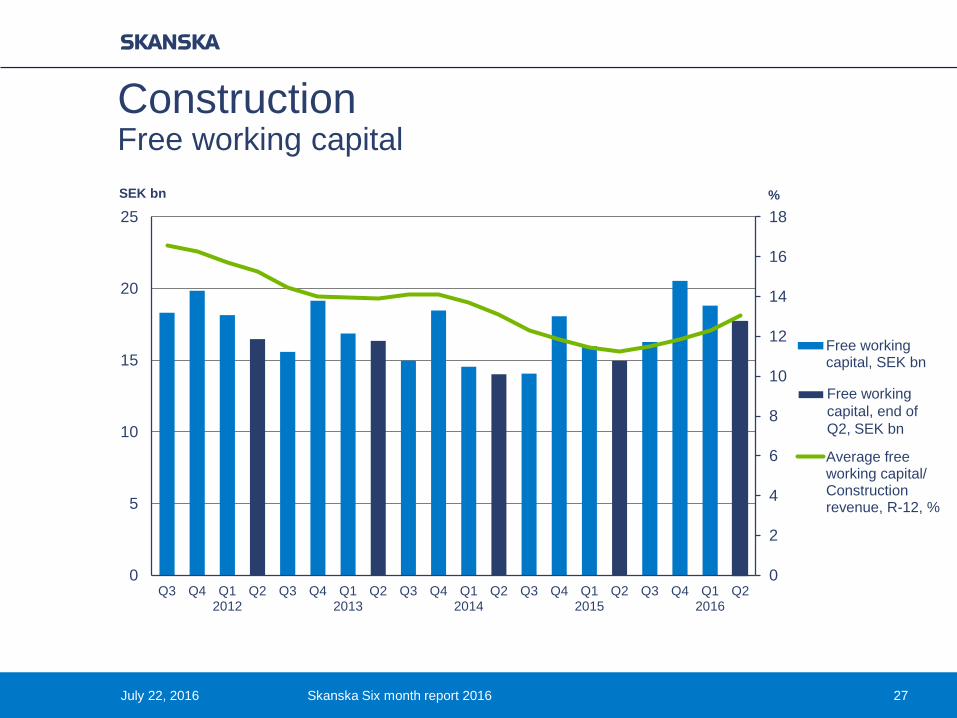
Construction Free working capital
July 22, 2016 Skanska Six month report 2016 27
0
2
4
6
8
10
12
14
16
18
0
5
10
15
20
25
Q3 Q4 Q12012
Q2 Q3 Q4 Q12013
Q2 Q3 Q4 Q12014
Q2 Q3 Q4 Q12015
Q2 Q3 Q4 Q12016
Q2
%SEK bn
Free workingcapital, SEK bn
Average freeworking capital/Constructionrevenue, R-12, %
Free working capital, end of Q2, SEK bn
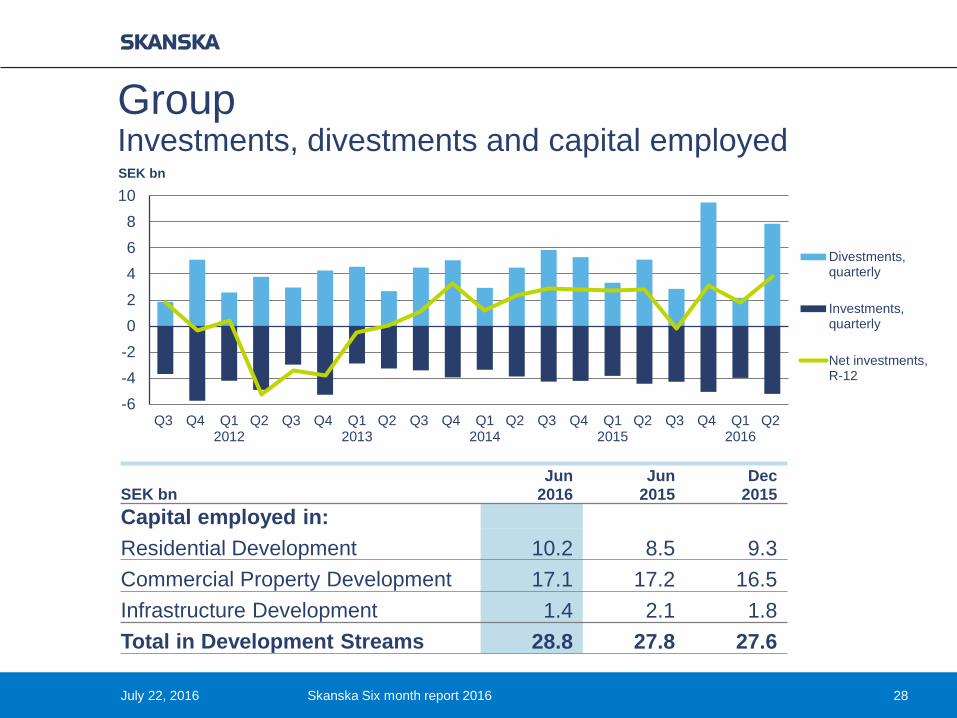
-6-4-202468
10
Q3 Q4 Q12012
Q2 Q3 Q4 Q12013
Q2 Q3 Q4 Q12014
Q2 Q3 Q4 Q12015
Q2 Q3 Q4 Q12016
Q2
SEK bn
Divestments,quarterly
Investments,quarterly
Net investments,R-12
July 22, 2016 Skanska Six month report 2016 28
GroupInvestments, divestments and capital employed
SEK bnJun
2016Jun
2015Dec
2015Capital employed in:Residential Development 10.2 8.5 9.3 Commercial Property Development 17.1 17.2 16.5 Infrastructure Development 1.4 2.1 1.8 Total in Development Streams 28.8 27.8 27.6
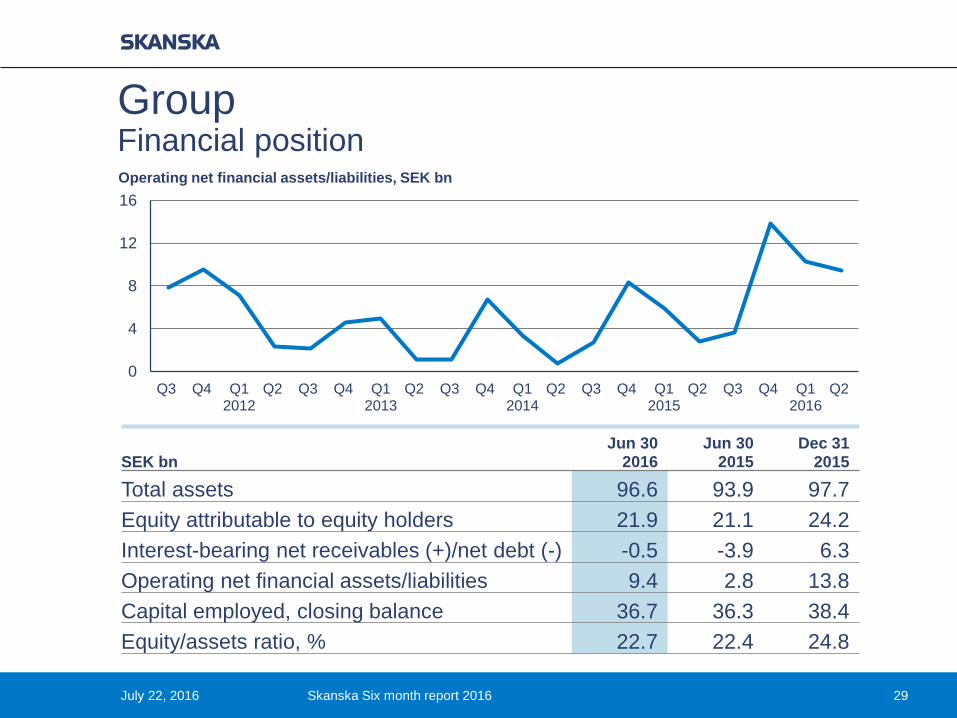
0
4
8
12
16
Q3 Q4 Q12012
Q2 Q3 Q4 Q12013
Q2 Q3 Q4 Q12014
Q2 Q3 Q4 Q12015
Q2 Q3 Q4 Q12016
Q2
Operating net financial assets/liabilities, SEK bn
Group Financial position
July 22, 2016 Skanska Six month report 2016 29
SEK bnJun 30
2016Jun 30
2015Dec 31
2015
Total assets 96.6 93.9 97.7 Equity attributable to equity holders 21.9 21.1 24.2 Interest-bearing net receivables (+)/net debt (-) -0.5 -3.9 6.3 Operating net financial assets/liabilities 9.4 2.8 13.8 Capital employed, closing balance 36.7 36.3 38.4 Equity/assets ratio, % 22.7 22.4 24.8
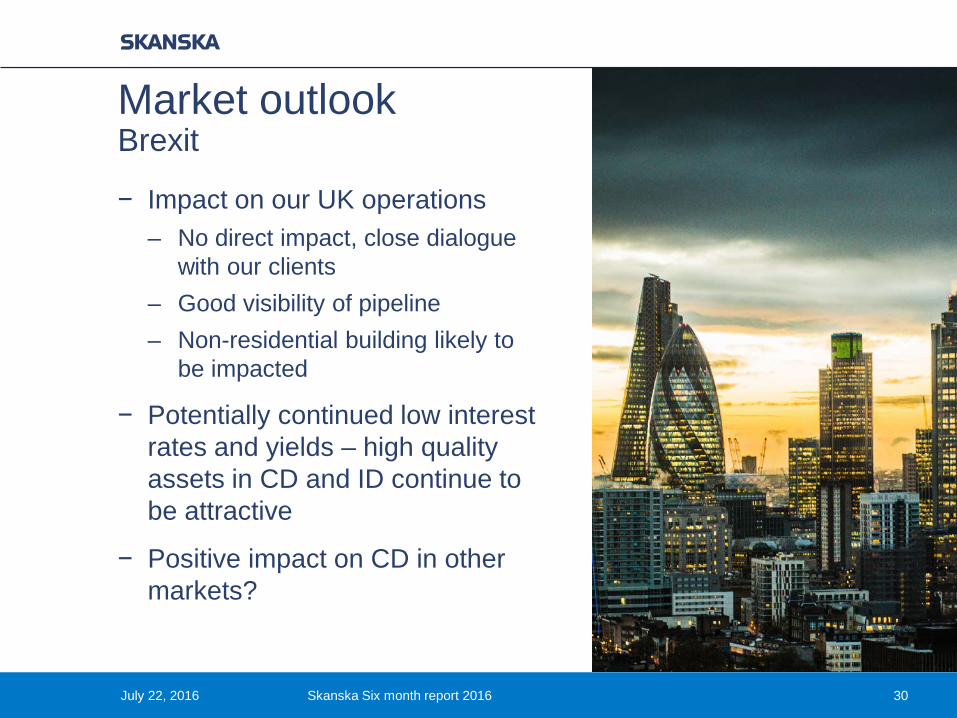
− Impact on our UK operations – No direct impact, close dialogue
with our clients– Good visibility of pipeline – Non-residential building likely to
be impacted
− Potentially continued low interest rates and yields – high quality assets in CD and ID continue to be attractive
− Positive impact on CD in other markets?
July 22, 2016 Skanska Six month report 2016 30
Market outlook Brexit
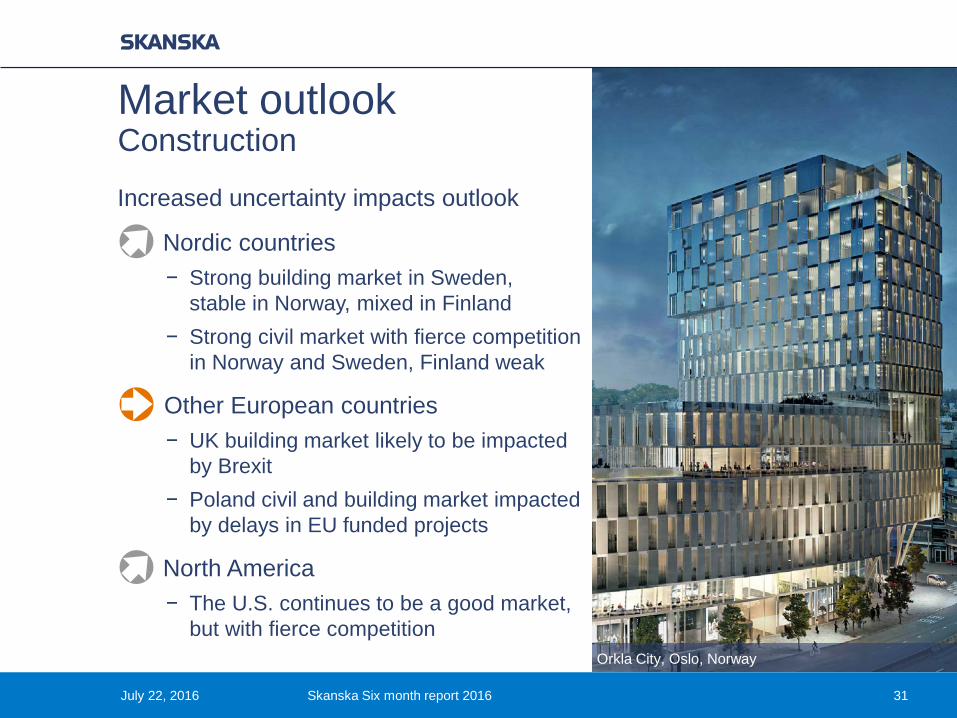
Increased uncertainty impacts outlook
Nordic countries− Strong building market in Sweden,
stable in Norway, mixed in Finland− Strong civil market with fierce competition
in Norway and Sweden, Finland weak
Other European countries− UK building market likely to be impacted
by Brexit − Poland civil and building market impacted
by delays in EU funded projects
North America − The U.S. continues to be a good market,
but with fierce competition
July 22, 2016 Skanska Six month report 2016
Market outlook Construction
Orkla City, Oslo, Norway
31
General− Challenge to acquire land in all home
markets except for Finland
Nordic countries− Sweden very strong. A more balanced
market with amortization regulations− Norway mixed, Oslo and Bergen good− Finland stable
Central Europe− Volumes and prices continue to
increase
BoKlok Lingonriset, Huddinge, Sweden
July 22, 2016 Skanska Six month report 2016 32
Market outlook Residential Development

General− Tenants and investors: Strong demand,
vacancy rates low− Brexit potentially positive impact
Nordic countries− High interest from investors and low
vacancy rates in Sweden especially
Central Europe− High demand in Poland and improving
in other parts of Central Europe
North America− Strong investor appetite and good
tenant demandSpark, Warsaw, Poland
July 22, 2016 Skanska Six month report 2016 33
Market outlook Commercial PropertyDevelopment
All countries− Strong market for PPPs in the U.S.,
but competition is considerable− Norwegian market improving − Thin pipeline in the other markets
New Karolinska Solna, Stockholm, Sweden
July 22, 2016 Skanska Six month report 2016 34
Market outlook Infrastructure Development

July 22, 2016 Skanska Six month report 2016 35


