

S K Akram Basha and Dr. B. Chanrda Mohan Reddy, International Journal of Research in Engineering, IT and
Social Sciences, ISSN 2250-0588, Impact Factor: 6.565, Volume 09 Issue 06, June 2019, Page 325-346
http://indusedu.org Page 325
This work is licensed under a Creative Commons Attribution 4.0 International License
Six Sigma-DMAIC Approach for
Improving Quality of Sinter at Sinter plant
S K Akram Basha1 and Dr. B. Chandra Mohan Reddy
2
1(M.Tech, Quality Engineering and Management, JNTU college of engineering, Ananthapuramu, Andhra
Pradesh, India) 2(Associate Professor of Mechanical Engineering, JNTU college of engineering, Ananthapuramu, Andhra
Pradesh, India)
Abstract: Blast furnace uses Iron bearing material like Sinter (70%), Pellet (15%) and Calibrate Ore (15%)
for producing Hot Metal. Sinter is produced in sinter plants and transported through a series of conveyors and
stored in Blast Furnace stock house. Sinter size requirement for charging in Blast furnace is 5-40mm (Blast
furnace feed) and deviations from range as required by Blast Furnace will cause the Sinter Plant Fines, which
adversely influence smooth Blast furnace operation. Undersize fraction <5mm is called Sinter Return Fines,
which is a rejection generated after screening in Blast Furnace stock house. It is sent back to Sinter Plant for
re-cycling. One of the challenges of Quality Assurance is to ensure higher sinter proportion in Blast Furnaces.
Sinter fines generation depends upon process parameters and number of falls in the transportation route. High
rejection of blast furnace affects on the sinter yield.
The main aim of this work is to identify and control the critical process parameters which are contributing to
generation of higher return files by SIX SIGMA TOOLS through DMAIC Process. Apart from this the area
where sinter degradation is more studied and improved.
Keywords: Sinter Plant, Sinter Physical and Chemical Properties, Six Sigma, Statistical Quality Control
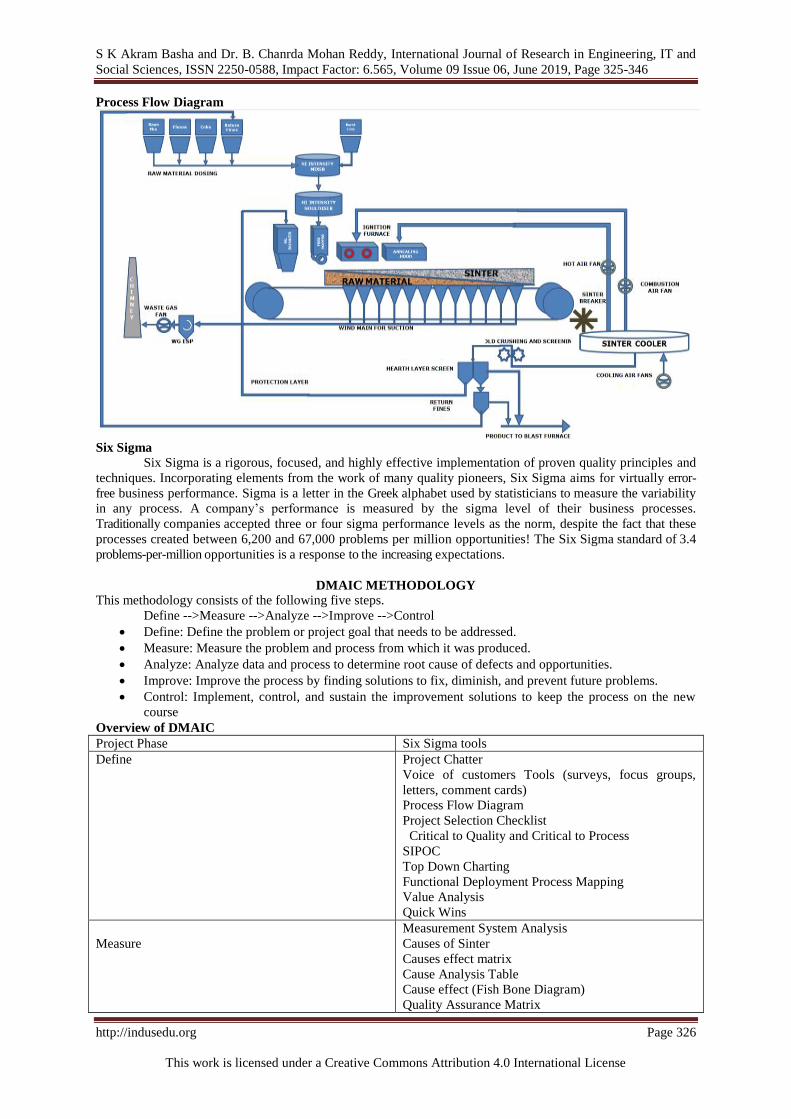
I. INTRODUCTION TO SINTER PLANT It is an Agglomeration process, in which incipient fusion of the iron ore fines takes place in the
presence of flux and solid fuel. The product of the process will be a hard, porous and lumpy mass. Sinter is a
porous and lumpy mass of Iron Oxides in Agglomeration process. Sinter plants agglomerate Iron Ore Fines with
addition of flux and solid fuel. Sinter gets partially reduced with the available solid fuel and deficit oxygen.
With the addition flux content, softening and melting point comes down and raw flux addition is minimized
lowering in the fuel requirement at Blast Furnace as compare to the other Iron bearing materials. Due to the
prepared burden, Blast Furnace productivity improves. Sintering is process of agglomeration of ore fines by
fusion of ore particles due to combustion heat of solid fuel (coke, coal etc.) present in the mix. Fines generated
during mining and beneficiation of iron ores cannot be charged directly into Blast Furnace, the sintering of such
fines makes it usable and desirable Blast Furnace feed. Sintering is a heat exchange process. In a static sinter
bed there are various zones like; cold sinter, hot sinter, combustion zone, preheating zone, drying zone and cold
charge. There is a downward movement of each zone with the forward movement of the pellet throughout the
entire length during sintering. Inconsistency of input raw material is avoided by processing required input
through Sinter. Consistent Sinter chemistry, physical & high temperature properties helps in smooth Blast
Furnace operation Sintering is process of agglomeration of ore fines by fusion of ore particles due to combustion
heat of solid fuel (coke, coal etc.) present in the mix. Fines generated during mining and beneficiation of iron
ores cannot be charged directly into Blast Furnace, the sintering of such fines makes it usable and desirable
Blast Furnace feed. Typical raw material characteristics are given below:
Iron ore fines:-Total Fe-56%, FeO-9%, Fe-10%, SiO2-4.5%, CaO-9%, MgO-2%, Al2O3-2.5%, CaO/SiO2- 2.0
Typical Physical Properties of Sinter are given below:
-5 mm< 8.0%, Cum+10-65%, MP-18 mm, Tumbler Index> 75.50, RDI< 25%
BFRF (Blast Furnace Return Fines): Rejection of Fines from Blast Furnace generated after sinter screening at
stock house (+5 MM to 40MM) sinter size will be screened at Blast Furnace.<5MM size will be screened out
and sent back to sinter through conveyers
<5mm Fraction:-5mm is less than 5mm fraction in sinter product which is not required by the customer (Blast
Furnace). -5mm fraction is screened out from sinter in return fines screen before sending to Blast Furnace
Internal Return fines: Internal return fines are fines which are screened at -5mm at Sinter plant and again -5mm
used in the sinter making.
S K Akram Basha and Dr. B. Chanrda Mohan Reddy, International Journal of Research in Engineering, IT and
Social Sciences, ISSN 2250-0588, Impact Factor: 6.565, Volume 09 Issue 06, June 2019, Page 325-346
http://indusedu.org Page 326
This work is licensed under a Creative Commons Attribution 4.0 International License
Process Flow Diagram
Six Sigma
Six Sigma is a rigorous, focused, and highly effective implementation of proven quality principles and
techniques. Incorporating elements from the work of many quality pioneers, Six Sigma aims for virtually error-
free business performance. Sigma is a letter in the Greek alphabet used by statisticians to measure the variability
in any process. A company’s performance is measured by the sigma level of their business processes.
Traditionally companies accepted three or four sigma performance levels as the norm, despite the fact that these
processes created between 6,200 and 67,000 problems per million opportunities! The Six Sigma standard of 3.4
problems-per-million opportunities is a response to the increasing expectations.
DMAIC METHODOLOGY
This methodology consists of the following five steps.
Define -->Measure -->Analyze -->Improve -->Control
Define: Define the problem or project goal that needs to be addressed.
Measure: Measure the problem and process from which it was produced.
Analyze: Analyze data and process to determine root cause of defects and opportunities.
Improve: Improve the process by finding solutions to fix, diminish, and prevent future problems.
Control: Implement, control, and sustain the improvement solutions to keep the process on the new
course
Overview of DMAIC
Project Phase Six Sigma tools
Define
Project Chatter
Voice of customers Tools (surveys, focus groups,
letters, comment cards)
Process Flow Diagram
Project Selection Checklist
Critical to Quality and Critical to Process
SIPOC
Top Down Charting
Functional Deployment Process Mapping
Value Analysis
Quick Wins
Measure
Measurement System Analysis
Causes of Sinter
Causes effect matrix
Cause Analysis Table
Cause effect (Fish Bone Diagram)
Quality Assurance Matrix

S K Akram Basha and Dr. B. Chanrda Mohan Reddy, International Journal of Research in Engineering, IT and
Social Sciences, ISSN 2250-0588, Impact Factor: 6.565, Volume 09 Issue 06, June 2019, Page 325-346
http://indusedu.org Page 327
This work is licensed under a Creative Commons Attribution 4.0 International License
WHY-WHY Analysis
Analysis
Hypothesis Testing
Correlation
Scatter plot
Regression
Simple linear regression
Multiple linear regression
Improve Kaizens
Control Standard operating procedure
Poke-yoke
Control Plan
PFMEA ( Process Failure Mode Effects Analysis )
1) Define: The Define phase to clearly define the business problem, goal, statements, level of the project
standards, and voice of customer. Define the goals of the improvement activity
a) Project charter: Project charter gives overview idea in one single chart the official plan and
authorization for the project is summarized in the Six Sigma Project Charter. The Project Charter is a
contract between the project team and its sponsor. As such, any changes in the critical elements of
scope, objectives, or schedule require approval from the sponsor and consensus of the team.
Project Title: Six Sigma–DMAIC Approach for Improving Quality of Sinter at Sinter plant
Business Case: Opportunity statement:
This project results in reduction of sinter cost by reducing rejections at Blast
Furnaces. Rejections of Sinter is reduced by improving Sinter quality
Tumbler index sinter is 75.2
against plan of 75.5 %
Goal Statement Project Scope
Metric Current level Target Target date
% 75.2 75.5 15.01.2019
Team selection
Project Guide: Dr. B.Chandra Mohana Reddy M.Tech, Ph.D
Member: Mr. Akram Basha
Process under Improvement:
Sinter Plant-3
Starts with: Input Raw
Material receiving area at
Sinter Plant -3
Ends with: 9.022 Conveyor
b) Critical to Quality and Critical to Process
Critical to Quality: It’s to meet the customer requirements and satisfy the customer and also improve the quality
parameters.
Critical to Process: It’s the process of input parameters this are variables which are critical approaches the like
critical to Quality, critical to Delivery, critical to Cost
Voice of Customer Customer Issues Current Level Critical to process
Sinter tumbler index should
be greater than 75.50 and
<5mm fraction in sinter
should be less than 8%
More rejections of sinter at
stock house due to higher % of
<5mm fraction and degradation
SP-3 to BF-3&4
75.2 Average of
Tumbler index
in Sinter Plant
CaO %i n sinter 11.7 to
11.9 Burn through
temperature should be more
than 330 Deg C
c) SIPOC
SL.NO Supplier Input Process Output Customer
1
RHMS Base Mix, Flux
and core
Storage of Raw
Material
Raw Material Dosing plant
2 Dosing plant
Raw material Proportioning
of raw materials
Raw Material 1.063 conveyor
3 1.063 conveyor
Lime Feeding
Granulator
Pump House
Raw material
Calcined Lime
Granulator
Dust
Water
Addition
Mixing of raw
materials
Mixed
Material with
moisture
2.004 conveyor
S K Akram Basha and Dr. B. Chanrda Mohan Reddy, International Journal of Research in Engineering, IT and
Social Sciences, ISSN 2250-0588, Impact Factor: 6.565, Volume 09 Issue 06, June 2019, Page 325-346
http://indusedu.org Page 328
This work is licensed under a Creative Commons Attribution 4.0 International License
4 2.004
conveyor
Pump house
Mixed
Material with
moisture
Water addition
Nodulizing
Green Mix
2.008
Conveyor
5 2.008 Conveyor
Green Mix
Feeding
Green Mix
material
Feed Hopper
6 Feed hopper Green mix
material
Sintering Hot sinter Cooler
7
Cooler Hot sinter Cooling Sinter
<80 degree .C
Hearth layer
screen
Return fines
screen
8 Hearth layer
screen
Return fines screen
Sinter
<80 degree .C
Sinter size
<10mm
Hearth layer
screening
Return fines
screening
Sinter size
>10mm
Sinter size
from 5 to 10
mm
Blast Furnaces
or storage bins
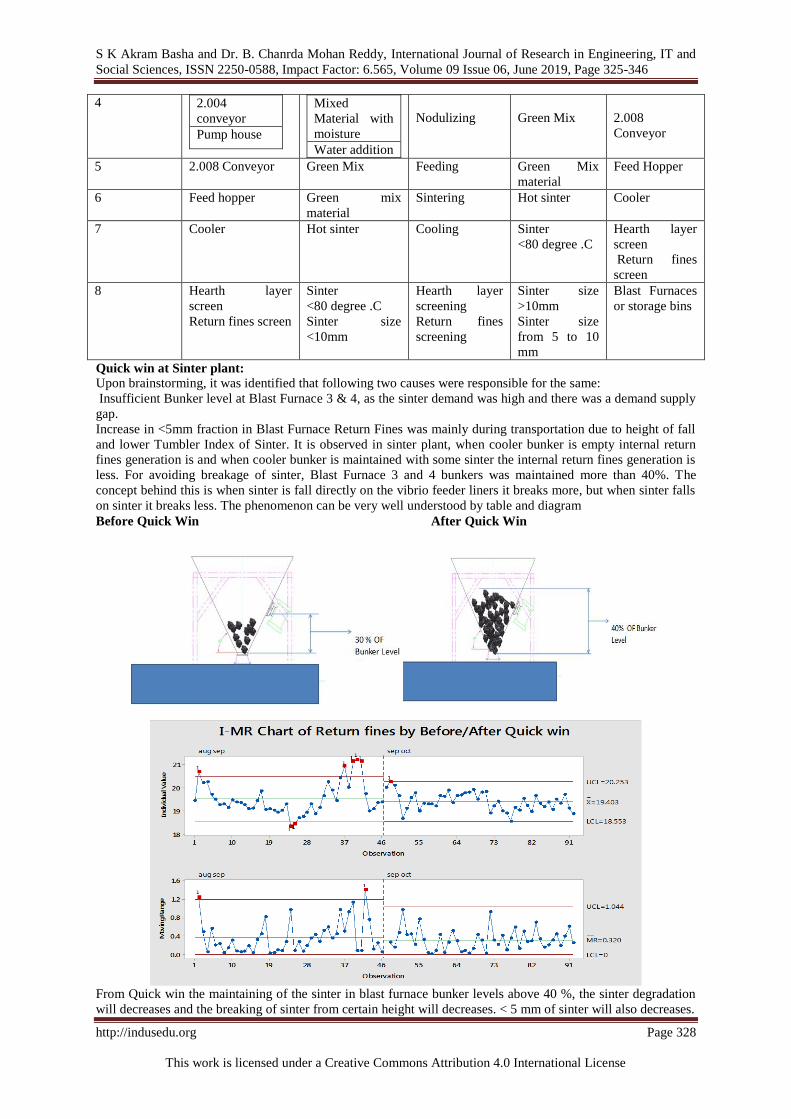
Quick win at Sinter plant:
Upon brainstorming, it was identified that following two causes were responsible for the same:
Insufficient Bunker level at Blast Furnace 3 & 4, as the sinter demand was high and there was a demand supply
gap.
Increase in <5mm fraction in Blast Furnace Return Fines was mainly during transportation due to height of fall
and lower Tumbler Index of Sinter. It is observed in sinter plant, when cooler bunker is empty internal return
fines generation is and when cooler bunker is maintained with some sinter the internal return fines generation is
less. For avoiding breakage of sinter, Blast Furnace 3 and 4 bunkers was maintained more than 40%. The
concept behind this is when sinter is fall directly on the vibrio feeder liners it breaks more, but when sinter falls
on sinter it breaks less. The phenomenon can be very well understood by table and diagram
Before Quick Win After Quick Win
From Quick win the maintaining of the sinter in blast furnace bunker levels above 40 %, the sinter degradation
will decreases and the breaking of sinter from certain height will decreases. < 5 mm of sinter will also decreases.
S K Akram Basha and Dr. B. Chanrda Mohan Reddy, International Journal of Research in Engineering, IT and
Social Sciences, ISSN 2250-0588, Impact Factor: 6.565, Volume 09 Issue 06, June 2019, Page 325-346
http://indusedu.org Page 329
This work is licensed under a Creative Commons Attribution 4.0 International License
2) Measure Phase: Measure the problem and process from which it was produced, Establish the process
baseline to quantify the current operating results as a means of verifying previously-defined business
needs, and to properly substantiate improvement results. Evaluate measurement system: to validate the
reliability of data for drawing meaningful conclusions.
An argument can be made for asserting that quality begins with measurement. Only when
quality is quantified, can meaningful discussion about improvement begin.
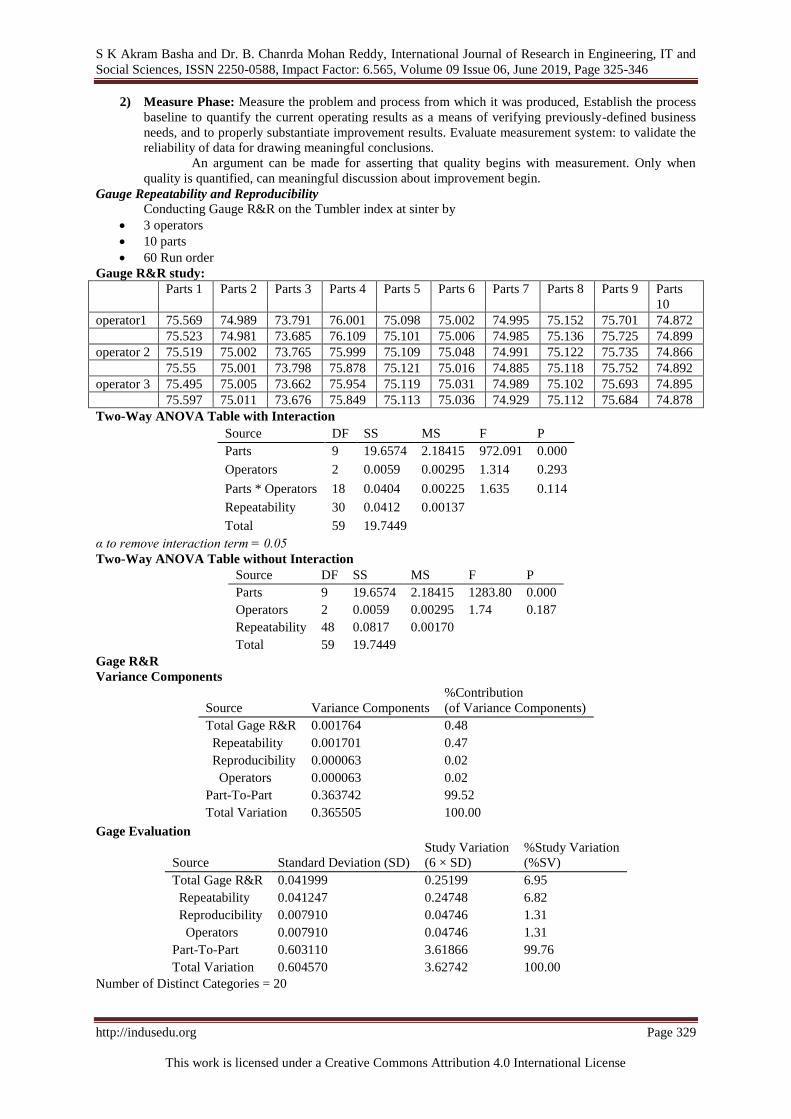
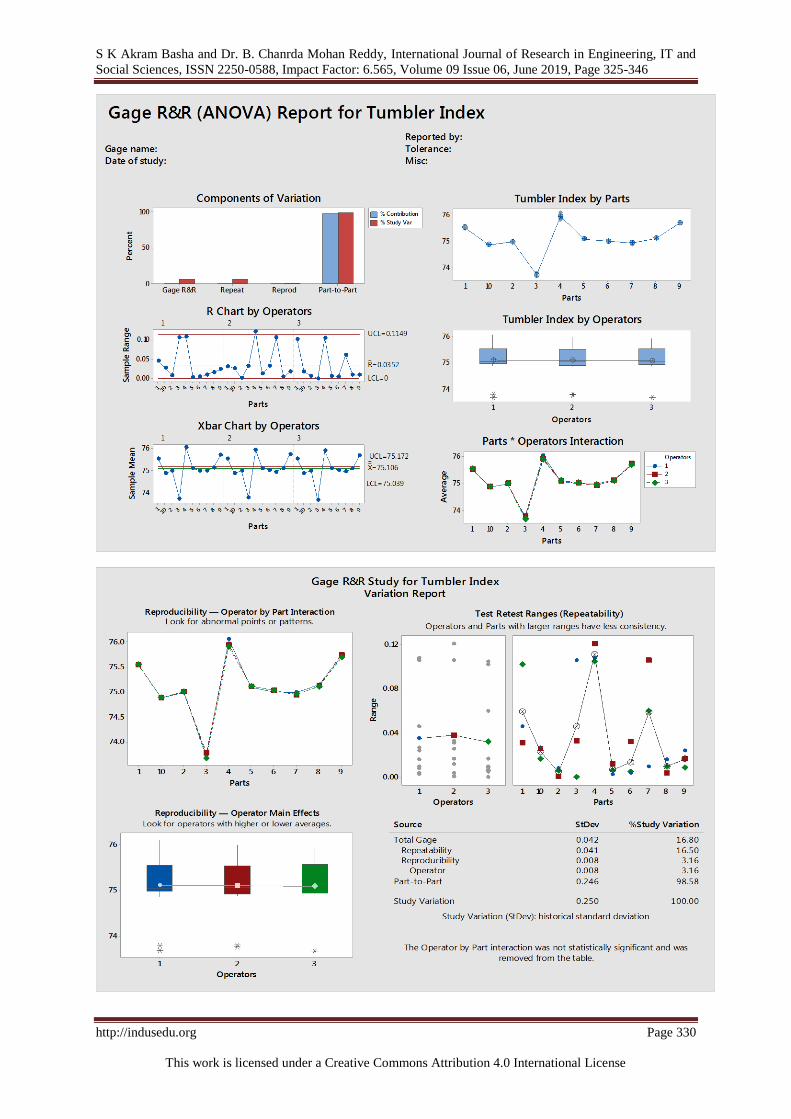
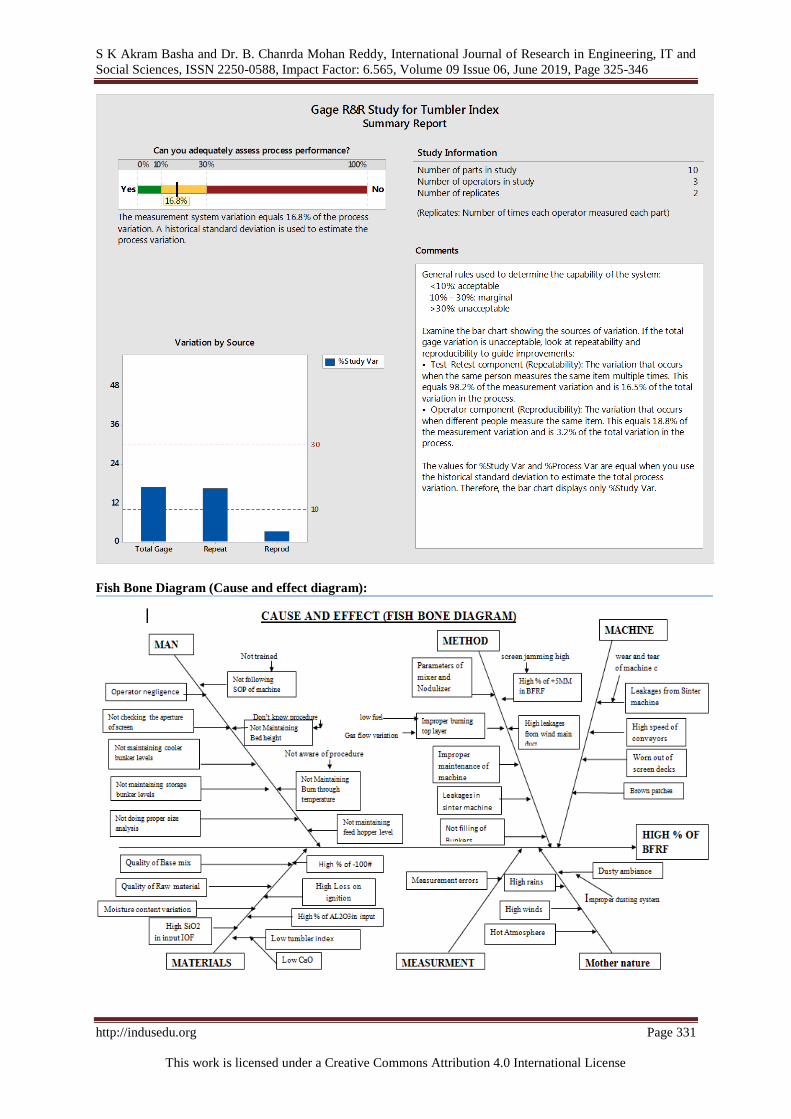
Gauge Repeatability and Reproducibility
Conducting Gauge R&R on the Tumbler index at sinter by
3 operators
10 parts
60 Run order
Gauge R&R study:
Parts 1 Parts 2 Parts 3 Parts 4 Parts 5 Parts 6 Parts 7 Parts 8 Parts 9 Parts
10
operator1 75.569 74.989 73.791 76.001 75.098 75.002 74.995 75.152 75.701 74.872
75.523 74.981 73.685 76.109 75.101 75.006 74.985 75.136 75.725 74.899
operator 2 75.519 75.002 73.765 75.999 75.109 75.048 74.991 75.122 75.735 74.866
75.55 75.001 73.798 75.878 75.121 75.016 74.885 75.118 75.752 74.892
operator 3 75.495 75.005 73.662 75.954 75.119 75.031 74.989 75.102 75.693 74.895
75.597 75.011 73.676 75.849 75.113 75.036 74.929 75.112 75.684 74.878
Two-Way ANOVA Table with Interaction
Source DF SS MS F P
Parts 9 19.6574 2.18415 972.091 0.000
Operators 2 0.0059 0.00295 1.314 0.293
Parts * Operators 18 0.0404 0.00225 1.635 0.114
Repeatability 30 0.0412 0.00137
Total 59 19.7449
α to remove interaction term = 0.05
Two-Way ANOVA Table without Interaction
Source DF SS MS F P
Parts 9 19.6574 2.18415 1283.80 0.000
Operators 2 0.0059 0.00295 1.74 0.187
Repeatability 48 0.0817 0.00170
Total 59 19.7449
Gage R&R
Variance Components
Source Variance Components
%Contribution
(of Variance Components)
Total Gage R&R 0.001764 0.48
Repeatability 0.001701 0.47
Reproducibility 0.000063 0.02
Operators 0.000063 0.02
Part-To-Part 0.363742 99.52
Total Variation 0.365505 100.00
Gage Evaluation
Source Standard Deviation (SD)
Study Variation
(6 × SD)
%Study Variation
(%SV)
Total Gage R&R 0.041999 0.25199 6.95
Repeatability 0.041247 0.24748 6.82
Reproducibility 0.007910 0.04746 1.31
Operators 0.007910 0.04746 1.31
Part-To-Part 0.603110 3.61866 99.76
Total Variation 0.604570 3.62742 100.00
Number of Distinct Categories = 20
S K Akram Basha and Dr. B. Chanrda Mohan Reddy, International Journal of Research in Engineering, IT and
Social Sciences, ISSN 2250-0588, Impact Factor: 6.565, Volume 09 Issue 06, June 2019, Page 325-346
http://indusedu.org Page 330
This work is licensed under a Creative Commons Attribution 4.0 International License
S K Akram Basha and Dr. B. Chanrda Mohan Reddy, International Journal of Research in Engineering, IT and
Social Sciences, ISSN 2250-0588, Impact Factor: 6.565, Volume 09 Issue 06, June 2019, Page 325-346
http://indusedu.org Page 331
This work is licensed under a Creative Commons Attribution 4.0 International License
Fish Bone Diagram (Cause and effect diagram):

S K Akram Basha and Dr. B. Chanrda Mohan Reddy, International Journal of Research in Engineering, IT and
Social Sciences, ISSN 2250-0588, Impact Factor: 6.565, Volume 09 Issue 06, June 2019, Page 325-346
http://indusedu.org Page 332
This work is licensed under a Creative Commons Attribution 4.0 International License
3) Analyses Phase: The Analyze deliverable is the choice of the high-level design concept to be created.
The design is ‘‘best’’ in the sense that it best meets the Critical to Quality. To accomplish this feat, we
must somehow link the Critical to Quality to features of the design.
Hypothesis Testing: The method of testing a hypothesis by comparing it with the null hypothesis. The
null hypothesis is only rejected its probability falls below a predetermined significance level, the
hypothesis being tested is said to have that level of significance.
2 Sample T test for the Tumbler index for the month of October and November
October
Tumbler
index
November
Tumbler
index
75.10 75.23 74.57 75.80 76.67 76.05 75.83 76.03 75.13 75.03
75.43 75.33 75.93 76.30 76.53 75.60 75.57 75.83 75.13 75.55
74.83 74.97 75.57 76.13 75.10 75.83 75.85 75.37 75.60 75.17
75.17 75.01 75.57 75.97 75.27 75.73 76.00 75.80 75.97 75.98
75.80 75.21 75.67 75.27 74.53 75.37 76.13 75.07 75.27 75.50
75.27 75.00 75.50 75.90 75.23 75.45 76.20 75.27 75.53 75.40
75.20 75.96 75.27 75.33 75.03 75.70 75.83 75.10 75.77 75.47
75.20 75.23 75.10 75.13 75.80 75.59 75.83 75.07 74.90 75.23
74.97 75.77 74.77 74.60 74.80 76.03 76.13 75.43 75.00 75.07
74.70 75.97 75.23 76.33 75.23 75.07 76.20 75.70 75.37 76.58
74.60 75.73 76.17 76.40 75.27 76.02 75.83 75.00 75.50 75.10
74.20 74.77 75.20 75.77 75.67 76.03 75.83 75.98 76.58 75.23
76.13 76.33 75.70 75.30 75.30 75.13 76.13 75.20 75.37 75.83
75.63 75.70 74.83 75.47 75.50 75.23 75.87 75.36 75.70 76.20
74.90 75.57 76.20 75.27 75.33 75.03 75.67 75.73
74.90 76.30 76.67 75.80 75.43 75.37 75.89 75.65
74.83 75.77 75.63 76.50 76.03 75.70 75.60 76.23
75.80 75.50 74.80 76.43 74.93 76.27 76.52 76.13
75.17 75.73 76.10 75.38 75.53 75.67 75.23 75.67

S K Akram Basha and Dr. B. Chanrda Mohan Reddy, International Journal of Research in Engineering, IT and
Social Sciences, ISSN 2250-0588, Impact Factor: 6.565, Volume 09 Issue 06, June 2019, Page 325-346
http://indusedu.org Page 333
This work is licensed under a Creative Commons Attribution 4.0 International License
Correlation for Tumbler index v/s CaO, Al2O3, Return Fines
3.53.43.33.23.13.0
77.0
76.5
76.0
75.5
75.0
74.5
74.0
S 0.463557
R-Sq 3.9%
R-Sq(adj) 3.1%
Al2o3
T.I
Fitted Line PlotT.I = 78.21 - 0.9003 Al2o3
Correlation is negative side which r value is = -0.10723
Regression Analysis: Tumbler index versus Al2o3
The regression equation is
T.I = 78.21 - 0.9003 Al2o3

S K Akram Basha and Dr. B. Chanrda Mohan Reddy, International Journal of Research in Engineering, IT and
Social Sciences, ISSN 2250-0588, Impact Factor: 6.565, Volume 09 Issue 06, June 2019, Page 325-346
http://indusedu.org Page 334
This work is licensed under a Creative Commons Attribution 4.0 International License
12.212.112.011.911.811.711.611.511.411.3
77.0
76.5
76.0
75.5
75.0
74.5
74.0
S 0.465480
R-Sq 3.1%
R-Sq(adj) 2.3%
CaO
T.I
Fitted Line PlotT.I = 69.28 + 0.5133 CaO
Correlation is positive side which r value is = 0.151848
Regression Analysis: Tumbler index versus CaO
The regression equation is
T.I = 69.28 + 0.5133 CaO
2221201918
77.0
76.5
76.0
75.5
75.0
74.5
74.0
S 0.450125
R-Sq 9.4%
R-Sq(adj) 8.6%
RF
T.I
Fitted Line PlotT.I = 79.00 - 0.1884 RF
From above figure we can conclude that there is negative correlation between Blast Furnace Return Fines and
Tumbler index.
Blast Furnace Return Fines Due to the low Tumble index is main effect is causing at Blast Furnace.
Regression Analysis: Tumbler index versus RF
The regression equation is
T.I = 79.00 - 0.1884 RF
4) Improve Phase:
The primary objective of the Improve or Design stage of DMAIC/DMADV is to implement
the new system. The first consideration is to prioritize the various opportunities, if more than one
proposal exists. Once a preferred approach has been determined, the new process or product design is
defined and optimal settings. This new design can then be evaluated for risks and potential failure
modes.
Kaizen:
Kaizen is a Japanese word. Kai means Change and zen means good. Small changes system can lead to
big improvement in industrial areas. To get effective results and sustain the process the kaizen plays a major role
Kaizen can be performed by an individual or group of people (Small Group Activities or Quality Circles)
S K Akram Basha and Dr. B. Chanrda Mohan Reddy, International Journal of Research in Engineering, IT and
Social Sciences, ISSN 2250-0588, Impact Factor: 6.565, Volume 09 Issue 06, June 2019, Page 325-346
http://indusedu.org Page 335
This work is licensed under a Creative Commons Attribution 4.0 International License
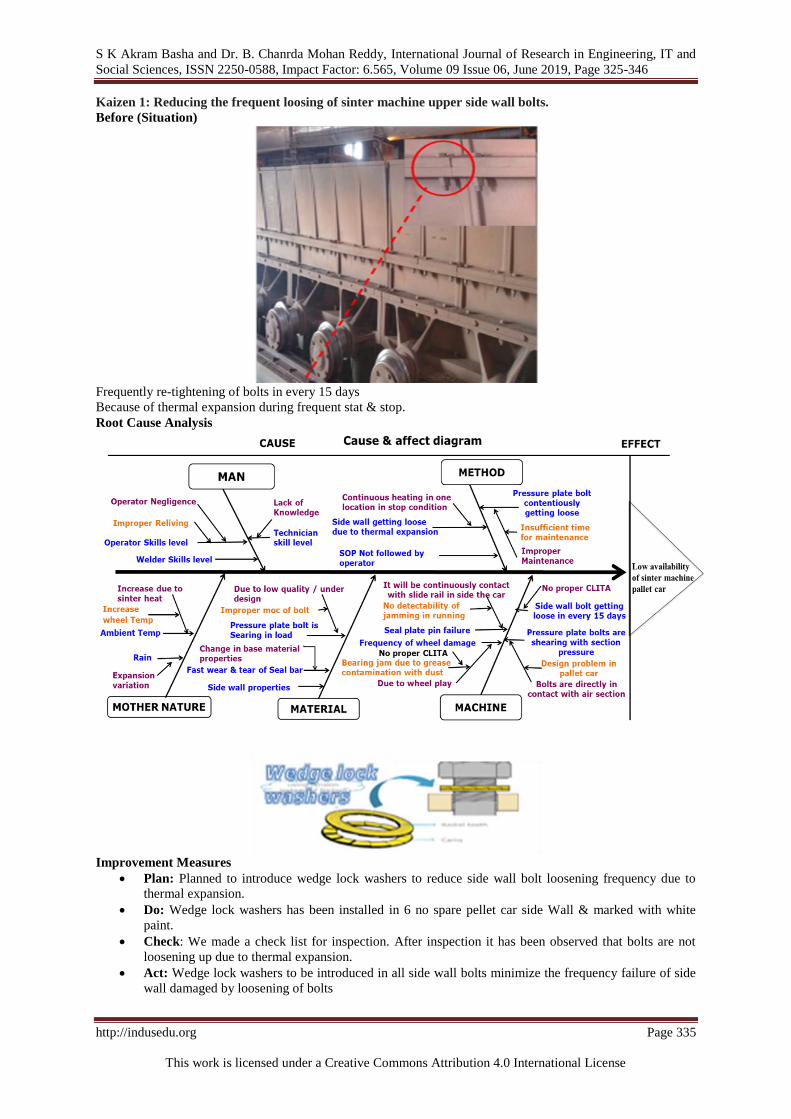
Kaizen 1: Reducing the frequent loosing of sinter machine upper side wall bolts.
Before (Situation)
Frequently re-tightening of bolts in every 15 days
Because of thermal expansion during frequent stat & stop.
Root Cause Analysis
Improvement Measures
Plan: Planned to introduce wedge lock washers to reduce side wall bolt loosening frequency due to
thermal expansion.
Do: Wedge lock washers has been installed in 6 no spare pellet car side Wall & marked with white
paint.
Check: We made a check list for inspection. After inspection it has been observed that bolts are not
loosening up due to thermal expansion.
Act: Wedge lock washers to be introduced in all side wall bolts minimize the frequency failure of side
wall damaged by loosening of bolts
S K Akram Basha and Dr. B. Chanrda Mohan Reddy, International Journal of Research in Engineering, IT and
Social Sciences, ISSN 2250-0588, Impact Factor: 6.565, Volume 09 Issue 06, June 2019, Page 325-346
http://indusedu.org Page 336
This work is licensed under a Creative Commons Attribution 4.0 International License
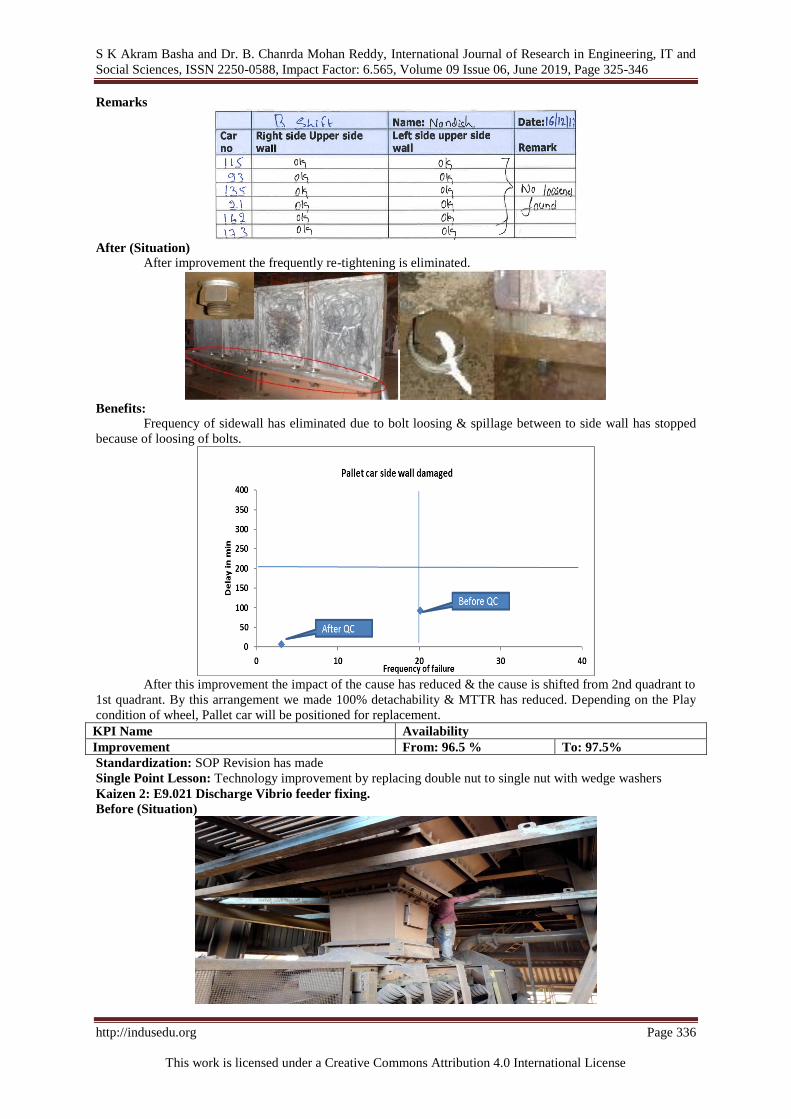
Remarks
After (Situation)
After improvement the frequently re-tightening is eliminated.
Benefits:
Frequency of sidewall has eliminated due to bolt loosing & spillage between to side wall has stopped
because of loosing of bolts.
After this improvement the impact of the cause has reduced & the cause is shifted from 2nd quadrant to
1st quadrant. By this arrangement we made 100% detachability & MTTR has reduced. Depending on the Play
condition of wheel, Pallet car will be positioned for replacement.
KPI Name Availability
Improvement From: 96.5 % To: 97.5%
Standardization: SOP Revision has made
Single Point Lesson: Technology improvement by replacing double nut to single nut with wedge washers
Kaizen 2: E9.021 Discharge Vibrio feeder fixing.
Before (Situation)

S K Akram Basha and Dr. B. Chanrda Mohan Reddy, International Journal of Research in Engineering, IT and
Social Sciences, ISSN 2250-0588, Impact Factor: 6.565, Volume 09 Issue 06, June 2019, Page 325-346
http://indusedu.org Page 337
This work is licensed under a Creative Commons Attribution 4.0 International License
E9.022 belt was tripped frequently in overload because of hopper material & warn out rapidly because
of sinter fall from height. More overload cause to damage to break down the sinter.
Root Cause Analysis:
By Brainstorming the Root cause analysis has been identified by the Fish bone diagram in this case in
the METHOD mode causes the effect of Discharge pipe line jamming & spillage the material.
1) The pipe lines are not in straight condition
2) The material discharge not in belt centre
3) Discharge pipe line size is so small
Improvement Measures
By using the Plan-Do-Check-Act
Plan: To avoid the conveyor belt over load.
Do: To install the vibrofeder in between hopper and conveyor.
Check: To check the probability and approach.
Act: To install the vibrofeder and check discharge
After (Situation):
After installing the vibrofeder the overload problem has solved, life span of belt of conveyer will
increases
Vibrofeder

S K Akram Basha and Dr. B. Chanrda Mohan Reddy, International Journal of Research in Engineering, IT and
Social Sciences, ISSN 2250-0588, Impact Factor: 6.565, Volume 09 Issue 06, June 2019, Page 325-346
http://indusedu.org Page 338
This work is licensed under a Creative Commons Attribution 4.0 International License
Benefits: 1) To avoid the conveyor overload.
2) To increase the conveyor belt life.
3) To reduce the belts wear out.
Kaizen 3: Blast Furnace Return Fines reduction by cooler segregation improvement
Before
Before the project the location of the gap between side walls to lower transfer chute is 450 mm. This gap cause
the sinter cooling is improper so the sinter degradation increases and < 5 mm increases more
After
After the project the location of the gap between side walls to lower transfer chute is200 mm. Reduce the gap
between side walls to lower transfer chute from 450 mm to 200 mm.
Segregation improved, mean of cooler discharge temperature decreased from 150 to 88 & tunnel pressure
slightly increased.
Kaizen 4: Sinter Cooler leakages reduction
A sinter plant takes fine ore and other materials, and fuses them together to produce sintered ore to
blast furnaces. A sinter plant can be divided into four parts
450 mm
200 mm

S K Akram Basha and Dr. B. Chanrda Mohan Reddy, International Journal of Research in Engineering, IT and
Social Sciences, ISSN 2250-0588, Impact Factor: 6.565, Volume 09 Issue 06, June 2019, Page 325-346
http://indusedu.org Page 339
This work is licensed under a Creative Commons Attribution 4.0 International License
23.222.421.620.820.0
14
12
10
8
6
4
2
0
Mean 21.17
StDev 0.7922
N 50
Pressure
mb
ar
Normal
Cooler Pressure
1. Raw material mixing system
2. Sinter machine
3. Sinter cooler
4. Sinter screening system
Before
18.016.815.614.413.212.0
12
10
8
6
4
2
0
Mean 15.48
StDev 1.404
N 50
Pressure.m
bar
Normal
Cooler Pressure
The cloth seal at the sinter cooler which is damage for so many times due to sinter pressure and it’s so
difficult to operator to recover with new cloth seal
After
Instead of cloth seal we use the metallic seal
Tunnel pressure mean was slightly increased from 15.48 to 21.17 mbar, after modification of cloth seal to
metallic sea
Control Phase: Implement, control, and sustain the improvement solutions to keep the process on the new
course. Control plan is a written summary of the systems for controlling the variation of all product and process
characteristics, important for quality and engineering requirements. It’s a contract between the supplier and
customer, the entire control strategy for a system, Sub system or component as the basics for development of a
process work instruction (SOP), Identify all customer specified characteristics.
Prototype
Pre-launch
Production
Cloth seal
Metallic seal

S K Akram Basha and Dr. B. Chanrda Mohan Reddy, International Journal of Research in Engineering, IT and
Social Sciences, ISSN 2250-0588, Impact Factor: 6.565, Volume 09 Issue 06, June 2019, Page 325-346
http://indusedu.org Page 340
This work is licensed under a Creative Commons Attribution 4.0 International License
Reduce variability, which leads to warranty costs, Increases productivity through Reduce down time, Reduce
setup
Fewer repairs, Efficient control, Optimized product costs, Improvement communications within a company,
Improvement communications between the organizations, it’s a customer and its suppliers
Provides emphasis on production, Provides a focus on process control, Promotes proactive planning, Provides
an entire picture of control, Promotes a continual improvement , Improve product quality
Standard operating Procedure (SOP):
For Sinter Quality Control has been revised
Title - Procedure for sintering process control
Objective: - To Achieve maximum productivity of sinter without affecting the quality or Endangering the plant
& equipment.
Responsibility: - Shift In-charge (Operations) Area 1 &2, Field operators & Control room operator.
General information: - Sintering process is designed to convert iron ore fines into product suitable for Blast
Furnace.
Raw material preparation: - Uniform size and desired quality of Iron ore fines, flux & fuel (- 3 mm of 90%)
is an essential aspects of raw material handling system.
1. Proportioning of raw material in weigh feeders: - Any deviations in set weights shall upset the
sintering process. Hence weigh feeder calibration (once in a three month)/ checks to be done regularly.
2. Mixing & Nodulizing: - Addition of moisture plays an important role in the process. Moisture for
good sintering process should be optimum. It can be more or less. Approximately 7 -8 % moisture of
total mix is desired in normal case & normal weather.
3. Feeding & segregation of raw mix onto sinter machine: -By varying the feed drum speed with
respect to sinter machine speed, green mix is fed to the sintering strand.
4. Ignition below the furnace: - Furnace temperature is controlled by maintaining desired gas & air
ratios depending on the Calorific value of the gas used.
5. Permeability of sinter mix on the bed: - It depends on mix charging to machine, segregation of mix,
Moisture in the mix etc.
6. Cooling of sinter and handling: - Cooling, crushing and screening the sinter to get the desired size for
Blast Furnace usage.
Procedure: -
1. Control room operator in consultation with the shift in charge sets the desired quality of raw material in
weigh feeders and moisture requirements in mixing & Nodulizing drum.
2. Weigh feeder and MND operators must check regularly the desired quality of raw material & moisture
in the mix is going to the machine.
3. Sinter machine operator must monitor feeding of hearth layer & raw mix on the strand.
4. Sinter machine operator must also monitor the discharge of the sinter at machine discharge end &
communicate the same to control room regularly & continuously.
5. 18mtr operator should monitor (with the help of control room operators for temperature reading
provided in DCS) the discharge temperature of the sinter at cooler discharge & communicate the same
to control room regularly & continuously.
6. Based on the feedbacks given by above mentioned operators control room operator shall increase/
decrease waste gas fan rpm to maintain the optimum machine speed?
7. Control room operator must continuously monitor the burn-through temperature and temperature
profile & pressure of wind boxes of the sinter machine. He must also monitor waste gas fan speed /
current, ESP inlet temperature / Pressure & ESP field operation and evacuation.
8. After the long shutdowns, sinter machine should be started at lower speed & gradually can increase the
speed of the machine based on the conditions available (Temperature / pressure).
9. During running of the machine, control room operator must record and monitor chemical & physical
analysis of sinter and other raw materials received from laboratory.
10. Corrective actions, if required, must be taken based on the desired analysis & the gap thereof.
Control room operator should monitor the generation of internal return fine continuously. This gives the
indication of the process set in.
Normally FeO, basicity & MgO in Sinter chemistry is monitored. In Blast Furnace requirement is as below and
it may vary also depending upon sinter burden in Blast Furnace.
FeO: - 9 – 10%, Basicity: - 2.1 – 2.3 & MgO: - 2.2 – 2.5.
These parameters are maintained as per the customer’s need & hence subject to change on demand.
1. To maintain FeO, following are to be checked.
2. Check the coke weigh feeder feeding in weigh feeder.
3. Check the size and quality of the coke breeze (FC>80%).
4. Check moisture in sinter mix (7.2% +-0.5)

S K Akram Basha and Dr. B. Chanrda Mohan Reddy, International Journal of Research in Engineering, IT and
Social Sciences, ISSN 2250-0588, Impact Factor: 6.565, Volume 09 Issue 06, June 2019, Page 325-346
http://indusedu.org Page 341
This work is licensed under a Creative Commons Attribution 4.0 International License
5. For any changes in material mix, changes in Solid fuel set point are required.
6. Observe physical appearance of Sinter discharge and Sinter in cooler for corrective action on Solid fuel
set point percentage in material mix.
7. Any correction is done to rectify FeO deviation, process has to be observed with an instantaneous
sample analysis before making any further correction.
8. For deviation in Basicity and MgO of sinter following are to be checked.
9. Check flux feeders, BFRF feeders, IRF feeders, Calcined lime feeders and Iron ore feeder.
10. Check for Flux size and quality.
11. Check for quality of Internal Return Fines and Blast Furnace Return Fines.
12. Changes in usage of limestone for the usage of Calcined lime.
13. For any deviation of Basicity / MgO, if correction is done process has to be watched for next two
consecutive sinter analyses before making any further correction.
14. Iron ore blending percentage can be varied by considering raw material chemistry.
15. To control internal return fines, following should be monitored
Advantages: 1. Improved Blast Furnace productivity & Control, Reduction in coke rate.
2. Minimum addition of trimming additions like limestone / dolomite is required.
3. For getting the good quality & quantity product, sintering process is optimized by varying bed depth,
selecting right return fines & fuel rates. Apart from this sintering process is governed by Sinter
Machine speed and continuous running of the strand.
4. For maintaining the desired rate of production at desired speed, following need to be monitored &
controlled continuously.
To Maintain tumbler index >75% at sinter plant
Maintain FeO 9-10%
Maintain uniform sinter bed
Maintain feed hopper 55-65%
Maintain cooler bunker >40%
Maintain screen aperture size
Maintain bed height >700 mm
To control Blast Furnace return fines followings should be monitored
Maintain tumbler index >75%
Maintain FeO 9-10%
Maintain uniform sinter bed
Maintain feed hopper 55-65%
Maintain cooler bunker >40%
Maintenance of transfer chute from Sinter plant to Blast furnaces, maintain sinter storage level more
than 40%
Maintain healthy bunker level at both furnace
Maintain screen aperture size
Maintain bed height >700 mm
Maintain Sinter CaO >12.8%
To control RDI followings should be monitored
MgO in sinter +2%
FeO in sinter 9-10%
Record the changes made & monitor the process and analysis.
Coke corrections beyond the deviations may also be required for the reasons mentioned below.
Return fines generation increases / decreases. Percentage of addition of micro pellet and carbon slurry.
Bed change effect.
Unusual temperature trends at discharge.
Change in the blend composition.
Metallurgical properties of sinter e.g. RDI. Reducibility Index, Tumbler Index,
Shift in charges must monitor & coordinate all these activities with control room operator & field
operators to achieve desired sinter machine speed for maximum output. Make use of online analyzer for the
prediction of right sinter chemistry. Immediate action can be taken like change in SiO2, Al2O3, MnO, MgO and
CaO.

S K Akram Basha and Dr. B. Chanrda Mohan Reddy, International Journal of Research in Engineering, IT and
Social Sciences, ISSN 2250-0588, Impact Factor: 6.565, Volume 09 Issue 06, June 2019, Page 325-346
http://indusedu.org Page 342
This work is licensed under a Creative Commons Attribution 4.0 International License
SOP changes reasons
To maintain FeO
Previous - Any correction is done, process has to be observed for next two consecutive sinter analyses before
making any further correction.
Revised - Any correction is done to rectify FeO deviation, process has to be observed with an instantaneous
sample analysis before making any further correction
To control Blast Furnace, return fines followings should be monitored
Previous -
Maintain Tumbler Index >75%
Maintain FeO 9-10%
Maintain uniform sinter bed
Maintain feed hopper 55-65%
Maintain cooler bunker >30%
Maintenance of transfer chute from SP-3 to both furnaces 3 & 4.
Maintain screen aperture size
Revised -
Maintain tumbler index >75.5%
Maintain FeO 9-10%
Maintain uniform sinter bed
Maintain feed hopper 55-65%
Maintain cooler bunker >40%
Maintenance of transfer chute from SP-3 to both furnaces.
Maintain healthy bunker level at both furnace
Maintain bed height from 710 to 720 mm
Maintain Sinter CaO from 11.7 to 11.9
Maintain Alumina input ore < 3.1%
New operating ranges for CaO and Al2o3 have been decided with the help of contour plot shown
below.
SiO2 % 6.32263405797102
MgO % 2.26758170289855
MnO % 0.37645018115942
Hold Values
CaO %
Al2
O3
%
12.212.011.811.611.411.211.0
3.3
3.2
3.1
3.0
2.9
>
–
–
–
–
–
< 75.00
75.00 75.25
75.25 75.50
75.50 75.75
75.75 76.00
76.00 76.25
76.25
TI
Contour Plot of TI vs Al2O3 %, CaO %
Revised range
Earlier range

S K Akram Basha and Dr. B. Chanrda Mohan Reddy, International Journal of Research in Engineering, IT and
Social Sciences, ISSN 2250-0588, Impact Factor: 6.565, Volume 09 Issue 06, June 2019, Page 325-346
http://indusedu.org Page 343
This work is licensed under a Creative Commons Attribution 4.0 International License
POKE-YOKE for Controlling the Bunker levels
Logic made in Control room in such a way that, if bin level is less than or equal to 40%, then its
corresponding belt feeder will not start, so that bin level can be maintained
Result: Storage bunker levels are maintained above 40%. A snapshot is shown below
II. RESULTS To Sustain the Quality parametrs following key performance indices are sustaining on the daily
management basics
Tumbler index

S K Akram Basha and Dr. B. Chanrda Mohan Reddy, International Journal of Research in Engineering, IT and
Social Sciences, ISSN 2250-0588, Impact Factor: 6.565, Volume 09 Issue 06, June 2019, Page 325-346
http://indusedu.org Page 344
This work is licensed under a Creative Commons Attribution 4.0 International License
< 5 mm fraction in sinter
Sinter Al2O3
Sinter CaO
Results before the project and after the project has been shown below

S K Akram Basha and Dr. B. Chanrda Mohan Reddy, International Journal of Research in Engineering, IT and
Social Sciences, ISSN 2250-0588, Impact Factor: 6.565, Volume 09 Issue 06, June 2019, Page 325-346
http://indusedu.org Page 345
This work is licensed under a Creative Commons Attribution 4.0 International License
< 5mm of sinter before and after project
Tumbler index of sinter before and after project
S K Akram Basha and Dr. B. Chanrda Mohan Reddy, International Journal of Research in Engineering, IT and
Social Sciences, ISSN 2250-0588, Impact Factor: 6.565, Volume 09 Issue 06, June 2019, Page 325-346
http://indusedu.org Page 346
This work is licensed under a Creative Commons Attribution 4.0 International License
III. CONCLUSION Sinter deterioration is function of Sinter strength (Tumbler Index) and <5mm fraction in Sinter product
and external conditions like Al2O3 in Iron Ore Fines. Sinter is subjected to height of fall in bunkers and transfer
points of conveyors. Through this project, Tumbler Index, height of fall and <5mm fraction problems were
addressed as we have limited control on input ore fines quality.
1. The deterioration by height of fall at Sinter storage bunkers addressed
2. Minimum level of storage in bunkers is increased from 35% to 40%.
3. Discharge chute has been replaced with Vibrio feeder which will reduce degradation of Sinter in
chutes. Checklists have been developed for maintaining the health of conveyor transfer points.
4. The Tumbler Index, CaO level in Sinter has been increased from 11.7 to 11.9 %.
5. For increasing screening efficiency, return fines screen mats are being cleaned once in a week. Also, to
increase availability of screens, Preventive Maintenance jobs are taken once in 15 days.
IV. REFERENCES [1] Arikata, Y., Yamamoto, K., and Sassa, Y., 2013, “Effect of coke breeze addition timing on sintering operation.” ISIJ
International, 53,pp. 1523–1528.
[2] Barnaba, P., 1985, “Influence of chemical characteristic on softening and melting down properties of iron ore sinter.” Iron
making and Steelmaking, 12, pp. 53–63. [3] Hsieh, L. and Whiteman, J. A., 1989a, “Sintering conditions for simulating the formation of mineral phases in industrial iron ore
sinter.” ISIJ International, 29, pp. 24–32. Hsieh, L. and Whiteman, J. A.,
[4] The Six Sigma Handbook, A Complete Guide for Green Belts, Black Belts, and Managers at All Levels Thomas Pyzdek, Paul A. Keller
[5] Abraham, B. and Whitney, J. B. (1990). “Applications of EWMA Charts to Data from Continuous Processes,” Annual Quality
Congress Transactions, Milwaukee, WI: ASQ Quality Press. [6] Apparatus for preventive raw mix from being unevenly sintered by a sinter machine, Shiokawa et al, U.S. patent NO.3, 949,974.
[7] Optimization of suction pressure for iron ore sintering by genetic algorithm. N.K. Nath and K. Mitra
[8] Effect of ore properties on sinter bed permeability and strength, B.G. Ellis, C.E. Loo and D. Witchard. [9] Optimization of sintering operation through permeability control at bokar steel plant ind, Aritra.mallick et al.
[10] Brezhnev, I. S., Klein, V. I., Matyukhin, V. I., & Yaroshenko, Y. G. (2009). Assessing the quality of iron-ore sinter on the basis of
its chemical composition. Steel in Translation, 39(10), 843-846. [11] Juran, J. M. and Gryna, F. M. (1988). Juran’s Quality Control Handbook, 4th Edition, McGraw-Hill.
[12] Ph.D., Centro National de Investigations Metallurgical CSIC-CENIM (Spain), [email protected]
[13] Six Sigma Statistics with Excel and Minitab Issa Bass, New York Chicago San Francisco Lisbon London Madrid Mexico City Milan New Delhi San Juan Seoul Singapore Sydney Toronto


