

SnSe2 Two Dimensional Anodes for Advanced Sodium Ion Batteries
Thesis by
Fan Zhang
In Partial Fulfillment of the Requirements
For the Degree of
Master of Science
King Abdullah University of Science and Technology
Thuwal, Kingdom of Saudi Arabia
All rights reserved
May, 2017
Fan Zhang

2
EXAMINATION COMMITTEE PAGE
The thesis of Fan Zhang is approved by the examination committee.
Committee Chairperson: Prof. Husam Niman Alshareef. Committee Members: Prof. Udo Schwingenschlogl; Prof. Yu Han.
3
ABSTRACT
SnSe2 Two Dimensional Anodes for Advanced Sodium Ion Batteries
Fan Zhang
Sodium-ion batteries (SIBs) are considered as a promising alternative to lithium-ion
batteries (LIBs) for large-scale renewable energy storage units due to the abundance of
sodium resource and its low cost. However, the development of anode materials for SIBs
to date has been mainly limited to some traditional anodes for LIBs, such as carbonaceous
materials. SnSe2 is a member of two dimensional layered transition metal dichalcogenide
(TMD) family, which has been predicted to have high theoretical capacity as anode
material for sodium ion batteries (756 mAh g-1), thanks to its layered crystal structure.
Yet, there have been no studies on using SnSe2 as Na ion battery anode. In this thesis, we
developed a simple synthesis method to prepare pure SnSe2 nanosheets, employing N2
saturated NaHSe solution as a new selenium source. The SnSe2 2D sheets achieve
theoretical capacity during the first cycle, and a stable and reversible specific capacity of
515 mAh g-1 at 0.1 A g-1 after 100 cycles, with excellent rate performance. Among all of
the reported transition metal selenides, our SnSe2 sample has the highest reversible
capacity and the best rate performances.
A combination of ex-situ high resolution transmission electron microscopy (HRTEM) and
X-ray diffraction was used to study the mechanism of sodiation and desodiation process
in this SnSe2, and to understand the reason for the excellent results that we have

4
obtained. The analysis indicate that a combination of conversion and alloying reactions
take place with SnSe2 anodes during battery operation, which helps to explain the high
capacity of SnSe2 anodes for SIBs compared to other binary selenides. Density functional
theory was used to elucidate the volume changes taking place in this important 2D
material.

5
ACKNOWLEDGEMENTS
I would first like to express my deepest appreciation to my thesis advisor Prof. Husam
Alshareef, for his guidance, constant encouragement and providing expertise throughout
my study. I would also like to thank my committee members Prof. Udo Schwingenschlogl
and Prof. Yu Han for their guidance and support throughout the course of this research.
My appreciation also goes to my friends and colleagues and the department faculty for
making my time at King Abdullah University of Science and Technology a great experience.
I am grateful to my family, who have provided me great moral and emotional support in
my life. I am also grateful to my girlfriend who supported me along the way.

6
TABLE OF CONTENTS
EXAMINATION COMMITTEE PAGE .................................................................................... 2
ABSTRACT ........................................................................................................................... 3
ACKNOWLEDGEMENTS ...................................................................................................... 5
TABLE OF CONTENTS .......................................................................................................... 6
LIST OF ABBREVIATIONS .................................................................................................... 8
LIST OF ILLUSTRATIONS ...................................................................................................... 9
LIST OF TABLES ................................................................................................................. 11
Chapter 1: Introduction .................................................................................................... 12
1.1 Overview of Sodium Ion Batteries .......................................................................... 12
1.1.1 Background ....................................................................................................... 12
1.1.2 Working Principle ............................................................................................. 14
1.2 Anode Materials for Sodium Ion Batteries.............................................................. 15
1.2.1 Reaction Mechanism ........................................................................................ 15
1.2.2 Carbon-based Materials ................................................................................... 18
1.2.3 Alloy-based Materials ....................................................................................... 20
1.2.4 Conversion-based Materials ............................................................................. 22
1.2.5 Sn-based Anode Materials ................................................................................ 23
1.3 2D Metal Dichalcogenide and SnSe2 ....................................................................... 27
Chapter 2: Experimental Principles and Methods .......................................................... 33
2.1 Reagents and Materials ........................................................................................... 33
2.2 Battery Assmembly ................................................................................................. 34
2.3 Characterization ...................................................................................................... 35
2.4 Electrochemical Characterization ........................................................................... 36
2.5 Computational Methods ......................................................................................... 37
Chapter 3: Synthesis of SnSe2 and the Electrochemical Performances ......................... 38
3.1 Synthesis of SnSe2 ................................................................................................... 38
3.2 Synthesis Mechanism .............................................................................................. 39
7
3.3 Characterization ...................................................................................................... 41
3.4 Electrochemical Performances................................................................................ 43
Chapter 4: Synthesis of SnSe2/RGO and the Electrochemical Performances ................ 47
4.1 Synthesis of RGO ..................................................................................................... 47
4.2 Synthesis of SnSe2/RGO........................................................................................... 49
4.3 Characterization ...................................................................................................... 50
4.4 Electrochemical Performances................................................................................ 58
Chapter 5: Comparison between SnSe2 and SnSe2/RGO Anodes ................................... 63
5.1 Comparison of Electrochemical Performances ....................................................... 63
5.2 Characterization ...................................................................................................... 65
Chapter 6: Electrochemical Mechanism of SnSe2/RGO electrodes ................................ 70
6.1 Mechanism .............................................................................................................. 70
6.2 Contribution of RGO ................................................................................................ 74
Chapter 7: Conclusion ...................................................................................................... 78
REFERENCE ........................................................................................................................ 80
APPENDIX A: The theoretical capacity of electrodes ...................................................... 88
LIST OF PUBLICATIONS ..................................................................................................... 89

8
LIST OF ABBREVIATIONS
SIBs sodium-ion batteries LIBs lithium-ion batteries TMD transition metal dichalcogenide HRTEM high resolution transmission electron microscopy XRD X-ray diffraction TEM transmission electron microscopy DFT density functional theory RGO reduced graphene oxide CVD chemical vapor deposition PVDF polyvinylidene difluoride NMP n-methyl-2-pyrrolidone EC ethylene carbonate DMC dimethyl carbonate XPS X-ray photoelectron spectroscopy TGA thermogravimetric analysis SEM Scanning Electron Microscopy CV cyclic voltammetry EIS electrochemical impedance spectroscopy OCV open-circuit voltage DI water deionized water SEI solid electrolyte interface GO graphene oxide CE coulombic efficiency BET Brunauer–Emmett–Teller
9
LIST OF ILLUSTRATIONS
Figure 1.1. Elemental abundance in the Earth’s crust . . . . . . . . . . . . . . . . . . . . . . . . . . . . . .3
Figure 1.2. Schematic illustration of the working mechanism of Na-ion batteries. . . . . . .15
Figure 1.3. Reaction mechanisms of anode materials for Na-ion batteries. . . . . . . . . . . . .17
Figure 1.4. Insertion reaction of sodium ions in NaCoO2. . . . . . . . . . . . . . . . . . . . . . . . . . . .17
Figure 1.5. The theoretical specific capacities of various anode materials for SIBs. . . . . . 23
Figure 1.6. Voltage curves of the first desodiation and second sodiation of metal tin, superimposed very well with the DFT results. . . . . . . . . . . . . . . . . . . . . . . . . . . . . . . . . . . . 24
Figure 1.7. Particles of a tin oxide electrode experiencing structural changes during charging (1-3) and discharging (3-4). . . . . . . . . . . . . . . . . . . . . . . . . . . . . . . . . . . . . . . . . . . .25
Figure 1.8. Crystal structure of 2D SnS2. . . . . . . . . . . . . . . . . . . . . . . . . . . . . . .. . . . . . . . . . .28
Figure 1.9. Electrochemical performances of SnS2 and SnS2-RGO composites. . . . . . . . . 30
Figure 2.1. Cross-sectional schematic diagram of the coin-cell. . . . . . . . . . . . . . . . . . . . . . 35
Figure 3.1. (a) As-prepared NaHSe solution; (b) After 30 min in the air. . . . . . . . . . . . . . . 40
Figure 3.2. X-ray diffraction pattern for pure SnSe2 powder. . . . . . . . . . . . . . . . . . . . . . . . 41
Figure 3.3. Schematic illustration of crystal structure of two dimensional SnSe2. . . . . . . .42
Figure 3.4. Raman spectra of as-prepared pure SnSe2. . . . . . . . . . . . . . . . . . . . . . . . . . . . . 42
Figure 3.5. SEM images of pure SnSe2 at different magnifications. . . . . . . . . . . . . . . . . . . .43
Figure 3.6. Cyclic voltammograms of SnSe2 electrode. . . . . . . . . . . . . . . . . . . . . . . . . . . . . 45
Figure 3.7. Galvanostatic charge/discharge profiles of SnSe2 electrode. . . . . . . . . . . . . . . .46
Figure 4.1. The yellow graphene oxide solution and the black reduced graphene oxide solution. . . . . . . . . . . . . . . . . . . . . . . . . . . . . . . . . . . . . . . . . . . . . . . . . . . . . . . . . . . . . . . . . . . . . .48
Figure 4.2. Modified Hummers’ method and the reduction process. . . . . . . . . . . . . . . . . . .49
Figure 4.3. XRD patterns of pure SnSe2 and SnSe2/RGO nanocomposites. . . . . . . . . . . . . .50
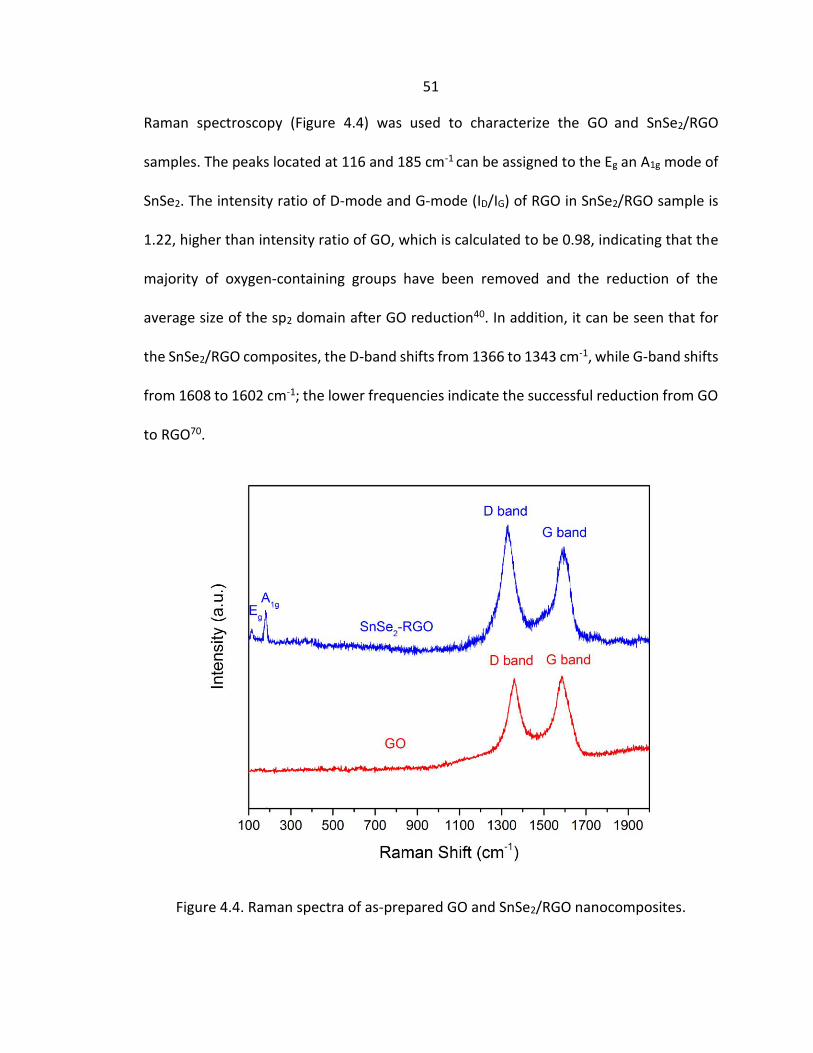
Figure 4.4. Raman spectra of as-prepared GO and SnSe2/RGO nanocomposites. . . . . . . .51

10
Figure 4.5. TG curves of SnSe2 and SnSe2/RGO. . . . . . . . . . . . . . . . . . . . . . . . . . . . . . . . . . . . .53
Figure 4.6. XPS spectra of the SnSe2/RGO nanocomposites: (a) survey, (b) C 1s, (c) Sn 3d and (d) Se 3d. . . . . . . . . . . . . . . . . . . . . . . . . . . . . . . . . . . . . . . . . . . . . . . . . . . . . . . . . . . . . . . . . .54
Figure 4.7. (a, b) SEM images of SnSe2/RGO nanocomposites at different magnifications; (c) Schematic illustration of SnSe2/RGO structure; (d) HRTEM image of the as-obtained SnSe2 and the corresponding FFT image. . . . . . . . . . . . . . . . . . . . . . . . . . . . . . . . . . . . . . . . . .56
Figure 4.8. EDX and mapping of SnSe2/RGO nanocomposites. . . . . . . . . . . . . . . . . . . . . . . .57
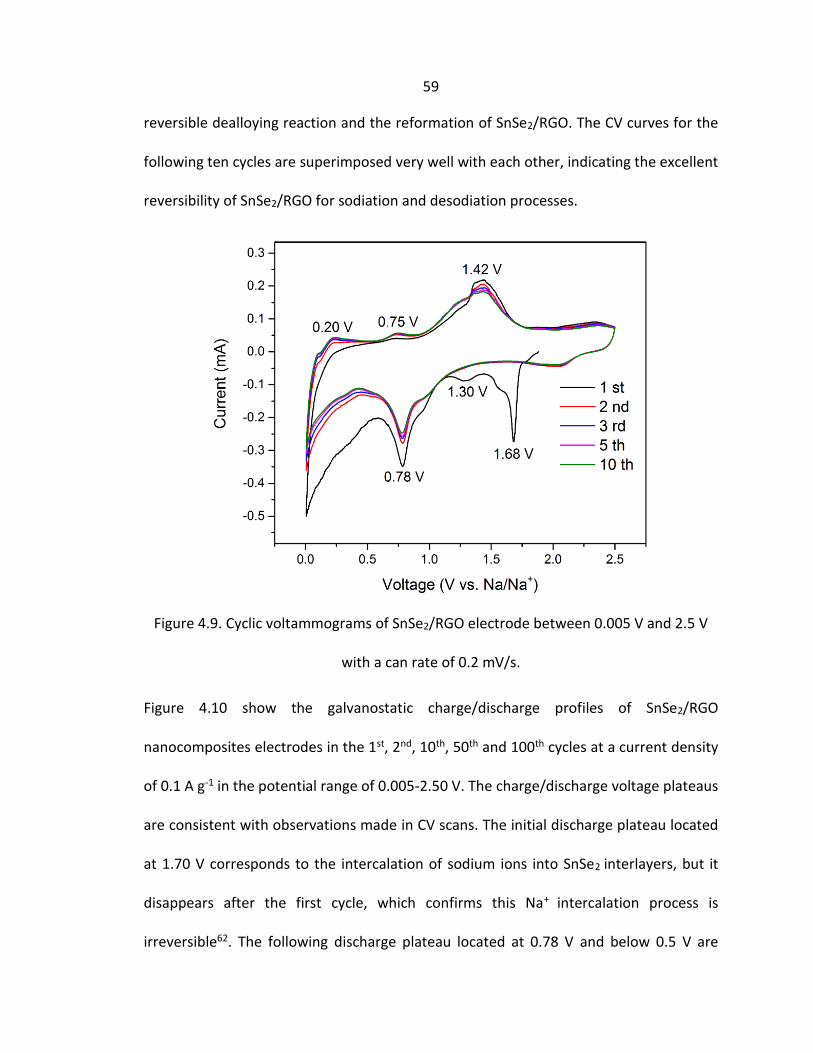
Figure 4.9. Cyclic voltammograms of SnSe2/RGO electrode between 0.005 V and 2.5 V with a can rate of 0.2 mV/s. . . . . . . . . . . . . . . . . . . . . . . . . . . . . . . . . . . . . . . . . . . . . . . . . . . . .59
Figure 4.10. Galvanostatic charge/discharge profiles of SnSe2/RGO electrode in the 1st, 2nd, 10th, 50th, 100th cycles. . . . . . . . . . . . . . . . . . . . . . . . . . . . . . . . . . . . . . . . . . . . . . . . . . . . . .61
Figure 4.11. Cyclic voltammograms of SnSe2/RGO electrodes at various scan rates. . . . . 62
Figure 5.1. Cycling performances of SnSe2 and SnSe2/RGO electrodes at 0.1 A g-1 for 100 cycles. . . . . . . . . . . . . . . . . . . . . . . . . . . . . . . . . . . . . . . . . . . . . . . . . . . . . . . . . . . . . . . . . . . . . . . .64
Figure 5.2. Rate performance of SnSe2 and SnSe2/RGO electrodes. . . . . . . . . . . . . . . . . . . .65
Figure 5.3. N2 adsorption/desorption isotherms of (a) Pure SnSe2 and (b) SnSe2/RGO composite. . . . . . . . . . . . . . . . . . . . . . . . . . . . . . . . . . . . . . . . . . . . . . . . . . . . . . . . . . . . . . . . . . . .67
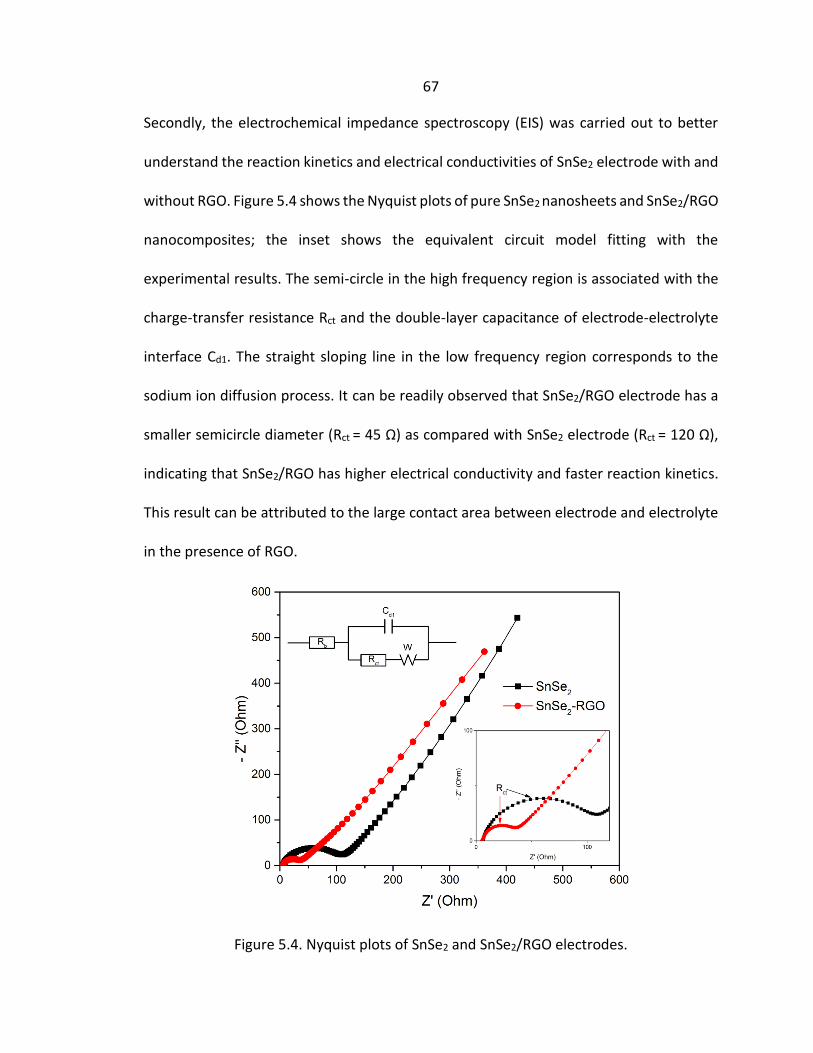
Figure 5.4. Nyquist plots of SnSe2 and SnSe2/RGO electrodes. . . . . . . . . . . . . . . . . . . . . . . .68
Figure 5.5. SEM images of (a) SnSe2 electrode before cycling and (b) after 100 cycles; (c, d) SnSe2/RGO electrode before cycling; (e, f) SnSe2/RGO electrode after 100 cycles. . . .69
Figure 6.1. (a) Ex-situ XRD patterns of the SnSe2/RGO electrode collected at different discharge/charge states as indicated in the corresponding voltage profile. (A) fresh electrode, (B) discharge to 1.70 V, (C) discharge to 1.20 V, (D) discharge to 0.78 V, (E) discharge to 0.005 V, (F) charge to 1.05 V, (G) charge to 1.42 V, (H) charge to 2.50 V; (b) Schematic illustration of the structure evolution during the sodiation process. . . . . . . . .72
Figure 6.2. Ex situ HRTEM images of the electrodes (a) after first discharge to 0.78 V and (b) after first charge to 2.5 V. The inset in (b) is the corresponding FFT image. . . . . . . . . .73
Figure 6.3. (a) Galvanostatic charge/discharge profiles of pure RGO electrode in the 1st, 2nd, 10th, 50th, 100th cycles; (b) Cycling performances of pure RGO electrode at 0.1 A g-
1 for 100 cycles. . . . . . . . . . . . . . . . . . . . . . . . . . . . . . . . . . . . . . . . . . . . . . . . . . . . . . . . . . . . . 75
Figure 6.4. (a) Schematic illustration of structure change of SnSe2 and SnSe2/RGO after sodium ion intercalation; (b) Lattice expansion as the function of Na atoms per unit cell. . . . . . . . . . . . . . . . . . . . . . . . . . . . . . . . . . . . . . . . . . . . . . . . . . . . . . . . . . . . . . . . . . . . . . . . . . . . . .77
11
LIST OF TABLES
Table 1.1. Comparison between lithium and sodium. . . . . . . . . . . . . . . . . . . . . . . . . . . . . 13
Table 1.2. Comparison between carbon-based materials. . . . . . . . . . . . . . . . . . . . . . . . . 20
Table 1.3. Summary of alloy-based anode materials. . . . . . . . . . . . . . . . . . . . . . . . . . . . . .21
Table 1.4. Electrochemical performance of Sn-based anodes in SIBs. . . . . . . . . . . . . . . . 26
Table 2.1. Summary of reagents and materials. . . . . . . . . . . . . . . . . . . . . . . . . . . . . . . . . . 33
Table 3.1. Some common ways to prepare metal selenides. . . . . . . . . . . . . . . . . . . . . . . . .38
Table 7.1 Summary of the transition metal selenide anodes for SIBs applications. . . . . .79

12
Chapter 1: Introduction
1.1 Overview of Sodium Ion Batteries
1.1.1 Background
Since the first commercialization of lithium-ion batteries (LIBs) in 1991, they have been
successfully developed as a high-energy power source in mobile electronic devices such
as mobile phones, cameras and laptops, and even in electric vehicles, which is a
development tendency of the future transportation1-2. However, the deficiency of Li
source, and the present technology for Li-ion batteries is not expected to meet the
demands for large grid-scale energy storage in the future applications. Thus, it is critical
to develop alternative rechargeable batteries similar to LIBs based on more abundant
elements in the earth3.
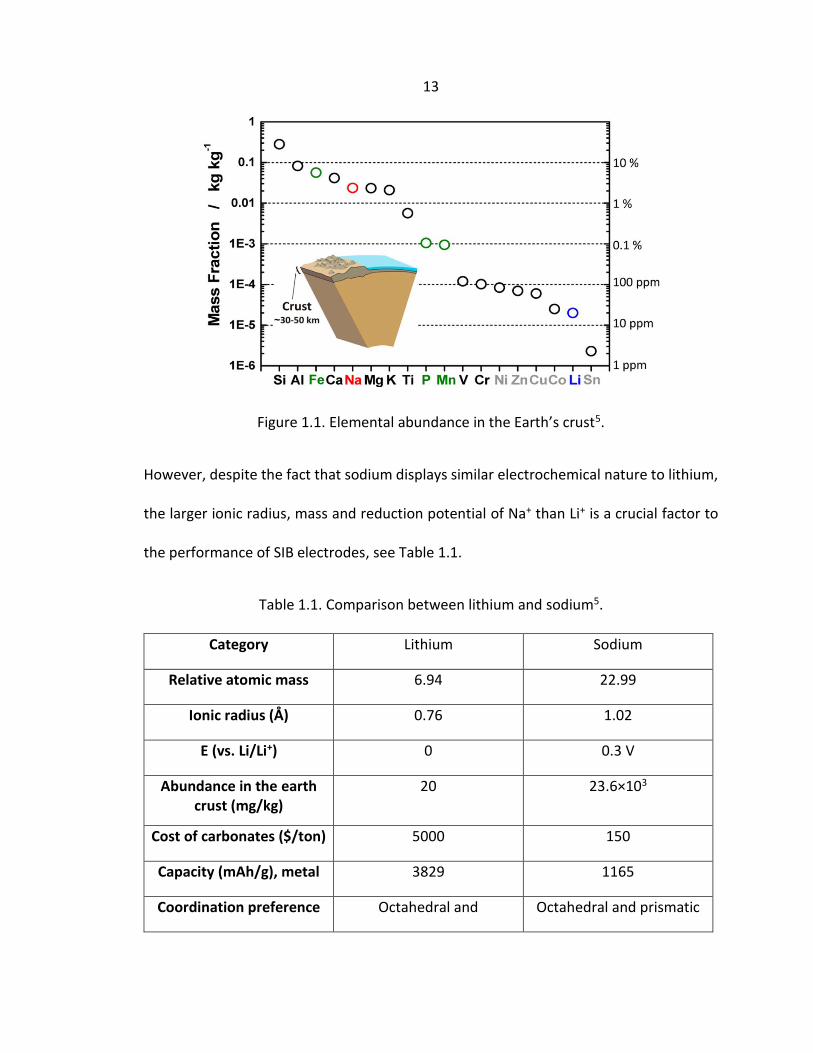
Sodium, the second-smallest and -lightest alkali metal element just next to lithium in the
periodic table, is one of the most abundant elements in the ocean and earth crust, as
shown Figure 1.1. This means that Na supplies are almost infinite with low cost. More
striking is the fact that sodium shows similar chemical properties as lithium, since they
are in the same group in the periodic table. This is the reason why rechargeable sodium
ion batteries (SIBs) have recently attracted a great deal of attention as a promising
alternative to lithium ion batteries (LIBs) for large-scale application4-6.
13
Figure 1.1. Elemental abundance in the Earth’s crust5.
However, despite the fact that sodium displays similar electrochemical nature to lithium,
the larger ionic radius, mass and reduction potential of Na+ than Li+ is a crucial factor to
the performance of SIB electrodes, see Table 1.1.
Table 1.1. Comparison between lithium and sodium5.
Category Lithium Sodium
Relative atomic mass 6.94 22.99
Ionic radius (Å) 0.76 1.02
E (vs. Li/Li+) 0 0.3 V
Abundance in the earth crust (mg/kg)
20 23.6×10³
Cost of carbonates ($/ton) 5000 150
Capacity (mAh/g), metal 3829 1165
Coordination preference Octahedral and
tetrahedral
Octahedral and prismatic
14
To date, different LIBs anode materials have been investigated as anode materials for
SIBs, but most efforts have been ineffective due to the low specific capacities, poor cycling
performances of these electrodes7-8. Take graphite for example, which is a state-of-the-
art anode material for commercial LIBs. It can exhibit the lithiation and delithiation
process with high reversibility, but has very low electrochemical activity for sodium
storage9-10. Hence, appropriate anode materials with high sodium storage ability with
excellent cyclic stability and superior rate performance should be studied and developed
for SIBs.
1.1.2 Working Principle
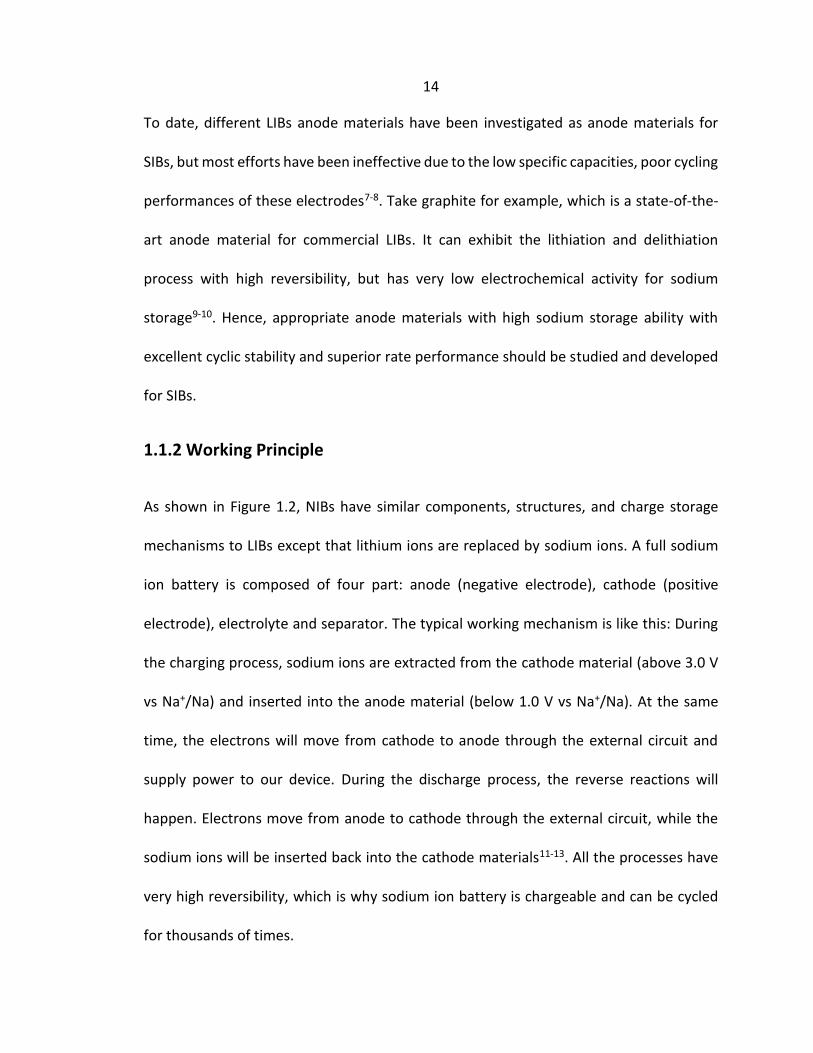
As shown in Figure 1.2, NIBs have similar components, structures, and charge storage
mechanisms to LIBs except that lithium ions are replaced by sodium ions. A full sodium
ion battery is composed of four part: anode (negative electrode), cathode (positive
electrode), electrolyte and separator. The typical working mechanism is like this: During
the charging process, sodium ions are extracted from the cathode material (above 3.0 V
vs Na+/Na) and inserted into the anode material (below 1.0 V vs Na+/Na). At the same
time, the electrons will move from cathode to anode through the external circuit and
supply power to our device. During the discharge process, the reverse reactions will
happen. Electrons move from anode to cathode through the external circuit, while the
sodium ions will be inserted back into the cathode materials11-13. All the processes have
very high reversibility, which is why sodium ion battery is chargeable and can be cycled
for thousands of times.
15
Figure 1.2. Schematic illustration of the working mechanism of Na-ion batteries5.
1.2 Anode Materials for Sodium Ion Batteries
1.2.1 Reaction Mechanism
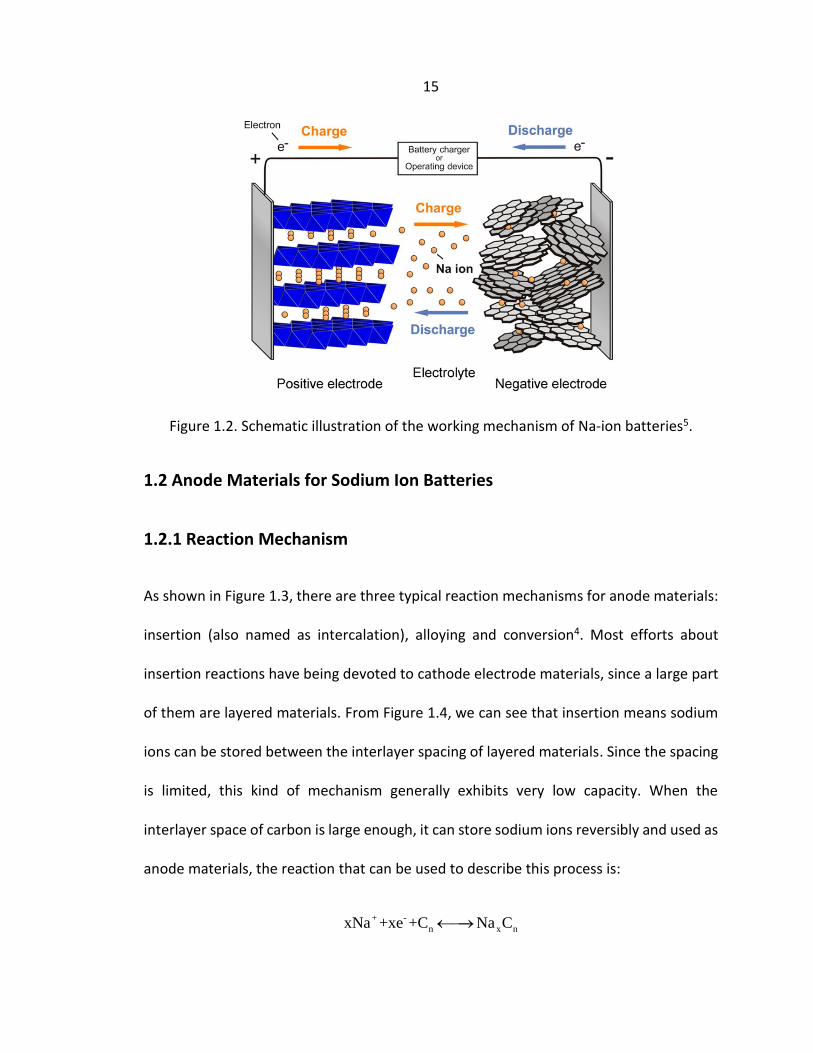
As shown in Figure 1.3, there are three typical reaction mechanisms for anode materials:
insertion (also named as intercalation), alloying and conversion4. Most efforts about
insertion reactions have being devoted to cathode electrode materials, since a large part
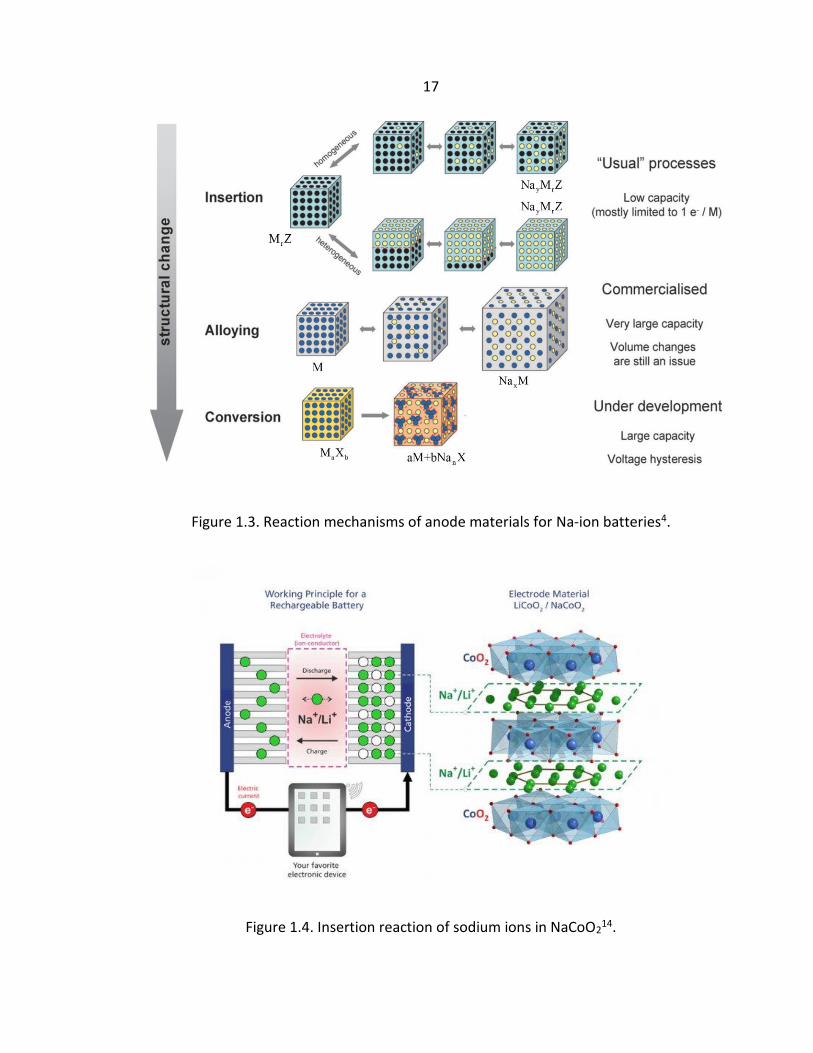
of them are layered materials. From Figure 1.4, we can see that insertion means sodium
ions can be stored between the interlayer spacing of layered materials. Since the spacing
is limited, this kind of mechanism generally exhibits very low capacity. When the
interlayer space of carbon is large enough, it can store sodium ions reversibly and used as
anode materials, the reaction that can be used to describe this process is:
+ -
n x nxNa +xe +C Na C

16
Some active metal elements will be promising anode electrodes since they can alloy with
sodium to form rich alloy phases, delivering a much higher capacity than carbon-based
materials. Unfortunately, the huge volume change during the reaction may destroy the
electrode structure and results in the degradation of battery performance4, 11. This
alloying process is observed for elements such as Sn, Sb, and P, and the reaction formula
can be described as follows:
+ -
xM+xNa +we Na M
Recently, more and more metal oxides (sulfides, selenides) have been proved to be
suitable as anodes for NIBs via conversion reactions. Through the multi-electron
reactions, the conversion anodes show high energy densities and high capacities.
However, they also have disadvantages such as large volume change, low initial
coulombic efficiency, and poor cycling performance11. The reaction formula is as follows:
+ -
a b nM X +(nb)Na +(nb)e aM+bNa X
Most of the anode materials follow these three mechanisms, and some of them will only
go through one process, while others may go through two or three of them.
17
Figure 1.3. Reaction mechanisms of anode materials for Na-ion batteries4.
Figure 1.4. Insertion reaction of sodium ions in NaCoO214.

18
1.2.2 Carbon-based Materials
Carbon-based materials are the most studied anode materials for both of LIBs and NIBs.
For LIBs, graphite is the most common anode material, which has advantages in
comparison with other forms of carbon, such as low cost, high gravimetric and volumetric
capacity and high stability. Li ions can be inserted into the inter-layer spacing of graphite
and forms the compound, LiC6, which can deliver a reversible capacity of more than 360
mAh g−1 (the theoretical capacity of graphite is 372 mAh g−1)15-16. However, graphite is
electrochemically less active in Na cells. Only a small amount of Na atoms (∼NaC70) can
be inserted into the graphite, due to the mismatchi between the graphite inter-layer
distance (d002=0.334 nm) and the larger Na+ ions (Ionic radius is 1.02 Å, larger than
lithium)6, 17. What’s exciting is that when the inter-layer spacing of graphite become
larger, it can show a much higher reversible capacity. A reported by Wen, the expanded
graphite with larger inter-layer distance of 4.3 Å showed a high reversible capacity of 284
mAh g-1 at a current density of 20 mA g-1 after 100 cycles, and 136 mAh g-1 at 100 mA g-1
after 1000 cycles. It has been proven by In situ transmission electron microscopy that,
sodium ions can be inserted into and extracted from the inter-layer of expanded graphite
reversibly18.
Graphene, made of up of few layers of graphite sheets, has special 2D nanostructure,
large specific surface area, and superior electronic conductivity. It has also been
extensively researched as anode material for SIBs19. Wang et al reported that reduced
graphene oxide anodes can allow significant sodium ion insertion, exhibiting a higher
19
reversible capacity at high current density compared to other carbon-based materials. A
reversible capacity as high as 174.3 mAh g-1 at the current density of 40 mA g-1 was be
obtained, and a capacity of 141 mAh g-1 at 40 mA g-1 was maintained even after 1000
cycles20. Beyond that, boron-doped and nitrogen-doped graphene also showed improved
performance. This could be explained by the fact that elemental doping, creates more
defects and active sites which improve electronic conductivity 21.
Hard carbon, is one type of the so-called non-graphitic carbonaceous materials, which
consist of carbon atoms that are mainly arranged in a planar hexagonal network but no
crystallographic order in the c-direction compared to graphite. Thanks to its large
interlayer distance, highly disordered structure and large amount of micro-pores, hard
carbon can store more sodium ions than ordered graphite22-24. Hong et al reported that
they can synthesize hard carbon with a 3D connected porous structure by the simple
pyrolysis of H3PO4-treated pomelo peels25. The as-prepared sample has a large specific
surface area of 1272 m2 g-1. When tested as an anode material for sodium ion batteries,
it could exhibit a reversible capacity of 181 mAh g-1 at 200 mA g-1 after 220 cycles. At even
higher current density of 5 A g-1, it could still deliver a capacity of 71 mAh g-1.
More information about the performance of carbon-based materials as anodes for SIBs
can be obtained in Table 1.2.

20
Table 1.2. Comparison between carbon-based materials11.
Carbon Material
Electronic conductivity
(S cm-1)
Interlayer distance
(nm)
Voltage (V vs
Na+/Na)
SBET (m2 g-1)
Capacity, mAh g-1 /Cycle numbers
(Current density, A g-1)
Mechanism
Expanded graphite
100 0.43 0-0.3, 0.3-2
30-34 284/100 (0.02) Insertion
Graphene 103 to 106 0.365 0.01-2 330.9 141/1000 (0.04) Adsorption
Hard carbon 10-100 0.39 0.1, 0.1-1.2
1272 181/200 (0.2) Insertion , layers and nanopores
Nano sheets
10-100 0.388 0.2, 0.2-1.2
196.6 203/210 (0.5) _
Hollow carbon
nanospheres
10-100 0.401 0-1.5 410 160/100 (0.1) Insertion
N-doped nanofibers
_ 0.369 0.01-1.5 81.7 134/200 (0.2) Adsorption and redox
1.2.3 Alloy-based Materials
Most of group 14 (Sn, Ge) and group 15 (P, Sb) elements can alloy with lithium or sodium
to form rich alloy phases, delivering a much higher capacity than carbon-based
materials11. Among all the materials, Si anodes have the highest theoretical capacity
(4200 mAh g-1) for LIBs, owing to the alloy reaction forming Li4.4Si26-27. While for SIBs, Si
anode materials are inactive and only NaSi can be formed, with much lower capacity3.
However, P has been proved to be promising anode materials for SIBs, owing to the rich
alloy phase Na3P can deliver a capacity over 2500 mAh g-1. Recently, various groups have
reported that phosphorus-based materials, including crystalline black phosphorus, black
21
phosphorus quantum dot, red phosphorus and amorphous phosphorus can show
promising electrochemical performance as anode materials for SIBs28-31. In particular, Yi
Cui has shown that a hybrid material made out of phosphorene and graphene layers can
show a very high specific capacity of 2440 mA h g−1 at 0.05 A g−1, and after 100 cycles, an
83% capacity can be maintained. The combination of ex situ X-ray diffraction (XRD) and
in situ transmission electron microscopy (TEM) techniques has demonstrated the
intercalation of sodium ions and the formation of the Na3P alloy32. It’s worth to mention
that, although alloy-based materials have very high capacity, the huge volume change
during the reaction may destroy the electrode structure and results in the degradation of
performances. Therefore, strategies must be developed to modify these alloy-based
materials to maintain high reversibility 33. Table 1.3 shows a list of some common alloy-
based anode materials for SIBs.
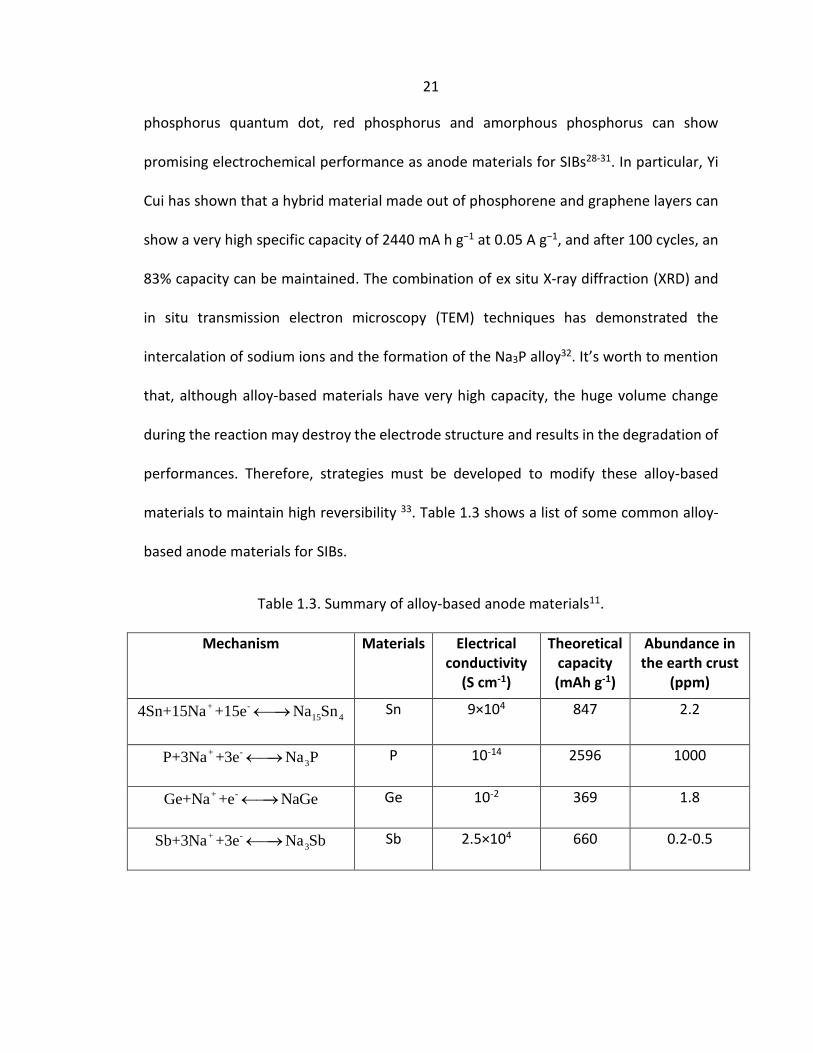
Table 1.3. Summary of alloy-based anode materials11.
Mechanism Materials Electrical conductivity
(S cm-1)
Theoretical capacity (mAh g-1)
Abundance in the earth crust
(ppm) + -
15 44Sn+15Na +15e Na Sn Sn 9×10⁴ 847 2.2
+ -
3P+3Na +3e Na P P 10-14 2596 1000
+ -Ge+Na +e NaGe Ge 10-2 369 1.8
+ -
3Sb+3Na +3e Na Sb Sb 2.5×10⁴ 660 0.2-0.5
22
1.2.4 Conversion-based Materials
Most of metal oxides (sulfides, selenides), denoted as MaXb (M = metal element, X = O, S,
Se, P, N. . .), can react with sodium and yield metallic nanoparticles embedded in a matrix
of NanX. This reaction is called conversion reaction, which involves the formation of NanX
and the full reduction of the metal element to its metallic state, which can deliver
remarkable high capacity34. If the metal is an inactive element, such as Mn and Fe, it
cannot alloy with sodium so that this will be a one-step conversion reaction. If the metal
is an active element, such as Sn and Sb, it can alloy with sodium like we have discussed
before, resulting in a two-step reaction in which the conversion reaction is followed by
alloying reaction. Through multi-electron reactions, the conversion anodes show high
energy densities and high capacities11. However, they also suffer from the same
disadvantages of huge volume change similar to the alloying anode materials. For
instance, Zhang et al reported that, γ-Fe2O3 nanoparticle and γ-Fe2O3@C nanocomposite
can be prepared using an aerosol spray pyrolysis technology. The unique structure of the
3D porous γ-Fe2O3@C nanocomposite can effectively prevent nanoparticles aggregation,
accommodate the large volume change, and improve the conductivity to facilitate the
movement of electrons during the cycling. The nanocomposite shows a very high
reversible capacity of 740 mAh g−1 after 200 cycles at the current density of 0.2 A g−1 and
a capacity of 317 mAh g−1 even at 8 A g−1. However, the bare γ-Fe2O3 nanoparticle shows
rapid capacity fading and only 200 mAh g−1 at 0.2 A g−1 can be obtained after 100 cycles35.

23
The theoretical specific capacities of various anode materials with different reaction
mechanisms for SIBs are shown in Figure 1.5.
Figure 1.5. The theoretical specific capacities of various anode materials for SIBs11.
1.2.5 Sn-based Anode Materials
Tin and tin-based compounds, with a high theoretical capacity, have been investigated as
the most promising SIBs anode materials. The theoretical sodium storage capacity of tin
is 847 mAh g-1, by alloying reaction, which forms Na15Sn4 (Na3.75Sn)36-38. As shown in Figure
1.6, during the reactions of Sn with Na to form Na15Sn4, four anodic plateaus can be
detected at 0.2, 0.3, 0.56, and 0.7 V, which are related to the multi-step desodiation
process of Na15Sn4 to form Sn through Na9Sn4, NaSn, and NaSn5, respectively. These
results match very well with the density functional theory (DFT) calculation39.

24
Figure 1.6. Voltage curves of the first desodiation and second sodiation of metal tin,
superimposed very well with the DFT results39.
More striking, tin-based compounds, such as tin oxide (SnO2), tin sulfide (SnS2 and SnS),
and tin selenide (SnSe2 and SnSe) possess higher theoretical capacities than metallic tin,
with the additional capacity contribution from conversion reactions. For instance, SnS2
and SnS can deliver a theoretical capacity of 1136 and 1022 mAh g-1, respectively, with
the sodiation mechanism being a combination of conversion and alloying reactions40-42.
SnSe2 can also deliver a high theoretical capacity of 756 mAh g-1 (considering that 1 molar
SnSe2 can store 7.75 molar sodium). In spite of high sodium storage ability, the deleterious
volume expansion of tin (~420%) during the alloying process seriously damages the
cycling stability of tin-based electrodes. The volume change of SnO2 during discharge and
charge process are shown in Figure 1.743.

25
Figure 1.7. Particles of a tin oxide electrode experiencing structural changes during
charging (1-3) and discharging (3-4).
In a word, tin-based materials can be suitable anodes owing to their high capacities, but
we must utilize some methods to overcome the large volume change that occurs during
the cycling process. More data about the electrochemical performances of Sn-based
anodes for SIBs can be seen in Table 1.444.

26
Table 1.4. Electrochemical performance of Sn-based anodes in SIBs.
Samples Capacity, mAh g-1
/Cycle numbers (Current density, A g-1)
Capacity, mAh g-
1 (Current density, A g-1)
References
Tin oxide
SnO/MWCNTs Composite
195/100 (0.1) NA ACS Appl. Mater.Interfaces, 2016, 8, 7147-7155.
SnO Flower
530/50 (0.05) 311 (0.5) J. Power Sources, 2015, 284, 287-295.
SnO Microspheres
310/50 (0.08) NA Chem. Eur. J., 2014, 20, 3192-3197.
SnO2@graphene Nanocomposites
569/100 (0.08) 143 (0.64) Chem. Commun., 2013, 49, 3131-3133.
SnO2 nanoparticles @RGO
330/150 (0.1) 125 (1.0) J. Mater. Chem. A, 2014, 2, 529-534.
SnO2@MWCNT Composite
350/50 (0.07) 210 (0.333) Electrochem.Commun., 2013, 29, 8-11.
SnO2/SnS Heterostructures
409/500 (0.81) 360 (7.29) Angew. Chem. Int. Ed., 2016, 55, 3408-3413.
Metal tin
Sn/C Composite
359/15 (0.02) 75 (1.0) Adv. Energy Mater., 2013, 3, 128-133.
Sn@Wood Fiber Composite
145/400 (0.084) 80 (0.84) Nano Lett., 2013, 13, 3093-3100.
Sn nanoparticles @C
445/200 (0.5) 349 (4.0) Adv. Funct. Mater., 2015, 25, 214-220.
Sn/graphite composite
350/20 (0.05) NA J. Power Sources., 2013, 225, 316-322.
Tin sulfide
SnS2/rGO composite
509/300 (0.2) 337 (12.8) Adv. Funct. Mater., 2015, 25, 481-489.
SnS2-RGO composite
628/100 (0.2) 544 (2.0) Adv. Mater., 2014, 26, 3854-3859.
SnS2@graphene composite
480/50 (0.03) 135 (7.29) ACS Nano, 2014, 8, 8323-8333.
SnS/C nanocomposites
266/300 (1.0) 145 (10.0) Adv. Sci., 2015, 2, 1500200.
SnS-C composite
433/50 (0.5) 280 (5.0) Nano Res., 2015, 8, 1595-1603.

27
Tin selenide
SnSe/C nanocomposite
325/200 (0.5) 323 (2.0) Electrochimica Acta, 2015, 176, 1296-1301.
SnSex flower composites
272/50 (0.2) 159 (2.0) Mater. Lett., 2016, 162, 169-172.
SnSe/RGO composite
570/50 (0.1) 260 (10.0) Chem. Eur. J., 2016, 22, 1445-1451.
Tin phosphide
Sn4+xP3@(Sn-P) composite
465/100 (0.1) 165 (10.0) Adv. Mater., 2014, 26, 4037-4042.
SnP3/C composite
810/150 (0.15) 570 (3.2) Adv. Energy Mater., 2015, 5, 1500174.
Sn4P3 nanoparticles
305/10 (0.05) NA J. Power Sources., 2016, 304, 346-353.
Sn4P3/C composite
520 (0.1) 349 (1.0) Nano Lett., 2014, 14, 1865-1869.
Sn4P3
powder 718/100 (0.1) NA Adv. Mater.,
2014, 26, 4139-4144.
Sn4P3@C nanospheres
515/50 (0.1) 421 (1.5) Energy Environ. Sci., 2015, 8, 3531-3538.
1.3 2D Metal Dichalcogenides
Two dimensional metal dichalcogenide MXa (M= Sn, Mo, Nb, W, Ti and so on) are
composed of a hexagonal close packed sandwich layer of metal atoms (M) between two
layers of chalcogenide elements (O, S, Se and Te). Strong covalent bonding characterizes
the M–X interactions, and the layers are loosely bound by van der Waals bonds45-47. Figure
1.8 shows the 2D crystal structure of SnS2. The relatively large interlayer spacing means
more sodium ion can be intercalated and buffer the large volume change during sodiation
and desodiation processes. Up to now, different kinds of 2D nanosheets have been used
in the energy storage field.

28
Figure 1.8. Crystal structure of 2D SnS248.
Take layered metal sulfides (MSa) as example, they have been widely studied as anode
materials for SIBs. Generally speaking, the electrochemical mechanism of layered metal
sulfides contains two steps. During the first step, sodium ions can intercalate into the
inter-layer space of layered structure to form an intermediate material (NaxMSa). The
second step, NaxMSa will decompose to Na2S and metallic state M through a conversion
reaction11. However, as we have mentioned, the conversion reaction may cause huge
volume change of the anode material. This large change can destroy the crystal structure,
block the space for the intercalation, and de-intercalation of sodium ions, so most of the
intercalation reaction in 2D metal dichalcogenide is irreversible. Beyond that, if the
metallic state M can alloy with sodium, there be a third step, involving an alloying
reaction.

29
Tin-based 2D transition metal dichalcogenides such as SnO, SnS, SnS2, SnSe, SnSe2,
possess higher theoretical capacities than metallic tin, with the additional capacity
contribution coming from conversion reactions. They can also take advantage of their
large inter-layer spacing to buffer the volume change during cycling49. It has been shown
that 2D tin-based materials can exhibit excellent performanceas anode material for SIBs.
SnSe2 can also deliver a high theoretical capacity of 756 mAh g-1 (considering that 1 molar
SnSe2 can store 7.75 molar sodium). In spite of high sodium storage ability, the deleterious
volume expansion of tin (~420%) during the alloying process seriously degrades the cycle
stability of tin-based electrodes. In order to solve this problem, composites containing
carbon material such as carbon spheres, carbon nanotube, and graphene were prepared
by many researches. Reduced graphene oxide (RGO), with special two dimensional
structure, large specific surface area and excellent electronic conductivity can indeed
buffer the large volume changes during alloying reaction. Recently, Qu et al. prepared a
SnS2/RGO composite as anode material for SIBs with a high reversible capacity of 500 mAh
g-1 at 1 A g-1 for 400 cycles and excellent rate performance (as shown in Figure 1.9). This
excellent electrochemical performance could be attributed to the good conductivity and
mechanical resilience of RGO nanocomposites40.

30
Figure 1.9. Electrochemical performances of SnS2 and SnS2-RGO composites
SnSe2 is a two dimensional transition metal dichalcogenide which has the CdI2-type
hexagonal layered structure (a=b=3.81 Å and c=6.14 Å, space group P3m1). Within each
SnSe2 layer, hexagonal close packed monolayers were stacked with a periodicity of one
layer tin atom and two layers selenium atoms, and the interlayer spaces are loosely bound
by van der Waals bonds. The large interlayer spacing can improve sodium ion
intercalations and buffer the large volume change during sodiation and desodiation
processes50-51. Recently, various synthesis methods have been reported to prepare pure
SnSe2 material for photodetector, optoelectronic, and energy storage applications51-52.
For example, Zhou et al synthesized ultrathin SnSe2 flakes on mica substrate in a hot
31
furnace at 600 ℃ under Ar and H2 atmosphere by chemical vapor deposition (CVD)
method52. Fernandes and his co-workers prepared SnSe2 thin film on soda lime glass
substrates by selenization of DC magnetron sputtered tin metallic precursors in the
temperature range from 300 to 579 ℃53. Choi et al. reported a solution approach using
the mixed solvent of oleylamine and dichloromethane at 220 ℃54. However, all these
methods involve complex reaction routes, high temperature, and require some toxic and
hazardous reagents, which are not practical for green chemistry synthesis. Beyond that,
for the chemical synthesis of selenides, the selenium source mostly used is the hydrazine
hydrate solution that have dissolved selenium powder, while hydrazine hydrate is a highly
toxic and dangerously unstable reagent55-56. Therefore, it is important to seek a suitable
and safe selenium source and a simpler process to prepare pure SnSe2 material.
In this work, we have developed a facile hydrothermal method to prepare pure SnSe2
nanosheets and SnSe2/RGO nanocomposites using a safe and stable selenium source for
the first time. Specifically, N2 saturated NaHSe solution, with high reaction activity was
exploited as Se source. The results show that the as-prepared SnSe2 had a layered
structure with interlayer spacing that can accommodate sodium ions; furthermore, the
insertion of RGO into SnSe2 could improve the electrical conductivity and structural
stability of the electrodes. When tested as anode materials for SIBs, the SnSe2/RGO
composites exhibit a large reversible capacity of 515 mAh g-1 after 100 cycles and
excellent rate performances, which are better than the pure SnSe2 electrode. In addition,
the electrochemical mechanism during the cycling process was investigated by ex situ XRD

32
and HRTEM analyses, and the role of RGO in buffering the big volume change that takes
place during sodium ion intercalations was simulated using density functional theory.
33
Chapter 2: Experimental Principles and Methods
2.1 Reagents and Materials
The list of reagents and materials used during this study are listed in Table 2.1.
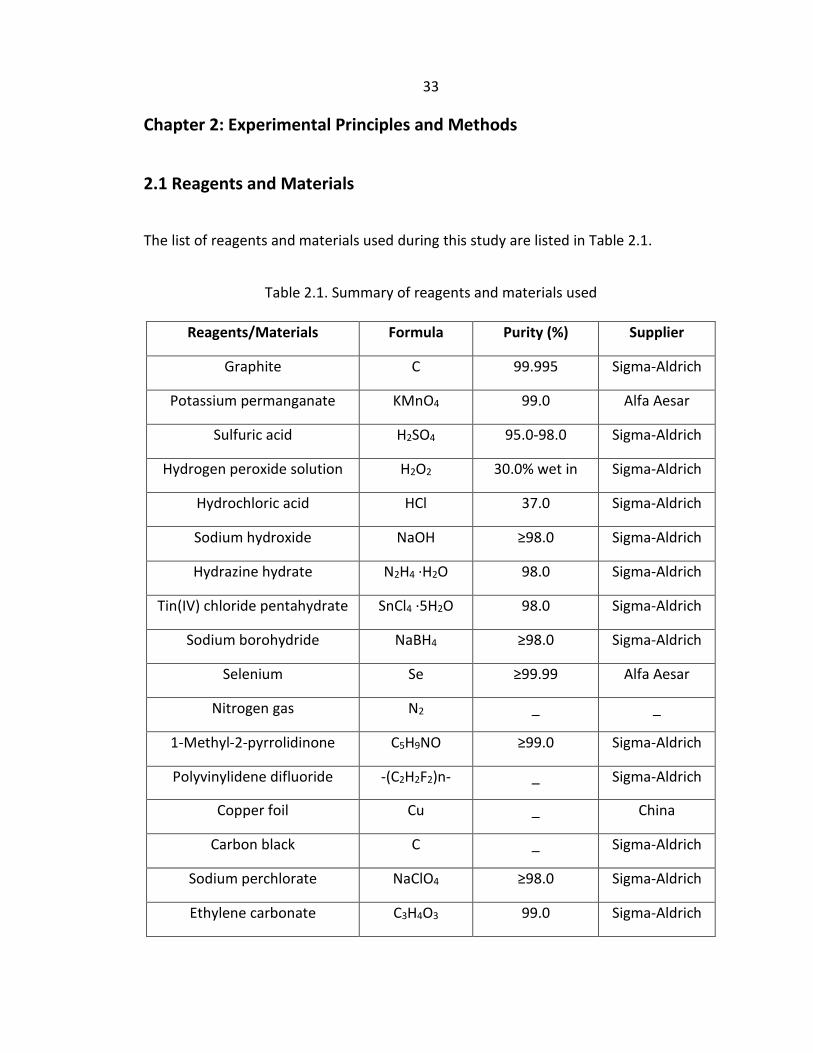
Table 2.1. Summary of reagents and materials used
Reagents/Materials Formula Purity (%) Supplier
Graphite C 99.995 Sigma-Aldrich
Potassium permanganate KMnO4 99.0 Alfa Aesar
Sulfuric acid H2SO4 95.0-98.0 Sigma-Aldrich
Hydrogen peroxide solution H2O2 30.0% wet in
H2O
Sigma-Aldrich
Hydrochloric acid HCl 37.0 Sigma-Aldrich
Sodium hydroxide NaOH ≥98.0 Sigma-Aldrich
Hydrazine hydrate N2H4 ·H2O 98.0 Sigma-Aldrich
Tin(IV) chloride pentahydrate SnCl4 ·5H2O 98.0 Sigma-Aldrich
Sodium borohydride NaBH4 ≥98.0 Sigma-Aldrich
Selenium Se ≥99.99 Alfa Aesar
Nitrogen gas N2 _ _
1-Methyl-2-pyrrolidinone C5H9NO ≥99.0 Sigma-Aldrich
Polyvinylidene difluoride -(C2H2F2)n- _ Sigma-Aldrich
Copper foil Cu _ China
Carbon black C _ Sigma-Aldrich
Sodium perchlorate NaClO4 ≥98.0 Sigma-Aldrich
Ethylene carbonate C3H4O3 99.0 Sigma-Aldrich

34
Dimethyl carbonate (CH3O)2CO 99.0 Sigma-Aldrich
Li Metal Li _ China
CR2032-type coin cell _ _ China
Celgard 3501 membranes _ _ China
2.2 Battery Assembly
A homogeneous slurry was prepared by mixing the active materials (SnSe2 or SnSe2/RGO),
carbon black (Super P) and polyvinylidene difluoride (PVDF) binder in a 7:1.5:1.5 weight
ratio in n-methyl-2-pyrrolidone (NMP). The slurry was then uniformly pasted on a copper
current collector and dried at 80 ℃ in a vacuum oven over 24 h, the typical active material
mass used was around 1.2 mg. For electrochemical measurements, CR2032-type coin
half-cells, using sodium foil as the counter electrode, were assembled in an argon-filled
glove box, where both H2O and O2 concentration were less than 1 ppm. A Celgard 3501
microporous membrane separator, and an electrolyte consisting of 1 M solution of
NaClO4 dissolved in ethylene carbonate (EC)/ dimethyl carbonate (DMC) with 1:1 weight
ratio.
The cross-sectional schematic diagram of the coin-cell is shown in Figure 2.1.

35
Figure 2.1. Cross-sectional schematic diagram of the coin-cell.
2.3 Characterization
The phase composition and elemental presence were identified using XRD spectra by a
Bruker diffractometer (D8 Advance) with Cu Kα radiation at a scanning speed of 5° min−1
and X-ray photoelectron spectroscopy (X486.6 eV) X-ray source. Raman spectra were
taken on a Hariba LabRAM HR spectrometer with He-Ne laser at 633 nm. The TGAs were
carried out on the Netzsch TG 209 F1 instrument from 30 to 700 °C at a heating rate of 10
°C min−1 in the air. The morphology of the products was characterized by SEM on a FEI
Nova Nano 630 microscope and HRTEM by the FEI Titan 80–300 KV microscope. The BET
surface area and pore size distribution were identified by nitrogen adsorption and
desorption using ASAP 2420 (Surface area and pore size analyzer, Micromeritics) at a bath
temperature of −195.85 °C. Electronic conductivity was characterized by the MET-007 4
36
point probe. The electrodes characterized by ex situ XRD were obtained by dissembling
the cycled batteries at various voltages in an argon-filled glovebox, any residual salt on
the surface of electrodes was moved by washing the cycled electrodes with battery grade
dimethyl carbonate (DMC) several times and dried at 80 °C for 2 h under vacuum.
2.4 Electrochemical Characterization
Cyclic Voltammetry (CV) is an electrochemical technique which measures the current that
develops in an electrochemical cell under conditions where voltage is in excess of that
predicted by the Nernst equation. CV is performed by cycling the potential of a working
electrode, and measuring the resulting current. CV is a widely used method for studying
electrode processes, especially for providing insights into the nature of processes beyond
the electron-transfer reaction. It was used in this work to study the electrochemical
properties of electrodes made from different as-prepared materials. Cyclic voltammetry
was measured by a Biologic VMP3 electrochemistry workstation in the voltage range of
0.005–2.5 V (V vs. Na/Na+) at a scan rate of 0.2 mV s−1 to examine the reduction and
oxidation peaks.
A charge cycle is the process of charging a rechargeable battery and discharging it as
required into a load. In general, number of cycles for a rechargeable battery indicates how
many times it can undergo the process of complete charging and discharging until failure
or it starting to lose capacity. The galvanostatic discharge and charge at different current

37
density states were performed by an Arbin BT-2043 battery testing system between the
voltage range of 0.005-2.5 V.
Impedance is a measure of the ability of a circuit to resist the flow of electrical current. In
this work, electrochemical impedance spectroscopy (EIS) measurements were conducted
by applying a sine wave with amplitude of 5.0 mV over the frequency range from 1000
kHz to 0.01 Hz at open-circuit voltage (OCV).
2.5 Computational Methods
Total energy calculations are carried out in the framework of density functional theory
using the projector augmented wave method as implemented in the Vienna Ab-initio
Simulation Package57. The generalized gradient approximation of Perdew, Burke and
Ernzerhof is selected for the exchange-correlation potential58, and the long-range
interlayer interaction is described by the DFT-D3 method59. Moreover, the plane wave is
set to 500 eV. The self-consistent calculations are converged to 10-6 eV, and the atomic
forces to 0.01 eV Å-1. A 6×6×6 k-mesh is employed for the Brillouin zone integrations.
2×2×1 supercells are built to investigate the sodiation processes, with a vacuum layer of
15 Å thickness is added to avoid artificial interaction between periodic images.

38
Chapter 3: Synthesis of SnSe2 and the Electrochemical Performances
3.1 Synthesis of SnSe2
Recently, various synthesis methods, have been reported to prepare pure SnSe2 material
used for photodetector, optoelectronic and energy storage application. Table 3.1
summarizes some methods that have been reported to prepare metal selenides.
Unfortunately, most of these methods involve complex reaction routes, high
temperature, and require toxic and hazardous reagents, which are not practical for green
chemistry synthesis. Beyond that, for the chemical synthesis of selenides, the selenium
source mostly used is the hydrazine hydrate solution to dissolve selenium powder, but
the hydrazine hydrate is a highly toxic and dangerously unstable reagent. Therefore, it is
important to seek a suitable and safe selenium source and a simpler way to prepare pure
SnSe2 material.
Table 3.1. Some common ways to prepare metal selenides.
Material Synthesis method Selenium source Reference
MoSe2 nanosheets
Hydrothermal 200℃, 24 h
Se + Hydrazine hydrate
Nano Res., 2016, 9, 1618-1629
MoSe2 nanoplates Thermal-
decomposition Se +
Hydrazine hydrate J. Power Sources,
2015, 283, 187-194
MoSe2 microspheres
Selenization of MoO3
H2Se gas Nanoscale, 2016, 8, 4209-4216
FeSe2 Microspheres
Hydrothermal 180℃, 12 h
Se + Hydrazine hydrate
Adv. Mater., 2015, 27, 3305-3309

39
Urchin-Like CoSe2
Hydrothermal 180℃, 24 h
Se + Hydrazine hydrate
Adv. Funct. Mater., 2016, 26, 6728-6735
SnSex flower Hydrothermal 180 ℃, 24 h
SeO2 + Oleyamine
Mater. Lett., 2016, 162, 169-172.
In this work, we used the N2 saturated NaHSe solution as the selenium source. More
details about the experiments are as follows:
A typical synthesis procedure of SnSe2 composites is given as follows: 0.176g SnCl4 ·5H2O
(0.5 mmol) was added to 5 ml deionized water (DI water) under stirring as the tin source.
Then, 0.08 g NaBH4 (2 mmol) was dissolved in 5 mL N2 statured DI water in a glass bottle,
after that, 0.08g Se powder (1 mmol) was added into the bottle with protective N2 or
Argon atmosphere under gently shaking until the Se powder totally dissolved and a clear
transparent solution was obtained, which was used as the selenium source-NaHSe
solution. Next, 5 ml tin source and 5 ml selenium source were mixed and stirred for 30
min. Finally, the mixture was transferred to a 50 ml Teflon-lined stainless steel autoclave,
and heated in an electric oven at 180 ℃ for 24 h. After cooling to room temperature, the
obtained product was collected by centrifugation, washed with DI water and ethanol for
several times and dried at 60 ℃ for 12 h under vacuum.
3.2 Synthesis Mechanism
The N2 saturated NaHSe solution is a very safe selenium source, which was synthesized
according to the following equation:
4 2 2 4 7 24NaBH +2Se+7H O = 2NaHSe+Na B O +14H

40
The reason for N2 saturation is that NaHSe can be easily oxidized in air atmosphere60, so
we need to remove all the O2 dissolved in the DI water.
From Figure 3.1, we can see that the well-prepared NaHSe solution is transparent.
However, if left in air for over 30 min, the color will change to brown, and NaHSe will be
oxidized to Se.
Figure 3.1. (a) As-prepared NaHSe solution; (b) After 30 min in the air.
41
3.3 Characterization
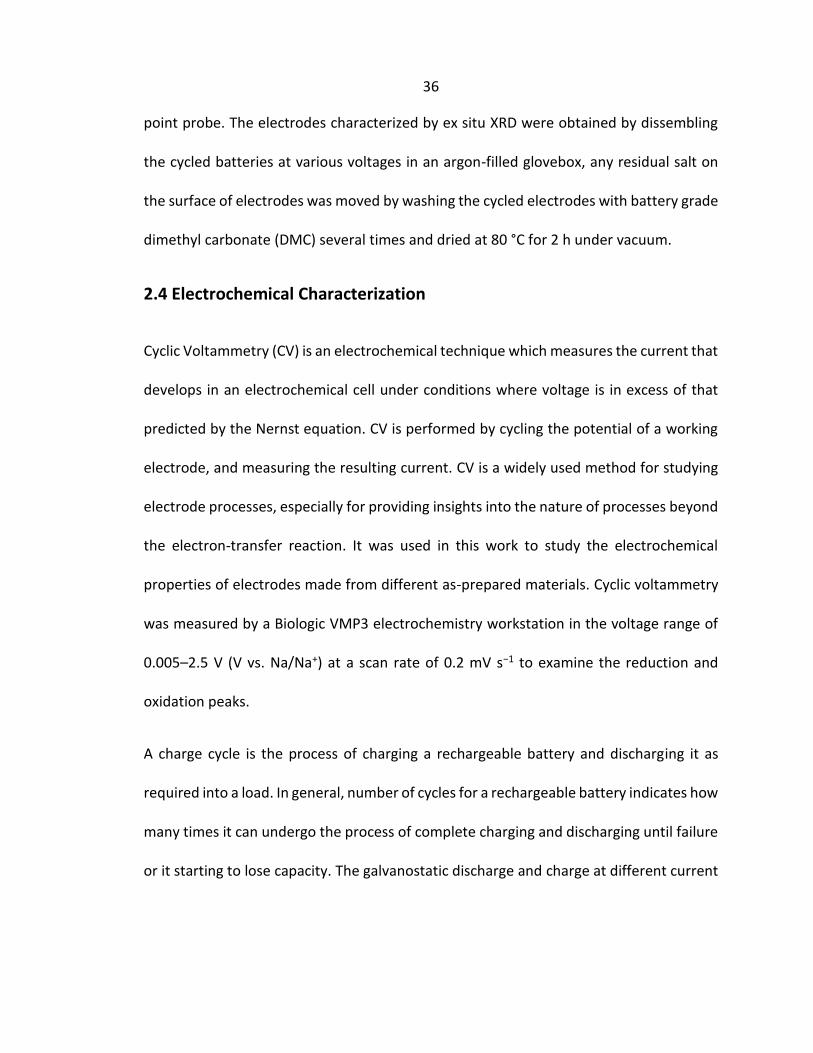
Figure 3.2. X-ray diffraction pattern for pure SnSe2 powder.
The crystal structures of the as-synthesized SnSe2 powder was characterized by X-ray
diffraction (XRD) . As shown in Figure 3.2, all the diffraction peaks can be assigned to the
hexagonal SnSe2 (JCPDS Card no. 23-0602), and the lattice constants of SnSe2 are a=b=3.81
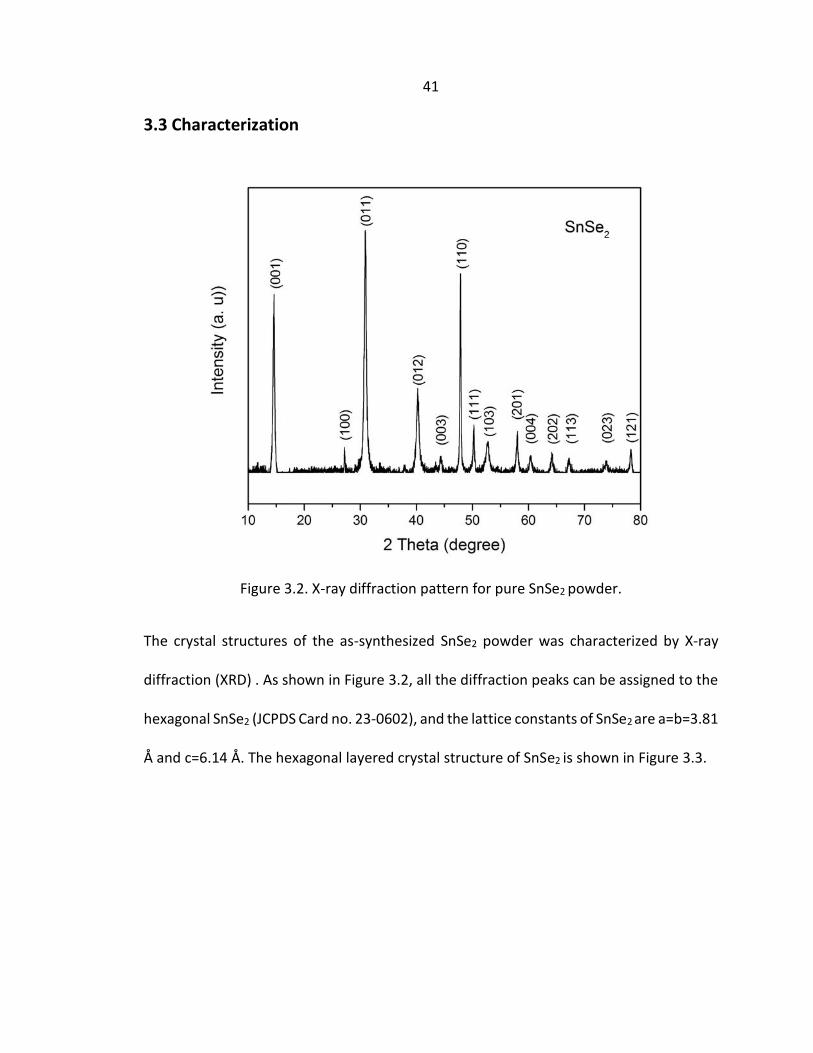
Å and c=6.14 Å. The hexagonal layered crystal structure of SnSe2 is shown in Figure 3.3.
42
Figure 3.3. Schematic illustration of crystal structure of two dimensional SnSe2.
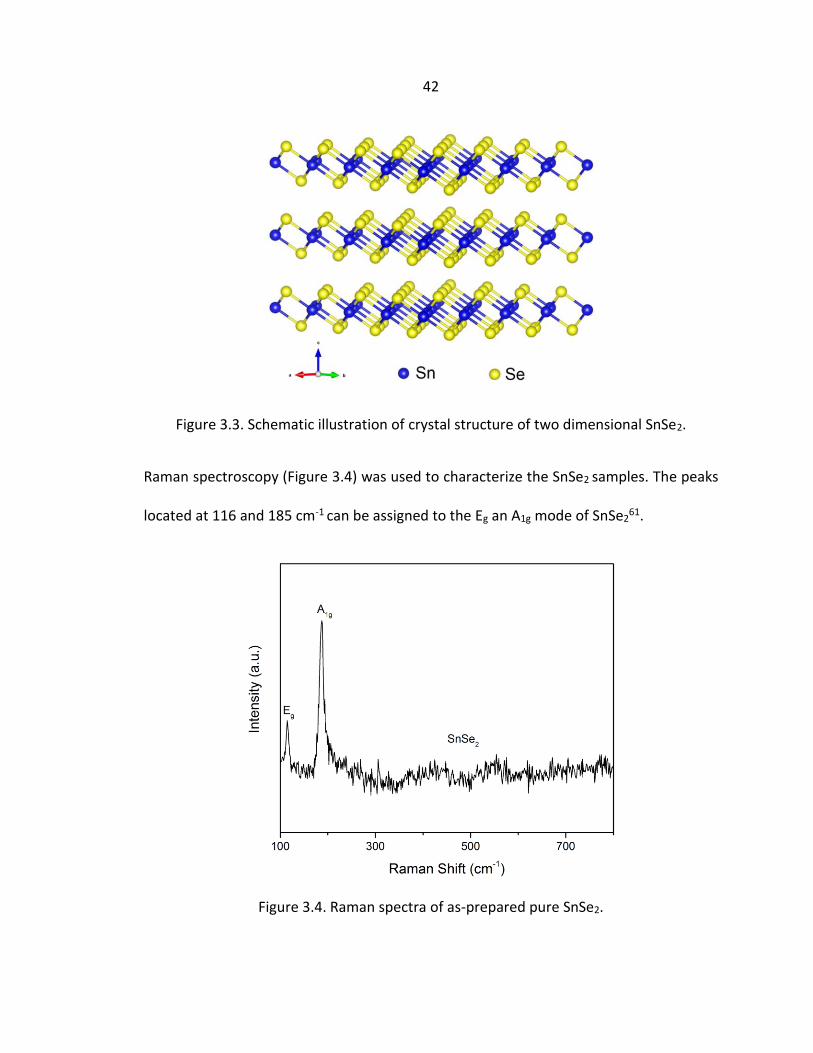
Raman spectroscopy (Figure 3.4) was used to characterize the SnSe2 samples. The peaks
located at 116 and 185 cm-1 can be assigned to the Eg an A1g mode of SnSe261.
Figure 3.4. Raman spectra of as-prepared pure SnSe2.
43
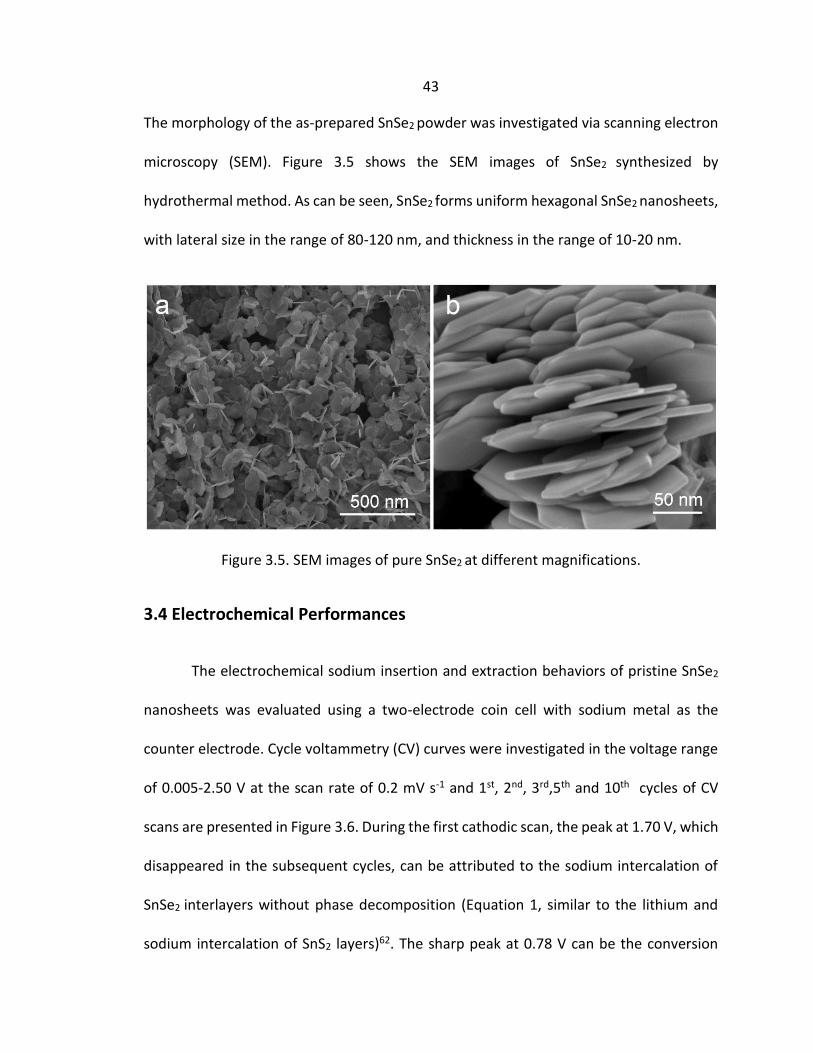
The morphology of the as-prepared SnSe2 powder was investigated via scanning electron
microscopy (SEM). Figure 3.5 shows the SEM images of SnSe2 synthesized by
hydrothermal method. As can be seen, SnSe2 forms uniform hexagonal SnSe2 nanosheets,
with lateral size in the range of 80-120 nm, and thickness in the range of 10-20 nm.
Figure 3.5. SEM images of pure SnSe2 at different magnifications.
3.4 Electrochemical Performances
The electrochemical sodium insertion and extraction behaviors of pristine SnSe2
nanosheets was evaluated using a two-electrode coin cell with sodium metal as the
counter electrode. Cycle voltammetry (CV) curves were investigated in the voltage range
of 0.005-2.50 V at the scan rate of 0.2 mV s-1 and 1st, 2nd, 3rd,5th and 10th cycles of CV
scans are presented in Figure 3.6. During the first cathodic scan, the peak at 1.70 V, which
disappeared in the subsequent cycles, can be attributed to the sodium intercalation of
SnSe2 interlayers without phase decomposition (Equation 1, similar to the lithium and
sodium intercalation of SnS2 layers)62. The sharp peak at 0.78 V can be the conversion

44
reaction, corresponding to the decomposition of the SnSe2 into metallic Sn and the
formation of Na2Se. The peak below 0.5 V can be assigned to the alloying reaction
between Sn and Na63. And the large intensity decrease of peak at 0.78 V in the second
cycles demonstrates the decomposition of the electrolyte on the surface of nanosized
SnSe2 particles at this voltage, which leads to the formation of irreversible solid electrolyte
interface (SEI), related to some irreversible capacity loss and low coulombic efficiency in
the first cycle19. During first anodic scan, the oxidation peaks at 0.18 V in all cycles can be
assigned to the desodiation reaction of Na3.75Sn alloy (Equation 2 and 3). The oxidation
peak at 1.18 V and 1.53 V can be ascribed as the restitution of the original SnSe2
nanocomposites. These distinct oxidation peaks correspond to the reversible dealloying
reaction and the reformation of SnSe2. However, it can be readily observed in the 10th
cycle of the CV scan that the intensities of pristine SnSe2 decrease rapidly which
corresponds to its poor cyclic performance. The detailed electrochemical reactions are
given in Equation (1 - 3):
+ -
2 x 2xNa +SnSe +xe Na SnSe (1)
+ -
2 24Na +SnSe +4e 2Na Se+Sn (2)
+ -
3.75Sn+3.75Na +3.75e Na Sn (3)

45
Figure 3.6. Cyclic voltammograms of SnSe2 electrode.
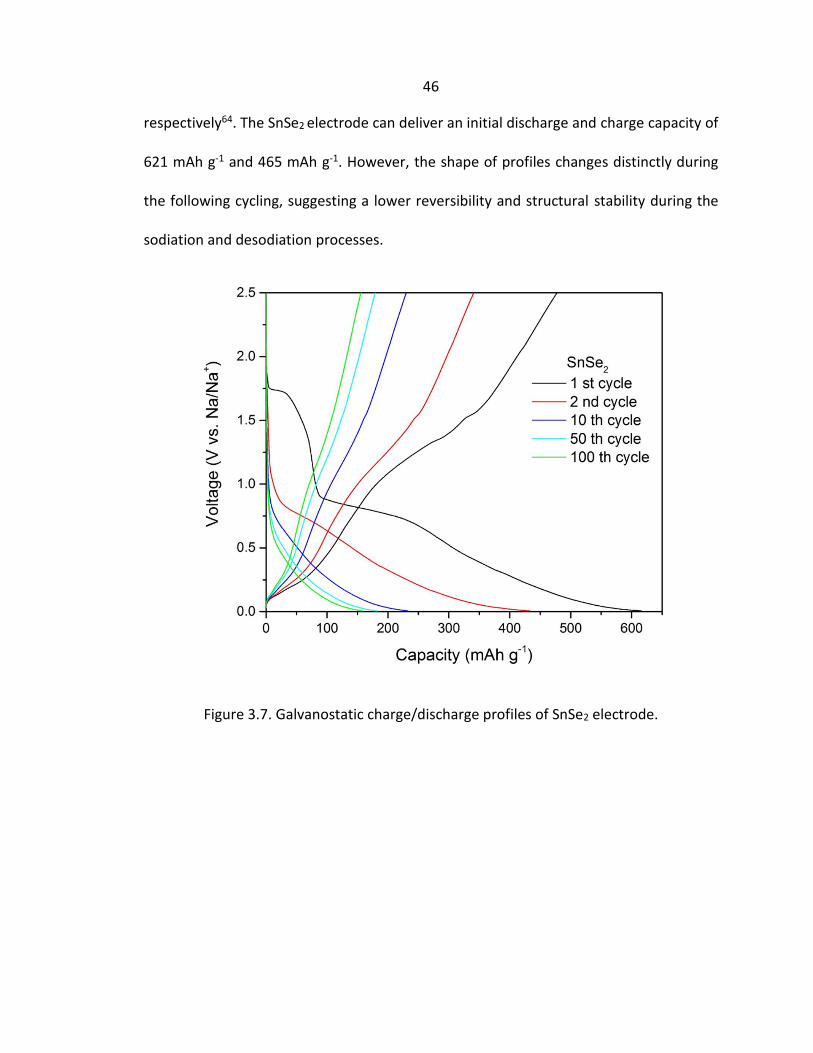
Figure 3.7 shows the galvanostatic charge/discharge profiles of pristine SnSe2
nanosheets electrodes in the 1st, 2nd, 10th, 50th and 100th cycles at a current density of 0.1
A g-1 in the potential range of 0.005-2.50 V. The charge/discharge voltage plateaus are
consistent with observations made in CV scans. The initial discharge plateau located at
1.75 V corresponds to the intercalation of sodium ions into SnSe2 interlayers, but it
disappears after the first cycle, which confirms this Na+ intercalation process is
irreversible. The discharge plateau located at 0.78 V and below 0.5 V are ascribed to the
conversion and alloying reactions, respectively. During the first desodiation process, the
small voltage plateau and broad voltage plateau located at 0.25 V and 1.20 V are
consistent with the dealloying of Na3.75Sn and restitution of the original SnSe2 structure,
46
respectively64. The SnSe2 electrode can deliver an initial discharge and charge capacity of
621 mAh g-1 and 465 mAh g-1. However, the shape of profiles changes distinctly during
the following cycling, suggesting a lower reversibility and structural stability during the
sodiation and desodiation processes.
Figure 3.7. Galvanostatic charge/discharge profiles of SnSe2 electrode.

47
Chapter 4: Synthesis of SnSe2/RGO and the Electrochemical Performances
4.1 Synthesis of RGO
Graphene oxide (GO) was prepared using a modified Hummers method65. In a typical
process, 0.5 g graphite powder, 0.5 g sodium nitrate and 25 mL of concentrated sulfuric
acid (98%) were mixed and strongly stirred for 30 min in the ice bath. Then 3 g potassium
was slowly added to the above solution and cooled for 30 min. Then remove the ice bath,
and the suspension was continuously stirred at room temperature for 48 h, then we will
get a brown slurry. 190 mL of pure water was added to the suspension slowly and the
temperature will rise very fast. After that, 140 mL of warm water and 10 mL of H2O2 (30%)
were further added to reduce residual manganese dioxide and permanganate to colorless
soluble manganese sulfate. The mixture was centrifuged at 3000 rpm for 10 min, remove
the supernatant liquid and washed with a mixed aqueous solution of 6 wt% HCl/1 wt%
H2O2, and repeat this step for 5 times until the pH value of the solution over 5. Then the
solution was washed with water, finally, we can get the graphene oxide solution.
The reduction of graphene oxide was carried out with the assistance of hydrazine hydrate
(35 wt% in water) and ammonia solution (28 wt% in water). In a typical procedure, 150.0
μl of hydrazine solution and 1 ml ammonia solution were added into the 100 ml
homogeneous dispersed graphene oxide solution in a 200 ml glass beaker, which was put
into a 95 ℃ water bath and stirred for 1 h66. Color of the solution would turn to black
gradually, which suggesting the successful reduction of graphene oxide to reduced
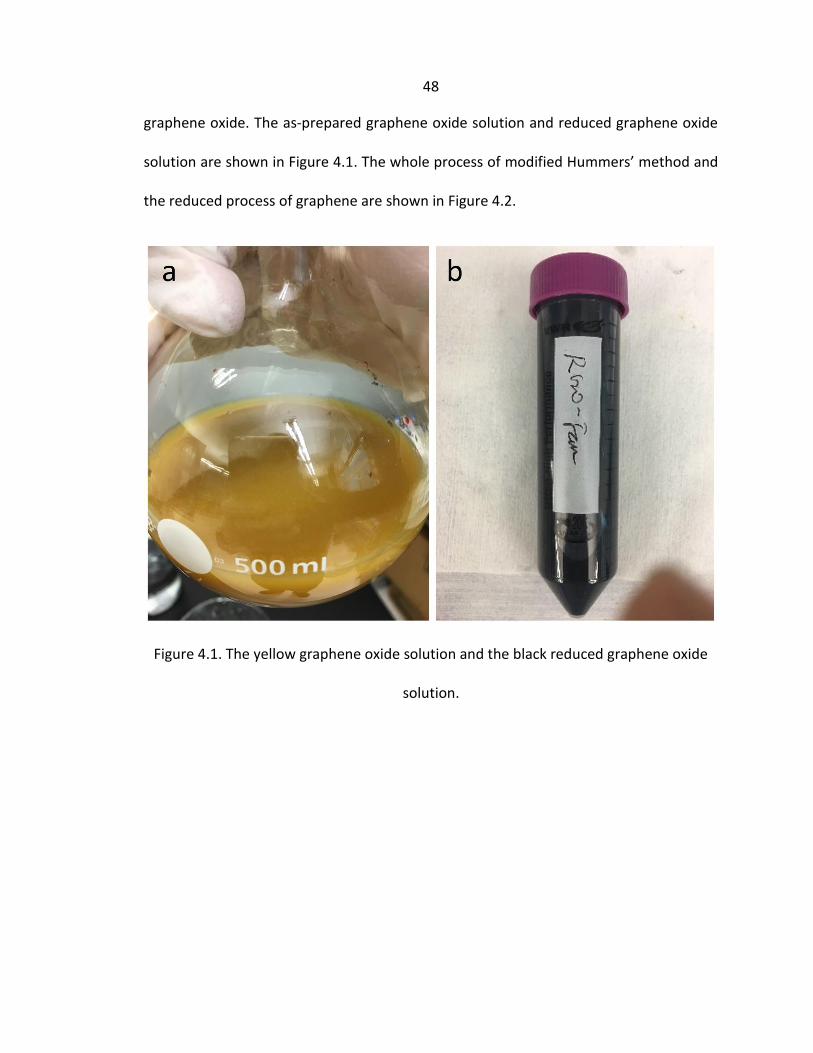
48
graphene oxide. The as-prepared graphene oxide solution and reduced graphene oxide
solution are shown in Figure 4.1. The whole process of modified Hummers’ method and
the reduced process of graphene are shown in Figure 4.2.
Figure 4.1. The yellow graphene oxide solution and the black reduced graphene oxide
solution.

49
Figure 4.2. Modified Hummers’ method and the reduction process.
4.2 Synthesis of SnSe2/RGO
A typical synthesis procedure of SnSe2/RGO composites is given as follows: 0.176g SnCl4
·5H2O (0.5 mmol) was added to 5 ml deionized water (DI water) under stirring as the tin
source. Then, 0.08 g NaBH4 (2 mmol) was dissolved in 5 mL N2 statured DI water in a glass
bottle, after that, 0.08g Se powder (1 mmol) was added into the bottle with protective N2
or Argon atmosphere under gently shaking until the Se powder totally dissolved and a
clear transparent solution was obtained, which was used as the selenium source-NaHSe
solution. Next, 5 ml tin source and 5 ml selenium source were mixed with 30 ml N2
statured RGO solution (~ 35mg RGO) and stirred for 30 min. Finally, the mixture was
transferred to a 50 ml Teflon-lined stainless steel autoclave, and heated in an electric
oven at 180 ℃ for 24 h. After cooling to room temperature, the obtained product was
50
collected by centrifugation, washed with DI water and ethanol for several times and dried
at 60 ℃ for 12 h under vacuum.
4.3 Characterization
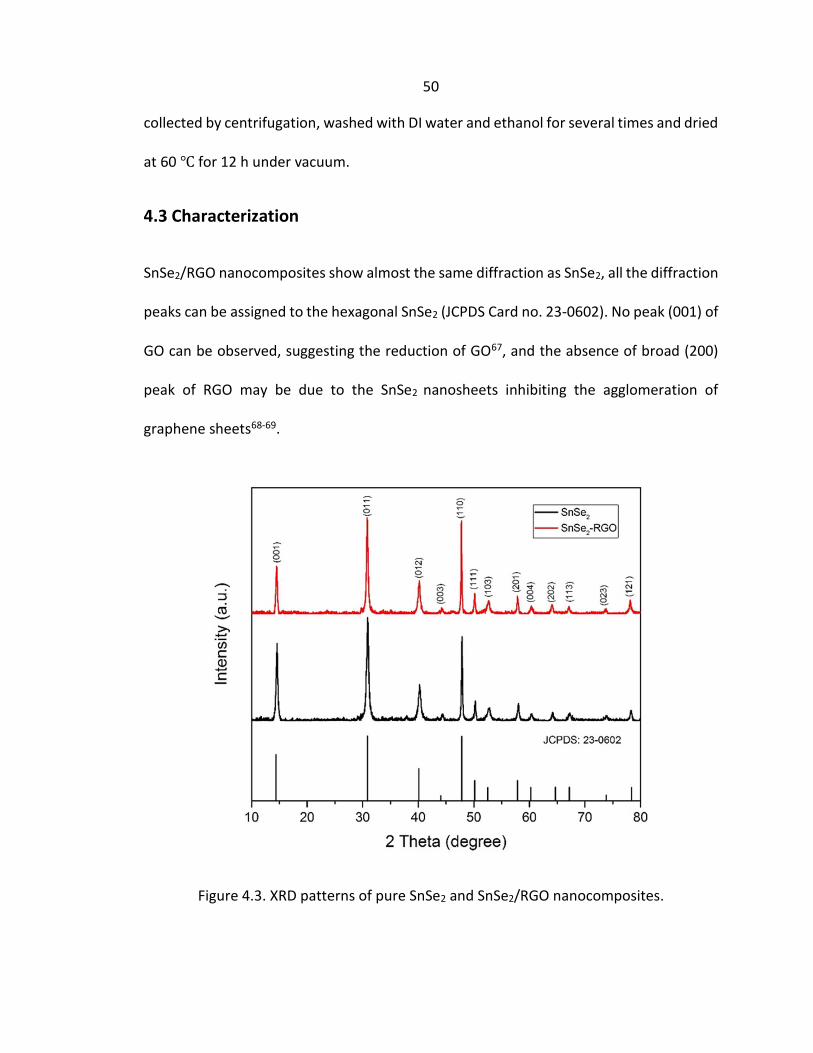
SnSe2/RGO nanocomposites show almost the same diffraction as SnSe2, all the diffraction
peaks can be assigned to the hexagonal SnSe2 (JCPDS Card no. 23-0602). No peak (001) of
GO can be observed, suggesting the reduction of GO67, and the absence of broad (200)
peak of RGO may be due to the SnSe2 nanosheets inhibiting the agglomeration of
graphene sheets68-69.
Figure 4.3. XRD patterns of pure SnSe2 and SnSe2/RGO nanocomposites.
51
Raman spectroscopy (Figure 4.4) was used to characterize the GO and SnSe2/RGO
samples. The peaks located at 116 and 185 cm-1 can be assigned to the Eg an A1g mode of
SnSe2. The intensity ratio of D-mode and G-mode (ID/IG) of RGO in SnSe2/RGO sample is
1.22, higher than intensity ratio of GO, which is calculated to be 0.98, indicating that the
majority of oxygen-containing groups have been removed and the reduction of the
average size of the sp2 domain after GO reduction40. In addition, it can be seen that for
the SnSe2/RGO composites, the D-band shifts from 1366 to 1343 cm-1, while G-band shifts
from 1608 to 1602 cm-1; the lower frequencies indicate the successful reduction from GO
to RGO70.
Figure 4.4. Raman spectra of as-prepared GO and SnSe2/RGO nanocomposites.
52
To determine the content of RGO in the nanocomposites, thermogravimetric
analysis (TGA) were carried out from 30 to 700 ℃ at a heating rate of 10 ℃ min-1 in the
air. Figure 4.5 shows the TGA results, in which five steps of weight change can be observed
and explained as follows. The first step of weight loss, from room temperature to 200 ℃,
can be attributed to the evaporation of surface water and the removal of oxygen-
containing functional groups from RGO71. Then SnSe2 starts to pyrolyze at around 200 ℃
as 2 2 2 2SnSe +3O =SnO +2SeO , resulting in nearly 10% weight increment between 200
and 330 ℃72. After that, SeO2 reaches its sublimation temperature and starts to volatilize,
and the weight decreases rapidly until 430 ℃, where all the solid SeO2 has volatilized.
Then, the step between 430 and 580 ℃ can be ascribed to the combustion of RGO. For
the last step beyond 580 ℃, all the final residue is SnO2. The total weight loss of
SnSe2/RGO composites is 56.4%, which is equal to the sum of weight loss of SnSe2 and
RGO, the weight percentage of RGO in the composites can be calculated from the
following formula:
M×56.4%=M×X+M×(1-X)×42.3%
M: the mass of SnSe2/RGO composites; X: the weight percentage of RGO in the
composites. Therefore, the accurate weight percentage of RGO in the composites is
calculated to be 24.4%, so the mass loading of active materials (SnSe2) is as high as 75.6%,
which is significant to the practical application.

53
Figure 4.5. TG curves of SnSe2 and SnSe2/RGO.
The surface composition of SnSe2/RGO nanocomposites and chemical states of C,
Sn and Se elements were further characterized using X-ray photoelectron spectroscopy
(XPS), as shown in Figure 4.6. The survey scan spectrum (Figure 4.6a) shows that the main
elements in SnSe2/RGO nanocomposites are C, Sn, Se and O. In the high-resolution C 1s
spectrum (Figure 4.6b), the detected peaks can be deconvoluted into five peaks, the
carbon in C-C, C-O, C=O and O-C=O appears at 284.8 eV, 286.2 eV, 287.3 eV and 289.1 eV,
respectively. The strong intensity of C-C peak and low intensities of functional group peaks
indicate the extraction of oxygen-involved groups and high reduction of GO73. And the
peak at 282.6 eV is assigned to carbon in C-Sn bonding. Figure 4.6c shows the high-
resolution spectrum of Sn 3d. Two peaks at 487.8 eV and 495.9 eV can be ascribed to the
Sn 3d5/2 and Sn 3d3/2 photoelectron emissions respectively. According to the fitting
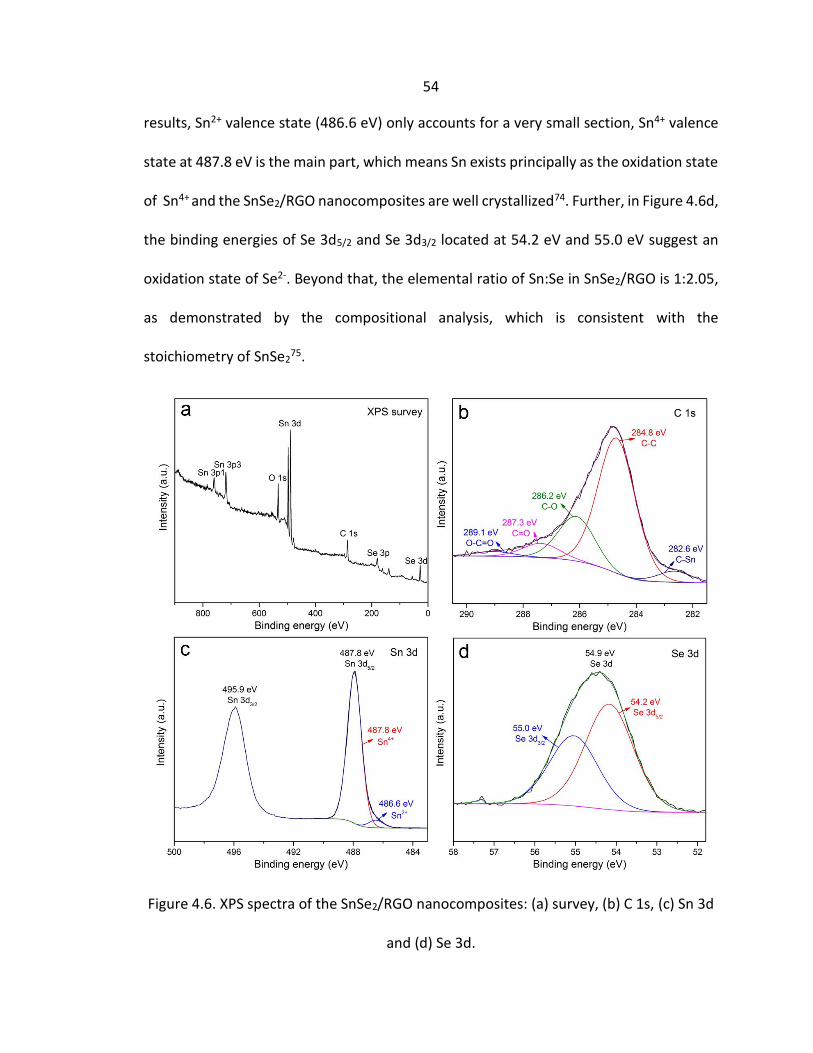
54
results, Sn2+ valence state (486.6 eV) only accounts for a very small section, Sn4+ valence
state at 487.8 eV is the main part, which means Sn exists principally as the oxidation state
of Sn4+ and the SnSe2/RGO nanocomposites are well crystallized74. Further, in Figure 4.6d,
the binding energies of Se 3d5/2 and Se 3d3/2 located at 54.2 eV and 55.0 eV suggest an
oxidation state of Se2-. Beyond that, the elemental ratio of Sn:Se in SnSe2/RGO is 1:2.05,
as demonstrated by the compositional analysis, which is consistent with the
stoichiometry of SnSe275.
Figure 4.6. XPS spectra of the SnSe2/RGO nanocomposites: (a) survey, (b) C 1s, (c) Sn 3d
and (d) Se 3d.

55
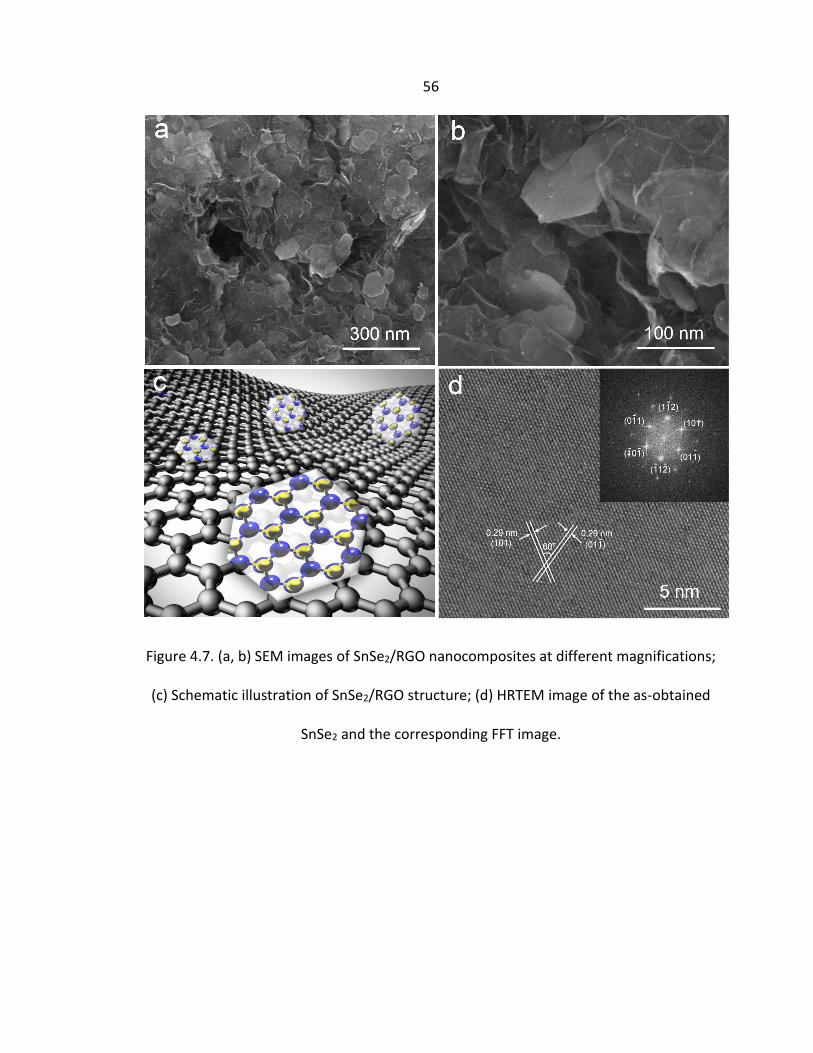
The morphology and crystal structure of the as-prepared SnSe2/RGO nanocomposites
were investigated via scanning electron microscopy (SEM) and high-resolution
transmission electron microscopy (HRTEM). Figure 4.7a shows the SEM images of
SnSe2/RGO synthesized by hydrothermal method. As can be seen, the uniform hexagonal
SnSe2 nanosheets nucleates heterogeneously on RGO, which is introduced into the
reaction vessel. This process results in uniform SnSe2 growth on the RGO sheets without
any aggregation, and SnSe2 maintains its hexagonal morphology (Figure 4.7a and 4.7b).
The morphology of SnSe2 nanosheets on 2D reduced graphene oxide was fabricated as
schematic illustration described in Figure 4.7c. The crystal planes of the hexagonal
nanosheets were investigated by HRTEM, as shown in Figure 4.7d. The (101) and (011)
crystal plan with lattice spacing of 0.29 nm can be observed from the top view of the
nanosheets.
EDX mapping demonstrates the existence of the elements C, Sn and Se and the dispersion
homogeneities with obvious boundary between hexagonal structure SnSe2 nanosheets
and RGO sheets (Figure 4.8). The signal of silicon comes from the silicon substrate used
for SEM test.
56
Figure 4.7. (a, b) SEM images of SnSe2/RGO nanocomposites at different magnifications;
(c) Schematic illustration of SnSe2/RGO structure; (d) HRTEM image of the as-obtained
SnSe2 and the corresponding FFT image.

57
Figure 4.8. EDX and mapping of SnSe2/RGO nanocomposites.
58
4.4 Electrochemical Performances
The electrochemical sodium insertion and extraction behaviors of SnSe2/RGO
nanocomposites were evaluated using a two-electrode coin cell with sodium metal as the
counter electrode. Cycle voltammetry (CV) curves were investigated in the voltage range
of 0.005-2.50 V at the scan rate of 0.2 mV s-1 and 1st, 2nd, 3rd,5th and 10th cycles of CV
scans are presented in Figure 4.9. The CV scan of SnSe2/RGO composites shows similar
peaks with pristine SnSe2, indicating the similar electrochemical reaction. For the
SnSe2/RGO nanocomposites. As shown in Figure 4.9, during the first cathodic scan, the
peak at 1.68 V and 1.30 V, which disappeared in the subsequent cycles, can be attributed
to the sodium intercalation of SnSe2 interlayers without phase decomposition (similar to
the lithium and sodium intercalation of SnS2 layers). The sharp peak at 0.78 V can be
assigned to the conversion reactions, corresponding to the decomposition of the SnSe2
into metallic Sn and the formation of Na2Se. The sharp peak below 0.5 V can be assigned
to the alloying reaction between Sn and Na. And the large intensity decrease of peak at
0.78 V in the second cycles demonstrates the decomposition of the electrolyte on the
surface of nanosized SnSe2 particles and RGO sheets at this voltage, which leads to the
formation of irreversible solid electrolyte interface (SEI), related to some irreversible
capacity loss and low coulombic efficiency in the first cycle76. During first anodic scan, the
oxidation peaks at 0.2 and 0.75 V in all cycles can be assigned to the desodiation reaction
of Na3.75Sn alloy. The oxidation peak at 1.42 V can be ascribed as the restitution of the
original SnSe2/RGO nanocomposites. These distinct oxidation peaks correspond to the
59
reversible dealloying reaction and the reformation of SnSe2/RGO. The CV curves for the
following ten cycles are superimposed very well with each other, indicating the excellent
reversibility of SnSe2/RGO for sodiation and desodiation processes.
Figure 4.9. Cyclic voltammograms of SnSe2/RGO electrode between 0.005 V and 2.5 V
with a can rate of 0.2 mV/s.
Figure 4.10 show the galvanostatic charge/discharge profiles of SnSe2/RGO
nanocomposites electrodes in the 1st, 2nd, 10th, 50th and 100th cycles at a current density
of 0.1 A g-1 in the potential range of 0.005-2.50 V. The charge/discharge voltage plateaus
are consistent with observations made in CV scans. The initial discharge plateau located
at 1.70 V corresponds to the intercalation of sodium ions into SnSe2 interlayers, but it
disappears after the first cycle, which confirms this Na+ intercalation process is
irreversible62. The following discharge plateau located at 0.78 V and below 0.5 V are

60
ascribed to the conversion and alloying reactions63. During the first desodiation process,
the small voltage plateau and broad voltage plateau located at 0.75 V and 1.40 V are
consistent with the dealloying of Na3.75Sn and restitution of the original SnSe2/RGO
structure, respectively, revealing the highly reversibility of the electrode64. The
SnSe2/RGO nanocomposites exhibit a high first discharge capacity of 798 mAh g-1 (a little
higher than the theoretical capacity 756 mAh g-1) and charge capacity of 660 mAh g-1. The
electrode materials may not be fully involved in the sodiation process if the irreversible
capacity generated from the electrolyte decomposition and SEI formation were taken into
consideration. From second cycle, the shape of charge/discharge profiles are similar,
indicating the sodium storage is highly reversible, and after 100 cycles, the SnSe2/RGO
nanocomposites exhibit a high reversible capacity of 515 mAh g-1, indicating a high
stability of the electrode.

61
Figure 4.10. Galvanostatic charge/discharge profiles of SnSe2/RGO electrode in the 1st,
2nd, 10th, 50th, 100th cycles.
To further evaluate the Na+ diffusion performances in the SnSe2/RGO electrode, cyclic
voltammetry (CV) at various scan rates from 0.1 mV s-1 to 2.0 mV s-1 was performed in the
voltage range of 0.005-2.50 V. As shown in Figure 4.11, the cathodic peaks moved to lower
voltages while the anodic peaks shifted to higher ones when the scan rate was increased.
This result can be explained as follows: the redox reactions can happen over the entire
active surface area while the scan rate is low; however, at high scan rates, due to the time
constraint, the diffusion of Na+ ions will be limited and the electrode will be polarized.
Hence, only the outer active surface is effective for redox reactions, which results in the
position shift of both reduction and oxidation peaks. The redox peaks were still clearly
present in the CV curves of the SnSe2/RGO electrode with increasing scan rate up to 2.0

62
mV/s, indicating excellent reversibility of the Na+ extraction-insertion reaction, and good
electronic conductivity of the SnSe2/RGO electrode.
Figure 4.11. Cyclic voltammograms of SnSe2/RGO electrodes at various scan rates.

63
Chapter 5: Comparison between SnSe2 and SnSe2/RGO Anodes
5.1 Comparison of Electrochemical Performances
Figure 5.1 depicts the cycling performances of as-synthesized pristine SnSe2 and
SnSe2/RGO composites electrodes at a current density of 0.1 A g-1 between 0.005 and 2.50
V. The initial discharge and charge capacities of SnSe2/RGO composites are 798 mAh g-1
and 660 mAh g-1, respectively, corresponding to a coulombic efficiency (CE) of 83%, the
first cycle capacity loss pertains to the formation of SEI film formation77. After first cycle,
CE increases quickly to over 99% and remains at nearly 100% thereafter, revealing a high
stability of SEI formed on anode/electrolyte interface during first cycle78. The SnSe2/RGO
electrode demonstrates excellent cycling stability and reversibility in the following cycles.
After 100 cycles, a reversible capacity as high as 515 mAh g-1 was maintained. In contrast,
cells made of pristine SnSe2 electrode shows a lower initial capacity of 621 mAh g-1 for
discharging and 465 mAh g-1 for charging, and a reversible capacity of 152 mAh g-1 after
100 cycles. The poor cycle performance and reversible capacity is mainly due to the low
conductivity and huge volume change of unsupported SnSe2 and the aggregation of Sn or
Na3.75Sn nanoparticles during the cycling process54. The obvious difference between
pristine SnSe2 and SnSe2/RGO electrodes suggests that after the insertion of conductive
RGO into SnSe2 nanosheets, the formation of three dimensional network architecture
with nanosized SnSe2 sheets will improve the conductivity of the composites. RGO can be
considered as an ideal supporting matrix for the transportation and storage of sodium
ions due to its high intrinsic surface and flexibility, and it will buffer the big volume change

64
and prevent nanosized particles aggregation during the sodiation and desodiation
process79.
Figure 5.1. Cycling performances of SnSe2 and SnSe2/RGO electrodes at 0.1 A g-1.
Moreover, the SnSe2/RGO electrode also exhibited excellent rate capability when tested
at high current densities. Figure 5.2 shows the rate performances of the pristine SnSe2
and SnSe2/RGO electrodes at different current densities between 0.1 and 2 A g-1. With
the current densities increasing from 0.1 to 0.2, 0.3, 0.5, 1.0, 2.0 A g-1 , the SnSe2/RGO
electrodes exhibit good capacity retention, varying from 528 to 504, 485, 440, 398, 365
mAh g-1, respectively. And a reversible capacity of 520 mAh g-1, almost without capacity
loss, can be achieved after the rate returns to 0.1 A g-1, which is much larger than the
pristine SnSe2 electrode. The pristine SnSe2 electrode only maintains a specific capacity of
82 mAh g-1 at the 2.0 A g-1, and when current density is reduced to 0.1 A g-1, only a
reversible capacity of 172 mAh g-1 is maintained. These results demonstrate that the

65
SnSe2/RGO nanocomposites with high electrical conductivity and large specific surface
area can allow the transformation of sodium ions at high current density without
irreversible change of three dimensional hybrid structure80.
Figure 5.2. Rate performance of SnSe2 and SnSe2/RGO electrodes.
5.2 Characterization
Different tests were utilized to understand why SnSe2/RGO have much better
performances than pure SnSe2.
Firstly, In order to confirm the large specific surface area and excellent electronic
conductivity of SnSe2/RGO nanocomposite compared with pure SnSe2, N2
adsorption/desorption isotherms were used to obtain the surface area, (as shown in
Figure 5.3) and four-point probe measurements were performed to obtain the electronic
conductivity. Based on the multi-point Brunauer–Emmett–Teller (BET) curves shown in
Figure 5.3, we be calculated that the specific surface area of the pure SnSe2 and

66
SnSe2/RGO are 28.7 m2 g-1 and 87.0 m2 g-1, respectively, which explains the substantial
improvement in SnSe2 performance after the addition of RGO. At room temperature, the
electronic conductivity of pure SnSe2 was 3.24x10⁻⁷ S/cm, whereas the conductivity of the
SnSe2/RGO nanocomposites was 2.12x10⁻¹ S/cm, which explains the improved
performance of SnSe2 when it was combined with RGO.
Figure 5.3. N2 adsorption/desorption isotherms of (a) Pure SnSe2 and (b) SnSe2/RGO
composite.
67
Secondly, the electrochemical impedance spectroscopy (EIS) was carried out to better
understand the reaction kinetics and electrical conductivities of SnSe2 electrode with and
without RGO. Figure 5.4 shows the Nyquist plots of pure SnSe2 nanosheets and SnSe2/RGO
nanocomposites; the inset shows the equivalent circuit model fitting with the
experimental results. The semi-circle in the high frequency region is associated with the
charge-transfer resistance Rct and the double-layer capacitance of electrode-electrolyte
interface Cd1. The straight sloping line in the low frequency region corresponds to the
sodium ion diffusion process. It can be readily observed that SnSe2/RGO electrode has a
smaller semicircle diameter (Rct = 45 Ω) as compared with SnSe2 electrode (Rct = 120 Ω),
indicating that SnSe2/RGO has higher electrical conductivity and faster reaction kinetics.
This result can be attributed to the large contact area between electrode and electrolyte
in the presence of RGO.
Figure 5.4. Nyquist plots of SnSe2 and SnSe2/RGO electrodes.
68
Thirdly, the mechanism of stability of SnSe2/RGO electrode was further studied by ex situ
SEM imaging. The SEM images of pristine SnSe2 and SnSe2/RGO electrodes and the same
electrodes after 100 cycles one are shown in the Figure 5.5. As we can see, after 100
cycles, the structure of SnSe2 electrodes had been totally destroyed; in contrast, the
hexagonal nanosheet morphology of SnSe2/RGO was maintained, even though the
surfaces and boundaries of SnSe2 crystal in SnSe2/RGO composite became blurred,
indicating good structural stability of the SnSe2/RGO composite.

69
Figure 5.5. SEM images of (a) SnSe2 electrode before cycling and (b) after 100 cycles; (c,
d) SnSe2/RGO electrode before cycling; (e, f) SnSe2/RGO electrode after 100 cycles.
70
Chapter 6: Electrochemical Mechanism of SnSe2/RGO electrodes
6.1 Mechanism
In order to further clarify the electrochemical mechanism and the reversible
structure conversions upon the sodiation and desodiation processes, ex situ XRD and
HRTEM analyses of the SnSe2/RGO electrode at various discharge and charge states in the
first cycle were carried out. As shown in Figure 6.1a, the fresh electrode (state A) shows
a clear XRD pattern of the pure SnSe2 lattice with the peak located at 43.5 degree, which
is attributed to the copper current collector. When the cell is discharged to 1.70 V (state
B), the XRD pattern shows nothing different except the decrease of peak intensities and
broadening of peaks, corresponding to the intercalation process of Na+ into SnSe2 forming
NaxSnSe2. During the insertion of Na+, the interlayer spaces between SnSe2 monolayers
can be opened and crystal structure of SnSe2 breaks down gradually. This is because the
SnSe2 layers cannot provide enough space for too many Na+ ions. With increasing
interlayer spacing, the crystal structure will become amorphous, consistent with
broadening of peaks and decreasing of intensities74. Upon discharging to 1.2 V (state C),
the electrode becomes almost totally amorphous and no distinct peaks can be detected.
After further discharging to 0.78 V (state D), the existence of β-Sn and Na2Se can be
observed by their characteristic peaks at 30.6 and 37.5 degree in the XRD pattern, and
their crystal structures can be found in the ex situ HRTEM image (Figure 6.2), indicating
the conversion reaction from SnSe2 to β-Sn and Na2Se at an initial stage of the Na+
reaction. Following the gradual conversion reaction, alloying reaction will occur

71
simultaneously, forming NaxSn (x=3.75)41. After fully discharging to 0.005 V (state E), the
Na2Se peak intensities become stronger, but beyond that, two broad peaks located at
around 18.5 and 32.5 degree appear, corresponding to the sodiated Sn phase as NaxSn,
and the very small crystallite size of the alloy81. After reverse charging to 1.05 V (state F),
the NaxSn phase signals disappear and β-Sn signal become stronger, indicating the
dealloying reaction of Na-Sn crystalline particles, and the reappearance of metallic Sn.
When the electrode is charged to 1.42 V (state G), the peak intensities corresponding to
SnSe2 increase, while β-Sn and Na2Se decrease gradually, which can be assigned to the
recombination of β-Sn and Na2Se, generating SnSe2. Finally, after fully charging to 2.5 V
(state H), the peaks of β-Sn and Na2Se almost disappear, where only nanosized SnSe2
exists, which is also demonstrated by the ex situ HRTEM results (Figure 6.2). The lattice
fringes of SnSe2, Sn, and Na2Se can be found and the nanosized SnSe2 is the main
component, indicating a high electrochemical reaction reversibility; it is worth mentioning
that the SAED pattern indicates a polycrystalline nature of SnSe2, due to its nanoscale size.
The result indicates that during sodiation and desodiation processes, the SnSe2/RGO
electrode can retain its crystal and chemical structure, and the existence of RGO can
relieve the aggregation and restacking of nanosized SnSe2, which will be contributing to
the high reversible capacity and remarkable cycling performances.

72
Figure 6.1. (a) Ex-situ XRD patterns of the SnSe2/RGO electrode collected at different
discharge/charge states as indicated in the corresponding voltage profile. (A) fresh
electrode, (B) discharge to 1.70 V, (C) discharge to 1.20 V, (D) discharge to 0.78 V, (E)
discharge to 0.005 V, (F) charge to 1.05 V, (G) charge to 1.42 V, (H) charge to 2.50 V; (b)
Schematic illustration of the structure evolution during the sodiation process.
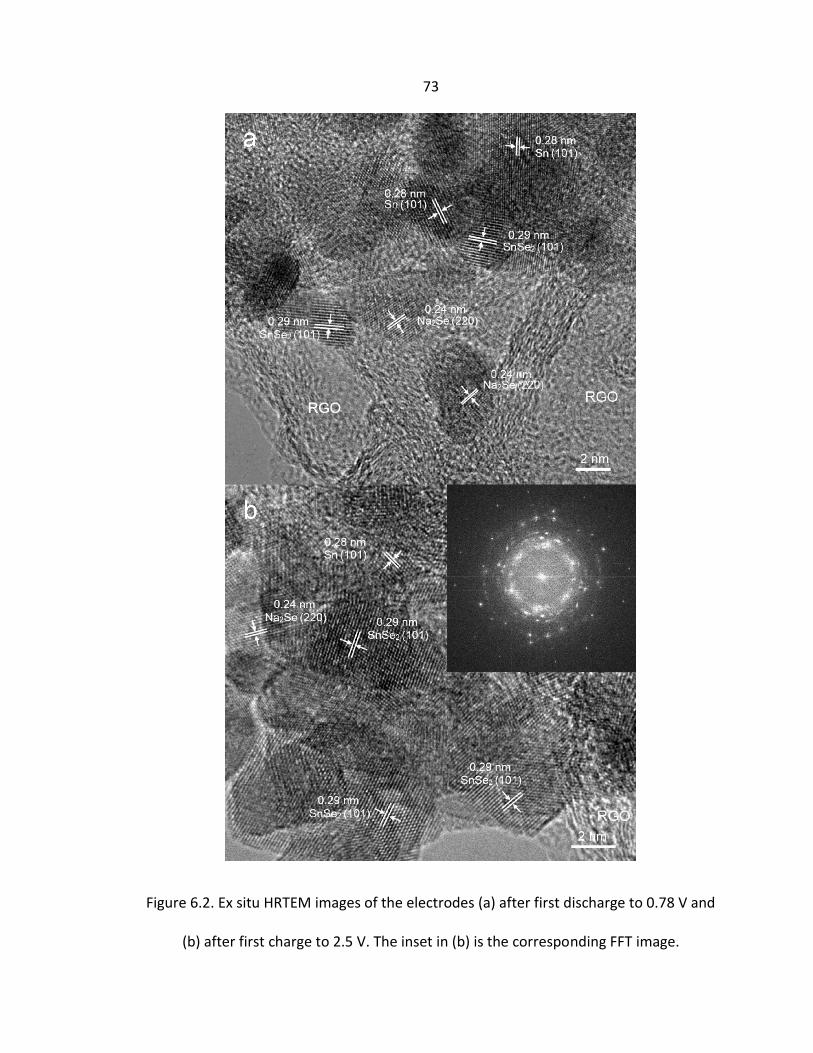
73
Figure 6.2. Ex situ HRTEM images of the electrodes (a) after first discharge to 0.78 V and
(b) after first charge to 2.5 V. The inset in (b) is the corresponding FFT image.
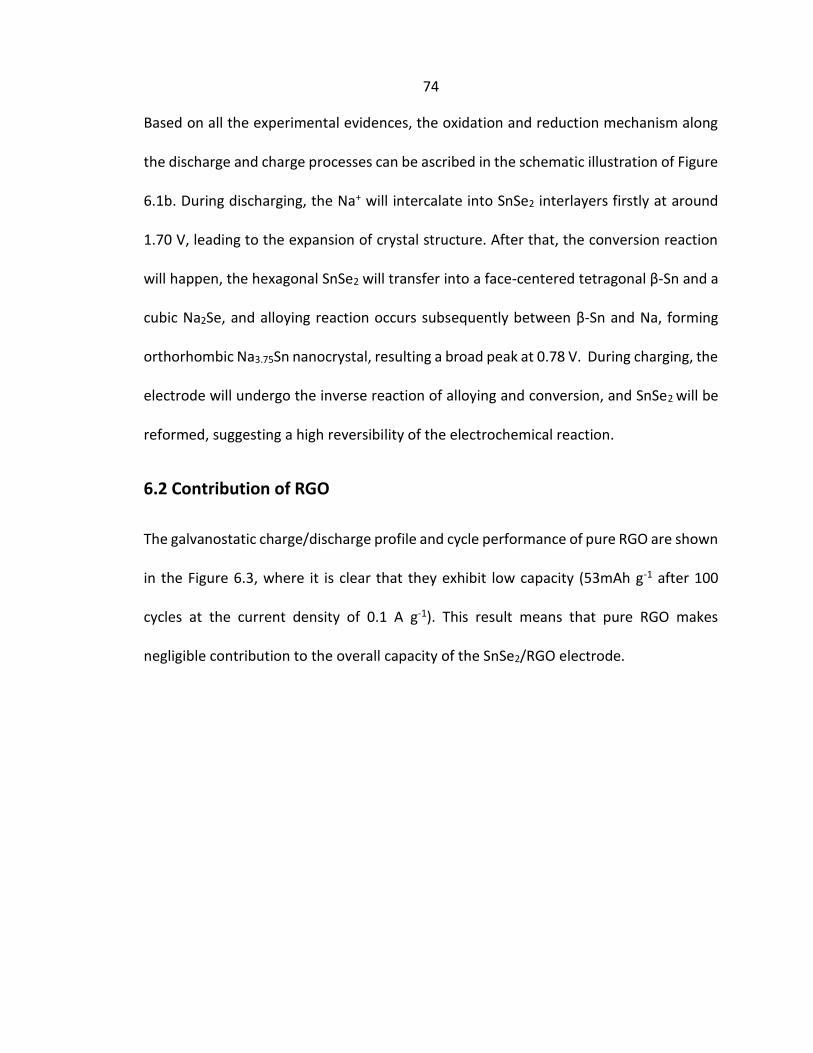
74
Based on all the experimental evidences, the oxidation and reduction mechanism along
the discharge and charge processes can be ascribed in the schematic illustration of Figure
6.1b. During discharging, the Na+ will intercalate into SnSe2 interlayers firstly at around
1.70 V, leading to the expansion of crystal structure. After that, the conversion reaction
will happen, the hexagonal SnSe2 will transfer into a face-centered tetragonal β-Sn and a
cubic Na2Se, and alloying reaction occurs subsequently between β-Sn and Na, forming
orthorhombic Na3.75Sn nanocrystal, resulting a broad peak at 0.78 V. During charging, the
electrode will undergo the inverse reaction of alloying and conversion, and SnSe2 will be
reformed, suggesting a high reversibility of the electrochemical reaction.
6.2 Contribution of RGO
The galvanostatic charge/discharge profile and cycle performance of pure RGO are shown
in the Figure 6.3, where it is clear that they exhibit low capacity (53mAh g-1 after 100
cycles at the current density of 0.1 A g-1). This result means that pure RGO makes
negligible contribution to the overall capacity of the SnSe2/RGO electrode.

75
Figure 6.3. (a) Galvanostatic charge/discharge profiles of pure RGO electrode in the 1st,
2nd, 10th, 50th and 100th cycles; (b) Cycling performances of pure RGO electrode at 0.1 A
g-1 for 100 cycles;

76
As we know, the large volumetric changes that occur during the charge/discharge process
of tin-based materials, result in electrical disconnection from the conductive medium (e.g.
Super P) and current collectors (e.g. Cu foil), which severely affects the stability of the
electrode. SnSe2, as a two dimensional material, may tolerate the volumetric changes
caused by sodiation and desodiation process thanks to its layered crystal structure. Figure
6.4 illustrates the structure change of SnSe2 and SnSe2/RGO after sodium ion
intercalation, and Figure 6.4b shows the simulation results for the lattice expansion of
NaxSnSe2 (0 ≤ x ≤ 2) as the function of the number of Na atoms per unit cell. When x ≤ 1,
the volume increases very slowly, for pristine SnSe2 and SnSe2/RGO composites, with
lattice expansions are 0.5% and 3.5%, respectively. When the Na content is higher than 1
(x>1), the volume of pristine SnSe2 increases swiftly, but the SnSe2/RGO composite still
shows very small expansions. Finally, when the electrode is sodiated to Na2SnSe2, the
lattice expansions of pristine SnSe2 and SnSe2/RGO composites increase to 17.5% and
1.0%, respectively. This result is consistent with experimental data, and we can therefore
conclude that the large intrinsic surface area of RGO is an appropriate supporting matrix
for SnSe2 nanosheets. Hence RGO effectively buffers the volume change of SnSe2 and
maintains stability of the electrode structure.

77
Figure 6.4. (a) Schematic illustration of structure change of SnSe2 and SnSe2/RGO after
sodium ion intercalation; (b) Lattice expansion as the function of Na atoms per unit cell.

78
Chapter 7: Conclusion
We have demonstrated a simple and safe process to prepare pure SnSe2 nanosheets and
SnSe2/RGO nanocomposites with a new selenium source. The well-developed SnSe2/RGO
nanocomposites are believed to function synergistically to stabilize the structure and
improve the conductivity of electrodes. Among all of these transition metal selenides,
SnSe2 have the highest theoretical sodium storage capacity of 756 mAh g-1, benefiting
from the mechanism of combination of conversion and alloying reactions. And we also
demonstrate, for the first time, the performance of SnSe2 and SnSe2/graphene
nanocomposites as anodes for sodium ion batteries. A high initial discharge capacity of
798 mAh g-1 and reversible specific capacity of 515 mAh g-1 at 0.1 A g-1 after 100 cycles
and an excellent rate performance have been achieved. Furthermore, an excellent rate
performance has been demonstrated. Literature data on the performances of transition
metal selenide as anode materials for SIBs are presented in Table 7.182-88. Among all of
the reported transition metal selenides, we used the safest process to prepare the
selenide, and our SnSe2 sample has the highest reversible capacity and the best rate
performances.
In addition, our study provides experimental evidence for the mechanism of
electrochemical sodium storage in SnSe2, combination of conversion and alloying
reactions. And simulations based on density functional theory for the volume change
during sodium ion intercalation. All these results indicate that SnSe2 is a promising
candidate for high-performance sodium ion batteries.
79
Table 7.1 Summary of the transition metal selenide anodes for SIBs applications.

80
REFERENCE
1. Luo, W.; Shen, F.; Bommier, C.; Zhu, H.; Ji, X.; Hu, L., Na-ion battery anodes: materials and electrochemistry. Acc. Chem. Res. 2016, 49 (2), 231-240.
2. Hong, S. Y.; Kim, Y.; Park, Y.; Choi, A.; Choi, N.-S.; Lee, K. T., Charge carriers in rechargeable batteries: Na ions vs. Li ions. Energy Environ. Sci. 2013, 6 (7), 2067-2081.
3. Slater, M. D.; Kim, D.; Lee, E.; Johnson, C. S., Sodium‐ion batteries. Adv. Funct. Mater. 2013, 23 (8), 947-958.
4. Palacin, M. R., Recent advances in rechargeable battery materials: a chemist’s perspective. Chem. Soc. Rev. 2009, 38 (9), 2565-2575.
5. Yabuuchi, N.; Kubota, K.; Dahbi, M.; Komaba, S., Research development on sodium-ion batteries. Chem. Rev. 2014, 114 (23), 11636-11682.
6. Kim, S. W.; Seo, D. H.; Ma, X.; Ceder, G.; Kang, K., Electrode materials for rechargeable sodium‐ion batteries: potential alternatives to current lithium‐ion batteries. Adv. Energy Mater. 2012, 2 (7), 710-721.
7. Xu, Y.; Zhou, M.; Lei, Y., Nanoarchitectured Array Electrodes for Rechargeable Lithium‐and Sodium‐Ion Batteries. Adv. Energy Mater. 2016.
8. Kim, Y.; Ha, K. H.; Oh, S. M.; Lee, K. T., High‐Capacity Anode Materials for Sodium‐Ion Batteries. Chem. Eur. J. 2014, 20 (38), 11980-11992.
9. Cao, Y.; Xiao, L.; Sushko, M. L.; Wang, W.; Schwenzer, B.; Xiao, J.; Nie, Z.; Saraf, L. V.; Yang, Z.; Liu, J., Sodium ion insertion in hollow carbon nanowires for battery applications. Nano Lett. 2012, 12 (7), 3783-3787.
10. Wenzel, S.; Hara, T.; Janek, J.; Adelhelm, P., Room-temperature sodium-ion batteries: improving the rate capability of carbon anode materials by templating strategies. Energy Environ. Sci. 2011, 4 (9), 3342-3345.
11. Kang, H.; Liu, Y.; Cao, K.; Zhao, Y.; Jiao, L.; Wang, Y.; Yuan, H., Update on anode materials for Na-ion batteries. J. Mater. Chem. A 2015, 3 (35), 17899-17913.
12. Pan, H.; Hu, Y.-S.; Chen, L., Room-temperature stationary sodium-ion batteries for large-scale electric energy storage. Energy Environ. Sci. 2013, 6 (8), 2338-2360.
13. Ponrouch, A.; Marchante, E.; Courty, M.; Tarascon, J.-M.; Palacín, M. R., In search of an optimized electrolyte for Na-ion batteries. Energy Environ. Sci. 2012, 5 (9), 8572-8583.

81
14. Medarde, M.; Mena, M.; Gavilano, J.; Pomjakushina, E.; Sugiyama, J.; Kamazawa, K.; Pomjakushin, V. Y.; Sheptyakov, D.; Batlogg, B.; Ott, H., 1D to 2D Na+ ion diffusion inherently linked to structural transitions in Na 0.7 CoO 2. Phys. Rev. Lett. 2013, 110 (26), 266401.
15. Wang, H.; Yoshio, M., Carbon-coated natural graphite prepared by thermal vapor decomposition process, a candidate anode material for lithium-ion battery. J. Power Sources 2001, 93 (1), 123-129.
16. Yoshio, M.; Wang, H.; Fukuda, K., Spherical Carbon‐Coated Natural Graphite as a Lithium‐Ion Battery‐Anode Material. Angew. Chem. 2003, 115 (35), 4335-4338.
17. Palomares, V.; Serras, P.; Villaluenga, I.; Hueso, K. B.; Carretero-González, J.; Rojo, T., Na-ion batteries, recent advances and present challenges to become low cost energy storage systems. Energy Environ. Sci. 2012, 5 (3), 5884-5901.
18. Wen, Y.; He, K.; Zhu, Y.; Han, F.; Xu, Y.; Matsuda, I.; Ishii, Y.; Cumings, J.; Wang, C., Expanded graphite as superior anode for sodium-ion batteries. Nat. Commun. 2014, 5.
19. Zhou, X.; Wan, L. J.; Guo, Y. G., Binding SnO2 Nanocrystals in Nitrogen‐Doped Graphene Sheets as Anode Materials for Lithium‐Ion Batteries. Adv. Mater. 2013, 25 (15), 2152-2157.
20. Wang, Y.X.; Chou, S.L.; Liu, H.K.; Dou, S.X., Reduced graphene oxide with superior cycling stability and rate capability for sodium storage. Carbon 2013, 57, 202-208.
21. Ling, C.; Mizuno, F., Boron-doped graphene as a promising anode for Na-ion batteries. PCCP 2014, 16 (22), 10419-10424.
22. Ponrouch, A.; Goñi, A.; Palacín, M. R., High capacity hard carbon anodes for sodium ion batteries in additive free electrolyte. Electrochem. Commun. 2013, 27, 85-88.
23. Komaba, S.; Murata, W.; Ishikawa, T.; Yabuuchi, N.; Ozeki, T.; Nakayama, T.; Ogata, A.; Gotoh, K.; Fujiwara, K., Electrochemical Na insertion and solid electrolyte interphase for hard‐carbon electrodes and application to Na‐Ion batteries. Adv. Funct. Mater. 2011, 21 (20), 3859-3867.
24. Gotoh, K.; Ishikawa, T.; Shimadzu, S.; Yabuuchi, N.; Komaba, S.; Takeda, K.; Goto, A.; Deguchi, K.; Ohki, S.; Hashi, K., NMR study for electrochemically inserted Na in hard carbon electrode of sodium ion battery. J. Power Sources 2013, 225, 137-140.
25. Hong, K.l.; Qie, L.; Zeng, R.; Yi, Z.q.; Zhang, W.; Wang, D.; Yin, W.; Wu, C.; Fan, Q.j.; Zhang, W.-x., Biomass derived hard carbon used as a high performance anode material for sodium ion batteries. J. Mater. Chem. A 2014, 2 (32), 12733-12738.

82
26. Wu, H.; Zheng, G.; Liu, N.; Carney, T. J.; Yang, Y.; Cui, Y., Engineering empty space between Si nanoparticles for lithium-ion battery anodes. Nano Lett. 2012, 12 (2), 904-909.
27. Wu, H.; Cui, Y., Designing nanostructured Si anodes for high energy lithium ion batteries. Nano Today 2012, 7 (5), 414-429.
28. Qian, J.; Wu, X.; Cao, Y.; Ai, X.; Yang, H., High capacity and rate capability of amorphous phosphorus for sodium ion batteries. Angew. Chem. 2013, 125 (17), 4731-4734.
29. Kim, Y.; Park, Y.; Choi, A.; Choi, N. S.; Kim, J.; Lee, J.; Ryu, J. H.; Oh, S. M.; Lee, K. T., An amorphous red phosphorus/carbon composite as a promising anode material for sodium ion batteries. Adv. Mater. 2013, 25 (22), 3045-3049.
30. Song, J.; Yu, Z.; Gordin, M. L.; Hu, S.; Yi, R.; Tang, D.; Walter, T.; Regula, M.; Choi, D.; Li, X., Chemically bonded phosphorus/graphene hybrid as a high performance anode for sodium-ion batteries. Nano Lett. 2014, 14 (11), 6329-6335.
31. Dahbi, M.; Yabuuchi, N.; Fukunishi, M.; Kubota, K.; Chihara, K.; Tokiwa, K.; Yu, X.f.; Ushiyama, H.; Yamashita, K.; Son, J.Y., Black phosphorus as a high-capacity, high-capability negative electrode for sodium-ion batteries: investigation of the electrode/electrolyte interface. Chem. Mater. 2016, 28 (6), 1625-1635.
32. Sun, J.; Lee, H.W.; Pasta, M.; Yuan, H.; Zheng, G.; Sun, Y.; Li, Y.; Cui, Y., A phosphorene–graphene hybrid material as a high-capacity anode for sodium-ion batteries. Nature nanotechnology 2015, 10 (11), 980-985.
33. Sun, J.; Zheng, G.; Lee, H.W.; Liu, N.; Wang, H.; Yao, H.; Yang, W.; Cui, Y., Formation of stable phosphorus–carbon bond for enhanced performance in black phosphorus nanoparticle–graphite composite battery anodes. Nano Lett. 2014, 14 (8), 4573-4580.
34. Klein, F.; Jache, B.; Bhide, A.; Adelhelm, P., Conversion reactions for sodium-ion batteries. PCCP 2013, 15 (38), 15876-15887.
35. Zhang, N.; Han, X.; Liu, Y.; Hu, X.; Zhao, Q.; Chen, J., 3D Porous γ‐Fe2O3@ C Nanocomposite as High‐Performance Anode Material of Na‐Ion Batteries. Adv. Energy Mater. 2015, 5 (5).
36. Xu, Y.; Zhu, Y.; Liu, Y.; Wang, C., Electrochemical performance of porous carbon/tin composite anodes for sodium‐ion and lithium‐ion batteries. Adv. Energy Mater. 2013, 3 (1), 128-133.

83
37. Zhu, H.; Jia, Z.; Chen, Y.; Weadock, N.; Wan, J.; Vaaland, O.; Han, X.; Li, T.; Hu, L., Tin anode for sodium-ion batteries using natural wood fiber as a mechanical buffer and electrolyte reservoir. Nano Lett. 2013, 13 (7), 3093-3100.
38. Farbod, B.; Cui, K.; Kalisvaart, W. P.; Kupsta, M.; Zahiri, B.; Kohandehghan, A.; Lotfabad, E. M.; Li, Z.; Luber, E. J.; Mitlin, D., Anodes for sodium ion batteries based on tin–germanium–antimony alloys. ACS Nano 2014, 8 (5), 4415-4429.
39. Li, Z.; Ding, J.; Mitlin, D., Tin and tin compounds for sodium ion battery anodes: phase transformations and performance. Acc. Chem. Res. 2015, 48 (6), 1657-1665.
40. Qu, B.; Ma, C.; Ji, G.; Xu, C.; Xu, J.; Meng, Y. S.; Wang, T.; Lee, J. Y., Layered SnS2‐Reduced Graphene Oxide Composite–A High‐Capacity, High‐Rate, and Long‐Cycle Life Sodium‐Ion Battery Anode Material. Adv. Mater. 2014, 26 (23), 3854-3859.
41. Zhou, T.; Pang, W. K.; Zhang, C.; Yang, J.; Chen, Z.; Liu, H. K.; Guo, Z., Enhanced sodium-ion battery performance by structural phase transition from two-dimensional hexagonal-SnS2 to orthorhombic-SnS. ACS Nano 2014, 8 (8), 8323-8333.
42. Liu, Y.; Kang, H.; Jiao, L.; Chen, C.; Cao, K.; Wang, Y.; Yuan, H., Exfoliated-SnS2 restacked on graphene as a high-capacity, high-rate, and long-cycle life anode for sodium ion batteries. Nanoscale 2015, 7 (4), 1325-1332.
43. Zhang, F.; Xia, C.; Zhu, J.; Ahmed, B.; Liang, H.; Velusamy, D. B.; Schwingenschlögl, U.; Alshareef, H. N., SnSe2 2D Anodes for Advanced Sodium Ion Batteries. Adv. Energy Mater. 2016, 6 (22), 1601188.
44. Zhang, F.; Zhu, J.; Zhang, D.; Schwingenschlögl, U.; Alshareef, H. N., Two-Dimensional SnO Anodes with a Tunable Number of Atomic Layers for Sodium Ion Batteries. Nano Lett. 2017, 17(2), 1302-1311..
45. Chhowalla, M.; Shin, H. S.; Eda, G.; Li, L.-J.; Loh, K. P.; Zhang, H., The chemistry of two-dimensional layered transition metal dichalcogenide nanosheets. Nat. Chem. 2013, 5 (4), 263-275.
46. Chhowalla, M.; Liu, Z.; Zhang, H., Two-dimensional transition metal dichalcogenide (TMD) nanosheets. Chem. Soc. Rev. 2015, 44 (9), 2584-2586.
47. Tan, C.; Zhang, H., Two-dimensional transition metal dichalcogenide nanosheet-based composites. Chem. Soc. Rev. 2015, 44 (9), 2713-2731.
48. Wahnón, P.; Conesa, J. C.; Palacios, P.; Lucena, R.; Aguilera, I.; Seminovski, Y.; Fresno, F., V-doped SnS2: a new intermediate band material for a better use of the solar spectrum. PCCP 2011, 13 (45), 20401-20407.

84
49. Liu, Y.; Zhang, N.; Jiao, L.; Chen, J., Tin Nanodots Encapsulated in Porous Nitrogen‐Doped Carbon Nanofibers as a Free‐Standing Anode for Advanced Sodium‐Ion Batteries. Adv. Mater. 2015, 27 (42), 6702-6707.
50. Huang, X.; Zeng, Z.; Zhang, H., Metal dichalcogenide nanosheets: preparation, properties and applications. Chem. Soc. Rev. 2013, 42 (5), 1934-1946.
51. Huang, Y.; Xu, K.; Wang, Z.; Shifa, T. A.; Wang, Q.; Wang, F.; Jiang, C.; He, J., Designing the shape evolution of SnSe2 nanosheets and their optoelectronic properties. Nanoscale 2015, 7 (41), 17375-17380.
52. Zhou, X.; Gan, L.; Tian, W.; Zhang, Q.; Jin, S.; Li, H.; Bando, Y.; Golberg, D.; Zhai, T., Ultrathin SnSe2 Flakes Grown by Chemical Vapor Deposition for High‐Performance Photodetectors. Adv. Mater. 2015, 27 (48), 8035-8041.
53. Fernandes, P.; Sousa, M.; Salome, P. M.; Leitao, J.; da Cunha, A., Thermodynamic pathway for the formation of SnSe and SnSe2 polycrystalline thin films by selenization of metal precursors. CrystEngComm 2013, 15 (47), 10278-10286.
54. Choi, J.; Jin, J.; Jung, I. G.; Kim, J. M.; Kim, H. J.; Son, S. U., SnSe2 nanoplate–graphene composites as anode materials for lithium ion batteries. Chem. Commun. 2011, 47 (18), 5241-5243.
55. Zhang, Z.; Yang, X.; Fu, Y.; Du, K., Ultrathin molybdenum diselenide nanosheets anchored on multi-walled carbon nanotubes as anode composites for high performance sodium-ion batteries. J. Power Sources 2015, 296, 2-9.
56. Tang, H.; Dou, K.; Kaun, C.C.; Kuang, Q.; Yang, S., MoSe2 nanosheets and their graphene hybrids: synthesis, characterization and hydrogen evolution reaction studies. J. Mater. Chem. A 2014, 2 (2), 360-364.
57. Kresse, G.; Furthmüller, J., Efficient iterative schemes for ab initio total-energy calculations using a plane-wave basis set. Phys. Rev. B 1996, 54 (16), 11169.
58. Perdew, J. P.; Burke, K.; Ernzerhof, M., Generalized gradient approximation made simple. Phys. Rev. Lett. 1996, 77 (18), 3865.
59. Grimme, S.; Antony, J.; Ehrlich, S.; Krieg, H., A consistent and accurate ab initio parametrization of density functional dispersion correction (DFT-D) for the 94 elements H-Pu. J. Chem. Phys. 2010, 132 (15), 154104.
60. Xia, C.; Jiang, Q.; Zhao, C.; Hedhili, M. N.; Alshareef, H. N., Selenide‐Based Electrocatalysts and Scaffolds for Water Oxidation Applications. Adv. Mater. 2016, 28 (1), 77-85.

85
61. Yu, J.; Xu, C.-Y.; Li, Y.; Zhou, F.; Chen, X.-S.; Hu, P.-A.; Zhen, L., Ternary SnS2–xSex alloys nanosheets and nanosheet assemblies with tunable chemical compositions and band gaps for photodetector applications. Sci. Rep. 2015, 5.
62. Jiang, X.; Yang, X.; Zhu, Y.; Shen, J.; Fan, K.; Li, C., In situ assembly of graphene sheets-supported SnS2 nanoplates into 3D macroporous aerogels for high-performance lithium ion batteries. J. Power Sources 2013, 237, 178-186.
63. Ko, Y.; Choi, S.; Park, S.; Kang, Y., Hierarchical MoSe 2 yolk–shell microspheres with superior Na-ion storage properties. Nanoscale 2014, 6 (18), 10511-10515.
64. Zhai, C.; Du, N.; Zhang, H.; Yu, J.; Yang, D., Multiwalled carbon nanotubes anchored with SnS2 nanosheets as high-performance anode materials of lithium-ion batteries. ACS Appl. Mater. Interfaces 2011, 3 (10), 4067-4074.
65. Dikin, D. A.; Stankovich, S.; Zimney, E. J.; Piner, R. D.; Dommett, G. H.; Evmenenko, G.; Nguyen, S. T.; Ruoff, R. S., Preparation and characterization of graphene oxide paper. Nature 2007, 448 (7152), 457-460.
66. Li, D.; Müller, M. B.; Gilje, S.; Kaner, R. B.; Wallace, G. G., Processable aqueous dispersions of graphene nanosheets. Nature nanotechnology 2008, 3 (2), 101-105.
67. Tang, L.; Wang, Y.; Li, Y.; Feng, H.; Lu, J.; Li, J., Preparation, structure, and electrochemical properties of reduced graphene sheet films. Adv. Funct. Mater. 2009, 19 (17), 2782-2789.
68. Zhang, Y.; Zhu, P.; Huang, L.; Xie, J.; Zhang, S.; Cao, G.; Zhao, X., Few‐Layered SnS2 on Few‐Layered Reduced Graphene Oxide as Na‐Ion Battery Anode with Ultralong Cycle Life and Superior Rate Capability. Adv. Funct. Mater. 2015, 25 (3), 481-489.
69. Williams, G.; Seger, B.; Kamat, P. V., TiO2-graphene nanocomposites. UV-assisted photocatalytic reduction of graphene oxide. ACS Nano 2008, 2 (7), 1487-1491.
70. Cui, P.; Lee, J.; Hwang, E.; Lee, H., One-pot reduction of graphene oxide at subzero temperatures. Chem. Commun. 2011, 47 (45), 12370-12372.
71. Wu, Z.-S.; Ren, W.; Gao, L.; Liu, B.; Jiang, C.; Cheng, H.M., Synthesis of high-quality graphene with a pre-determined number of layers. Carbon 2009, 47 (2), 493-499.
72. Huang, Y.; Lu, H.; Gu, H.; Fu, J.; Mo, S.; Wei, C.; Miao, Y.E.; Liu, T., A CNT@ MoSe2 hybrid catalyst for efficient and stable hydrogen evolution. Nanoscale 2015, 7 (44), 18595-18602.

86
73. Jiang, Y.; Wei, M.; Feng, J.; Ma, Y.; Xiong, S., Enhancing the cycling stability of Na-ion batteries by bonding SnS2 ultrafine nanocrystals on amino-functionalized graphene hybrid nanosheets. Energy Environ. Sci. 2016, 9 (4), 1430-1438.
74. Sun, W.; Rui, X.; Yang, D.; Sun, Z.; Li, B.; Zhang, W.; Zong, Y.; Madhavi, S.; Dou, S.; Yan, Q., Two-dimensional tin disulfide nanosheets for enhanced sodium storage. ACS Nano 2015, 9 (11), 11371-11381.
75. Yao, J.; Liu, B.; Ozden, S.; Wu, J.; Yang, S.; Rodrigues, M.T. F.; Kalaga, K.; Dong, P.; Xiao, P.; Zhang, Y., 3D nanostructured molybdenum diselenide/graphene foam as anodes for long-cycle life lithium-ion batteries. Electrochim. Acta 2015, 176, 103-111.
76. Chan, C. K.; Zhang, X. F.; Cui, Y., High capacity Li ion battery anodes using Ge nanowires. Nano Lett. 2008, 8 (1), 307-309.
77. Chan, C. K.; Peng, H.; Liu, G.; McIlwrath, K.; Zhang, X. F.; Huggins, R. A.; Cui, Y., High-performance lithium battery anodes using silicon nanowires. Nature nanotechnology 2008, 3 (1), 31-35.
78. Tang, K.; Fu, L.; White, R. J.; Yu, L.; Titirici, M. M.; Antonietti, M.; Maier, J., Hollow carbon nanospheres with superior rate capability for sodium‐based batteries. Adv. Energy Mater. 2012, 2 (7), 873-877.
79. Zhao, Y.; Li, X.; Yan, B.; Li, D.; Lawes, S.; Sun, X., Significant impact of 2D graphene nanosheets on large volume change tin-based anodes in lithium-ion batteries: A review. Journal of Power Sources 2015, 274, 869-884.
80. Yan, Y.; Yin, Y. X.; Guo, Y. G.; Wan, L. J., A Sandwich‐Like Hierarchically Porous Carbon/Graphene Composite as a High‐Performance Anode Material for Sodium‐Ion Batteries. Adv. Energy Mater. 2014, 4 (8).
81. Kim, Y.; Kim, Y.; Choi, A.; Woo, S.; Mok, D.; Choi, N. S.; Jung, Y. S.; Ryu, J. H.; Oh, S. M.; Lee, K. T., Tin Phosphide as a Promising Anode Material for Na‐Ion Batteries. Adv. Mater. 2014, 26 (24), 4139-4144.
82. Zhang, Z.; Zhao, X.; Li, J., SnSex flowerlike composites as anode materials for sodium ion batteries. Mater. Lett. 2016, 162, 169-172.
83. Choi, S. H.; Kang, Y. C., Fullerene-like MoSe2 nanoparticles-embedded CNT balls with excellent structural stability for highly reversible sodium-ion storage. Nanoscale 2016, 8 (7), 4209-4216.
84. Wang, H.; Lan, X.; Jiang, D.; Zhang, Y.; Zhong, H.; Zhang, Z.; Jiang, Y., Sodium storage and transport properties in pyrolysis synthesized MoSe2 nanoplates for high performance sodium-ion batteries. J. Power Sources 2015, 283, 187-194.
87
85. Xie, D.; Tang, W.; Wang, Y.; Xia, X.; Zhong, Y.; Zhou, D.; Wang, D.; Wang, X.; Tu, J., Facile fabrication of integrated three-dimensional C-MoSe2/reduced graphene oxide composite with enhanced performance for sodium storage. Nano Res. 2016, 9 (6), 1618-1629.
86. Share, K.; Lewis, J.; Oakes, L.; Carter, R. E.; Cohn, A. P.; Pint, C. L., Tungsten diselenide (WSe2) as a high capacity, low overpotential conversion electrode for sodium ion batteries. RSC Advances 2015, 5 (123), 101262-101267.
87. Zhang, K.; Hu, Z.; Liu, X.; Tao, Z.; Chen, J., FeSe2 microspheres as a high‐performance anode material for Na‐ion batteries. Adv. Mater. 2015, 27 (21), 3305-3309.
88. Cho, J. S.; Lee, S. Y.; Kang, Y. C., First introduction of NiSe2 to anode material for sodium-ion batteries: A hybrid of graphene-wrapped NiSe2/C porous nanofiber. Sci. Rep. 2016, 6.

88
APPENDIX A: The theoretical capacity of electrodes
The theoretical capacity calculation is based on how many electrons have been
transformed during the electrochemistry reaction.
3
M max
1C = (x ×z×F×10 )
M
MC -- Theoretical capacity;
M -- Molar mass of electrodes;
maxx -- Maximum electrons have been transformed;
z -- The valence number, z = 1 for Li, Na, and K; z = 2 for Ca;
F -- Faraday constant: 26.810 Ah mol-1.
Take SnO2 anode material for example, it will go through two-step reaction:
2 2SnO +4Na 2Na O+Sn
3.75Sn+3.75Na Na Sn
There will be 7.75 molar electrons transformed during the whole process for each 1
molar of SnO2, so the theoretical capacity is:
37.75C= ×1×26.810×10 mAh/g=1385mAh/g
150
For SnSe2:
2 2 3.75SnSe +7.75Na 2Na Se+Na Sn
Theoretical capacity is:
7.75C= ×26810mAh/g=758mAh/g
274

89
LIST OF PUBLICATIONS
(1) Zhang, F.; Xia, C.; Zhu, J.; Ahmed, B.; Liang, H.; Velusamy, D. B.; Schwingenschlögl, U.;
Alshareef, H. N., SnSe2 2D Anodes for Advanced Sodium Ion Batteries. Adv. Energy Mater.
2016, 6 (22), 1601188.
(2) Zhang, F.; Zhu, J.; Zhang, D.; Schwingenschlögl, U.; Alshareef, H. N., Two-Dimensional
SnO Anodes with a Tunable Number of Atomic Layers for Sodium Ion Batteries. Nano Lett.
2017, 17(2), 1302-1311.
(3) Velusamy, D. B.; Haque, M.; Parida, M. R.; Zhang, F.; Wu, T.; Mohammed, O. F.;
Alshareef, H. N., 2D Organic–Inorganic Hybrid Thin Films for Flexible UV–Visible
Photodetectors. Adv. Funct. Mater. 2017, 27, 1605554.


