
Social identity mapping in addiction recovery (SIM-AR): extension and application of a visual method
BECKWITH, Melinda, BEST, David <http://orcid.org/0000-0002-6792-916X>, SAVIC, Michael, HASLAM, Catherine, BATHISH, Ramez, DINGLE, Genevieve, MACKENZIE, Jock, STAIGER, Petra and LUBMAN, Dan
Available from Sheffield Hallam University Research Archive (SHURA) at:
http://shura.shu.ac.uk/23661/
This document is the author deposited version. You are advised to consult the publisher's version if you wish to cite from it.
Published version
BECKWITH, Melinda, BEST, David, SAVIC, Michael, HASLAM, Catherine, BATHISH, Ramez, DINGLE, Genevieve, MACKENZIE, Jock, STAIGER, Petra and LUBMAN, Dan (2019). Social identity mapping in addiction recovery (SIM-AR): extension and application of a visual method. Addiction research and theory.
Copyright and re-use policy
See http://shura.shu.ac.uk/information.html
Sheffield Hallam University Research Archivehttp://shura.shu.ac.uk

Running Head: Mapping Social Identity in Recovery
Social Identity Mapping in Addiction Recovery (SIM-AR):
Extension and application of a visual method
Melinda Beckwith1,2, David Best2,3, Michael Savic1,2, Catherine Haslam4, Ramez Bathish1,2,
Genevieve Dingle4, Jock Mackenzie4, Petra K. Staiger5, Dan I. Lubman1,2
1Eastern Health Clinical School, Monash University 2Turning Point, Eastern Health 3Sheffield Hallam University 4University of Queensland 5Deakin University
Contact:
Melinda Beckwith Monash University Eastern Health Clinical School Melbourne, Victoria, Australia Email: [email protected] Tel: +61 3 8413 8413
Words: approx. 5580
Acknowledgements:
The authors would like to thank the managers, staff and participants who supported
this research. This work was generously supported by the Australian Research Council
under Grant DP140103579. The main author was supported by a PhD scholarship from
the National Health & Medical Research Council (ID 1001144).
Abstract
Background: The Social Identity approach offers a unifying framework for understanding
recovery from addiction as a process of identity change, associated with change in
social network composition. This paper introduces Social Identity Mapping in Addiction
Recovery (SIM-AR) — a visual method for capturing social group memberships,
extended to integrate the substance use ‘status’ of group members as an indicator of
group substance use norms. The aim here is to test theory-derived predictions focused
on the relationship between changes in social identity and network composition
reflected in substance use norms in early recovery.
Method: 155 therapeutic community (TC) residents in Victoria, Australia, completed the
SIM-AR plus measures of substance-using and recovery identities and substance use
shortly after admission, and 65% (N=101) again 6 months later.
Results: As predicted, substance use severity at follow up was associated with changes
in both social identity and network composition. Furthermore, reduced strength of
substance-using identity was associated with a decrease in the proportion of groups
with heavy substance use norms, while increased strength of ‘recovery’ identity was
associated with an increased proportion of non-using groups.
Conclusion: SIM-AR proved useful in testing predictions about social identity and
network changes in a residential treatment context. It captured key social identity
constructs in recovery using a visual technique with value to both research and applied
contexts. Findings highlight the clinical importance of assessing a person’s group-based
relationships in treatment and early recovery, especially the influence of social group
norms in relation to substance use.
Keywords: recovery, substance use, social identity, social networks, visual methods, mapping
Page 1 of 14
Social Identity Mapping in Addiction Recovery (SIM-AR): Extension and
application of a visual method
Introduction
The Social Identity Approach to Health (e.g. Haslam, Jetten, Postmes, Haslam, 2009; Jetten,
Haslam & Haslam, 2012; Haslam, Jetten, Cruwys, Dingle & Haslam, 2018) offers a comprehensive
framework for understanding the influence of social groups on general health and wellbeing.
Applying this approach to recovery from alcohol and other drug addiction is the Social Identity Model
of Recovery (SIMOR; Best, Beckwith, et al., 2016) which integrates two key factors supporting the
recovery process – change in identity (e.g. Biernacki, 1986; McIntosh & McKeganey, 2000) and
change in social network composition around substance use (e.g. Litt, Kadden, Kabela-Cormier &
Petry, 2009; Longabaugh, Wirtz, Zweben & Stout, 2008; Haslam et al., 2018).
The main premise of the Social Identity Model of Recovery (SIMOR; Best, Beckwith et al, 2016)
is that identity change in the recovery process is underpinned by moving away from groups in one’s
social network whose norms encourage heavy use and towards new or known groups whose norms
and values are supportive of recovery goals. Drawing on Social Identity Theory (SIT; Tajfel & Turner,
1979) and Self-Categorisation Theory (SCT; Turner, Hogg, Oakes, Reicher & Wetherell, 1987), the
social identity approach asserts that an important part of an individual's sense of self is derived from
their membership of social groups. To the extent that membership of a group is meaningful,
emotionally significant, and valued by an individual, key characteristics central to shared identity
between group members are internalised as a part of the person’s psychological self-concept. As
part of the self, groups can influence members through transmission of, and encouraging adherence
to, the group's norms, which come to be reflected in the person’s behaviour, attitudes, values, and
beliefs (Turner, 1991). Life transitions, such as recovery from addiction, typically involve changes in
the group memberships that contribute to a person’s self-concept (Jetten, Haslam, Iyer & Haslam,
2009). As a consequence, there is a change in the groups that function as sources of influence,
support, and belonging.
One tool developed to examine the nature of an individual’s network of social group
memberships is Social Identity Mapping (SIM; Cruwys et al., 2016) – a visual method capturing the
groups a person belongs to, and their relationship to those groups on various dimensions. To have
meaningful application in addiction recovery research, the SIM tool has been adapted to include the
substance use 'status' of group members, to reflect the changes in network composition found to
support the recovery process (e.g. Groh, Olson, Jason, Davis & Ferrari, 2007), as well as groups norms
that may influence substance use or support an individual's recovery efforts.

Page 2 of 14
In this paper, we introduce this adaptation – referred to as Social Identity Mapping in
Addiction Recovery (SIM-AR) – explaining the need for this tool with reference to the recovery
literature. Through quantifying visual data from maps created by a treatment population from two
Therapeutic Communities (TCs) in Australia, we examine the value of the SIM-AR tool in testing social
identity theory informed predictions in the addiction recovery context.
Social Networks and Identity in Addiction Recovery
It is well established that the using status of a person's social network influences their own
substance use. Treatment effects are sustained longer among those whose social network members
do not engage in, or support, drinking (Litt et al., 2007, 2009; Longabaugh et al., 2008; Longabaugh,
Wirtz, Zywiak & O’Malley, 2010). Even without treatment, people who maintain abstinence report a
far greater reduction in substance use among their network membership (Buchanan & Latkin, 2008),
both through the addition of new members who do not use substances and reductions in substance
use among existing network members (Bohnert, Bradshaw & Latkin, 2009; Buchanan & Latkin, 2008;
Rosenquist, Murabito, Fowler & Christakis, 2010; Zywiak et al, 2009).
In retrospective accounts of the recovery process, these network changes are described in
terms of the 'type' of groups one associates with or distances oneself from, and what is 'normal'
substance use behaviour for those groups (Best, Gow, Taylor, Knox & White, 2011; Best et al., 2010;
Best et al., 2012; Biernacki, 1986; Granfield & Cloud, 1996). This is important as group associations
have distinctive effects on wellbeing over and above the effect of individual relationships (Haslam,
Cruwys & Haslam, 2014; Haslam, Cruwys, Milne, Kan & Haslam, 2015; Jetten et al., 2015), with social
influence from individuals considered strongest when there is recognition of a shared group identity
(Abrams, Wetherell, Cochrane, Hogg, & Turner, 1990; Turner, 1991).
Indeed, common to many of these retrospective accounts are reports of perceived changes in
one’s identity through the recovery process, away from an identity linked to substance use and
towards an identity compatible with recovery (e.g., Best et al., 2011; Biernacki, 1986; Granfield &
Cloud, 1996; McIntosh & McKeganey, 2001; Waldorf, 1983). Evidence from subsequent prospective
studies provides strong support for these social identity changes as a key factor in both treatment
outcomes and ongoing recovery (Beckwith, Best, Dingle, Perryman & Lubman, 2015; Buckingham,
Frings & Albery, 2013; Dingle, Stark, Cruwys, & Best, 2015; Dingle et al, 2017).
No study has yet integrated these findings, likely due to limitations in the methods available to
do so. It is for this purpose that we have adapted Social Identity Mapping (SIM; Cruwys et al., 2016),
as explained below. This adaptation, SIM-AR, allows us to explore how changes in the composition of

Page 3 of 14
one’s group memberships and their substance use norms affect identity change in the process of
recovery, as proposed in the Social Identity Model of Recovery (SIMOR; Best, Beckwith et al, 2016).
Social Identity Mapping in Addiction Recovery (SIM-AR)
Social Identity Mapping (SIM; Cruwys et al., 2016) is useful in understanding the nature of
people’s multiple social identities and confers a range of benefits in relation to the measurement of
complex social identity constructs (Cruwys et al, 2016; Haslam, Dingle, Best, Mackenzie & Beckwith,
2017). SIM has been shown in clinical and non-clinical contexts to have good internal consistency as
well as convergent and discriminant validity. Importantly it also identifies some key group processes
that support health and wellbeing in a range of settings (Cruwys et al, 2016). In particular, multiple
group memberships (reflected in group number), group importance (indicated by group size), group
positivity (through ratings of how positive one feels about the group), and group compatibility (or the
inter-relationships between groups as indicated in compatibility lines between pairs of groups) have
been identified as key in protecting health and well-being in periods of life transition (Haslam et al.,
2008; Jetten et al, 2009; Jetten, Haslam, Haslam, & Branscombe, 2009).
Social Identity Mapping in Addiction Recovery (SIM-AR) has a slightly different focus to the
original SIM tool. Given SIM-AR builds on the existing structure of the SIM, it retains the capacity to
explore the key social group processes related to wellbeing described above (see also Cruwys et al.,
2016). However, SIM-AR adds another level of detail by capturing the relevant normative 'content'
of each group's shared identity, substance use norms in particular. This adaptation was piloted with
very small samples in addiction treatment settings (see Best et al., 2014; Mawson, Best, Beckwith,
Dingle, & Lubman, 2015) and found to provide valuable data that was meaningful to participants. An
example of a typical map, with its key elements, resulting from the SIM-AR process is shown in Figure
1.
INSERT FIGURE 1 ABOUT HERE
To capture groups' substance use norms, the person is asked to indicate the ‘substance use
status’ of each group's members using classifications derived from an existing measure of network
support for substance use — the Important People Drug & Alcohol interview (IPDA; Zywiak et al.,
2009). Use of IPDA classification allows some comparison with previous research on substance using
status within a person's network (e.g. Litt et al., 2009; Longabaugh et al., 2008; Longabaugh et al.,
2010; Zywiak et al, 2009), as well as providing a guide for calculating key indices from group network
data. In SIM-AR, group members' substance use status is indicated with coloured dots placed on the
relevant group, as seen in Figure 1. Members could be classified as heavy (red dots), casual (yellow
Page 4 of 14
dots), or non-users/drinkers (blue dots), or non-users/drinkers in recovery (green dots), with white
dots where status is unknown. Particularly for groups with many members, dots were used to
visually represent the proportion of group members for each relevant status, with group norms
derived from the predominant substance use status in each group.
In the current study, as in the IPDA, group members' alcohol use (small dots) and other drug
use (large dots) were captured separately. This avoids conflating the two, as shared norms around
alcohol use compared to other substance use tend to vary due to differences in legal status and
cultural acceptability in Australia. For example, it would be culturally normative for the majority of a
group's members to regularly drink alcohol on social occasions but never use illicit substances.
In SIM-AR, groups can be categorised according to their substance use norms, indicating their
influence on the person's substance use behaviour. We based our categorisation on scoring
conventions developed for the IPDA (e.g. Groh et al., 2007; Longabaugh et al, 2010). As these were
initially calculated based on an alcohol dependent population and did not include casual drinkers, we
categorised groups by normative behaviour considered in the IPDA to be high risk (heavy
drinking/use) or low risk (non-drinking/use or in recovery) for continued problematic use only. Thus,
groups whose membership consisted primarily of heavy users (red dots) were categorised as high risk
for the person, whereas groups whose membership comprised primarily non-users, people in
recovery and/or members’ whose substance use was unknown to the person (blue, green and white
dots respectively) were categorised as low risk for continued problematic use.
While groups that did not fit the criteria for either low or high risk were not categorised
further, they were still counted in each person's total number of groups. Consequently, in order to
accurately index network composition for each person, the proportion of high risk groups and the
proportion of low risk groups, was calculated relative to the total number of groups. These group
network characteristics were then used in further analysis to test their importance in recovery.
The present study
Here we examine the value of SIM-AR as a research tool in the context of addiction recovery,
using data from a multi-site longitudinal study – the Social Networks and Recovery study (SONAR;
Best, Haslam, et al., 2016). The aim is to test key predictions regarding the role of social group
processes in supporting recovery in line with a social identity approach.
First, we test the prediction that both changes in group network composition and social identities
related to substance use and recovery will be related to substance use outcomes in the current

Page 5 of 14
sample (Hypothesis 1; H1). We hypothesise that lower substance use at follow up will be associated
with:
a. an decrease in strength of substance-using identity and a increase in the strength of
recovery identity, and
b. an increase in the proportion of groups in a person’s network categorised as 'low risk', and
a decrease in the proportion of 'high risk' groups.
Second, we predict that change in substance-using and recovery identities will be associated with
group-based network change in people’s maps. Specifically, that an increase in proportion of high
risk groups will be associated with an increase in substance-using identity, and an increase in
proportion of low risk groups will be associated with an increase in recovery identity (H2).
Method
Participants and recruitment
Participants were 155 new residents of two Therapeutic Communities (TCs) in the state of
Victoria, recruited with informed consent within the first four weeks following admission to the TC.
Admission criteria for the TCs required residents to be at least 18 years of age and medically stable,
with no clinical indicators of potential harm to self or others, or active psychosis. Staff of each TC
further excluded potential participants on the basis of ill-health or behavioural management issues.
Participants ranged in age from 18 to 67 years (M = 35.1 years) and 66.5% were male. The
majority (89.7%) were born in Australia, with 9.7% of Aboriginal or Torres Strait Islander descent.
One third (34.0%) had previously been incarcerated, and 75% reported a mental health condition.
While 90.9% of participants reported accessing at least one other type of treatment for their
substance use in the six months prior to admission, two thirds (66.9%) had never accessed a TC
program before. The primary drug of concern for 28.4% of participants was alcohol, with the
majority (71.6%) seeking treatment for another drug, predominantly methamphetamine (34.2%) or
heroin (23.2%). In their lifetime, 59.4% had ever injected a substance, with 39.4% using
intravenously in the previous month.
Procedure and materials
Ethics approval for this arm of the Social Networks and Recovery (SONAR) study was obtained
from the Eastern Health Human Research Ethics Committee. Participants were first interviewed
within the first four weeks (M = 25 days) of TC admission and attempts were made to contact all
participants for a follow up interview approximately six months post-admission. Of the original 155

Page 6 of 14
respondents, 101 participants were contactable and available for a follow up interview, giving a
follow up rate of 65.2%. Follow up interviews were conducted at the TC for the 38 participants still in
treatment, and either at an agreed location or via telephone for the 63 participants who had left
treatment.
The SONAR study procedure and interview schedule used is set out by Best, Haslam, and
colleagues (2016), and included the administration of SIM-AR. To undertake the SIM-AR task (and
create a map similar to that shown in Figure 1), the researcher provided participants with a large
sheet of paper (A3 size), Post-It notes (three sizes), coloured dots (five colours, two sizes), and two
coloured markers. After explaining the task, the researcher guided participants through the stages of
the SIM-AR task in the following order: a) writing 'ME' in the middle of the A3 page, b) writing the
names of each group on a separate Post-It note, with the size of the group (Post-It note) representing
its importance, c) placing groups/Post-It notes on the A3 page around the word 'ME', d) adding
coloured dots to each group to represent group members' substance use status, using small dots of
alcohol use and large dots for other drug use, e) drawing lines to indicate group (in)compatibility -
using a blue or black marker to draw straight lines indicating similarity between 'ME' and each group,
and between the groups, then repeating this with a red marker and wavy or jagged lines to indicate
conflict.
Maps remained de-identified, with researchers recording only the participant’s alphanumeric
identifier for the study. On average, the duration for administration of the complete SONAR
interview schedule was around 90 minutes, of which between 10 and 30 minutes was spent on the
SIM-AR task, depending on the number of groups and complexity of map content.
Measures
The following measures from the interview schedule for the SONAR study (see Best, Haslam, et
al., 2016), captured at both time points, were used in this study to test predictions.
Substance use
Questions derived from the Australian Treatment Outcomes Profile (Ryan et al., 2014) asked
participants to indicate which substances they had used in the previous six months, and the number
of days they had used each of these substances in the previous four weeks. The number of
substances used, and the maximum number of days of use of any substance in the previous four
weeks, were used as indicators of substance use severity. At baseline, participants were asked to
consider the four weeks prior to admission, with 'admission' defined as admission to an inpatient
withdrawal unit where applicable.
Page 7 of 14
Social Identification
To capture substance-using identity and recovery identity, the 4-item social identification scale
of Buckingham and colleagues (2013; adapted from Doosje, Ellemers and Spears (1995) original
scale), was used to gauge strength of identification as being ‘in recovery’ ( = 0.60; ) and
as being a ‘drug user/drinker’ ( = 0.80; = 0.87); dependent on participants' self-identified
primary treatment concern). Agreement with the four items from each scale (e.g., “I would describe
myself as being in recovery”, “I identify with other drug users/drinkers”, respectively) was rated on a
7-point Likert scale where 1 = strongly disagree and 7 = strongly agree, with scores averaged for an
overall score out of 7 for each identity type.
Social Identity Mapping for Addiction Recovery (SIM-AR)
The measures taken from the maps for this study were key indices of network composition –
proportion of high risk groups and proportion of low risk groups in the participant's group network,
for both alcohol use and drug use separately.
Analysis strategy
Spearman's rank-order correlations and Pearson's product-moment correlations were
conducted, as appropriate, to assess relationships between social identity strength and substance
use variables (H1a), the proportion of group risk types and substance use variables (H1b), and social
identity strength and proportion of group risk types (H2). Correlations were first conducted on cross-
sectional data at each time point to examine differences between time points in the pattern of
correlations, then to assess the relationship between change in the proportion of group risk types
and in strength of social identities, and between each of these change variables and substance use at
follow up. Power analyses conducted in G*Power suggested that the study was powered to detect
moderate to large effects (r > 0.4).
Results
All key variables had non-normal distributions at both time points, requiring use of non-
parametric measures of central tendency and distribution, which are shown in Table 1.
INSERT TABLE 1 ABOUT HERE
The number of participants' social groups ranged from zero to six, with a median of four
groups at both time points. Only 11.6% of participants specified six groups at baseline, while 5.2%
reported no groups, and so did not produce a social identity map. At follow up, 15.8% specified six
groups and 3.0% reported no groups. Although there was also little change in the median number of
Page 8 of 14
both high risk and low risk groups in relation to alcohol use, there was a shift in the distribution of all
group category type — toward zero for high risk groups and away from zero for low risk groups (see
Figure 2).
A larger percentage of groups were not categorised as either high or low risk in terms of
influence for heavy alcohol use (64.9% of all groups), when compared to other drug use (20.4% of
groups), at baseline. This reduced to 50.0% compared with 21.7% respectively at follow up. The
result was that around a quarter of participants had neither type of group in their network at
baseline, dropping to 20% at follow up, however this did not exclude these participants or those
groups from further analysis – it merely meant that the proportion of both high and low risk groups
in the participant's network was zero.
INSERT FIGURE 2 ABOUT HERE
Participants' median strength of identification as a 'drug user' or 'drinker' at baseline (5.75 out
of a possible 7) was only slightly higher than the median rating for strength of identification with
being 'in recovery' (5.5 out of 7). At follow up, median identification as a drug user/drinker had
reduced to 3.75 whereas identification as in recovery had not changed. Substance use had reduced
significantly at follow up compared to baseline. Whereas, at baseline, the majority (74.8%) of
participants were using at least one substance daily or almost daily, as expected, almost half (45.5%)
of participants were abstinent from all substances at follow up, with only a quarter (24.8%) using at
least one substance daily or almost daily. The number of different substances used by participants
also decreased significantly (Z = -5.56, p <.001).
Cross-sectional associations between key variables
A nonparametric test of association (Spearman's rank-order correlation) between substance
use, strength of identification with social identity categories, and network composition indices were
calculated for baseline and follow-up data. As Table 2 shows, the pattern of association at these time
points differed. At baseline, both the maximum number of days a participant used any substance
and the number of substances used was associated with strength of substance-using identity but not
with recovery identity. At follow up, however, both substance use variables were positively
associated with substance-using identity and negatively associated with recovery identity as
expected. In addition, the strength of these associations increased markedly between baseline and
follow up, likely due to the greater variance in substance use frequency at follow up allowing for a
clearer relationship to emerge.

Page 9 of 14
INSERT TABLE 2 ABOUT HERE
A similar pattern was observed in network composition indices. At baseline, the number of
substances used was correlated with the proportion of both high risk alcohol use and high risk drug
use groups but only low risk drug use groups, while the maximum number of days any substance was
used was only correlated with high risk alcohol use groups. Again, the picture was quite different at
follow up, with moderate positive correlations between both substance use variables and both high
risk group types, and negative associations between substance use variables and low risk group
types. Again, the strength of association was markedly increased between baseline and follow up,
particularly for low risk groups, and again likely due to greater variance in substance use frequency at
follow up.
Finally, at baseline, identification as a 'drinker' or 'drug user' was positively correlated with the
proportion of both high risk group types, as predicted, and negatively correlated with low risk drug
use groups, whereas no group types were significantly correlated with recovery identity. Unlike
previous results, the pattern was not markedly different at follow up, with similar effect sizes at both
time points for relationships with substance-using identity. However, there was an increase in effect
size for most relationships with recovery identity. The only exception to this pattern was that low risk
alcohol groups were significantly correlated with both substance-using and recovery identity at
follow up, but not at baseline, again with a notable increase in effect size.
Associations between changes in key variables
Correlational analysis was also used to assess relationships between the change in recovery
and substance-using identities across the two time points, change in the proportion of high and low
risk groups, and substance use outcomes at follow up. As change variables were normally distributed
Pearson's product-moment correlations were conducted, although Spearman's rank-order
correlation was used to assess relationships with substance use variables as these were not normally
distributed.
Supporting Hypothesis 1a, less substance use at follow up was associated with an increase in
strength of recovery identity, and more so with a decrease in strength of substance-using identity
(see Table 3). Interestingly, there was no association (r = .009, p = .932) between change in
substance-using identity and change in recovery identity.
Analysis also showed that changes in network composition were associated with substance use
outcomes, supporting Hypothesis 1b (see Table 3). Specifically, an increase in the proportion of low
Page 10 of 14
risk groups was significantly associated with less substance use at follow up. There was also a
significant relationship between the reduction in high risk groups and less substance use, albeit not
as strong.
INSERT TABLE 3 ABOUT HERE
Finally, changes in identification as a 'drug user' or 'drinker' were positively associated with
change in the proportion of high risk groups in one’s network, such that a reduction in a substance-
using identity was accompanied by a reduction in the proportion of groups whose norms supported
heavy use as predicted (H2, see Table 3). Further supporting this hypothesis, change in recovery
identity was positively associated with change in the proportion of low risk groups in the network
over a 6-month period, such that increased strength of recovery identity was associated with an
increase in the proportion of groups in one’s network where not using drugs or alcohol was
normative.
Discussion
The aim of this study was to examine the value of Social Identity Mapping in Addiction
Recovery (SIM-AR) in assessing changes in the composition of one’s group memberships and their
substance use norms, and the predicted impact on changes in social identity and substance use
behaviour. Results show that SIM-AR is an effective tool for indicating social identity change in
recovery, in line with predictions from the Social Identity Model of Recovery (SIMOR; Best, Beckwith,
et al., 2016). In particular the results show that better substance use outcomes are related to a
decreased substance-using identity and an increase in recovery identity, as well as a decrease in
proportion of high risk groups and an increase in proportion of low risk groups in one's network.
Importantly, change in recovery identity was positively related to changes in the proportion of low
risk groups in one's network while change in substance-using identity was positively related to
change in the proportion of high risk groups.
It was interesting to find that changes in substance-using and recovery identities were
unrelated over a six month period, suggesting these are distinct processes, at least in these early
stages of recovery. Nevertheless, both were associated with substance use outcomes, with
substance-using identity more strongly related to substance use outcomes at this early stage. This
may be due to the large decrease in strength of substance-using identity observed for the sample,
whereas there was little to no change in recovery identity, despite nearly two thirds of the sample
having left the TC at follow up. Importantly, these findings suggest that this is not necessarily a case
of one identity diminishing as the other becomes stronger, as recovery is not simply a matter of
Page 11 of 14
decreasing substance use or not using at all (e.g. Laudet, 2007; UK Drug Policy Commission, 2008;
White, 2007). Integrating a new recovery identity into one's internalised network of group
memberships requires not only relinquishing one’s substance-using identity, but also assessing
existing group memberships in relation to the emerging recovery identity (Jetten et al., 2009; Dingle,
Stark et al., 2015; Dingle, Cruwys & Frings, 2015). Consequently, indexing the strength of one’s
recovery identity relative to one's substance-using identity is meaningful in terms of gauging identity
change. Indeed, change in this differential has previously been shown to be a better predictor of
recovery outcomes than change in either identity alone (Buckingham et al., 2013; Dingle, Stark et al.,
2015; Dingle et al., 2017).
Still, to understand the mechanisms underlying these distinct identity change processes, it is
first necessary to understand transitions in a person's network composition with regards to
substance use, a key feature in recovery trajectories (e.g. Groh et al., 2007; Longabaugh et al., 2010;
Buchanan & Latkin, 2008). Adaptations made to the SIM tool (Cruwys et al, 2016) to capture the
substance use of group members allows us to gain these insights, with changes in substance-using
and recovery identities underpinned by changes in the normative influence of groups in a person's
social network.
These group-based network changes were also found to be associated with substance use
outcomes, together suggesting they are a key indicator of identity change. Less substance use at
follow up is related to an increased proportion of low risk groups and, to a lesser extent, a decreased
proportion of high risk groups, consistent with previous findings regarding network support for
substance use. Previous findings highlight the importance of introducing non-using network
members (e.g Litt et al., 2009; Longabaugh et al., 2010) and groups (e.g. Best et al., 2012; Biernacki,
1986) to support recovery, with recovery-specific groups most beneficial for people embedded in a
network largely supportive of heavy substance use (Groh, Jason & Keys, 2008). These non-using and
recovery groups provide a positive source of social influence to reduce substance use (Bohnert et al.,
2009; Rosenquist et al., 2010) through social learning processes and social control mechanisms
(Frings, Collins, Long, Pinto & Albery, 2016; Moos, 2007), linking people with others in long-term
recovery who can act as role models and helping embed new social norms around substance use to
support recovery.
Our findings also illustrate the utility of SIM-AR as an ecologically valid means to capture
complex information not easily indicated through existing quantitative measures. By applying
substance use status categories derived from the IPDA (Zywiak et al., 2009) to an existing visual
method of representing a network of multiple group memberships (SIM; Cruwys et al., 2016), Social
Page 12 of 14
Identity Mapping in Addiction Recovery (SIM-AR) allows us to capture network support and
normative influences for substance use at a social group level. This adaptation provides a significant
and meaningful contribution to further understanding the social identity processes supporting
recovery, primarily though its integration of social groups norms as a mechanism through which to
understand substance use outcomes and identity change.
Results also reinforce that SIM-AR is of greatest empirical value when administered at multiple
time points. Assessing change over time has great clinical value, as explored by Haslam and
colleagues (2017) in preliminary case studies of SONAR study participants, with change in the
number, type and importance of groups contributing to wellbeing and substance use outcomes.
Mapping can be used to facilitate strategic decisions about social relationships, whilst highlighting
complexities in doing so. For example, a group with heavy substance use norms may provide a
person with valued social and emotional support, and for this reason the person may choose not to
distance themselves entirely from that group. However, to support recovery goals, they will need to
negotiate how they engage with members to minimise social influence around substance use. A SIM-
based tool may also be used alongside community development practices to connect people with a
broad range of recovery supportive groups where such supports are lacking in one’s existing network
(Best, Irving, Collinson, Andersson & Edwards, 2017). Changes can then be assessed by repeating the
SIM-AR task in a therapeutic session, drawing comparisons with a previous map.
Finally, although the variety of measures that can be drawn from SIM-AR is a strength,
particularly when used clinically, in a research context the time required to co-produce a map with
each participant, and to code and analyse the data, may prove impractical in large scale studies. To
this end, Cruwys and colleagues (2016) suggest consideration be given to time and the social identity
data sought when designing a study. Where the focus is on a particular social category, such as
'drinker' and 'in recovery', a measure of strength of identification may be sufficient and more
appropriate, as use of such measures have demonstrated significance in predicting a broad range of
recovery outcomes (e.g. Buckingham et al., 2013; Dingle, Stark et al., 2015). However, SIM-AR is
particularly appropriate where various social identity constructs or mechanisms underpinning social
identity change in recovery are the focus of research.
Limitations
A number of limitations need to be considered. Although power analyses indicated that the
sample size was only sufficient to detect moderate to large effects (r > 0.4), support was found for
our hypotheses. Nevertheless, the sample size limits our capacity to engage in more detailed

Page 13 of 14
analysis to address a number of study limitations. Firstly, 38 of the 101 participants followed up were
still in a controlled, drug-free environment at this time thus inhibiting people’s substance use and
potentially influencing responses on measures of social identification. Correlational analyses are
clearly insufficient to determine whether identity change reported was due to being in the drug-free
environment of the TC. Nevertheless, what is significant is that changes in both identity and network
composition were still related to substance use behaviour despite the difference in environments at
follow up.
In terms of methodological limitations, our results are a reflection of the method used to
categorise groups as high risk or low risk. The method used here was intended to replicate and apply,
at a group-based level, the scoring conventions used in various iterations of the IPDA (Groh et al.,
2007; Longabaugh et al, 2010). As results show significant associations for high risk and low risk
alcohol and drug groups with both participants' substance use and identity change, this approach to
categorisation appears meaningful in an addiction treatment context. In more general substance use
research, however, a method for assessing the social influence of groups whose norms support
casual use may need to be considered.
Conclusion and future directions
Using a visual approach broadens the scope of relevant data in the study of complex social
factors supporting the process of recovery from addiction. These findings provide the first step in
further developing the Social Identity Model of Recovery (SIMOR; Best, Beckwith et al., 2016),
providing a practical tool with which to do so, and guiding use of SIM-AR in research and clinical
settings.
Further research using SIM-AR can also extend these findings to assess the impact of other
aspects of multiple group memberships found to support wellbeing more generally — such as group
compatibility and group importance (e.g. Cruwys et al., 2016; Mawson et al., 2015) — as well as
factors that may inhibit positive changes in network group memberships and identities, such as
internalised stigma (e.g. Corrigan, Larson & Rüsch, 2009; Link, Cullen, Struening, Shrout &
Dohrenwend, 1989). This will allow a more nuanced assessment of the Social identity Model of
Recovery (SIMOR; Best, Beckwith, et al., 2016).
Beyond its research applications, SIM-AR holds great promise for further development as a
clinical tool, providing a concrete method for addressing an abstract concept that holds intuitive
appeal to participants. With increasing knowledge of social identity processes supporting both
treatment outcomes and the recovery process more broadly, there is significant scope to embed
Page 14 of 14
SIM-AR in a therapeutic program, with the standard SIM shown to be effective as the basis of general
health-promoting interventions (Haslam, Cruwys, Haslam, Dingle & Chang, 2016). Given, the
recognised benefits of using visual representations in therapeutic alliance and communication with a
substance-using populations (Dansereau & Simpson, 2009), SIM-AR holds great promise as both an
assessment and treatment planning tool. In the context of Therapeutic Community programs in
which it was tested, it is recommended that Social Identity Mapping in Addiction Recovery be used
throughout the program to explicitly address the process of identity change.
Declaration of interest:
The authors report no conflicts of interest.

References
Abrams, D., Wetherell, M., Cochrane, S., Hogg, M. A., & Turner, J. C. (1990). Knowing what to think by knowing
who you are: Self-categorization and the nature of norm formation, conformity and group polarization.
British Journal of Social Psychology, 29(2), 97-119. doi:10.1111/j.2044-8309.1990.tb00892.x
Beckwith, M., Best, D., Dingle, G., Perryman, C., & Lubman, D. (2015). Predictors of flexibility in social identity
among people entering a Therapeutic Community for substance abuse. Alcoholism Treatment
Quarterly, 33(1), 93-104.
Best, D., Beckwith, M., Haslam, C., Haslam, S. A., Jetten, J., Mawson, E., & Lubman, D. I. (2016). Overcoming
alcohol and other drug addiction as a process of social identity transition: The Social Identity Model of
Recovery (SIMOR). Addiction Research & Theory, 1-13. doi: 10.3109/16066359.2015.1075980
Best, D., Gow, J., Knox, T., Taylor, A., Groshkova, T., & White, W. (2012). Mapping the recovery stories of
drinkers and drug users in glasgow: Quality of life and its associations with measures of recovery capital.
Drug and Alcohol Review, 31(3), 334-341. doi:10.1111/j.1465-3362.2011.00321.x
Best, D., Gow, J., Taylor, A., Knox, A., & White, W. (2011). Recovery from heroin or alcohol dependence: A
qualitative account of the recovery experience in Glasgow. Journal of Drug Issues, 41(3), 359-377.
Best, D., Groshkova, T., Loaring, J., Ghufran, S., Day, E., & Taylor, A. (2010). Comparing the addiction careers of
heroin and alcohol users and their self-reported reasons for achieving abstinence. Journal of Groups in
Addiction & Recovery, 5(3-4), 289-305. doi:10.1080/1556035X.2010.523364
Best, D., Irving, J., Collinson, B., Andersson, C., & Edwards, M. (2017). Recovery networks and community
connections: Identifying connection needs and community linkage opportunities in early recovery
populations. Alcoholism Treatment Quarterly, 35(1), 2-15. doi:10.1080/07347324.2016.1256718
Best, D., Lubman, D., Savic, M., Wilson, A., Dingle, G., Haslam, S., . . . Jetten, J. (2014). Social and transitional
identity: Exploring social networks and their significance in a therapeutic community setting.
Therapeutic Communities: The International Journal of Therapeutic Communities, 35(1), 10-20.
Best, D., Haslam, C., Staiger, P., Dingle, G., Savic, M., Bathish, R., … Lubman, D (2016) Social Networks and
Recovery (SONAR): Characteristics of a longitudinal outcome study in five Therapeutic Communities in
Australia. Therapeutic Communities: The International Journal of Therapeutic Communities, 37(3), 131-
139. doi: 10.1108/TC-04-2016-0012
Biernacki, P. (1986). Pathways from heroin addiction: Recovery without treatment. Philadelphia: Temple
University Press.
Bohnert, A. S. B., Bradshaw, C. P., & Latkin, C. A. (2009). A social network perspective on heroin and cocaine
use among adults: evidence of bidirectional influences. Addiction, 104(7), 1210-1218.
doi:10.1111/j.1360-0443.2009.02615.x
Buchanan, A. S., & Latkin, C. A. (2008). Drug use in the social networks of heroin and cocaine users before and
after drug cessation. Drug and Alcohol Dependence, 96(3), 286-289.
doi:10.1016/j.drugalcdep.2008.03.008
Buckingham, S. A., Frings, D., & Albery, I. P. (2013). Group membership and social identity in addiction
recovery. Psychology of Addictive Behaviors, 27(4), 1132-1140. doi: 10.1037/a0032480
Corrigan, P. W., Larson, J. E., & Rüsch, N. (2009). Self‐stigma and the “why try” effect: impact on life goals and
evidence‐based practices. World Psychiatry, 8(2), 75-81. doi:10.1002/j.2051-5545.2009.tb00218.x
Cruwys, T., Steffens, N.K., Haslam, S.A., Haslam, C., Jetten, J., & Dingle, G. (2016). Social Identity Mapping
(SIM): A procedure for visual representation and assessment of subjective group memberships. British
Journal of Social Psychology, 55(4), 613-642. doi:10.1111/bjso.12155
Dansereau, D. F., & Simpson, D. D. (2009). A picture is worth a thousand words: the case for graphic
representations. Professional Psychology: Research and Practice, 40(1), 104-110. doi:10.1037/a0011827
Dingle, G. A., Cruwys, T., & Frings, D. (2015) Social identities as pathways into and out of addiction. Frontiers in
Psychology, 6, 1795. doi:10.3389/fpsyg.2015.01795
Dingle, G., Haslam, C., Best, D., Chan, G., Staiger, P., Savic, M., … Lubman, D. (2017, November) Social identity
differentiation predicts TC treatment commitment and retention at 6 months (SONAR Project). Poster
session presented at the meeting of the Australasian Professional Society on Alcohol and other Drugs,
Melbourne, Australia
Dingle, G. A., Stark, C., Cruwys, T., & Best, D. (2015). Breaking good: Breaking ties with social groups may be
good for recovery from substance misuse. British Journal of Social Psychology, 54(2), 236-254.
doi:10.1111/bjso.12081
Doosje, B., Ellemers, N., & Spears, R. (1995). Perceived intragroup variability as a function of group status and
identification. Journal of Experimental Social Psychology, 31(5), 410-436.
Frings, D., Collins, M., Long, G., Pinto, I. R., & Albery, I. P. (2016). A test of the Social Identity Model of
Cessation Maintenance: The content and role of social control. Addictive Behaviors Reports, 3, 77-85.
doi:10.1016/j.abrep.2016.02.003
Granfield, R., & Cloud, W. (1996). The elephant that no one sees: Natural recovery among middle-class addicts.
Journal of Drug Issues, 26(1), 45-61.
Groh, D. R., Jason, L. A., & Keys, C. B. (2008). Social network variables in alcoholics anonymous: A literature
review. Clinical Psychology Review, 28(3), 430-450. doi:10.1016/j.cpr.2007.07.014
Groh, D. R., Olson, B. D., Jason, L. A., Davis, M. I., & Ferrari, J. R. (2007). A factor analysis of the Important
People Inventory. Alcohol and Alcoholism, 42(4), 347–353. doi:10.1093/alcalc/agm012
Haslam, C., Cruwys, T., & Haslam, S.A. (2014). "The we's have it": Evidence for the distinctive benefits of group
engagement in enhancing cognitive health in ageing. Social Science and Medicine, 120, 57-66.
Haslam, C., Cruwys, T., Haslam, S. A., Dingle, G., & Chang, M. X.-L. (2016). Groups 4 Health: Evidence that a
social-identity intervention that builds and strengthens social group membership improves mental
health. Journal of Affective Disorders, 194, 188-195. doi:10.1016/j.jad.2016.01.010
Haslam, C., Cruwys, T., Milne, M., Kan, C-H, & Haslam, S.A. (2015). Group ties protect cognitive health by
promoting social identification and social support. Journal of Aging and Health.
doi:10.1177/0898264315589578.
Haslam, C., Dingle, G. A., Best, D., Mackenzie, J., & Beckwith, M. (2017). Social identity mapping: Measuring
social identity change in recovery from addiction Addiction, behavioral change and social identity: The
path to resilience and recovery. Abingdon, Oxon: Routledge.
Haslam, C., Holme, A., Haslam, S.A., Iyer, A., Jetten, J., & Williams, W.H. (2008). Maintaining group
membership: Identity continuity and well-being after stroke Neuropsychological Rehabilitation, 18, 671-
691.
Haslam, C., Jetten, J., Cruwys, T., Dingle, G. A., & Haslam, S. A. (2018). The new psychology of health: Unlocking
the social cure. London and New York: Routledge
Haslam, S. A., Jetten, J., Postmes, T., & Haslam, C. (2009). Social Identity, Health and Well-Being: An Emerging
Agenda for Applied Psychology. Applied Psychology, 58(1), 1-23. doi:10.1111/j.1464-0597.2008.00379.x
Jetten, J., Branscombe, N.R., Haslam, S.A., Haslam, C., Cruwys, T., Jones, J.M., . . . Zhang, A. (2015) Having a lot
of a good thing: multiple important group memberships as a source of self-esteem. PLoS ONE, 10(5),
e0124609. doi:10.1371/journal.pone.0124609
Jetten, J., Haslam, C., & Haslam, S. A. (Eds.). (2012). The social cure: Identity, health, and well-being. London
and New York: Psychology Press.
Jetten, J., Haslam, C., Haslam, S. A., & Branscombe, N. (2009). The social cure. Scientific American Mind, 20(5),
26-33.
Jetten, J., Haslam, S. A., Iyer, A., & Haslam, C. (2009). Turning to Others in Times of Change. In S. Stürmer & M.
Snyder (Eds.), The psychology of prosocial behavior: Group processes, intergroup relations, and helping
(pp. 139-156). West Sussex, UK: Wiley-Blackwell.
Laudet, A. B. (2007). What does recovery mean to you? Lessons from the recovery experience for research and
practice. Journal of Substance Abuse Treatment, 33(3), 243-256. doi: 10.1016/j.jsat.2007.04.014
Link, B. G., Cullen, F. T., Struening, E., Shrout, P. E., & Dohrenwend, B. P. (1989). A Modified Labeling Theory
Approach to Mental Disorders: An Empirical Assessment. American Sociological Review, 54(3), 400-423.
doi:10.2307/2095613
Litt, M. D., Kadden, R. M., Kabela-Cormier, E., & Petry, N. (2007). Changing network support for drinking: Initial
findings from the Network Support Project. Journal of Consulting and Clinical Psychology, 75(4), 542.
Litt, M. D., Kadden, R. M., Kabela-Cormier, E., & Petry, N. M. (2009). Changing network support for drinking:
Network Support Project 2-year follow-up. Journal of Consulting and Clinical Psychology, 77(2), 229-
242.
Longabaugh, R., Wirtz, P. W., Zweben, A., & Stout, R. (2008). Network Support for Drinking. In R. Longabaugh &
P. W. Wirtz (Eds.), Project MATCH: Hypotheses, Results, and Causal Chain Analyses. Rockville, MD:
National Institute on Alcohol Abuse and Alcoholism.
Longabaugh, R., Wirtz, P. W., Zywiak, W. H., & O'Malley, S. S. (2010). Network support as a prognostic indicator
of drinking outcomes: The COMBINE study. Journal of Studies on Alcohol and Drugs, 71(6), 837-846.
Mawson, E., Best, D., Beckwith, M., Dingle, G., & Lubman, D. (2015). Social identity, social networks and
recovery capital in emerging adulthood: A pilot study. Substance Abuse Treatment, Prevention, and
Policy, 10(1). doi:10.1186/s13011-015-0041-2
McIntosh, J., & McKeganey, N. (2000). Addicts' narratives of recovery from drug use: constructing a non-addict
identity. Social Science & Medicine, 50(10), 1501-1510.
McIntosh, J., & McKeganey, N. (2001). Identity and Recovery from Dependent Drug Use: the addict's
perspective. Drugs: Education, Prevention and Policy, 8(1), 47-59. doi:10.1080/09687630124064
Moos, R. H. (2007). Theory-based processes that promote the remission of substance use disorders. Clinical
psychology review, 27(5), 537-551.
Rosenquist, J. N., Murabito, J., Fowler, J. H., & Christakis, N. A. (2010). The spread of alcohol consumption
behavior in a large social network. Annals of Internal Medicine, 152(7), 426-433. doi:10.7326/0003-
4819-152-7-201004060-00007
Ryan, A., Holmes, J., Hunt, V., Dunlop, A., Mammen, K., Holland, R., . . . Lintzeris, N. (2014). Validation and
implementation of the Australian Treatment Outcomes Profile in specialist drug and alcohol settings.
Drug and Alcohol Review, 33(1), 33-42.
Tajfel, H., & Turner, J. C. (1979). An integrative theory of intergroup conflict. In W. G. Austin & S. Worchel
(Eds.), The social psychology of intergroup relations (pp. 33-47). Monterey, CA.: Brooks/Cole.
Turner, J. C. (1991). Social Influence. Belmont, CA, US: Thomson Brooks/Cole Publishing Co.
Turner, J. C., Hogg, M. A., Oakes, P. J., Reicher, S. D., & Wetherell, M. S. (1987). Rediscovering the social group:
A self-categorization theory. Cambridge, MA: Basil Blackwell.
UK Drug Policy Commission. (2008). The UK Drug Policy Commission Recovery Consensus Group: A vision of
recovery. London: UKDPC.
Waldorf, D. (1983). Natural recovery from opiate addiction: some social-psychological processes of untreated
recovery. Journal of Drug Issues, 13(2), 237-247.

White, W. (2007). Addiction recovery: Its definition and conceptual boundaries. Journal of Substance Abuse
Treatment, 33(3), 229-241.
Zywiak, W. H., Neighbors, C. J., Martin, R. A., Johnson, J. E., Eaton, C. A., & Rohsenow, D. J. (2009). The
Important People Drug and Alcohol Interview: Psychometric Properties, Predictive Validity, and
Implications for Treatment. Journal of Substance Abuse Treatment, 36(3), 321-330.
doi:10.1016/j.jsat.2008.08.001

Figure 1: Example of a typical map created using the SIM-AR process
Heavy use
Casual use
Non-use / abstinent
Recovery
Unknown
Very important Moderately important
Of little importance
Substance use status Importance Relationships
A lot in common
Some in common
A lot of conflict
Some conflict
ME Work (14 people)
Drug friends (6 people)
Recovery group (20 people)
Family (4 people) Close friends
(4 people)
Alcohol use (small dots)
Drug use (large dots)

Table 1. Descriptive statistics for key variables at baseline and 6-month follow up
Baseline (N = 155) Follow up (N = 101)
Median IQR Median IQR Significance of
difference
GROUPS IN NETWORK
Total groups 4 2 - 5 4 3 - 5 NS
High risk groups (alcohol) 0 0 - 1 0 0 - 0 p =.001
High risk groups (drugs) 1 0 - 2 0 0 - 0 p <.001
Low risk groups (alcohol) 1 0 - 1 1 0 - 2.25 p <.001
Low risk groups (drugs) 2 1 - 3 3 2 - 4 p <.001
SOCIAL IDENTIFICATION
'Drinker' or 'drug user' 5.75 4.5 - 6.5 3.75 2.25 - 6.0 p <.001
'In recovery' 5.5 5.0 - 6.25 5.5 4.75 - 6.25 NS
SUBSTANCE USE (last 28 days)
Number of substances used 3 1 - 4 1 0 - 3 p <.001
Maximum days any substance used 28 20 - 28 3 0 - 25.5 p <.001
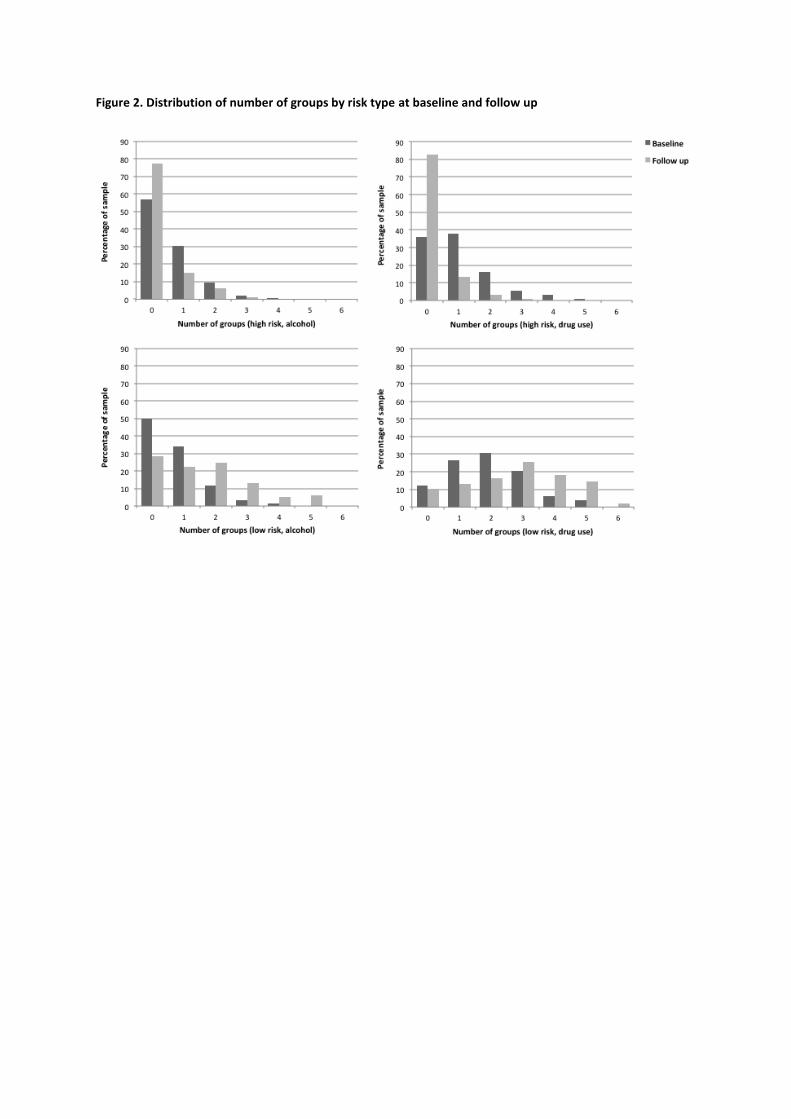
Figure 2. Distribution of number of groups by risk type at baseline and follow up
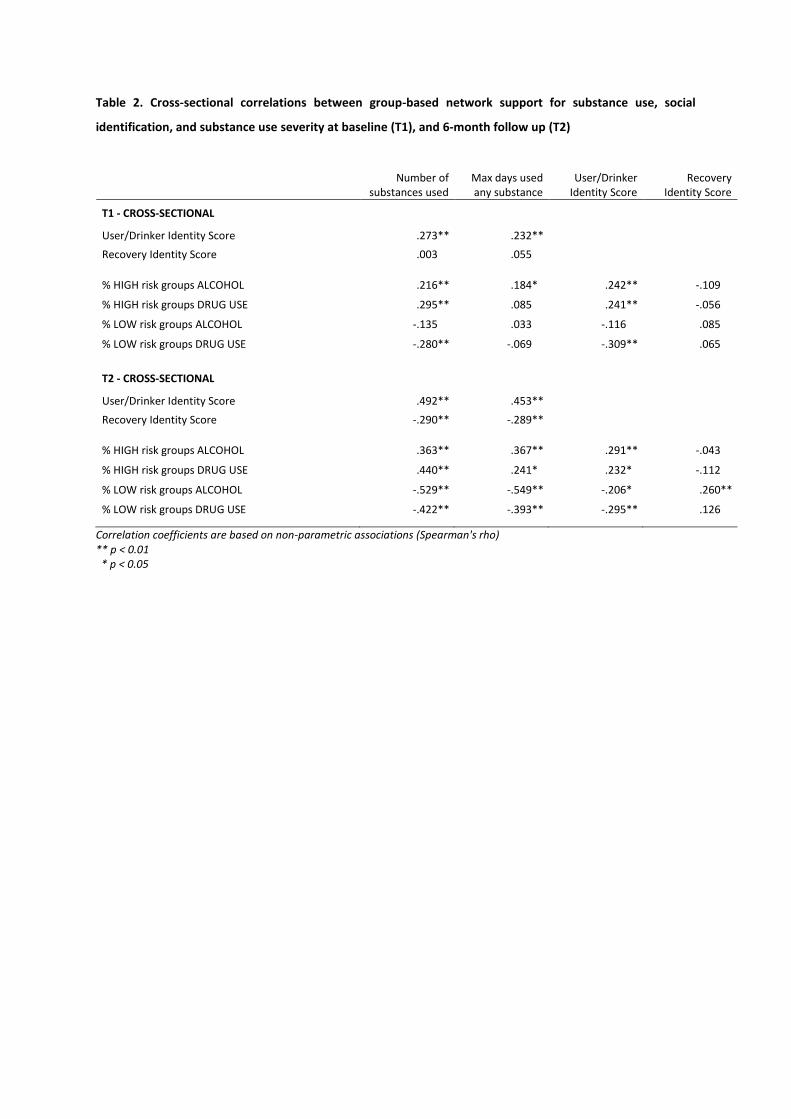
Table 2. Cross-sectional correlations between group-based network support for substance use, social
identification, and substance use severity at baseline (T1), and 6-month follow up (T2)
Number of
substances used Max days used any substance
User/Drinker Identity Score
Recovery Identity Score
T1 - CROSS-SECTIONAL
User/Drinker Identity Score .273** .232**
Recovery Identity Score .003 .055
% HIGH risk groups ALCOHOL .216** .184* .242** -.109
% HIGH risk groups DRUG USE .295** .085 .241** -.056
% LOW risk groups ALCOHOL -.135 .033 -.116 .085
% LOW risk groups DRUG USE -.280** -.069 -.309** .065
T2 - CROSS-SECTIONAL
User/Drinker Identity Score .492** .453**
Recovery Identity Score -.290** -.289**
% HIGH risk groups ALCOHOL .363** .367** .291** -.043
% HIGH risk groups DRUG USE .440** .241* .232* -.112
% LOW risk groups ALCOHOL -.529** -.549** -.206* .260**
% LOW risk groups DRUG USE -.422** -.393** -.295** .126
Correlation coefficients are based on non-parametric associations (Spearman's rho) ** p < 0.01 * p < 0.05

Table 3. Correlations between change in group-based network support for substance use, change in social
identification, and substance use at follow up
CHANGE
Number of substances used
at follow up
Max days any substance used
at follow up
Change in User/Drinker Identification
Change in Recovery
Identification
(Spearman's rho) (Pearson's r)
Change in User/Drinker Identification .425** .407**
Change in Recovery Identification -.318** -.294** .009
Change in % HIGH risk groups ALCOHOL .246* .260* .273** -.263*
Change in % HIGH risk groups DRUGS .213* .134 .244* -.110
Change in % LOW risk groups ALCOHOL -.415** -.423** -.078 .224*
Change in % LOW risk groups DRUGS -.364** -.322** -.291** .238*
** p < 0.01 * p < 0.05


