

Socioeconomic Characteristics of Smallholder
Rice Production in Ethiopia
Minilik Tsega Dawit Alemu
Shiratori Kiyoshi
Research Report 100
የ ኢትዮጵያ የ ግብርና ምርምር ኢንስቲትዩት
Ethiopian Institute of Agricultural Research
2
Socioeconomic Characteristics of Smallholder
Rice Production in Ethiopia
©EIAR, 2013 ›=ÓU›=' 2005
Website: http://www.eiar.gov.et Tel: +251-11-6462633 Fax: +251-11-6461294 P.O.Box: 2003 Addis Ababa, Ethiopia
ISBN: 978-99944-53-92-4 Copyediting and design: Abebe Kirub Printing: Abesolom Kassa Binding and collation: Abesolom Kassa, Miftah Argeta, and Wudnesh Mamo Distribution: Solomon Tsega, Bogalech Abebe, and Meseret Kebede
3
Contents
Preface 1
Introduction 2
Methodology 3
Producers and ecologies 7
Demographic characteristic 9
Economic characteristics 15
Varieties, seed and seed management 18
Agronomy 27
Cultivated area, production and productivity 32
Paddy rice milled and sold 46
Purpose of rice production 49
Major constraints in rice production 49
Conclusion 50
References 50

1
Preface
The preparation of this report was initiated because of the increased need for
information about the characteristics of rice production and its producers in
Ethiopia for the design of effective research and development interventions.
The emerging importance of rice in the country is well recognized following
the approval of the national rice research and development strategy in 2010 by
the Ministry of Agriculture. The purpose of the survey was to document the
characteristics of rice producers by rice agro-ecology in terms of their
socio-demographics and production characteristics mainly in terms of types of
rice varieties grown, seed management, applied agronomic practices, land
allocation, productivity and production levels, and major perceived production
constraints among others.
Accordingly, the report is organized into ten major sections. The first section
presents the methodology applied in conducting the survey. The second section
deals with the distribution of rice producers by major rice ecologies. The next
two sections present the socio-demographic and economic characteristics of
rice producers followed by two sections deal with the types of rice varieties
grown along with farmers’ rice seed management and the agronomic practices
applied. The two sections that follow deal with estimates of rice area allocated,
production and productivity levels, and amount of paddy rice milled and sold.
Before the conclusions, the main purposes of rice production along with the
perceived challenges and constraints in rice production are presented.
We would like to express our appreciation for the technical and financial
support provided by AfricaRice, which is a leading pan-African rice research
organization committed to improving livelihoods in Africa through strong
science and effective partnerships. We would also like to thank Dr Aliou
Diagne and Dr Ali Toure at AfricaRice for the support provided. We appreciate
also the financial support we received from EIAR/JICA FRG II project. We are
also grateful for the supervisions, enumerators, data-entry, and verification
colleagues and to all smallholder rice producers who have shared their precious
time during the data collection.
We hope that the information presented will serve as a baseline and reference
material for rice researchers, development workers, and advocates of the
implementation of the national rice research and development strategy.
The authors
2
Introduction
In recognition to its importance, the Government of Ethiopia (GoE) has
developed national strategy for rice research and development to guide the
integrated and focused promotion of the rice sector in the effort to ensure food
security in the country (MoARD, 2010).
Consumption of imported rice has recently increased tremendously which
boosted rice cultivation locally. The increased demand for rice in the local
market is creating conducive environment for farmers and investors to produce
more rice; which again led to acquisition and development of additional rice
farms in different parts of the country.
The Central Statistical Agency (CSA) is mandated to collect, compile and
disseminate statistical data on agricultural production and related issues. CSA
conducts agricultural sample surveys to provide data on crop area and
production for the private peasant holdings, state farms, and private investors’
farms for the belg and meher seasons. The CSA design surveys and determine
sample sizes based on distribution of the major crops and no attention is given
to rare crops such as rice. For this reason, when samples are drawn rice area
and production were not targeted and measured only from the households
visited. Since the sampling approach gives emphasis to major crops and rice-
growing areas are different from other crops due to its agro-ecological
suitability, very few rice-producing areas are included in the sample that
obviously does not represent rice farming community in the country. This
approach creates a downward bias and rice crop area and production are highly
under estimated.
Unpopularity of the crop in the past has made statistics on rice production,
productivity, and area coverage not to be well known. Generating statistics,
therefore, on various aspects of rice sector has paramount importance.
This study was conducted to generate information on characteristics of rice
producers, production area, production, productivity levels and prioritized
production and marketing constraints. Specifically, the study was designed to
provide statistical data and information about
The socio-demographic characteristics of rice producing households;
Rice producers’ knowledge, experience and productivity constraints;
Characterizing producers knowledge and use of kebele level rice varieties;
3
Access, management and availability of rice seed;
The status of rice production and production management; and
Major challenges of rice production and marketing
Methodology
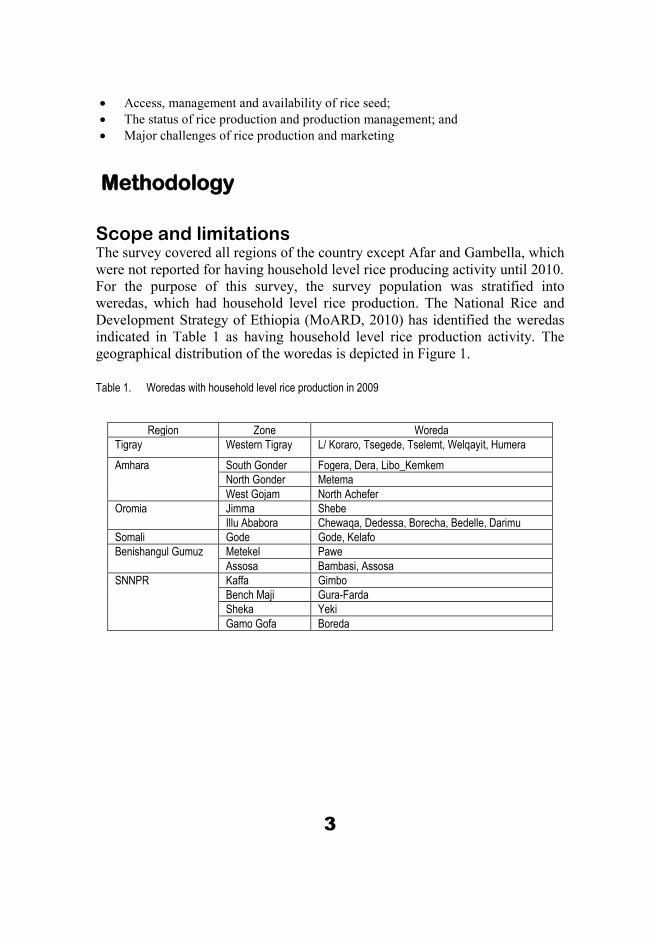
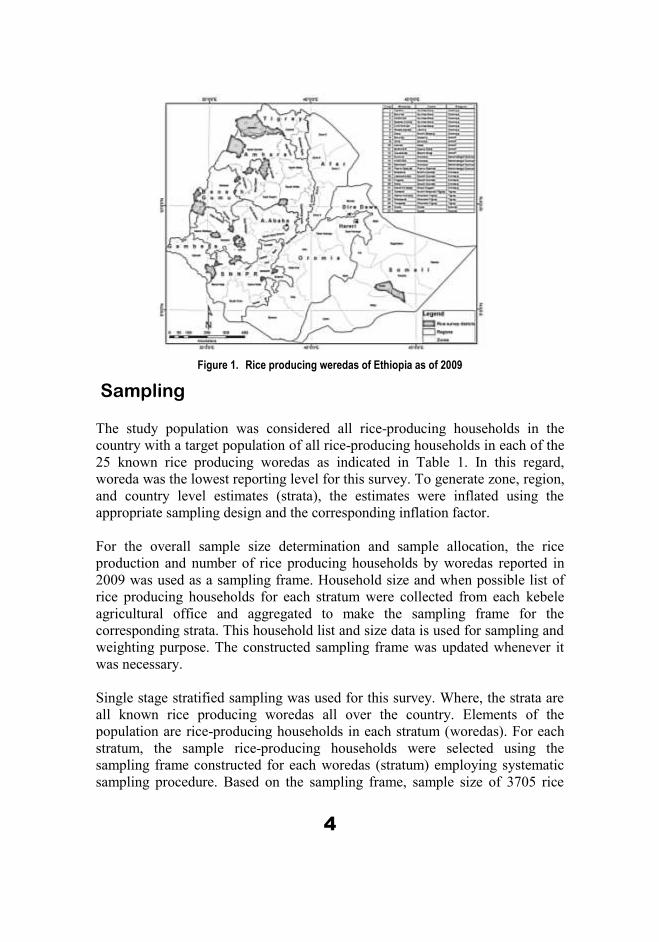
Scope and limitations The survey covered all regions of the country except Afar and Gambella, which
were not reported for having household level rice producing activity until 2010.
For the purpose of this survey, the survey population was stratified into
weredas, which had household level rice production. The National Rice and
Development Strategy of Ethiopia (MoARD, 2010) has identified the weredas
indicated in Table 1 as having household level rice production activity. The
geographical distribution of the woredas is depicted in Figure 1.
Table 1. Woredas with household level rice production in 2009
Region Zone Woreda
Tigray Western Tigray L/ Koraro, Tsegede, Tselemt, Welqayit, Humera
Amhara
South Gonder Fogera, Dera, Libo_Kemkem
North Gonder Metema
West Gojam North Achefer
Oromia
Jimma Shebe
Illu Ababora Chewaqa, Dedessa, Borecha, Bedelle, Darimu
Somali Gode Gode, Kelafo
Benishangul Gumuz
Metekel Pawe
Assosa Bambasi, Assosa
SNNPR
Kaffa Gimbo
Bench Maji Gura-Farda
Sheka Yeki
Gamo Gofa Boreda
4
Figure 1. Rice producing weredas of Ethiopia as of 2009
Sampling
The study population was considered all rice-producing households in the
country with a target population of all rice-producing households in each of the
25 known rice producing woredas as indicated in Table 1. In this regard,
woreda was the lowest reporting level for this survey. To generate zone, region,
and country level estimates (strata), the estimates were inflated using the
appropriate sampling design and the corresponding inflation factor.
For the overall sample size determination and sample allocation, the rice
production and number of rice producing households by woredas reported in
2009 was used as a sampling frame. Household size and when possible list of
rice producing households for each stratum were collected from each kebele
agricultural office and aggregated to make the sampling frame for the
corresponding strata. This household list and size data is used for sampling and
weighting purpose. The constructed sampling frame was updated whenever it
was necessary.
Single stage stratified sampling was used for this survey. Where, the strata are
all known rice producing woredas all over the country. Elements of the
population are rice-producing households in each stratum (woredas). For each
stratum, the sample rice-producing households were selected using the
sampling frame constructed for each woredas (stratum) employing systematic
sampling procedure. Based on the sampling frame, sample size of 3705 rice

5
producing households were identified and the overall sample size was allocated
proportionally to each of the stratum based on the stratum household size
(Table 2). The required information then was generated using a pre-tested
structured questionnaire prepared for the purpose.
Table 2. Distribution of rice producing households by region and woreda
Region Zone No. of sampled rice producing households
Amhara
Metema 139
Fogera 1550
Libo_Kemkem 701
Dera 421
North Achefer 33
Sub-total 2844
Tigray
L/Koraro 53
Tsegede 12
Tselemt 13
Welqayit 9
Qafta Humera 6
Sub-total 93
Benishangul Gumuz
Bambasi 30
Kurmuk 9
Pawe 8
Assosa 5
Sub-total 52
Oromia
Chewaqa 142
Dedessa 78
Borecha 41
Bedelle 37
Darimu 3
Shebe 36
Sub-total 337
Somali
Gode 35
Kelafo 77
Sub-total 112
SNNPR
Yeki 14
Boreda 14
Gura-Farda 262
Gimbo 11
Misha 1
Sub-total 302
Grand total 3705
6
Field survey
Field team organization
The data collection was done in four rounds. In each round, the survey team
was composed of 13 members grouped into two teams. Each of the team was
composed of five enumerators and one team leader and there was one overall
coordinator. One car for each team was assigned starting from the date of
deployment to the end of data collection. Each team was responsible to conduct
both village and producer level survey of those sites they were assigned
Field team recruitment and training
The field team members were recruited based on formal criteria that can
address well the interest of the research. The enumerators and supervisors who
had related experience and attachment with CSA were recruited. Three days
training was given for the field staffs in order to have correct and uniform
understanding of the concepts, ideas, and instructions on how to fill each entry
in the questionnaires.
Data collection
Data collection activity was conducted with one official, who can facilitate
conditions from each of the study villages or localities. During the data
collection, there was strong supervision with field supervisors and as well from
the researchers. Some on-field data editing were made by supervisors, the
coordinator and as well by the researchers.
Data editing, coding, verification and entry
Edited questionnaires were fully verified and checked for consistency before
data entry. After data entry, automated data cleaning was conducted. Data entry
was conducted using CSPro software. The entered dataset, which was in CSPro
format, was exported to SPSS for further processing and analysis.
Data processing and report writing
Data processing, analysis, and report writing activities were handled by the
country research team. The team was composed of three researchers: one
statistician, one agricultural economist, and one GIS expert.
7
Producers and Ecologies
The number of smallholder rice producers in the country for 2010 is estimated
to be 64,886. From the total smallholder rice producers, 94.1 % are male
headed and the remaining 5.9 % are female headed. This result shows that rice
farming in Ethiopia, like most agricultural activities, is households engaged in
rice production are dominantly male headed. During the survey in all regions,
except Afar and Gambella, there was household level rice production. The
three main rice-producing regions were Amhara, Oromia, and SNNPR having
76, 14.9, and 5.2% of the country rice producers, respectively. Almost 75% of
the rice producers are found in South Gonder Zone of Amhara followed by
18.8% in Ilu Ababora Zone of Oromia and 3.6% in Bench Maji Zone of
SNNPR
In 2010, 94.3% of the rice ecology under practice was rain-fed followed by
upland rain-fed and irrigated with 4.6 and 1.1%, respectively. The irrigated rice
ecology is being practiced only in Somali region. In Tigray Region, 68.8 % of
the rice ecology is upland rain-fed while the remaining is lowland rain-fed. For
Amhara, Oromia, and Benishangul Gumuz, more than 92 % of the ecology is
lowland rain-fed while the rest is upland rain-fed. This indicates that rice
production in Ethiopia is dominated by rain-fed (Table 3).

8
Table 3. Distribution of rice producers in 2010
Region Zone Rice producers Producers by rice agro-ecologies
Irrigated Upland rain-fed Lowland rain-fed
No of producers
% No of producers
% No of producers
% No of producers
%
Tigray Western Tigray 1,216 1.9 0 0.0 836 68.8 380 31.3
Total 1,216 1.9 0 0.0 836 68.8 380 31.3
Amhara South Gonder 48,705 75.1 0 0.0 1,457 3.0 47,247 97.0
North Gonder 601 0.9 0 0.0 587 97.7 14 2.3
West Gojam 40 0.1 0 0.0 0 0.0 40 100.0
Total 49,345 76.0 0 0.0 2,044 4.1 47,301 95.9
Oromia Jimma 696 1.1 0 0.0 18 2.6 679 97.4
Ilu Ababora 8,956 13.8 0 0.0 0 0.0 8,956 100.0
Total 9,652 14.9 0 0.0 18 0.2 9,634 99.8
Somali Gode 731 1.1 731 100.0 0 0.0 0 0.0
Total 731 1.1 731 100.0 0 0.0 0 0.0
Benishangul Gumuz
Metekel 340 0.5 0 0.0 0 0.0 340 100.0
Assosa 210 0.3 0 0.0 40 19.0 170 81.0
Total 550 0.8 0 0.0 40 7.3 510 92.7
SNNPR Kaffa 574 0.9 0 0.0 44 7.7 530 92.3
Bench Maji 2,335 3.6 0 0.0 16 0.7 2,319 99.3
Sheka 429 0.7 0 0.0 0 0.0 429 100.0
Gamo Gofa 54 0.1 0 0.0 0 0.0 54 100.0
Total 3,392 5.2 0 0.0 61 1.8 3,331 98.2
Total Male 61,027 94.1 598 1.0 2,820 4.6 57,609 94.4
Female 3,860 5.9 133 3.5 179 4.6 3,547 91.9
Total 64,886 100.0 731 1.1 2,999 4.6 61,156 94.3
9
Demographic Characteristics
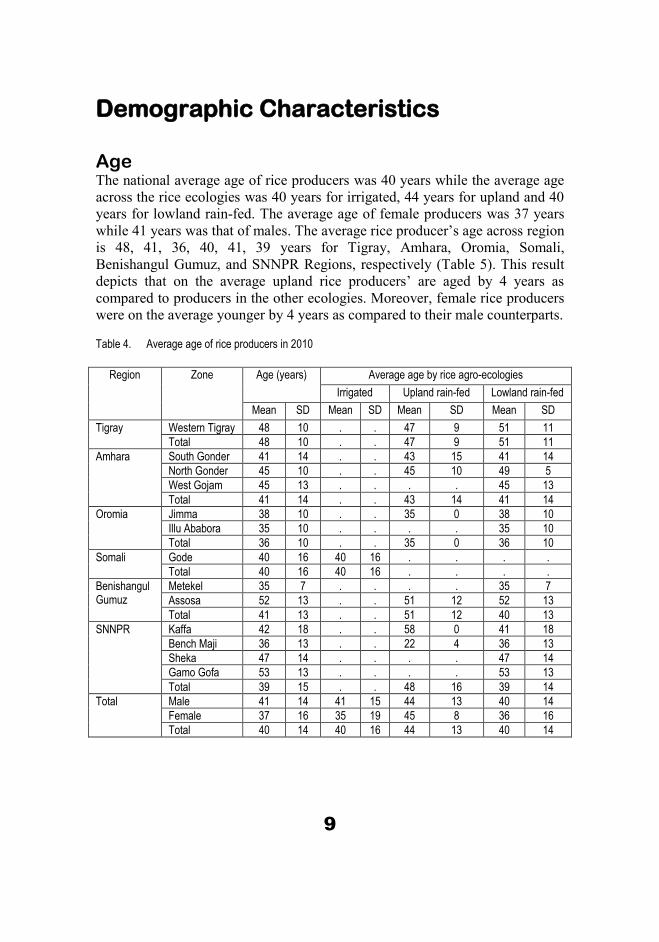
Age The national average age of rice producers was 40 years while the average age
across the rice ecologies was 40 years for irrigated, 44 years for upland and 40
years for lowland rain-fed. The average age of female producers was 37 years
while 41 years was that of males. The average rice producer’s age across region
is 48, 41, 36, 40, 41, 39 years for Tigray, Amhara, Oromia, Somali,
Benishangul Gumuz, and SNNPR Regions, respectively (Table 5). This result
depicts that on the average upland rice producers’ are aged by 4 years as
compared to producers in the other ecologies. Moreover, female rice producers
were on the average younger by 4 years as compared to their male counterparts. Table 4. Average age of rice producers in 2010
Region Zone Age (years) Average age by rice agro-ecologies
Irrigated Upland rain-fed Lowland rain-fed
Mean SD Mean SD Mean SD Mean SD
Tigray Western Tigray 48 10 . . 47 9 51 11
Total 48 10 . . 47 9 51 11
Amhara South Gonder 41 14 . . 43 15 41 14
North Gonder 45 10 . . 45 10 49 5
West Gojam 45 13 . . . . 45 13
Total 41 14 . . 43 14 41 14
Oromia Jimma 38 10 . . 35 0 38 10
Illu Ababora 35 10 . . . . 35 10
Total 36 10 . . 35 0 36 10
Somali Gode 40 16 40 16 . . . .
Total 40 16 40 16 . . . .
Benishangul Gumuz
Metekel 35 7 . . . . 35 7
Assosa 52 13 . . 51 12 52 13
Total 41 13 . . 51 12 40 13
SNNPR Kaffa 42 18 . . 58 0 41 18
Bench Maji 36 13 . . 22 4 36 13
Sheka 47 14 . . . . 47 14
Gamo Gofa 53 13 . . . . 53 13
Total 39 15 . . 48 16 39 14
Total Male 41 14 41 15 44 13 40 14
Female 37 16 35 19 45 8 36 16
Total 40 14 40 16 44 13 40 14

10
Distribution of household members by sex
In terms of the distribution of household members by sex, 54.2 % of the
members of rice producing households were male and the remaining 45.8 %
were females. With the exception of Benishangul Gumuz, the sex distribution
of the regions is almost similar. In Benishangul Gumuz, about 65 % of
household members were constituted by male population (Table 5).
Table 5. Distribution of household members by sex
Region Zone Sex Total Male Female
No. % No. %
Tigray Western Tigray 4,064 54.2 3,432 45.8 7,496
Total 4,064 54.2 3,432 45.8 7,496
Amhara South Gonder 131,215 53.7 113,211 46.3 244,426
North Gonder 1,598 53.0 1,418 47.0 3,016
West Gojam 125 56.6 96 43.4 221
Total 132,938 53.7 114,724 46.3 247,662
Oromia Jimma 2,000 56.0 1,571 44.0 3,571
Illu Ababora 29,333 55.9 23,097 44.1 52,430
Total 31,333 55.9 24,669 44.1 56,002
Somali Gode 3,766 57.3 2,804 42.7 6,571
Total 3,766 57.3 2,804 42.7 6,571
Benishangul Gumuz
Metekel 978 69.7 425 30.3 1,403
Assosa 803 59.5 546 40.5 1,349
Total 1,780 64.7 971 35.3 2,751
SNNPR Kaffa 1,458 46.5 1,679 53.5 3,137
Bench Maji 5,567 54.5 4,654 45.5 10,221
Sheka 1,286 58.4 914 41.6 2,200
Gamo Gofa 186 51.5 175 48.5 361
Total 8,496 53.4 7,422 46.6 15,918
Total 182,378 54.2 154,023 45.8 336,401
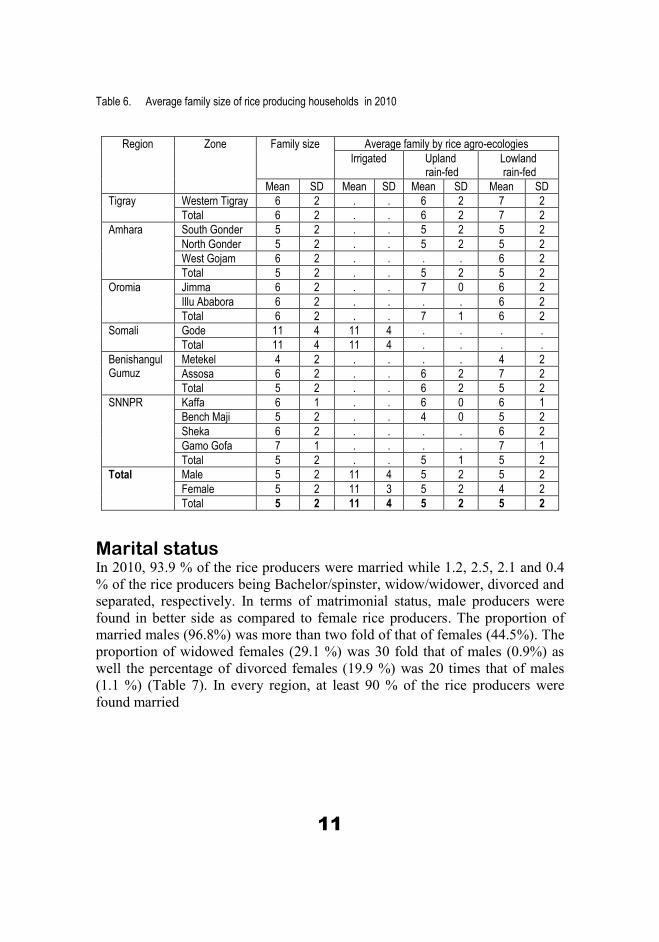
Family size The national average family size of rice producing household is 5 persons;
however, in this survey it was found that 11 persons for the irrigated ecology
and 5 persons for both for upland and lowland rain-fed ecologies. The average
rice producing household size across the surveyed regions was 6, 5, 6, 11, 5,
and 5 persons for Tigray, Amhara, Oromia, Somali, Benishangul Gumuz, and
SNNPR, respectively(Table 6). This result indicates the considerable variability
of rice producing households in family size across regions.
11
Table 6. Average family size of rice producing households in 2010
Region Zone Family size Average family by rice agro-ecologies
Irrigated Upland rain-fed
Lowland rain-fed
Mean SD Mean SD Mean SD Mean SD
Tigray Western Tigray 6 2 . . 6 2 7 2
Total 6 2 . . 6 2 7 2
Amhara South Gonder 5 2 . . 5 2 5 2
North Gonder 5 2 . . 5 2 5 2
West Gojam 6 2 . . . . 6 2
Total 5 2 . . 5 2 5 2
Oromia Jimma 6 2 . . 7 0 6 2
Illu Ababora 6 2 . . . . 6 2
Total 6 2 . . 7 1 6 2
Somali Gode 11 4 11 4 . . . .
Total 11 4 11 4 . . . .
Benishangul Gumuz
Metekel 4 2 . . . . 4 2
Assosa 6 2 . . 6 2 7 2
Total 5 2 . . 6 2 5 2
SNNPR Kaffa 6 1 . . 6 0 6 1
Bench Maji 5 2 . . 4 0 5 2
Sheka 6 2 . . . . 6 2
Gamo Gofa 7 1 . . . . 7 1
Total 5 2 . . 5 1 5 2
Total Male 5 2 11 4 5 2 5 2
Female 5 2 11 3 5 2 4 2
Total 5 2 11 4 5 2 5 2
Marital status In 2010, 93.9 % of the rice producers were married while 1.2, 2.5, 2.1 and 0.4
% of the rice producers being Bachelor/spinster, widow/widower, divorced and
separated, respectively. In terms of matrimonial status, male producers were
found in better side as compared to female rice producers. The proportion of
married males (96.8%) was more than two fold of that of females (44.5%). The
proportion of widowed females (29.1 %) was 30 fold that of males (0.9%) as
well the percentage of divorced females (19.9 %) was 20 times that of males
(1.1 %) (Table 7). In every region, at least 90 % of the rice producers were
found married

12
Table 7. Distribution of rice producers by matrimonial status
Regions Zone/sex % of rice producers
Married Bachelor /Spinster
Widow/ widower
Divorced Separated
Tigray Western Tigray 89.9 0 5.3 4.8 0
Total 89.9 0 5.3 4.8 0
Amhara South Gonder 93.8 0.8 2.7 2.3 0.5
North Gonder 93.2 0 3.8 3 0
West Gojam 100 0 0 0 0
Total 93.8 0.8 2.7 2.3 0.5
Oromia Jimma 97.4 2.6 0 0 0
Illu Ababora 95.6 1.6 1.6 1.2 0
Total 95.7 1.7 1.5 1.1 0
Somali Gode 95.3 4.7 0 0 0
Total 95.3 4.7 0 0 0
Benishangul Gumuz
Metekel 100 0 0 0 0
Assosa 100 0 0 0 0
Total 100 0 0 0 0
SNNPR Kaffa 76.9 23.1 0 0 0
Bench Maji 92.1 3.6 1.1 3.2 0
Sheka 100 0 0 0 0
Gamo Gofa 93.3 0 6.7 0 0
Total 90.5 6.4 0.8 2.2 0
Sex Male 96.8 1.1 0.9 1.1 0.2
Female 44.5 3.5 29.1 19.9 2.9
Total 93.9 1.2 2.5 2.1 0.4
Educational status About 60 % of the rice producers were illiterate while 15.7 % of the producers
can only read and write. The proportion of rice producers reported with
primary, junior, and senior high school, preparatory, TVET, and college was
13.8, 4.8, 2.3, 0.3, and 0.3 % respectively. About 2.6 % of the producers have
also attended religious educations. The illiteracy rate was as high as 69.6 % in
Amhara Region; while the lowest was 12.3 % in Somali Region. In terms of
education, males were better off as compared to their female counterparts.
About 81 and 52 % of females and males respectively were illiterate while 16.3
% of males and 5.3 % of females only can read and write in at least one
language. 14, 4.9, 2.3 % of males and 6.9, 3, 1 % of females have attended
primary, junior and senior high school education (Table 8).

13
Table 8. Distribution of rice producers by educational level
Region Zone /sex % of rice producers
Illiterate Read/ write only
Religious Primary Junior high school
Senior high school
Preparatory TVET Tertiary Other
Tigray Western Tigray 40.2 21.6 0.6 13.8 13 5.3 0 6 0 0
Total 40.2 21.6 0.6 13.8 13 5.3 0 6 0 0
Amhara South Gonder 69.8 13.7 2.7 10.6 2.2 0.9 0.1 0 0 0
North Gonder 57.1 21.8 0.8 11.3 5.3 3 0.8 0 0 0
West Gojam 66.7 12.1 6.1 12.1 3 0 0 0 0 0
Total 69.6 13.8 2.7 10.6 2.3 0.9 0.1 0 0 0
Oromia Jimma 30.8 28.2 0 20.5 13 7.7 0 0 0 0
Illu Ababora 26.6 22.3 1.2 28.2 15 5.6 0.5 0.5 0.3 0.1
Total 26.9 22.7 1.2 27.6 15 5.7 0.5 0.5 0.3 0.1
Somali Gode 12.3 12 13.8 9 13 27 7 6.1 0 0
Total 12.3 12 13.8 9.0 13 27 7 6.1 0 0
Benishangul Gumuz
Metekel 12.5 25 0 12.5 13 25 13 0 0 0
Assosa 52.7 22.2 0 14.6 7.3 3.2 0 0 0 0
Total 27.8 23.9 0 13.3 11 17 7.7 0 0 0
SNNPR Kaffa 30.8 30.8 7.7 15.4 7.7 7.7 0 0 0 0
Bench Maji 49.6 14.3 4.6 17.5 9.6 3.6 0.7 0 0 0
Sheka 40 33.3 6.7 20 0 0 0 0 0 0
Gamo Gofa 53.3 26.7 6.7 6.7 0 0 6.7 0 0 0
Total 45.2 19.7 5.5 17.3 7.9 3.8 0.6 0 0 0
Sex Male 59.2 16.3 2.7 14 4.9 2.3 0.3 0.3 0 0
Female 80.7 5.4 1.6 6.9 3 1 0.8 0 0 0.6
Grand total 60.4 15.7 2.6 13.6 4.8 2.3 0.3 0.3 0 0.1

14
Other economic activities Crop production is major economic activity of the rice producing community. It
was the first major economic activity for 96 % of the rice producers. Crop
production is the first major economic activity for 98 and 48 % of male and
female rice producers, respectively. About 47.4 % of female rice producers
have reported household chores being their first main activity. In general,
rearing, commerce and labor was also reported as the first major economic
activity by 0.5, 0.2, and 0.2 % of the rice producing community. The
distribution of rice producers by economic activity was different across regions.
Crop production was reported as the first major economic activity by 88, 95,
99, 87, 100, and 99 % of Tigray, Amhara, Oromia, Somali, Benishangul
Gumuz, and SNNPR rice producers, respectively. Livestock rearing was also
reported as the first major economic activity for 0.6, 0.1, and 3.5 % of Amhara,
Oromia, and Somali rice producers. For other activities like Commerce,
Handicraft, Casual labor 1% reported as major economic activity (Table 9).
Table 9. Distribution of rice producers by main economic activity (2010)
Region Zone/ sex % of rice producers Crop Rearing Forestry House chores Others
Tigray Western Tigray 88 0 0 5.3 6.6 Total 88 0 0 5.3 6.6
Amhara South Gonder 95 0.6 0.1 3.6 0.8 North Gonder 96 1.5 0 3 0 West Gojam 100 0 0 0 0 Total 95 0.6 0.1 3.5 0.8
Oromia Jimma 100 0 0 0 0 Illu Ababora 99 0.1 0 0 0.8 Total 99 0.1 0 0 0.7
Somali Gode 87 3.5 0 0.9 8.3 Total 87 3.5 0 0.9 8.3
Benishangul Gumuz
Metekel 100 0 0 0 0 Assosa 100 0 0 0 0 Total 100 0 0 0 0
SNNPR Kaffa 100 0 0 0 0 Bench Maji 98 0 0 0 2.2 Sheka 100 0 0 0 0 Gamo Gofa 100 0 0 0 0 Total 99 0 0 0 1.4
Sex Male 98 0.5 0 0.2 0.8 Female 48 0.2 0 47.4 4.5
Total 96 0.5 0 2.8 1.1

15
Economic Characteristics Major crops The five most important crops grown by rice producers in 2010 were rice,
sorghum, maize, tef, and millet as 85.8, 5.1, 4.6, 1.2, and 1 % of the producers
respectively. About 95, 54, 80.1, and 79 % of the rice producers from Amhara,
Oromia, Benishangul Gumuz, and SNNPR Regions’ were producing rice as
major crop, respectively. This confirms that rice is a major crop for these rice-
producing areas in respective region.
Table 10. First most important crops for rice producing areas (2006-2010)
Crops % of rice producers Total
Tigray Amhara Oromia Somali Benishangul Gumuz SNNPR
Rice 22.6 95 54 23.4 80.1 79 85.8
Sorghum 49.7 0.7 22.5 2.8 9.9 3.2 5.1
Maize 1.2 1.3 15 49.9 6.8 14.5 4.6
Tef 22.4 1 0 1 1.6 0.1 1.2
Millet 0 1.4 0 0 0 0 1
Chick pea 0 0.2 2.6 0 0 0 0.6
Sesame 3.5 0.2 0.8 8.4 0 0.3 0.5
Peanut 0 0 1.3 0 0 1.6 0.3
Coffee 0 0 0 0 0 1.1 0.1
Wheat 0 0.1 0 0 0 0 0.1
Tomato 0.6 0.1 0 0 0 0 0.1
Onion 0 0 0 11.6 0 0 0.1
Other 0 0.1 3.8 2.8 1.6 0.3 0.6
For Tigray and Somali Regions rice producers, sorghum and maize are the
major crops, which accounts for 49.7 and 49.9 % of producers, respectively.
Rice was the second major crop for both Tigray and Somali Regions rice
producers with 22.6 and 23.4 % of the rice producers producing it as a major
crop. In Tigray region, the proportion of rice producers producing tef and rice
as a major crop was somehow balanced (Table 10).
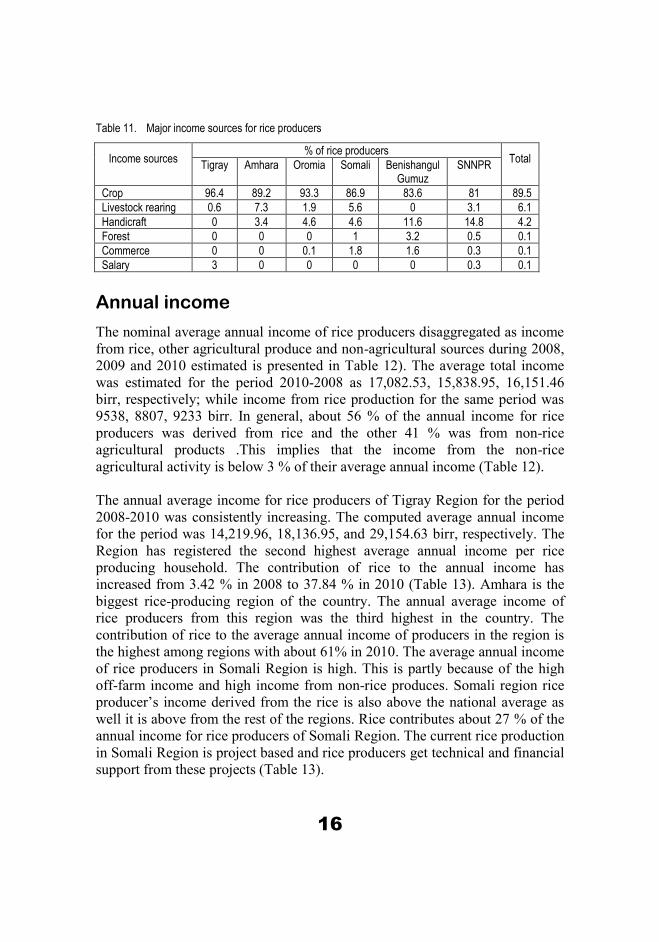
Major income sources In general, crop production is reported to be the first income source of rice
producers followed by livestock rearing. About 90% of rice producers reported
crop to be their major income source and only about 6% of reported livestock
as their main income source. The data in Table 11 indicates the distribution
along with the regional difference in income source for rice producers.
16
Table 11. Major income sources for rice producers
Income sources % of rice producers
Total Tigray Amhara Oromia Somali Benishangul
Gumuz SNNPR
Crop 96.4 89.2 93.3 86.9 83.6 81 89.5
Livestock rearing 0.6 7.3 1.9 5.6 0 3.1 6.1
Handicraft 0 3.4 4.6 4.6 11.6 14.8 4.2
Forest 0 0 0 1 3.2 0.5 0.1
Commerce 0 0 0.1 1.8 1.6 0.3 0.1
Salary 3 0 0 0 0 0.3 0.1
Annual income
The nominal average annual income of rice producers disaggregated as income
from rice, other agricultural produce and non-agricultural sources during 2008,
2009 and 2010 estimated is presented in Table 12). The average total income
was estimated for the period 2010-2008 as 17,082.53, 15,838.95, 16,151.46
birr, respectively; while income from rice production for the same period was
9538, 8807, 9233 birr. In general, about 56 % of the annual income for rice
producers was derived from rice and the other 41 % was from non-rice
agricultural products .This implies that the income from the non-rice
agricultural activity is below 3 % of their average annual income (Table 12).
The annual average income for rice producers of Tigray Region for the period
2008-2010 was consistently increasing. The computed average annual income
for the period was 14,219.96, 18,136.95, and 29,154.63 birr, respectively. The
Region has registered the second highest average annual income per rice
producing household. The contribution of rice to the annual income has
increased from 3.42 % in 2008 to 37.84 % in 2010 (Table 13). Amhara is the
biggest rice-producing region of the country. The annual average income of
rice producers from this region was the third highest in the country. The
contribution of rice to the average annual income of producers in the region is
the highest among regions with about 61% in 2010. The average annual income
of rice producers in Somali Region is high. This is partly because of the high
off-farm income and high income from non-rice produces. Somali region rice
producer’s income derived from the rice is also above the national average as
well it is above from the rest of the regions. Rice contributes about 27 % of the
annual income for rice producers of Somali Region. The current rice production
in Somali Region is project based and rice producers get technical and financial
support from these projects (Table 13).

17
Table 12. Rice producer's average nominal annual income by source (Birr)
Region Agricultural income Nonagricultural income Total income
2010 2009 2008 Year Year
Rice Other produce
Rice Other produce
Rice Other produce
2010 2009 2008 2010 2009 2008
Tigray 11,033 15,815 1,880 14,204 461 12,306 2,307.08 2,052.83 1,452.35 29,154.63 18,136.95 14,219.96
Amhara 11,218 6,993 10,595 6,516 11,224 6,688 166.23 167.20 149.15 18,377.13 17,278.54 18,061.46
Oromia 2,419 5,853 1,732 5,487 2,092 4,516 579.99 427.53 378.05 8,852.55 7,645.89 6,986.41
Somali 13,966 22,475 16,767 21,152 15,262 21,533 20,668.98 21,136.16 18,834.94 57,109.78 59,055.29 55,630.61
Benishangul Gumuz 2,110 8,984 2,263 6,996 2,332 8,473 1,539.88 1,529.90 1,228.64 12,633.87 10,788.86 12,034.40
SNNPR 5,042 4,931 4,932 4,663 3,649 4,346 204.21 201.92 181.02 10,176.48 9,796.21 8,176.07
Total 9,538 7,056 8,807 6,566 9,233 6,511 488.57 465.95 406.79 17,082.53 15,838.95 16,151.46
18
Table 13. Contribution of rice, other agricultural produces, and off-farm sources to the income of rice producers
Region Agricultural income Nonagricultural income
2010 2009 2008 Year
Rice Other produce
Rice Other produce
Rice other produce
2010 2009 2008
Tigray 37.84 54.25 10.37 78.32 3.24 86.54 7.91 11.32 10.21
Amhara 61.04 38.05 61.32 37.71 62.14 37.03 0.90 0.97 0.83
Oromia 27.33 66.12 22.65 71.76 29.94 64.64 6.55 5.59 5.41
Somali 24.45 39.35 28.39 35.82 27.43 38.71 36.19 35.79 33.86
Benishangul Gumuz 16.70 71.11 20.98 64.84 19.38 70.41 12.19 14.18 10.21
SNNPR 49.55 48.45 50.35 47.60 44.63 53.16 2.01 2.06 2.21
Total 55.83 41.31 55.60 41.45 57.17 40.31 2.86 2.94 2.52
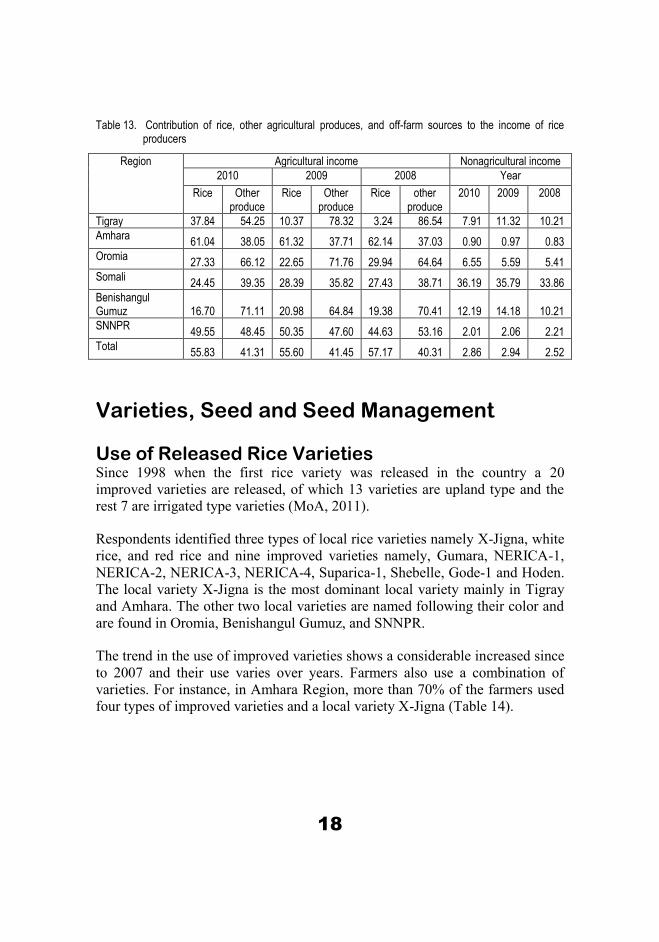
Varieties, Seed and Seed Management
Use of Released Rice Varieties Since 1998 when the first rice variety was released in the country a 20
improved varieties are released, of which 13 varieties are upland type and the
rest 7 are irrigated type varieties (MoA, 2011).
Respondents identified three types of local rice varieties namely X-Jigna, white
rice, and red rice and nine improved varieties namely, Gumara, NERICA-1,
NERICA-2, NERICA-3, NERICA-4, Suparica-1, Shebelle, Gode-1 and Hoden.
The local variety X-Jigna is the most dominant local variety mainly in Tigray
and Amhara. The other two local varieties are named following their color and
are found in Oromia, Benishangul Gumuz, and SNNPR.
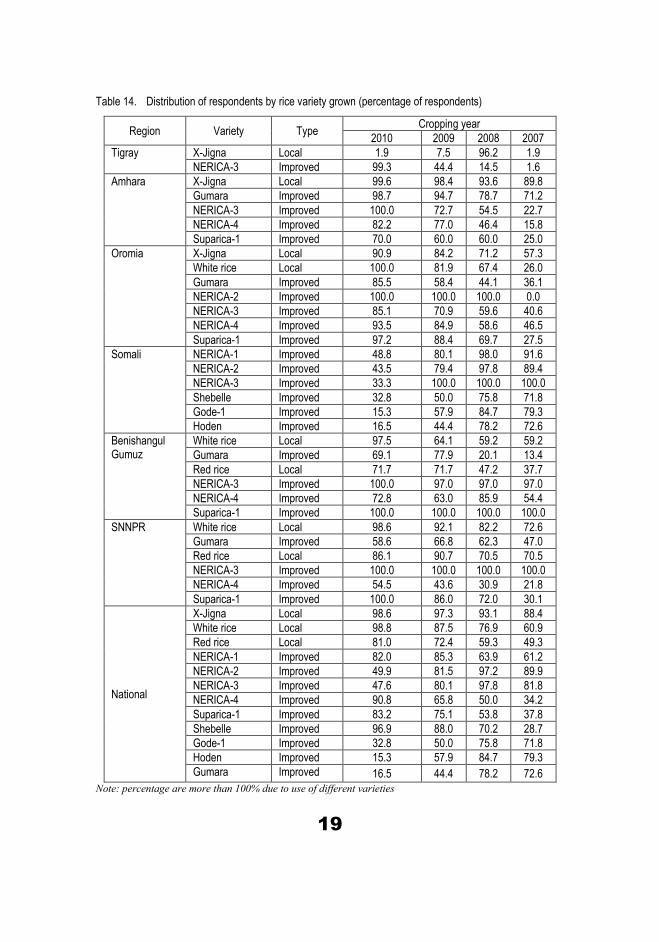
The trend in the use of improved varieties shows a considerable increased since
to 2007 and their use varies over years. Farmers also use a combination of
varieties. For instance, in Amhara Region, more than 70% of the farmers used
four types of improved varieties and a local variety X-Jigna (Table 14).
19
Table 14. Distribution of respondents by rice variety grown (percentage of respondents)
Region Variety Type Cropping year
2010 2009 2008 2007
Tigray X-Jigna Local 1.9 7.5 96.2 1.9
NERICA-3 Improved 99.3 44.4 14.5 1.6
Amhara X-Jigna Local 99.6 98.4 93.6 89.8
Gumara Improved 98.7 94.7 78.7 71.2
NERICA-3 Improved 100.0 72.7 54.5 22.7
NERICA-4 Improved 82.2 77.0 46.4 15.8
Suparica-1 Improved 70.0 60.0 60.0 25.0
Oromia X-Jigna Local 90.9 84.2 71.2 57.3
White rice Local 100.0 81.9 67.4 26.0
Gumara Improved 85.5 58.4 44.1 36.1
NERICA-2 Improved 100.0 100.0 100.0 0.0
NERICA-3 Improved 85.1 70.9 59.6 40.6
NERICA-4 Improved 93.5 84.9 58.6 46.5
Suparica-1 Improved 97.2 88.4 69.7 27.5
Somali NERICA-1 Improved 48.8 80.1 98.0 91.6
NERICA-2 Improved 43.5 79.4 97.8 89.4
NERICA-3 Improved 33.3 100.0 100.0 100.0
Shebelle Improved 32.8 50.0 75.8 71.8
Gode-1 Improved 15.3 57.9 84.7 79.3
Hoden Improved 16.5 44.4 78.2 72.6
Benishangul Gumuz
White rice Local 97.5 64.1 59.2 59.2
Gumara Improved 69.1 77.9 20.1 13.4
Red rice Local 71.7 71.7 47.2 37.7
NERICA-3 Improved 100.0 97.0 97.0 97.0
NERICA-4 Improved 72.8 63.0 85.9 54.4
Suparica-1 Improved 100.0 100.0 100.0 100.0
SNNPR White rice Local 98.6 92.1 82.2 72.6
Gumara Improved 58.6 66.8 62.3 47.0
Red rice Local 86.1 90.7 70.5 70.5
NERICA-3 Improved 100.0 100.0 100.0 100.0
NERICA-4 Improved 54.5 43.6 30.9 21.8
Suparica-1 Improved 100.0 86.0 72.0 30.1
National
X-Jigna Local 98.6 97.3 93.1 88.4
White rice Local 98.8 87.5 76.9 60.9
Red rice Local 81.0 72.4 59.3 49.3
NERICA-1 Improved 82.0 85.3 63.9 61.2
NERICA-2 Improved 49.9 81.5 97.2 89.9
NERICA-3 Improved 47.6 80.1 97.8 81.8
NERICA-4 Improved 90.8 65.8 50.0 34.2
Suparica-1 Improved 83.2 75.1 53.8 37.8
Shebelle Improved 96.9 88.0 70.2 28.7
Gode-1 Improved 32.8 50.0 75.8 71.8
Hoden Improved 15.3 57.9 84.7 79.3
Gumara Improved 16.5 44.4 78.2 72.6
Note: percentage are more than 100% due to use of different varieties
20
Table 15. Distribution of respondents by seed source by variety and region in 2010 (percentage of rice producers)
Region Variety Farmer or relative from the village
farmer or relative from other kebele NARS Development
project BoA NGO Farmers organization
Local market
Other facility
Tigray NERICA-3 48.5 51.5 Amhara X-Jigna 97.0 1.3 0.1 0.1 1.5
Gumara 98.2 1.8 Superica 1 93.8 6.3 NERICA-4 90.3 5.0 1.2 1.2 2.3 NERICA-3 84.2 10.5 5.3
Oromia X-Jigna 93.0 7.0 White rice 87.5 9.7 2.8 Gumara 74.7 19.8 1.8 1.7 1.9 Superica 1 92.7 7.0 0.3 NERICA-4 96.4 3.6 NERICA-2 100.0 NERICA-3 96.0 1.0 3.0
Somali NERICA-2 4.8 95.2 NERICA-3
100.0 NERICA-1 4.5 1.4 94.0 Shebelle
100.0 Gode-1
100.0 Hoden
100.0 Benishangul Gumuz
White rice 78.9 15.0 3.1 3.1 Gumara 75.6 8.1 8.1 8.1 Red rice 91.9 8.1 Superica 1 100.0 NERICA-4 100.0 NERICA-3 72.2 24.1 3.8
SNNPR White rice 93.0 3.7 0.4 0.4 0.4 1.1 Gumara 89.4 7.7 Red rice 100.0 Superica 1 100.0 NERICA-4 72.6 3.4 20.6 3.4
Total 93.3 2.4 1.9 0.0 1.0 0.0 0.0 1.2
21
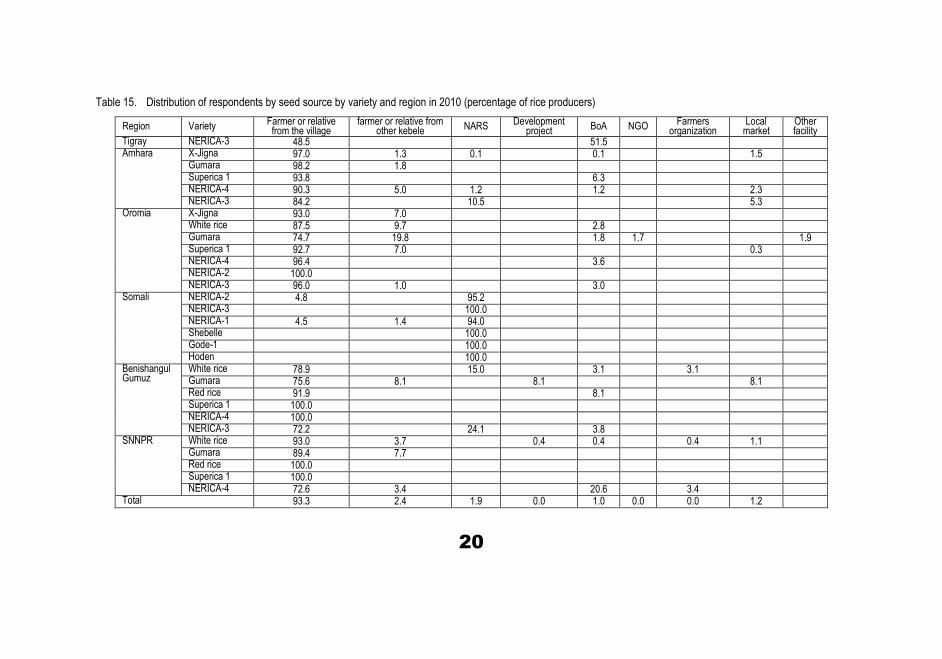
Sources of rice seed Table 15 presents the distribution of rice producers by source of seed for the
different varieties of rice. Accordingly, the dominant sources of seed are
farmers and relatives within a village followed by the national research systems
-NARS (Table 15).
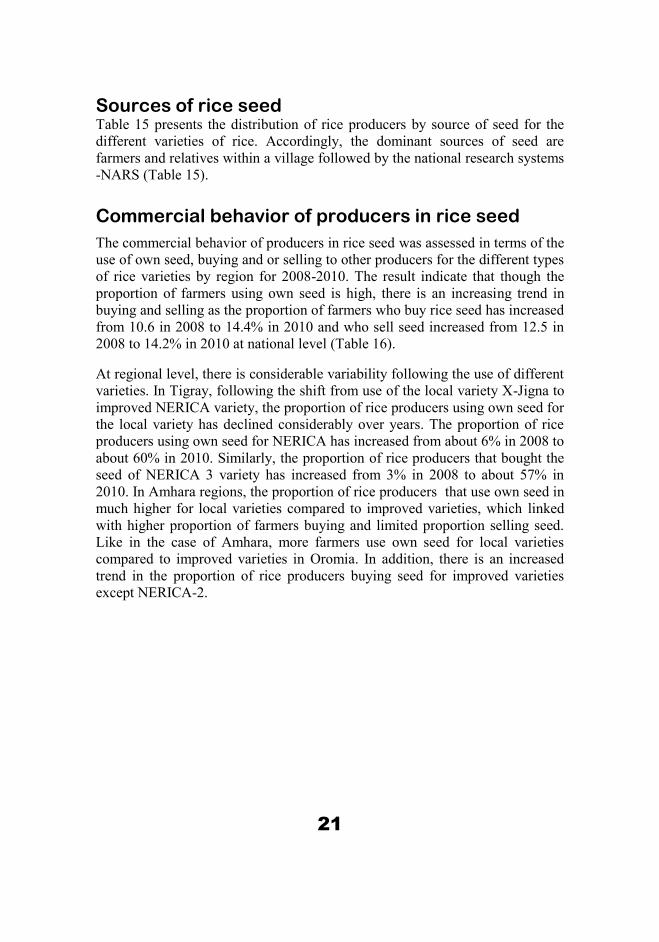
Commercial behavior of producers in rice seed
The commercial behavior of producers in rice seed was assessed in terms of the
use of own seed, buying and or selling to other producers for the different types
of rice varieties by region for 2008-2010. The result indicate that though the
proportion of farmers using own seed is high, there is an increasing trend in
buying and selling as the proportion of farmers who buy rice seed has increased
from 10.6 in 2008 to 14.4% in 2010 and who sell seed increased from 12.5 in
2008 to 14.2% in 2010 at national level (Table 16).
At regional level, there is considerable variability following the use of different
varieties. In Tigray, following the shift from use of the local variety X-Jigna to
improved NERICA variety, the proportion of rice producers using own seed for
the local variety has declined considerably over years. The proportion of rice
producers using own seed for NERICA has increased from about 6% in 2008 to
about 60% in 2010. Similarly, the proportion of rice producers that bought the
seed of NERICA 3 variety has increased from 3% in 2008 to about 57% in
2010. In Amhara regions, the proportion of rice producers that use own seed in
much higher for local varieties compared to improved varieties, which linked
with higher proportion of farmers buying and limited proportion selling seed.
Like in the case of Amhara, more farmers use own seed for local varieties
compared to improved varieties in Oromia. In addition, there is an increased
trend in the proportion of rice producers buying seed for improved varieties
except NERICA-2.
22
Table 16 Commercial behavior of producers in rice seed by variety 2008 - 2010 (%age)
Region Variety Own seed Buy Sell
2010 2009 2008 2010 2009 2008 2010 2009 2008
Tigray X-Jigna 1.9 7.5 45.3 0.0 0.0 7.5 0.0 0.0 0.0
NERICA-3 59.0 16.8 6.0 56.7 18.5 3.0 1.4 0.0 0.0
Amhara
X-Jigna 93.9 93.5 88.7 12.2 10.1 7.7 11.5 10.7 10.3
Gumara 91.6 74.8 73.6 30.0 26.3 19.0 7.8 6.6 3.8
Superica 1 62.5 37.5 20.8 29.2 12.5 25.0 0.0 0.0 0.0
NERICA-4 68.1 62.3 31.1 19.5 21.4 17.4 1.0 1.0 0.0
NERICA-3 50.0 50.0 22.7 45.5 31.8 22.7 9.1 9.1 4.5
Oromia
X-Jigna 84.1 73.0 53.3 9.6 8.0 17.0 9.5 11.0 14.1
White rice 71.7 49.1 20.7 17.5 15.6 26.8 12.4 9.0 9.0
Gumara 50.9 43.2 36.1 28.3 11.7 10.2 16.3 18.9 14.7
Superica 1 84.6 70.4 44.1 17.2 14.0 23.1 30.4 25.4 18.5
NERICA-4 51.6 43.9 25.0 13.3 7.7 10.5 15.3 7.7 10.3
NERICA-2 50.0 50.0 0.0 0.0 50.0 50.0 50.0 100.0 50.0
NERICA-3 66.6 56.6 38.9 17.7 11.0 18.4 21.6 16.2 13.4
Somali
NERICA-2 49.5 73.0 85.7 3.3 2.2 7.8 43.4 76.2 84.3
NERICA-1 54.5 75.1 82.4 4.2 4.5 6.6 47.0 78.4 85.9
Shebelle 40.6 62.2 79.7 0.0 4.0 4.0 32.3 70.5 67.1
Gode-1 28.5 52.8 88.5 0.0 0.0 6.0 17.0 58.3 82.1
Hoden 28.8 64.4 88.4 0.0 6.4 0.0 18.2 56.8 68.6
Benishangul Gumuz
White rice 70.4 37.4 32.9 35.8 14.2 16.5 32.9 30.7 28.5
Gumara 53.7 30.9 14.4 36.0 45.3 14.4 2.2 7.2 0.0
Red rice 82.3 72.9 61.1 5.9 1.8 0.0 43.4 37.6 49.3
Superica 1 33.3 33.3 33.3 0.0 0.0 0.0 0.0 0.0 0.0
NERICA-4 7.9 25.1 25.1 29.0 3.9 0.0 0.0 0.0 0.0
NERICA-3 75.0 75.0 75.0 0.0 0.0 0.0 25.0 25.0 25.0
SNNPR
White rice 74.5 73.7 68.2 29.0 18.7 17.9 22.9 17.4 15.1
Gumara 45.0 45.4 37.3 6.1 6.9 11.6 3.1 0.7 1.4
Red rice 64.3 70.3 70.3 23.8 0.0 5.9 11.9 11.9 11.9
Superica 1 87.4 74.9 37.2 12.6 12.6 37.7 25.1 25.1 12.6
NERICA-4 17.8 14.4 11.9 15.9 9.2 6.7 0.8 0.8 0.8
Total 85.3 82.2 74.5 14.4 11.1 10.6 14.2 13.5 12.5 Note: percentages do not add to 100 due to multiple responses.
Trends in rice seed price The trend in rice seed price indicates that there is considerable variability
across regions and over years. In national average price indicates that the price
was higher in 2009 compared to 2008 and 2010 for the seed bought locally
within and outside of the Kebele (Table 17).

23
Table 17. Seed price (birr per kg) in and out of the kebele by region
Region Inside the kebele outside the kebele
2010 2009 2008 2010 2009 2008
Tigray 6.92 6.99 6.41 7.07 6.98 6.91
Amhara 4.91 5.36 5.17 4.89 5.27 4.87
Oromia 3.22 3.09 2.90 3.33 3.06 2.72
Somali 15.95 12.36 10.36 16.32 12.81 10.68
Benishangul Gumuz 4.76 4.65 3.99 4.05 3.98 3.29
SNNPR 3.97 3.78 3.39 3.96 3.45 2.96
Total 4.80 5.14 4.96 4.95 5.16 4.73
The price for the different rice varieties was different. There is no clear
indication of price difference among local and improved varieties. Among the
improved varieties, NERICA-1, NERICA-2, Shebelle, Gode-1, and Hoden
recorded the highest prices with increasing trend from 2008 to 2010 (Table 18).
Table 18. Seed price (birr/kg) in and out of the kebele by variety
Variety Inside the kebele Outside the kebele
2010 2009 2008 2010 2009 2008
X-Jigna 4.86 5.30 5.12 4.83 5.21 4.81
White rice 3.99 3.80 3.52 3.78 3.52 3.11
Gumara 3.94 4.02 3.54 4.07 4.21 3.70
Red rice 4.33 3.88 2.17 4.70 3.84 2.89
Superica 1 3.35 3.33 3.22 3.49 3.29 3.01
NERICA-4 4.17 4.71 4.27 4.19 4.46 3.92
NERICA-2 14.23 12.01 10.23 15.28 11.73 10.47
NERICA-3 4.76 4.09 3.63 4.62 3.79 2.97
NERICA-1 15.91 12.09 10.30 16.21 12.68 10.44
Shebelle 16.25 12.66 10.23 16.26 16.34 11.38
Gode-1 16.73 13.92 11.35 16.62 13.92 11.39
Hoden 16.93 13.60 10.75 16.91 13.60 11.43
Total 4.80 5.14 4.96 4.95 5.16 4.73
24
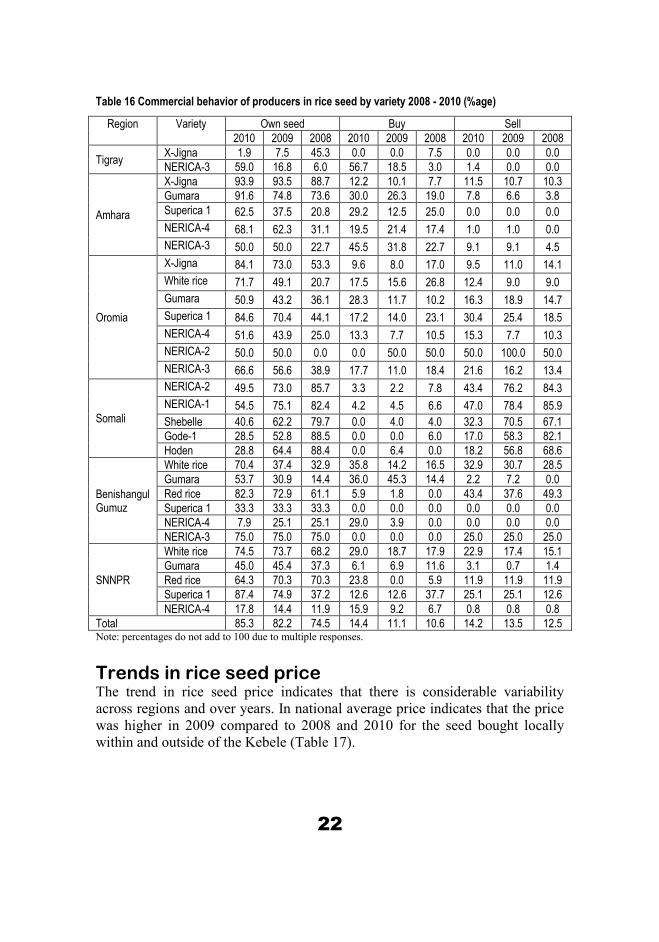
Variety and seed selection Seed selection criteria The most important criteria for seed selection are found to be panicle
appearance, grain color and shape and crop stand. However, the priority
criterion for seed selection is panicle appearance as reported by 71.3% of rice
producing households, with considerable variability among regions (Table 19).
Table 19. Priority criterion for seed selection
Criteria Region
Total Tigray Amhara Oromia Somali Benishangul Gumuz
SNNPR
Panicle appearance 100.0 74.2 53.2 89.4 68.4 66.2 71.3
Grain color 0.0 12.9 27.7 7.8 23.9 23.6 15.3
Grain shape 0.0 5.6 7.2 0.0 3.9 3.0 5.6
Crop stand 0.0 7.0 2.7 2.9 1.9 3.4 6.1
Other 0.0 0.2 9.2 0.0 1.9 3.9 1.7
Cropping stage for seed selection
Majority of the rice-producing households select seeds from the preferred
variety during harvesting stage (78.5%) followed by selection at heading stage
of the rice crop (Table 20).
Table 20. Priority cropping stage for seed selection
Stage Region Total
Tigray Amhara Oromia Somali Benishangul Gumuz
SNNPR
Harvest 81.6 83.9 51.9 63.4 80.3 73.5 78.5
Heading 18.4 5.4 21.6 21.0 14.0 14.7 8.6
Level of mixture of paddies and select at onset cropping season
0.0 10.0 18.8 15.7 1.9 7.8 11.0
other 0.0 0.7 7.7 0.0 3.8 3.9 1.9
Rice seed management The overall rice seed management practices are looked in terms of whether
producers handling paddy fields differently when for seed, cropping stage for
seed selection, seed drying and storage practices.
25
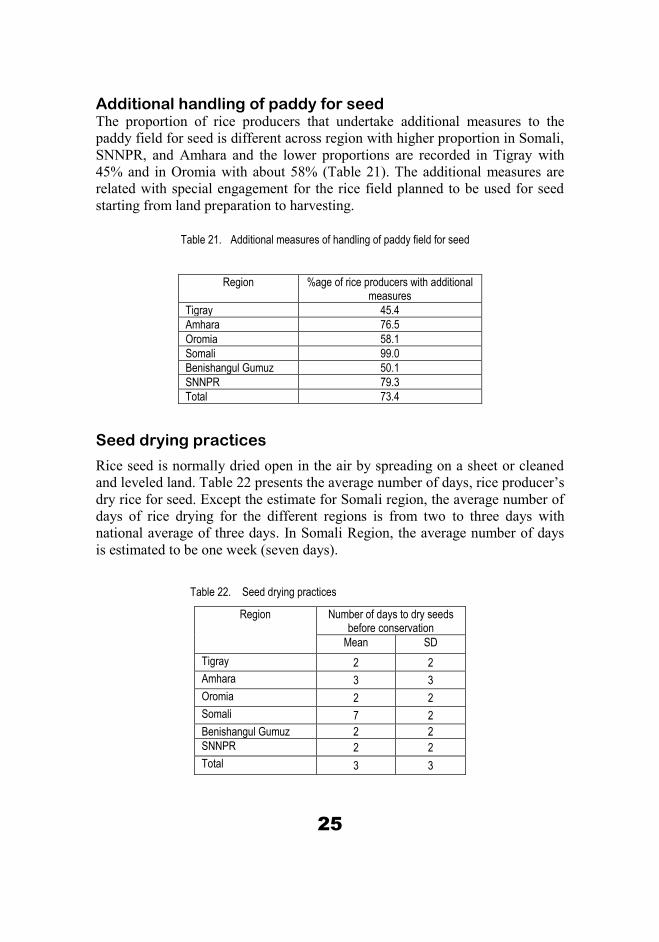
Additional handling of paddy for seed The proportion of rice producers that undertake additional measures to the
paddy field for seed is different across region with higher proportion in Somali,
SNNPR, and Amhara and the lower proportions are recorded in Tigray with
45% and in Oromia with about 58% (Table 21). The additional measures are
related with special engagement for the rice field planned to be used for seed
starting from land preparation to harvesting.
Table 21. Additional measures of handling of paddy field for seed
Region %age of rice producers with additional measures
Tigray 45.4
Amhara 76.5
Oromia 58.1
Somali 99.0
Benishangul Gumuz 50.1
SNNPR 79.3
Total 73.4
Seed drying practices
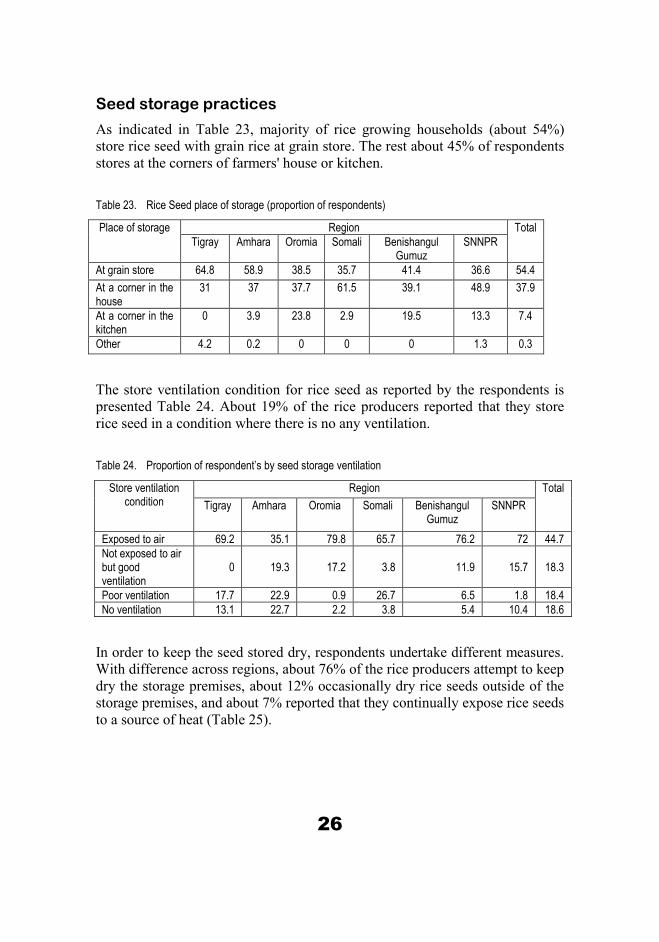
Rice seed is normally dried open in the air by spreading on a sheet or cleaned
and leveled land. Table 22 presents the average number of days, rice producer’s
dry rice for seed. Except the estimate for Somali region, the average number of
days of rice drying for the different regions is from two to three days with
national average of three days. In Somali Region, the average number of days
is estimated to be one week (seven days).
Table 22. Seed drying practices
Region Number of days to dry seeds before conservation
Mean SD
Tigray 2 2
Amhara 3 3
Oromia 2 2
Somali 7 2
Benishangul Gumuz 2 2
SNNPR 2 2
Total 3 3
26
Seed storage practices
As indicated in Table 23, majority of rice growing households (about 54%)
store rice seed with grain rice at grain store. The rest about 45% of respondents
stores at the corners of farmers' house or kitchen.
Table 23. Rice Seed place of storage (proportion of respondents)
Place of storage Region Total
Tigray Amhara Oromia Somali Benishangul Gumuz
SNNPR
At grain store 64.8 58.9 38.5 35.7 41.4 36.6 54.4
At a corner in the house
31 37 37.7 61.5 39.1 48.9 37.9
At a corner in the kitchen
0 3.9 23.8 2.9 19.5 13.3 7.4
Other 4.2 0.2 0 0 0 1.3 0.3
The store ventilation condition for rice seed as reported by the respondents is
presented Table 24. About 19% of the rice producers reported that they store
rice seed in a condition where there is no any ventilation.
Table 24. Proportion of respondent’s by seed storage ventilation
Store ventilation condition
Region Total
Tigray Amhara Oromia Somali Benishangul Gumuz
SNNPR
Exposed to air 69.2 35.1 79.8 65.7 76.2 72 44.7
Not exposed to air but good ventilation
0 19.3 17.2 3.8 11.9 15.7 18.3
Poor ventilation 17.7 22.9 0.9 26.7 6.5 1.8 18.4
No ventilation 13.1 22.7 2.2 3.8 5.4 10.4 18.6
In order to keep the seed stored dry, respondents undertake different measures.
With difference across regions, about 76% of the rice producers attempt to keep
dry the storage premises, about 12% occasionally dry rice seeds outside of the
storage premises, and about 7% reported that they continually expose rice seeds
to a source of heat (Table 25).

27
Table 25. Measures to keep seed dry (% of respondents)
Measures
Region
Total Tigray Amhara Oromia Somali Benishangul Gumuz
SNNPR
Always taking measures to keep storage premises dry
85.9 76 74.7 100 63.1 72.3 75.9
Occasionally drying rice seeds
4.4 12.9 6.7 0 4.9 10.6 11.5
Continually exposing rice seeds to a source of heat
0 8.9 0.5 0 0 3.5 7.1
Others 9.8 2.2 18.1 0 32.1 13.6 5.4
With considerable differences across regions, the main measures reported to be
undertaken to prevent the attack of insects at rice seed are related with chemical
application (63% of respondents) and prevention of insects from intrusion to
the storage premises (11% of respondents). Interestingly, about 16% of
respondents reported that they do not take any measure as they belief that rice
seed cannot be attached by insects (Table 26).
Table 26. Measures to prevent insect attacks to rice seed (% of respondents)
Measures Region Total
Tigray Amhara Oromia Somali Benishangul Gumuz
SNNPR
Application of chemicals 69.6 64.6 56.7 99 57.5 40.2 62.5
Prevention of insects from intrusions
2.8 13.1 3.4 1 10.3 7.8 11.1
No measure because of belief that insects do not cause damage to the quality of seed
8.8 19.1 5.9 0 4.9 6.2 16.0
Others 18.9 3.2 33.9 0 27.3 45.7 10.4
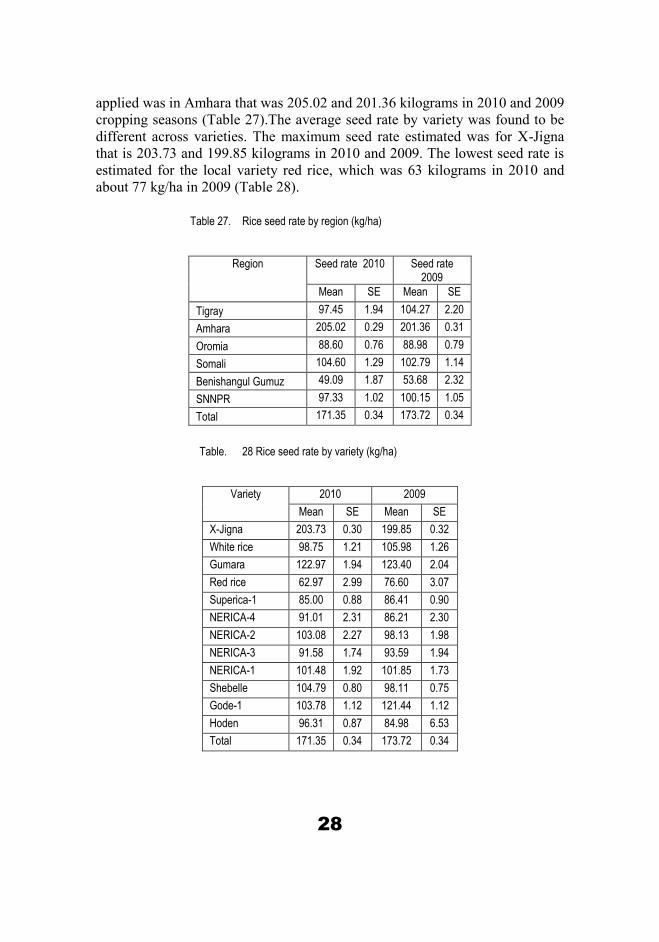
Agronomy Seed rate The average seed rate per hectare at national level was 171.35 and 173.25
kilograms in 2010 and 2009, respectively. The maximum region-wise seed rate
28
applied was in Amhara that was 205.02 and 201.36 kilograms in 2010 and 2009
cropping seasons (Table 27).The average seed rate by variety was found to be
different across varieties. The maximum seed rate estimated was for X-Jigna
that is 203.73 and 199.85 kilograms in 2010 and 2009. The lowest seed rate is
estimated for the local variety red rice, which was 63 kilograms in 2010 and
about 77 kg/ha in 2009 (Table 28).
Table 27. Rice seed rate by region (kg/ha)
Region Seed rate 2010 Seed rate 2009
Mean SE Mean SE
Tigray 97.45 1.94 104.27 2.20
Amhara 205.02 0.29 201.36 0.31
Oromia 88.60 0.76 88.98 0.79
Somali 104.60 1.29 102.79 1.14
Benishangul Gumuz 49.09 1.87 53.68 2.32
SNNPR 97.33 1.02 100.15 1.05
Total 171.35 0.34 173.72 0.34
Table. 28 Rice seed rate by variety (kg/ha)
Variety 2010 2009
Mean SE Mean SE
X-Jigna 203.73 0.30 199.85 0.32
White rice 98.75 1.21 105.98 1.26
Gumara 122.97 1.94 123.40 2.04
Red rice 62.97 2.99 76.60 3.07
Superica-1 85.00 0.88 86.41 0.90
NERICA-4 91.01 2.31 86.21 2.30
NERICA-2 103.08 2.27 98.13 1.98
NERICA-3 91.58 1.74 93.59 1.94
NERICA-1 101.48 1.92 101.85 1.73
Shebelle 104.79 0.80 98.11 0.75
Gode-1 103.78 1.12 121.44 1.12
Hoden 96.31 0.87 84.98 6.53
Total 171.35 0.34 173.72 0.34
29
Fertilizer application
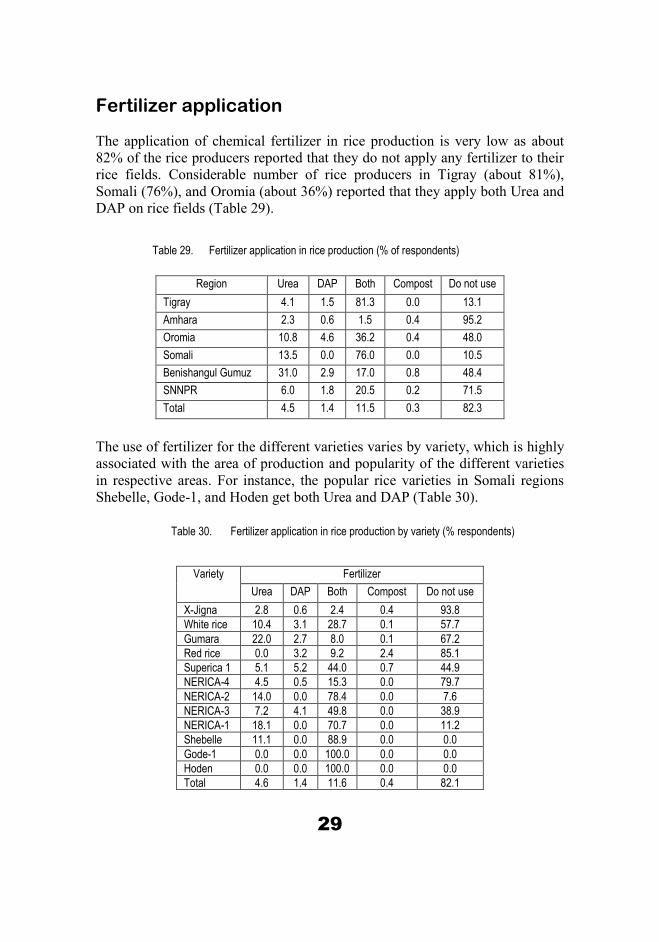
The application of chemical fertilizer in rice production is very low as about
82% of the rice producers reported that they do not apply any fertilizer to their
rice fields. Considerable number of rice producers in Tigray (about 81%),
Somali (76%), and Oromia (about 36%) reported that they apply both Urea and
DAP on rice fields (Table 29).
Table 29. Fertilizer application in rice production (% of respondents)
Region Urea DAP Both Compost Do not use
Tigray 4.1 1.5 81.3 0.0 13.1
Amhara 2.3 0.6 1.5 0.4 95.2
Oromia 10.8 4.6 36.2 0.4 48.0
Somali 13.5 0.0 76.0 0.0 10.5
Benishangul Gumuz 31.0 2.9 17.0 0.8 48.4
SNNPR 6.0 1.8 20.5 0.2 71.5
Total 4.5 1.4 11.5 0.3 82.3
The use of fertilizer for the different varieties varies by variety, which is highly
associated with the area of production and popularity of the different varieties
in respective areas. For instance, the popular rice varieties in Somali regions
Shebelle, Gode-1, and Hoden get both Urea and DAP (Table 30).
Table 30. Fertilizer application in rice production by variety (% respondents)
Variety Fertilizer
Urea DAP Both Compost Do not use
X-Jigna 2.8 0.6 2.4 0.4 93.8
White rice 10.4 3.1 28.7 0.1 57.7
Gumara 22.0 2.7 8.0 0.1 67.2
Red rice 0.0 3.2 9.2 2.4 85.1
Superica 1 5.1 5.2 44.0 0.7 44.9
NERICA-4 4.5 0.5 15.3 0.0 79.7
NERICA-2 14.0 0.0 78.4 0.0 7.6
NERICA-3 7.2 4.1 49.8 0.0 38.9
NERICA-1 18.1 0.0 70.7 0.0 11.2
Shebelle 11.1 0.0 88.9 0.0 0.0
Gode-1 0.0 0.0 100.0 0.0 0.0
Hoden 0.0 0.0 100.0 0.0 0.0
Total 4.6 1.4 11.6 0.4 82.1
30
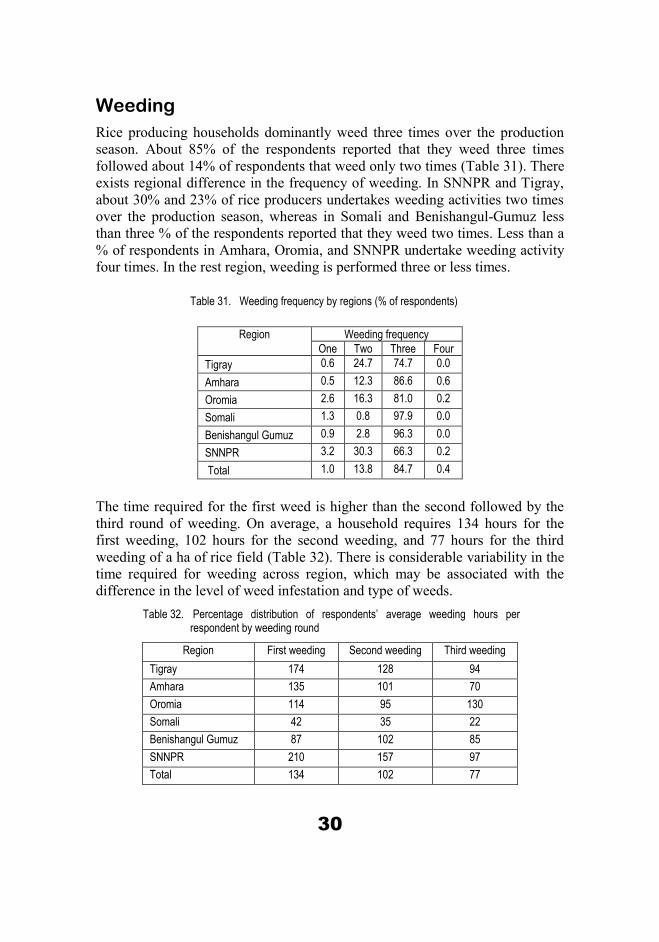
Weeding
Rice producing households dominantly weed three times over the production
season. About 85% of the respondents reported that they weed three times
followed about 14% of respondents that weed only two times (Table 31). There
exists regional difference in the frequency of weeding. In SNNPR and Tigray,
about 30% and 23% of rice producers undertakes weeding activities two times
over the production season, whereas in Somali and Benishangul-Gumuz less
than three % of the respondents reported that they weed two times. Less than a
% of respondents in Amhara, Oromia, and SNNPR undertake weeding activity
four times. In the rest region, weeding is performed three or less times.
Table 31. Weeding frequency by regions (% of respondents)
Region Weeding frequency
One Two Three Four
Tigray 0.6 24.7 74.7 0.0
Amhara 0.5 12.3 86.6 0.6
Oromia 2.6 16.3 81.0 0.2
Somali 1.3 0.8 97.9 0.0
Benishangul Gumuz 0.9 2.8 96.3 0.0
SNNPR 3.2 30.3 66.3 0.2
Total 1.0 13.8 84.7 0.4
The time required for the first weed is higher than the second followed by the
third round of weeding. On average, a household requires 134 hours for the
first weeding, 102 hours for the second weeding, and 77 hours for the third
weeding of a ha of rice field (Table 32). There is considerable variability in the
time required for weeding across region, which may be associated with the
difference in the level of weed infestation and type of weeds.
Table 32. Percentage distribution of respondents’ average weeding hours per respondent by weeding round
Region First weeding Second weeding Third weeding
Tigray 174 128 94
Amhara 135 101 70
Oromia 114 95 130
Somali 42 35 22
Benishangul Gumuz 87 102 85
SNNPR 210 157 97
Total 134 102 77
31
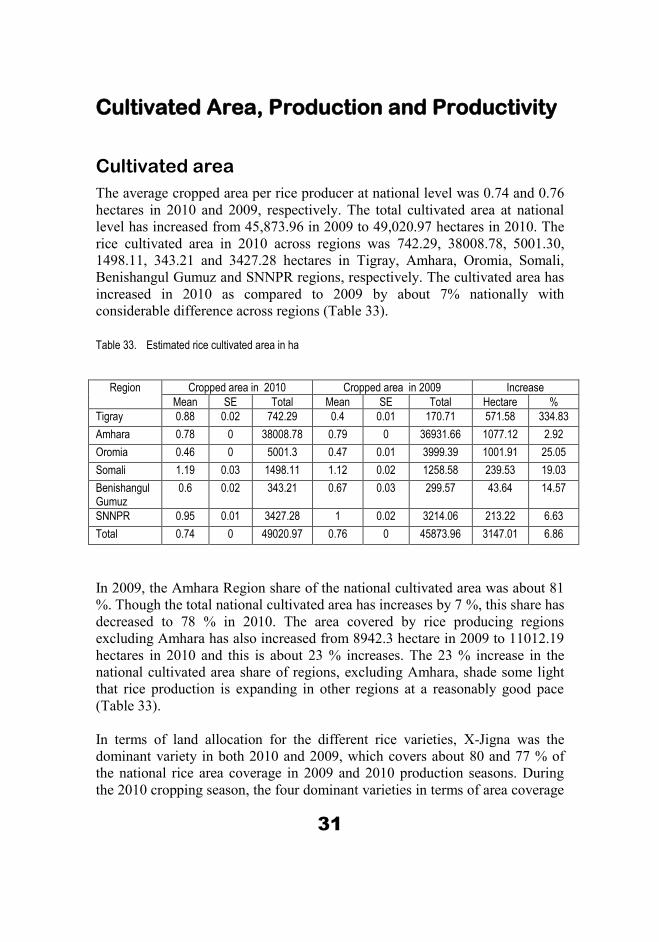
Cultivated Area, Production and Productivity
Cultivated area
The average cropped area per rice producer at national level was 0.74 and 0.76
hectares in 2010 and 2009, respectively. The total cultivated area at national
level has increased from 45,873.96 in 2009 to 49,020.97 hectares in 2010. The
rice cultivated area in 2010 across regions was 742.29, 38008.78, 5001.30,
1498.11, 343.21 and 3427.28 hectares in Tigray, Amhara, Oromia, Somali,
Benishangul Gumuz and SNNPR regions, respectively. The cultivated area has
increased in 2010 as compared to 2009 by about 7% nationally with
considerable difference across regions (Table 33).
Table 33. Estimated rice cultivated area in ha
Region Cropped area in 2010 Cropped area in 2009 Increase
Mean SE Total Mean SE Total Hectare %
Tigray 0.88 0.02 742.29 0.4 0.01 170.71 571.58 334.83
Amhara 0.78 0 38008.78 0.79 0 36931.66 1077.12 2.92
Oromia 0.46 0 5001.3 0.47 0.01 3999.39 1001.91 25.05
Somali 1.19 0.03 1498.11 1.12 0.02 1258.58 239.53 19.03
Benishangul Gumuz
0.6 0.02 343.21 0.67 0.03 299.57 43.64 14.57
SNNPR 0.95 0.01 3427.28 1 0.02 3214.06 213.22 6.63
Total 0.74 0 49020.97 0.76 0 45873.96 3147.01 6.86
In 2009, the Amhara Region share of the national cultivated area was about 81
%. Though the total national cultivated area has increases by 7 %, this share has
decreased to 78 % in 2010. The area covered by rice producing regions
excluding Amhara has also increased from 8942.3 hectare in 2009 to 11012.19
hectares in 2010 and this is about 23 % increases. The 23 % increase in the
national cultivated area share of regions, excluding Amhara, shade some light
that rice production is expanding in other regions at a reasonably good pace
(Table 33).
In terms of land allocation for the different rice varieties, X-Jigna was the
dominant variety in both 2010 and 2009, which covers about 80 and 77 % of
the national rice area coverage in 2009 and 2010 production seasons. During
the 2010 cropping season, the four dominant varieties in terms of area coverage
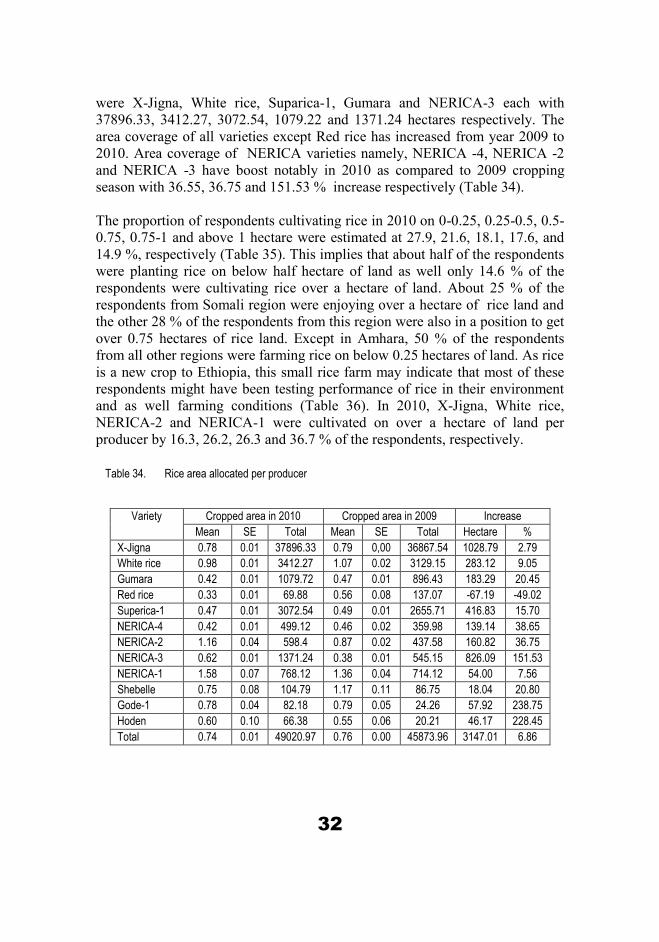
32
were X-Jigna, White rice, Suparica-1, Gumara and NERICA-3 each with
37896.33, 3412.27, 3072.54, 1079.22 and 1371.24 hectares respectively. The
area coverage of all varieties except Red rice has increased from year 2009 to
2010. Area coverage of NERICA varieties namely, NERICA -4, NERICA -2
and NERICA -3 have boost notably in 2010 as compared to 2009 cropping
season with 36.55, 36.75 and 151.53 % increase respectively (Table 34).
The proportion of respondents cultivating rice in 2010 on 0-0.25, 0.25-0.5, 0.5-
0.75, 0.75-1 and above 1 hectare were estimated at 27.9, 21.6, 18.1, 17.6, and
14.9 %, respectively (Table 35). This implies that about half of the respondents
were planting rice on below half hectare of land as well only 14.6 % of the
respondents were cultivating rice over a hectare of land. About 25 % of the
respondents from Somali region were enjoying over a hectare of rice land and
the other 28 % of the respondents from this region were also in a position to get
over 0.75 hectares of rice land. Except in Amhara, 50 % of the respondents
from all other regions were farming rice on below 0.25 hectares of land. As rice
is a new crop to Ethiopia, this small rice farm may indicate that most of these
respondents might have been testing performance of rice in their environment
and as well farming conditions (Table 36). In 2010, X-Jigna, White rice,
NERICA-2 and NERICA-1 were cultivated on over a hectare of land per
producer by 16.3, 26.2, 26.3 and 36.7 % of the respondents, respectively.
Table 34. Rice area allocated per producer
Variety Cropped area in 2010 Cropped area in 2009 Increase
Mean SE Total Mean SE Total Hectare %
X-Jigna 0.78 0.01 37896.33 0.79 0,00 36867.54 1028.79 2.79
White rice 0.98 0.01 3412.27 1.07 0.02 3129.15 283.12 9.05
Gumara 0.42 0.01 1079.72 0.47 0.01 896.43 183.29 20.45
Red rice 0.33 0.01 69.88 0.56 0.08 137.07 -67.19 -49.02
Superica-1 0.47 0.01 3072.54 0.49 0.01 2655.71 416.83 15.70
NERICA-4 0.42 0.01 499.12 0.46 0.02 359.98 139.14 38.65
NERICA-2 1.16 0.04 598.4 0.87 0.02 437.58 160.82 36.75
NERICA-3 0.62 0.01 1371.24 0.38 0.01 545.15 826.09 151.53
NERICA-1 1.58 0.07 768.12 1.36 0.04 714.12 54.00 7.56
Shebelle 0.75 0.08 104.79 1.17 0.11 86.75 18.04 20.80
Gode-1 0.78 0.04 82.18 0.79 0.05 24.26 57.92 238.75
Hoden 0.60 0.10 66.38 0.55 0.06 20.21 46.17 228.45
Total 0.74 0.01 49020.97 0.76 0.00 45873.96 3147.01 6.86

33
Table 35. Proportion of respondents by size of rice area cultivated in ha
Region Cropped area in 2010 Cropped area in 2009
0.25 > 0.25 and 0.5 >0.5 and 0.75 >0.75 and 1 > 1 0.25 > 0.25 and 0.5 >0.5 and 0.75 >0.75 and 1 > 1
Tigray 49.4 14.6 3.3 11.8 20.9 83.2 11.7 3.6 1.5 .0
Amhara 16.9 22.0 24.5 20.4 16.2 19.4 21.1 23.0 21.5 15.1
Oromia 58.4 26.4 3.5 5.1 6.6 66.5 20.7 3.3 4.7 4.7
Somali 39.1 8.3 .0 28.0 24.5 18.1 11.1 1.0 44.0 25.7
Benishangul Gumuz 69.6 8.8 .0 17.3 4.3 69.8 12.9 .0 12.9 4.3
SNNPR 45.9 14.8 2.6 18.4 18.3 50.4 13.1 5.2 16.0 15.2
Total 27.9 21.6 18.1 17.6 14.8 31.6 20.0 17.3 18.1 13.1

34
Table 36. Proportion of respondents by area in ha allocated for the different rice varieties
Variety Cropped area in 2010 Cropped area in 2009
0.25 > 0.25 and 0.5 >0.5 and 0.75 >0.75 and 1 > 1 0.25 > 0.25 and 0.5 >0.5 and 0.75 >0.75 and 1 > 1
X-Jigna 16.8 22.0 24.4 20.4 16.3 19.4 20.9 23.0 21.6 15.1
White rice 24.9 18.6 4.1 26.4 26.2 31.3 18.2 4.7 22.8 23.0
Gumara 70.0 18.5 4.5 3.7 3.3 72.3 15.4 7.2 2.7 2.4
Red rice 65.1 32.1 .0 2.8 .0 54.0 40.5 .0 2.8 2.8
Superica-1 54.5 27.7 4.1 6.4 7.2 62.4 22.5 2.9 6.5 5.8
NERICA-4 80.2 13.2 1.2 2.9 2.5 87.2 7.4 1.0 3.5 .9
NERICA-2 31.1 13.4 .0 29.2 26.3 27.8 18.5 1.0 43.6 9.1
NERICA-3 56.7 18.9 2.7 9.0 12.7 77.5 16.2 2.6 2.0 1.8
NERICA-1 37.5 3.1 .0 21.8 37.6 15.5 4.6 .0 37.9 41.9
Shebelle 53.5 8.3 .0 29.8 8.3 15.1 30.7 7.3 23.5 23.5
Gode-1 28.9 11.9 .0 53.6 5.5 .0 41.2 .0 58.8 .0
Hoden 55.5 39.3 .0 .0 5.3 48.8 17.1 .0 34.1 .0
Total 27.8 21.6 18.1 17.6 14.9 31.5 20.0 17.3 18.1 13.1
35
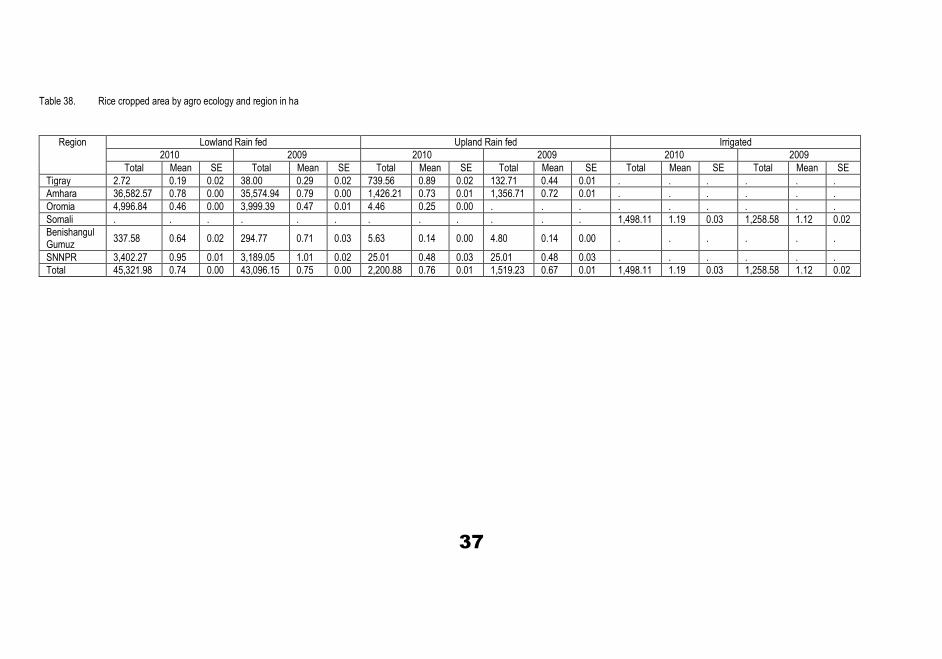
Cultivated area by agro-ecology and variety
Table 38 and Table 37 present the area allocated for rice by variety, agro-
ecology, and region. In Tigray, upland rain fed rice agro-ecology dominates
followed by lowland rain fed. In Amhara region, lowland rain fed rice ecology
is very important with a total land allocation of about 36,600 ha followed by
upland rain fed rice ecology with about 1400 ha in 2010. In Oromia, the
dominant rice agro-ecology is lowland with a total land allocation of about
5000 ha. Similarly, lowland rain fed rice ecology dominates also in SNNP with
about 3,400 ha in 2010. It is only in Somali region that there is irrigated rice
ecology under smallholder farmers’ condition and it is estimated that the total
land allocated in 2010 was about 1500 ha.
In terms of rice varieties, the most important varieties in lowland and upland
rain fed rice ecology are the local X-Jigna, local white rice, Superica -1,
Gumara, and NERICA varieties. For irrigated rice ecology, the important
varieties are NERICA 1 and 2, Shebelle, Gode 1, and Hoden (Table 37).

36
Table 37. Rice cropped area by agro ecology and variety in ha
Region
Lowland rain fed Upland rain fed Irrigated
2010 2009 2010 2009 2010 2009
Total Mean SE Total Mean SE Total Mean SE Total Mean SE Total Mean SE Total Mean SE
X-Jigna 36,638.13 0.78 0.00 35,673.10 0.79 0.00 1,258.20 0.89 0.02 1,194.44 0.87 0.02 . . . . . .
White rice 3,402.32 0.98 0.01 3,119.19 1.08 0.02 9.96 0.46 0.09 9.96 0.46 0.09 . . . . . .
Gumara (IAC-164) 1,079.72 0.42 0.01 896.43 0.47 0.01 . . . . . . . . . . . .
Red rice 51.35 0.34 0.02 118.54 0.63 0.10 18.52 0.32 0.01 18.52 0.32 0.01 . . . . . .
Superica-1 3,046.45 0.47 0.01 2,629.47 0.49 0.01 26.09 0.26 0.01 26.23 0.32 0.02 . . . . . .
NERICA-4 379.43 0.47 0.02 245.23 0.57 0.03 119.70 0.32 0.01 114.75 0.32 0.01 . . . . . .
NERICA-2 121.76 1.25 0.08 24.35 0.50 0.00 . . . . . . 476.64 1.14 0.05 413.23 0.91 0.03
NERICA-3 602.82 0.47 0.01 389.83 0.37 0.01 768.41 0.83 0.02 155.33 0.41 0.01 . . . . . .
NERICA-1 . . . . . . . . . . . . 768.12 1.58 0.07 714.12 1.36 0.04
Shebelle . . . . . . . . . . . . 104.79 0.75 0.08 86.75 1.17 0.11
Gode-1 (BG-90-2) . . . . . . . . . . . . 82.18 0.78 0.04 24.26 0.79 0.05
Hoden (MTU-1001) . . . . . . . . . . . . 66.38 0.60 0.10 20.21 0.55 0.06
Total 45,321.98 0.74 0.00 43,096.15 0.75 0.00 2,200.88 0.76 0.01 1,519.23 0.67 0.01 1,498.
11 1.19 0.03 1,258.58 1.12 0.02
37
Table 38. Rice cropped area by agro ecology and region in ha
Region Lowland Rain fed Upland Rain fed Irrigated
2010 2009 2010 2009 2010 2009
Total Mean SE Total Mean SE Total Mean SE Total Mean SE Total Mean SE Total Mean SE
Tigray 2.72 0.19 0.02 38.00 0.29 0.02 739.56 0.89 0.02 132.71 0.44 0.01 . . . . . .
Amhara 36,582.57 0.78 0.00 35,574.94 0.79 0.00 1,426.21 0.73 0.01 1,356.71 0.72 0.01 . . . . . .
Oromia 4,996.84 0.46 0.00 3,999.39 0.47 0.01 4.46 0.25 0.00 . . . . . . . . .
Somali . . . . . . . . . . . . 1,498.11 1.19 0.03 1,258.58 1.12 0.02
Benishangul Gumuz
337.58 0.64 0.02 294.77 0.71 0.03 5.63 0.14 0.00 4.80 0.14 0.00 . . . . . .
SNNPR 3,402.27 0.95 0.01 3,189.05 1.01 0.02 25.01 0.48 0.03 25.01 0.48 0.03 . . . . . .
Total 45,321.98 0.74 0.00 43,096.15 0.75 0.00 2,200.88 0.76 0.01 1,519.23 0.67 0.01 1,498.11 1.19 0.03 1,258.58 1.12 0.02

38
Distribution of farmers by rice land size and agro-ecology
The distribution of rice farmers by size of rice land indicates that there is
considerable difference across the three rice ecologies, where in irrigated
ecology more farmers cultivate less than a quarter of a hectare and more than
one hectare compared to lowland and upland rain fed rice ecology (Table 39).
Table 39. Percentage distribution of producers by agro-ecology and rice acreage
Crop year Area category Agro ecology Total
Lowland rain fed
Upland rain fed
Irrigated
2010 <=0.25 27.4 33.0 39.1 27.9
> 0.25 and <=0.5 21.9 21.4 8.3 21.6
>0.5 and <= 0.75 18.8 11.0 0.0 18.1
>0.75 and <= 1 17.4 16.3 28.0 17.6
> 1 14.5 18.3 24.5 14.8
2009 <=0.25 31.0 50.0 18.1 31.6
> 0.25 and <=0.5 20.2 18.6 11.1 20.0
>0.5 and <= 0.75 17.8 12.0 1.0 17.3
>0.75 and <= 1 18.0 10.2 44.0 18.1
> 1 13.0 9.2 25.7 13.1
Production by region and variety
On the average, 22 and 21 quintals of paddy were produced per household
during 2010 and 2009 cropping seasons. The total national volume of
production during 2010 and 2009 cropping seasons were estimated to be
1,465,658 and 1,265,306 quintals of paddy. This does not include commercial
rice production in the country at medium and large-scale farmers. The 2010
cropping season production has increased by 200,352 quintals of paddy as
compared to 2009 cropping season production. This is an evidence for 15.8 %
increase in the national volume of paddy rice production (Table 40).

39
Table 40. Production of paddy per household and region in quintals
Region Quantity of paddy produced 02010
Quantity of paddy produced 2009
Increment
Mean SE Total Mean SE Total Quintal %
Tigray 25 1 20,798 7 0 3,095 17,703 571.99
Amhara 25 0 1,214,889 23 0 1,083,531 131,358 12.12
Oromia 11 0 114,836 10 0 86,843 27,993 32.23
Somali 34 1 42,273 36 1 41,274 999 2.42
Benishangul Gumuz
12 0 6,563 8 0 3,106 3,457 111.30
SNNPR 18 0 66,300 15 0 47,455 18,845 39.71
Total 22 0 1,465,658 21 0 1,265,306 200,352 15.83
The 2010 cropping season volume of production by region was 20798,
1214889, 114836, 12273, 6563, and 66300 quintals as produced by Tigray,
Amhara, Oromia, Somali, Benishangul Gumuz and SNNPR respectively. In all
the regions, the production level in 2010 has increased as compared to 2009 in
571.9, 12.12, 32.23, 2.42, 111.3, and 39.71 % in Tigray, Amhara, Oromia,
Somali, Benishangul Gumuz, and SNNPR, respectively. This result may be
considered as an indicator for existence of considerable expansion of rice
production in Tigray and Benishangul Gumuz Regions (Table 40).
Table 41. Production of Paddy per household and variety in quintals
Variety Paddy produced 2010 Paddy produced 2009 Increment
Mean SE Total Mean SE Total Quintal %
X-Jigna 25 0 1,212,585 23 0 1,082,994 129,591 11.97
White rice 19 0 65,746 16 0 44,100 21,646 49.08
Gumara 9 0 23,459 8 0 16,228 7,231 44.56
Red rice 10 0 2,086 7 0 1,617 469 29.00
Superica-1 12 0 77,094 11 0 60,204 16,890 28.05
NERICA-4 8 0 8,810 7 0 5,553 3,257 58.65
NERICA-2 34 1 15,698 31 1 15,730 -32 -0.20
NERICA-3 16 0 32,873 8 0 12,459 20,414 163.85
NERICA-1 45 2 21,201 44 1 23,321 -2120 -9.09
Shebelle 20 1 2,813 27 2 2,201 612 27.81
Gode-1 20 2 2,161 15 2 463 1,698 366.74
Hoden 11 1 1,131 12 2 435 696 160.00
Total 22 0 1,465,658 21 0 1,265,306 200,352 15.83
All the varieties except NERICA-1 and NERICA-2 have shown an increase in
volume of production in 2010 as compared to 2009 cropping season. However,
40
the average volume of production per household for NERICA-1 and NERICA-
2 was the highest in both years compared to other rice varieties. In terms of the
contribution to total rice production the local variety X-Jigna and the improved
variety Superica 1 are the dominant varieties at national level (Table 41).
Production by agro-ecology and variety
Linked with the size of land allocated more rice is produced in lowland rain fed
rice agro-ecology with an estimated total paddy production of about 1.2 million
quintals in 2009 and 1.4 million quintals in 2010. In upland rice ecology, the
estimated total paddy production was about 62 thousand quintals with average
productivity level of 21 q/ha in 2010. In irrigated rice ecology, the estimated
paddy production was about 42 thousand quintals with productivity levels of 34
q/ha (Table 42). The trend in production and productivity indicates that there is
increase in the level of productivity in lowland and upland rain fed rice ecology
whereas in the irrigated ecology the estimates indicated that there is a decrease
on average (Table 43).
The estimated productivity level in lowland ecology has increased from the
average 21 q/ha in 2009 to 22 q/ha in 2010. In the upland rice ecology, the
productivity level has increased from 18 q/ha in 2009 to 21 q/ha in 2010. In the
irrigated rice ecology, the average productivity level has decreased from 36
q/ha in 2009 to 34 q/ha in 2010.
The productivity levels achieved in the different regions are considerably
different within rice ecologies and across ecologies. The highest productivity
level in the lowland rice ecology was achieved in Amhara (25 q/ha) in 2010
followed by SNNP (19 q/ha) and Oromia (11 q/ha). On the other hand, higher
productivity level in upland rice ecology was achieved in Tigray with average
productivity level of 25 q/ha in 2010.
In terms of variety, X-Jigna gave the highest yield both in lowland and upland
rice ecologies with 25 q/ha and 27 q/ha in 2010, respectively. In the irrigated
rice ecology, NERICA 1 gave the highest productivity level with 45 q/ha in
2010 (Table 43).

41
Table 42. Paddy produced by agro-ecology and region in quintal
Region
Lowland rain fed Upland rain fed Irrigated
Quantity of paddy produced Quantity of paddy produced Quantity of paddy produced
2010 2009 2010 2009 2010 2009
Total Mean SE Total Mean SE Total Mean SE Total Mean SE Total Mean SE Total Mean S.E
Tigray 100 7 0.82 265 2 0.19 20,697 25 0.69 2,830 8 0.50 . . . . . .
Amhara 1,174,655 25 0.08 1,045,778 23 0.08 40,234 21 0.44 37,754 20 0.43 . . . . . .
Oromia 114,782 11 0.09 86,843 10 0.10 54 3 0.00 . . . . . . . . .
Somali . . . . . . . . . . . . 42,273 34 0.81 41,274 36 0.79
Benishangul Gumuz
6,376 12 0.48 2,840 8 0.28 187 5 0.64 267 8 1.95 . . . . . .
SNNPR 65,659 19 0.27 47,152 15 0.24 641 12 1.37 303 6 0.25 . . . . . .
Total 1,361,572 22 0.07 1,182,878 21 0.07 61,813 21 0.36 41,153 18 0.37 42,273 34 0.81 41,274 36 0.79

42
Table 43. Paddy produced by agro ecology and Variety in quintal
Region
Lowland rain fed Upland rain fed Irrigated
Quantity of paddy produced Quantity of paddy produced Quantity of paddy produced
2010 2009 2010 2009 2010 2009
Total Mean SE Total Mean SE Total Mean SE Total Mean SE Total Mean SE Total Mean SE
X-Jigna 1,174,577 25 0 1,047,240 23 0 38,008 27 1 35,753 26 0 . . . . . .
White rice 65,385 19 0 43,811 16 0 361 17 3 289 13 3 . . . . . .
Gumara (IAC-164) 23,459 9 0 16,228 8 0 . . . . . . . . . . . .
Red rice 1,693 11 1 1,369 7 0 393 7 0 248 4 0 . . . . . .
Superica-1 76,796 12 0 59,870 11 0 297 3 0 334 4 0 . . . . . .
NERICA-4 6,994 9 0 4,147 10 1 1,816 5 0 1,406 4 0 . . . . . .
NERICA-2 731 15 0 877 18 0 . . . . . . 14,968 36 1 14,854 33 1
NERICA-3 11,937 10 0 9,336 9 0 20,937 23 1 3,123 8 0 . . . . . .
NERICA-1 . . . . . . . . . . . . 21,201 45 2 23,321 44 1
Shebelle(IR688059-76-3-3-3-2)
. . . . . . . . . . . . 2,813 20 1 2,201 27 2
Gode-1 (BG-90-2) . . . . . . . . . . . . 2,161 20 2 463 15 2
Hoden (MTU-1001) . . . . . . . . . . . . 1,131 11 1 435 12 2
Total 1,361,572 22 0 1,182,878 21 0 61,813 21 0 41,153 18 0 42,273 34 1 41,274 36 1

43
Productivity levels by region and variety
The national average productivity level of 2010 and 2009 cropping seasons
were estimated at 32.4 and 31.25 q/ha, respectively. This shows an
improvement of 0.9 q/ha on the average productivity level of 2010 as compared
to 2009 cropping season. The highest productivity level, 34.43 q/ha, was
recorded for Amhara while the lowest productivity level, 24.6 q/ha, was
recorded for Benishangul Gumuz in 2010 cropping season (Table 44).
Table 44. Paddy rice productivity levels (q /ha) by region
Region 2010 2009
Mean SE Mean SE
Tigray 25.83 0.44 16.51 0.65
Amhara 34.43 0.09 31.89 0.10
Oromia 33.10 0.26 32.98 0.32
Somali 33.42 0.46 36.98 0.70
Benishangul Gumuz 24.60 1.11 15.27 1.41
SNNPR 23.89 0.33 19.37 0.29
Total 33.42 0.08 31.25 0.09
The 2010 productivity level of varieties was assessed and the maximum and the
minimum productivity levels estimated were 40.03 and 24.89 q/ha, estimated
for the varieties Shebelle and NERICA-4 respectively (Table 45).
Table 45. Paddy rice productivity levels (q/ha)
Variety 2010 2009
Mean SE Mean SE
X-Jigna 34.55 0.09 32.04 0.10
White rice 26.20 0.39 22.32 0.48
Gumara 27.77 0.42 22.27 0.38
Red rice 29.34 1.07 21.36 0.91
Superica-1 34.32 0.36 34.07 0.42
NERICA-4 24.89 0.61 17.01 0.52
NERICA-2 34.91 0.70 40.82 1.12
NERICA-3 28.50 0.49 29.28 0.69
NERICA-1 32.79 0.59 35.60 0.93
Shebelle 40.03 1.81 32.56 2.20
Gode-1 26.52 2.11 17.84 2.10
Hoden 26.24 1.21 27.81 2.99
Total 33.42 0.08 31.25 0.09
44
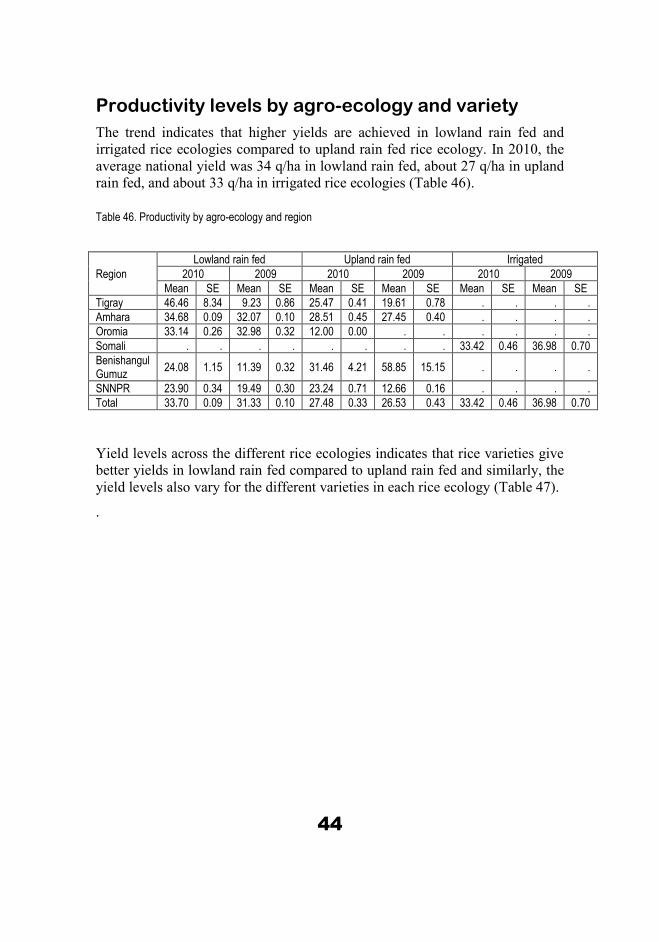
Productivity levels by agro-ecology and variety
The trend indicates that higher yields are achieved in lowland rain fed and
irrigated rice ecologies compared to upland rain fed rice ecology. In 2010, the
average national yield was 34 q/ha in lowland rain fed, about 27 q/ha in upland
rain fed, and about 33 q/ha in irrigated rice ecologies (Table 46).
Table 46. Productivity by agro-ecology and region
Region
Lowland rain fed Upland rain fed Irrigated
2010 2009 2010 2009 2010 2009
Mean SE Mean SE Mean SE Mean SE Mean SE Mean SE
Tigray 46.46 8.34 9.23 0.86 25.47 0.41 19.61 0.78 . . . .
Amhara 34.68 0.09 32.07 0.10 28.51 0.45 27.45 0.40 . . . .
Oromia 33.14 0.26 32.98 0.32 12.00 0.00 . . . . . .
Somali . . . . . . . . 33.42 0.46 36.98 0.70
Benishangul Gumuz
24.08 1.15 11.39 0.32 31.46 4.21 58.85 15.15 . . . .
SNNPR 23.90 0.34 19.49 0.30 23.24 0.71 12.66 0.16 . . . .
Total 33.70 0.09 31.33 0.10 27.48 0.33 26.53 0.43 33.42 0.46 36.98 0.70
Yield levels across the different rice ecologies indicates that rice varieties give
better yields in lowland rain fed compared to upland rain fed and similarly, the
yield levels also vary for the different varieties in each rice ecology (Table 47).
.

45
Table 47: Paddy produced by agro ecology and region
Region Lowland Rain fed Upland Rain fed Irrigated
2010 2009 2010 2009 2010 2009
Mean SE Mean SE Mean SE Mean SE Mean S.E Mean S.E
X-Jigna 34.59 0.09 32.03 0.10 33.24 0.46 32.28 0.46 . . . .
White rice 26.11 0.39 21.90 0.44 39.52 6.06 . . . . . .
Gumara (IAC-164) 27.77 0.42 22.27 0.38 . . . . . . . .
Red rice 32.29 1.35 23.73 1.13 21.52 0.99 13.67 0.12 . . . .
Superica-1 34.60 0.37 34.38 0.42 16.05 2.12 13.36 0.93 . . . .
NERICA-4 28.33 0.67 18.48 0.77 17.94 1.16 15.27 0.67 . . . .
NERICA-2 30.00 0.00 36.00 0.00 . . . . 35.49 0.78 41.33 1.24
NERICA-3 32.08 0.79 33.22 0.87 23.91 0.41 18.31 0.67 . . . .
NERICA-1 . . . . . . . . 32.79 0.59 35.60 0.93
Shebelle (IR688059-76-3-3-3-2) . . . . . . . . 40.03 1.81 32.56 2.20
Gode-1 (BG-90-2) . . . . . . . . 26.52 2.11 17.84 2.10
Hoden (MTU-1001) . . . . . . . . 26.24 1.21 27.81 2.99
Total 33.70 0.09 31.33 0.10 27.48 0.33 26.53 0.43 33.42 0.46 36.98 0.70
46
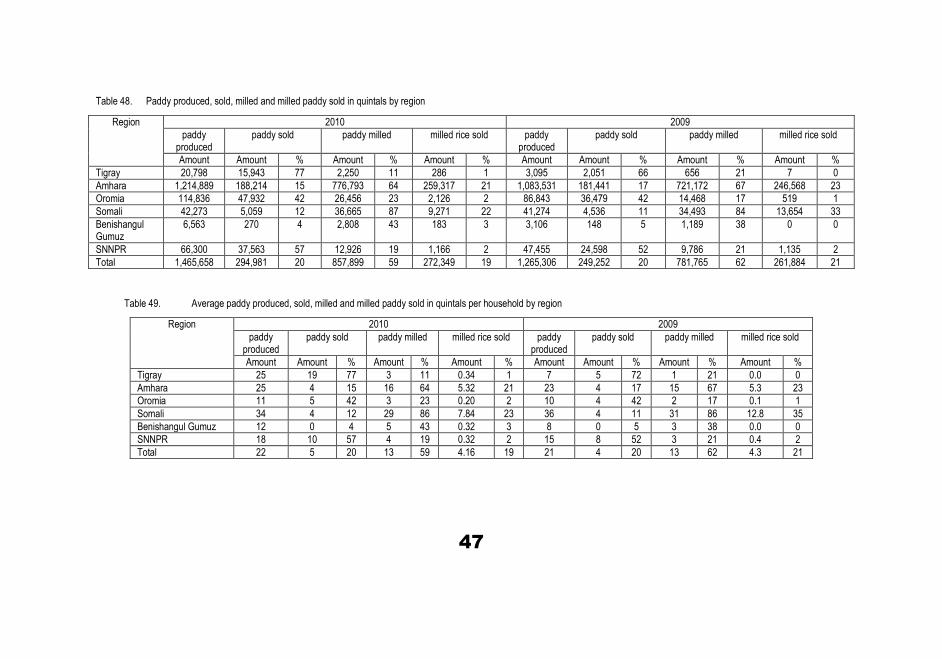
Paddy Rice Milled and Sold The amount of rice sold varied considerable across region and the average
proportion of paddy sold from the total paddy produced was about 20% at
national level in both 2010 and 2009. The proportion of milled rice of the total
paddy produced varied across region and the average proportion of paddy
milled from the total paddy produced was about 59% in 2010 and 62% in 2009
at national level. The highest proportion of paddy milled was recorded in
Somali region with 87% followed by Amhara with 64%, and Benishangul-
Gumuz with 43% (Table 48).
The average amount of paddy produced per household is estimated to be 21
quintals in 2009 and 22 quintals in 2010. The quantity of paddy sold per
household was on average 4 quintals in 2009 and 5 quintals in 2010 whereas
the quantity of milled rice sold per household is 4 quintals in 2009 and 2010
(Table 49).
Table 50 presents the amount of paddy produced, sold, milled, and milled rice
sold for the different varieties. The result indicates that there is a considerable
variability among the different varieties. For some varieties the amount of
paddy sold is higher than the amount milled rice sold like for Gumara,
superica-1, NERICA 4, NERICA 3, whereas for other varieties the amount
paddy sold is smaller than the amount milled rice sold like for NERECA 2 and
NERICA 1 (Table 50).
47
Table 48. Paddy produced, sold, milled and milled paddy sold in quintals by region
Region 2010 2009
paddy produced
paddy sold paddy milled milled rice sold paddy produced
paddy sold paddy milled milled rice sold
Amount Amount % Amount % Amount % Amount Amount % Amount % Amount %
Tigray 20,798 15,943 77 2,250 11 286 1 3,095 2,051 66 656 21 7 0
Amhara 1,214,889 188,214 15 776,793 64 259,317 21 1,083,531 181,441 17 721,172 67 246,568 23
Oromia 114,836 47,932 42 26,456 23 2,126 2 86,843 36,479 42 14,468 17 519 1
Somali 42,273 5,059 12 36,665 87 9,271 22 41,274 4,536 11 34,493 84 13,654 33
Benishangul Gumuz
6,563 270 4 2,808 43 183 3 3,106 148 5 1,189 38 0 0
SNNPR 66,300 37,563 57 12,926 19 1,166 2 47,455 24,598 52 9,786 21 1,135 2
Total 1,465,658 294,981 20 857,899 59 272,349 19 1,265,306 249,252 20 781,765 62 261,884 21
Table 49. Average paddy produced, sold, milled and milled paddy sold in quintals per household by region
Region 2010 2009
paddy produced
paddy sold paddy milled milled rice sold paddy produced
paddy sold paddy milled milled rice sold
Amount Amount % Amount % Amount % Amount Amount % Amount % Amount %
Tigray 25 19 77 3 11 0.34 1 7 5 72 1 21 0.0 0
Amhara 25 4 15 16 64 5.32 21 23 4 17 15 67 5.3 23
Oromia 11 5 42 3 23 0.20 2 10 4 42 2 17 0.1 1
Somali 34 4 12 29 86 7.84 23 36 4 11 31 86 12.8 35
Benishangul Gumuz 12 0 4 5 43 0.32 3 8 0 5 3 38 0.0 0
SNNPR 18 10 57 4 19 0.32 2 15 8 52 3 21 0.4 2
Total 22 5 20 13 59 4.16 19 21 4 20 13 62 4.3 21

48
Table 50. Paddy produced, sold, milled and milled paddy sold in quintals by variety
Variety 2010 2009
paddy produced
paddy sold paddy milled milled rice sold paddy produced
paddy sold paddy milled milled rice sold
Amount Amount % Amount % Amount % Amount Amount % Amount % Amount %
X-Jigna 1,212,585 190,080 16 770,946 64 257,688 21 1,082,994 182,306 17 717,476 66 245,322 23
White rice 65,746 35,422 54 13,161 20 1,086 2 44,100 22,787 52 9,427 21 1,120 3
Gumara 23,459 4,701 20 12,492 53 2,386 10 16,228 3,924 24 7,811 48 1,085 7
Red rice 2,086 559 27 1,047 50 4 0 1,617 470 29 987 61 0 0
Superica-1 77,094 36,041 47 13,002 17 768 1 60,204 27,219 45 7,013 12 375 1
NERICA-4 8,810 2,365 27 2,614 30 805 9 5,553 1,083 20 1,014 18 327 6
NERICA-2 15,698 760 5 14,454 92 3,666 23 15,730 982 6 13,702 87 5,546 35
NERICA-3 32,873 20,753 63 7,241 22 342 1 12,459 6,927 56 2,667 21 0 0
NERICA-1 21,201 2,121 10 18,883 89 4,082 19 23,321 2,738 12 19,360 83 6,704 29
Shebelle 2,813 778 28 2,004 71 719 26 2,201 634 29 1,360 62 771 35
Gode-1 2,161 1,011 47 1,276 59 390 18 463 6 1 415 90 347 75
Hoden 1,131 389 34 778 69 414 37 435 176 40 399 92 286 66
Total 1,465,658 294,981 20 857,899 59 272,349 19 1,265,306 249,252 20 781,631 62 261,884 21

49
Purpose of Rice Production
Respondents were asked how they used the rice they produced in 2010 and
2009 cropping seasons. In 2010, 27.4, 68.7, 2.2, and 1.7 % of the respondents
have reported that they use what they produced only family consumption, and
sale, for sale only and for other purposes respectively. While in 2009, 26.9,
67.5 1.8, and 3.8 % of the respondents have reported that, what they produced
was used for family consumption only, family consumption and sale, for sale
only and for other purposes respectively (Table 51).
Table 51. Distribution of rice producing households by main purpose of rice production
Region 2010 2009
Consumption only
Consumption and sale
Sale only
Other Consumption only
Consumption and sale
Sale only
Other
Tigray 48.1 47.8 2.9 1.2 38.2 26.2 8.7 26.9
Amhara 20.3 76.7 1.9 1.2 22.6 73.7 1.6 2.1
Oromia 48.1 48.5 2.3 1.1 41.1 53.7 .6 4.7
Somali 46.8 38.7 7.2 7.2 34.6 37.2 9.4 18.9
Benishangul Gumuz
75.3 15.3 .0 9.4 75.0 3.0 .0 22.0
SNNPR 33.4 55.1 4.6 6.9 31.3 55.9 3.6 9.3
Total 27.4 68.7 2.2 1.7 26.9 67.5 1.8 3.8
Major Constraints in Rice Production
The major constraints in rice production are in order to their importance (Table
52).
water management related problems, which are related to the late onset, early
session, heavy rainfall, shortage of rain, drought and/or water lodge and flood;
soil related problem that are associated with soil fertility depletion, salinity, and/or
siltation;
weed;
insect pests;
disease;
input related such as seed fertilizer, labor chemical and water pumps; and
market related.

50
Table 52. Distribution of respondents by priority rice production constraint (% of respondents)
Constraint Tigray Amhara Oromia Somali Benishangul Gumuz
SNNPR Total
Water related problem 28.3 40.1 5.3 1 0 7.9 32.1
Weed 34.9 25.5 20.4 12.9 20.9 37.5 25.6
Insect, pest and wild life 34.5 19.4 56.3 20.6 61.7 21.5 24.1
Soil related problem 2.3 7.5 2.7 2.9 0 0.7 6.2
Disease 0 2.3 13.9 0.6 12.6 31.2 5.6
Crop nature 0 4.2 1 0 0 0 3.3
Input related problem 0 0.3 0 34.9 3.9 0.5 1.6
Market related 0 0.6 0.4 27.1 1 0.7 1.6
Conclusions As relatively new crop to the country, much is not known about rice production
and the characteristics of its producers. This national survey was conducted to
fill this gap especially in terms of characterizing rice production and its
producers.
It is expected that the report will serve as a baseline and reference material for
rice researchers, development workers and advocates of the implementation of
the national rice research and development strategy.
References MoA (Ministry of Agriculture). 2011. Crop Variety Register. Issue No. 14. Animal and
Plant Health Regulatory Directorate. Ministry of Agriculture. Addis Ababa
Ethiopia.
CSA (Central Statistical Agency). 2011. Report on Area And Production Of Major
Crops. Volume I. Agricultural Sample Survey - 2010 / 2011 (2003 E.C.) Central
Statistical Agency. The Federal Democratic Republic Of Ethiopia. Addis Ababa,
Ethiopia.
MoARD (Ministry of Agriculture and Rural Development). 2010. National Rice
Research and Development Strategy. Ministry of Agriculture and Rural
Development, the Federal Democratic Republic of Ethiopia. Addis Ababa, Ethiopia.
48p


