

SOLAR FLARE ENERGETIC SOLAR FLARE ENERGETIC PARTICLESPARTICLES
Eduard Kontar
School of Physics and AstronomyUniversity of Glasgow, UK

Solar flares and accelerated particles
From Emslieet al., 2004
Free magnetic energy~2 1032 ergs

Observations of energetic particles
X-r
ays
r
adio
wav
es
Par
ticle
s 1A
U
Krucker et al, 2001
Aschwanden and Benz, 1997

X-ray spectrum of solar flares
Thermal X-rays
Non-thermal X-rays
Gamma-ray lines
pre-RHESSI X-ray spectra (Kane et al, 1982)
Ramaty High Energy Solar Spectroscopic Imager (RHESSI) spectrum
July 23, 2002 flare
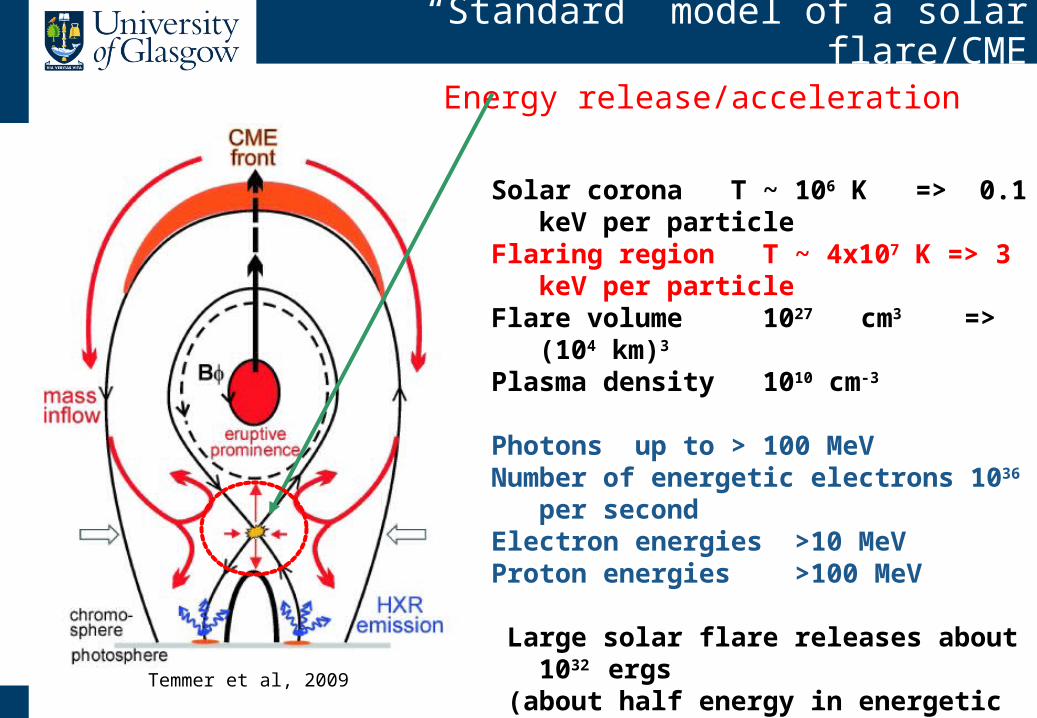
“Standard” model of a solar flare/CME
Solar corona T ~ 106 K => 0.1 keV per particle
Flaring region T ~ 4x10⁷ K => 3 keV per particle
Flare volume 1027 cm3 => (104 km)3
Plasma density 1010 cm-3
Photons up to > 100 MeVNumber of energetic electrons 1036 per secondElectron energies >10 MeVProton energies >100 MeV Large solar flare releases about 1032 ergs (about half energy in energetic electrons) 1 megaton of TNT is equal to about 4 x 10²²
ergs.
Energy release/acceleration
Temmer et al, 2009

X-ray spectrum of solar flares
Thermal X-rays
Non-thermal X-rays
Gamma-ray lines
pre-RHESSI X-ray spectra (Kane et al, 1982)
Ramaty High Energy Solar Spectroscopic Imager (RHESSI) spectrum
July 23, 2002 flare
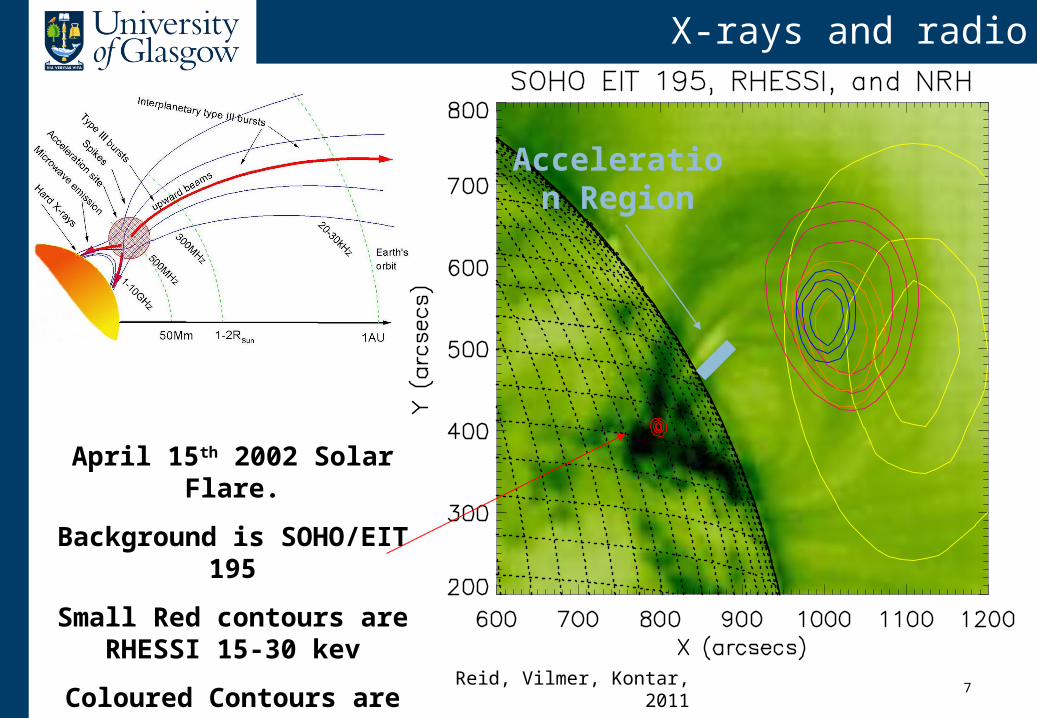
X-rays and radio
Reid, Vilmer, Kontar, 20117
April 15th 2002 Solar Flare.
Background is SOHO/EIT 195
Small Red contours are RHESSI 15-30 kev
Coloured Contours are radio (NRH) 432 MHz Blue to 164
MHz Yellow
Acceleration Region

Standard fare geometry
‘Standard’ flare model picture in 2D (Shibata, 1996)
Soft X-ray emission up to ~10 - 20 keV
Hard X-ray sources above ~20 keV
RHESSI spectrum
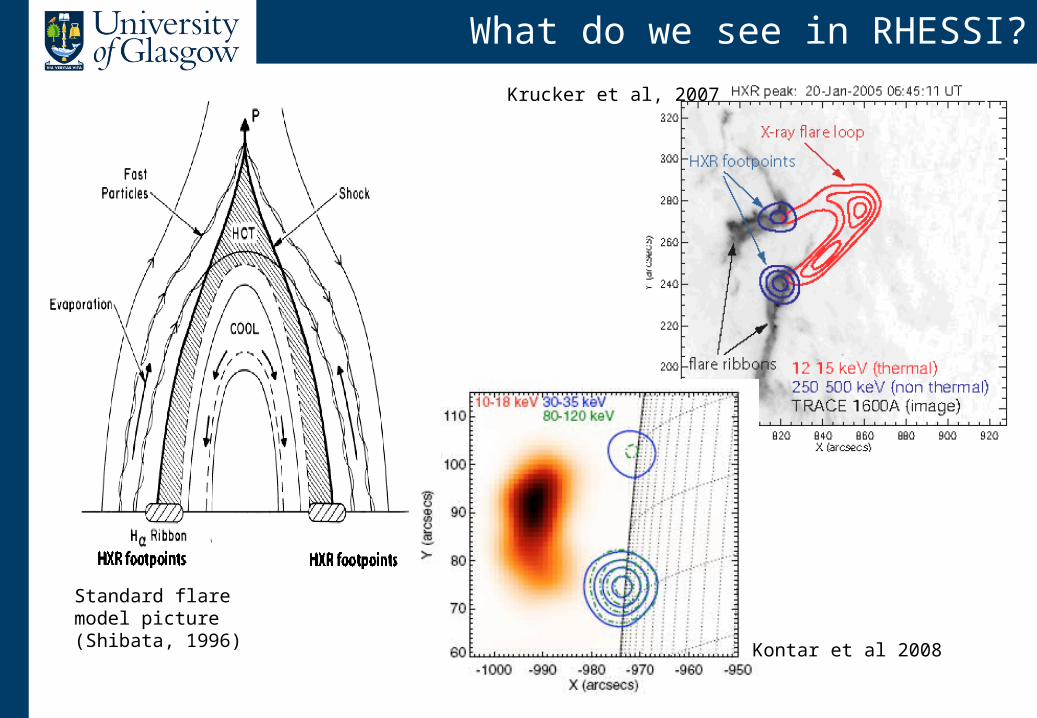
What do we see in RHESSI?
Krucker et al, 2007
Standard flare model picture (Shibata, 1996)
Kontar et al 2008

X-ray emission from limb flares
Footpoints
Coronal Source
Limb flare event 6 January 2004
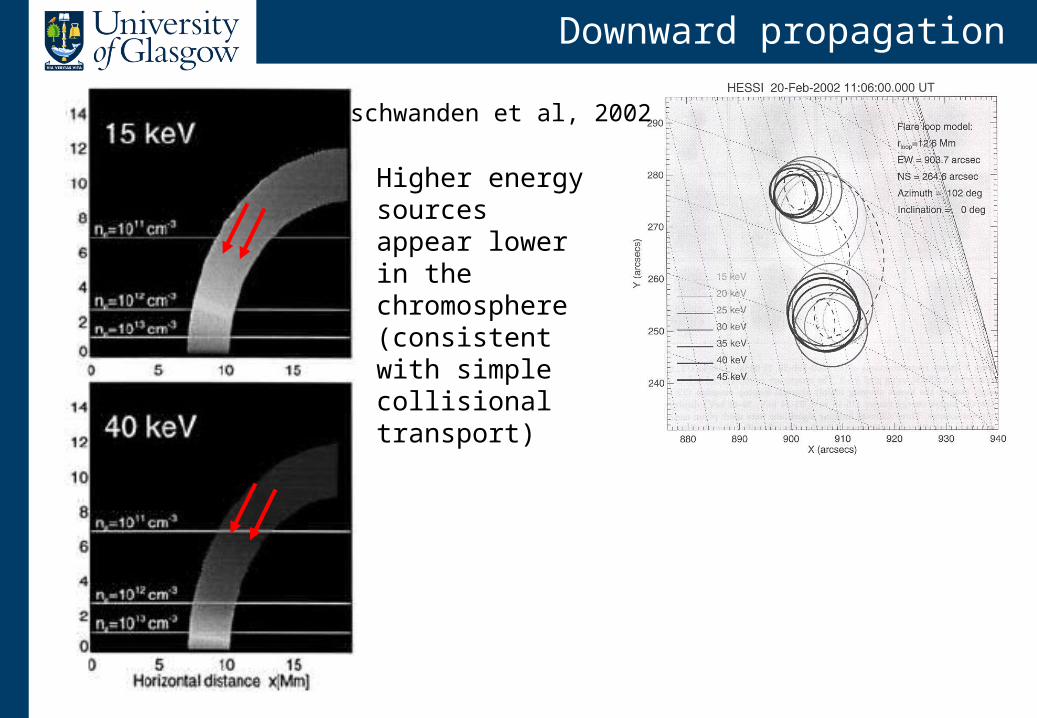
Downward propagation
Aschwanden et al, 2002
Higher energy sources appear lower in the chromosphere(consistent with simple collisional transport)

From X-rays to electrons
We measure density weighted electron flux spectrum quite accurately;
Injected rate is model dependent/particle transport is coupled/
Mean electron spectra
Accelerated (injected) spectra
1 2 54
3
1 2 54
31234 5
(Model dependent)
(Model inde
pendent)
=> accelerated rate is ~1036 electrons per sec

Location of energy release
6-10 keV
14-16 keV
Sui et al, 2004
Do we observe magnetic reconnection?
Plasma density 1010 cm-3 Flare volume 1027 cm3
(104 km)3
=> Number of electrons:1037
=> All electrons will be evacuated from the volume within 10 seconds!
For acceleration rate 1036 per second
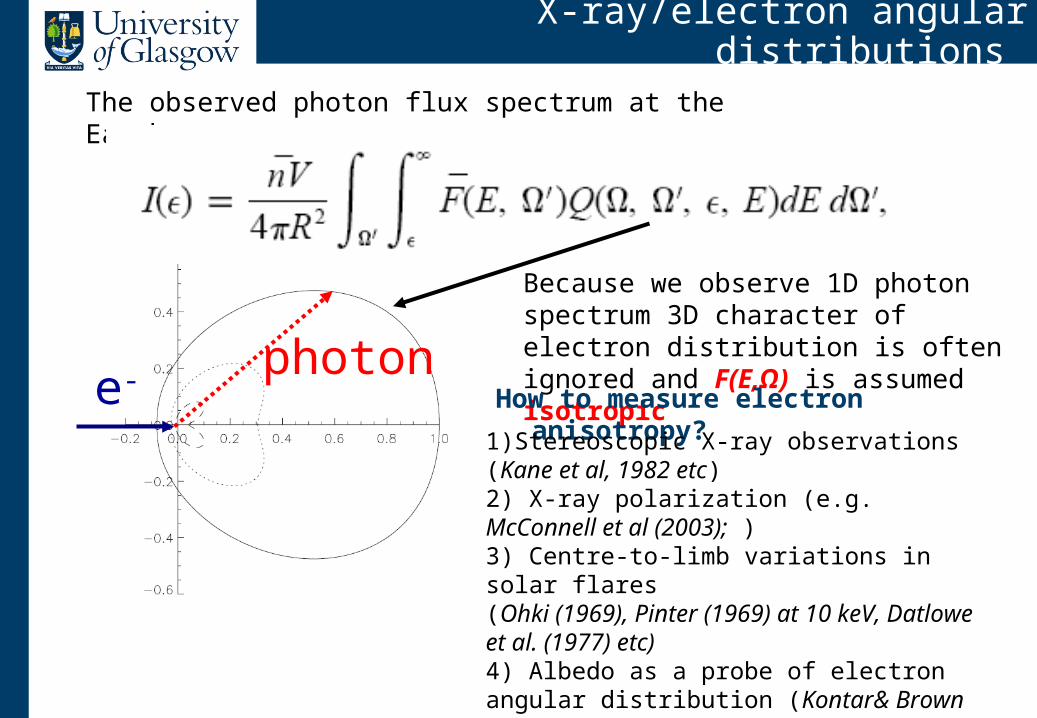
X-ray/electron angular distributions
The observed photon flux spectrum at the Earth:
Because we observe 1D photon spectrum 3D character of electron distribution is often ignored and F(E,Ω) is assumed isotropic
e-photon
How to measure electron anisotropy?
1)Stereoscopic X-ray observations (Kane et al, 1982 etc)2) X-ray polarization (e.g. McConnell et al (2003); )3) Centre-to-limb variations in solar flares(Ohki (1969), Pinter (1969) at 10 keV, Datlowe et al. (1977) etc)4) Albedo as a probe of electron angular distribution (Kontar& Brown 2006; Kasparova et al 2007, Battaglia et al, this meeting)

Compton scattering in pictures
Reflected flux
Direct flux
Observed fluxPrimary
Reflected Observed

Electron anisotropy: individual events
Albedo mirror suggest close to isotropic distribution (e.g. Kontar&Brown, 2006)
=> The angular distribution found is inconsistent with downward beamed distributions
Collisional scattering and return current effects cannot explain the isotropy of electron distribution

Electron anisotropy in flares
Collective effects of beam-plasma interaction?
PIC simulations of electron transport (Karlicky & Kasparova, 2009)
After 200 plasma periods
X-point collapse was studied using kinetic, 2.5-dimensional, PIC code (Tsiklauri and Haruki, 2008)
Related to the properties of accelerated electrons?
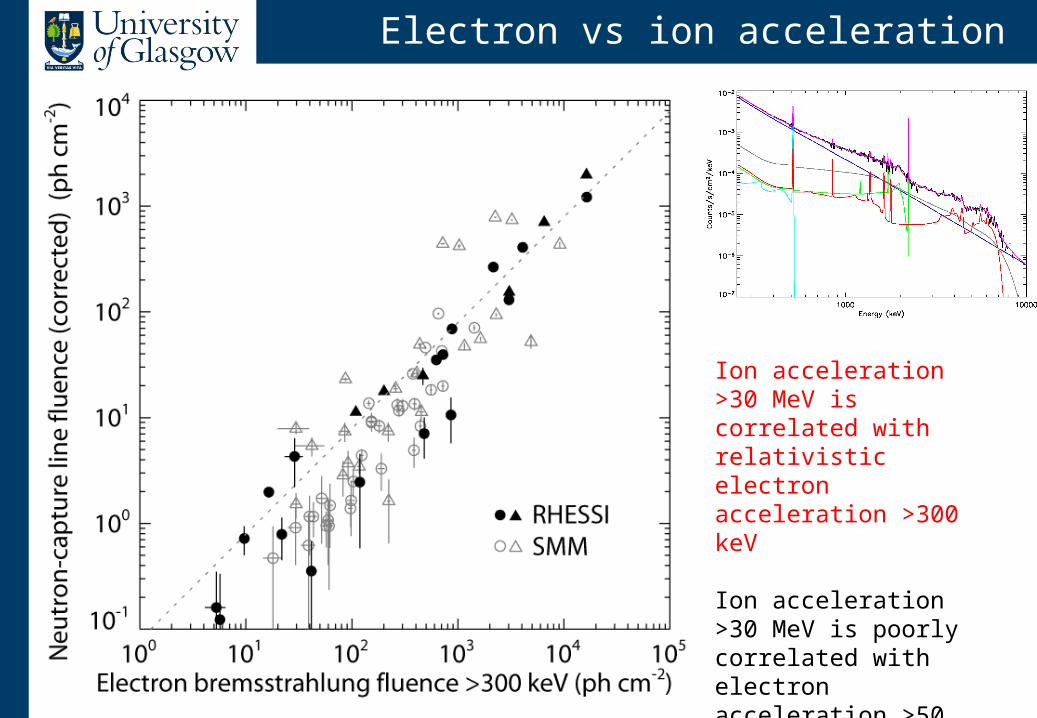
Electron vs ion acceleration
Ion acceleration >30 MeV is correlated with relativistic electron acceleration >300 keV
Ion acceleration >30 MeV is poorly correlated with electron acceleration >50 keV, with the possibility of two separate classes of flares(Shih et al, 2009)

gamma-ray emission processes
a) narrow-gamma lines
b) broad-gamma lines and gamma-ray-continuum Accelerated protons and alpha particles
Accelerated heavy ions and unresolved lines and Compton scatttering
From Murphy and Share, 2004

From X-rays to electrons
Imaging of the 2.223 MeV neutroncapture line (blue contours) and the HXR electronbremsstrahlung (red contours) of the flare on October 28, 2003. The underlying image is from TRACE at 195 Å. The X-ray and γ-ray imaging shown here used exactly the same selection of detector arrays and imaging procedure. Note the apparent loop-top source
in the hard X-ray contours.(Hurford et al, 2006)

Instead of conclusions… Instead of conclusions…
RHESSI Terrestrial Gamma-ray Flashes Positions
Visible Lightning Positions
Terrestrial gamma-ray flashes (TGFs) are very brief bursts of gamma radiation (typically around 1 millisecond long) coming upwards from the Earth's atmosphere from somewhere in the vicinity of a thunderstorm (Smith et al, 2005)


