

sensors
Article
Halochromic Polystyrene Nanofibers Obtained bySolution Blow Spinning for Wine pH Sensing
Kelvi W.E. Miranda 1,2 , Caio V. L. Natarelli 1, Adriana C. Thomazi 2,Guilherme M. D. Ferreira 3 , Maryana M. Frota 4, Maria do Socorro R. Bastos 5,Luiz H. C. Mattoso 2 and Juliano E. Oliveira 6,*
1 Graduate Program in Biomaterials Engineering, Federal University of Lavras, Lavras 37200-000, Brazil;[email protected] (K.W.E.M.); [email protected] (C.V.L.N.)
2 Nanotechnology National Laboratory for Agriculture, Embrapa Instrumentação, São Carlos 13560-970,Brazil; [email protected] (A.C.T.); [email protected] (L.H.C.M.)
3 Department of Chemistry, Federal University of Lavras, Lavras 37200-000, Brazil;[email protected]
4 Food Engineering Department, Federal University of Ceara, Fortaleza 60356-000, Brazil;[email protected]
5 Packaging Laboratory, Embrapa Agroindustria Tropical, Fortaleza 60511-110, Brazil;[email protected]
6 Department of Engineering, Federal University of Lavras, Lavras 37200-000, Brazil* Correspondence: [email protected]
Received: 20 October 2019; Accepted: 7 January 2020; Published: 11 January 2020�����������������
Abstract: Colorimetric sensors developed by the solution blow spinning (SBS) technique have a rapidresponse to a variation in different physicochemical properties. In this study, polystyrene nanofibrous(PSNF) mats containing the bromothymol blue (BTB) indicator were obtained by SBS for the pHsensing of wine sample. The incorporation of the indicator did not promote changes in fiber diameterbut led to the appearance of beads, allowing for the encapsulation of BTB. The halochromic propertyof BTB was retained in the PSNF material, and the migration tests showed that the indicator matspresented values below the maximum acceptable limit (10 mg dm−2) established by EU CommissionRegulation No. 10/2011 for foods with an alcohol content up to 20%. The present study opensthe possibility of applying nanostructured materials to innovative food packaging which, throughnanosensory zones, change color as a function of the food pH.
Keywords: nanofiber; sensor; smart packaging
1. Introduction
The engineering of nanostructured materials has played an important role in the development oftechniques designed to obtain nanomaterials with great potential for application in biomedicine [1],civil construction [2], cosmetics [3], and agribusiness [4] among others. In particular, the food industryhas benefited from technologies involving nanomaterials [5,6], including the development of activeand intelligent packaging [7,8] that has been commercially adopted as a solution for quality controland the shelf-life extension of foods [7,9] and beverages [10], for example, sensible to changes in thepH of aqueous media [11] and vapor [12].
Intelligent packaging incorporates devices that are able to monitor, in real time, the quality ofthe food and/or the packaging itself through responses to chemical changes, such as variations inpH [7,13,14], CO2 production [15], food freshness [16], or a time–temperature indicator [17], amongothers. This set of chemical modifications can be evaluated by the appropriate use of polymernanomaterials in the construction of sensors. However, to generate polymer nanomaterials with
Sensors 2020, 20, 417; doi:10.3390/s20020417 www.mdpi.com/journal/sensors
Sensors 2020, 20, 417 2 of 16
specific properties amenable to intelligent packaging, techniques are needed that can accuratelymodulate the structure, size and composition of materials on a nanometric scale and allow their properinteraction/mixing.
The use of colorimetric sensors is one of the most basic and convenient analytical techniques,being easy and low-cost [18]. The technique allows to identify changes in the surrounding environmentwithout requiring sophisticated equipment and trained manipulators [19]. The basis of colorimetricdetection is the analysis of the color change caused by the generation of colored compounds(chromophore) from the reaction between the chromogenic reagent and the analyte [18,19].
Among several advantages, colorimetric sensors are attractive and are used for identification ofanalytes in different areas [20], such as detecting ammonia in aqueous solution or in a gas phase [19], ureain biological solutions [21], biochemical changes in sweat [22], conformational changes in proteins [18],volatile amines released during the deteriorating state of fish [23], ferric ions [24], and discriminationagainst organophosphate pesticides [25].
Polymer filaments can be produced in two ways by electrospinning (ES) and solution blowspinning (SBS). From these methods, it is possible to obtain fibers of the sub-, micro-, and nanometricscale [26]. However, the ES technique requires the use of high voltage, the use of solvents with mediumdielectric properties and has a small-scale production [27,28]. In contrast, the SBS method is consideredsafe, low cost and has a high production rate, significantly higher than electrospinning [26,29,30].
In the context of polymer nanomaterials, the SBS technique is considered an innovation inobtaining versatile one-dimensional nanomaterials, especially nanofibers. In this technique, two parallelconcentric fluid streams: (i) a polymer solution formed by a volatile solvent; and (ii) a pressurizedgas (O2 or N2) move in a concentric and parallel manner [29,31]. When the solvent evaporates,the nanometric fibers are formed. This type of nanomaterial can exhibit a large surface area anda high porosity depending on the choice of polymer [32] and solvent, providing a multifunctionalcharacteristic for the application of these nanomaterials as sensors [30].
The majority of the research involving nanofibers has focused on the development of materialsfor areas such as tissue engineering, catalysis and chemical sensors, highlighting mainly the useof the ES technique [33–35]. In the food area, such applications are still considered innovative,particularly the immobilization of indicator substances in nanofibers that can lead to the developmentof halochromic sensors. Agarwal et al. [27], for example, showed that the incorporation of differentcombinations of indicator dyes (methyl red, bromocresol green, bromothymol blue (BTB), phenol redand phenolphthalein) in the formation of nylon-6 fibers by ES did not modify the fiber morphologynor the halochromic profile of the indicator. Schoolaert et al. [36] obtained colorimetric sensors fromelectrospun nanofibers of a polymer blend (polycaprolactone/chitosan) incorporated with methyl redand rose bengal. The nanofibrous mats quickly responded to the pH change. More recently, the SBStechnique has been utilized for the development of indicator nanofibers. Khattab et al. [11] developeda mat with a reversible halochromic potential; the mat was formed with polyacrylonitrile (PAN) andtricyanofuran-hydrazone (TCF-H) via the SBS technique, yielding a sensitivity to modifications inthe medium (vapor or aqueous) pH. The authors proposed the use of the PAN-TCF-H halochromicnanofibrous sensor for the detection of amines and ammonia. Studies such as this open the door forapplications of intelligent packaging, given that biogenic amines (histamine, cadaverine, tyramine andtryptamine) can promote food poisoning [37].
In the present study, the SBS technique was used to obtain polystyrene (PS) halochromic nanofibersintegrated with the BTB indicator. The PS/BTB nanofibrous mats were investigated with respect to fibermorphology, indicator migration (dye leaching process) in aqueous media and halochromic behaviorin aqueous media at different pH and exposed to acid vapors in red wine samples.
Sensors 2020, 20, 417 3 of 16
2. Experimental
2.1. Materials
Polystyrene (PS) with a molar mass of 1.9 × 10⁵ g mol−1 was purchased from Sigma-Aldrich(St. Louis, MO, USA) and used to obtain the nanofibers. Toluene (ACS reagent grade, Labsynth®,São Paulo, SP, Brazil) and acetone p.a. (ACS solventes, LabSynth®,São Paulo, SP, Brazil) were usedas spinning and solubilization indicators, respectively. Bromothymol blue, BTB, (Qhemis, São Paulo,SP, Brazil) was incorporated into the nanofibers to obtain the indicator mats. Phosphoric acid(ACS solventes, Labsynth®, São Paulo, SP, Brazil), monobasic sodium phosphate (Dinâmica Ltd.a.,São Paulo, SP, Brazil), dibasic sodium phosphate (Cromoline Química Fina Ltda., São Paulo, SP, Brazil),anhydrous sodium carbonate (LabSynth®, São Paulo, SP, Brazil), sodium bicarbonate (LabSynth®,São Paulo, SP, Brazil) and sodium hydroxide (LabSynth®, São Paulo, SP, Brazil) were used in thepreparation of buffer solutions and for pH adjustments. The halochromic profile of the mat wasstudied in the presence of the following acids: glacial acetic acid P.A. (Dinâmica®, São Paulo, SP, Brazil)(AA), hydrochloric acid P.A. (ACS Dinâmica®, São Paulo, SP, Brazil) (HCA) and sulfuric acid P.A.(ACS LabSynth®, São Paulo, SP, Brazil) (SA). For the beverage test, a Merlot dry red wine (12.5% alcoholcontent) obtained from a local supermarket was used.
2.2. Solution Blow Spinning (SBS)
The polystyrene nanofibrous (PSNF) mats and PSNF mats with the pH indicator (PSNF/BTB) wereobtained by the SBS technique. A 30 wt.% PS solution was prepared in toluene, while solutions withdifferent concentrations of BTB (0.05%, 0.1%, and 0.2%, dry weight) were prepared in acetone. The BTBsolution pH was adjusted to 13 with a 1 mol L−1 NaOH solution. All solutions were prepared at roomtemperature (25 ◦C) while stirring at 500 rpm. Next, the PS and BTB solutions were blended at a ratioof 3:1 for subsequent spinning at room temperature (25 ◦C). PS nanofibers with BTB contents of 0.05,0.1 and 0.2%, dry weight was prepared and called PSNF/BTB-0.05, PSNF/BTB-0.1, and PSNF/BTB-0.2,respectively. Control nanofibers (PSNF control) were obtained using the same procedure in the absenceof BTB.
The blow spinning process apparatus is represented in Figure 1A. The process was performed usingan air compressor (Schulz, model 10VL/200-2HP, Santa Catarina, Brazil) with 100 kPa moisture-freegas. In addition, an injection pump (NE-300, New Era Pump Systems, New York, NY, USA) equippedwith a glass syringe (F-5500-A, Ismatec, Wertheim, Germany) was used. The SBS system operatedat an ejection rate of 7 mL h−1 through a 0.5 mm diameter stainless-steel needle. To promote fiberformation during the ejection process, a needle protrusion distance of 0.2 mm was used and a workingdistance of 15 cm (distance between the needle and the rotating collector). The fibers were gathered onthe surface of a collector rotating at 420 rpm for 30 min. Room temperature and relative humidity (RH)were 25 ◦C and RH ≤ 55%, respectively. The samples were placed in a desiccator under vacuum for3 days for prior subsequent analysis.
2.3. Characterization of the Nanofibers
The nanofibrous mats were characterized by Fourier transform infrared (FTIR) spectrophotometryusing a spectrophotometer model Vertex 70 Bruker (Ettlingen, Germany). The spectra were recordedin attenuated total reflectance (ATR) mode, accumulating 32 scans over a spectral range of 4000 to400 cm−1 at a resolution of 4 cm−1. The fiber characterization was performed before and after 24 h ofmaterial immersion in solutions at pH = 2.0, 6.8 and 10.7. In addition to the visual color change of thenanofibrous mat, these pH values were determined through preliminary analyses to serve as referencevalues for evaluating the degradation of various foods.
Scanning electron microscopy (SEM) analyses were performed using a Zeiss DSM 960 (Jena,Germany) microscope. The samples were previously coated with gold using an SCD 050 Bal-Tecsputter coater (Balzers Union AG, Balzers, Liechtenstein). The mean fiber diameters were calculated

Sensors 2020, 20, 417 4 of 16
using ImageJ software (National Institutes of Health, Bethesda, MD, USA), analyzing the morphologyof 100 randomly chosen fibers.
2.4. Study of BTB Migration and Colorimetric Analysis
The migration assays followed the methodology proposed by Agarwal et al. [27] with modificationsto determine the transfer of BTB bound to the PSNF mat to aqueous media after immersion. The assayswere performed by immersing approximately 380 mm2 of PSNF/BTB-0.2 mat in 100 mL of foodsimulator solutions B and C (3% (w/v) AA and 20% (v/v) ethanol, respectively) according to EUCommission Regulation n. No. 10/2011 [38]. The absorbance of the supernatant solutions at 430 nmwas determined in a UV-vis spectrophotometer (model UV-M51, BEL Engineering, Italy). All assayswere performed at steady state at 25 ◦C.
The colorimetric analysis of the PSNF/BTB mats was performed by determining the color spacecoordinates of the system defined by the International Commission on Illumination (CIE), as obtainedusing a Minolta Chromameter CR-400 (Konica Minolta Sensing, Inc., Osaka, Japan). In the CIE colorspace: L*a*b*, L* stands for lightness, a* represents the position between green (negative value) andred (positive value) and b* the position between yellow (positive value) and blue (negative value).In addition, the hue angle (0–360◦) was evaluated to identify and quantify the changes in the color ofthe sensor mat (a visual attribute) and the location of the color on the colorimetric circle. Mat colormeasurements were performed after 24 h of nanomaterial immersion in buffer solutions, and anaverage of ten readings was made for each analysis. The total color difference (∆E) between twoPSNF/BTB samples subjected to the different conditions was calculated by the equation:
∆E =2√[(∆L∗)2 + (∆a∗)2 + (∆b∗)2] (1)
where ∆L* is the difference in lightness between the samples, while ∆a* and ∆b* are the differences inthe red and yellow colors, respectively, between the samples.
2.5. Halochromic Evaluation of PSNF/BTB-0.2 Mats in Wine Samples
The halochromic response of the PSNF/BTB-0.2 mat to acid vapors generated in wine sampleswas evaluated. For that purpose, 10 mL of the wine sample was added to test tubes doped withdifferent acids: acetic acid P.A. (AA), hydrochloric acid P.A. (HCA) and sulfuric acid P.A. (SA) at thefollowing concentrations: 0.0, 1.2, 2.4, 4.8, 7.6 and 10.0 gL−1, according to methodologies adapted fromLozano et al. [39] and Hopfer et al. [40]. Then, a PSNF/BTB-0.2 sensor mat, with a diameter of 1 cm2,was fixed on the inside of each tube lid, which was then closed quickly and left to stand at a temperatureof 25 ◦C. For the liquid-vapor equilibrium to be reached, a time of 30 min was used, as established inthe previous analyses. After 30 min of contact, the mats were removed and immediately analyzed by aMinolta Chromameter CR-400, as described in Section 2.4.
2.6. Sensitivity and Limit of Detection (LOD)
The sensitivity of the nanofiber sensor to determine the presence of acid vapors was determinedby the slope of the analytical curve (α) in the graph of ∆E versus acid concentration. The LOD wascalculated using the following equation [41,42]:
LOD =3× Sbα
(2)
where Sb corresponds to the relative standard deviation of the blank.

Sensors 2020, 20, 417 5 of 16
3. Results and Discussion
3.1. Morphological and Structural Characterization of Nanofibrous Mats
The PSNF mats containing different BTB concentrations, obtained by the SBS technique, are shownin Figure 1.Sensors 2020, 20, x FOR PEER REVIEW 5 of 16
Figure 1. (A) Representation of the solution blow spinning (SBS) system for obtaining fibers: (I)
controlled ejection pump; (II) polymeric solution to be ejected; (III) pressurized gas piping; (IV) gas
pressure gauge; (V) working distance for solvent evaporation; and (VI) rotary collector; (B)
Polystyrene nanofibrous mats with different bromothymol blue concentration (0.05, 0.1 and 0.2%
(w/w)), obtained by SBS technique with collection time of 30 min at room temperature and RH ≤ 55%.
The increase in the BTB concentration in the spinning solution resulted in a visual change in the
color of the nanofibrous mats from white to blue, and for the highest BTB concentration (PSNF/BTB‐
0.2), a higher intensity of the blue color was observed. To evaluate the effect of adding the indicator
on the morphological profile of PSNF mats, SEM micrographs in the absence and presence of BTB
were obtained, and the respective mean diameters were calculated, as shown in Figure 2.
Figure 1. (A) Representation of the solution blow spinning (SBS) system for obtaining fibers:(I) controlled ejection pump; (II) polymeric solution to be ejected; (III) pressurized gas piping; (IV) gaspressure gauge; (V) working distance for solvent evaporation; and (VI) rotary collector; (B) Polystyrenenanofibrous mats with different bromothymol blue concentration (0.05, 0.1 and 0.2% (w/w)), obtainedby SBS technique with collection time of 30 min at room temperature and RH ≤ 55%.
The increase in the BTB concentration in the spinning solution resulted in a visual change in thecolor of the nanofibrous mats from white to blue, and for the highest BTB concentration (PSNF/BTB-0.2),a higher intensity of the blue color was observed. To evaluate the effect of adding the indicator onthe morphological profile of PSNF mats, SEM micrographs in the absence and presence of BTB wereobtained, and the respective mean diameters were calculated, as shown in Figure 2.
Sensors 2020, 20, 417 6 of 16
Sensors 2020, 20, x FOR PEER REVIEW 6 of 16
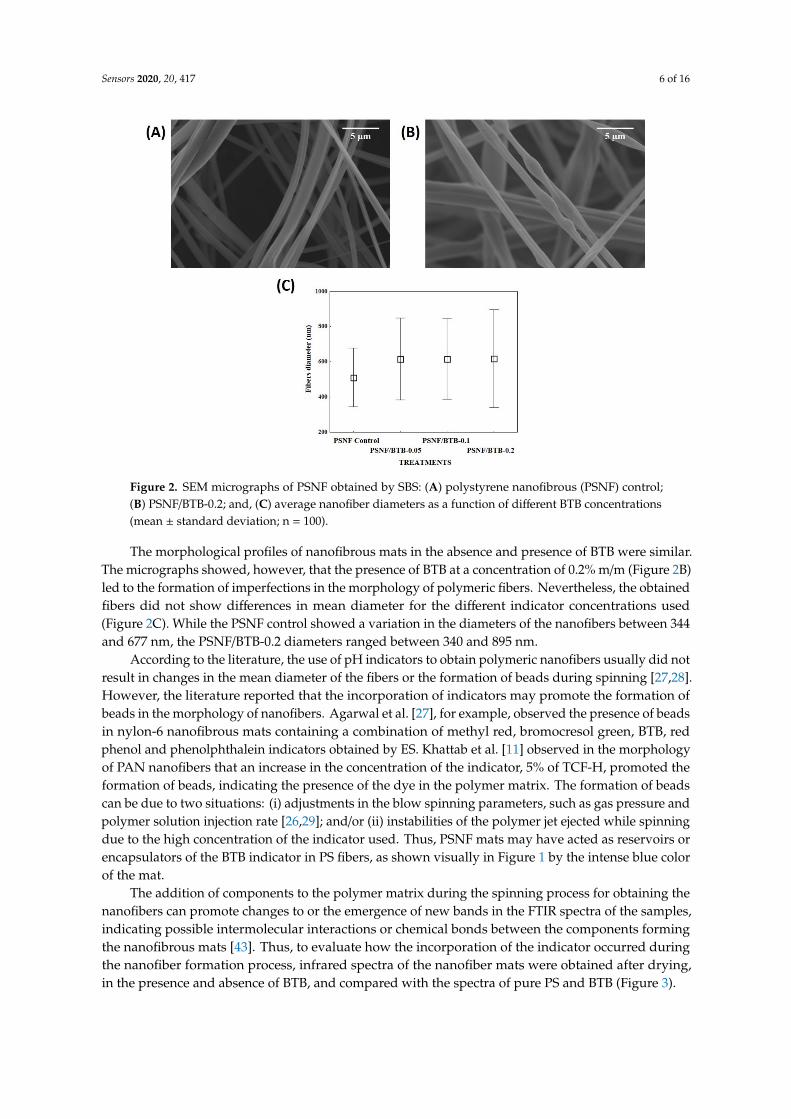
Figure 2. SEM micrographs of PSNF obtained by SBS: (A) polystyrene nanofibrous (PSNF) control;
(B) PSNF/BTB‐0.2; and, (C) average nanofiber diameters as a function of different BTB concentrations
(mean ± standard deviation; n = 100).
The morphological profiles of nanofibrous mats in the absence and presence of BTB were similar.
The micrographs showed, however, that the presence of BTB at a concentration of 0.2% m/m (Figure
2B) led to the formation of imperfections in the morphology of polymeric fibers. Nevertheless, the
obtained fibers did not show differences in mean diameter for the different indicator concentrations
used (Figure 2C). While the PSNF control showed a variation in the diameters of the nanofibers
between 344 and 677 nm, the PSNF/BTB‐0.2 diameters ranged between 340 and 895 nm.
According to the literature, the use of pH indicators to obtain polymeric nanofibers usually did
not result in changes in the mean diameter of the fibers or the formation of beads during spinning
[27,28]. However, the literature reported that the incorporation of indicators may promote the
formation of beads in the morphology of nanofibers. Agarwal et al. [27], for example, observed the
presence of beads in nylon‐6 nanofibrous mats containing a combination of methyl red, bromocresol
green, BTB, red phenol and phenolphthalein indicators obtained by ES. Khattab et al. [11] observed
in the morphology of PAN nanofibers that an increase in the concentration of the indicator, 5% of
TCF‐H, promoted the formation of beads, indicating the presence of the dye in the polymer matrix.
The formation of beads can be due to two situations: (i) adjustments in the blow spinning parameters,
such as gas pressure and polymer solution injection rate [26,29]; and/or (ii) instabilities of the polymer
jet ejected while spinning due to the high concentration of the indicator used. Thus, PSNF mats may
have acted as reservoirs or encapsulators of the BTB indicator in PS fibers, as shown visually in Figure
1 by the intense blue color of the mat.
The addition of components to the polymer matrix during the spinning process for obtaining
the nanofibers can promote changes to or the emergence of new bands in the FTIR spectra of the
samples, indicating possible intermolecular interactions or chemical bonds between the components
forming the nanofibrous mats [43]. Thus, to evaluate how the incorporation of the indicator occurred
during the nanofiber formation process, infrared spectra of the nanofiber mats were obtained after
drying, in the presence and absence of BTB, and compared with the spectra of pure PS and BTB
(Figure 3).
Figure 2. SEM micrographs of PSNF obtained by SBS: (A) polystyrene nanofibrous (PSNF) control;(B) PSNF/BTB-0.2; and, (C) average nanofiber diameters as a function of different BTB concentrations(mean ± standard deviation; n = 100).
The morphological profiles of nanofibrous mats in the absence and presence of BTB were similar.The micrographs showed, however, that the presence of BTB at a concentration of 0.2% m/m (Figure 2B)led to the formation of imperfections in the morphology of polymeric fibers. Nevertheless, the obtainedfibers did not show differences in mean diameter for the different indicator concentrations used(Figure 2C). While the PSNF control showed a variation in the diameters of the nanofibers between 344and 677 nm, the PSNF/BTB-0.2 diameters ranged between 340 and 895 nm.
According to the literature, the use of pH indicators to obtain polymeric nanofibers usually did notresult in changes in the mean diameter of the fibers or the formation of beads during spinning [27,28].However, the literature reported that the incorporation of indicators may promote the formation ofbeads in the morphology of nanofibers. Agarwal et al. [27], for example, observed the presence of beadsin nylon-6 nanofibrous mats containing a combination of methyl red, bromocresol green, BTB, redphenol and phenolphthalein indicators obtained by ES. Khattab et al. [11] observed in the morphologyof PAN nanofibers that an increase in the concentration of the indicator, 5% of TCF-H, promoted theformation of beads, indicating the presence of the dye in the polymer matrix. The formation of beadscan be due to two situations: (i) adjustments in the blow spinning parameters, such as gas pressure andpolymer solution injection rate [26,29]; and/or (ii) instabilities of the polymer jet ejected while spinningdue to the high concentration of the indicator used. Thus, PSNF mats may have acted as reservoirs orencapsulators of the BTB indicator in PS fibers, as shown visually in Figure 1 by the intense blue colorof the mat.
The addition of components to the polymer matrix during the spinning process for obtaining thenanofibers can promote changes to or the emergence of new bands in the FTIR spectra of the samples,indicating possible intermolecular interactions or chemical bonds between the components formingthe nanofibrous mats [43]. Thus, to evaluate how the incorporation of the indicator occurred duringthe nanofiber formation process, infrared spectra of the nanofiber mats were obtained after drying,in the presence and absence of BTB, and compared with the spectra of pure PS and BTB (Figure 3).
Sensors 2020, 20, 417 7 of 16Sensors 2020, 20, x FOR PEER REVIEW 7 of 16
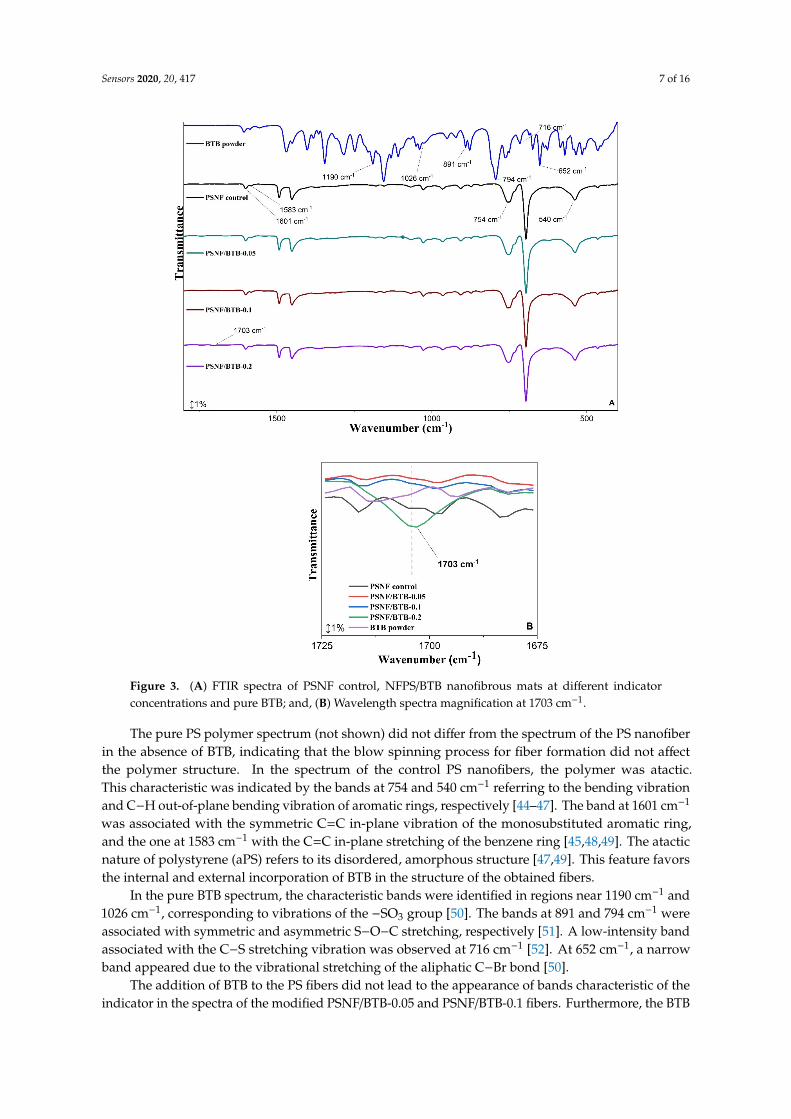
Figure 3. (A) FTIR spectra of PSNF control, NFPS/BTB nanofibrous mats at different indicator
concentrations and pure BTB; and, (B) Wavelength spectra magnification at 1703 cm−1.
The pure PS polymer spectrum (not shown) did not differ from the spectrum of the PS nanofiber
in the absence of BTB, indicating that the blow spinning process for fiber formation did not affect the
polymer structure. In the spectrum of the control PS nanofibers, the polymer was atactic. This
characteristic was indicated by the bands at 754 and 540 cm−1 referring to the bending vibration and
C−H out‐of‐plane bending vibration of aromatic rings, respectively [44–47]. The band at 1601 cm−1
was associated with the symmetric C=C in‐plane vibration of the monosubstituted aromatic ring, and
the one at 1583 cm−1 with the C=C in‐plane stretching of the benzene ring [45,48,49]. The atactic nature
of polystyrene (aPS) refers to its disordered, amorphous structure [47,49]. This feature favors the
internal and external incorporation of BTB in the structure of the obtained fibers.
In the pure BTB spectrum, the characteristic bands were identified in regions near 1190 cm−1 and
1026 cm−1, corresponding to vibrations of the −SO3 group [50]. The bands at 891 and 794 cm−1 were
associated with symmetric and asymmetric S−O−C stretching, respectively [51]. A low‐intensity band
Figure 3. (A) FTIR spectra of PSNF control, NFPS/BTB nanofibrous mats at different indicatorconcentrations and pure BTB; and, (B) Wavelength spectra magnification at 1703 cm−1.
The pure PS polymer spectrum (not shown) did not differ from the spectrum of the PS nanofiberin the absence of BTB, indicating that the blow spinning process for fiber formation did not affectthe polymer structure. In the spectrum of the control PS nanofibers, the polymer was atactic.This characteristic was indicated by the bands at 754 and 540 cm−1 referring to the bending vibrationand C−H out-of-plane bending vibration of aromatic rings, respectively [44–47]. The band at 1601 cm−1
was associated with the symmetric C=C in-plane vibration of the monosubstituted aromatic ring,and the one at 1583 cm−1 with the C=C in-plane stretching of the benzene ring [45,48,49]. The atacticnature of polystyrene (aPS) refers to its disordered, amorphous structure [47,49]. This feature favorsthe internal and external incorporation of BTB in the structure of the obtained fibers.
In the pure BTB spectrum, the characteristic bands were identified in regions near 1190 cm−1 and1026 cm−1, corresponding to vibrations of the −SO3 group [50]. The bands at 891 and 794 cm−1 wereassociated with symmetric and asymmetric S−O−C stretching, respectively [51]. A low-intensity bandassociated with the C−S stretching vibration was observed at 716 cm−1 [52]. At 652 cm−1, a narrowband appeared due to the vibrational stretching of the aliphatic C−Br bond [50].
The addition of BTB to the PS fibers did not lead to the appearance of bands characteristic of theindicator in the spectra of the modified PSNF/BTB-0.05 and PSNF/BTB-0.1 fibers. Furthermore, the BTB

Sensors 2020, 20, 417 8 of 16
incorporation process did not promote a displacement of bands associated with PS in the spectra of themodified fibers compared to those in the spectrum of the control PSNF. This result suggests that theindicator incorporation at the lowest concentrations may have occurred due to weak intermolecularinteractions of London dispersion forces between the hydrophobic groups of the BTB (benzene ringsand the −CH3 groups) and the hydrophobic surface of the polymer [53]. The presence of increasingamounts of one or more components in a sample may make a band in the infrared spectrum moreevident [54]. However, the low concentrations of the indicator used may have resulted in the absenceof bands associated with BTB in the PSNF/BTB-0.05 and PSNF/BTB-0.1 fiber spectra. Khattab et al. [11]also observed that the incorporation of the TCF-H indicator in PAN nanofibrous mats did not leadto the appearance of new spectral bands relative to the mat without the indicator, suggesting thatthere were no chemical reactions during the incorporation process. However, in the PSNF/BTB-0.2spectrum, a new low-intensity band, absent both in the FTIR spectra of the other fibers and in the FTIRspectrum of pure BTB, appeared at 1703 cm−1 (Figure 3B). This band was most likely associated withthe stretching of the C=O group of BTB [52], indicating that the indicator was in its deprotonated form,therefore, providing the blue color to the nanofibrous mat (Figure 1) with potential indicator action forpH sensing.
3.2. Analysis of the PSNF/BTB-0.2 pH Sensing Capacity by Immersion
The variation in the pH of a medium is an important quality indicator of food during storagebecause this parameter signifies the chemical alteration of food due to spoilage reactions [53,55,56].In addition, different types of food may exhibit distinct variations in pH levels during spoilage.For example, low-acidity foods with pH between 4.5 and 7.0 (meat, fish and eggs) exhibit a highmicrobial spoilage activity, while spoilage in high-acidity foods (fruits, vegetables and beverages, suchas wine) is mostly caused by fungal and biochemical activity. In this sense, the PSNF/BTB-0.2 indicatormat was evaluated for its pH sensing capacity in an aqueous medium.
Samples of PSNF/BTB-0.2 were submerged in solutions with pH of 2.0, 6.8 and 10.7. Figure 4shows the visual changes in the mat color, which were quantified by the hue angle. The total colordifference (∆E) between the samples analyzed is shown in Table 1.
Sensors 2020, 20, x FOR PEER REVIEW 8 of 16
associated with the C−S stretching vibration was observed at 716 cm−1 [52]. At 652 cm−1, a narrow band
appeared due to the vibrational stretching of the aliphatic C−Br bond [50].
The addition of BTB to the PS fibers did not lead to the appearance of bands characteristic of the
indicator in the spectra of the modified PSNF/BTB‐0.05 and PSNF/BTB‐0.1 fibers. Furthermore, the
BTB incorporation process did not promote a displacement of bands associated with PS in the spectra
of the modified fibers compared to those in the spectrum of the control PSNF. This result suggests
that the indicator incorporation at the lowest concentrations may have occurred due to weak
intermolecular interactions of London dispersion forces between the hydrophobic groups of the BTB
(benzene rings and the −CH3 groups) and the hydrophobic surface of the polymer [53]. The presence
of increasing amounts of one or more components in a sample may make a band in the infrared
spectrum more evident [54]. However, the low concentrations of the indicator used may have
resulted in the absence of bands associated with BTB in the PSNF/BTB‐0.05 and PSNF/BTB‐0.1 fiber
spectra. Khattab et al. [11] also observed that the incorporation of the TCF‐H indicator in PAN
nanofibrous mats did not lead to the appearance of new spectral bands relative to the mat without
the indicator, suggesting that there were no chemical reactions during the incorporation process.
However, in the PSNF/BTB‐0.2 spectrum, a new low‐intensity band, absent both in the FTIR spectra
of the other fibers and in the FTIR spectrum of pure BTB, appeared at 1703 cm−1 (Figure 3B). This
band was most likely associated with the stretching of the C=O group of BTB [52], indicating that the
indicator was in its deprotonated form, therefore, providing the blue color to the nanofibrous mat
(Figure 1) with potential indicator action for pH sensing.
3.2. Analysis of the PSNF/BTB‐0.2 pH Sensing Capacity by Immersion
The variation in the pH of a medium is an important quality indicator of food during storage
because this parameter signifies the chemical alteration of food due to spoilage reactions [53,55,56].
In addition, different types of food may exhibit distinct variations in pH levels during spoilage. For
example, low‐acidity foods with pH between 4.5 and 7.0 (meat, fish and eggs) exhibit a high microbial
spoilage activity, while spoilage in high‐acidity foods (fruits, vegetables and beverages, such as wine)
is mostly caused by fungal and biochemical activity. In this sense, the PSNF/BTB‐0.2 indicator mat
was evaluated for its pH sensing capacity in an aqueous medium.
Samples of PSNF/BTB‐0.2 were submerged in solutions with pH of 2.0, 6.8 and 10.7. Figure 4
shows the visual changes in the mat color, which were quantified by the hue angle. The total color
difference (ΔE) between the samples analyzed is shown in Table 1.
Figure 4. PSNF/BTB-0.2 mats obtained by SBS submerged for 24 h in buffer solutions with different pHvalues: (A) PSNF/BTB-0.2 (reference), without submerging, buffer solutions with pH (B) 2.0, (C) 6.8and (D) 10.7. Hue angle values are indicated for each condition evaluated.
Sensors 2020, 20, 417 9 of 16
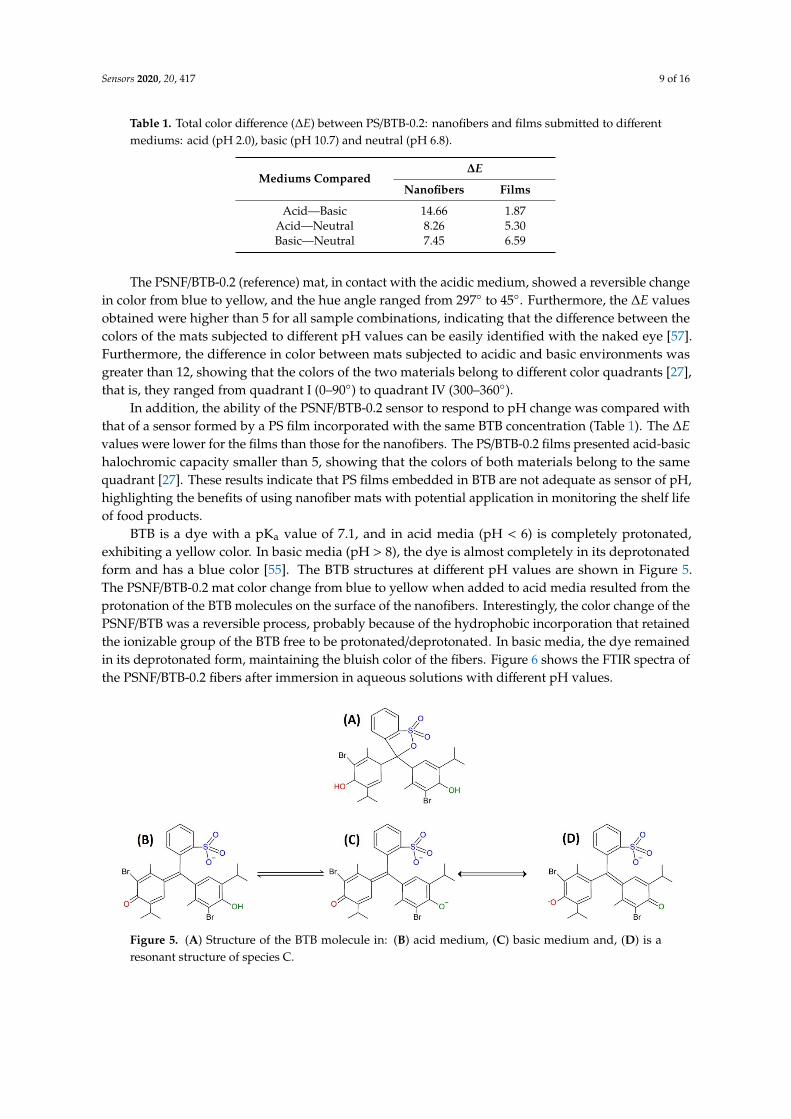
Table 1. Total color difference (∆E) between PS/BTB-0.2: nanofibers and films submitted to differentmediums: acid (pH 2.0), basic (pH 10.7) and neutral (pH 6.8).
Mediums Compared∆E
Nanofibers Films
Acid—Basic 14.66 1.87Acid—Neutral 8.26 5.30Basic—Neutral 7.45 6.59
The PSNF/BTB-0.2 (reference) mat, in contact with the acidic medium, showed a reversible changein color from blue to yellow, and the hue angle ranged from 297◦ to 45◦. Furthermore, the ∆E valuesobtained were higher than 5 for all sample combinations, indicating that the difference between thecolors of the mats subjected to different pH values can be easily identified with the naked eye [57].Furthermore, the difference in color between mats subjected to acidic and basic environments wasgreater than 12, showing that the colors of the two materials belong to different color quadrants [27],that is, they ranged from quadrant I (0–90◦) to quadrant IV (300–360◦).
In addition, the ability of the PSNF/BTB-0.2 sensor to respond to pH change was compared withthat of a sensor formed by a PS film incorporated with the same BTB concentration (Table 1). The ∆Evalues were lower for the films than those for the nanofibers. The PS/BTB-0.2 films presented acid-basichalochromic capacity smaller than 5, showing that the colors of both materials belong to the samequadrant [27]. These results indicate that PS films embedded in BTB are not adequate as sensor of pH,highlighting the benefits of using nanofiber mats with potential application in monitoring the shelf lifeof food products.
BTB is a dye with a pKa value of 7.1, and in acid media (pH < 6) is completely protonated,exhibiting a yellow color. In basic media (pH > 8), the dye is almost completely in its deprotonatedform and has a blue color [55]. The BTB structures at different pH values are shown in Figure 5.The PSNF/BTB-0.2 mat color change from blue to yellow when added to acid media resulted from theprotonation of the BTB molecules on the surface of the nanofibers. Interestingly, the color change of thePSNF/BTB was a reversible process, probably because of the hydrophobic incorporation that retainedthe ionizable group of the BTB free to be protonated/deprotonated. In basic media, the dye remainedin its deprotonated form, maintaining the bluish color of the fibers. Figure 6 shows the FTIR spectra ofthe PSNF/BTB-0.2 fibers after immersion in aqueous solutions with different pH values.
Sensors 2020, 20, x FOR PEER REVIEW 9 of 16
Figure 4. PSNF/BTB‐0.2 mats obtained by SBS submerged for 24 h in buffer solutions with different
pH values: (A) PSNF/BTB‐0.2 (reference), without submerging, buffer solutions with pH (B) 2.0, (C)
6.8 and (D) 10.7. Hue angle values are indicated for each condition evaluated.
Table 1. Total color difference (ΔE) between PS/BTB‐0.2: nanofibers and films submitted to different
mediums: acid (pH 2.0), basic (pH 10.7) and neutral (pH 6.8).
Mediums Compared ΔE
Nanofibers Films
Acid—Basic 14.66 1.87
Acid—Neutral 8.26 5.30
Basic—Neutral 7.45 6.59
The PSNF/BTB‐0.2 (reference) mat, in contact with the acidic medium, showed a reversible
change in color from blue to yellow, and the hue angle ranged from 297° to 45°. Furthermore, the ΔE
values obtained were higher than 5 for all sample combinations, indicating that the difference
between the colors of the mats subjected to different pH values can be easily identified with the naked
eye [57]. Furthermore, the difference in color between mats subjected to acidic and basic
environments was greater than 12, showing that the colors of the two materials belong to different
color quadrants [27], that is, they ranged from quadrant I (0–90°) to quadrant IV (300–360°).
In addition, the ability of the PSNF/BTB‐0.2 sensor to respond to pH change was compared with
that of a sensor formed by a PS film incorporated with the same BTB concentration (Table 1). The ΔE
values were lower for the films than those for the nanofibers. The PS/BTB‐0.2 films presented acid‐
basic halochromic capacity smaller than 5, showing that the colors of both materials belong to the
same quadrant [27]. These results indicate that PS films embedded in BTB are not adequate as sensor
of pH, highlighting the benefits of using nanofiber mats with potential application in monitoring the
shelf life of food products.
BTB is a dye with a pKa value of 7.1, and in acid media (pH < 6) is completely protonated,
exhibiting a yellow color. In basic media (pH > 8), the dye is almost completely in its deprotonated
form and has a blue color [55]. The BTB structures at different pH values are shown in Figure 5. The
PSNF/BTB‐0.2 mat color change from blue to yellow when added to acid media resulted from the
protonation of the BTB molecules on the surface of the nanofibers. Interestingly, the color change of
the PSNF/BTB was a reversible process, probably because of the hydrophobic incorporation that
retained the ionizable group of the BTB free to be protonated/deprotonated. In basic media, the dye
remained in its deprotonated form, maintaining the bluish color of the fibers. Figure 6 shows the FTIR
spectra of the PSNF/BTB‐0.2 fibers after immersion in aqueous solutions with different pH values.
Figure 5. (A) Structure of the BTB molecule in: (B) acid medium, (C) basic medium and, (D) is a
resonant structure of species C. Figure 5. (A) Structure of the BTB molecule in: (B) acid medium, (C) basic medium and, (D) is aresonant structure of species C.

Sensors 2020, 20, 417 10 of 16
Sensors 2020, 20, x FOR PEER REVIEW 10 of 16
Figure 6. PSNF/BTB‐0.2 infrared spectrum (reference) before and after 24 h immersion in pH 2.0, 6.8
and 10.7 solutions. The nanofibrous mats were dried in desiccated for 48 h.
The immersion of the PSNF/BTB‐0.2 mat in the different aqueous media (regardless of the pH)
led to the disappearance of some bands in the FTIR spectra including the band at 1703 cm−1, related
to C=O stretching [52], and the bands between 900–700 cm−1, associated with the symmetric S−O−C
(thioester) vibrational stretching of BTB [52,58,59]. Most likely, immersion in aqueous media led to
the breakage of the O−C bond of the thioester (structure A in Figure 5) induced by the deprotonation
of the hydroxyl group, leading to the disappearance of the band at 729 cm−1. This result may have
been caused by changes in the structure of the indicator due to protonation/deprotonation of the
sulfonate and phenyl groups [55].
Despite the important changes observed in the FTIR spectra of the PSNF/BTB‐0.2 mat after
immersion in aqueous media with different pH values, the disappearance of some bands could be
associated with the migration of the indicator from the fibers to the solution, reducing the
concentration of the BTB in the indicator mat and making it undetectable in the FTIR spectrum. At
the same time, this phenomenon of migration has great importance in determining the application of
indicator mats with foods. Thus, the migration of BTB from the PSNF/BTB‐0.2 mats was evaluated in
food simulation media as a function of time, and the results are shown in Figure 7.
Figure 6. PSNF/BTB-0.2 infrared spectrum (reference) before and after 24 h immersion in pH 2.0, 6.8and 10.7 solutions. The nanofibrous mats were dried in desiccated for 48 h.
The immersion of the PSNF/BTB-0.2 mat in the different aqueous media (regardless of the pH) ledto the disappearance of some bands in the FTIR spectra including the band at 1703 cm−1, related toC=O stretching [52], and the bands between 900–700 cm−1, associated with the symmetric S−O−C(thioester) vibrational stretching of BTB [52,58,59]. Most likely, immersion in aqueous media led to thebreakage of the O−C bond of the thioester (structure A in Figure 5) induced by the deprotonation ofthe hydroxyl group, leading to the disappearance of the band at 729 cm−1. This result may have beencaused by changes in the structure of the indicator due to protonation/deprotonation of the sulfonateand phenyl groups [55].
Despite the important changes observed in the FTIR spectra of the PSNF/BTB-0.2 mat afterimmersion in aqueous media with different pH values, the disappearance of some bands could beassociated with the migration of the indicator from the fibers to the solution, reducing the concentrationof the BTB in the indicator mat and making it undetectable in the FTIR spectrum. At the same time,this phenomenon of migration has great importance in determining the application of indicator matswith foods. Thus, the migration of BTB from the PSNF/BTB-0.2 mats was evaluated in food simulationmedia as a function of time, and the results are shown in Figure 7.
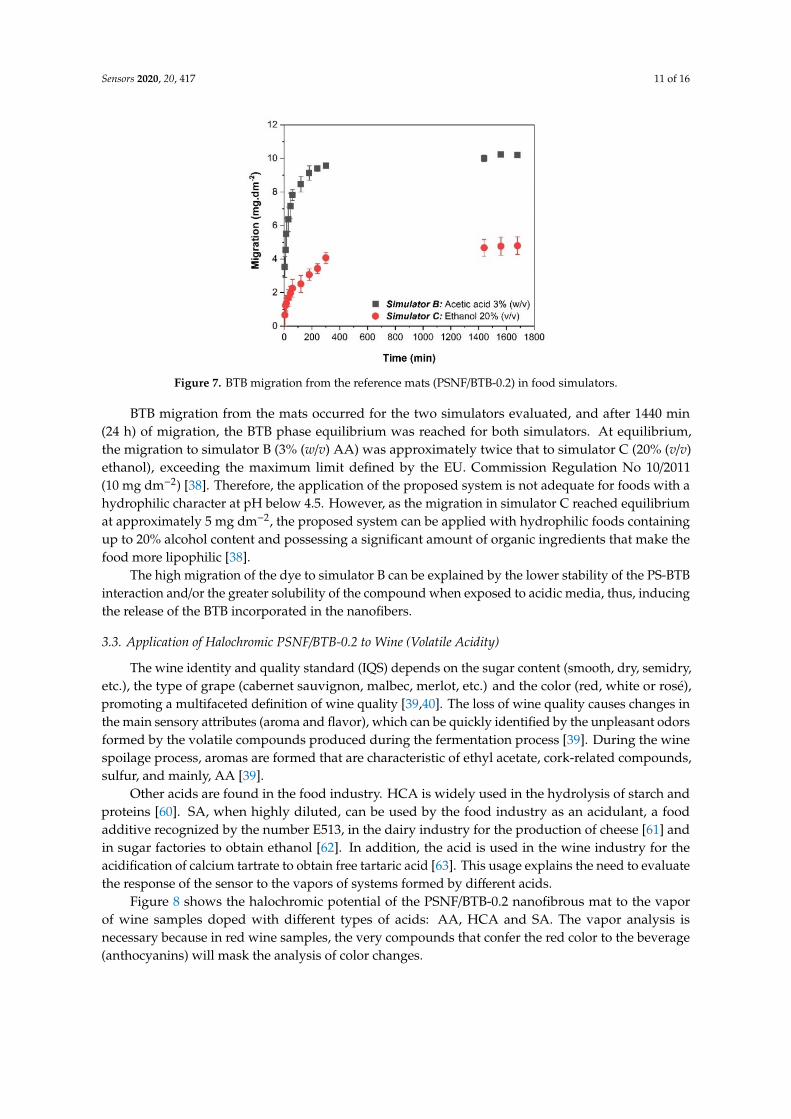
Sensors 2020, 20, 417 11 of 16Sensors 2020, 20, x FOR PEER REVIEW 11 of 16
Figure 7. BTB migration from the reference mats (PSNF/BTB‐0.2) in food simulators.
BTB migration from the mats occurred for the two simulators evaluated, and after 1440 min (24
h) of migration, the BTB phase equilibrium was reached for both simulators. At equilibrium, the
migration to simulator B (3% (w/v) AA) was approximately twice that to simulator C (20% (v/v)
ethanol), exceeding the maximum limit defined by the EU. Commission Regulation No 10/2011 (10
mg dm−2) [38]. Therefore, the application of the proposed system is not adequate for foods with a
hydrophilic character at pH below 4.5. However, as the migration in simulator C reached equilibrium
at approximately 5 mg dm−2, the proposed system can be applied with hydrophilic foods containing
up to 20% alcohol content and possessing a significant amount of organic ingredients that make the
food more lipophilic [38].
The high migration of the dye to simulator B can be explained by the lower stability of the PS‐
BTB interaction and/or the greater solubility of the compound when exposed to acidic media, thus,
inducing the release of the BTB incorporated in the nanofibers.
3.3. Application of Halochromic PSNF/BTB‐0.2 to Wine (Volatile Acidity)
The wine identity and quality standard (IQS) depends on the sugar content (smooth, dry,
semidry, etc.), the type of grape (cabernet sauvignon, malbec, merlot, etc.) and the color (red, white
or rosé), promoting a multifaceted definition of wine quality [39,40]. The loss of wine quality causes
changes in the main sensory attributes (aroma and flavor), which can be quickly identified by the
unpleasant odors formed by the volatile compounds produced during the fermentation process [39].
During the wine spoilage process, aromas are formed that are characteristic of ethyl acetate, cork‐
related compounds, sulfur, and mainly, AA [39].
Other acids are found in the food industry. HCA is widely used in the hydrolysis of starch and
proteins [60]. SA, when highly diluted, can be used by the food industry as an acidulant, a food
additive recognized by the number E513, in the dairy industry for the production of cheese [61] and
in sugar factories to obtain ethanol [62]. In addition, the acid is used in the wine industry for the
acidification of calcium tartrate to obtain free tartaric acid [63]. This usage explains the need to
evaluate the response of the sensor to the vapors of systems formed by different acids.
Figure 8 shows the halochromic potential of the PSNF/BTB‐0.2 nanofibrous mat to the vapor of
wine samples doped with different types of acids: AA, HCA and SA. The vapor analysis is necessary
because in red wine samples, the very compounds that confer the red color to the beverage
(anthocyanins) will mask the analysis of color changes.
Figure 7. BTB migration from the reference mats (PSNF/BTB-0.2) in food simulators.
BTB migration from the mats occurred for the two simulators evaluated, and after 1440 min(24 h) of migration, the BTB phase equilibrium was reached for both simulators. At equilibrium,the migration to simulator B (3% (w/v) AA) was approximately twice that to simulator C (20% (v/v)ethanol), exceeding the maximum limit defined by the EU. Commission Regulation No 10/2011(10 mg dm−2) [38]. Therefore, the application of the proposed system is not adequate for foods with ahydrophilic character at pH below 4.5. However, as the migration in simulator C reached equilibriumat approximately 5 mg dm−2, the proposed system can be applied with hydrophilic foods containingup to 20% alcohol content and possessing a significant amount of organic ingredients that make thefood more lipophilic [38].
The high migration of the dye to simulator B can be explained by the lower stability of the PS-BTBinteraction and/or the greater solubility of the compound when exposed to acidic media, thus, inducingthe release of the BTB incorporated in the nanofibers.
3.3. Application of Halochromic PSNF/BTB-0.2 to Wine (Volatile Acidity)
The wine identity and quality standard (IQS) depends on the sugar content (smooth, dry, semidry,etc.), the type of grape (cabernet sauvignon, malbec, merlot, etc.) and the color (red, white or rosé),promoting a multifaceted definition of wine quality [39,40]. The loss of wine quality causes changes inthe main sensory attributes (aroma and flavor), which can be quickly identified by the unpleasant odorsformed by the volatile compounds produced during the fermentation process [39]. During the winespoilage process, aromas are formed that are characteristic of ethyl acetate, cork-related compounds,sulfur, and mainly, AA [39].
Other acids are found in the food industry. HCA is widely used in the hydrolysis of starch andproteins [60]. SA, when highly diluted, can be used by the food industry as an acidulant, a foodadditive recognized by the number E513, in the dairy industry for the production of cheese [61] andin sugar factories to obtain ethanol [62]. In addition, the acid is used in the wine industry for theacidification of calcium tartrate to obtain free tartaric acid [63]. This usage explains the need to evaluatethe response of the sensor to the vapors of systems formed by different acids.
Figure 8 shows the halochromic potential of the PSNF/BTB-0.2 nanofibrous mat to the vaporof wine samples doped with different types of acids: AA, HCA and SA. The vapor analysis isnecessary because in red wine samples, the very compounds that confer the red color to the beverage(anthocyanins) will mask the analysis of color changes.

Sensors 2020, 20, 417 12 of 16Sensors 2020, 20, x FOR PEER REVIEW 12 of 16
Figure 8. Colour variation (∆E) of PSNF/BTB‐0.2 nanofibers mats subjected to acid vapors produced
in doped wine samples with different acid concentrations (0, 1.2, 2.4, 4.8, 7.6 and 10.0 g L−1): (A) acetic
acid, (B) hydrochloric acid and, (C) sulfuric acid, after 30 min of liquid‐vapor equilibrium.
The results show a high sensitivity of the nanofiber mat to the volatile acid compounds of the
sample, indicating a color change from blue to yellow. This color change can be explained by the
acid‐base equilibrium discussed in Section 3.2 being displaced by the action of volatile acids on the
indicator material encapsulated in the nanofibers.
The response of the sensor showed a better linearity for AA than for the inorganic acids.
Furthermore, the sensitivity to AA vapors (11.20 L g−1) was greater than that observed for CA, and
SA, with 4.79 and 3.79 L g−1, respectively. The LODs of the components were calculated, obtaining
values of 0.53, 1.24 and 1.60 g L−1. Most likely, the method of detection used in our methodology, i.e.,
through contact between the mat and the vapor generated by the sample, favored the sensing of AA.
This conclusion is due to AA being a volatile acid, unlike the others that have low vapor pressures
when in aqueous solution. Most likely, in the case of inorganic acids, there was protonation of the
most volatile wine compounds, which interacted with the fibers.
Mat color changes were observed by the naked eye at AA concentrations higher than 1.2 g L−1
(Figure 8A). The hue angle of the PSNF/BTB‐0.2 (reference) mat changed from 300° (blue color) to a
range from 82° to 95° (yellow color). For the analysis of volatile acids in the system formed with HCA
(Figure 8B), the color change began at a concentration of 1.2 g L−1, with eventual changes from blue
(300°) to a yellow range of 68° to 87° for the hue angle. For doping with SA (Figure 8C), the change
in color was only perceptible at values greater than 4.8 g L−1, and the angle ranged from 81° to 89° for
yellow.
According to the FAO (Food Administration and Organization of the United Nations) in
collaboration with FAO’s Rural Infrastructure and Agro‐Industries Division, wine quality is
measured by chemical analysis, including the volatile acid content [64], which should be lower than
1.1 g L−1 for wines [64]. According to Brazilian law, table wines, fine wines, and noble wines may
have up to 1.2 g L−1 of volatile acidity [65].
Figure 8. Colour variation (∆E) of PSNF/BTB-0.2 nanofibers mats subjected to acid vapors produced indoped wine samples with different acid concentrations (0, 1.2, 2.4, 4.8, 7.6 and 10.0 g L−1): (A) aceticacid, (B) hydrochloric acid and, (C) sulfuric acid, after 30 min of liquid-vapor equilibrium.
The results show a high sensitivity of the nanofiber mat to the volatile acid compounds of thesample, indicating a color change from blue to yellow. This color change can be explained by theacid-base equilibrium discussed in Section 3.2 being displaced by the action of volatile acids on theindicator material encapsulated in the nanofibers.
The response of the sensor showed a better linearity for AA than for the inorganic acids.Furthermore, the sensitivity to AA vapors (11.20 L g−1) was greater than that observed for CA, andSA, with 4.79 and 3.79 L g−1, respectively. The LODs of the components were calculated, obtainingvalues of 0.53, 1.24 and 1.60 g L−1. Most likely, the method of detection used in our methodology,i.e., through contact between the mat and the vapor generated by the sample, favored the sensing ofAA. This conclusion is due to AA being a volatile acid, unlike the others that have low vapor pressureswhen in aqueous solution. Most likely, in the case of inorganic acids, there was protonation of the mostvolatile wine compounds, which interacted with the fibers.
Mat color changes were observed by the naked eye at AA concentrations higher than 1.2 g L−1
(Figure 8A). The hue angle of the PSNF/BTB-0.2 (reference) mat changed from 300◦ (blue color) to arange from 82◦ to 95◦ (yellow color). For the analysis of volatile acids in the system formed with HCA(Figure 8B), the color change began at a concentration of 1.2 g L−1, with eventual changes from blue(300◦) to a yellow range of 68◦ to 87◦ for the hue angle. For doping with SA (Figure 8C), the changein color was only perceptible at values greater than 4.8 g L−1, and the angle ranged from 81◦ to 89◦
for yellow.According to the FAO (Food Administration and Organization of the United Nations) in
collaboration with FAO’s Rural Infrastructure and Agro-Industries Division, wine quality is measuredby chemical analysis, including the volatile acid content [64], which should be lower than 1.1 g L−1
for wines [64]. According to Brazilian law, table wines, fine wines, and noble wines may have up to1.2 g L−1 of volatile acidity [65].

Sensors 2020, 20, 417 13 of 16
The material developed in this study demonstrates potential for use as a wine quality indicatorthrough the color change and color intensity (hue angle) of a nanofibrous mat. The hue angle rangedfrom 341◦ (blue color) in the control mat to 82◦ (reference mat subjected to an AA concentration of1.2 g L−1), increasing to 95◦ (reference mat subjected to an AA concentration of 10.0 g L−1).
4. Conclusions
The incorporation of the BTB pH indicator in PS nanofibers by the SBS technique was performedsuccessfully. In this context, the SBS technique can be considered easy to use for the development ofsmart nanomaterials with staggered production profiles. The obtained smart nanofibers showed avisual sensitivity to changes in pH in aqueous and vapor media. The incorporation of BTB into thePS fibers did not promote intense modifications to the morphology of the nanofibers but led to theformation of beads that promoted the encapsulation of the dye. The mean PS fiber diameters showedno significant difference, regardless of the BTB concentration used. The migratory potential of thePSNF/BTB-0.2 was considered high for foods with pH < 4.5, but the values obtained in this study werewithin the limit established by law, especially for beverages with up to 20% alcohol content. Finally,the halochromic potential of the nanofibrous mat was correlated with a rapid chromatic responseto red wine vapor, promoting a change in the color of the nanofibers due to the presence of volatileacids in the beverage. These results suggest that the PSNF/BTB-0.2 nanofibrous mats can be usedas a nanomaterial sensor for multiple applications dealing with evaluation by direct surface contactor by indirect contact, e.g., through the measurement of volatile acids in the control of wine quality.This advancement opens a door for the use of halophytic nanofiber mats in intelligent packaging asquality sensors for food and beverage products that generate acid products during the spoilage stage.
Author Contributions: Conceptualization, L.H.C.M. and J.E.O.; Data curation, K.W.E.M., A.C.T. and C.V.L.N.;Formal analysis, K.W.E.M. and C.V.L.N.; Funding acquisition, L.H.C.M. and J.E.O.; Investigation, K.W.E.M.,C.V.L.N. and M.M.F.; Methodology, K.W.E.M., C.V.L.N., A.C.T., G.M.D.F., M.M.F., M.D.S.R.B., L.H.C.M. and J.E.O.;Project administration, K.W.E.M. and J.E.O.; Resources, L.H.C.M. and M.D.S.R.B.; Supervision, M.D.S.R.B., A.C.T.,L.H.C.M. and J.E.O.; Validation, G.M.D.F. and J.E.O.; Visualization, K.W.E.M. and J.E.O.; Writing—original draft,K.W.E.M. and C.V.L.N.; Writing—review & editing, G.M.D.F. and J.E.O. All authors have read and agreed to thepublished version of the manuscript.
Funding: This work was financially supported by FAPEMIG (Grant Number: APQ-01505-15,APQ-00906-17), CNPq (402287/2013-4, 302044/2015-9, 403357/2016-0, 302469/2018-4), MCTI-SisNano, CAPES,FINEP, Nanotechnology National Laboratory for Agriculture, EMBRAPA Instrumentação and EMBRAPAAgroindustria Tropical.
Conflicts of Interest: The authors declare no conflicts of interest.
References
1. Haque, F.; Pi, F.; Zhao, Z.; Gu, S.; Hu, H.; Yu, H.; Guo, P. RNA versatility, flexibility, and thermostability forpractice in RNA nanotechnology and biomedical applications. Wiley Interdiscip. Rev. RNA 2017, 9, e1452.[CrossRef] [PubMed]
2. De Azevedo, N.H.; Gleize, P.J.P. Effect of silicon carbide nanowhiskers on hydration and mechanicalproperties of a Portland cement paste. Constr. Build. Mater. 2018, 169, 388–395. [CrossRef]
3. Barbieux, D.; Padula, A.D. Paths and Challenges of New Technologies: The Case of Nanotechnology-BasedCosmetics Development in Brazil. Adm. Sci. 2018, 8, 16. [CrossRef]
4. Scott, N.R.; Chen, H.; Cui, H. Nanotechnology Applications and Implications of Agrochemicals towardSustainable Agriculture and Food Systems. J. Agric. Food Chem. 2018, 66, 6451–6456. [CrossRef] [PubMed]
5. Yu, H.; Park, J.-Y.; Kwon, C.W.; Hong, S.-C.; Park, K.-M.; Chang, P.-S. An Overview of Nanotechnologyin Food Science: Preparative Methods, Practical Applications, and Safety. J. Chem. 2018, 2018, 5427978.[CrossRef]
6. Ramachandraiah, K.; Han, S.G.; Chin, K.B. Nanotechnology in Meat Processing and Packaging: PotentialApplications—A Review. Asian-Australas. J. Anim. Sci. 2015, 28, 290–302. [CrossRef] [PubMed]
7. Janjarasskul, T.; Suppakul, P. Active and intelligent packaging: The indication of quality and safety. Crit. Rev.Food Sci. Nutr. 2018, 58, 808–831. [CrossRef] [PubMed]
Sensors 2020, 20, 417 14 of 16
8. Cerqueira, M.A.; Vicente, A.A.; Pastrana, L.M. Nanotechnology in Food Packaging: Opportunitiesand Challenges. In Nanomaterials for Food Packaging; Cerqueira, M.Â.P.R., Lagaron, J.M., PastranaCastro, L.M., de Oliveira Soares Vicente, A.A.M., Eds.; Micro and Nano Technologies; Elsevier: Amsterdam,The Netherlands, 2018; pp. 1–11. ISBN 978-0-323-51271-8.
9. Ai, K.; Liu, Y.; Lu, L. Hydrogen-bonding recognition-induced color change of gold nanoparticles for visualdetection of melamine in raw milk and infant formula. J. Am. Chem. Soc. 2009, 131, 9496–9497. [CrossRef]
10. Cheng, G.; Fa, J.-Q.; Xi, Z.-M.; Zhang, Z.-W.; Cheng, G.; Fa, J.-Q.; Xi, Z.-M.; Zhang, Z.-W. Research on thequality of the wine grapes in corridor area of China. Food Sci. Technol. 2015, 35, 38–44. [CrossRef]
11. Khattab, T.A.; Rehan, M.; Aly, S.A.; Hamouda, T.; Haggag, K.M.; Klapötke, T.M. Fabrication ofPAN-TCF-hydrazone nanofibers by solution blowing spinning technique: Naked-eye colorimetric sensor.J. Environ. Chem. Eng. 2017, 5, 2515–2523. [CrossRef]
12. Golmohammadi Rostami, S.; Sorayani Bafqi, M.S.; Bagherzadeh, R.; Latifi, M.; Gorji, M. Multi-layerelectrospun nanofiber mats with chemical agent sensor function. J. Ind. Text. 2015, 45, 467–480. [CrossRef]
13. Shivakumar, N.; Madhusudan, P.; Kiruba Daniel, S.C.G. Nanomaterials for smart food packaging.In Nanomaterials for Industrial Applications; Micro & Nano Technologies Series; Elsevier: Madrid, Spain, 2018;ISBN 978-0-12-813352-1.
14. Yam, K.L.; Takhistov, P.T.; Miltz, J. Intelligent Packaging: Concepts and Applications. J. Food Sci. 2005, 70,R1–R10. [CrossRef]
15. Puligundla, P.; Jung, J.; Ko, S. Carbon dioxide sensors for intelligent food packaging applications—Review.Food Control 2012, 25, 328–333. [CrossRef]
16. Lee, S.Y.; Lee, S.J.; Choi, D.S.; Hur, S.J. Current topics in active and intelligent food packaging for preservationof fresh foods. J. Sci. Food Agric. 2015, 95, 2799–2810. [CrossRef] [PubMed]
17. Pereira, V.A.; de Arruda, I.N.Q.; Stefani, R. Active chitosan/PVA films with anthocyanins from Brassicaoleraceae (Red Cabbage) as Time–Temperature Indicators for application in intelligent food packaging.Food Hydrocoll. 2015, 43, 180–188. [CrossRef]
18. Mao, J.; Lu, Y.; Chang, N.; Yang, J.; Zhang, S.; Liu, Y. Multidimensional colorimetric sensor array fordiscrimination of proteins. Biosens. Bioelectron. 2016, 86, 56–61. [CrossRef]
19. Khattab, T.A.; Dacrory, S.; Abou-Yousef, H.; Kamel, S. Smart microfibrillated cellulose as swab sponge-likeaerogel for real-time colorimetric naked-eye sweat monitoring. Talanta 2019, 205, 120166. [CrossRef]
20. Skim, J.R.; Suslick, K.S. Hand-Held Reader for Colorimetric Sensor Arrays. Anal. Chem. 2015, 87, 7810–7816.21. Khattab, T.A.; Dacrory, S.; Abou-Yousef, H.; Kamel, S. Development of microporous cellulose-based smart
xerogel reversible sensor via freeze drying for naked-eye detection of ammonia gas. Carbohydr. Polym. 2019,210, 196–203. [CrossRef]
22. Khattab, T.A.; Fouda, M.M.G.; Abdelrahman, M.S.; Othman, S.I.; Bin-Jumah, M.; Alqaraawi, M.A.;Al Fassam, H.; Allam, A.A. Co-encapsulation of enzyme and tricyanofuran hydrazone into alginatemicrocapsules incorporated onto cotton fabric as a biosensor for colorimetric recognition of urea. React. Funct.Polym. 2019, 142, 199–206. [CrossRef]
23. Diaz, Y.J.; Page, Z.A.; Knight, A.S.; Treat, N.J.; Hemmer, J.R.; Hawker, C.J.; Read de Alaniz, J. A Versatile andHighly Selective Colorimetric Sensor for the Detection of Amines. Chemistry A Eur. J. 2017, 23, 3562–3566.[CrossRef] [PubMed]
24. Khattab, T.A.; Fouda, M.M.G.; Allam, A.A.; Othman, S.I.; Bin-Jumah, M.; Al-Harbi, H.M.; Rehan, M. SelectiveColorimetric Detection of Fe (III) Using Metallochromic Tannin-Impregnated Silica Strips. ChemistrySelect2018, 3, 12065–12071. [CrossRef]
25. Fahimi-Kashani, N.; Hormozi-Nezhad, M.R. Gold-Nanoparticle-Based Colorimetric Sensor Array forDiscrimination of Organophosphate Pesticides. Anal. Chem. 2016, 88, 8099–8106. [CrossRef] [PubMed]
26. Benito, J.G.; Teno, J.; Torres, D.; Díaz, M. Solution Blow Spinning and Obtaining Submicrometric Fibers ofDifferent Polymers. Int. J. Nanopart. Nanotechnol. 2017, 3, 1–10. [CrossRef]
27. Agarwal, A.; Raheja, A.; Natarajan, T.S.; Chandra, T.S. Development of universal pH sensing electrospunnanofibers. Sens. Actuators B Chem. 2012, 161, 1097–1101. [CrossRef]
28. Van der Schueren, L.; Mollet, T.; Ceylan, Ö.; De Clerck, K. The development of polyamide 6.6 nanofibreswith a pH-sensitive function by electrospinning. Eur. Polym. J. 2010, 46, 2229–2239. [CrossRef]
Sensors 2020, 20, 417 15 of 16
29. Medeiros, E.S.; Glenn, G.M.; Klamczynski, A.P.; Orts, W.J.; Mattoso, L.H.C. Solution blow spinning: A newmethod to produce micro- and nanofibers from polymer solutions. J. Appl. Polym. Sci. 2009, 113, 2322–2330.[CrossRef]
30. Oliveira, J.E.; Mattoso, L.H.C.; Medeiros, E.S.; Zucolotto, V. Poly(lactic acid)/Carbon Nanotube Fibers asNovel Platforms for Glucose Biosensors. Biosensors 2012, 2, 70–82. [CrossRef]
31. Daristotle, J.L.; Behrens, A.M.; Sandler, A.D.; Kofinas, P. A Review of the Fundamental Principles andApplications of Solution Blow Spinning. ACS Appl. Mater. Interfaces 2016, 8, 34951–34963. [CrossRef]
32. da S. Parize, D.D.; Foschini, M.M.; de Oliveira, J.E.; Klamczynski, A.P.; Glenn, G.M.; Marconcini, J.M.;Mattoso, L.H.C. Solution blow spinning: Parameters optimization and effects on the properties of nanofibersfrom poly(lactic acid)/dimethyl carbonate solutions. J. Mater. Sci. 2016, 51, 4627–4638.
33. Li, Y.; Jiao, M.; Zhao, H.; Yang, M. Humidity sensing properties of the composite of electrospun crosslinkedpolyelectrolyte nanofibers decorated with Ag nanoparticles. Sens. Actuators B Chem. 2018, 273, 133–142.[CrossRef]
34. Hasan, A.; Memic, A.; Annabi, N.; Hossain, M.; Paul, A.; Dokmeci, M.R.; Dehghani, F.; Khademhosseini, A.Electrospun scaffolds for tissue engineering of vascular grafts. Acta Biomater. 2014, 10, 11–25. [CrossRef][PubMed]
35. Formo, E.; Lee, E.; Campbell, D.; Xia, Y. Functionalization of Electrospun TiO2 Nanofibers with PtNanoparticles and Nanowires for Catalytic Applications. Nano Lett. 2008, 8, 668–672. [CrossRef] [PubMed]
36. Schoolaert, E.; Steyaert, I.; Vancoillie, G.; Geltmeyer, J.; Lava, K.; Hoogenboom, R.; Clerck, K.D. Blendelectrospinning of dye-functionalized chitosan and poly(ε-caprolactone): towards biocompatible pH-sensors.J. Mater. Chem. B 2016, 4, 4507–4516. [CrossRef]
37. Silla Santos, M.H. Biogenic amines: Their importance in foods. Int. J. Food Microbiol. 1996, 29, 213–231.[CrossRef]
38. European Comission. Commission Regulation (EU) NO 10/2011 on Plastic Materials and Articles Intendedto Come into Contact with Food. Off. J. Eur. Union 2011, L12, 1–89.
39. Lozano, J.; Álvarez, F.; Santos, J.P.; Horrillo, C. Detection of Acetic Acid in wine by means of an electronicnose. AIP Conf. Proc. 2011, 1362, 176–177.
40. Hopfer, H.; Nelson, J.; Ebeler, S.E.; Heymann, H. Correlating wine quality indicators to chemical and sensorymeasurements. Molecules 2015, 20, 8453–8483. [CrossRef]
41. Loock, H.-P.; Wentzell, P.D. Detection limits of chemical sensors: Applications and misapplications.Sens. Actuators B Chem. 2012, 173, 157–163. [CrossRef]
42. Gimenes, D.T.; dos Santos, W.T.P.; Tormin, T.F.; Munoz, R.A.A.; Richter, E.M. Flow-Injection AmperometricMethod for Indirect Determination of Dopamine in the Presence of a Large Excess of Ascorbic Acid.Electroanalysis 2010, 22, 74–78. [CrossRef]
43. Wu, Y.; Geng, F.; Chang, P.R.; Yu, J.; Ma, X. Effect of agar on the microstructure and performance of potatostarch film. Carbohydr. Polym. 2009, 76, 299–304. [CrossRef]
44. Huan, S.; Liu, G.; Han, G.; Cheng, W.; Fu, Z.; Wu, Q.; Wang, Q. Effect of Experimental Parameters onMorphological, Mechanical and Hydrophobic Properties of Electrospun Polystyrene Fibers. Materials 2015, 8,2718–2734. [CrossRef]
45. Sheiko, S.S.; Vainilovitch, I.S.; Magonov, S.N. FTIR spectroscopy of polymer films under uniaxial stretching.Polym. Bull. 1991, 25, 499–506. [CrossRef]
46. Rodbari, R.J.; Wendelbo, R.; Jamshidi, L.C.L.A.; Hernández, E.P.; Nascimento, L. Study of physical andchemical characterization of nanocomposite polystyrene/graphene oxide high acidity can be applied in thinfilms. J. Chil. Chem. Soc. 2016, 61, 3120–3124. [CrossRef]
47. Nyquist, R.A.; Putzig, C.L.; Leugers, M.A.; McLachlan, R.D.; Thill, B. Comparison of the VibrationalSpectra and Assignments for α-Syndiotactic, β-Syndiotactic, Isotactic, and Atactic Polystyrene and Toluene,Comparison of the Vibrational Spectra and Assignments for α-Syndiotactic, β-Syndiotactic, Isotactic, andAtactic Polystyrene and Toluene. Appl. Spectrosc. 1992, 46, 981–987.
48. Bhutto, A.A.; Vesely, D.; Gabrys, B.J. Miscibility and interactions in polystyrene and sodium sulfonatedpolystyrene with poly(vinyl methyl ether) PVME blends. Part II. FTIR. Polymer 2003, 44, 6627–6631. [CrossRef]
49. Krasovskii, A.N.; Novikov, D.V.; Osmolovskaya, N.A.; Borisova, S.V. ATR IR spectra and structure ofboundary layers of atactic polystyrene. Polym. Sci. Ser. A 2012, 54, 451–458. [CrossRef]

Sensors 2020, 20, 417 16 of 16
50. Rahman, N.; Manirul Haque, S.; Azmi, S.N.H.; Rahman, H. Optimized and validated spectrophotometricmethods for the determination of amiodarone hydrochloride in commercial dosage forms usingN-bromosuccinimide and bromothymol blue. J. Saudi Chem. Soc. 2017, 21, 25–34. [CrossRef]
51. Azmi, S.N.H.; Al-Ghafri, L.T.; Al-Ghafri, S.S.; Al-Haribi, M.M. Determination of Buspirone HCl in CommercialDosage Forms by Extractive Spectrophotometric Method and Comparison by HPLC Method. Sci. J.Anal. Chem. 2015, 3, 91. [CrossRef]
52. Coates, J. Interpretation of Infrared Spectra, a Practical Approach. In Encyclopedia of Analytical Chemistry;John Wiley & Sons, Ltd.: Chichester, UK, 2006; ISBN 978-0-470-02731-8.
53. Qi, Z.; Matsuda, N.; Santos, J.; Itoh, K.; Takatsu, A.; Kato, K. A Study of Molecular Adsorption of BromothymolBlue by Optical Waveguide Spectroscopy. Langmuir 2003, 19, 214–217. [CrossRef]
54. Carpenter, J.F.; Crowe, J.H. An infrared spectroscopic study of the interactions of carbohydrates with driedproteins. Biochemistry 1989, 28, 3916–3922. [CrossRef] [PubMed]
55. Dowding, C.E.; Borda, M.J.; Fey, M.V.; Sparks, D.L. A new method for gaining insight into the chemistry ofdrying mineral surfaces using ATR-FTIR. J. Colloid Interface Sci. 2005, 292, 148–151. [CrossRef] [PubMed]
56. Balderas-Hernández, P.; Ramírez, M.T.; Rojas-Hernández, A.; Gutiérrez, A. Determination of pK(a)’s forthymol blue in aqueous medium: Evidence of dimer formation. Talanta 1998, 46, 1439–1452. [CrossRef]
57. Tassanawat, S.; Phandee, A.; Magaraphan, R.; Nithitanakul, M.; Manuspiya, H. pH-Sensitive PP/ClayNanocomposites for Beverage Smart Packaging. In Proceedings of the 2007 2nd IEEE InternationalConference on Nano/Micro Engineered and Molecular Systems, Bangkok, Thailand, 16–19 January 2007;pp. 478–482.
58. Lakshmi, D.; Rajendran, S.; Sathiyabama, J.; Rathis, R.J.; Prabha, S.S. Application of infra-red spectroscopy incorrosion inhibition studies. Int. J. Nano Corros. Sci. Eng. 2016, 3, 181–203.
59. Sahil, K.; Prashant, B.; Akanksha, M.; Premjeet, S.; Devashish, R. Interpretation of infrared spectra. Int. J.Pharm. Chem. Sci. 2012, 1, 174–200.
60. Wang, S.; Copeland, L. Effect of acid hydrolysis on starch structure and functionality: A review. Crit. Rev.Food Sci. Nutr. 2015, 55, 1081–1097. [CrossRef] [PubMed]
61. Scordino, M.; Lazzaro, F.; Borzì, M.A.; Sabatino, L.; Traulo, P.; Gagliano, G. Dehydroacetic acid in cheese andcheese coating, results of official control in Italy. Food Addit. Contam. Part B 2018, 11, 75–81. [CrossRef]
62. Costa, M.A.S.; Cerri, B.C.; Ceccato-Antonini, S.R. Ethanol addition enhances acid treatment to eliminateLactobacillus fermentum from the fermentation process for fuel ethanol production. Lett. Appl. Microbiol.2018, 66, 77–85. [CrossRef]
63. Lourenço, A.S.; Nascimento, R.F.; Silva, A.C.; Ribeiro, W.F.; Araujo, M.C.U.; Oliveira, S.C.B.;Nascimento, V.B. Voltammetric determination of tartaric acid in wines by electrocatalytic oxidation on acobalt(II)-phthalocyanine-modified electrode associated with multiway calibration. Anal. Chim. Acta 2018,1008, 29–37. [CrossRef]
64. FAO. Agribusiness Handbook—Grapes Wines; Agribusiness Manuals; FAO Investiment Center Division: Rome,Italy, 2009.
65. MAPA. Instrução Normativa NO 14, de 08 de fevereiro de 2018, Complementação dos Padrões de Identidade eQualidade do Vinho e Derivados da Uva e do Vinho; MAPA: Brasília, Brazil, 2018; pp. 1–27.
© 2020 by the authors. Licensee MDPI, Basel, Switzerland. This article is an open accessarticle distributed under the terms and conditions of the Creative Commons Attribution(CC BY) license (http://creativecommons.org/licenses/by/4.0/).


