
Spatio-temporal correlations and visual signaling in a complete
neuronal population
Jonathan W. Pillow1, Jonathon Shlens2, Liam Paninski3,Alexander Sher4, Alan M. Litke4, E. J. Chichilnisky2, Eero P. Simoncelli5
1 Gatsby Computational Neuroscience Unit, UCL2 The Salk Institute, La Jolla, California
3 Department of Statistics and Center for Theoretical Neuroscience, Columbia University4 Santa Cruz Institute for Particle Physics, University of California, Santa Cruz
5 Howard Hughes Medical Institute, Center for Neural Science,and Courant Institute of Mathematical Sciences, New York University
Correspondence should be addressed to J.W.P. ([email protected])
May 19, 2008
Statistical dependencies in the responses of sensory neurons govern both the amount of
stimulus information conveyed and the means by which downstream neurons can extract
it. Although a variety of measurements indicate the existence of such dependencies, their
origin and importance for neural coding are poorly understood. Here we analyze the
functional significance of correlated firing in a complete population of primate parasol
retinal ganglion cells using a model of multi-neuron spike responses. The model, with
parameters fit directly to physiological data, simultaneously captures both the stimulus
dependence and detailed spatio-temporal correlations in population responses, and pro-
vides two insights into the structure of the neural code. First, neural encoding at the
population level is less noisy than one would expect from the variability of individual
neurons: spike times are more precise, and can be predicted more accurately when the
spiking of neighboring neurons is are taken into account. Second, correlations provide
additional sensory information: optimal, model-based decoding that exploits the response
1

correlation structure extracts 20% more information about the visual scene than decod-
ing under the assumption of independence, and preserves 40% more visual information
than optimal linear decoding. This model-based approach reveals the role played by cor-
related activity in the retinal coding of visual stimuli, and provides a general framework
for understanding the importance of correlated activity in populations of neurons.
How does the spiking activity of a neural population represent the sensory environment? The answer
depends critically on the structure of neuronal correlations, or the tendency of groups of neurons to fire
temporally coordinated spike patterns. The statistics of such patterns have been studied in a variety
of brain areas, and their significance in the processing and representation of sensory information has
been debated extensively [1, 2, 3, 4, 5, 6, 7, 8, 9].
Previous studies have examined visual coding by pairs of neurons [7], and the statistics of simultaneous
firing patterns in larger neural populations [10, 11]. However, no previous approach addresses how
correlated spiking activity in complete neural populations depends on the pattern of visual stimulation,
or the question of how such dependencies affect the encoding of visual stimuli.
Here we introduce a model-based methodology for studying this problem. We describe the encoding of
stimuli in the spike trains of a neural population with a generalized linear model (fig. 1a), a generalization
of the well-known linear-nonlinear-Poisson (LNP) cascade model [12, 13, 14, 15]. In this model, each
cell’s input is described by a set of linear filters: (1) a stimulus filter, or spatio-temporal receptive
field; (2) a post-spike filter, which captures dependencies on spike-train history (e.g. refractoriness,
burstiness, adaptation); and (3) a set of coupling filters, which capture dependencies on the recent
spiking of other cells. For each neuron, the summed filter responses are exponentiated to obtain an
instantaneous spike rate. This is equivalent to exponentiating the filter outputs and then multiplying.
The exponentiated post-spike and coupling filters (as plotted in Fig. 1) may therefore be interpreted
as spike-induced gain adjustments of the neuron’s firing rate.
Although this model is strictly phenomenological, its components can be loosely compared to biophys-
2
ical mechanisms: the stimulus filter approximates the spatio-temporal integration of light in the outer
retina and passive dendritic filtering; the post-spike filter mimics voltage-activated currents following
a spike; coupling filters resemble synaptic or electrical interactions between cells (and can mimic the
effects of shared input noise); the exponential nonlinearity implements a “soft threshold” converting
membrane potential to instantaneous spike probability. Note that the post-spike and coupling filters,
which allow stochastic spiking in one cell to affect subsequent population activity, give rise to shared,
non-Poisson variability in the model response.
We fit the model to data recorded in vitro from a population of 27 ON and OFF parasol ganglion cells
(RGCs) in a small patch of isolated macaque monkey retina, stimulated with 120-Hz spatio-temporal
binary white noise. The receptive fields (RFs) of each of the two cell types formed a complete mosaic
covering a small region of visual space (fig. 1b), indicating that every parasol cell in this region was
recorded [16, 11]. Such complete recordings, which have not been achieved elsewhere in the mammalian
nervous system, are essential for understanding visual coding in neural populations.
The model contains many parameters (i.e., specifying the shapes of all filters), but fitting by maximum
likelihood remains highly tractable [15]. A penalty on coupling filters was used to obtain a minimally
sufficient set of coupling filters, which yields an estimate of the network’s functional connectivity [17, 18].
Figure 1 shows the estimated filters describing input to example ON and OFF cells. The stimulus
filters exhibit center-surround receptive field organization consistent with previous characterizations
of parasol cells. Post-spike filters show the timecourse of recovery from refractoriness following a
spike, while coupling filters show the effects of spikes in nearby cells: for the ON cell (top), spikes in
neighboring ON cells elicit a large, transient excitation (increasing the instantaneous spike rate by a
factor of three), while spikes in nearby OFF cells elicit suppression. These effects are reversed in the
OFF cell, which is excited/suppressed by spikes in neighboring OFF/ON cells. Both populations exhibit
approximate nearest-neighbor connectivity, with coupling strength falling as a function of distance
between RF centers [11]. Surprisingly, fitted stimulus filters have smaller surrounds than the spike-
3

triggered average, indicating that a portion of the classical surround can be explained by interactions
between cells [19] (see Supp. Materials).
To assess accuracy in capturing the statistical dependencies in population responses, we compared
the pairwise cross-correlation function (CCF) of RGCs and simulated model spike trains (fig. 2). For
nearby ON-ON and OFF-OFF pairs, the CCF exhibits a sharp peak at zero, indicating the prevalence
of synchronous spikes, while for ON-OFF pairs, a trough at zero indicates an absence of synchrony.
For all 351 possible pairings, the model accurately reproduces the CCF (fig. 2a-c,e-f).
To examine whether inter-neuronal coupling was necessary to capture the response correlation struc-
ture, we re-fitted the model without coupling filters (i.e., so that each cell’s response depends only on
the stimulus and its own spike-train history). This uncoupled model assumes that cells encode the stim-
ulus independently, though correlations may still arise from the overlap of stimulus filters. However,
the uncoupled model fails to reproduce the sharp CCF peaks observed in the data. These peaks are
also absent from CCFs computed on trial-shuffled data, indicating that fast time-scale correlations are
not stimulus-induced and thus cannot be captured by any independent encoding model.
Higher-order statistical dependencies were considered by inspecting correlations in three-neuron groups:
triplet CCFs show the spike rate of one cell as a function of the relative times to spikes in two other
cells (fig. 2e-g) [11]. For adjacent neurons of the same type, triplet CCFs have substantial peaks at
zero (i.e., “triplet synchrony”), which are are well matched by the full model.
Although the full and uncoupled models differ substantially in their statistical dependencies, the two
models predict average light responses in individual cells with nearly identical accuracy, capturing 80-
95% of the variance in the peri-stimulus time histogram (PSTH) in 26 of 27 cells (fig. 3a-c). Both
models therefore accurately describe average single-cell responses to novel stimuli. However, the full
model achieves higher accuracy predicting multi-neuronal spike responses on a single trial (8±3% more
bits/spike, fig. 3d). This discrepancy can be explained by the fact that noise (i.e., variability) is shared
across neurons. Shared variability means that population activity carries information about a single
4
cell’s response (due to coupling between cells) beyond that provided by the stimulus alone. Individual
neurons therefore appear less noisy when conditioned on spiking activity in the rest of the population
than they appear in raster plots.
We measured the effect of correlations on single-trial, single-cell spike train prediction by using the
model to draw samples of a single cell’s response given both the stimulus and the spiking activity in
the rest of the population on a single trial (fig. 3e-f). Averaging the resulting raster gives a prediction
of the cell’s single-trial spike rate, or “population-conditioned” PSTH for a single trial. We compared
these predictions with the cell’s true spike times (binned at 2ms) across all trials and found that on
nearly every trial, the model-based prediction is more highly correlated with the observed spikes than
the neuron’s full PSTH (fig. 3g). Note that the full PSTH achieves the highest correlation possible
for any independent (i.e., trial-independent) prediction. Thus, by exploiting the correlation structure,
the coupled model predicts single-neuron spike times more accurately than any independent encoding
model.
Although the full model accurately captures dependencies in the activity of RGCs, it is not obvious a
priori whether these dependencies affect the amount of sensory information conveyed by RGC responses.
In principle, the correlation structure could be necessary to predict the responses, but not to extract
the stimulus information they carry [9]. To examine this issue directly, we used the full and uncoupled
models to perform Bayesian decoding of the population response (fig. 4a), which optimally reconstructs
stimuli given an accurate description of the encoding process. For comparison, we also performed
Bayesian decoding under a Poisson (i.e., LNP) model and optimal linear decoding.
Each decoding method was used to estimate short (150-ms) segments of the stimulus given all relevant
spike times from the full population (fig. 4b). Bayesian decoding under the coupled model recovers
20% more information than Bayesian decoding under the uncoupled model, indicating that knowledge
of the correlation structure is critical for extracting all sensory information contained in the population
response. This improvement was invariant to enhancements of the model’s stimulus filters and nonlin-
5

earities (see Supp. Materials), indicating that the difference in performance arises specifically from the
coupled model’s ability to incorporate the correlation structure. Our results also show that spike his-
tory is relevant for decoding (a Poisson model preserves 6% less information than the uncoupled model
[21]) and that linear decoding fails to extract the sensory information contained in RGC responses.
Decoding analysis can also be used to examine the coding fidelity of specific stimulus features. As a
simple illustration, we examined the temporal frequency spectrum of reconstructed stimuli and found
that the response correlation structure is most important for decoding those stimulus frequencies (6-20
Hz) that are encoded with highest fidelity (fig. 4c).
These results demonstrate that the responses of a population of retinal ganglion cells are well described
by a generalized linear model, and that correlations in the response can be exploited to recover 20%
more visual information than if responses are regarded as independent given the stimulus. By contrast,
previous studies have reported this information gain to be less than 10% for pairs of neurons [5, 8].
However, pairwise analyses provide little evidence about the importance of correlations across an entire
population. Second-order correlations between pairs of neurons could give rise to either much larger
(scaling with the number of neurons n) or much smaller (falling as 1/n) gains for a full population (see
Supp. Materials). To compare more directly with previous findings, we performed Bayesian decoding
using isolated pairs of neurons from the same population; we found a ≤ 10% gain in sensory information
when correlations were included (see Supp. Materials). While consistent with previous findings, this
shows that the information gain for a complete population is larger than that observed for pairs. We
also compared the model to a pairwise maximum-entropy model, which has recently been shown to
capture the instantaneous spiking statistics of groups of retinal ganglion cells [10, 11]. The coupled
model exhibits similar accuracy in capturing these statistics, but has the advantage that it accounts
for the temporal correlation structure and stimulus dependence of responses, which are essential for
assessing the effect of correlations on sensory coding.
Although it provides an accurate functional description of correlated spike responses, the generalized
6

linear model does not reveal the biophysical mechanisms underlying the statistical dependencies be-
tween neurons: coupling does not necessarily imply anatomical connections between cells, but could (for
example) reflect dependencies due to shared input noise [22]. The model also lacks several mechanisms
known to exist in retinal ganglion cells (e.g., contrast gain-control [23]), which may be required for
characterizing responses to a wider range of stimuli. One additional caveat is that Bayesian decoding
provides a tool for measuring the sensory information available in the population response, but it does
not reveal whether the brain makes use of this information. Physiological interpretations of the model
and mechanisms for neural read-out of sensory information in higher brain areas are thus important
directions for future research.
Nevertheless, the generalized linear model offers a concise, computationally tractable description of
the population encoding process, and provides the first generative description of the space-time de-
pendencies in stimulus-induced population activity. It allows us to quantify the relative contributions
of stimulus, spike history, and network interactions to the encoding and decoding of visual stimuli,
and clarifies the relationship between single-cell and population variability. More generally, the model
can be used to assess which features of the visual environment are encoded with highest and lowest
fidelity, and to determine how the structure of the neural code constrains perceptual capabilities. We
expect this framework to extend to other brain areas, and to play an important role in revealing the
information processing capabilities of spiking neural populations [24, 25, 14, 17].
Short Methods (journal version)
Data . Multi-electrode extracellular recordings were obtained in vitro from a segment of isolated,
peripheral macaque monkey retina, and analysis was restricted to two cell types (ON and OFF parasol)
[26, 11, 27]. A standard, spike sorting procedure, followed by a specialized statistical method for
detecting simultaneous spikes was used to sort spikes (cf [28]). The retina was stimulated with a
photopic, achromatic, optically reduced spatio-temporal binary white noise stimulus refreshing at 120
Hz, with an RMS contrast of 96%.
7

Fitting. Model parameters were fitted to 7 minutes of spike responses to a non-repeating stimulus.
Each cell’s parameters consisted of a stimulus filter (parametrized as a rank-2 matrix), a spike-history
filter, a set of incoming coupling filters, and a constant. Temporal filters were represented in a basis
of cosine “bumps” [21]. Parameters for the uncoupled and Poisson (LNP) models were fitted indepen-
dently. Parameters were fitted by penalized maximum likelihood [15, 14], with an L1 penalty on the
vector length of coupling filters to eliminate unnecessary connections.
Encoding. Spike prediction was cross-validated using the log-likelihood of 5 minutes of novel spiking
data (scaled to units of bits/s). Repeat rasters were obtained using 200 presentations of a novel
10s stimulus. Population-conditional rasters were obtained from the coupled model by sampling the
model-defined probability distribution over the neuron’s response given the stimulus and surrounding-
population activity on a single trial [29].
Decoding. Population responses were decoded using the Bayes’ least squares estimator (posterior
mean) to reconstruct 18-sample single-pixel stimulus segments (cross-validation data). Linear decoding
was performed using the optimal linear estimator [20]. Decoding performance was quantified using the
log signal-to-noise ratio (SNR) of each technique, which gives an estimate of mutual information.
Breakdown by temporal frequency was obtained by computing the Fourier power spectra of the stimuli
and residuals and then computing log-SNR.
Full Methods (pdf only)
Recording. Multi-electrode extracellular recordings were obtained in vitro from a segment of isolated,
peripheral macaque monkey retina, using preparation and recording methods described previously
[26, 11]. Analysis was restricted to two physiologically-defined classes of cells which, on the basis of
light response properties and density, were identified as ON and OFF parasol cells [27]. The cells shown
were recorded in a square region of retina covered by 76 electrodes. A standard clustering spike sorting
procedure (cf [26, 11]) was used to estimate the number of units, and least-squares regression of the
estimated spike times against multi-electrode voltage signal was used to estimate multi-electrode spike
8

waveforms for each unit. Although this approach correctly and efficiently identifies isolated spikes,
when two cells fire within a 1-2 ms window, the clustering approach can fail to identify the presence
of both spikes. We solved this problem by using estimates of the elementary waveforms to detect the
superposition of spikes. We performed maximum a posteriori estimation under the model that the
multi-electrode voltage signal was the linear superposition of Gaussian white noise and the spike trains
convolved with their associated spike waveforms, with a sparse (exponential) prior on the spike trains.
This corresponds to a tractable quadratic optimization problem under linear inequality constraints,
which can be efficiently solved using existing methods. The real-valued solution vector was then
binarized by greedily inserting spikes whenever the reduction in mean-squared error between predicted
and actual voltage exceeded a threshold [28]. This procedure correctly identified simultaneous spikes
in simulated datasets and corrected obvious cross-correlation artifacts appearing in real data sorted
with standard clustering techniques.
Stimuli. The retina was stimulated with a photopic, achromatic image of a cathode ray tube display,
refreshing at 120 Hz. The stimulus was a spatio-temporal pseudo-random binary sequence, where the
intensity of each pixel was drawn independently from one of two values on each frame. The stimulus
pixel size was 120 x 120 microns on the retina, and contrast (standard deviation divided by mean) was
96%.
Fitting. Model parameters were fitted by maximizing likelihood [15], using 7 minutes of spiking data
recorded during presentation of a non-repeating stimulus. The parameters for each cell consisted of a
stimulus filter k, a spike history filter h, a set of incoming coupling filters {li}, and a constant (DC
offset) µ. k was a 750-dimensional vector (5x5 spatial pixels x 30 time bins), parametrized using a
lower-dimensional representation as a rank-2 matrix: k(x, y, τ) = ks,1(x, y)kt,1(τ) − ks,2(x, y)kt,2(τ),
with ks,i(x, y) denoting a spatial filter (25 parameters) and kt,i(τ) a temporal filter (10 parameters),
giving 2 × 35 = 70 parameters. A rank-3 representation did not improve performance. These filters
closely resembled a time-varying difference-of-Gaussians [30]; spatial filters were well-approximated
(in a least-squares sense) by Gaussians, which were used to plot spatial ellipses shown in (fig. 1)
9
and to summarize receptive field properties (Supp. Figures S2–S3). Gaussians fit to RF centers and
surrounds had average standard deviations of 0.25 pixels and 0.7 pixels (1.0 pixels for the uncoupled
model), respectively. Temporal filters h and {li}, and the temporal components of k were represented
using a basis of raised cosine “bumps” of the form bj(t) = 1
2cos(log[t + ψ] − φj) + 1
2for t such that
log(t + ψ) ∈ [φj − π, φj + π] and 0 elsewhere (see Supplementary Materials). This basis allows for the
representation of fine temporal structure near the time of a spike and coarser/smoother dependency at
later times (see [21]). h was represented with 10 such basis vectors, and li from each coupled neuron
was represented with 4. The “uncoupled model” was fitted independently without coupling filters {li},
and the inhomogeneous Poisson model (fig. 4) was fitted without {li} or h.
Conditional intensity (spike rate) is given by λ(t) = exp(k · x + h · y + (∑
i li · yi) + µ), where x is
the stimulus, y the cell’s own spike-train history, µ is the cell’s baseline log-firing rate, and {yi} the
spike-train histories of other cells at time t. The population log-likelihood is the sum over single-cell
log-likelihoods, each given by L =∑
log λ(tsp) −∫
λ(t)dt, where tsp denotes the set of spike times
and the integral is taken over the length of the experiment [15, 14]. We added a penalty of the form
−α∫t |
∑i li(t)
2|1/2dt to eliminate unnecessary coupling filters (using a constrained Newton-Raphson
algorithm to maximize the penalized log-likelihood), which regularizes and prevents overfitting. The
regularization parameter α was selected via cross-validation on a novel 5-minute dataset, but results
were robust with respect to both α and the choice of basis. (This reduced the number of number
of coupling filters from 702 to 243 and recovered a roughly pairwise-adjacent structure; see Supp.
Materials).
Correlations. Spike responses of full and uncoupled models were simulated with the same 20-min stim-
ulus (144,000 samples) presented experimentally. Pairwise cross-correlations were computed in 1-ms
bins, according to C(τ) = [〈y1(t)y2(t + τ)〉 − 〈y1(t)〉〈y2(t)〉] /(〈y2(t)〉dt), where y1(t) denotes the spike
response of the first neuron in bins of width dt, and 〈·〉 denotes averaging over t. Triplet correlations
were computed in 5-ms bins according to C(τ1, τ2) = [〈y1(t)y2(t + τ1)y3(t + τ2)〉 − 〈y1(t)〉〈y2(t)〉〈y3(t)〉]
/(〈y2(t)〉〈y3(t)〉dt).
10

Encoding. Spike-train prediction was validated using the log-likelihood of novel spike trains under
both models, computed on 5 minutes of data not used for fitting or setting α. The difference of log-
likelihood under the model and the baseline firing rate,∑
log λ̄(tsp) −∫t λ̄(t)dt (where λ̄ = nsp/T is
the mean spike rate), divided by nsp, gives prediction accuracy in bits/spike for each cell [25]. Repeat
rasters were obtained using 200 presentations of a novel 10s stimulus, and the time-varying average
response (PSTH) was computed in 1-ms bins, smoothed with a Gaussian kernel of width σ=2ms.
Conditional rasters were obtained from the coupled model by holding the responses of all but one
neuron fixed, and sampling from the model-induced probability distribution on the remaining neuron’s
response. Samples were obtained by the Metropolis-Hastings algorithm, with spike “proposals” drawn
from a point process model as described in [29]. We kept only every 100th output sample of the
algorithm to ensure independent samples.
Decoding. We decoded the population response using the Bayes’ least squares estimator, computed
under each model (fully coupled, uncoupled with spike history terms, and inhomogeneous Poisson) using
6000 different 18-sample single-pixel stimulus segments (validation data—not used for model fitting).
Each stimulus xi (an 18-dimensional binary vector, given by the time series of light intensities for a
centrally located stimulus pixel) was decoded by first extracting yi, the multi-neuronal spike response
portion that was causally influenced by this stimulus. For each model, and for every one of the 218
possible binary xj , we then computed pj = p(yi|xj), the likelihood of the observed population response
given that it was generated by stimulus xj . By Bayes’ rule, the posterior is p(xj|yi) ∝ p(yi|xj)p(xj),
and the prior p(xj) here is constant across binary stimuli. Thus, the posterior is proportional to
pj, and the Bayes’ least squares estimate is given by x̂i = (∑
pjxj)/(∑
pj). We also performed
decoding on longer (30-sample) stimulus segments, where exhaustive evaluation of these sums is no
longer tractable: in this case we used Gibbs sampling from p(xj|yi) to approximately evaluate the sum;
the results obtained using both methods were similar.
Linear decoding was performed using the optimal linear estimator [20], with the same training data
as for model fitting. Decoding performance was quantified using the log signal-to-noise ratio (SNR)
11
of each technique: log(|〈xixTi 〉|/|〈rir
Tj 〉|), where ri = x̂i − xi denotes the residual error for decoding
stimulus vector xi, and |〈·〉| denotes averaging over i followed by matrix determinant. Breakdown
by temporal frequency was obtained by computing the Fourier power spectra of the stimuli x̃i(ω)2
and residuals r̃i(ω)2, and computing log SNR according to log(〈x̃i(ω)2〉/〈r̃(ω)2〉). Integrating this
log SNR across frequency, (1/2)∫
log SNR(ω)dω, gives a commonly-employed estimate of the mutual
information between the stimulus and the spike train response [20], which is equivalent to the quantity
shown in Fig. 4b.
References
[1] M. Meister, L. Lagnado, and D. A. Baylor. Concerted signaling by retinal ganglion cells. Science,270:1207–1210, 1995.
[2] M. Shadlen and W. Newsome. The variable discharge of cortical neurons: implications for con-nectivity, computation, and information coding. Journal of Neuroscience, 18:3870–3896, 1998.
[3] Y. Dan, J. M. Alonso, W. M. Usrey, and R.C. Reid. Coding of visual information by preciselycorrelated spikes in the lateral geniculate nucleus. Nature Neuroscience, 1:501–507, 1998.
[4] S. Panzeri, H. Golledge, F. Zheng, and M.P. Tovee, M. J. Young. Objective assessment of thefunctional role of spike train correlations using information measures. Vis Cogn, 8:531–547, 2001.
[5] S. Nirenberg, S. Carcieri, A. Jacobs, and P. Latham. Retinal ganglion cells act largely as indepen-dent encoders. Nature, 411:698–701, 2001.
[6] E. Schneidman, W. Bialek, and M. J. Berry. Synergy, redundancy, and independence in populationcodes. J. Neurosci., 21:11539–11553, 2003.
[7] S. Nirenberg and P.E. Latham. Decoding neuronal spike trains: how important are correlations?PNAS, 100:7348–7353, 2003.
[8] B. B. Averbeck and D. Lee. Coding and transmission of information by neural ensembles. Trends
Neurosci, 27:225–230, 2004.
[9] P. Latham and S. Nirenberg. Synergy, redundancy, and independence in population codes, revis-ited. J. Neurosci., 25:5195–5206, 2005.
[10] E. Schneidman, M. Berry, R. Segev, and W. Bialek. Weak pairwise correlations imply stronglycorrelated network states in a neural population. Nature, 440:1007–1012, 2006.
[11] J. Shlens, G. Field, J. Gauthier, M. Grivich, D. Petrusca, A. Sher, Litke A. M., and E. J.Chichilnisky. The structure of multi-neuron firing patterns in primate retina. J Neurosci, 26:8254–8266, 2006.
[12] H. Plesser and W. Gerstner. Noise in integrate-and-fire neurons: From stochastic input to escaperates. Neural Computation, 12:367–384, 2000.
12

[13] E. P. Simoncelli, L. Paninski, J. Pillow, and O. Schwartz. Characterization of neural responseswith stochastic stimuli. In M. Gazzaniga, editor, The Cognitive Neurosciences, pages 327–338.MIT Press, 3rd edition, 2004.
[14] W. Truccolo, U. T. Eden, M. R. Fellows, J. P. Donoghue, and E. N. Brown. A point processframework for relating neural spiking activity to spiking history, neural ensemble and extrinsiccovariate effects. J. Neurophysiol, 93(2):1074–1089, 2004.
[15] L. Paninski. Maximum likelihood estimation of cascade point-process neural encoding models.Network: Computation in Neural Systems, 15:243–262, 2004.
[16] E. S. Frechette, A. Sher, M. I. Grivich, D. Petrusca, A. M. Litke, and E. J. Chichilnisky. Fidelityof the ensemble code for visual motion in primate retina. J. Neurophysiol., 94:119–135, 2005.
[17] M. Okatan, M. Wilson, and E. Brown. Analyzing functional connectivity using a network likelihoodmodel of ensemble neural spiking activity. Neural Computation, 17:1927–1961, 2005.
[18] F. Rigat, M. de Gunst, and J. van Pelt. Bayesian modelling and analysis of spatio-temporalneuronal networks. Bayesian Analysis, 1(4):733–764, 2006.
[19] S. H. DeVries. Correlated firing in rabbit retinal ganglion cells. J. Neurophysiol., 81(2):908–920,1999.
[20] D. Warland, P. Reinagel, and M. Meister. Decoding visual information from a population of retinalganglion cells. Journal of Neurophysiology, 78:2336–2350, 1997.
[21] J. W. Pillow, L. Paninski, V. J. Uzzell, E. P. Simoncelli, and E. J. Chichilnisky. Prediction anddecoding of retinal ganglion cell responses with a probabilistic spiking model. The Journal of
Neuroscience, 25:11003–11013, 2005.
[22] D. N. Mastronarde. Correlated firing of retinal ganglion cells. Trends in Neurosciences, 12(2):75–80, 1989.
[23] R. M. Shapley and J. D. Victor. The effect of contrast on the transfer properties of cat retinalganglion cells. J. Physiol, 285:275–298, 1978.
[24] K. Harris, J. Csicsvari, H. Hirase, G. Dragoi, and G. Buzsaki. Organization of cell assemblies inthe hippocampus. Nature, 424:552–556, 2003.
[25] L. Paninski, M. Fellows, S. Shoham, N. Hatsopoulos, and J. Donoghue. Superlinear populationencoding of dynamic hand trajectory in primary motor cortex. J. Neurosci., 24:8551–8561, 2004.
[26] A. M. Litke, N. Bezayiff, E. J. Chichilnisky, W. Cunningham, W. Dabrowski, A.A. Grillo,M. Grivich, P. Grybos, P. Hottowy, S. Kachiguine, R.S. Kalmar, K. Mathieson, D. Petrusca,M. Rahman, and A. Sher. What does the eye tell the brain? development of a system for thelarge scale recording of retinal output activity. IEEE Trans Nucl Sci, 51:1434–1440, 2004.
[27] M. Watanabe and R. W. Rodieck. Parasol and midget ganglion cells of the primate retina. J.
Comp. Neurol., 289:434–454, 1989.
[28] R. Segev, J. Goodhouse, J. Puchalla, and M. J. Berry. Recording spikes from a large fraction ofthe ganglion cells in a retinal patch. Nat. Neurosci., 7:1155–1162, 2004.
13

[29] J. W. Pillow and P. Latham. Neural characterization in partially observed populations of spikingneurons.
[30] M. Meister and M. J. Berry. The neural code of the retina. Neuron, 22:435–450, 1999.
Acknowledgments We thank M. Bethge, C. Brody, D. Butts, P. Latham, M. Lengyel, S. Niren-berg, and R. Sussman for helpful comments and discussions. Funding was provided a Royal SocietyUSA/Canada Research Fellowship (JP); NSF IGERT DGE-03345 (JS); NEI grant EY018003 (EJC,LP, & EPS); Gatsby Foundation Pilot Grant (LP); Burroughs Wellcome Fund Career Award at theScientific Interface (AS); US National Science Foundation grant PHY-0417175 (AML); McKnight Foun-dation (AML & EJC); and HHMI (JP,LP, & EPS).
Figure Legends
Figure 1: Multi-neuron encoding model and fitted parameters. a, Model schematic for two coupled
neurons: each neuron has a stimulus filter, post-spike filter, and coupling filters that capture dependen-
cies on spiking in other neurons. Summed filter output passes through an exponential nonlinearity to
produce the instantaneous spike rate. b, Mosaics of 11 ON and 16 OFF retinal ganglion cell receptive
fields (RFs), tiling a small region of visual space. Ellipses represent 1 SD of a Gaussian fit to each RF
center; square grid indicates stimulus pixels. c-e, Parameters for an example ON cell. c, Temporal
and spatial components of center (red) and surround (blue) filter components, whose difference is the
full stimulus filter. d, Exponentiated post-spike filter, which may be interpreted as multiplying the
spike rate following a spike at time zero. It produces a brief refractory period and gradual recovery
(with a slight overshoot). e, Connectivity and coupling filters from other cells in the population. Black
filled ellipse is this cell’s RF center, and blue and red lines show connections from neighboring OFF
and ON cells (line thickness indicates coupling strength). Below, exponentiated coupling filters show
the multiplicative effect on this cell’s spike rate following a spike in a neighboring cell. f-h, Analogous
plots for an example OFF cell.
Figure 2: Analysis of response correlations. a-c, Example cross-correlations functions (CCFs) of
14
retinal responses, and simulated responses of the full and uncoupled models, for two ON cells (a), two
OFF cells (b), and an ON-OFF pair (c). Baseline is subtracted so that units are in spikes/s above (or
below) the cell’s mean rate. d RF mosaic overlaid with arbitrary labels. e, CCFs between all ON pairs,
where the i, jth plot shows the CCF between cell i and cell j. Gray box indicates the CCF plotted
above in (a). f, CCFs between all OFF pairs and g, between all ON-OFF pairs. h, Third-order (triplet)
CCF between three adjacent ON cells, showing the instantaneous spike rate of cell 5 as a function of
the relative spike time in cells 4 and 8 (left: RGCs; middle: full model; right: uncoupled model). i
Analogous triplet CCF for OFF cells 15, 16 and 22. j, Comparison of triplet CCF peak in RGC and
model responses (full model = black, uncoupled = gray), for randomly selected triplets of adjacent ON
(open) and OFF cells (filled).
Figure 3: Spike-train prediction comparison. a, Raster of responses of an ON RGC to 25 repeats of
a novel 1-s stimulus (top), and responses of uncoupled (middle) and full models (bottom) to the same
stimulus. b, Peri-stimulus time histogram (PSTH) of the RGC (black), uncoupled (blue) and coupled
model (red); both models account for ≈ 84% of the variance of the true PSTH. c, PSTH prediction by
full and uncoupled models, showing that coupling confers no advantage predicting average responses.
d, Log-likelihood of novel RGC spike responses under full and uncoupled models; full model provides
8% more information about novel spike trains. e, Magnified 150-ms portion of RGC raster and PSTH
(gray box in a). Red dots highlight RGC spike times on selected individual trials, which are re-
plotted in f. f, Single-trial spike-train prediction using the coupled model. Top half of each plot shows
population activity on a single trial: true spike times of the cell (red dots), coupled ON cells (light
gray dots) and coupled OFF cells (dark gray dots; each line in the raster shows the spike times of
a different cell). Below, a raster of 50 predicted responses of the cell in question, using both the
stimulus and coupled responses (shown above) to predict spike trains. Red trace shows the single-trial
rate prediction (population-conditioned PSTH), compared with true PSTH of the cell (black trace,
identical in all plots). g, Correlation coefficient of true spike trains and the PSTH (ordinate) and with
population-conditioned predictions (abscissa); the full model predicts single-trial responses with higher
15
accuracy than the true PSTH.
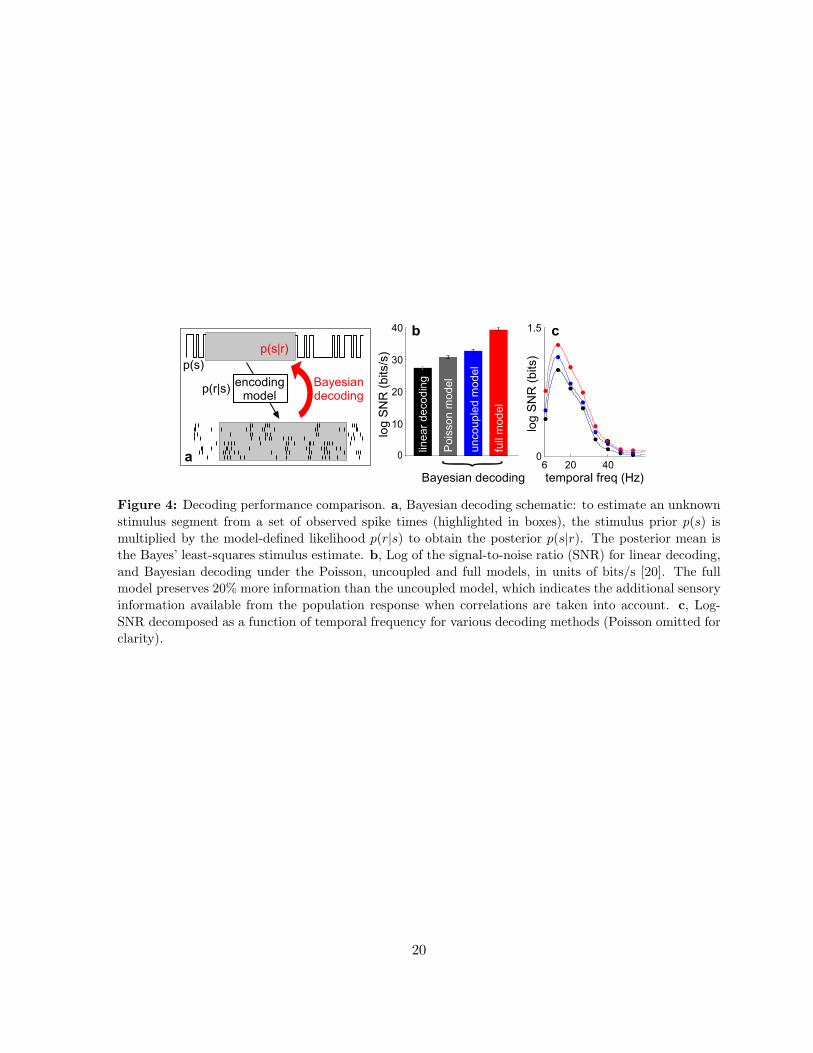
Figure 4: Decoding performance comparison. a, Bayesian decoding schematic: to estimate an un-
known stimulus segment from a set of observed spike times (highlighted in boxes), the stimulus prior
p(s) is multiplied by the model-defined likelihood p(r|s) to obtain the posterior p(s|r). The posterior
mean is the Bayes’ least-squares stimulus estimate. b, Log of the signal-to-noise ratio (SNR) for lin-
ear decoding, and Bayesian decoding under the Poisson, uncoupled and full models, in units of bits/s
[20]. The full model preserves 20% more information than the uncoupled model, which indicates the
additional sensory information available from the population response when correlations are taken into
account. c, Log-SNR decomposed as a function of temporal frequency for various decoding methods
(Poisson omitted for clarity).
16

�
��������
��� ����
�������� ����
�����������
�
������
������
��������
����
��������
���������������������
��
�� ���
� !
�
�
"
� !
#$
#%
�
������������������ �����
�� ���
� !
#&
�
� !
�
�#&
�� ��
�
�
! �� ��
�������
����
������ ����
����������������
����'�(
���������������
�
����
����
� !
�
�
�
� � �
�
� �����������������
�� µ
Figure 1: Multi-neuron encoding model and fitted parameters. a, Model schematic for two coupled
neurons: each neuron has a stimulus filter, post-spike filter, and coupling filters that capture dependencies
on spiking in other neurons. Summed filter output passes through an exponential nonlinearity to produce
the instantaneous spike rate. b, Mosaics of 11 ON and 16 OFF retinal ganglion cell receptive fields
(RFs), tiling a small region of visual space. Ellipses represent 1 SD of a Gaussian fit to each RF center;
square grid indicates stimulus pixels. c-e, Parameters for an example ON cell. c, Temporal and spatial
components of center (red) and surround (blue) filter components, whose difference is the full stimulus
filter. d, Exponentiated post-spike filter, which may be interpreted as multiplying the spike rate following
a spike at time zero. It produces a brief refractory period and gradual recovery (with a slight overshoot).
e, Connectivity and coupling filters from other cells in the population. Black filled ellipse is this cell’s
RF center, and blue and red lines show connections from neighboring OFF and ON cells (line thickness
indicates coupling strength). Below, exponentiated coupling filters show the multiplicative effect on this
cell’s spike rate following a spike in a neighboring cell. f-h, Analogous plots for an example OFF cell.
17

�&
���������
����������
���������
���"�!�&�$�)�%�*� �����"�!�&�$�)
� � " ! & $ ) % * � ���" �! �& �$ �) �% �* � �� �� �" �! �& �$ �)
� � " ! & $ ) % * � �
"!
&$
)%
*� ��
��������� �������������� ��������� ��������������
�
����'+,(
"
"
����������
�����
�����
��������-��
)&+,
& �
�
� �������
�& &
��
��
� ������
�& &
"
$
����'+,(
'�(
��������
�& &
"
$
�
�
�
"
!
&
$)
%
*
�
��
��
�"
�!
�&
�$
�)�%
�*
�
��
��
�"
�!
�&
�$
�)
�
���
����
�
�
�
�&
&
&
�&
"
�&
&
&
�&
Figure 2: Analysis of response correlations. a-c, Example cross-correlations functions (CCFs) of retinal
responses, and simulated responses of the full and uncoupled models, for two ON cells (a), two OFF cells
(b), and an ON-OFF pair (c). Baseline is subtracted so that units are in spikes/s above (or below) the
cell’s mean rate. d RF mosaic overlaid with arbitrary labels. e, CCFs between all ON pairs, where the
i, jth plot shows the CCF between cell i and cell j. Gray box indicates the CCF plotted above in (a). f,
CCFs between all OFF pairs and g, between all ON-OFF pairs. h, Third-order (triplet) CCF between
three adjacent ON cells, showing the instantaneous spike rate of cell 5 as a function of the relative spike
time in cells 4 and 8 (left: RGCs; middle: full model; right: uncoupled model). i Analogous triplet CCF
for OFF cells 15, 16 and 22. j, Comparison of triplet CCF peak in RGC and model responses (full model
= black, uncoupled = gray), for randomly selected triplets of adjacent ON (open) and OFF cells (filled).
18

$ % �
$
%
�
������������
�'./��(
���������������
���������
� �#&
�
�#&
��������������
'-�0�(
��
�������
��������
& ��
���
���������
���������
�����'(
��
� �+,
�
�
���� ��������
��������������������
���
#� #&
#�
#&
��������
������
����������
�������������
�
���
��������
���
������
���
���������
�-��/��
���0
�
�
� �+,
Figure 3: Spike-train prediction comparison. a, Raster of responses of an ON RGC to 25 repeats of
a novel 1-s stimulus (top), and responses of uncoupled (middle) and full models (bottom) to the same
stimulus. b, Peri-stimulus time histogram (PSTH) of the RGC (black), uncoupled (blue) and coupled
model (red); both models account for ≈ 84% of the variance of the true PSTH. c, PSTH prediction by full
and uncoupled models, showing that coupling confers no advantage predicting average responses. d, Log-
likelihood of novel RGC spike responses under full and uncoupled models; full model provides 8% more
information about novel spike trains. e, Magnified 150-ms portion of RGC raster and PSTH (gray box in
a). Red dots highlight RGC spike times on selected individual trials, which are re-plotted in f. f, Single-
trial spike-train prediction using the coupled model. Top half of each plot shows population activity on
a single trial: true spike times of the cell (red dots), coupled ON cells (light gray dots) and coupled OFF
cells (dark gray dots; each line in the raster shows the spike times of a different cell). Below, a raster of 50
predicted responses of the cell in question, using both the stimulus and coupled responses (shown above)
to predict spike trains. Red trace shows the single-trial rate prediction (population-conditioned PSTH),
compared with true PSTH of the cell (black trace, identical in all plots). g, Correlation coefficient of
true spike trains and the PSTH (ordinate) and with population-conditioned predictions (abscissa); the
full model predicts single-trial responses with higher accuracy than the true PSTH.
19
��������
�����
1������
��������
�'�2(
�'(
�'2�(
�
������3�'-�0(
�
�
"
!
���������
���������������
�
�������� ��4�'+,(
������3�'-�(
$ � !
�#&�
���������������
5����������
1���������������
{Figure 4: Decoding performance comparison. a, Bayesian decoding schematic: to estimate an unknown
stimulus segment from a set of observed spike times (highlighted in boxes), the stimulus prior p(s) is
multiplied by the model-defined likelihood p(r|s) to obtain the posterior p(s|r). The posterior mean is
the Bayes’ least-squares stimulus estimate. b, Log of the signal-to-noise ratio (SNR) for linear decoding,
and Bayesian decoding under the Poisson, uncoupled and full models, in units of bits/s [20]. The full
model preserves 20% more information than the uncoupled model, which indicates the additional sensory
information available from the population response when correlations are taken into account. c, Log-
SNR decomposed as a function of temporal frequency for various decoding methods (Poisson omitted for
clarity).
20

Spatio-temporal correlations and visual signaling in a complete
neuronal population
May 20, 2008
Supplementary Materials
To provide more insight into the generalized linear model, we present several figures illustrating details
of the model components and their contributions to model response properties. We also discuss several
control analyses addressing whether the difference in performance of the full and uncoupled models
can be attributed primarily to their difference in capturing the response correlation structure. Finally,
we provide connections to several previous results on correlated spiking activity in neural populations,
specifically maximum-entropy analyses [1, 2] and pairwise measurements of coding efficiency [3].
Analysis of Model Components
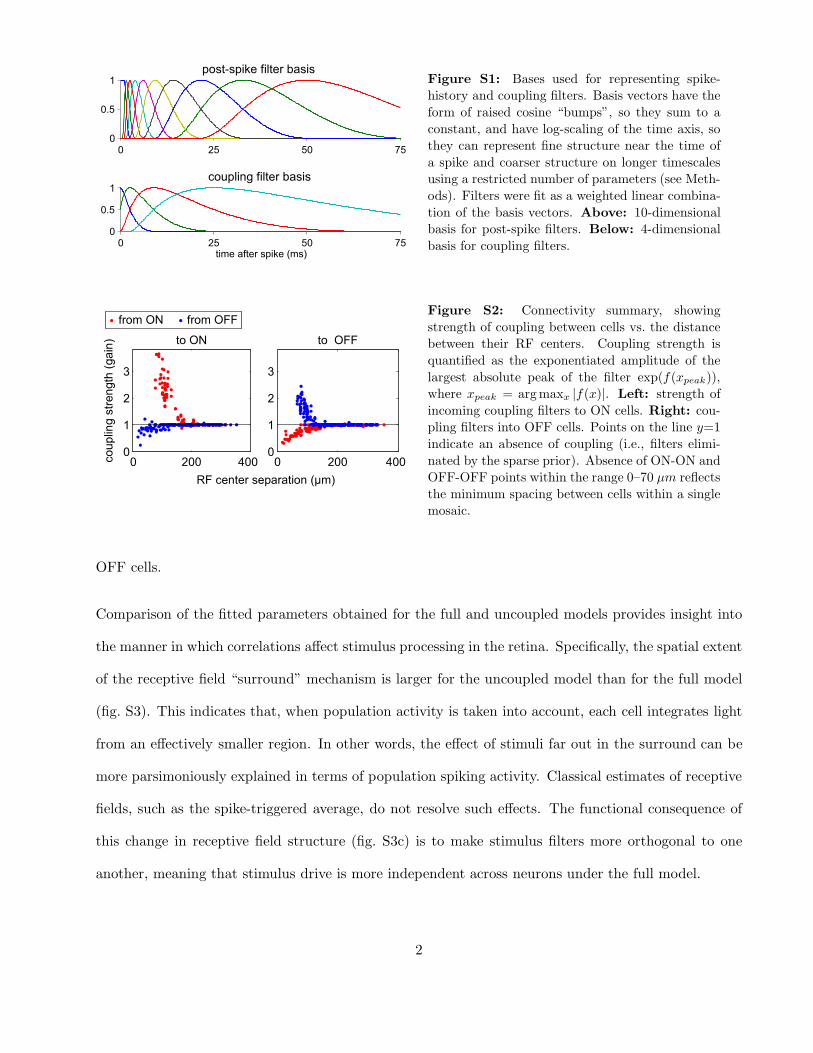
Figure S1 shows the linear bases used to parametrize post-spike filters and coupling filters, respectively.
These bases provide a low-dimensional parametrization of the waveforms, allowing for fine temporal
structure near the time of a spike and coarse temporal structure at longer delays. The raised cosine
form for these vectors means they sum to a constant and are free of temporal aliasing.
Figure S2 shows that coupling strength falls off strongly with the distance between receptive field (RF)
centers, illustrating the fact that coupling effects are primarily restricted to neighboring cells (cf. [2]).
Coupling between ON cells is on average much stronger and extends over larger distances than between
1
�
���
�
�������� ����� ����
������� ����� ����
� �� �� ��
�
���
�
��� ����� ���� ����
� �� �� ��
Figure S1: Bases used for representing spike-
history and coupling filters. Basis vectors have the
form of raised cosine “bumps”, so they sum to a
constant, and have log-scaling of the time axis, so
they can represent fine structure near the time of
a spike and coarser structure on longer timescales
using a restricted number of parameters (see Meth-
ods). Filters were fit as a weighted linear combina-
tion of the basis vectors. Above: 10-dimensional
basis for post-spike filters. Below: 4-dimensional
basis for coupling filters.
�� ������ ��������� ����
���� � ���� ���
� ��� !��
�
�
�
"
�� �
������� �������# �����
� ��� !��
�
�
�
"
�� ���
Figure S2: Connectivity summary, showing
strength of coupling between cells vs. the distance
between their RF centers. Coupling strength is
quantified as the exponentiated amplitude of the
largest absolute peak of the filter exp(f(xpeak)),
where xpeak = argmaxx |f(x)|. Left: strength of
incoming coupling filters to ON cells. Right: cou-
pling filters into OFF cells. Points on the line y=1
indicate an absence of coupling (i.e., filters elimi-
nated by the sparse prior). Absence of ON-ON and
OFF-OFF points within the range 0–70 µm reflects
the minimum spacing between cells within a single
mosaic.
OFF cells.
Comparison of the fitted parameters obtained for the full and uncoupled models provides insight into
the manner in which correlations affect stimulus processing in the retina. Specifically, the spatial extent
of the receptive field “surround” mechanism is larger for the uncoupled model than for the full model
(fig. S3). This indicates that, when population activity is taken into account, each cell integrates light
from an effectively smaller region. In other words, the effect of stimuli far out in the surround can be
more parsimoniously explained in terms of population spiking activity. Classical estimates of receptive
fields, such as the spike-triggered average, do not resolve such effects. The functional consequence of
this change in receptive field structure (fig. S3c) is to make stimulus filters more orthogonal to one
another, meaning that stimulus drive is more independent across neurons under the full model.
2

��������$ � �
������
� ���
���
���
� %���
� � �
�
�
�
���&�� �� ���� �����
��� � ���
���
�
���
���� ��$��
�� �'� �σ�
��������$ ��$��
�
���� ��$��
�
�������$�
���
�������$�
�
Figure S3: Receptive field changes induced by coupling. a, Ellipses show 1 SD contours of a Gaussian fit
to the surround mechanism for each cell, for uncoupled (above) and full models (below). b, Scatter-plot
of RF center and surround sizes; each point represents the estimated RF diameter of a single cell under
full and uncoupled models. Surround width is reduced by roughly 70% in the coupled model, while the
center width is roughly constant. c, Correlation coefficients between all pairs of RFs, under uncoupled
(x-axis) and full models (y-axis), showing RFs to be more orthogonal (i.e., closer to zero-correlation)
under the full model (cf. [5]).
To examine the relative magnitude of the inputs provided by stimulus and coupling-related model
components, we show the net linear input to an example ON cell from the stimulus filter and from
coupling filters from ON cell and to OFF cell activity (fig. S4). The sum of these inputs (including
post-spike filter output) can be loosely interpreted as membrane potential in a “soft-threshold integrate-
and-fire” model: the exponential nonlinearity forms a soft threshold whereby the probability of spiking
increases as a smooth function of membrane depolarization [6]. The relative importance of network-
and stimulus-induced inputs to each cell can be roughly quantified by the amplitude of the fluctuations
they induce in the membrane voltage. Across the population, the standard deviation of the total
network-induced input is approximately 1/2 the standard deviation of the stimulus-induced input in
ON cells, and 1/3 in OFF cells.
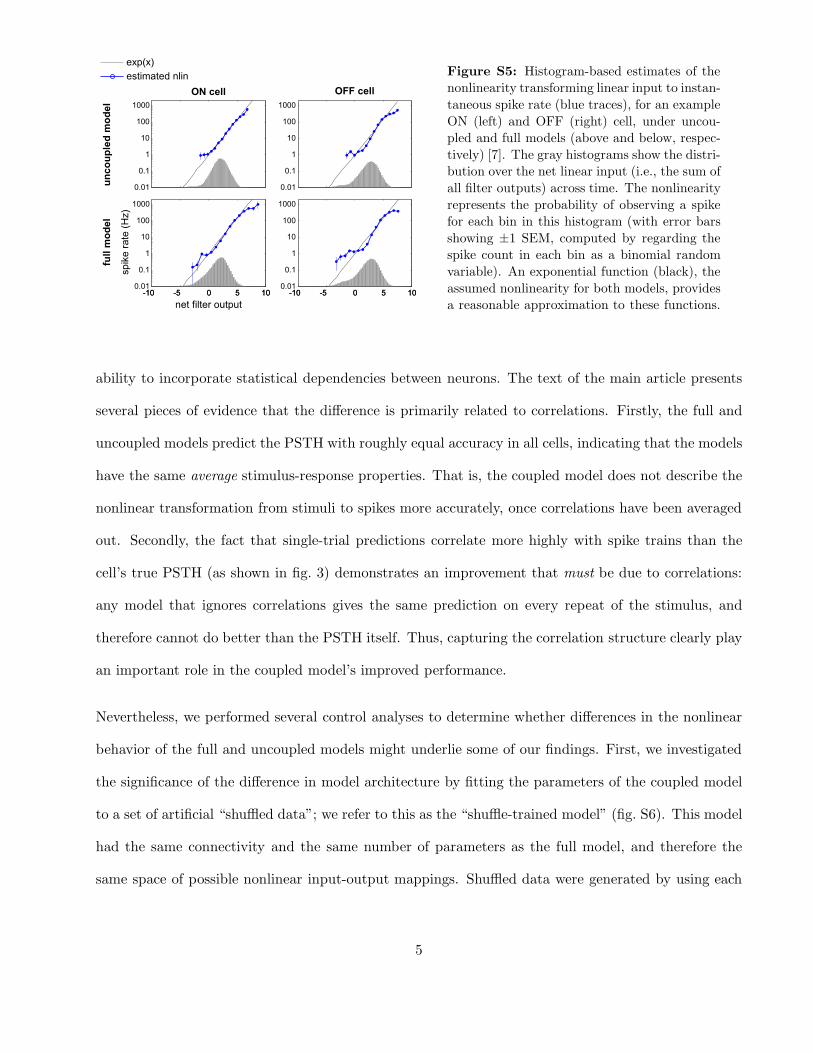
For each cell, the model converts linear input into an instantaneous spike rate by means of an expo-
nential nonlinearity. To assess the adequacy of this assumption, we compare an exponential function
with a direct “reconstruction” estimate of the nonlinearity, computed using the raw distribution of
filter outputs and the observed spike responses (fig. S5) [7]. These reconstructions look reasonably
exponential for both uncoupled and full-model parameter settings, though slightly better for ON than
OFF cells. For comparison, we also performed a complete re-fitting of the model parameters using
3

� ��� ��� "�� !�� ���
�
�
�
!
(
� ��� ��� "�� !�� ���
�
�
��
���� �������
���� � �����
���� ��� �����
��� ����
���� ��$��
��������$
���&��� ���� % ������� ����
��� �����
�����
����� ���� �����
� �����
� ���� �����
��$��
�����
���
�����
�
�
�
��" ��! ��� ��( ���
�
�
!
�
�
��" ��! ��� ��( ���
Figure S4: Relative contribution of stimulus and coupling dependent inputs to an example ON cell.
a, Net linear input from the stimulus, ON cells, and OFF cells during a 500ms stimulus segment on a
single trial, with true spike times of the ON cell shown above (black dots). Traces show the output of
the stimulus filter (black), and the summed outputs of coupling filters from ON cells (red) and from OFF
cells (blue). b, Summing the three traces above gives the net external input to the cell (purple trace),
plotted alongside the stimulus-dependent input to this cell under the uncoupled model (its only external
input). Exponentiating the total input (which also includes input from the post-spike filter, omitted here
for visual clarity) gives the instantaneous spike rate of the model. c, Histogram showing the relative
magnitude of stimulus and population-induced inputs to each cell under the full model. x-axis is the
ratio of the standard deviation of each of these inputs (where population input is the sum of ON and
OFF inputs). Population-induced input tends to be approximately half as strong as stimulus-induced
input in ON cells (above), and about a third as strong in OFF cells (below).
output nonlinearities given by a half-wave rectified linear function and by log(1+exp(x)), which grows
linearly for large x and decays like ex for negative values. These models gave much lower likelihoods
for the observed data and exhibited poorer cross-validation performance.
Finally, we re-fit both full and coupled models using a flexible nonlinearity, parametrized as a cubic
spline with 8 piecewise polynomial segments. This addition conferred a slight improvement in cross-
validation performance (see fig. S7), and it did not elicit a noticeable change in the fitted filters. We
return to this model under Control Analyses, below.
Control Analyses
Although they have the same functional form, one might wonder whether the difference in performance
of the full and uncoupled models arises from some functional differences other than the full model’s
4
����
���
�
��
���
����
�������
��� ����� ������
����
���
�
��
���
����
�� � � � ��
����
���
�
��
���
����
�� � � � ���� � � � ��
����
���
�
��
���
����
�� � � � ��
������
�)��)�
�������$ ���
��� ���������
���������
���� ���� �*'�
Figure S5: Histogram-based estimates of the
nonlinearity transforming linear input to instan-
taneous spike rate (blue traces), for an example
ON (left) and OFF (right) cell, under uncou-
pled and full models (above and below, respec-
tively) [7]. The gray histograms show the distri-
bution over the net linear input (i.e., the sum of
all filter outputs) across time. The nonlinearity
represents the probability of observing a spike
for each bin in this histogram (with error bars
showing ±1 SEM, computed by regarding the
spike count in each bin as a binomial random
variable). An exponential function (black), the
assumed nonlinearity for both models, provides
a reasonable approximation to these functions.
ability to incorporate statistical dependencies between neurons. The text of the main article presents
several pieces of evidence that the difference is primarily related to correlations. Firstly, the full and
uncoupled models predict the PSTH with roughly equal accuracy in all cells, indicating that the models
have the same average stimulus-response properties. That is, the coupled model does not describe the
nonlinear transformation from stimuli to spikes more accurately, once correlations have been averaged
out. Secondly, the fact that single-trial predictions correlate more highly with spike trains than the
cell’s true PSTH (as shown in fig. 3) demonstrates an improvement that must be due to correlations:
any model that ignores correlations gives the same prediction on every repeat of the stimulus, and
therefore cannot do better than the PSTH itself. Thus, capturing the correlation structure clearly play
an important role in the coupled model’s improved performance.
Nevertheless, we performed several control analyses to determine whether differences in the nonlinear
behavior of the full and uncoupled models might underlie some of our findings. First, we investigated
the significance of the difference in model architecture by fitting the parameters of the coupled model
to a set of artificial “shuffled data”; we refer to this as the “shuffle-trained model” (fig. S6). This model
had the same connectivity and the same number of parameters as the full model, and therefore the
same space of possible nonlinear input-output mappings. Shuffled data were generated by using each
5

cell’s true spike times in conjunction with simulated spikes from neighboring neurons, elicited by a
presentation of the same stimulus to the coupled model.1 These training data therefore preserved the
stimulus dependence of the population response but removed its noise correlation structure. Figure
S6 shows the coupling filters obtained for an example ON and OFF cell, compared to those estimated
for the full model. Unsurprisingly, the shuffle-trained model exhibited similar PSTH prediction to the
full and uncoupled models. It exhibited a negligible improvement in predicting spike times (fig. S6,
right), and a < 1% increase in Bayesian decoding performance (not shown), over the uncoupled model.
Therefore, without access to the correlation structure present in simultaneous activity, the full-model
architecture behaves like the independent model, and is unable to extract more information from the
population responses.
� !�
�
�
"
!
��� ����
���
� ����
������ ��$��
�#����������$
� !�
���
�
���
�
��� ����
��� ����� ���
�
����
���
����
���
����
+ ����,����� ����%���
� ����������� ����������� ��������������
Figure S6: Control analysis #1: coupled model trained using shuffled spike data. The coupled model
(assuming the same connectivity as the original coupled model) was fit to artificial “shuffled” data,
where the stimulus dependence of the spikes used for fitting was intact, but the correlation structure was
removed by shuffling. Left: coupling waveforms (blue) obtained for an ON and OFF cell fit to shuffled
data, compared with the original waveforms fit to the true (simultaneously recorded) data (red). Right:
improvement in spike timing prediction of the original full and shuffle-trained models over the uncoupled
model.
A second group of control analyses was performed using versions of the coupled and uncoupled models
with more complicated nonlinear properties (fig. S7). If the full model’s advantage over the uncoupled
model were due to richer stimulus-processing capabilities, rather than its ability to capture correlations,
1We were forced to use simulated data for the shuffled spike-times of neighboring cells due to the fact that we did not
have multiple repeats of a long-duration stimulus. We also simulated a full set of simultaneous data from the model to
ensure that fitting the full model to this data returned a consistent estimate of the full model parameters. Thus, any
stimulus-related features that are capturable by the model were accurately reproduced by this shuffling procedure.
6
one would expect to see the advantage disappear once once both models had access to a sufficiently
rich class of nonlinearities. We therefore fit the data using several more-complicated “control models”,
which included:
• a point process model with a flexible (instead of exponential) nonlinearity for each cell, parametrized
using cubic splines
• a stochastic, leaky integrate-and-fire model with post-spike current ([8], and compared in [9])
• a point process model with multiple stimulus filters (excitatory and suppressive), giving each cell
sensitivity to multiple dimensions of the stimulus space (cf. [10]).
In the third model, the conditional intensity depended on the squared outputs of additional excitatory
and suppressive filters, and was given by λ = λ0
(
∏
e
(1+(ke ·x)2))/(
∏
i
(1+(ki ·x)2))
, where λ0 is the
conditional intensity formulated in the original model, x is the stimulus and {ke} and {ks} are stimulus
filters providing quadratic excitatory and suppressive input, respectively. We used two excitatory and
two suppressive filters, and fit all parameters (including those governing λ0) via gradient ascent of the
likelihood function. Two versions of each of these control models were fit: one uncoupled, with each
cell conditionally independent of the others, and a second with coupling, allowing the model to capture
joint dependencies in the response.
For all three control models (fig. S7), the effects of incorporating coupling between cells were directly
analogous to the effects in the original model: PSTH prediction was equally accurate with and without
coupling (left panel), while spike-timing prediction (middle) and decoding performance (right) exhib-
ited significant improvements under coupling. Most importantly, the magnitude of the increase in
encoding and decoding performance due to coupling was relatively constant across models (i.e., 20%
more stimulus information preserved when the population response is decoded under a coupled model).
This suggests that the nonlinear stimulus-response properties and response correlation structure make
relatively independent contributions to the model’s performance. Moreover, these results show that
7
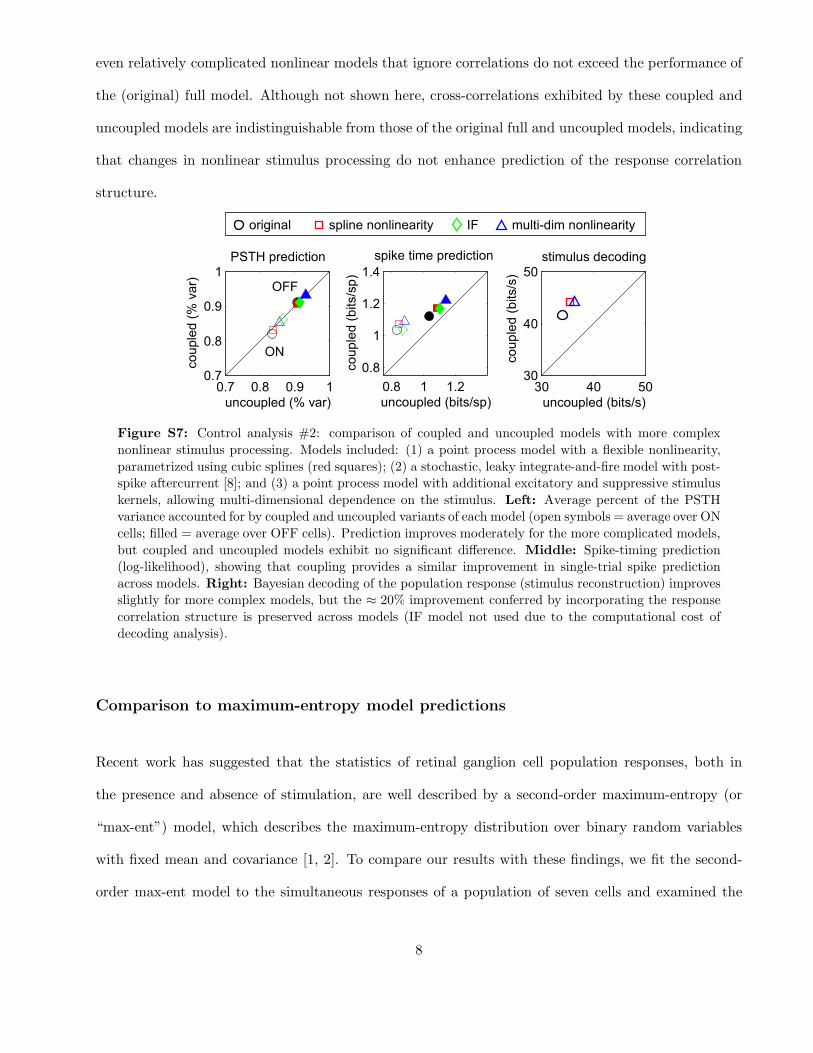
even relatively complicated nonlinear models that ignore correlations do not exceed the performance of
the (original) full model. Although not shown here, cross-correlations exhibited by these coupled and
uncoupled models are indistinguishable from those of the original full and uncoupled models, indicating
that changes in nonlinear stimulus processing do not enhance prediction of the response correlation
structure.
��� ��- ��. �
���
��-
��.
�
��������$ �+ ,���
������$ �+ ,���
/01* ���$����
��- � ���
��-
�
���
��!
��������$ ����%���
������$ ����%���
���� ��� ���$����
"� !� ��
"�
!�
��
������� $���$��
��������$ ����%��
������$ ����%��
������ ����� ���������2 3� ����$� ���������2
�
���
Figure S7: Control analysis #2: comparison of coupled and uncoupled models with more complex
nonlinear stimulus processing. Models included: (1) a point process model with a flexible nonlinearity,
parametrized using cubic splines (red squares); (2) a stochastic, leaky integrate-and-fire model with post-
spike aftercurrent [8]; and (3) a point process model with additional excitatory and suppressive stimulus
kernels, allowing multi-dimensional dependence on the stimulus. Left: Average percent of the PSTH
variance accounted for by coupled and uncoupled variants of each model (open symbols = average over ON
cells; filled = average over OFF cells). Prediction improves moderately for the more complicated models,
but coupled and uncoupled models exhibit no significant difference. Middle: Spike-timing prediction
(log-likelihood), showing that coupling provides a similar improvement in single-trial spike prediction
across models. Right: Bayesian decoding of the population response (stimulus reconstruction) improves
slightly for more complex models, but the ≈ 20% improvement conferred by incorporating the response
correlation structure is preserved across models (IF model not used due to the computational cost of
decoding analysis).
Comparison to maximum-entropy model predictions
Recent work has suggested that the statistics of retinal ganglion cell population responses, both in
the presence and absence of stimulation, are well described by a second-order maximum-entropy (or
“max-ent”) model, which describes the maximum-entropy distribution over binary random variables
with fixed mean and covariance [1, 2]. To compare our results with these findings, we fit the second-
order max-ent model to the simultaneous responses of a population of seven cells and examined the
8

observed and predicted frequencies of 7-digit binary words, indicating which cells spiked in a 10 ms
window (for each cell: 0 = ‘no spikes’; 1 = ‘one or more spikes’). We compared RGC word frequen-
cies collected during 8 minutes of stimulation with those emitted by the (simulated) max-ent model
and coupled/uncoupled generalized linear point process models (fig. S8). The max-ent and coupled
point-process models match the observed frequencies with approximately equal accuracy, while the
uncoupled-model prediction is noticeably less inaccurate. The coupled model is therefore consistent
with predictions of the second-order max-ent model.
��
!
��
"
��
�
��
�
��������2
� � �����
���� 4
����2 �������
� "� (! .( ��-
�
�
�56
��)���
���� 578
��������$
��
!
��
"
��
�
��
�
� ��� �����
���� 4
����2 �������
� "� (! .( ��-
�
�
Figure S8: Comparison of 7-neuron binary word frequencies with the predictions of a 2nd-order
maximum-entropy model [1, 2]. Left: Distribution over binary words, computed using simultaneous
responses of 7 ON cells (shown inset) in 10 ms bins. Binary words (shown along x axis) have been sorted
by their observed frequency in the actual RGC population response (black trace), and are compared with
observed word frequencies from the maximum-entropy (red), coupled (blue) and uncoupled model (gray).
Right: Analogous plots for a collection of 7 OFF cells. In both cases, the coupled model provides similar
accuracy to the max-ent model in predicting word frequencies of RGC population, while the uncoupled
model performs substantially less accurately.
However, the generalized linear model makes an important advance over the maximum-entropy model
by incorporating both stimulus dependence and the full time-course of response correlations. Stimulus
dependence is especially important, because it is essential for determining whether correlations affect
the stimulus-coding properties of the neural population. The max-ent model used here provides a
description of the marginal distribution over responses, P (r), while the point-process models describes
the conditional response distribution, P (r|stim); only the latter distribution captures the relationship
between correlations and stimulus encoding.
9

More generally, the fact that P (r) can be well described by a second-order maximum entropy model
does not imply the same for P (r|stim). We can illustrate this with a simple example: consider 3
neurons encoding 2 discrete stimuli (‘A’ and ‘B’) according to the following rule: if A is presented, an
odd number of neurons spike, with each possible spike pattern (100, 010, 001, 111) occurring with equal
probability; if stimulus B is presented, an even number of neurons spike, again with all possible patterns
(000, 011, 101, 110) equally likely. A second-order max-ent model cannot represent the conditional
distributions P (r|A) and P (r|B), because third-order correlations are essential to this encoding rule—
at least one neuron must have access to both its neighbors’ responses when deciding whether or not to
spike. However, if A and B occur equally often, then all 8 spike patterns occur with equal probability,
so the marginal distribution P (r) is independent, and therefore consistent with a first-order maximum
entropy description.
When comparing the second-order maximum-entropy model and the generalized linear point-process
model, it is also worth noting that, although both models capture statistical dependencies using pair-
wise interactions between neurons, responses of the point process model are not necessarily maximum-
entropy for any set of constraints on the moments of the response distribution (e.g., 2’nd order corre-
lations). This means that the point-process model does not offer a breakdown of the total entropy by
order (i.e., 1st, 2nd, 3rd-order effects), but it might in principle capture higher-order correlations that
differ from a second-order maximum entropy prediction.
Connection to pairwise analyses and Poisson spiking model
Previous work on the importance of correlations in neural coding has focused primarily on pairs of
neurons, due in part to the large amounts of data needed for information-theoretic (i.e., model-free)
analyses of joint coding [3]. To provide a more direct link to these studies, we repeated the decoding
analysis shown in fig. 4 using isolated pairs of neurons. Consistent with earlier findings, we observed that
preserving the response correlation structure between pairs provides a ≤ 10% increase in information.
10

Our results therefore indicate that the full set of spatio-temporal correlations in a neural population
account for more information than is observed for isolated pairs.
Analysis of a full population is critical because pairwise analyses can provide little evidence about the
importance of correlations across an entire population. Pairwise measurements are blind to third and
higher-order response statistics, meaning there is no limit to the information that could be encoded
using higher-order features of the population response. Moreover, second-order pairwise correlations
can have radically different influences on the information content of the full population (fig. S9).
For an idealized example, consider a population of n neurons, where each neuron contributes I0 bits
independently, and the correlations between any two neurons contribute 0.2I0 bits, so that for any two
isolated neurons, the percent increase in information due to the correlations is (0.2I0)/(2I0)×100 = 10%.
Now if correlations between any pair of neurons contribute the same information as the correlations
between any other pair of neurons (i.e., complete dependence of the pairwise correlations), then the
increase due to correlations for the full population is (0.2I0)/(nI0) × 100 = (20/n)%, giving a 0.7%
increase for our population of 27 cells. On the other hand, if each set of pairwise correlations contributes
independent information, the increase due to correlations for the full population is ((
n
2
)
0.2I0)/(nI0)×100
= 10(n − 1)%, giving a 260% increase for our population (fig. S9). The range of values consistent with
pairwise measurements is thus extremely large, and it can increase or decrease with the number of
neurons. Determining the importance of correlated spiking across a full population therefore goes
significantly beyond the implications of pairwise analyses.
Lastly, to connect with one of the standard models in the literature, we compared the encoding per-
formance of the generalized linear point-process model with the classic linear-nonlinear-Poisson (LNP)
model [11], which lacks both spike-history dependence and coupling between cells (fig. S10). The LNP
model predicts both the PSTH (left) and the timing of spikes (right) less accurately than either the
full or the uncoupled model, though it still provides more accurate Bayesian stimulus decoding than
an optimal linear decoder (fig. 4).
11
���%��� � %��� � %�
�
�
!
(
-
��
��������� ��� �+�
/�� 9���$��
��� �2�� 4 �������
� �� �� ��
�
���
���
"��
��������� ��� �+�
:)���������� ���� /���
�� /���������
���������
&�# ���&��
�������
�������
�� �� ;���#�
���$2
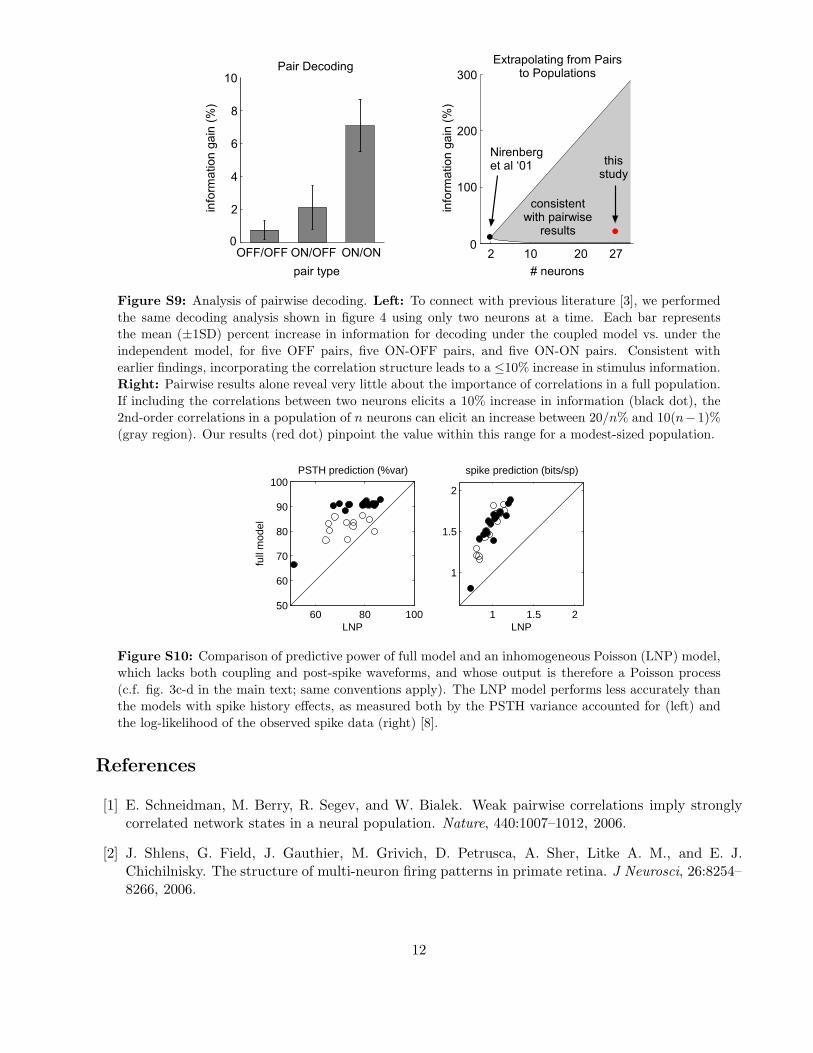
Figure S9: Analysis of pairwise decoding. Left: To connect with previous literature [3], we performed
the same decoding analysis shown in figure 4 using only two neurons at a time. Each bar represents
the mean (±1SD) percent increase in information for decoding under the coupled model vs. under the
independent model, for five OFF pairs, five ON-OFF pairs, and five ON-ON pairs. Consistent with
earlier findings, incorporating the correlation structure leads to a ≤10% increase in stimulus information.
Right: Pairwise results alone reveal very little about the importance of correlations in a full population.
If including the correlations between two neurons elicits a 10% increase in information (black dot), the
2nd-order correlations in a population of n neurons can elicit an increase between 20/n% and 10(n−1)%
(gray region). Our results (red dot) pinpoint the value within this range for a modest-sized population.
1 1.5 2
1
1.5
2
spike prediction (bits/sp)
LNP60 80 100
50
60
70
80
90
100PSTH prediction (%var)
LNP
full
mod
el
Figure S10: Comparison of predictive power of full model and an inhomogeneous Poisson (LNP) model,
which lacks both coupling and post-spike waveforms, and whose output is therefore a Poisson process
(c.f. fig. 3c-d in the main text; same conventions apply). The LNP model performs less accurately than
the models with spike history effects, as measured both by the PSTH variance accounted for (left) and
the log-likelihood of the observed spike data (right) [8].
References
[1] E. Schneidman, M. Berry, R. Segev, and W. Bialek. Weak pairwise correlations imply stronglycorrelated network states in a neural population. Nature, 440:1007–1012, 2006.
[2] J. Shlens, G. Field, J. Gauthier, M. Grivich, D. Petrusca, A. Sher, Litke A. M., and E. J.Chichilnisky. The structure of multi-neuron firing patterns in primate retina. J Neurosci, 26:8254–8266, 2006.
12

[3] S. Nirenberg, S. Carcieri, A. Jacobs, and P. Latham. Retinal ganglion cells act largely as indepen-dent encoders. Nature, 411:698–701, 2001.
[4] L. Paninski. Maximum likelihood estimation of cascade point-process neural encoding models.Network: Computation in Neural Systems, 15:243–262, 2004.
[5] S. H. DeVries. Correlated firing in rabbit retinal ganglion cells. J. Neurophysiol., 81(2):908–920,1999.
[6] H. Plesser and W. Gerstner. Noise in integrate-and-fire neurons: From stochastic input to escaperates. Neural Computation, 12:367–384, 2000.
[7] E. J. Chichilnisky. A simple white noise analysis of neuronal light responses. Network: Computation
in Neural Systems, 12:199–213, 2001.
[8] J. W. Pillow, L. Paninski, V. J. Uzzell, E. P. Simoncelli, and E. J. Chichilnisky. Prediction anddecoding of retinal ganglion cell responses with a probabilistic spiking model. The Journal of
Neuroscience, 25:11003–11013, 2005.
[9] L. Paninski, J. W. Pillow, and J. Lewi. Statistical models for neural encoding, decoding, and opti-mal stimulus design. In P. Cisek, T. Drew, and J. Kalaska, editors, Computational Neuroscience:
Theoretical Insights Into Brain Function, Progress in Brain Research. Elsevier, 2007.
[10] N. C. Rust, O. Schwartz, J. A. Movshon, and E. P. Simoncelli. Spatiotemporal elements of macaquev1 receptive fields. Neuron, 46(6):945–956, 2005.
[11] E. P. Simoncelli, L. Paninski, J. Pillow, and O. Schwartz. Characterization of neural responseswith stochastic stimuli. In M. Gazzaniga, editor, The Cognitive Neurosciences, pages 327–338.MIT Press, 3rd edition, 2004.
13


