
• •
> >
> >
• •
> >
• •
• •
> >
• • • •
Spectrogram Examples
IntroductionA spectrogram illustrates how the constituent frequencies of a signal vary over time. This application generates the spectrogram of several audio files, including a
DTMS tone, human voice saying “MapleSim”, violin note played with vibrato, and an entire violin scale,C8 piano note,series of dolphin clicks,and more.
Interestingly, some electronic musicians hide images in their music; you can only view these images with a spectrogram of the appropriate part of the audio. This includes the track “My Violent Heart” by the Nine Inch Nails; you can view this spectrogram in this application.
The Spectrogram function was introduced in Maple 18, and also lets you plot the waveform and power spectrum
restart :
with SignalProcessing :
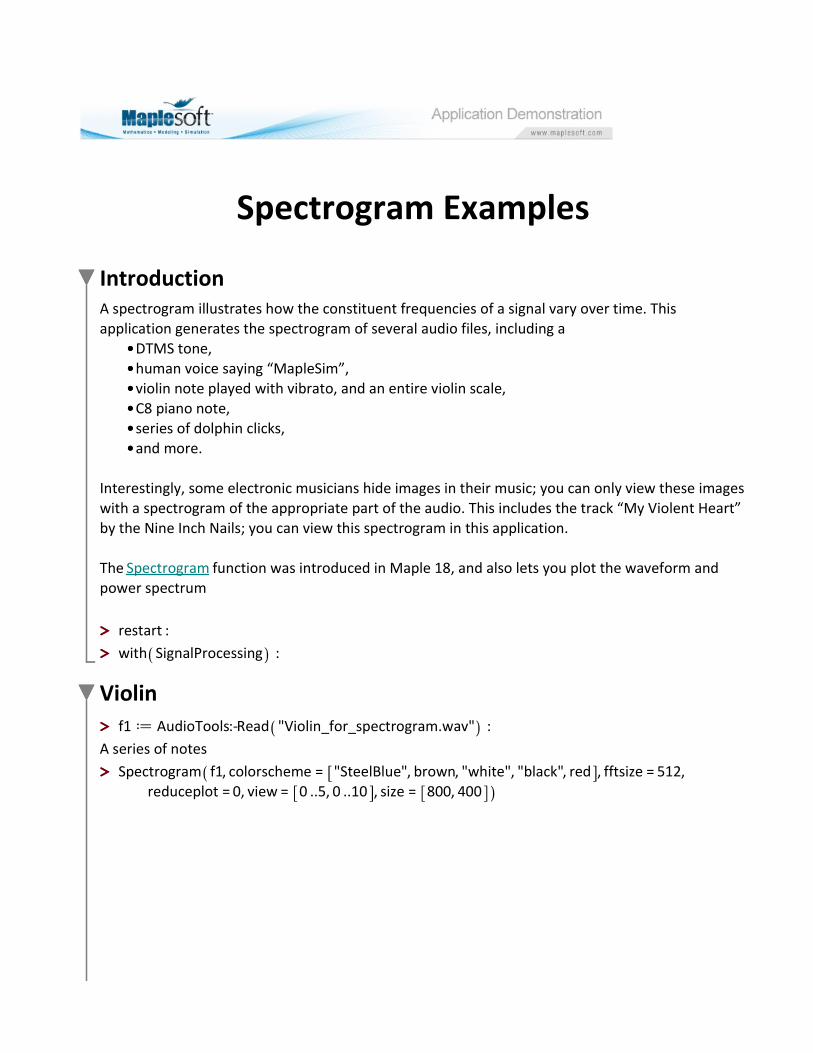
Violin
f1 d AudioTools:-Read "Violin_for_spectrogram.wav" :
A series of notes
Spectrogram f1, colorscheme = "SteelBlue", brown, "white", "black", red , fftsize = 512, reduceplot = 0, view = 0 ..5, 0 ..10 , size = 800, 400
> >
> >
> >
> >
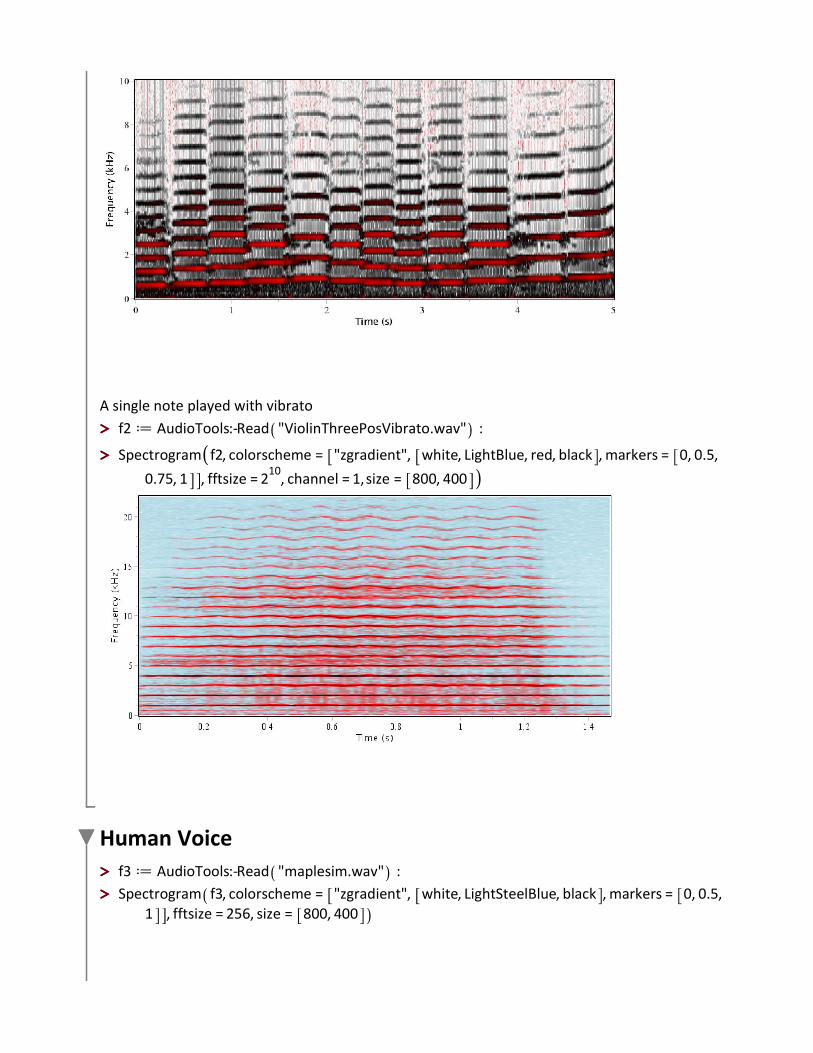
A single note played with vibrato
f2 d AudioTools:-Read "ViolinThreePosVibrato.wav" :
Spectrogram f2, colorscheme = "zgradient", white, LightBlue, red, black , markers = 0, 0.5,
0.75, 1 , fftsize = 210
, channel = 1, size = 800, 400
Human Voice
f3 d AudioTools:-Read "maplesim.wav" :
Spectrogram f3, colorscheme = "zgradient", white, LightSteelBlue, black , markers = 0, 0.5,1 , fftsize = 256, size = 800, 400
> >
> >
> >
> >
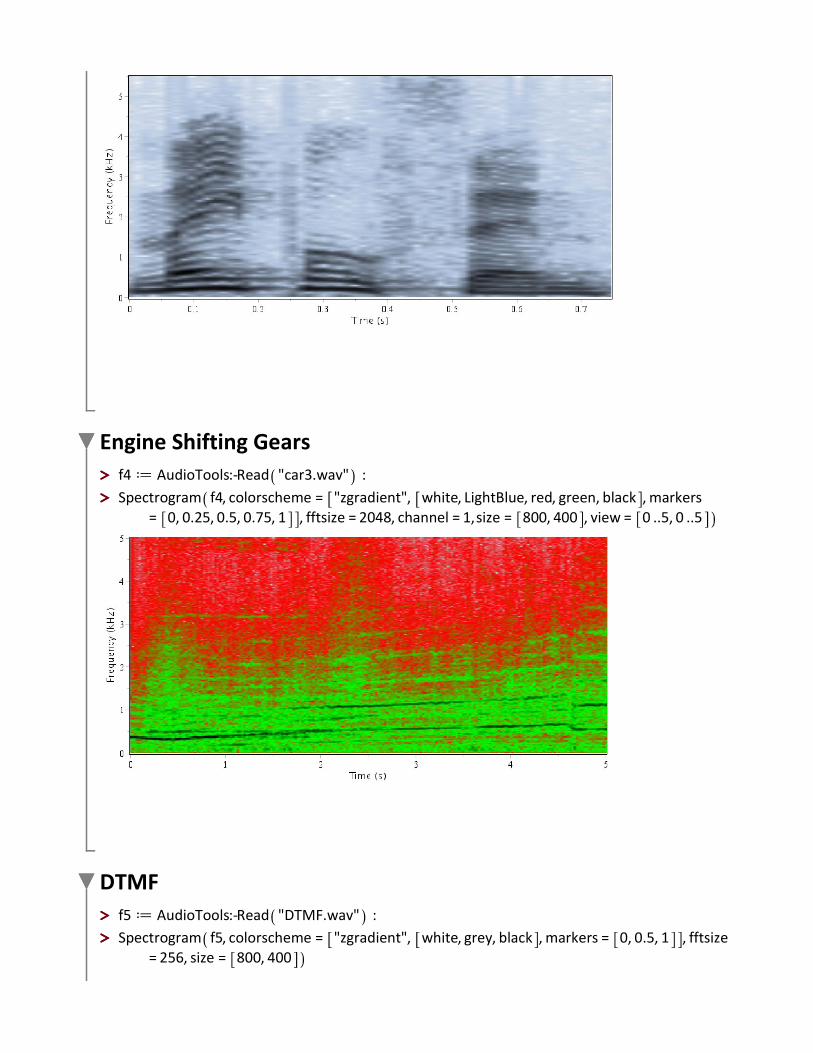
Engine Shifting Gears
f4 d AudioTools:-Read "car3.wav" :
Spectrogram f4, colorscheme = "zgradient", white, LightBlue, red, green, black , markers= 0, 0.25, 0.5, 0.75, 1 , fftsize = 2048, channel = 1, size = 800, 400 , view = 0 ..5, 0 ..5
DTMF
f5 d AudioTools:-Read "DTMF.wav" :
Spectrogram f5, colorscheme = "zgradient", white, grey, black , markers = 0, 0.5, 1 , fftsize= 256, size = 800, 400

> >
> >
> >
> >
Ding
f6 d AudioTools:-Read "ding.wav" :
Spectrogram f6, colorscheme = "zgradient", white, grey, red , markers = 0, 0.5, 1 , fftsize= 512, size = 800, 400
Dolphin Clicks
f7 d AudioTools:-Read "dolphin.wav" :
Spectrogram f7, colorscheme = "zgradient", white, grey, SteelBlue, black , markers = 0, 0.5,0.85, 1 , fftsize = 256, size = 800, 400 , channel = 1, view = 0 ..0.7, 0 ..4
> >
> >
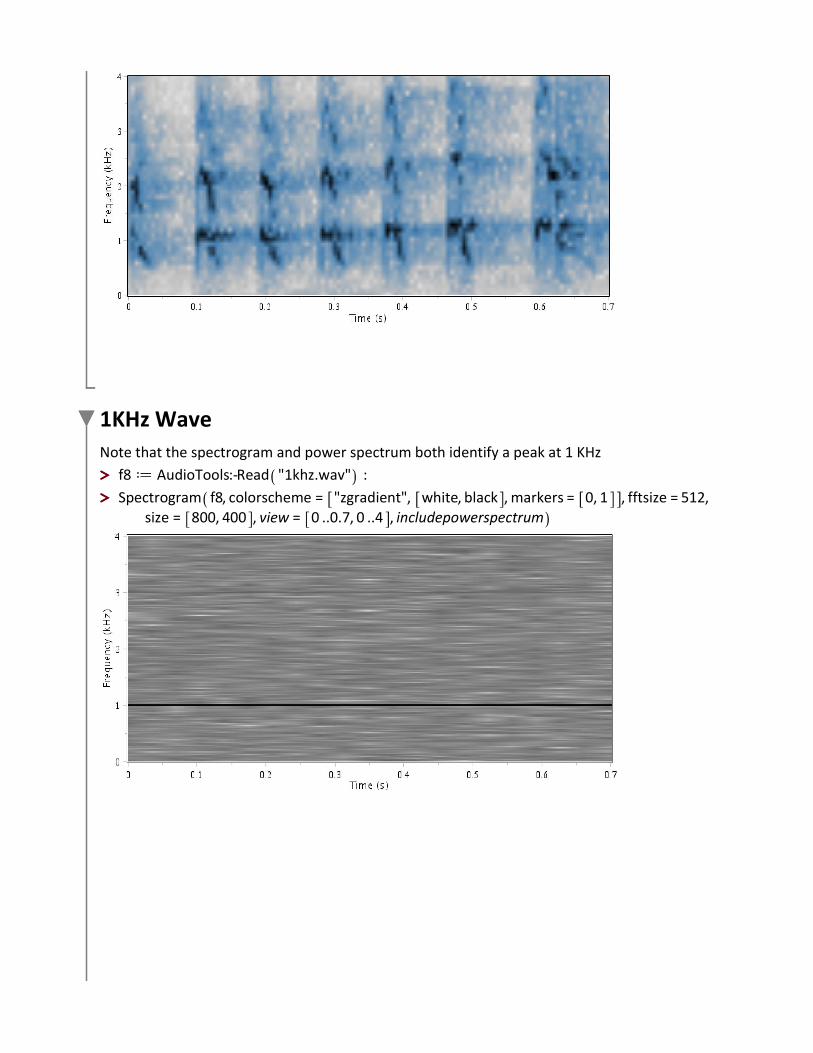
1KHz Wave
Note that the spectrogram and power spectrum both identify a peak at 1 KHz
f8 d AudioTools:-Read "1khz.wav" :
Spectrogram f8, colorscheme = "zgradient", white, black , markers = 0, 1 , fftsize = 512,size = 800, 400 , view = 0 ..0.7, 0 ..4 , includepowerspectrum
> >
> >
> >
> >
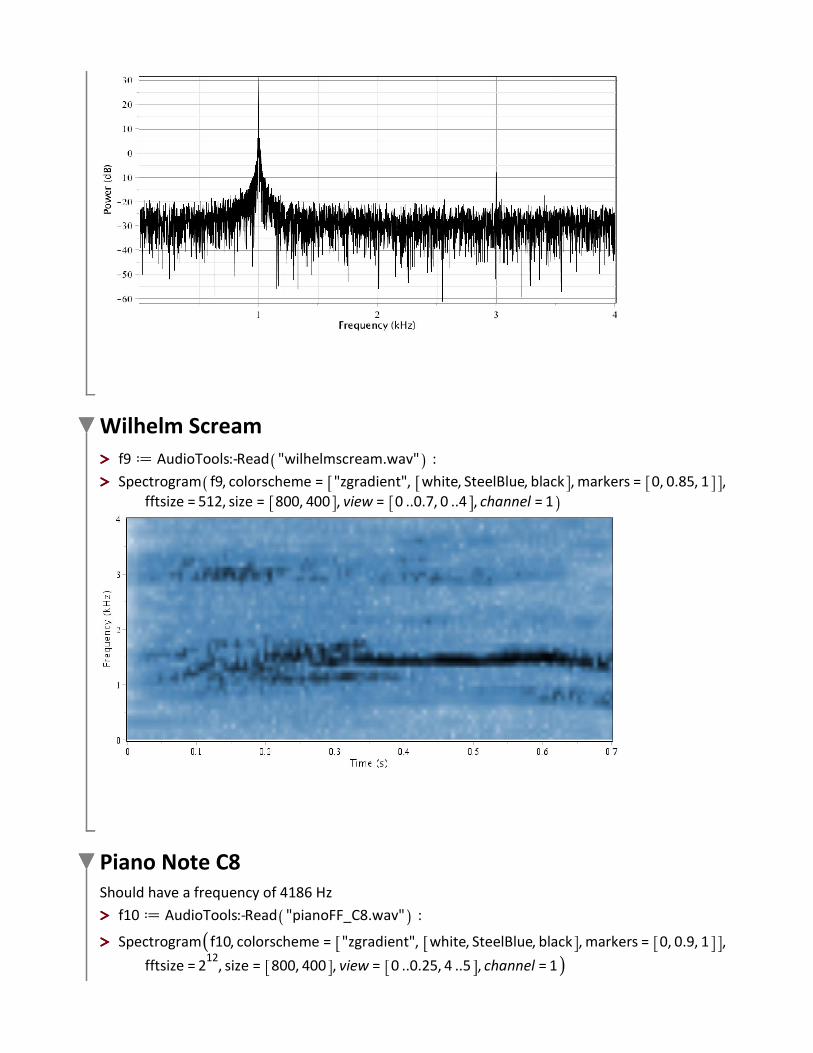
Wilhelm Scream
f9 d AudioTools:-Read "wilhelmscream.wav" :
Spectrogram f9, colorscheme = "zgradient", white, SteelBlue, black , markers = 0, 0.85, 1 ,fftsize = 512, size = 800, 400 , view = 0 ..0.7, 0 ..4 , channel = 1
Piano Note C8Should have a frequency of 4186 Hz
f10 d AudioTools:-Read "pianoFF_C8.wav" :
Spectrogram f10, colorscheme = "zgradient", white, SteelBlue, black , markers = 0, 0.9, 1 ,
fftsize = 212
, size = 800, 400 , view = 0 ..0.25, 4 ..5 , channel = 1
> >
> >
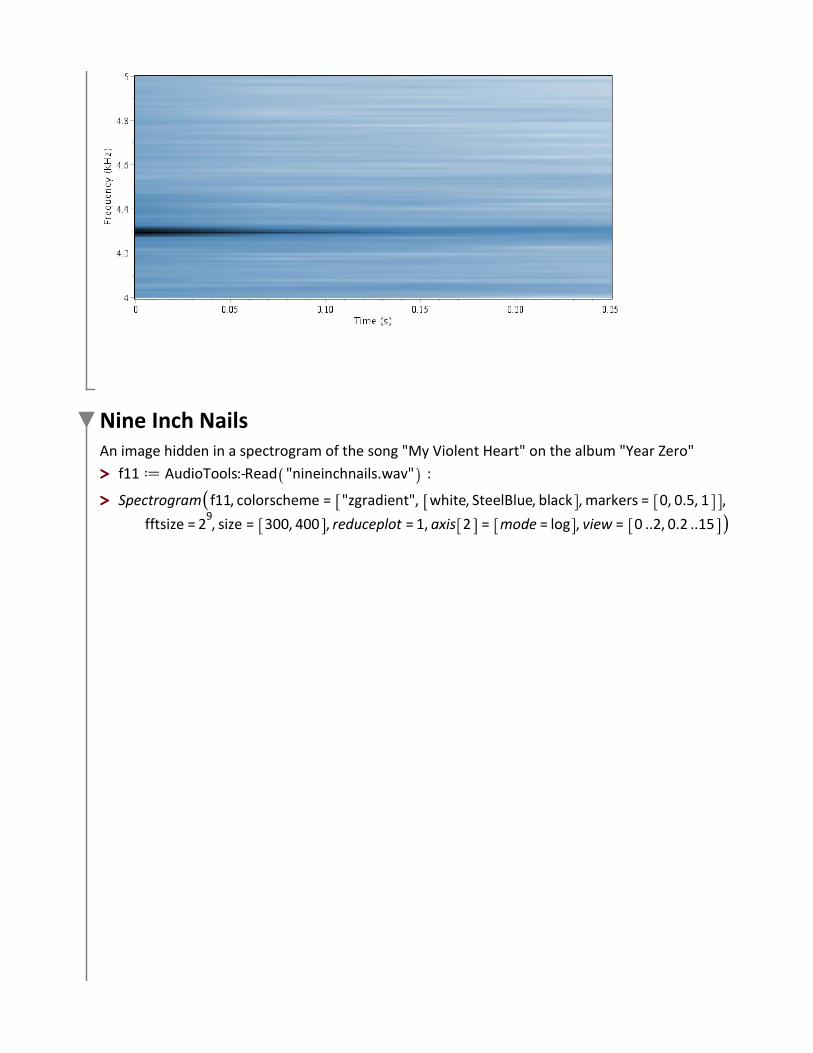
Nine Inch NailsAn image hidden in a spectrogram of the song "My Violent Heart" on the album "Year Zero"
f11 d AudioTools:-Read "nineinchnails.wav" :
Spectrogram f11, colorscheme = "zgradient", white, SteelBlue, black , markers = 0, 0.5, 1 ,
fftsize = 29, size = 300, 400 , reduceplot = 1, axis 2 = mode = log , view = 0 ..2, 0.2 ..15
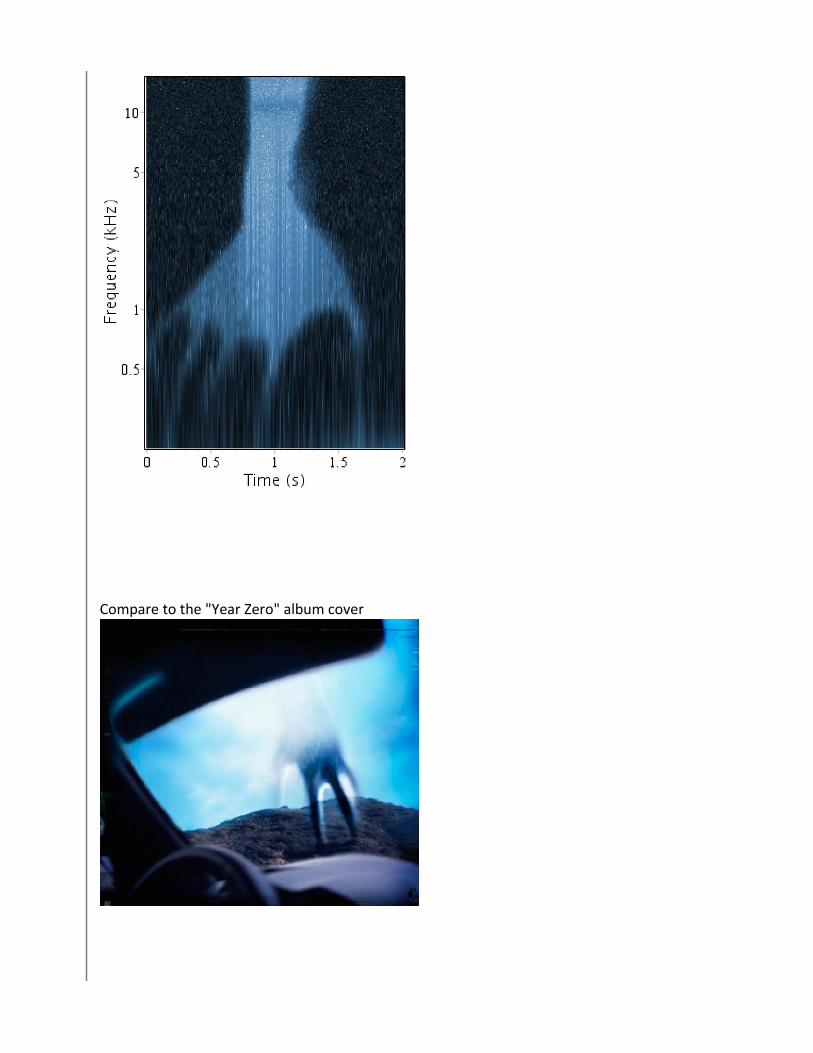
Compare to the "Year Zero" album cover
> >
> >
> >
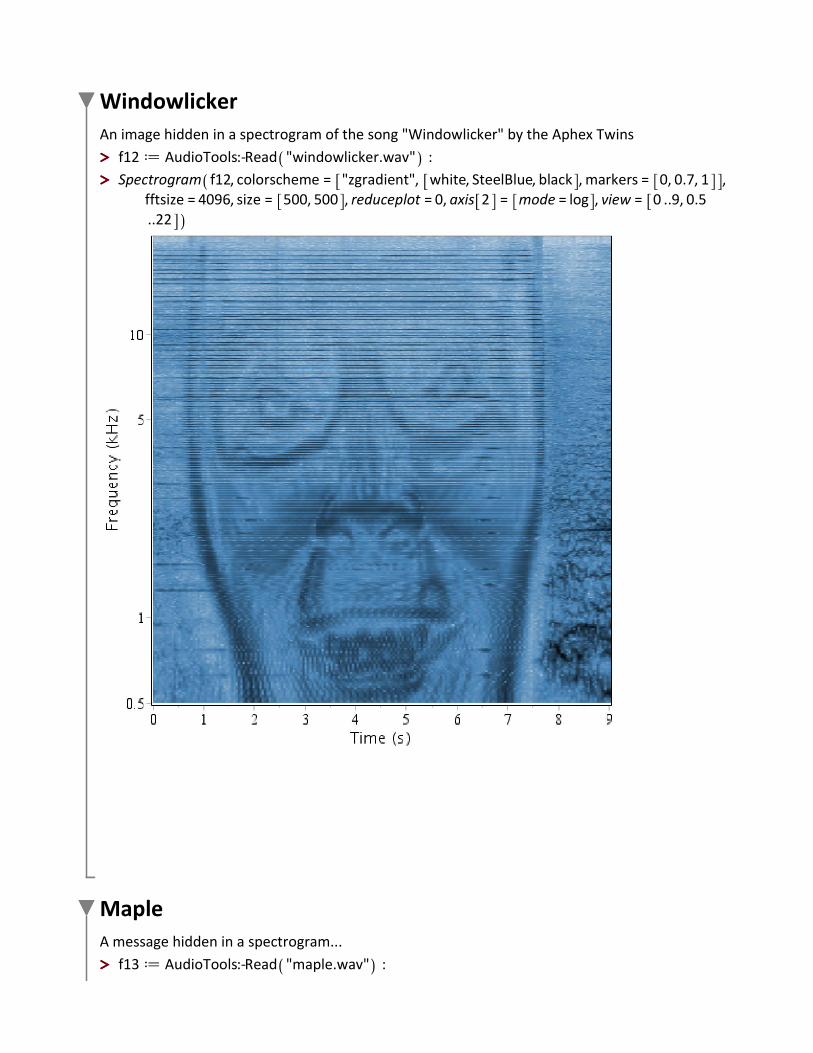
Windowlicker
An image hidden in a spectrogram of the song "Windowlicker" by the Aphex Twins
f12 d AudioTools:-Read "windowlicker.wav" :
Spectrogram f12, colorscheme = "zgradient", white, SteelBlue, black , markers = 0, 0.7, 1 ,fftsize = 4096, size = 500, 500 , reduceplot = 0, axis 2 = mode = log , view = 0 ..9, 0.5..22
Maple
A message hidden in a spectrogram...
f13 d AudioTools:-Read "maple.wav" :
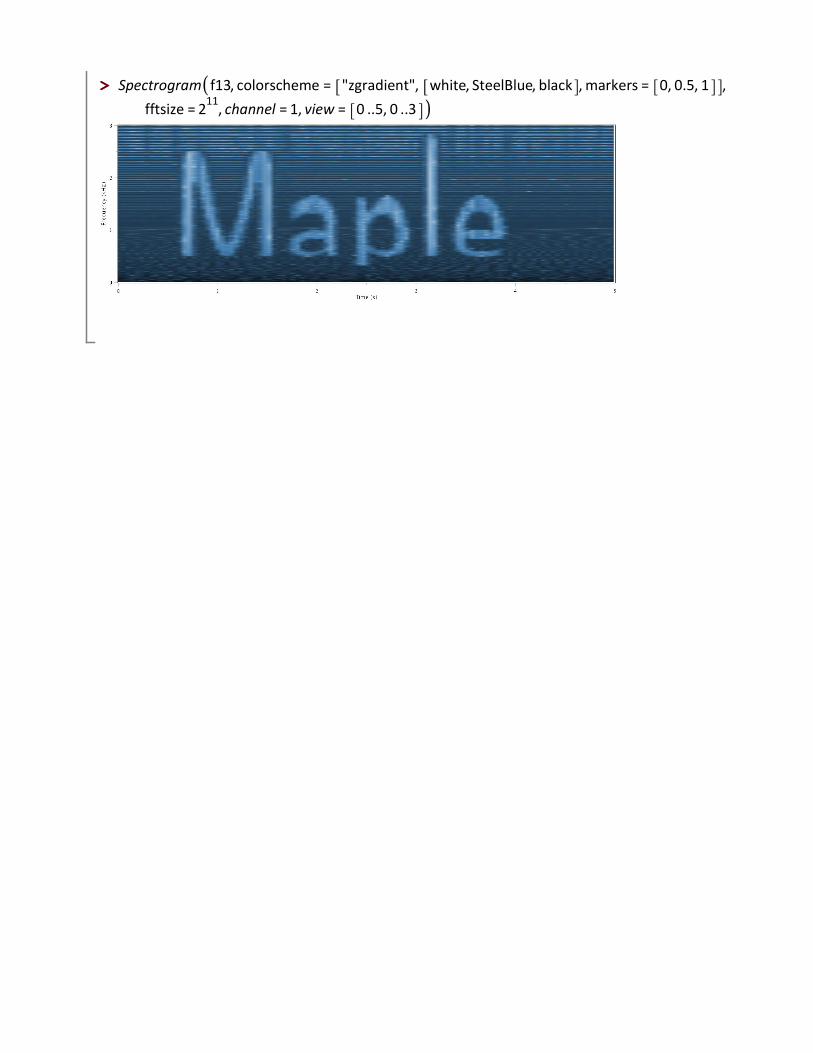
> > Spectrogram f13, colorscheme = "zgradient", white, SteelBlue, black , markers = 0, 0.5, 1 ,
fftsize = 211
, channel = 1, view = 0 ..5, 0 ..3


