

The business of sustainability
Spring Farm Advanced Resource Recovery Technology Facility
Odour Assessment
8 June 2020
Project No.: 0505960

www.erm.com Version: 02 Project No.: 0505960 Client: SUEZ 8 June 2020 Page ii
Document details
Document title Spring Farm Advanced Resource Recovery Technology Facility
Document subtitle Odour Assessment
Project No. 0505960
Date 8 June 2020
Version 02
Author Madeleine Lewis, Jane Barnett
Client Name SUEZ
Document history
ERM approval to issue
Version Revision Author Reviewed by Name Date Comments
V1 00 M. Lewis J. Barnett J. Barnett 07.06.2020 Draft
V2 00 M. Lewis J. Barnett J. Barnett 08.06.2020 Final

www.erm.com Version: 02 Project No.: 0505960 Client: SUEZ 8 June 2020 Page iii
Signature Page
8 June 2020
Spring Farm Advanced Resource Recovery Technology Facility
Odour Assessment
Jane Barnett
Partner – Air Quality
ERM Australia Pacific Pty Ltd
Level 15, 309 Kent Street
Sydney NSW 2000
© Copyright 2020 by ERM Worldwide Group Ltd and / or its affiliates (“ERM”).
All rights reserved. No part of this work may be reproduced or transmitted in any form,
or by any means, without the prior written permission of ERM

www.erm.com Version: 02 Project No.: 0505960 Client: SUEZ 8 June 2020 Page iv
SPRING FARM ADVANCED RESOURCE RECOVERY TECHNOLOGY FACILITY Odour Assessment
CONTENTS
CONTENTS
1. INTRODUCTION .......................................................................................................................... 1
2. PROJECT DESCRIPTION ........................................................................................................... 2
3. DISCUSSION OF ODOUR ISSUES ............................................................................................. 5
3.1 Measuring Odour Concentration .................................................................................................... 5 3.2 Odour Performance Criteria ........................................................................................................... 5 3.3 Peak to Mean Ratios ..................................................................................................................... 6
4. MODELLING METHODOLOGY ................................................................................................... 7
4.1 Selection of Meteorological Year for Dispersion Modelling ............................................................ 7 4.1 TAPM ............................................................................................................................................. 7 4.2 CALMET ........................................................................................................................................ 8 4.1 CALPUFF ...................................................................................................................................... 8
5. DISPERSION METEOROLOGY .................................................................................................. 9
5.1 Wind Speed and Direction ............................................................................................................. 9 5.2 Stability ........................................................................................................................................ 12 5.3 Mixing Height ............................................................................................................................... 13
6. ODOUR EMISSION RATES ....................................................................................................... 14
7. MODELLING RESULTS............................................................................................................. 17
7.1 Comparison to EPA Assessment Criteria .................................................................................... 17 7.2 Additional Discussion ................................................................................................................... 21
8. RECOMMENDATIONS .............................................................................................................. 24
9. CONCLUSIONS ......................................................................................................................... 24
10. REFERENCES ........................................................................................................................... 25

www.erm.com Version: 02 Project No.: 0505960 Client: SUEZ 8 June 2020 Page v
SPRING FARM ADVANCED RESOURCE RECOVERY TECHNOLOGY FACILITY Odour Assessment
CONTENTS
List of Tables
Table 3.1: Odour performance criteria for the assessment of odour ...................................................... 6
Table 4-1: Representative year analysis ................................................................................................. 7
Table 4-2: CALMET meteorological model settings ............................................................................... 8
Table 6-1: Grease trap waste and used oil emission rates measured at other facilities ...................... 15
Table 6-2: Odour emission rates used for each site ............................................................................. 16
List of Figures
Figure 2-1: Spring Farm RRP site plan ................................................................................................... 2
Figure 2-2: Grease trap waste processing .............................................................................................. 4
Figure 5-1: Annual wind rose for ARRT Facility for 2017 ....................................................................... 9
Figure 5-2: Seasonal wind rose for the ARRT Facility for 2017 ............................................................ 10
Figure 5-3: Time of day wind rose for ARRT Facility for 2017 .............................................................. 11
Figure 5-4: Stability class frequency distribution for ARRT Facility for 2017 ........................................ 12
Figure 5-5: Mixing height for the ARRT Facility for 2017 ...................................................................... 13
Figure 7-1: Cumulative predicted 99th percentile ground level odour concentration ............................ 18
Figure 7-2: Comparison of new predictions to the previous assessment ............................................. 19
Figure 7-3: Predicted 99th percentile ground level odour concentration for grease trap waste only .... 20
Figure 7-4: Predicted maximum ground level odour concentration ...................................................... 22
Figure 7-5: Predicted maximum ground level odour concentration (ARRT Facility only) ..................... 23
Figure 7-6: Predicted maximum ground level odour concentration (Camden Organics and Tripodi
Organics only) ....................................................................................................................................... 23

SPRING FARM ADVANCED RESOURCE RECOVERY TECHNOLOGY FACILITY
www.erm.com Version: 02 Project No.: 0505960 Client: SUEZ 8 June 2020 Page 1
INTRODUCTION
1. INTRODUCTION
ERM has been commissioned by SUEZ to undertake an odour assessment for the Spring Farm
Advanced Resource Recovery Technology (ARRT) Facility to support its development consent
modification application. The ARRT Facility is located within the Spring Farm Resource Recovery
Park (RRP) off Barrow Road, Spring Farm, NSW. ERM (formerly Pacific Environment) previously
performed an odour assessment as part of a modification application (Mod 5) for the ARRT Facility
(Pacific Environment, 2013). SUEZ is currently requesting a further modification (Mod 6). ERM
conducted an initial odour assessment for this modification (ERM, 2019). The modifications relevant
to odour as part of Mod 6 included:
modification of Condition 2.9d) to include industrial liquid waste, as consistent with the
original EA; and
Modification of Condition 2.14 and 2.15 to include extended operating hours.
NSW Environmental Protection Authority (EPA) had some concerns about the odour assessment and
were unable to support the proposal to include industrial liquid waste. The concerns were regarding
the way the odour from the industrial liquid waste had been accounted for, along with operational risks
associated with uncontrolled mixing of industrial liquids.
Since the preparation of the initial odour assessment for Mod 6, SUEZ have been in discussion with
the EPA and the Department of Planning, Industry and Environment (DPIE) and have decided not to
pursue approval for inclusion of broad definition of “industrial liquid waste” at this time, which may be
perceived to have a higher operational risk profile. SUEZ are therefore only seeking approval for
receival of grease trap waste from SUEZ’ customer base e.g. restaurants and shopping centres.
SUEZ expects to receive approximately 15,000 tonnes per annum of grease trap waste.
The key risk to accepting grease trap waste is potential for odour generation. The purpose of this
document is to provide an assessment of odour impacts for the updates proposed to the Mod 6
application and to address the items raised in the latest correspondence with NSW EPA in their letter
dated 22 May 2020 (DOC20/390460). Specifically, this assessment will identify changes to the
predicted extent of odour impacts after the following updates:
addition of grease trap waste odour source; and
application of a more conservative tank farm odour emission rate.
This modelling has taken into consideration the extended operating hours sought by SUEZ.
This assessment includes the following scope of works:
Preparation of odour emission inventories;
Processing of meteorological data;
Dispersion modelling;
Post processing of predicted ground level concentrations; and
Assessment and discussion of predicted impacts.
As requested by the NSW EPA, this report is prepared as a standalone assessment to support
revised Mod 6 proposal for grease trap liquid waste. For clarity, this report supersedes previous
information provided related to seeking approval for the broader “industrial liquid waste”, with the aim
of enabling the EPA to assess the revised proposal without having to reference previous information
provided by SUEZ.

SPRING FARM ADVANCED RESOURCE RECOVERY TECHNOLOGY FACILITY
www.erm.com Version: 02 Project No.: 0505960 Client: SUEZ 8 June 2020 Page 2
PROJECT DESCRIPTION
2. PROJECT DESCRIPTION
The Spring Farm RRP site is located in Spring Farm, NSW, approximately 50 km west southwest of
Sydney CBD. The Spring Farm RRP consists of the ARRT Facility, a capped landfill and a materials
recycling facility (MRF). The ARRT Facility consists of an enclosed receival hall, a tank farm facility,
green waste area and bio filter. The Spring Farm RRP, a nearby residential development (currently
being constructed), a coal preparation plant, SUEZ Camden Organics and Tripodi Organics are
shown in Figure 2-1. The Mod 5 odour assessment combined operations within the SUEZ Camden
Organics and the Tripodi Organics sites presented in Figure 2-1 and this assumption has been
maintained for this assessment.
The residential development area to the north-west provided in Figure 2-1 has been modified to
include the landfill gas buffer where residential development has not yet been approved and which
confines housing development to outside the restriction zone.
Figure 2-1: Spring Farm RRP site plan

SPRING FARM ADVANCED RESOURCE RECOVERY TECHNOLOGY FACILITY
www.erm.com Version: 02 Project No.: 0505960 Client: SUEZ 8 June 2020 Page 3
PROJECT DESCRIPTION
This assessment is based on the use of the computer-based dispersion model (CALPUFF) to predict
off site odour levels. To assess the effect that potential emissions could have on existing air quality,
the dispersion model predictions have been compared to relevant regulatory air quality criteria. The
assessment follows a conventional approach using the procedures outlined in the NSW Environment
Protection Authority’s (EPA) document titled “Approved Methods and Guidance for the Modelling and
Assessment of Air Pollutants in NSW” (NSW EPA, 2016).
The initial Mod 6 assessment included all odour sources from the ARRT facility (including green waste
processing) as well as odour from the neighbouring Camden and Tripodi Organics sites. This updated
Mod 6 assessment now includes:
addition of grease trap waste odour source; and
application of a more conservative tank farm odour emission rate.
The grease trap waste would be processed using the same system which currently treats high organic
liquids, with the addition of a filter and clarifier, both enclosed. Grease trap liquid waste is compatible
with the current treatment system as it is similar in nature to liquid organic waste, which is already
approved to be received and treated at the facility. Both grease trap liquid waste and liquid organic
waste are high in organic content, with the key difference between grease trap liquid includes a layer
of grease and solids (litter and other solids). This will be separated out via a filter, and the remaining
liquids which is high in organics will be treated with other liquid organic waste currently accepted in
the facility. The addition of a clarifier will further clean out any residual oil and grease not screened by
the filter.
This process is described as per the flow chart in Figure 2-2. Grease trap waste would be delivered to
the site via enclosed tankers. Once in position, hoses will be connected to the tanker and the contents
directly unloaded to the filter, situated within an enclosed shed. It would not be discharged into an
open pit like the previous setup at SUEZ’s former Camellia Resource Recovery and Treatment facility
which used to accept and treat grease trap waste, among other industrial liquids.
The part of the reception process that is not enclosed is the grease and solid residues screened out
by the filter. This material will exit the filter via a screw press into a small bin that is outside the shed,
and the bin would then be relocated via forklift and emptied into the adjacent transfer area for disposal
to landfill. The area the bin will be located in will have a deodorizer line overhead. The bin would be
emptied daily and more frequently as required depending on the amount of material received and
processed.
Once the liquid is inside the tank farm the process is almost exclusively enclosed. The only tanks
which are not enclosed are two sequential batch reactor (SBR). These tanks have been accounted for
in the model as described in Section 6.
It is worth noting that since Mod 5 was approved, the screw press area and the balance tank were
both enclosed. These changes were not accounted for in the model, that is, the model assumes these
are open to the atmosphere which enables a conservative assessment.

SPRING FARM ADVANCED RESOURCE RECOVERY TECHNOLOGY FACILITY
www.erm.com Version: 02 Project No.: 0505960 Client: SUEZ 8 June 2020 Page 4
PROJECT DESCRIPTION
Figure 2-2: Grease trap waste processing
Note: sludge removal from tanks is done on an as required basis, typically once every few months as part of tank
cleaning, when meteorological conditions are suitable.

SPRING FARM ADVANCED RESOURCE RECOVERY TECHNOLOGY FACILITY
www.erm.com Version: 02 Project No.: 0505960 Client: SUEZ 8 June 2020 Page 5
DISCUSSION OF ODOUR ISSUES
3. DISCUSSION OF ODOUR ISSUES
3.1 Measuring Odour Concentration
There are no instrument-based methods that can measure an odour response in the same way as the
human nose. Therefore, “dynamic olfactometry” is typically used as the basis of odour management
by regulatory authorities.
Dynamic olfactometry is the measurement of odour by presenting a sample of odorous air to a panel
of people with decreasing quantities of clean odour-free air. The panellists then note when the smell
becomes detectable. The correlations between the known dilution ratios and the panellists’ responses
are then used to calculate the number of dilutions of the original sample required to achieve the odour
detection threshold. The units for odour measurement using dynamic olfactometry are “odour units”
(OU) which are dimensionless and are effectively “dilutions to threshold”.
As with all sensory methods of identification there is variability between individuals. Consequently the
results of odour measurements depend on the way in which the panel is selected and the way in
which the panel responses are interpreted.
3.2 Odour Performance Criteria
The determination of air quality goals for odour and their use in the assessment of odour impacts is
recognised as a difficult topic in air pollution science. The NSW EPA has developed odour goals and
the way in which they should be applied with dispersion models to assess the likelihood of nuisance
impact arising from the emission of odour.
There are two factors that need to be considered:
1. what "level of exposure" to odour is considered acceptable to meet current community
standards in NSW, and
2. how can dispersion models be used to determine if a source of odour meets the goals which
are based on this acceptable level of exposure.
The term "level of exposure" has been used to reflect the fact that odour impacts are determined by
several factors the most important of which are:
the Frequency of the exposure;
the Intensity of the odour;
the Duration of the odour episodes;
the Offensiveness of the odour; and
the Location of the source.
Whether or not an individual considers an odour to be a nuisance will depend on the FIDOL factors
outlined above and although it is possible to derive formulae for assessing odour annoyance in a
community, the response of any individual to an odour is still unpredictable. Odour goals need to take
account of these factors.
In determining the offensiveness of an odour it needs to be recognised that for most odours the
context in which an odour is perceived is also relevant. Some odours, for example the smell of
sewage, hydrogen sulfide, butyric acid, landfill gas etc., are likely to be judged offensive regardless of
the context in which they occur. Other odours such as the smell of jet fuel may be acceptable at an
airport, but not in a house, and diesel exhaust may be acceptable near a busy road, but not in a
restaurant.
The NSW EPA Approved Methods (NSW EPA, 2016) include ground-level concentration criteria for
complex mixtures of odorous air pollutants. These criteria have been refined by the EPA to take

SPRING FARM ADVANCED RESOURCE RECOVERY TECHNOLOGY FACILITY
www.erm.com Version: 02 Project No.: 0505960 Client: SUEZ 8 June 2020 Page 6
DISCUSSION OF ODOUR ISSUES
account of population density in an area. Table 3.1 lists the odour thresholds, to be exceeded not
more than 1% of the time (99th percentile), for different population densities.As described in the NSW
EPA “Technical Notes – Assessment and management of odour from stationary sources in NSW”
(Technical Notes) (DEC NSW, 2006), these odour assessment criteria are concerned with controlling
odours to ensure offensive odour impacts will be effectively managed but are not intended to ‘no
odour’.
Table 3.1: Odour performance criteria for the assessment of odour
Population of affected community Odour performance criteria
(nose response odour units at the 99th percentile)
Single residence (≤ ~2) 7
~10 6
~ 30 5
~ 125 4
~ 500 3
Urban (~ 2000) 2
The difference between odour goals is based on considerations of risk of odour impact rather than
differences in odour acceptability between urban and rural areas. For a given odour level there will be
a wide range of responses in the population exposed to the odour. In a densely populated area there
will therefore be a greater risk that some individuals within the community will find the odour
unacceptable than in a sparsely populated area.
In terms of odour impact, the more stringent criterion of 2 OU would apply to residential developments
in Spring Farm.
3.3 Peak to Mean Ratios
It is a common practice to use dispersion models to determine compliance with odour goals. This
introduces a complication because dispersion models are only able to directly predict concentrations
over an averaging period of 3-minutes or greater. The human nose, however, can respond to odours
over periods of the order of one second. During a 3-minute period, odour levels can fluctuate
significantly above and below the mean depending on the nature of the source.
To determine the ratio between the one-second peak concentrations and three minute and longer
period average concentrations (referred to as the peak to mean ratio) that might be predicted by a
dispersion model, the NSW EPA commissioned studies by Katestone Scientific Pty Ltd (Katestone
Scientific, 1995; Katestone Scientific, 1998). The ratios developed by Katestone are dependent on
atmospheric stability and the distance from the source. For area sources, the peak to mean ratio is
2.5 for stability classes A to D, and 2.3 for E and F class stability. For volume sources, the factor is 2.3
and is not dependent on stability class.
The EPA Approved Methods take account of this peak to mean factor and the goals summarised in
Table 3.1 are based on nose-response time.

SPRING FARM ADVANCED RESOURCE RECOVERY TECHNOLOGY FACILITY
www.erm.com Version: 02 Project No.: 0505960 Client: SUEZ 8 June 2020 Page 7
MODELLING METHODOLOGY
4. MODELLING METHODOLOGY
The local meteorology has been modelled using observations from the Campbelltown and Camden
Airport weather stations in conjunction with the TAPM and CALMET models as described in Sections
4.1 and Section 4.2, respectively. Output from TAPM, plus local and regional observational weather
station data were entered into CALMET, a meteorological pre-processor recommended for use in
non-steady state conditions. From this, a 1-year representative meteorological dataset was compiled,
suitable for use in the 3-dimensional plume dispersion model CALPUFF as described in Section 4.1.
Details on the model configuration and data inputs are provided in the following sections.
4.1 Selection of Meteorological Year for Dispersion Modelling
The previous meteorological dataset developed as part of the Mod 5 odour assessment was for
October 2010 to September 2011 and so the dataset developed as part of this assessment has been
updated to include a more recent year. One year of hourly meteorological data is required for the
dispersion modelling. There is a preference for assessments to be based on a representative
meteorological year with demonstration of the basis for the selection criteria. To determine which year
to include in our assessment we reviewed five years of meteorological data from the Campbelltown
Bureau of Meteorology (BoM) station (2013-2017). This meteorological station was selected as it was
the nearest BoM station (with long term data) to the site, approximately 3.1 km.
The Mann-Whitney U test for large sample sizes was used to analyse the data for wind speed,
temperature and relative humidity. These meteorological parameters were selected as they show a
clear diurnal cycle. The Mann-Whitney U-test is a statistical comparison with a null hypothesis that
there is no significant difference between an individual year and long-term average values.
A summary of the best performing to least performing year for wind speed, temperature and relative
humidity are presented in Table 4-1. The year 2017 was selected as the most representative year for
this assessment as it performed on average better than any other year.
Table 4-1: Representative year analysis
Statistical rank Wind speed Temperature Relative humidity
Rank 1 2017 2014 2016
Rank 2 2014 2017 2017
Rank 3 2013 2016 2013
Rank 4 2016 2013 2014
Rank 5 2015 2015 2015
4.1 TAPM
The Air Pollution Model (TAPM) is a three dimensional meteorological and air pollution model
developed by the CSIRO Division of Atmospheric Research. Detailed description of the TAPM model
and its performance is provided in The Air Pollution Model (TAPM) Version 4. Part 1: Technical
Description (Hurley, P, 2008) and The Air Pollution Model (TAPM) Version 4. Part 2: Summary of
Some Verification Studies (Hurley, Physick, Luhar, & Edwards, 2008).
TAPM solves the fundamental fluid dynamics and scalar transport equations to predict meteorology
and pollutant concentrations. It consists of coupled prognostic meteorological and air pollution
concentration components. The model predicts airflow important to local scale air pollution, such as
sea breezes and terrain induced flows, against a background of larger scale meteorology provided by
synoptic analyses.

SPRING FARM ADVANCED RESOURCE RECOVERY TECHNOLOGY FACILITY
www.erm.com Version: 02 Project No.: 0505960 Client: SUEZ 8 June 2020 Page 8
MODELLING METHODOLOGY
For this project, TAPM was set up with 5 domains, composed of 25 grid points along both the X and
the Y axes, centred on 292.0 km Easting and 6227.0 km northing (UTM Zone 56 S). Each nested
domain had a grid spacing of 30 km, 10 km, 3.5 km, 1.2 km and 500 m, respectively.
CALTAPM was developed to provide users of the TAPM model the ability to create an hourly, 3
dimensional data file of gridded meteorological parameters, for direct use in the CALMET diagnostic
meteorological model. When used in this way the TAPM data can be used in CALMET to determine
the initial guess wind field, prior to the weighting of true observations or even to run CALMET in no-
observation mode. The TAPM output file (3D.DAT) was used as an initial guess wind field.
4.2 CALMET
CALMET is a meteorological pre-processor that includes a wind field generator containing objective
analysis and parameterised treatments of slope flows, terrain effects and terrain blocking effects. The
pre-processor produces fields of wind components, air temperature, relative humidity, mixing height
and other micro-meteorological variables to produce the three-dimensional meteorological fields that
are utilised in the CALPUFF dispersion model (i.e. the CALPUFF dispersion model requires
meteorological data in three dimensions). CALMET uses the meteorological inputs in combination
with land use and geophysical information for the modelling domain to predict gridded meteorological
fields for the region.
CALMET was run with a grid domain of 10 km x 10 km, with a 100 m grid resolution. Gridded wind
fields generated by TAPM in the form of a three dimensional data file (the 3D.DAT file referred to
above) were used as the initial guess field for CALMET. Details on the CALMET settings are
provided in Table 4-2 below.
Table 4-2: CALMET meteorological model settings
CALMET
South west corner of CALMET domain X: 286.989 km Y: 6,222.270 km
Meteorological grid domain 10 km x 10 km (100 x 100 grid points)
Meteorological grid resolution 0.1 km
TERRAD 2 km
Surface stations Campbelltown BoM and Camden Airport BoM
NOOBS 1 (Use surface and overwater stations (no upper air observations), use MM4/MM5/3D.DAT for upper air data.
ICLOUD 4 (Gridded cloud cover from Prognostic Relative Humidity at all levels)
4.1 CALPUFF
CALPUFF is the dispersion module of the CALMET/CALPUFF suite of models. It is a multi-layer, multi
species, non-steady-state puff dispersion model that can simulate the effects of time-varying and
space-varying meteorological conditions on pollutant transport, transformation and removal. The
model contains algorithms for near-source effects such as building downwash, partial plume
penetration, sub-grid scale interactions as well as longer range effects such as pollutant removal,
chemical transformation, vertical wind shear and coastal interaction effects. The model employs
dispersion equations based on a Gaussian distribution of pollutants across released puffs and takes
into account the complex arrangement of emissions from point, area, volume and line sources (Scire,
Strimaitis & Yamartino, 2005).
Each odour generating source was represented by a series of area and volume sources situated
according to their location. Model predictions were made across the domain at gridded receptors at a
spacing of 100 m x 100 m.
SPRING FARM ADVANCED RESOURCE RECOVERY TECHNOLOGY FACILITY
www.erm.com Version: 02 Project No.: 0505960 Client: SUEZ 8 June 2020 Page 9
DISPERSION METEOROLOGY
5. DISPERSION METEOROLOGY
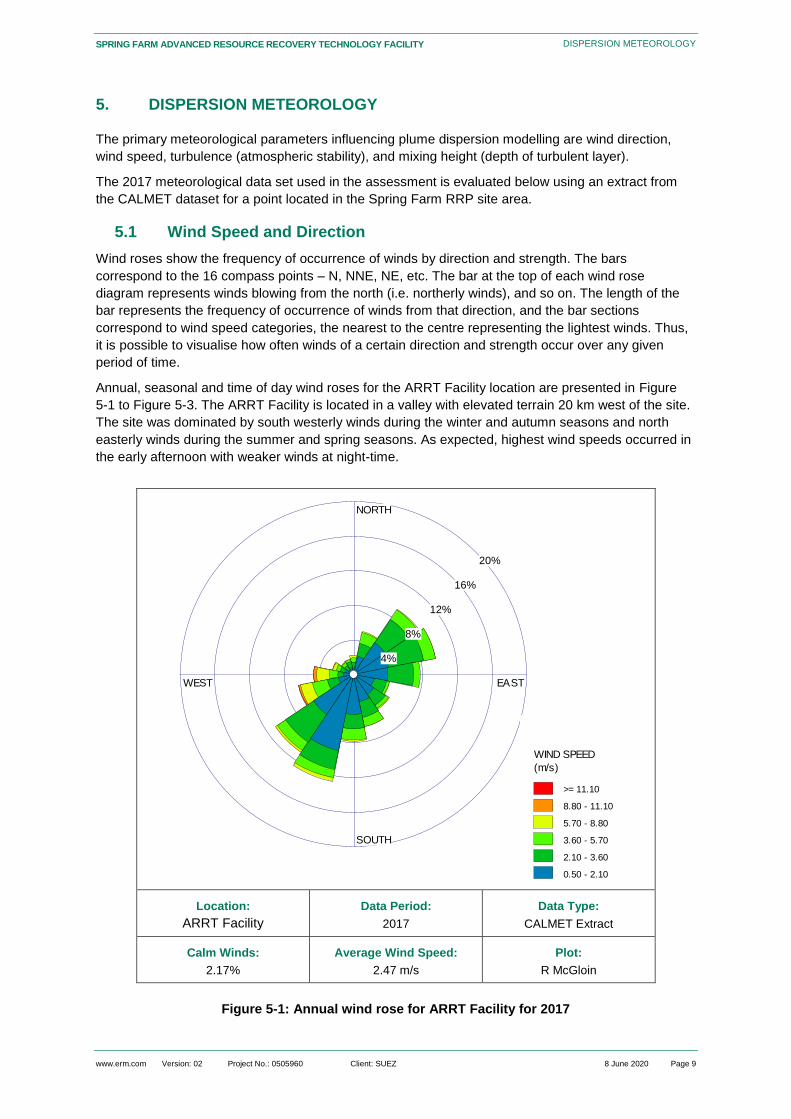
The primary meteorological parameters influencing plume dispersion modelling are wind direction,
wind speed, turbulence (atmospheric stability), and mixing height (depth of turbulent layer).
The 2017 meteorological data set used in the assessment is evaluated below using an extract from
the CALMET dataset for a point located in the Spring Farm RRP site area.
5.1 Wind Speed and Direction
Wind roses show the frequency of occurrence of winds by direction and strength. The bars
correspond to the 16 compass points – N, NNE, NE, etc. The bar at the top of each wind rose
diagram represents winds blowing from the north (i.e. northerly winds), and so on. The length of the
bar represents the frequency of occurrence of winds from that direction, and the bar sections
correspond to wind speed categories, the nearest to the centre representing the lightest winds. Thus,
it is possible to visualise how often winds of a certain direction and strength occur over any given
period of time.
Annual, seasonal and time of day wind roses for the ARRT Facility location are presented in Figure
5-1 to Figure 5-3. The ARRT Facility is located in a valley with elevated terrain 20 km west of the site.
The site was dominated by south westerly winds during the winter and autumn seasons and north
easterly winds during the summer and spring seasons. As expected, highest wind speeds occurred in
the early afternoon with weaker winds at night-time.
Location:
ARRT Facility
Data Period:
2017
Data Type:
CALMET Extract
Calm Winds:
2.17%
Average Wind Speed:
2.47 m/s
Plot:
R McGloin
Figure 5-1: Annual wind rose for ARRT Facility for 2017
NORTH
SOUTH
WEST EAST
4%
8%
12%
16%
20%
WIND SPEED
(m/s)
>= 11.10
8.80 - 11.10
5.70 - 8.80
3.60 - 5.70
2.10 - 3.60
0.50 - 2.10
Calms: 2.17%

SPRING FARM ADVANCED RESOURCE RECOVERY TECHNOLOGY FACILITY
www.erm.com Version: 02 Project No.: 0505960 Client: SUEZ 8 June 2020 Page 10
DISPERSION METEOROLOGY
Summer
Autumn
Winter
Spring
Period Average wind speed (m/s) Calm winds frequency
Summer 2.6 1.5%
Autumn 2.1 2.0%
Winter 2.3 2.5%
Spring 2.8 2.6%
Location: ARRT Facility
Data Period: 2017
Data Type: CALMET Extract
Figure 5-2: Seasonal wind rose for the ARRT Facility for 2017
NORTH
SOUTH
WEST EAST
5%
10%
15%
20%
25%
WIND SPEED
(m/s)
>= 11.10
8.80 - 11.10
5.70 - 8.80
3.60 - 5.70
2.10 - 3.60
0.50 - 2.10
Calms: 1.48%
NORTH
SOUTH
WEST EAST
5%
10%
15%
20%
25%
WIND SPEED
(m/s)
>= 11.10
8.80 - 11.10
5.70 - 8.80
3.60 - 5.70
2.10 - 3.60
0.50 - 2.10
Calms: 2.04%
NORTH
SOUTH
WEST EAST
5%
10%
15%
20%
25%
WIND SPEED
(m/s)
>= 11.10
8.80 - 11.10
5.70 - 8.80
3.60 - 5.70
2.10 - 3.60
0.50 - 2.10
Calms: 2.54%
NORTH
SOUTH
WEST EAST
5%
10%
15%
20%
25%
WIND SPEED
(m/s)
>= 11.10
8.80 - 11.10
5.70 - 8.80
3.60 - 5.70
2.10 - 3.60
0.50 - 2.10
Calms: 2.61%
NORTH
SOUTH
WEST EAST
4%
8%
12%
16%
20%
WIND SPEED
(m/s)
>= 11.10
8.80 - 11.10
5.70 - 8.80
3.60 - 5.70
2.10 - 3.60
0.50 - 2.10
Calms: 2.17%

SPRING FARM ADVANCED RESOURCE RECOVERY TECHNOLOGY FACILITY
www.erm.com Version: 02 Project No.: 0505960 Client: SUEZ 8 June 2020 Page 11
DISPERSION METEOROLOGY
12 AM to 6 AM
6 AM to 12 PM
12 PM to 6 PM
6 PM to 12 AM
Period Average wind speed (m/s) Calm winds frequency
12 AM to 6 AM 1.6 3.8%
6 AM to 12 PM 2.6 3.2%
12 PM to 6 PM 3.7 0.5%
6 PM to 12 AM 2.0 1.1%
Location: ARRT Facility
Data Period: 2017
Data Type: CALMET Extract
Figure 5-3: Time of day wind rose for ARRT Facility for 2017
NORTH
SOUTH
WEST EAST
5%
10%
15%
20%
25%
WIND SPEED
(m/s)
>= 11.10
8.80 - 11.10
5.70 - 8.80
3.60 - 5.70
2.10 - 3.60
0.50 - 2.10
Calms: 3.84%
NORTH
SOUTH
WEST EAST
5%
10%
15%
20%
25%
WIND SPEED
(m/s)
>= 11.10
8.80 - 11.10
5.70 - 8.80
3.60 - 5.70
2.10 - 3.60
0.50 - 2.10
Calms: 3.24%
NORTH
SOUTH
WEST EAST
5%
10%
15%
20%
25%
WIND SPEED
(m/s)
>= 11.10
8.80 - 11.10
5.70 - 8.80
3.60 - 5.70
2.10 - 3.60
0.50 - 2.10
Calms: 0.50%
NORTH
SOUTH
WEST EAST
5%
10%
15%
20%
25%
WIND SPEED
(m/s)
>= 11.10
8.80 - 11.10
5.70 - 8.80
3.60 - 5.70
2.10 - 3.60
0.50 - 2.10
Calms: 1.10%

SPRING FARM ADVANCED RESOURCE RECOVERY TECHNOLOGY FACILITY
www.erm.com Version: 02 Project No.: 0505960 Client: SUEZ 8 June 2020 Page 12
DISPERSION METEOROLOGY
5.2 Stability
Atmospheric turbulence is an important factor in plume dispersion. Turbulence acts to increase the
cross-sectional area of the plume due to random motions, thus diluting or diffusing a plume. As
turbulence increases, the rate of plume dilution or diffusion increases. Weak turbulence limits plume
diffusion and is a critical factor in causing high plume concentrations downwind of a source,
particularly when combined with very low wind speeds.
Turbulence is related to the vertical temperature gradient, the condition of which determines what is
known as stability, or thermal stability. For traditional dispersion modelling using Gaussian plume
models, categories of atmospheric stability are used in conjunction with other meteorological data to
describe atmospheric conditions and thus dispersion.
The most well-known stability classification is the Pasquill-Gifford scheme, which denotes stability
classes from A to F. Class A is described as highly unstable and occurs in association with strong
surface heating and light winds, leading to intense convective turbulence and much enhanced plume
dilution. At the other extreme, class F denotes very stable conditions associated with strong
temperature inversions and light winds, which commonly occur under clear skies at night and in early
mornings. Under these conditions plumes can remain relatively undiluted for considerable distances
downwind.
Intermediate stability classes grade from moderately unstable (B), through neutral (D) to slightly stable
(E). Whilst classes A and F are strongly associated with clear skies, class D is linked to windy and/or
cloudy weather, and short periods around sunset and sunrise when surface heating or cooling is
small. As a general rule, unstable (or convective) conditions dominate during the daytime and stable
flows are dominant at night. This diurnal pattern is most pronounced when there is relatively little
cloud cover and light to moderate winds.
The frequency distributions of stability classes for the CALMET ARRT Facility for 2017 are presented
in Figure 5-4. The data show a high proportion of neutral conditions (class D) and very stable
conditions (class F).
Figure 5-4: Stability class frequency distribution for ARRT Facility for 2017

SPRING FARM ADVANCED RESOURCE RECOVERY TECHNOLOGY FACILITY
www.erm.com Version: 02 Project No.: 0505960 Client: SUEZ 8 June 2020 Page 13
DISPERSION METEOROLOGY
5.3 Mixing Height
Mixing height is the depth of the atmospheric mixing layer beneath an elevated temperature inversion.
It is an important parameter in air pollution meteorology as vertical diffusion or mixing of a plume is
generally considered to be limited by the mixing height. This is because the air above this layer tends
to be stable, with restricted vertical motions.
The diurnal variation of mixing heights at the site location for the 2017 data set is summarised and
presented in Figure 5-5. The diurnal cycles are typical with mixing height growth during daytime hours
(in response to convective mixing which results from solar heating of the earth’s surface) until late
afternoon followed by a decline around early evening and sunset with lower mixing heights throughout
the night and minimum mixing heights just before dawn.
Figure 5-5: Mixing height for the ARRT Facility for 2017

SPRING FARM ADVANCED RESOURCE RECOVERY TECHNOLOGY FACILITY
www.erm.com Version: 02 Project No.: 0505960 Client: SUEZ 8 June 2020 Page 14
ODOUR EMISSION RATES
6. ODOUR EMISSION RATES
The odour emission rates used in the initial Mod 6 assessment were the same as those developed as
part of the Mod 5 odour assessment, with a number of updates and additions. These changes are
described below.
All landfill sources were updated to ‘capped’ as all landfill sites were capped progressively
since July 2018 and completed in mid-2019. Even though a landfill is capped, it may still
continue to release odour for some time. This is generally not significant, and is the case for
this site as measured emission rates from capped areas were low. To remain conservative,
and considering this source is closest to the residential areas, emissions from the capped
landfill have been included.
Biofilter source modelled as a volume source to better reflect actual operation of air flowing
through the biofilter bed.
The operating time was extended to be between 6:00 AM and 5:00 PM Monday to Friday.
Weekends have shorter timeframes but weekday hours have been used to ensure a
conservative assessment 7 days a week.
Additional odour sources at the Camden Organics and Tripodi Organics sites to better define
the shredding and storage areas source including:
Greenwaste receival area
Greenwaste shredder
Leachate pond
In addition, the following inclusions and considerations have been made as part of this assessment to
update the initial Mod 6 application:
An increase in the emission rate has been applied for the open tanks in the tank farm. The
new value (0.153 ou.m3/m2/s) is higher than previous assessments (0.06 ou.m3/m2/s and
0.108 ou.m3/m2/s) and was measured on a leachate pond at the Whytes Gully putrescible
landfill (PAEHolmes, 2012) and is considered more representative of the liquid waste
processed at this site. This update has been made in response to the EPA’s comment in
their letter dated 18 October 2019 (DOC19/889378-1) that the previous values used were
measured at a leachate pond for greenwaste. It is noted that the results in Section 7 show
these open tanks are not a significant contributor to the predicted ground level
concentrations.
A new volume source has also been included for grease trap waste. As there are no direct
measurements possible from the site yet, a number of grease trap waste odour emission
rates were sourced from other studies. Table 6-1 provides a list of these measurements,
including measurements made at SUEZ’ former liquid waste facility at Camellia.
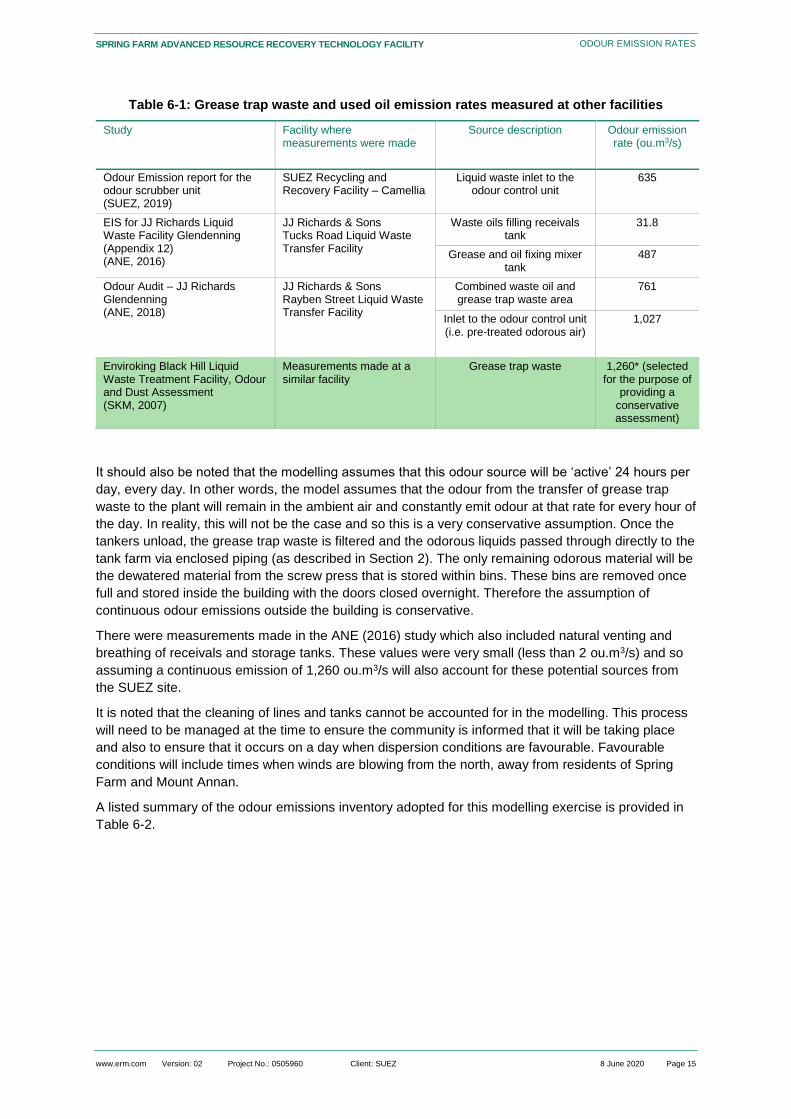
For the modelling presented in this assessment the highest value in Table 6-1of 1,260 ou.m3/s, has
been used. The measurement was from fugitive odour emissions from areas open to the air including
where the grease trap waste is transferred from the tankers. This will be similar to that proposed for
Spring Farm and so the odour character is likely to be representative. It is noted that the
measurement taken from the former SUEZ Camellia facility is also from grease trap waste
(635 ou.m3/s), but the higher value from Black Hill was selected to ensure a conservative assessment
of potential odour impacts.
SPRING FARM ADVANCED RESOURCE RECOVERY TECHNOLOGY FACILITY
www.erm.com Version: 02 Project No.: 0505960 Client: SUEZ 8 June 2020 Page 15
ODOUR EMISSION RATES
Table 6-1: Grease trap waste and used oil emission rates measured at other facilities
Study Facility where measurements were made
Source description Odour emission rate (ou.m3/s)
Odour Emission report for the odour scrubber unit (SUEZ, 2019)
SUEZ Recycling and Recovery Facility – Camellia
Liquid waste inlet to the odour control unit
635
EIS for JJ Richards Liquid Waste Facility Glendenning (Appendix 12) (ANE, 2016)
JJ Richards & Sons Tucks Road Liquid Waste Transfer Facility
Waste oils filling receivals tank
31.8
Grease and oil fixing mixer tank
487
Odour Audit – JJ Richards Glendenning (ANE, 2018)
JJ Richards & Sons Rayben Street Liquid Waste Transfer Facility
Combined waste oil and grease trap waste area
761
Inlet to the odour control unit (i.e. pre-treated odorous air)
1,027
Enviroking Black Hill Liquid Waste Treatment Facility, Odour and Dust Assessment (SKM, 2007)
Measurements made at a similar facility
Grease trap waste 1,260* (selected for the purpose of
providing a conservative assessment)
It should also be noted that the modelling assumes that this odour source will be ‘active’ 24 hours per
day, every day. In other words, the model assumes that the odour from the transfer of grease trap
waste to the plant will remain in the ambient air and constantly emit odour at that rate for every hour of
the day. In reality, this will not be the case and so this is a very conservative assumption. Once the
tankers unload, the grease trap waste is filtered and the odorous liquids passed through directly to the
tank farm via enclosed piping (as described in Section 2). The only remaining odorous material will be
the dewatered material from the screw press that is stored within bins. These bins are removed once
full and stored inside the building with the doors closed overnight. Therefore the assumption of
continuous odour emissions outside the building is conservative.
There were measurements made in the ANE (2016) study which also included natural venting and
breathing of receivals and storage tanks. These values were very small (less than 2 ou.m3/s) and so
assuming a continuous emission of 1,260 ou.m3/s will also account for these potential sources from
the SUEZ site.
It is noted that the cleaning of lines and tanks cannot be accounted for in the modelling. This process
will need to be managed at the time to ensure the community is informed that it will be taking place
and also to ensure that it occurs on a day when dispersion conditions are favourable. Favourable
conditions will include times when winds are blowing from the north, away from residents of Spring
Farm and Mount Annan.
A listed summary of the odour emissions inventory adopted for this modelling exercise is provided in
Table 6-2.

SPRING FARM ADVANCED RESOURCE RECOVERY TECHNOLOGY FACILITY
www.erm.com Version: 02 Project No.: 0505960 Client: SUEZ 8 June 2020 Page 16
ODOUR EMISSION RATES
Table 6-2: Odour emission rates used for each site
Source Measured odour concentration
(OU)
Specific odour emission rate for area sources (ou.m3/m2/s)
Odour emission rate (ou.m3/s)
Source
ARRT Facility
Greenwaste area 2,230 1.279 n/a Measured on-site
Biofilter 181 n/a 1,484 Measured on-site
Receival hall 2,660 n/a 399 Measured on-site
MRF 140 n/a 49 Measured on-site
Grease trap waste a - n/a 1,260 Grease trap and oil waste unloading via
tanker
Tank farm b 239 0.153 n/a Leachate dam at putrescible landfill
Landfill
Capped 45 0.026 n/a Measured on-site
Camden Organics / Tripodi Organics
Fresh manure 208 0.122 n/a Measured on-site
Treated manure 166 0.098 n/a Measured on-site
Unturned windrow 256 0.149 n/a Measured on-site
Freshly turned windrow 4,710 2.654 n/a Measured on-site
Compost Block - 0.149 n/a Measured on-site
Greenwaste receival area
- 3.7 n/a Measured on-site
Greenwaste shredder - n/a 42,200 Measured on-site
Leachate pond 99 0.06 n/a Measured on-site
a) measurement of liquid waste odour as it enters the odour control unit, made at the SUEZ Camellia liquid waste facility
(SUEZ, 2019)
b) measurement taken on a leachate pond at the Whytes Gully putrescible waste landfill (PAEHolmes, 2012)

SPRING FARM ADVANCED RESOURCE RECOVERY TECHNOLOGY FACILITY
www.erm.com Version: 02 Project No.: 0505960 Client: SUEZ 8 June 2020 Page 17
MODELLING RESULTS
7. MODELLING RESULTS
7.1 Comparison to EPA Assessment Criteria
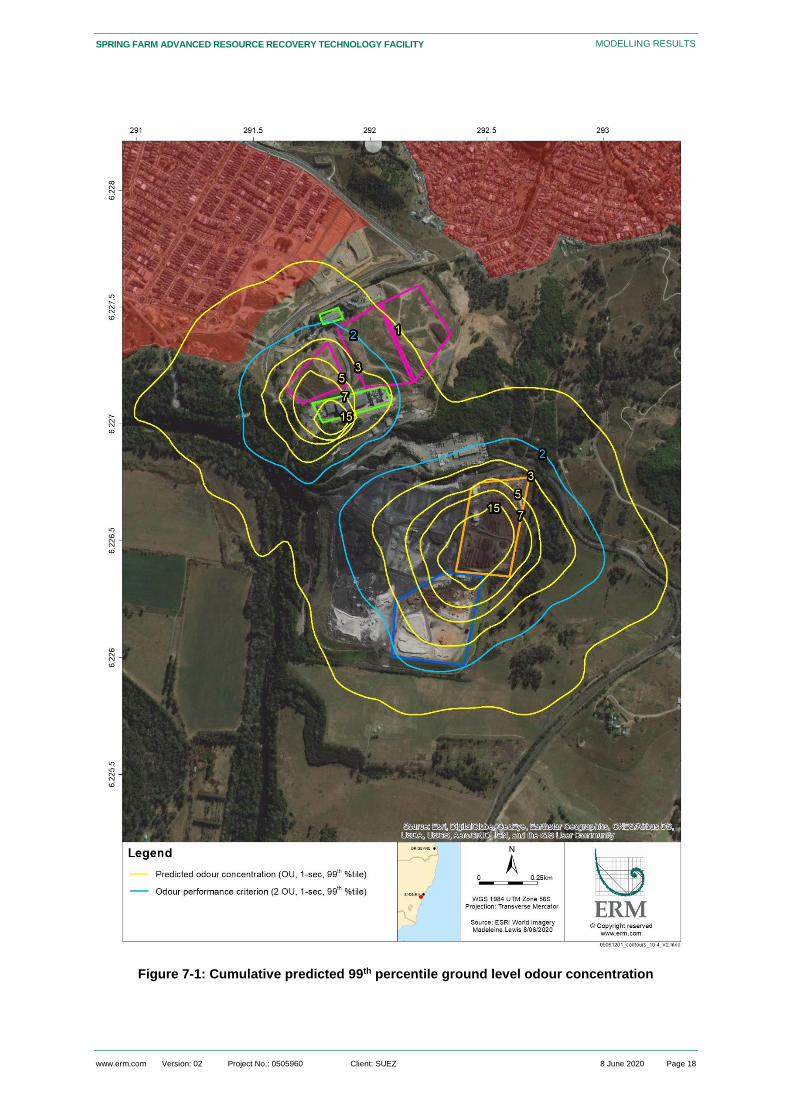
Predictions are presented as contour plots across the modelling domain in Figure 7-1. These results
are for the predicted 99th percentile cumulative concentrations due to all three operations operating
simultaneously, and can be compared directly to the EPA odour criterion of 2 OU. Figure 7-1 shows
the 2 OU contour does not extend into the neighbouring residential areas, and the facility is predicted
to comply with the assessment criterion.
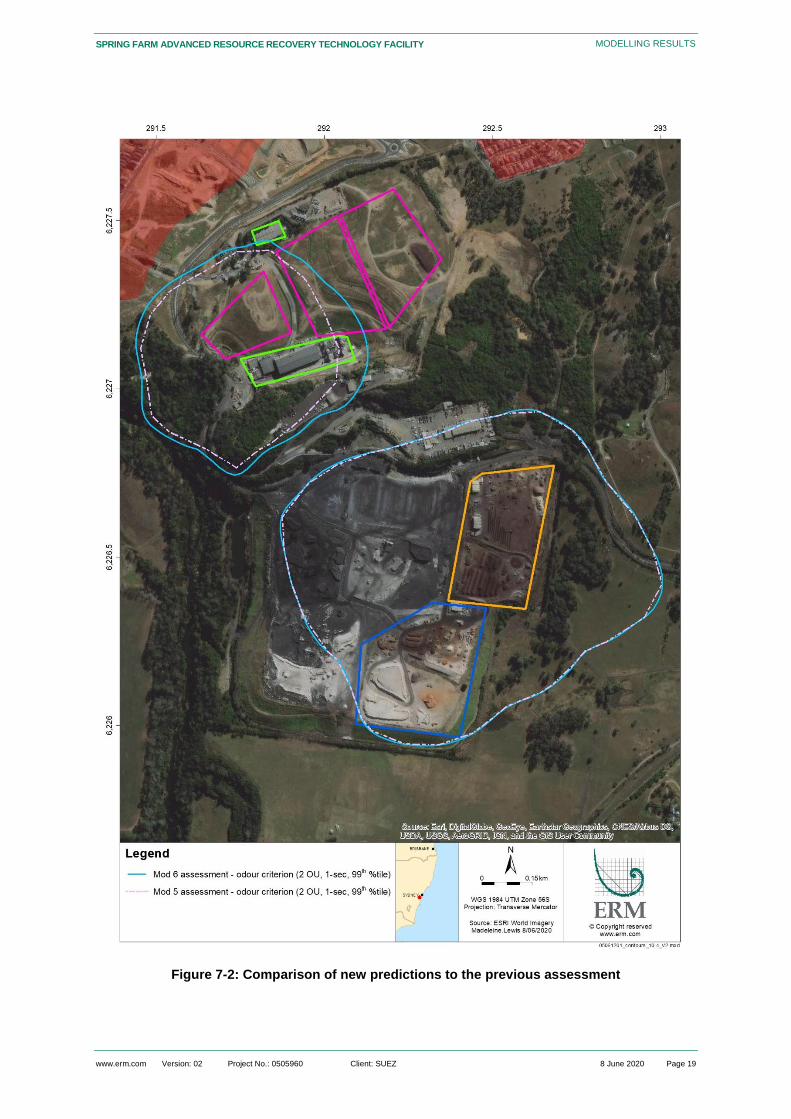
For comparison, Figure 7-2 also presents the 2 OU contour for this assessment and the previous Mod
5 assessment, which did not include the grease trap waste and had a lower tank farm emission rate.
As shown, there is an extension of this contour in the vicinity of the tank farm where the grease trap
waste is to be unloaded, but there is very little change at the nearest residences to the northwest.
This is not unexpected as although the grease trap waste can be a very odorous source, it is a
relatively small source in comparison to the other sources at the three operations and therefore its
inclusion has little impact at distances further from the site.
This can also be seen in Figure 7-3, which shows the predicted odour concentrations from the grease
trap waste emissions on their own. Even with the conservative assumptions for the emission rate, and
also assuming the emission will continue 24 hours per day, these predictions are very low. As with the
previous assessments, it is clear that the dominant sources of odour in the region are from the
Camden Organics and Tripodi Organics site to the southeast.
SPRING FARM ADVANCED RESOURCE RECOVERY TECHNOLOGY FACILITY
www.erm.com Version: 02 Project No.: 0505960 Client: SUEZ 8 June 2020 Page 18
MODELLING RESULTS
Figure 7-1: Cumulative predicted 99th percentile ground level odour concentration
SPRING FARM ADVANCED RESOURCE RECOVERY TECHNOLOGY FACILITY
www.erm.com Version: 02 Project No.: 0505960 Client: SUEZ 8 June 2020 Page 19
MODELLING RESULTS
Figure 7-2: Comparison of new predictions to the previous assessment

SPRING FARM ADVANCED RESOURCE RECOVERY TECHNOLOGY FACILITY
www.erm.com Version: 02 Project No.: 0505960 Client: SUEZ 8 June 2020 Page 20
MODELLING RESULTS
Figure 7-3: Predicted 99th percentile ground level odour concentration for grease trap waste
only

SPRING FARM ADVANCED RESOURCE RECOVERY TECHNOLOGY FACILITY
www.erm.com Version: 02 Project No.: 0505960 Client: SUEZ 8 June 2020 Page 21
MODELLING RESULTS
7.2 Additional Discussion
The assessment above and the results presented in Section 7.1, satisfies the requirement of the
Approved Methods, and shows that the proposed operations with the addition of the grease trap
waste is predicted to comply with the relevant EPA assessment criterion at the closest residential
receptors within Spring Farm and the neighbouring suburb of Mount Annan.
However, the NSW EPA indicate in their letter dated 22 May 2020 (DOC20/390460) that modelling
does not reflect recent odour complaints as no odour is shown within the contour results to extend to
these suburbs. Some additional work has therefore been carried out and is presented here to cover
this issue and to provide some context.
As explained in Section 3.2, the odour assessment criteria are designed to take into account a range
of sensitivity to odours within the community, as well as the nose-response time. The criteria are
therefore reported as a frequency of occurrence, in this case the 99th percentile. This does not mean
that odour will not be experienced in the area from time to time. Additional modelling is presented
here to show that there may be times where odour may be detected at Spring Farm and Mount
Annan, but these levels are relatively low, with a maximum prediction of around 5 OU.
Figure 7-4 shows the contours of the predicted maximum (100th percentile) ground level odour
concentration for this assessment. It is important to note that this does not relate to the EPA
assessment criterion but is presented to show the extent of where odour may be experienced less
than 1% of the time. It shows that the modelling predicts odour to extend into these suburbs, but to an
acceptable level (as presented in Figure 7-1). In other words, residents can expect to experience
some odour throughout the year but the threshold for offensive odour is not predicted to exceed the
assessment criteria more than what is considered acceptable by the NSW EPA (>1% of the time)
(NSW EPA, 2016). The Technical Notes (DEC NSW, 2006) suggest that a level of about 7 OU is
likely to represent the level at which ‘offensive odours’ should not occur. With the conservative
assumptions made in the modelling, these levels are not likely to be reached at sensitive receptors.
Theses maximum levels generally occur at times when the atmosphere is highly stable and dispersion
conditions are unfavourable. This is usually during temperature inversion conditions in early morning
and late afternoon in the cooler winter months.
It is also important to note that it is not the ARRT Facility that is driving these maximum values. This
can be seen when comparing the maximum predictions for the ARRT Facility1 on its own (Figure 7-5)
to those for the Camden Organics and Tripodi Organics site (Figure 7-6).
Again, the results presented here are maximum (100th percentile) predictions and do not correspond
to EPA assessment criteria. They are presented for further information only and show that the ARRT
Facility, including the additional odour from grease trap waste, is unlikely to contribute significantly to
peak odours experienced in the area.
1 This includes the ARRT, MRF and capped landfill

SPRING FARM ADVANCED RESOURCE RECOVERY TECHNOLOGY FACILITY
www.erm.com Version: 02 Project No.: 0505960 Client: SUEZ 8 June 2020 Page 22
MODELLING RESULTS
Figure 7-4: Predicted maximum ground level odour concentration

SPRING FARM ADVANCED RESOURCE RECOVERY TECHNOLOGY FACILITY
www.erm.com Version: 02 Project No.: 0505960 Client: SUEZ 8 June 2020 Page 23
MODELLING RESULTS
Figure 7-5: Predicted maximum ground level odour concentration
(ARRT Facility only) Figure 7-6: Predicted maximum ground level odour concentration
(Camden Organics and Tripodi Organics only)
SPRING FARM ADVANCED RESOURCE RECOVERY TECHNOLOGY FACILITY
www.erm.com Version: 02 Project No.: 0505960 Client: SUEZ 8 June 2020 Page 24
RECOMMENDATIONS
8. RECOMMENDATIONS
SUEZ currently employ a number of odour control measures at the Spring Farm RRP that are
included within the site’s odour management plan. Given the location of nearby residence in relation
to the facility, it is recommended that the following odour control measures be included within the
site’s odour management plan:
all spills of odorous material outside the building are cleaned as soon as possible;
install deodorizer line overhead of bin(s) for grease and solids extracted from the filter;
all vehicle loads are covered when entering and leaving the site;
building doors are only opened when required and remain closed outside operational hours;
all lines and tanks are cleaned (including sludge removal from tanks) when meteorological
conditions are suitable; and
regular maintenance of the biofilter to ensure it is working effectively at all times, including
replacement of media as required.
It is recommended that a post-commissioning validation study of the odour emissions be carried out,
such as has been done for other similar liquid waste facilities in NSW.
Further to this, it is recommended that an odour audit be conducted after acceptance and
implementation of the updates identified as part of the Mod 6 application. This odour audit would take
a similar form conducted after the implementation of the tank farm as part of the Mod 5 application
(Pacific Environment, 2018).
9. CONCLUSIONS
This report has assessed the cumulative odour impacts of the Spring Farm ARRT Facility, capped
landfill, Camden Organics and Tripodi’s Organics operations. Dispersion modelling has been used to
predict off-site odour concentrations at nearby residential areas. The dispersion modelling took
account of local meteorological conditions and terrain information and used on-site odour
measurements to determine odour emission rates from the Spring Farm facility or other similar
facilities considered to be representative. The modelling was updated from the initial Mod 6 odour
assessment (ERM, 2019) and included:
addition of grease trap waste odour source; and
application of a more conservative tank farm odour emission rate.
Conservative assumptions were made regarding odour emission rates from grease trap waste. It was
also assumed these emissions were occurring at this full rate continuously, for all hours of the day.
Results from the dispersion modelling predict that the facility will comply with the NSW EPA
assessment criterion of 2 OU (99th percentile) at the neighbouring residential areas.
The updated meteorological model and odour emission estimations have also shown that the extent
of odour impacts presented in the approved Mod 5 operations are not predicted to be exceeded
with the updates proposed to the Mod 6 application. This is largely due to the former landfill (modelled
in the Mod 5 assessment) being a major contributor of odour prior to its closure, and the landfill
capping project was completed in mid-2019 which resulted in a decrease in odour contribution.

SPRING FARM ADVANCED RESOURCE RECOVERY TECHNOLOGY FACILITY
www.erm.com Version: 02 Project No.: 0505960 Client: SUEZ 8 June 2020 Page 25
REFERENCES
10. REFERENCES
ANE. (2016). Air and Noise Assessment – Proposed Liquid Waste Facility, Glendenning. Appendix 12
to EIS. Air Noise Environment. February 2016. ANE. (2018). Air and Noise Assessment – Post Commissioning Odour Audit for JJ Richards. Air
Noise Environment. September 2018.
DEC NSW. (2006). Technical Notes: Assessment and management of odour from stationary sources
in NSW. Department of Environment and Conservation NSW. November 2006.
ERM. (2019). Spring Farm Resource Recovery Park Odour Assessment. Prepared for SUEZ, Job
number 0505960: Environmental Resources Management. July 2019.
Hurley, P. (2008). The Air Pollution Model (TAPM) Version 4. Part 1, Technical Description: CSIRO
Atmospheric Research Technical Paper No. 25. Melbourne: CSIRO Division of Atmospheric
Research.
Hurley, P., Physick, W., Luhar, A., & Edwards, M. (2008). Hurley, P; Physick, W; Luhar, A; Edwards,
M. The Air Pollution Model (TAPM) Version 4. Part 2: Summary of Some Verification Studies:
CSIRO Atmospheric Research Technical Paper No. 26. Melbourne: CSIRO Division of
Atmospheric Research.
Katestone Scientific. (1995). The evaluation of peak-to-mean ratios for odour assessments: Volume 1
- Main Report: Volume 1 - Main Report. Katestone Scientific Pty Ltd.
Katestone Scientific. (1998). Report from Katestone Scientific to Environment Protection Authority of
NSW: Peak to Mean Ratios for Odour Assessments. Katestone Scientific Pty Ltd: Katestone
Scientific.
NSW EPA. (2016). Approved Methods for the Modelling and Assessment of Air Pollutants in NSW.
Sydney: NSW Environment Protection Authority.
Pacific Environment. (2013). Spring Farm Advanced Resource Recovery Treatment Facility - Air
Quality and Odour Impact Assessment. Prepared for SITA Australia Pty Ltd c/- Cardno by
Pacific Environment, job number 7327, 23/09/2013.
Pacific Environment. (2018). SUEZ Spring Farm ARRF - Odour Audit. Document number: AQU-NSW-
003-0458764. Pacific Environment (an ERM group Company). July 2018.
PAEHolmes. (2012). Air Quality Assessment: Whytes Gully New Landfill Cell. PAEHolmes. June
2012.
SKM. (2007). Odour and Dust Assessment: Enviroking Liquid Waste Treatment Facility, Black Hill,
Cessnock NSW. Sinclair Knight Merz. October 2007.
SUEZ. (2019). Report on Odour Emission from the Odour Scrubber Unit at Suez Recycling and
Recovery Australia Camellia Facility. Prepared by EnvironOdour on behalf of SUEZ. May
2019.

www.erm.com Version: 02 Project No.: 0505960 Client: SUEZ 8 June 2020 Page 26
SPRING FARM ADVANCED RESOURCE RECOVERY TECHNOLOGY FACILITY Odour Assessment
REFERENCES
ERM has over 160 offices across the following
countries and territories worldwide
Argentina
Australia
Belgium
Brazil
Canada
Chile
China
Colombia
France
Germany
Hong Kong
India
Indonesia
Ireland
Italy
Japan
Kazakhstan
Kenya
Malaysia
Mexico
Mozambique
Myanmar
The Netherlands
New Zealand
Norway
Panama
Peru
Poland
Portugal
Puerto Rico
Romania
Russia
Singapore
South Africa
South Korea
Spain
Sweden
Switzerland
Taiwan
Thailand
UAE
UK
US
Vietnam
ERM’s Sydney Office
Level 15
309 Kent Street
SYDNEY NSW 2000
T: +61 2 8584 8888
F: +61 2 9299 7502
www.erm.com


