
Reducing Water Use on Campus: Cooling Towers
2011 Deluhery, Chen, Rajagopalan
Funded By
Student Sustainability Committee, UIUC
In 2008, the University of Illinois at Urbana Champaign signed on to the American College & University Presidents’ Climate Commitment.
In 2010, the completed Illinois Climate Action Plan (iCAP) was published.
“Our intentions are clear and our goal remains ambitious: to be the model of sustainability for
all universities in the nation.”
-Robert A. Easter, Chancellor (iCAP)
2
The campus has made a commitment to reducing greenhouse gas emissions, energy
and water use.
The University’s goal is a 20% reduction of campus potable water consumption by 2015. A
40% reduction by 2025 is envisioned.
Meeting this goal requires closely examining how water is currently used on campus and
what opportunities are available for improvement.
3
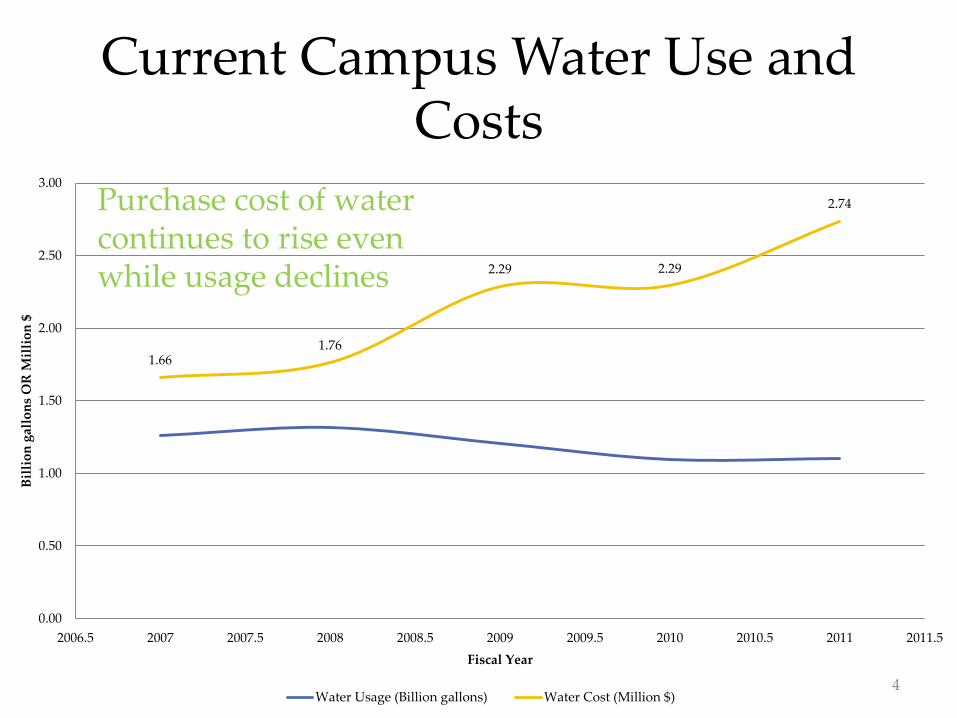
Current Campus Water Use and Costs
1.66 1.76
2.29 2.29
2.74
0.00
0.50
1.00
1.50
2.00
2.50
3.00
2006.5 2007 2007.5 2008 2008.5 2009 2009.5 2010 2010.5 2011 2011.5
Bil
lio
n g
allo
ns
OR
Mil
lio
n $
Fiscal Year
Water Usage (Billion gallons) Water Cost (Million $)
Purchase cost of water continues to rise even while usage declines
4

Project Goals
• Benchmark Water Use in Cooling Towers & at Abbott RO Plant
• Generate Ideas for Improving Water Use Efficiency
Customer/Collaborator – F & S
Project Sponsor – Student Sustainability Committee
5

Actions • Install Trasar 3D monitoring at Oak St and Vet Med Chiller Plants • Feasibility study of sulfuric acid dosing to increase COC at chiller plants • Optimize Abbott Cooling Tower and RO as a whole system • Benchmark softener plant performance at Abbott/other locations Pilot Studies • Piloting of Nanofiltration of Oak Street seepage water as make-up for
cooling tower • Pilot investigation of non-chemical water treatment (especially VRTX)
technologies for stand-alone towers • Pilot investigations of non-chemical softening using zeolite based resins
Follow-Up
7
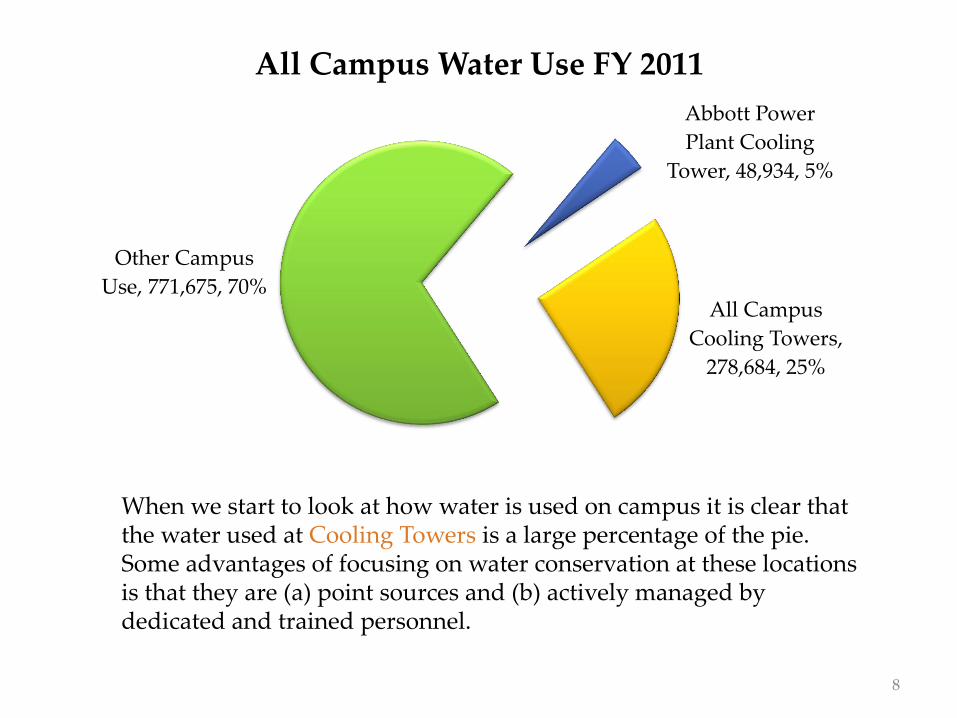
When we start to look at how water is used on campus it is clear that the water used at Cooling Towers is a large percentage of the pie. Some advantages of focusing on water conservation at these locations is that they are (a) point sources and (b) actively managed by dedicated and trained personnel.
Abbott Power
Plant Cooling
Tower, 48,934, 5%
All Campus
Cooling Towers,
278,684, 25%
Other Campus
Use, 771,675, 70%
All Campus Water Use FY 2011
8

http://goo.gl/maps/jf6K
UIUC Cooling Tower Location Map
As you can see on the map, Cooling tower locations are spread all over the University
Campus. The spatial distribution of towers is a barrier to close monitoring at many locations. The
larger Chiller Plants, however, are closely monitored by on-site staffing on a daily basis.
9

What is a Cooling Tower?
• Equipment that cools water through evaporation
• On campus, primarily used to remove heat from buildings, especially in summer.
10
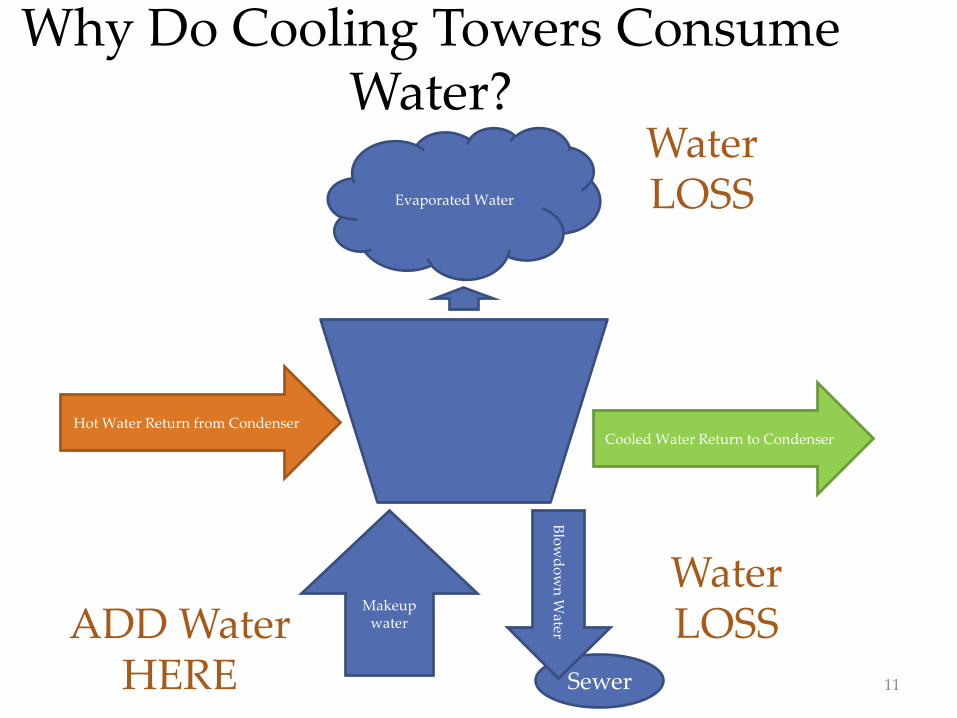
Why Do Cooling Towers Consume Water?
Hot Water Return from Condenser
Makeup water
Cooled Water Return to Condenser
Evaporated Water
Sewer
Blo
wd
ow
n W
ater
Water LOSS
Water LOSS
ADD Water HERE 11
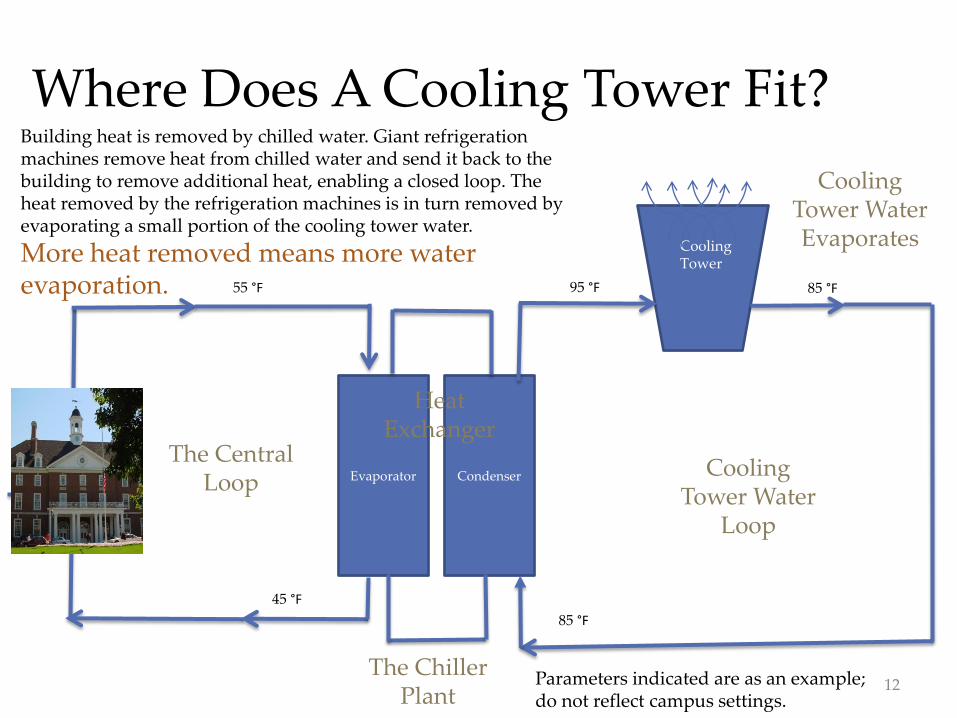
Where Does A Cooling Tower Fit? Building heat is removed by chilled water. Giant refrigeration machines remove heat from chilled water and send it back to the building to remove additional heat, enabling a closed loop. The heat removed by the refrigeration machines is in turn removed by evaporating a small portion of the cooling tower water.
More heat removed means more water evaporation.
Condenser
55 °F
Evaporator
45 °F
95 °F
85 °F
85 °F
The Central Loop
The Chiller Plant
Cooling Tower
Pump
Heat Exchanger
Cooling Tower Water
Loop
Cooling Tower Water Evaporates
Parameters indicated are as an example; do not reflect campus settings.
12
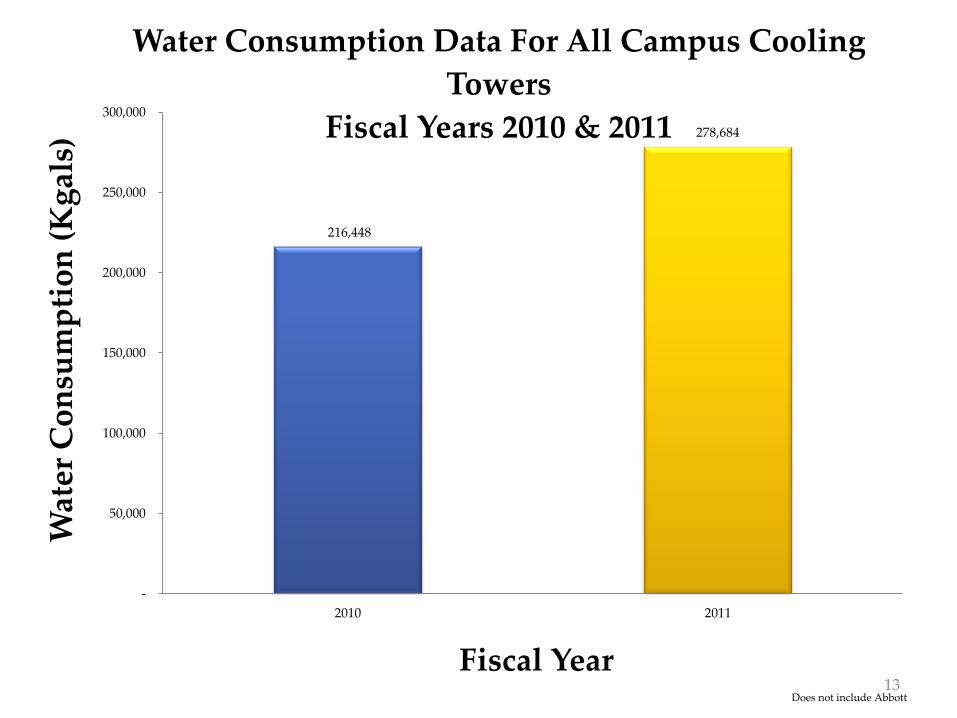
216,448
278,684
-
50,000
100,000
150,000
200,000
250,000
300,000
2010 2011
Wat
er C
on
sum
pti
on
(K
gal
s)
Fiscal Year
Water Consumption Data For All Campus Cooling
Towers
Fiscal Years 2010 & 2011
Does not include Abbott 13

Oak Street Chiller
Plant
33%
North Campus Chiller
Plant
19%
Veterinary Medicine
Chiller Plant
13%
Library Air
Conditioning Center
11%
Animal Science Air
Conditioning Ctr
6%
Housing Food Stores
3%
Other Active (20+)
Towers
15%
Campus Cooling Tower Water Use FY 2011
Without Abbott Power Plant
* CLSL off for most of the year to bring it onto the loop as a booster chiller.
14
-
10,000
20,000
30,000
40,000
50,000
60,000
70,000
80,000
90,000
100,000
Oak Street
Chiller Plant
North Campus
Chiller Plant
Abbott Power
Plant Cooling
Tower
Veterinary
Medicine Chiller
Plant
Library Air
Conditioning
Center
Animal Science
Air Conditioning
Ctr
Housing Food
Stores
Other Active
(20+) Towers
Wat
er U
se (
Kg
al)
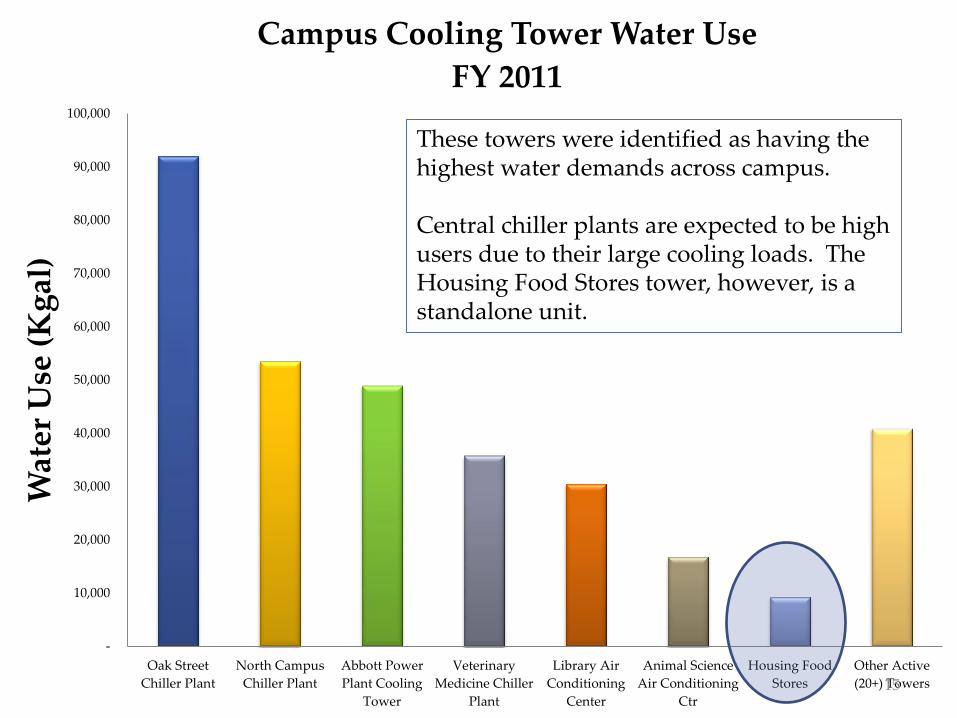
Campus Cooling Tower Water Use
FY 2011
These towers were identified as having the highest water demands across campus. Central chiller plants are expected to be high users due to their large cooling loads. The Housing Food Stores tower, however, is a standalone unit.
15

A Little Cooling Tower Jargon
• Cycles of Concentration (COC): A measure of water use efficiency – Bigger number is better
– Typical target: 4-5
• COC dependent on water quality – Higher water quality into the tower allows
higher target COC
– Higher quality typically also means more water pretreatment/more $$$
16

13
19
0
2
4
6
8
10
12
14
16
18
20
Treated Untreated
Nu
mb
er o
f C
oo
lin
g T
ow
ers
Treated vs. Untreated CT
Towers operating below 1.5 cycles are not chemically treated. Towers with higher cycles are chemically treated.
18
4
2
1
7
0
2
4
6
8
10
12
14
16
18
20
< 1.5 1.5-2 2.1-2.5 2.6-3 3.1 and up
Nu
mb
er o
f T
ow
ers
Ranges of Cycles
Cooling Towers vs
Efficiency
Higher Water Use Efficiency
17
47,090
9,979
156,268
79,049
36,647
161,780
-
20,000
40,000
60,000
80,000
100,000
120,000
140,000
160,000
180,000
1.0-2.0 2.1-2.5 2.6-3 3.1+
Mak
eup
(K
gal
s)
Range of Cycles
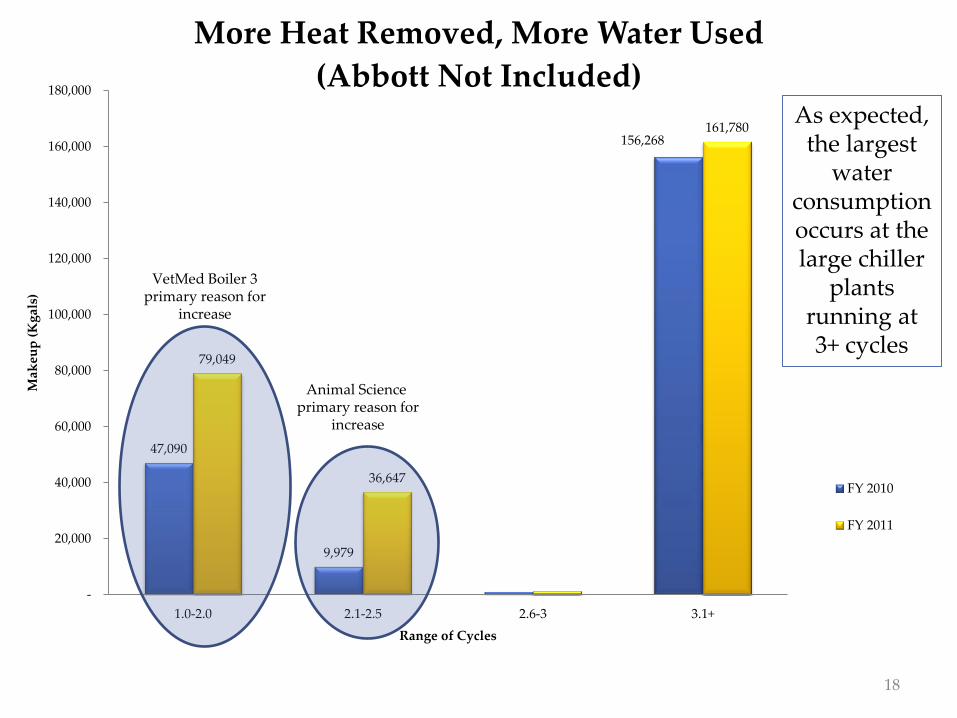
More Heat Removed, More Water Used
(Abbott Not Included)
FY 2010
FY 2011
As expected, the largest
water consumption occurs at the large chiller
plants running at 3+ cycles
VetMed Boiler 3 primary reason for
increase
Animal Science primary reason for
increase
18

54,643
29,845 16,936
47,938
71,586
56,396
37,855
161,780
-
20,000
40,000
60,000
80,000
100,000
120,000
140,000
160,000
180,000
< 1.5 1.5-2 2.1-3 3.1+
Wat
er (
kg
al)
Cycles
Lower Efficiencies Mean
More Water Use, More Cost
Blowdown (kgal) Makeup (kgal)
Abbott , Plant Sciences ISTC, State Water Survey
Smaller Towers & Vet Med
Blowdown Greater Than Centralized Chiller Plants
Oak St CP; NCCP (N&S) Library, Grainger, CLSL
19
0
5,000
10,000
15,000
20,000
25,000
Blo
wd
ow
n (
Kg
als)
Cooling Towers
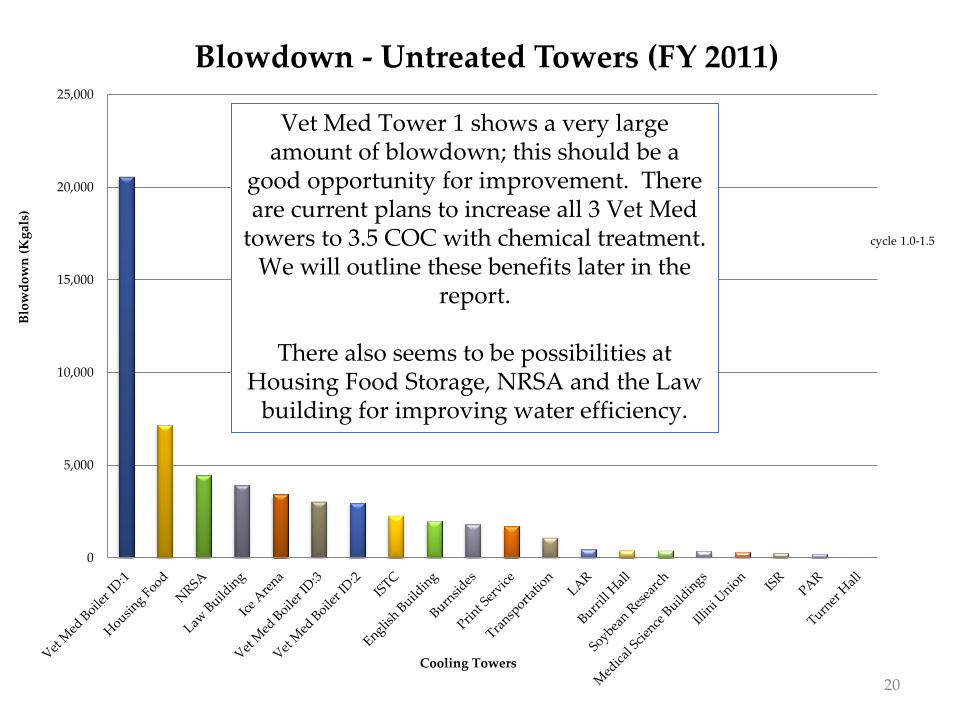
Blowdown - Untreated Towers (FY 2011)
cycle 1.0-1.5
Vet Med Tower 1 shows a very large amount of blowdown; this should be a
good opportunity for improvement. There are current plans to increase all 3 Vet Med
towers to 3.5 COC with chemical treatment. We will outline these benefits later in the
report.
There also seems to be possibilities at Housing Food Storage, NRSA and the Law
building for improving water efficiency.
20
0%
10%
20%
30%
40%
50%
60%
70%
80%
90%
100%
1.00 1.50 2.00 2.50 3.00 3.50 4.00
% B
low
do
wn
COC Range
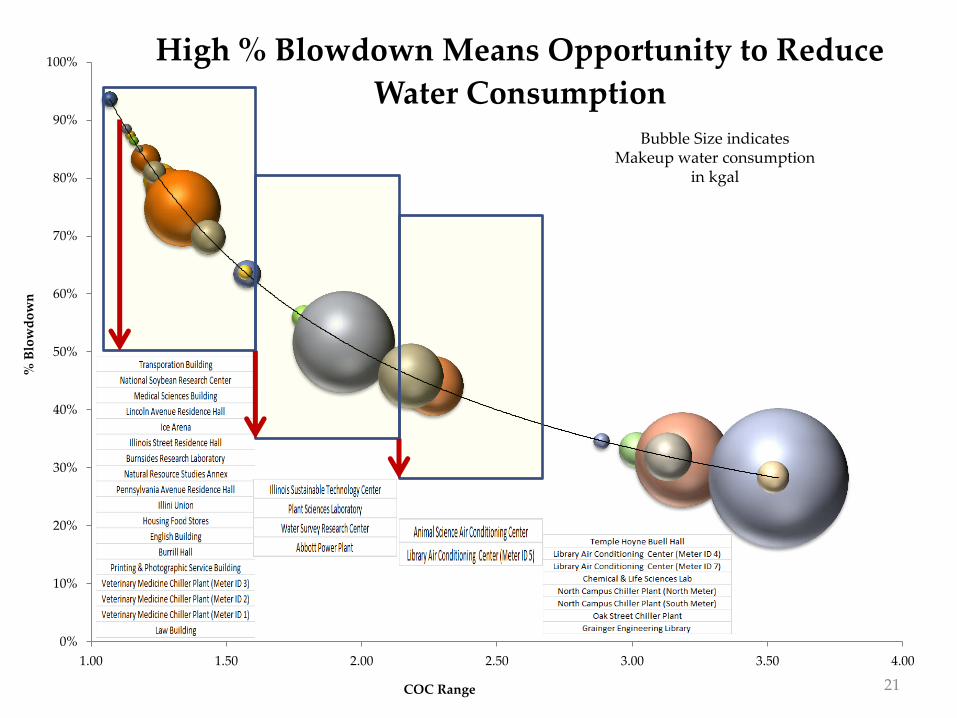
High % Blowdown Means Opportunity to Reduce
Water Consumption Bubble Size indicates
Makeup water consumption in kgal
21
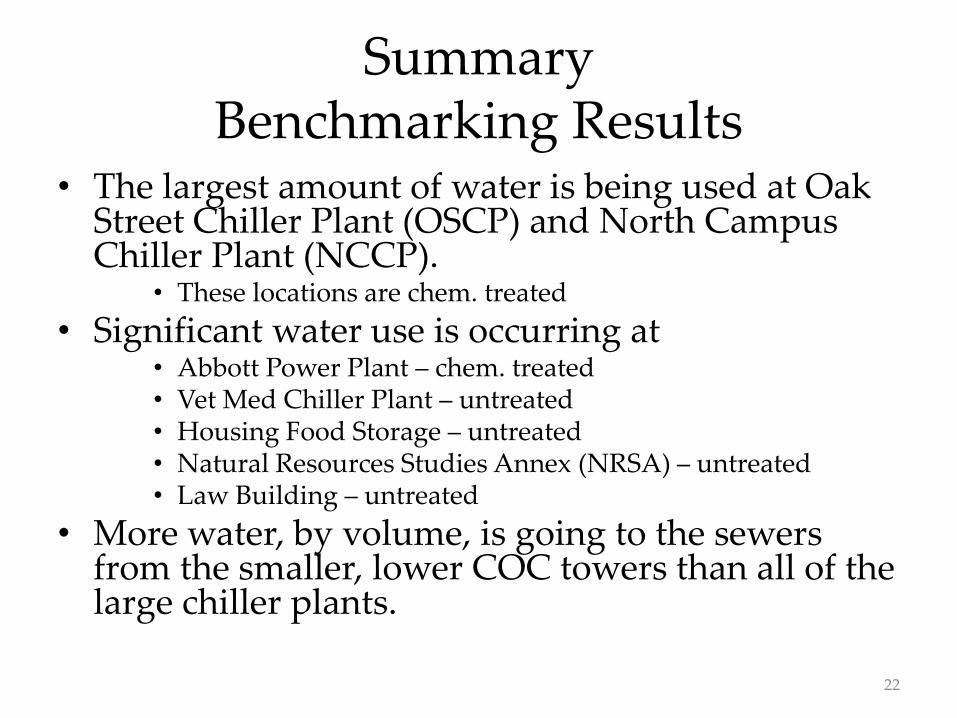
Summary Benchmarking Results
• The largest amount of water is being used at Oak Street Chiller Plant (OSCP) and North Campus Chiller Plant (NCCP).
• These locations are chem. treated
• Significant water use is occurring at • Abbott Power Plant – chem. treated • Vet Med Chiller Plant – untreated • Housing Food Storage – untreated • Natural Resources Studies Annex (NRSA) – untreated • Law Building – untreated
• More water, by volume, is going to the sewers from the smaller, lower COC towers than all of the large chiller plants.
22
0%
10%
20%
30%
40%
50%
60%
70%
80%
90%
100%
0 1 2 3 4 5 6 7
% o
f w
ater
to
sew
er
Axis Title
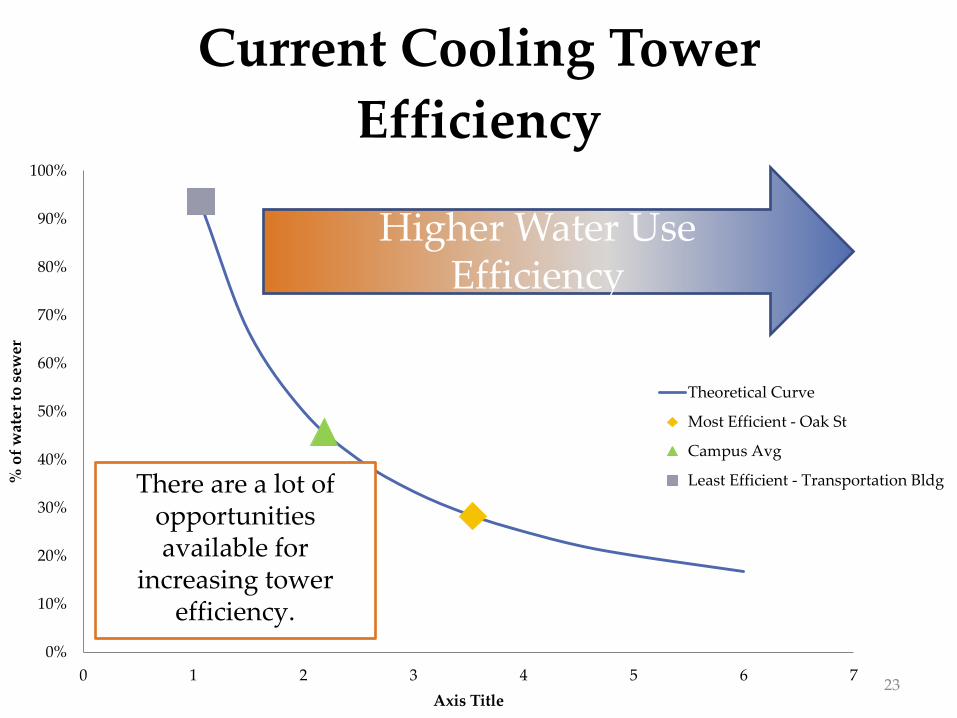
Current Cooling Tower
Efficiency
Theoretical Curve
Most Efficient - Oak St
Campus Avg
Least Efficient - Transportation Bldg
Higher Water Use Efficiency
There are a lot of opportunities available for
increasing tower efficiency.
23

Benchmarking Abbott RO
• RO Flow rates at Abbott Power Plant were analyzed over a 2 fiscal year period.
24

31676.7
29763.2
5160.5 4756.6
2536.6 2186.7
0
5,000
10,000
15,000
20,000
25,000
30,000
35,000
RO #2 RO #2
Wat
er (
kg
al)
Abbott RO Flows
FY 2011
RO #1 Feed
RO #1 Permeate
RO #1 Reject
RO #2 Feed
RO #2 Permeate
RO #2 Reject
Summary
25

0
5,000
10,000
15,000
20,000
25,000
30,000
35,000
RO #2 RO #2
Wat
er (
kg
al)
Abbott RO Flows
FY 2011
RO #1 Feed
RO #1 Permeate
RO #1 Reject
RO #2 Feed
RO #2 Permeate
RO #2 Reject
The data indicates that there has been little change between RO performance in FY 2010 and
FY 2011.
The 1st pass has a ~85% Recovery
The 2nd pass has a ~90% Recovery
These systems appear to have limited opportunities for optimization
Summary
26

0%
10%
20%
30%
40%
50%
60%
70%
80%
90%
100%
0 1 2 3 4 5 6 7
% o
f w
ater
to
sew
er
Axis Title
Current Cooling Tower
Efficiency
Theoretical Curve
Most Efficient - Oak St
Campus Avg
Least Efficient - Transportation Bldg
Higher Water Use Efficiency
There are a lot of opportunities available for
increasing tower efficiency.
27

Routes
Use CT blowdown to displace water use
in another application
Decrease CT water use through
improved control
•Improved monitoring(Trasar)
Reduce Cooling Load
•Increase Chiller Plant Efficiency
•Building Retrocommissioning
Decrease CT water by increasing COC
• Treat water at more towers (chemical,
non-chemical)
•Treat water more intensively
Cascade water from another process for
CT make-up
•Abbott RO reject
•Oak Street Seepage
•Reprocessed blowdown
Routes to Water Reduction
28

Decrease CT water use by
increasing COC
•Treat water at more towers (chemical, non-chemical)
•Treat water more intensively
ROUTE 1
29

Findings
• Evaluated water consumption and cycles of concentration at Campus Cooling Towers.
• We found a significant amount of water savings is possible by modifying operation at only 7 of the towers.
30

Evaluation Results
• 57.3 Million Gallons total water savings (click to see details)
– This would represent a 20% savings of total Campus Cooling Tower water use for 2011
– This would represent a 5% savings of total Campus water use for 2011
• In one year, cost savings could amount to
$136,000*!!
* (based on FY 2011 demands)
31
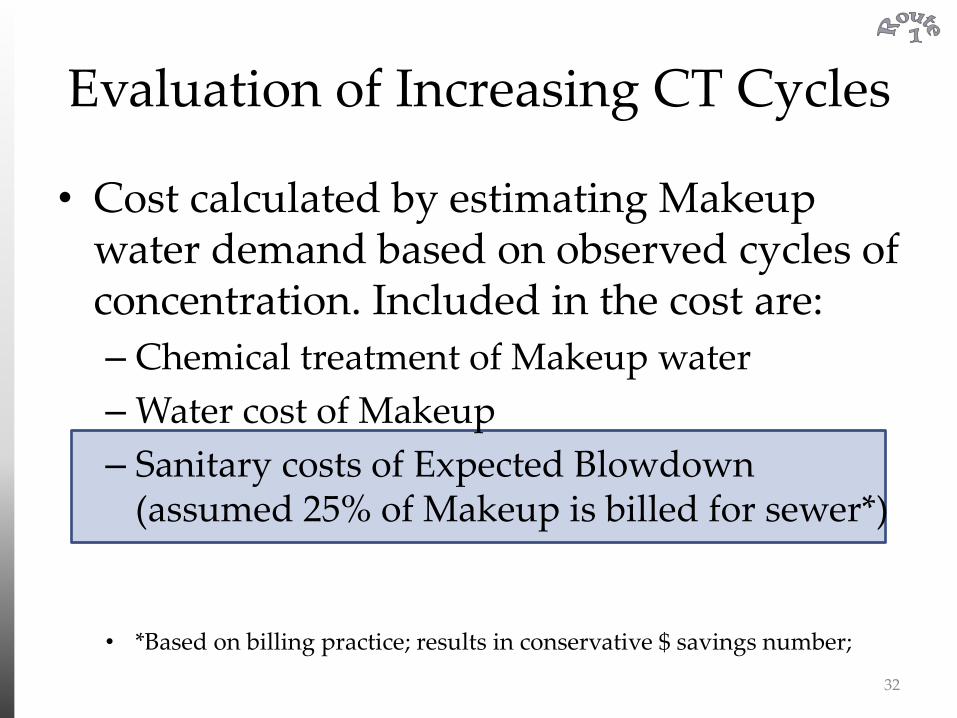
Evaluation of Increasing CT Cycles
• Cost calculated by estimating Makeup water demand based on observed cycles of concentration. Included in the cost are:
– Chemical treatment of Makeup water
– Water cost of Makeup
– Sanitary costs of Expected Blowdown (assumed 25% of Makeup is billed for sewer*)
• *Based on billing practice; results in conservative $ savings number;
32

Isn’t saving water only an environmental issue?
Commonly, water is considered cheap. Cooling Tower water associated costs can be
200-300% higher than the incoming water cost at current water rates.
$1.32 $1.34
$1.90
$2.09
$2.49
$-
$0.50
$1.00
$1.50
$2.00
$2.50
$3.00
2006 2007 2008 2009 2010 2011 2012
Wat
er R
ate
Bil
led
($/
kg
al)
Fiscal Year 33
Expected to increase by 20% in FY 2012

True Cost of Water
Proper identification of all of the associated costs of running a system better enable you to make an accurate determination of the economic viability of an improvement. Costs of water at Tower
1. Purchase price of water 2. Chemicals We are focusing on these 3 factors. 3. Sewer fees 4. Maintenance of equipment – not included 5. Energy to run cooling tower – not included 6. Direct Labor, Supervision and Administration – not included
• Costs used (UIUC Internal Memo, June 28, 2010, Terry Ruprecht to Dempsey)
– Energy Savings Rate for Water : $2.15/kgal – Energy Savings Rate for Sewer Disposal : $ 2.02/kgal – Chemical Treatment Costs :
• $0/kgal for COC < 1.5; $1.08/kgal for 1.5<COC<4; $1.18/kgal for 4<COC<5
34 Example Calculation
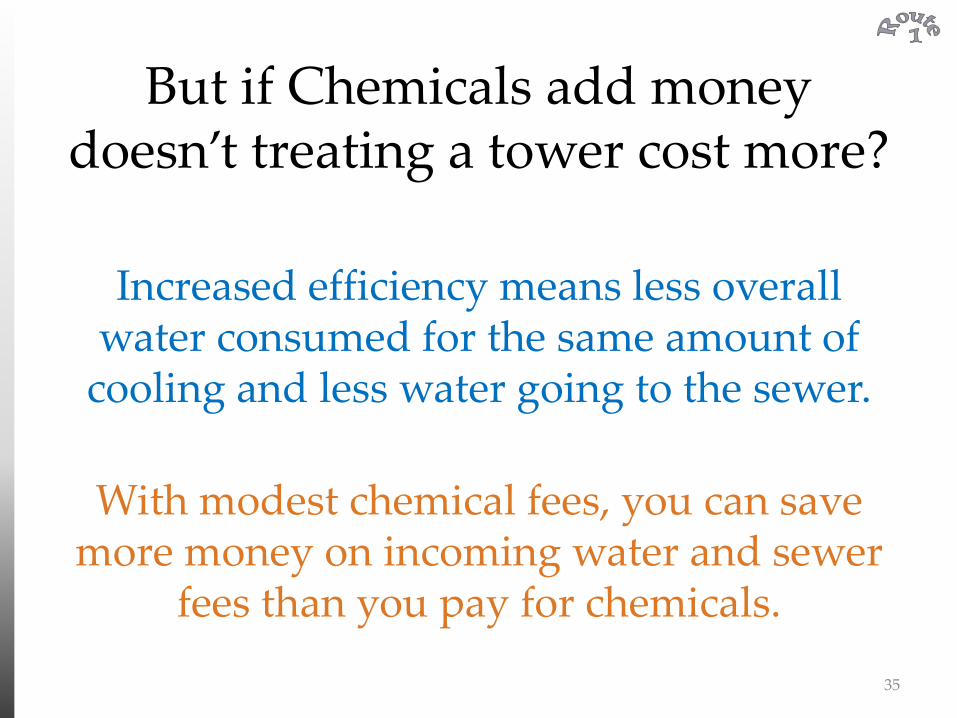
But if Chemicals add money doesn’t treating a tower cost more?
Increased efficiency means less overall water consumed for the same amount of
cooling and less water going to the sewer.
With modest chemical fees, you can save more money on incoming water and sewer
fees than you pay for chemicals.
35
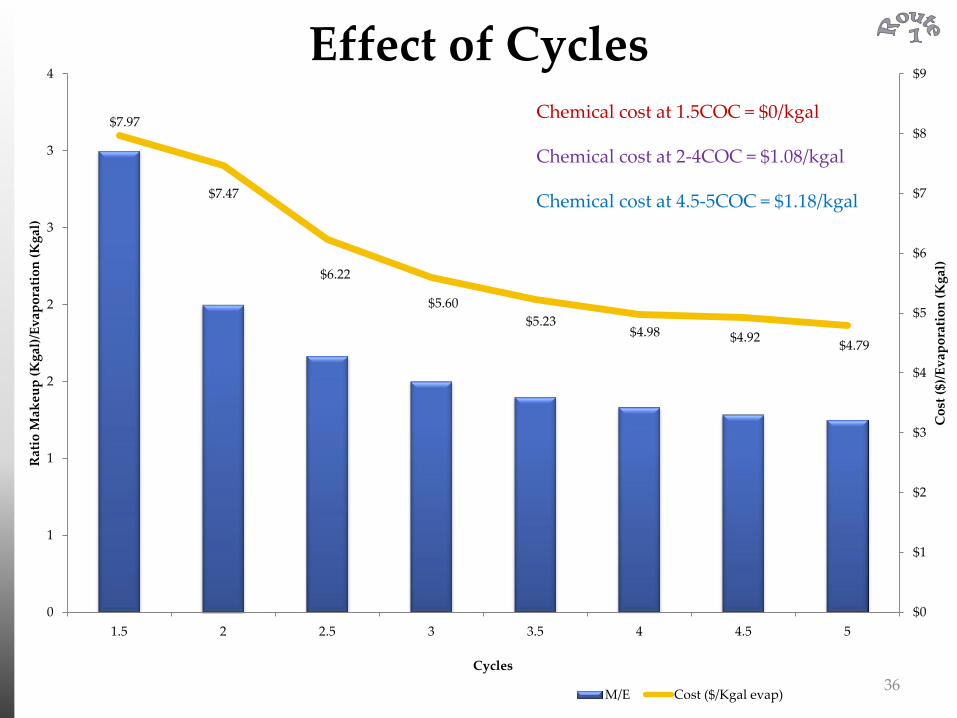
$7.97
$7.47
$6.22
$5.60
$5.23 $4.98 $4.92
$4.79
$0
$1
$2
$3
$4
$5
$6
$7
$8
$9
0
1
1
2
2
3
3
4
1.5 2 2.5 3 3.5 4 4.5 5
Co
st (
$)/E
vap
ora
tio
n (
Kg
al)
Rat
io M
akeu
p (
Kg
al)/
Ev
apo
rati
on
(K
gal
)
Cycles
Effect of Cycles
M/E Cost ($/Kgal evap)
Chemical cost at 1.5COC = $0/kgal Chemical cost at 2-4COC = $1.08/kgal Chemical cost at 4.5-5COC = $1.18/kgal
36
$0
$50,000
$100,000
$150,000
$200,000
$250,000
$300,000
$350,000
$400,000
Oak Street Chiller Plant North Campus Chiller
Plant (North)
North Campus Chiller
Plant (South)
Co
st
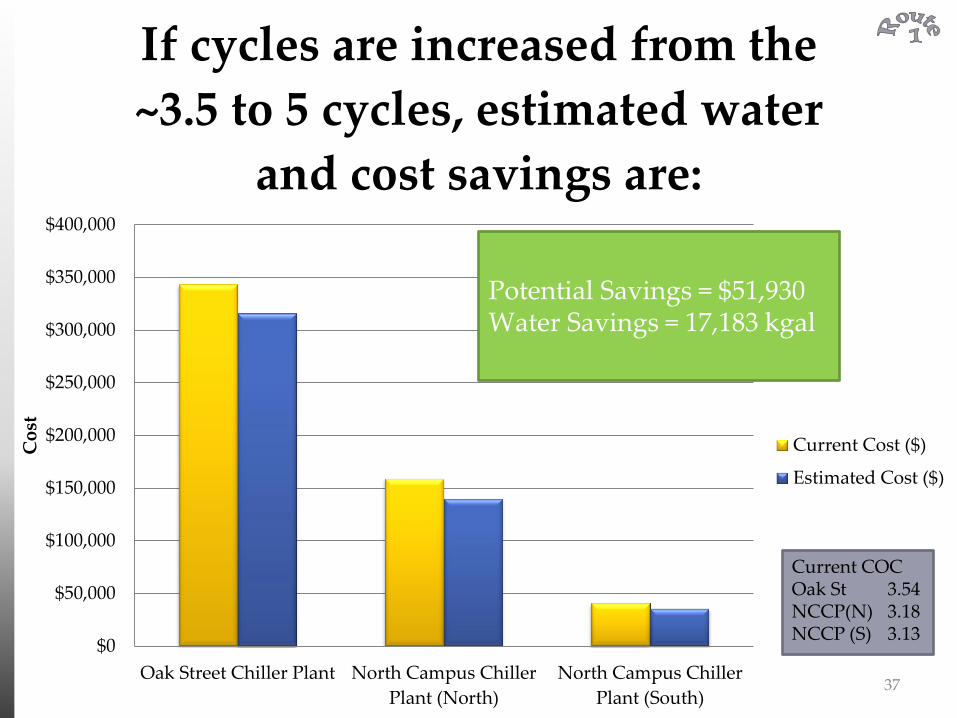
If cycles are increased from the
~3.5 to 5 cycles, estimated water
and cost savings are:
Current Cost ($)
Estimated Cost ($)
Potential Savings = $51,930 Water Savings = 17,183 kgal
Current COC Oak St 3.54 NCCP(N) 3.18 NCCP (S) 3.13
37
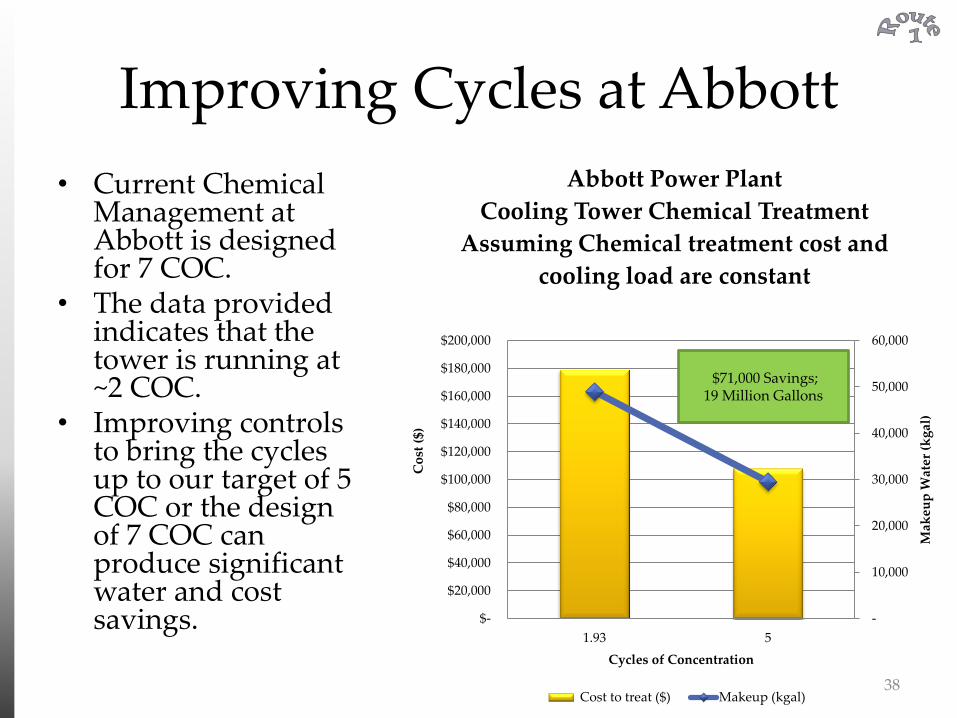
Improving Cycles at Abbott
• Current Chemical Management at Abbott is designed for 7 COC.
• The data provided indicates that the tower is running at ~2 COC.
• Improving controls to bring the cycles up to our target of 5 COC or the design of 7 COC can produce significant water and cost savings. -
10,000
20,000
30,000
40,000
50,000
60,000
$-
$20,000
$40,000
$60,000
$80,000
$100,000
$120,000
$140,000
$160,000
$180,000
$200,000
1.93 5
Mak
eup
Wat
er (
kg
al)
Co
st (
$)
Cycles of Concentration
Abbott Power Plant
Cooling Tower Chemical Treatment
Assuming Chemical treatment cost and
cooling load are constant
Cost to treat ($) Makeup (kgal)
$71,000 Savings; 19 Million Gallons
38
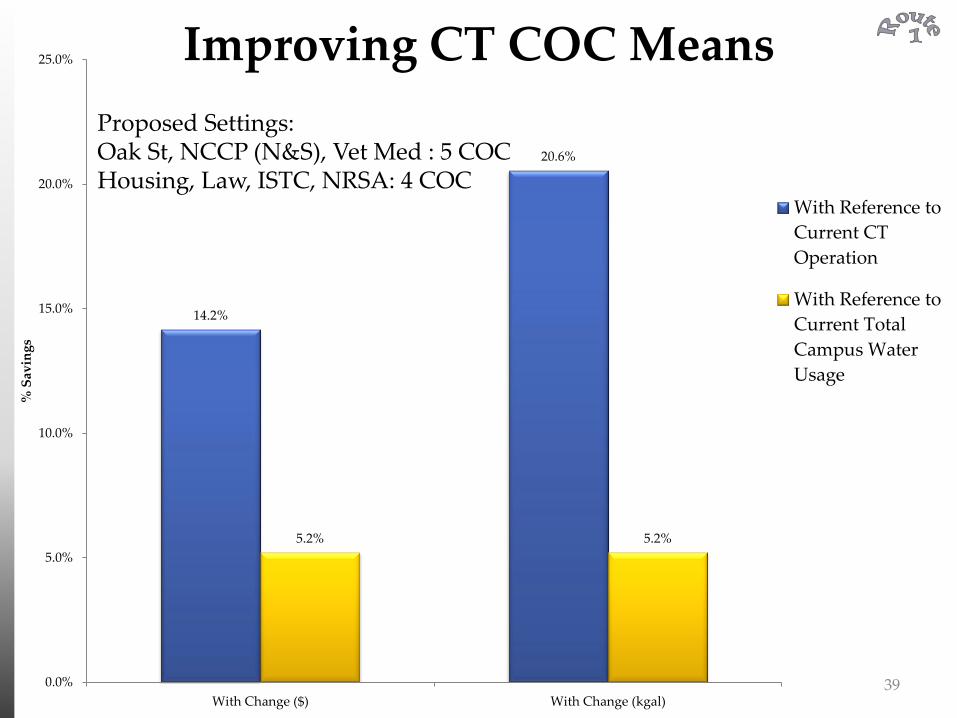
14.2%
20.6%
5.2% 5.2%
0.0%
5.0%
10.0%
15.0%
20.0%
25.0%
With Change ($) With Change (kgal)
% S
avin
gs
Improving CT COC Means
With Reference to
Current CT
Operation
With Reference to
Current Total
Campus Water
Usage
Proposed Settings: Oak St, NCCP (N&S), Vet Med : 5 COC Housing, Law, ISTC, NRSA: 4 COC
39
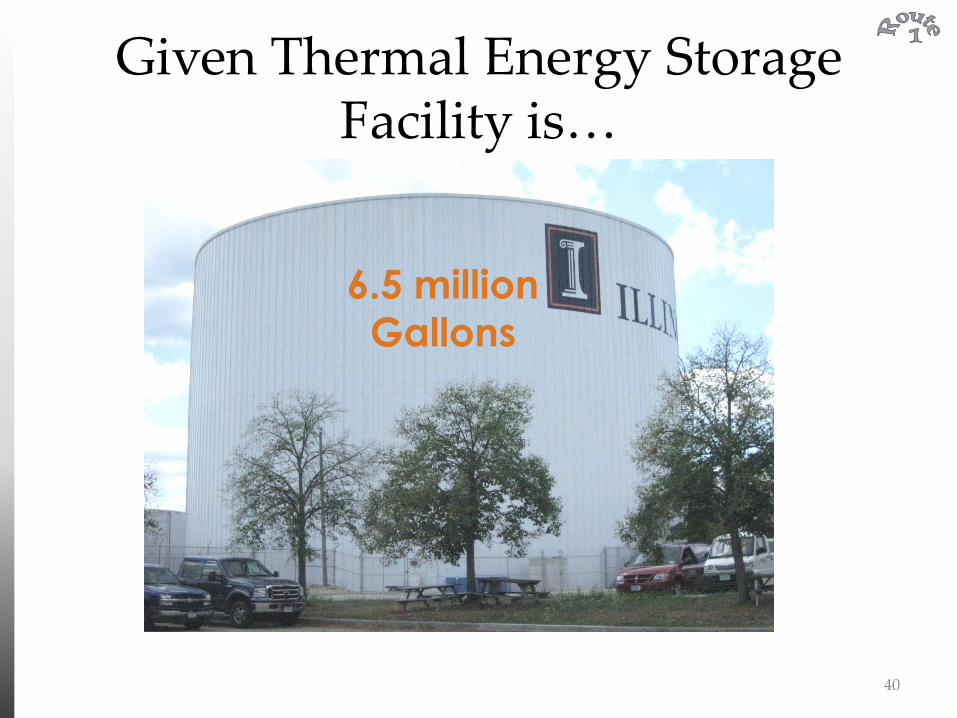
Given Thermal Energy Storage Facility is…
6.5 million
Gallons
40
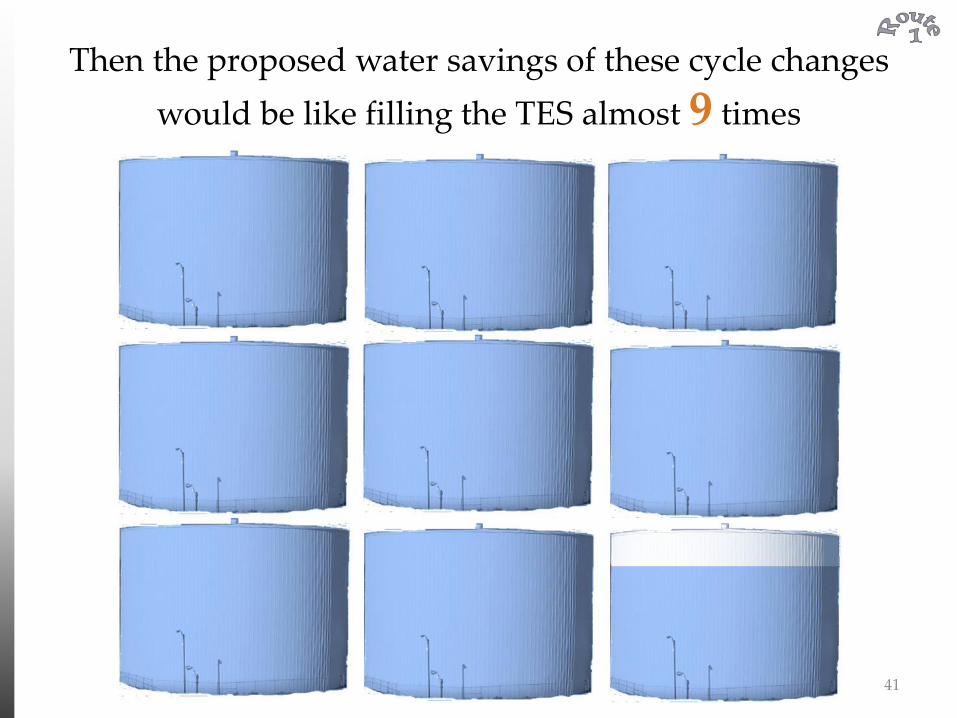
Then the proposed water savings of these cycle changes
would be like filling the TES almost 9 times
41
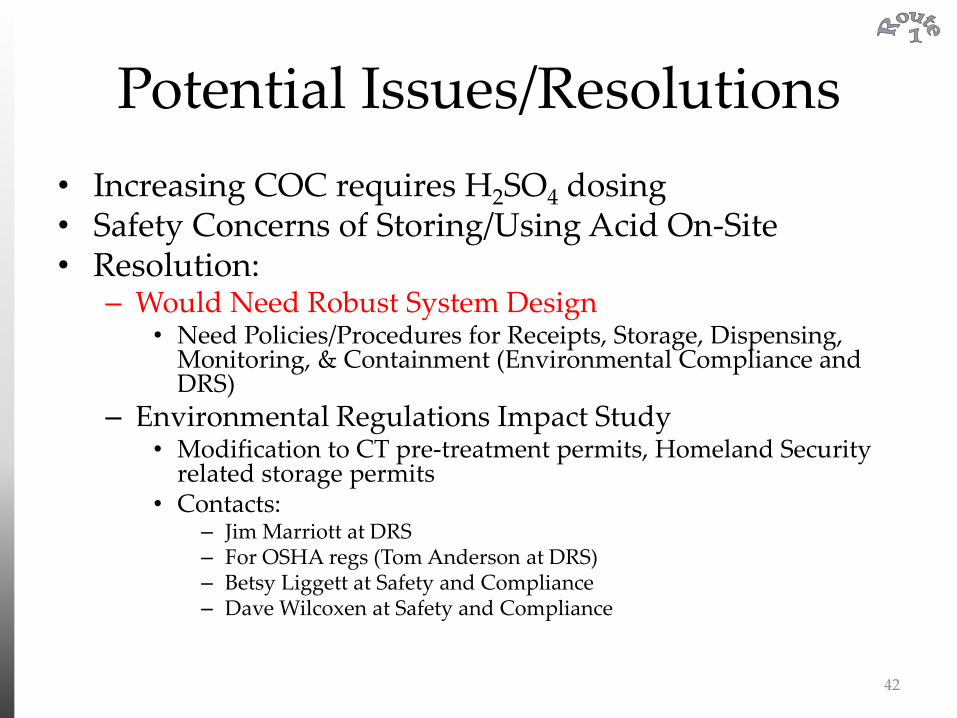
Potential Issues/Resolutions
• Increasing COC requires H2SO4 dosing • Safety Concerns of Storing/Using Acid On-Site • Resolution:
– Would Need Robust System Design • Need Policies/Procedures for Receipts, Storage, Dispensing,
Monitoring, & Containment (Environmental Compliance and DRS)
– Environmental Regulations Impact Study • Modification to CT pre-treatment permits, Homeland Security
related storage permits • Contacts:
– Jim Marriott at DRS – For OSHA regs (Tom Anderson at DRS) – Betsy Liggett at Safety and Compliance – Dave Wilcoxen at Safety and Compliance
42
Is there a way to avoid the use of Chemicals but still
increase Cycles of Concentration?
43

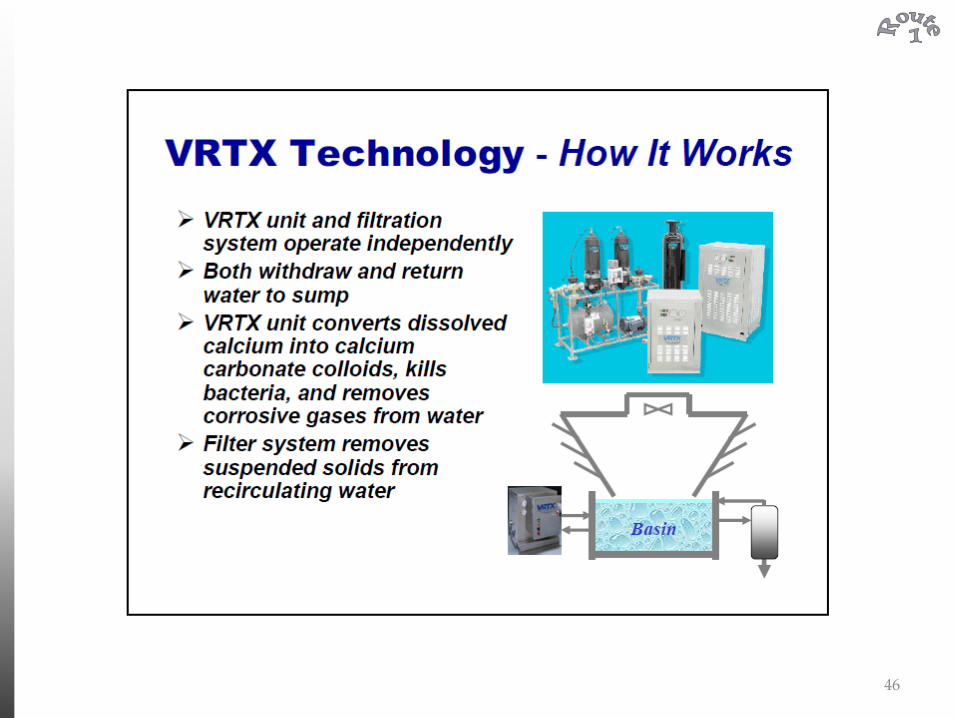
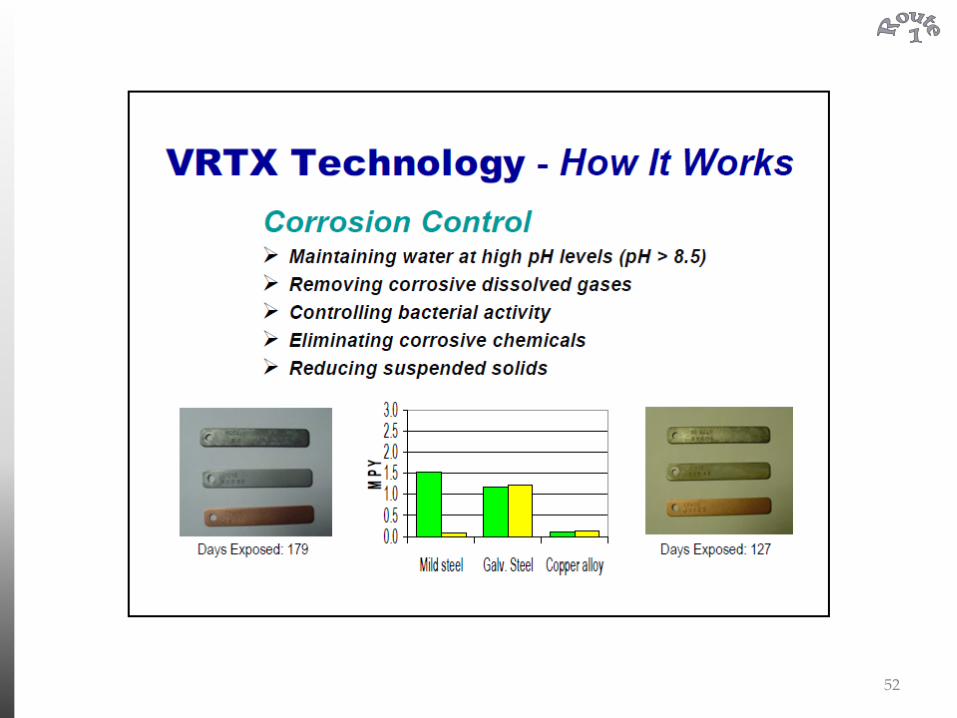
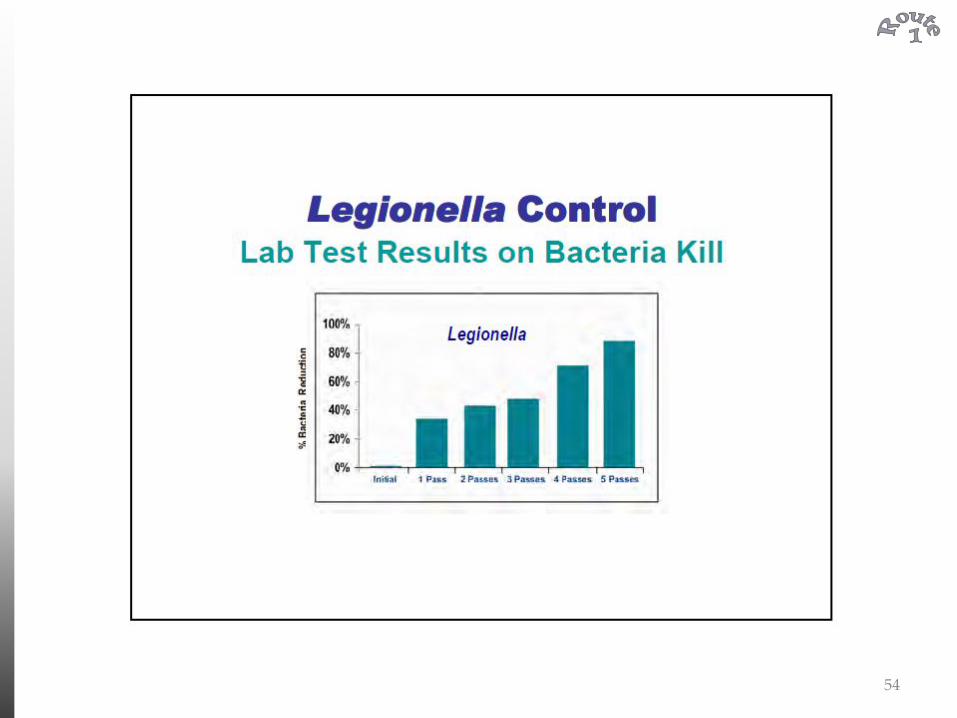
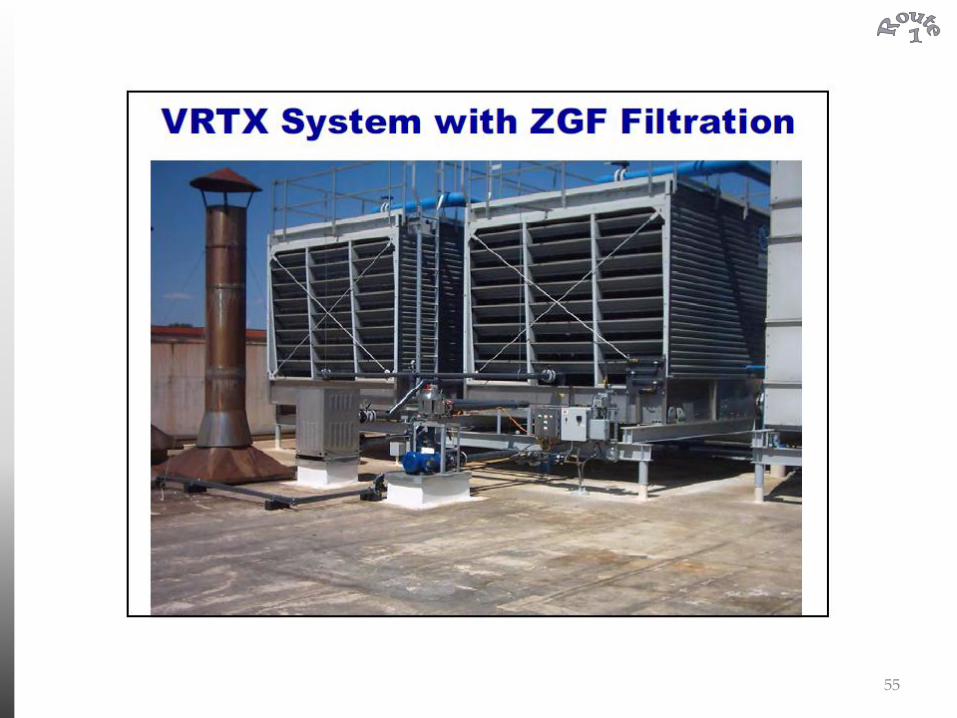
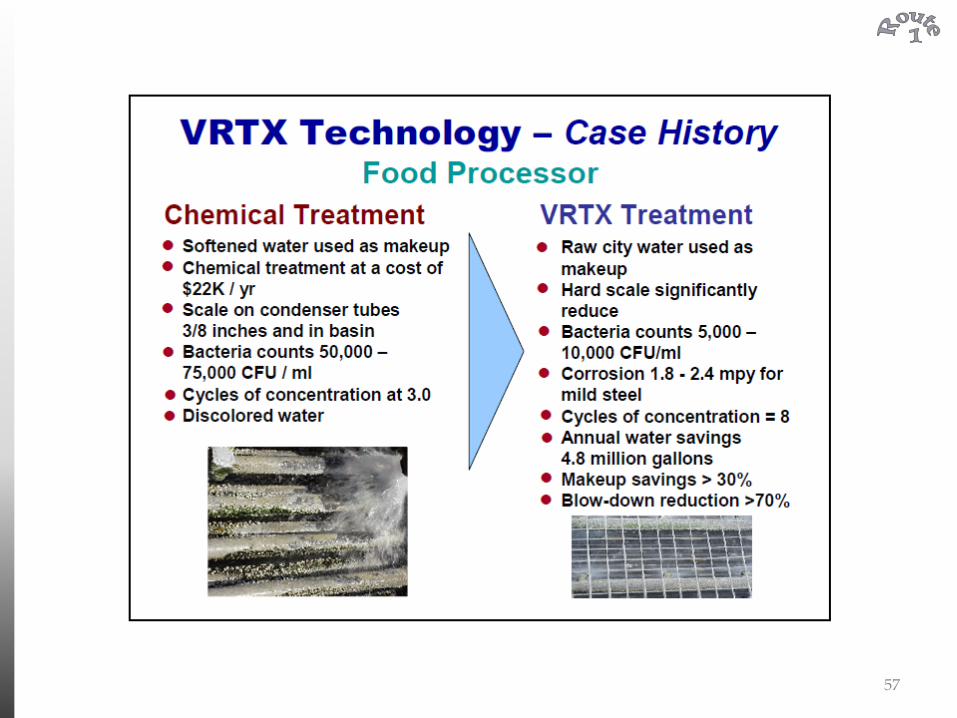
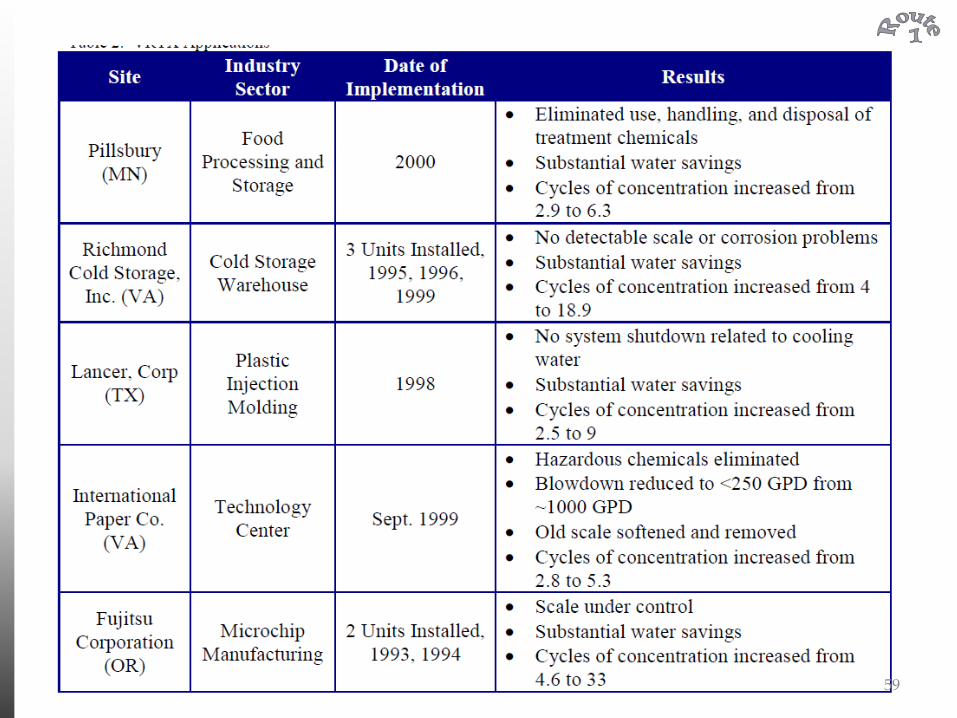
Don’t Like Chemicals?
• Non-chemical cooling tower programs are available
• Many such programs are poorly documented and have questionable effectiveness
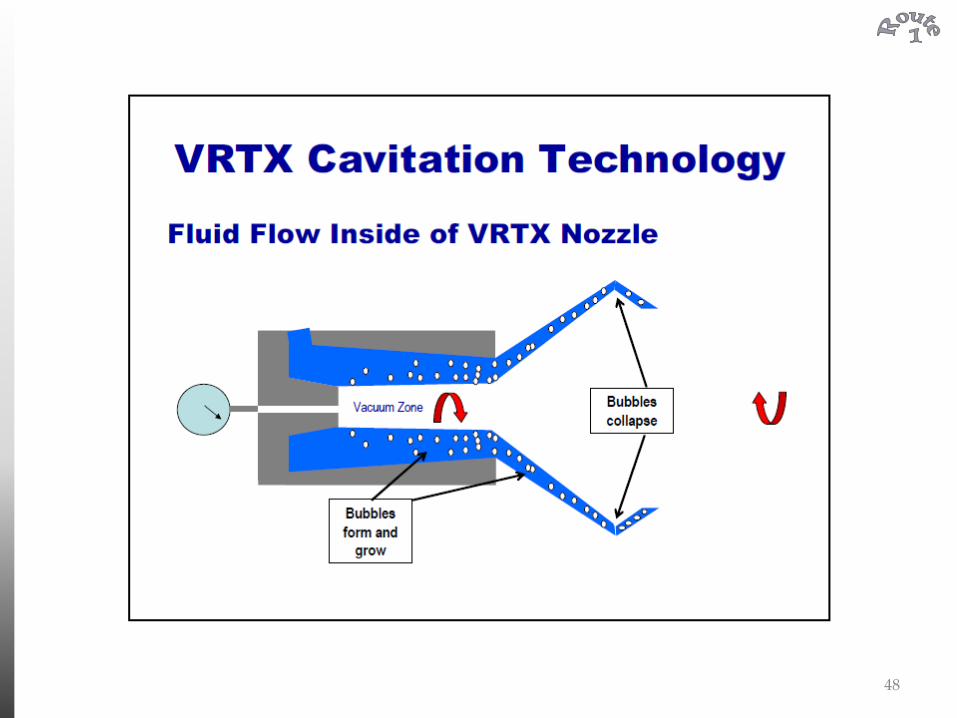
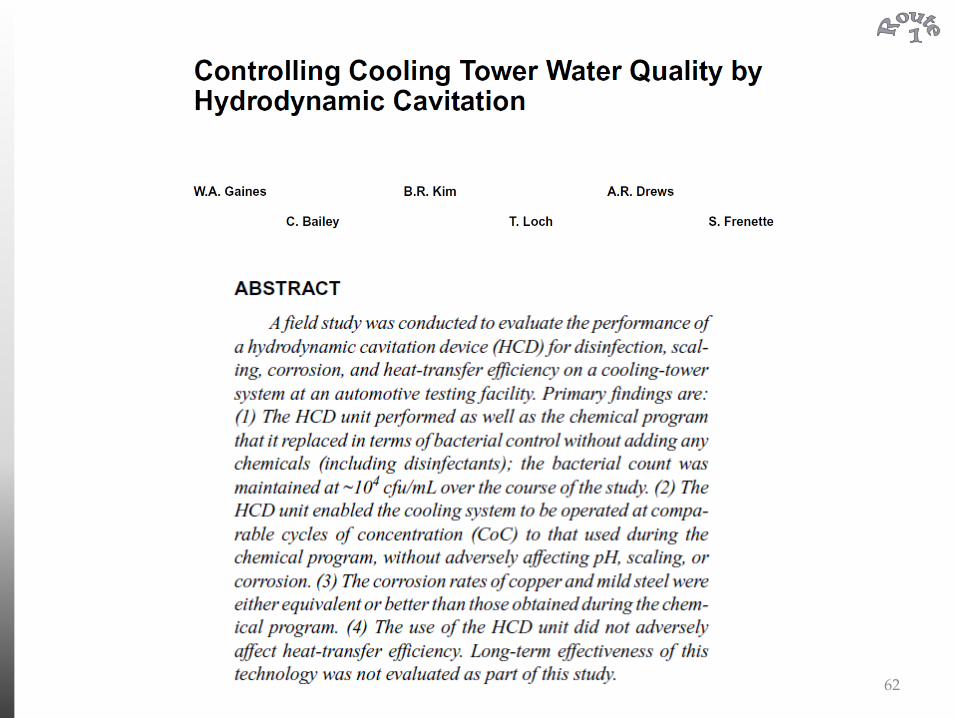
• One based on cavitation appears to have been more thoroughly vetted. This may be a good candidate for a pilot test.
44

45
46

47
48
49

50
51
52

53
54
55
56
57

58
59

60

61
62

63

•General Mills – New Albany IN: Ted Iverson – 812-941-4332; [email protected]
•Ed Miniat Meats – South Holland IL: Randy Nelson – 708-589-2400; [email protected]
•Preferred Freezer - Chicago IL: Phil Locher – 773-457-7839; [email protected]
•Appleton Medical Center – Appleton WI: Richard Helfrich – 920-731-4101
•Engineered Polymers – Mora MN: Tim Joy – 320-679-6786; [email protected]
•Xavier University – Cincinnati OH: Rob Edwards – 513-745-3855
Referrals
64
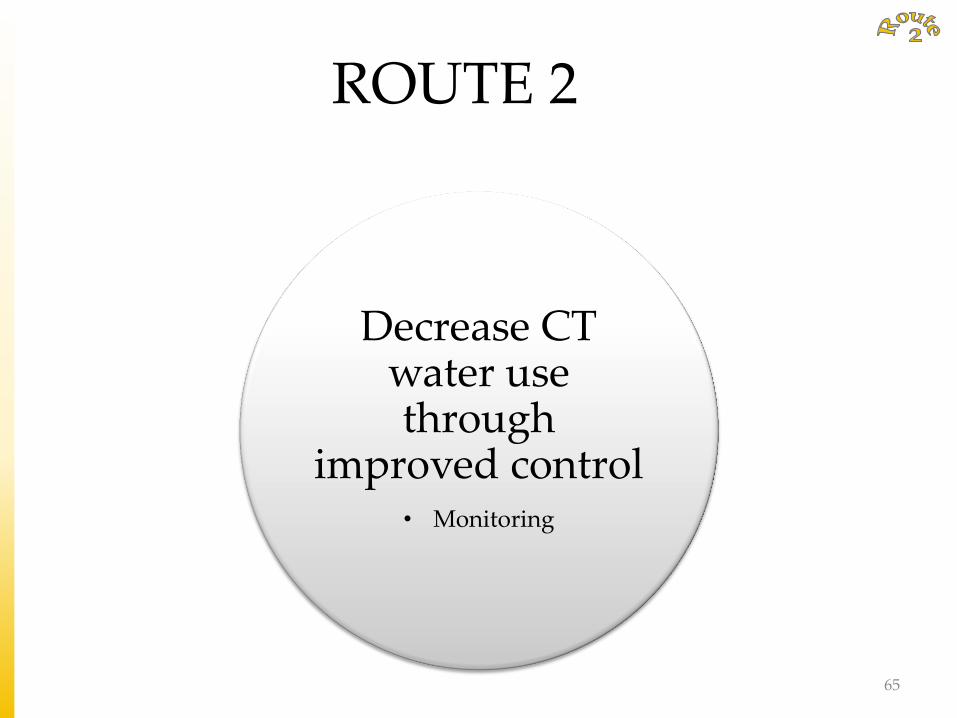
ROUTE 2
Decrease CT water use through
improved control • Monitoring
65

What is Improved Monitoring?
• Quantity of Blowdown is controlled by measurement of objective criteria such as conductivity
• Continuous monitoring is better than periodic monitoring – allows automated control
• Example of one such system – TRASAR 3D from Nalco
66
North Campus Chiller Plant Experience with Trasar 3D
What benefits, if any, due to improved monitoring?
67
0
10
20
30
40
50
60
70
80
90
-
1,000.00
2,000.00
3,000.00
4,000.00
5,000.00
6,000.00
7,000.00
8,000.00
9,000.00
Feb Mar Apr May Jun Jul Aug Sep Oct Nov Dec Jan
Av
erag
e T
emp
erat
ure
(◦F
)
Mak
e-u
p w
ater
(k
gal
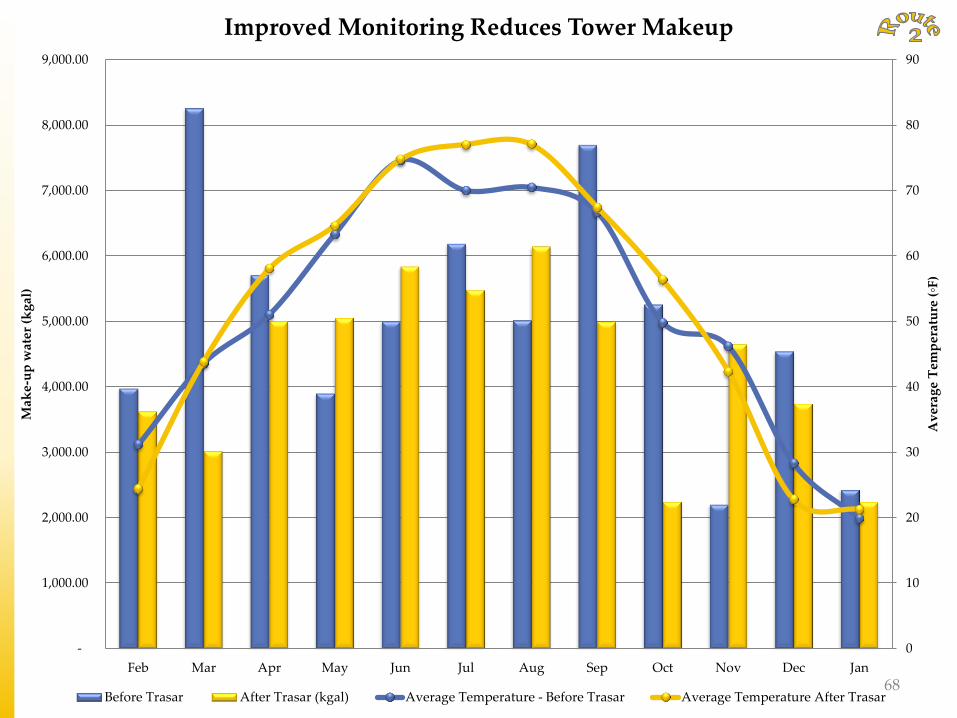
) Improved Monitoring Reduces Tower Makeup
Before Trasar After Trasar (kgal) Average Temperature - Before Trasar Average Temperature After Trasar68
0
10
20
30
40
50
60
70
80
90
-
1,000.00
2,000.00
3,000.00
4,000.00
5,000.00
6,000.00
7,000.00
8,000.00
9,000.00
Feb Mar Apr May Jun Jul Aug Sep Oct Nov Dec Jan
Av
erag
e T
emp
erat
ure
(◦F
)
Mak
e-u
p w
ater
(k
gal
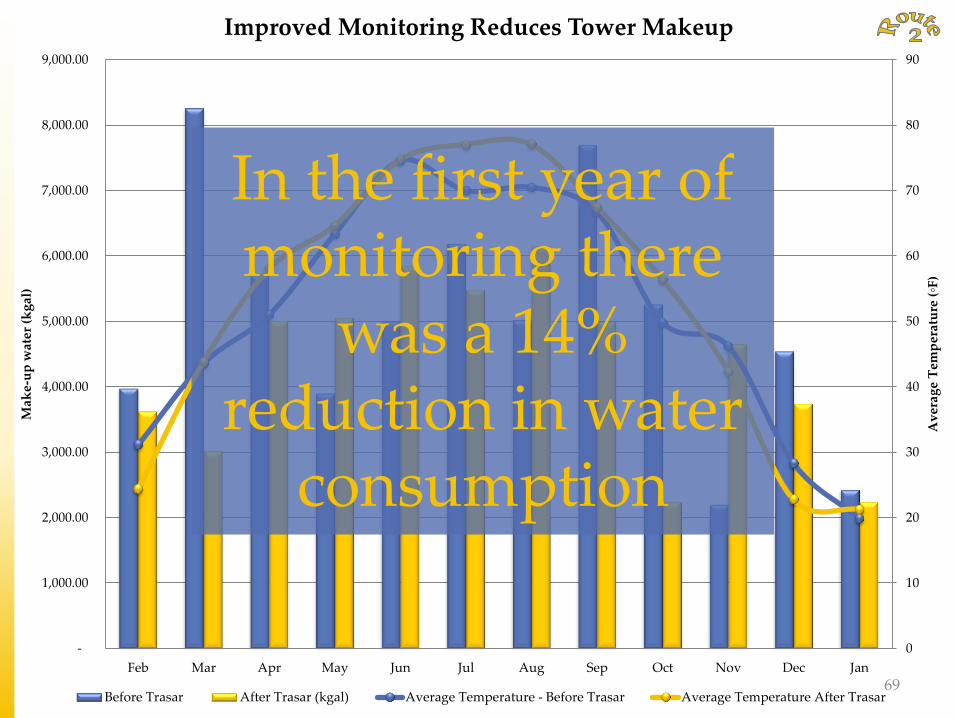
) Improved Monitoring Reduces Tower Makeup
Before Trasar After Trasar (kgal) Average Temperature - Before Trasar Average Temperature After Trasar
In the first year of monitoring there
was a 14% reduction in water
consumption
69
Future of Trasar @ UIUC
The Nalco Representative indicated that units have already been purchased for Oak Street and Vet Med Chiller Plants but are awaiting installation. If additional units are needed for other locations:
– The expected cost of each unit would be $XXXX.XX
– Installations by Nalco have been completed for $2,000-$4,000 per unit.
70
Closer attention to water use numbers, metering, and prompt
remedial action are likely to reduce water lost to
malfunctioning hardware.
• At ISTC, during retrocommissioning, cooling tower blowdown control was found to be malfunctioning
• Similar situations have existed at Vet Med based on what we have heard anecdotally.
71
ROUTE 3
Reduce Cooling Load
72

How Does One Reduce Cooling Load?
• More energy efficient buildings
– Lowers cooling load
– Many pathways to improve efficiency; Outside scope of this project; Only campus efforts with retrocommissioning highlighted
• Efficient energy use at chiller plant
– Many routes; optimization, condenser heat recovery; combined cooling/heating are all potential routes
73
An Example of The Energy-Water Nexus On Campus
• Building Retrocommissioning
– The skilled analysis of a building’s HVAC systems and maintenance program can play a part in reducing the thermal load that a building adds to the Campus Chilled Water System.
74

A Snap Shot of Existing Retro-X Projects
Retrocommissioned Cooling Towers
Chilled Water Saved per year (MMBTU)
Percentage of CW Saved
Chilled Water Cost per 1 MMBTU *
Estimated Savings
National Soybean Research Center
3,316 37% $6.93 $22,979.88
Turner Hall 6,223 33% $6.93 $43,125.39
Animal Sciences Laboratory 3,091 31% $6.93 $21,420.63
Bevier Hall 2,383 21% $6.93 $16,514.19
Psychology Building 3,032 18% $6.93 $21,011.76
Krannert Center for Performing Art
2,698 16% $6.93 $18,697.14
Chemical & Life Sciences Laboratory
13 1% $6.93 $90.09
Total Savings 20,756 $6.93 $143,839.08
* Energy Saving rate-Fuel and consumable materials costs only. To be used to calculate energy savings for energy conservation projects. Found in Terry Ruprecht's report
75
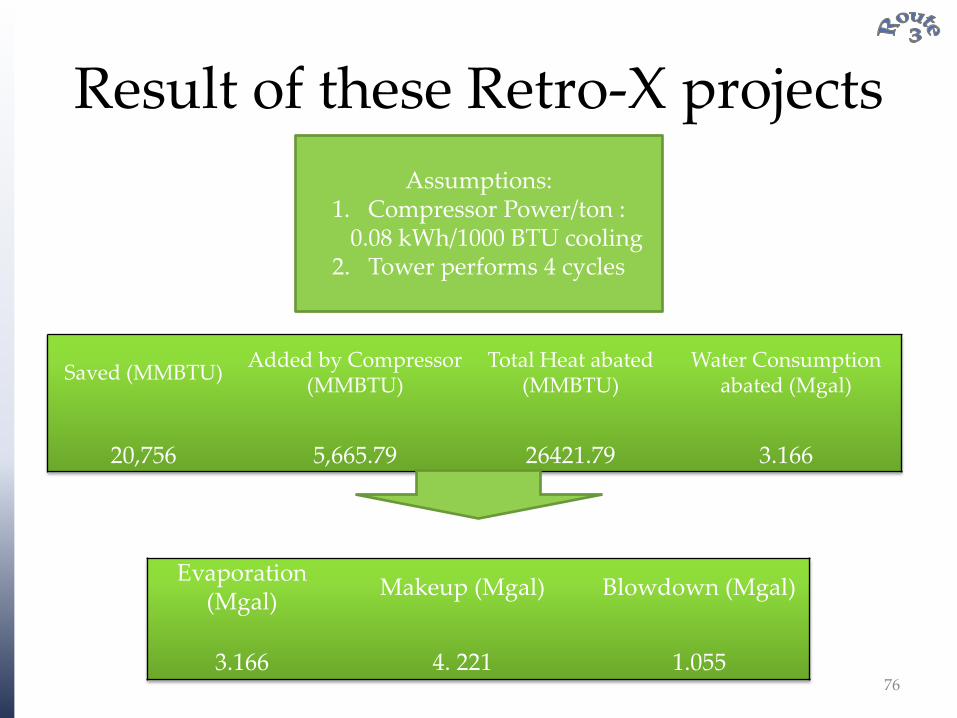
Result of these Retro-X projects
Saved (MMBTU) Added by Compressor
(MMBTU) Total Heat abated
(MMBTU) Water Consumption
abated (Mgal)
20,756
5,665.79
26421.79
3.166
Assumptions: 1. Compressor Power/ton :
0.08 kWh/1000 BTU cooling 2. Tower performs 4 cycles
Evaporation (Mgal)
Makeup (Mgal) Blowdown (Mgal)
3.166
4. 221
1.055
76
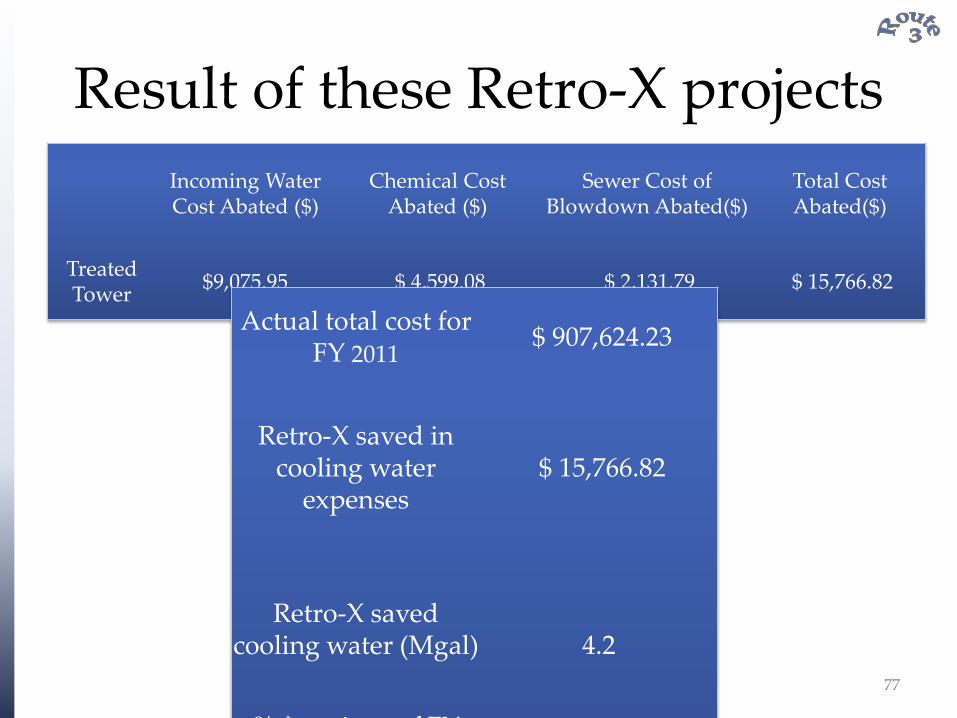
Result of these Retro-X projects
Incoming Water Cost Abated ($)
Chemical Cost Abated ($)
Sewer Cost of Blowdown Abated($)
Total Cost Abated($)
Treated Tower
$9,075.95 $ 4,599.08 $ 2,131.79 $ 15,766.82
Actual total cost for FY 2011
$ 907,624.23
Retro-X saved in cooling water
expenses $ 15,766.82
Retro-X saved cooling water (Mgal)
4.2
% $ savings of FY 2011
1.7%
% kgal CT FY 2011 savings (ex Abbott)
1.5%
77

-
500.00
1,000.00
1,500.00
2,000.00
2,500.00
3,000.00
3,500.00
4,000.00
4,500.00
Mak
eup
Wat
er (
kg
al)
FY 2011 Tower Water Consumption
Reducing the water demand at the Chiller Plants by 4.2 Mgal is
equivalent to completely removing the cooling demand of any one or more of
these buildings
78

Retro-X
Current Retrocommission projects have resulted in savings of ~21 Mgal
water for cooling in the first year after Retrocommissioning
List of Retrocommissioned Buildings
Saved (MMBTU) Added by Compressor (MMBTU) Total Heat abated (MMBTU)
106,666 29,117
135,782 Evaporated Water Use abated (Mgal) Makeup water abated (Mgal)
16.27
21.69
79

Retro-X
The cost savings from water consumption abatement provides an additional 13% savings to the current
calculation used to evaluate retrocommissioning projects.
This demonstrates a great potential
for cost and water savings by the University through the continuation of the Retrocommissioning efforts.
The additional cost and fuel savings from reductions in mechanical load
have not been included in our calculations and would represent
further savings currently unaccounted for.
Savings Rate ($/MMBTU)
Cost Savings ($)
From Retro-X Energy Rate $6.9300 $739,195.38
Savings from Cooling water $0.7596 $103,144.27
Total Savings by Retrofit $7.69 $820,221.77
% Added Savings Represented by Cooling
Water 11% 13%
80

ROUTE 4
Cascade water from another process for
CT make-up •Abbott RO reject
•Oak Street Seepage •Reprocessed blowdown
81

Oak Street Seepage
• Seepage of the order of 50 gpm
• Oak Street Chiller Plant make-up ~200 gpm
• Substantial reductions in cooling tower water usage possible if seepage can be used for make-up
Major Issue
Seepage water quality not suitable without recourse to treatment
82
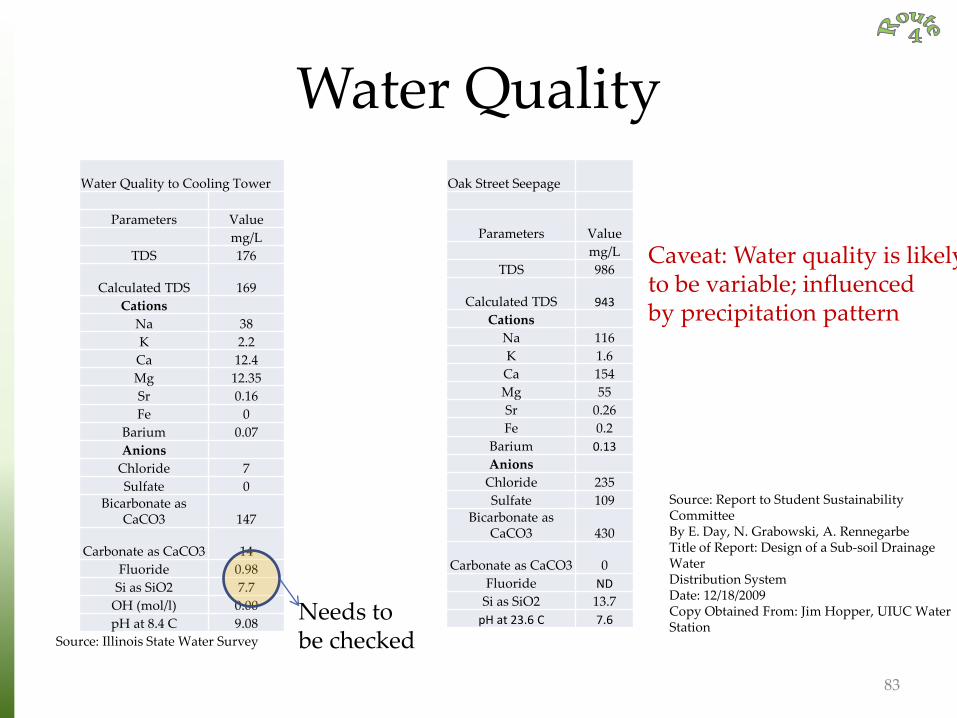
Water Quality
Source: Illinois State Water Survey
Water Quality to Cooling Tower
Parameters Value
mg/L
TDS 176
Calculated TDS 169
Cations
Na 38
K 2.2
Ca 12.4
Mg 12.35
Sr 0.16
Fe 0
Barium 0.07
Anions
Chloride 7
Sulfate 0
Bicarbonate as CaCO3 147
Carbonate as CaCO3 14
Fluoride 0.98
Si as SiO2 7.7
OH (mol/l) 0.00
pH at 8.4 C 9.08 Needs to be checked
Oak Street Seepage
Parameters Value
mg/L
TDS 986
Calculated TDS 943
Cations
Na 116
K 1.6
Ca 154
Mg 55
Sr 0.26
Fe 0.2
Barium 0.13
Anions
Chloride 235
Sulfate 109
Bicarbonate as CaCO3 430
Carbonate as CaCO3 0
Fluoride ND
Si as SiO2 13.7
pH at 23.6 C 7.6
Source: Report to Student Sustainability Committee By E. Day, N. Grabowski, A. Rennegarbe Title of Report: Design of a Sub-soil Drainage Water Distribution System Date: 12/18/2009 Copy Obtained From: Jim Hopper, UIUC Water Station
Caveat: Water quality is likely to be variable; influenced by precipitation pattern
83
Oak Street Seepage - Prior Study
• Report: Design of a Sub-soil Drainage Water Distribution System
– By E. Day, N. Grabowski, A. Rennegarbe – Report to Student Sustainability Committee
• Suggests that cost of treating seepage water is excessive
– Evaluated RO as treatment option; major costs identified in descending order • Disposal costs of RO reject • pH adjustment of RO permeate • Energy for RO operation • Anti-scalant dosage costs
84

Prior Study…Observations
• The improved quality of tower water is not reflected in the COC
• Basis for chemical costs are unclear but likely incorrect (Appendix B, Fig 2 suggests that water input is 100% raw seepage with sulfuric acid to control alkalinity rather than RO water)
85
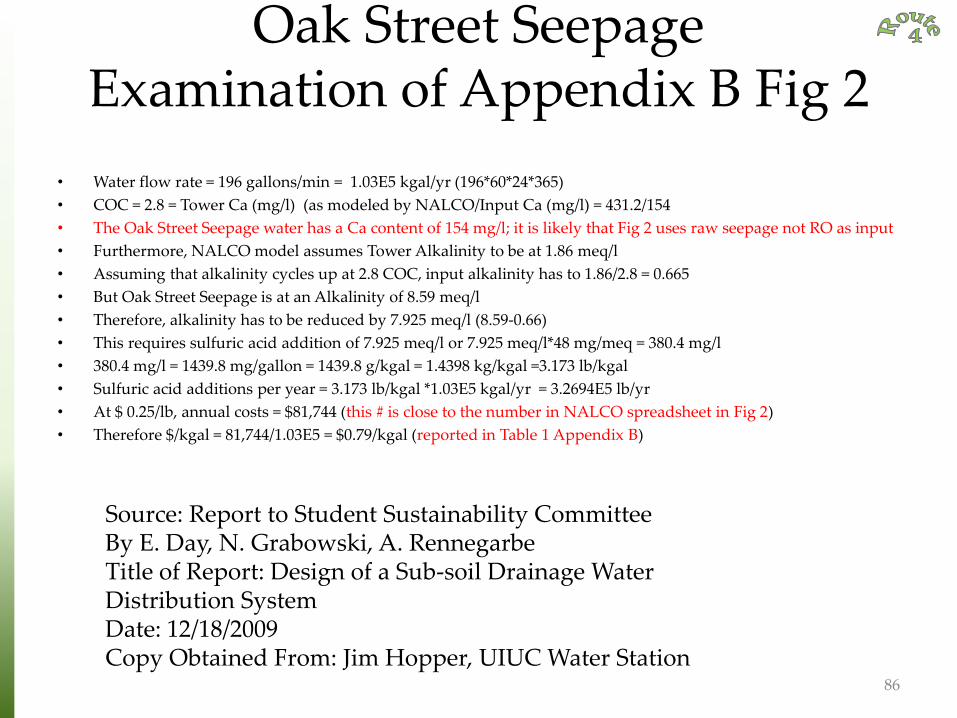
Oak Street Seepage Examination of Appendix B Fig 2
• Water flow rate = 196 gallons/min = 1.03E5 kgal/yr (196*60*24*365)
• COC = 2.8 = Tower Ca (mg/l) (as modeled by NALCO/Input Ca (mg/l) = 431.2/154
• The Oak Street Seepage water has a Ca content of 154 mg/l; it is likely that Fig 2 uses raw seepage not RO as input
• Furthermore, NALCO model assumes Tower Alkalinity to be at 1.86 meq/l
• Assuming that alkalinity cycles up at 2.8 COC, input alkalinity has to 1.86/2.8 = 0.665
• But Oak Street Seepage is at an Alkalinity of 8.59 meq/l
• Therefore, alkalinity has to be reduced by 7.925 meq/l (8.59-0.66)
• This requires sulfuric acid addition of 7.925 meq/l or 7.925 meq/l*48 mg/meq = 380.4 mg/l
• 380.4 mg/l = 1439.8 mg/gallon = 1439.8 g/kgal = 1.4398 kg/kgal =3.173 lb/kgal
• Sulfuric acid additions per year = 3.173 lb/kgal *1.03E5 kgal/yr = 3.2694E5 lb/yr
• At $ 0.25/lb, annual costs = $81,744 (this # is close to the number in NALCO spreadsheet in Fig 2)
• Therefore $/kgal = 81,744/1.03E5 = $0.79/kgal (reported in Table 1 Appendix B)
Source: Report to Student Sustainability Committee By E. Day, N. Grabowski, A. Rennegarbe Title of Report: Design of a Sub-soil Drainage Water Distribution System Date: 12/18/2009 Copy Obtained From: Jim Hopper, UIUC Water Station
86

Use of Alternative Water Sources Example
Permeate
City Water
< 200 gpm
~ 17% reduction in make-up
possible
87
Sand Filter
Nanofiltration Or
Reverse Osmosis
Oak St Seepage
Reject to Sewer
50 gpm
16.1 gpm
3 gpm
Reject to Sewer
30.9 gpm Cooling Tower
< 169.1 gpm
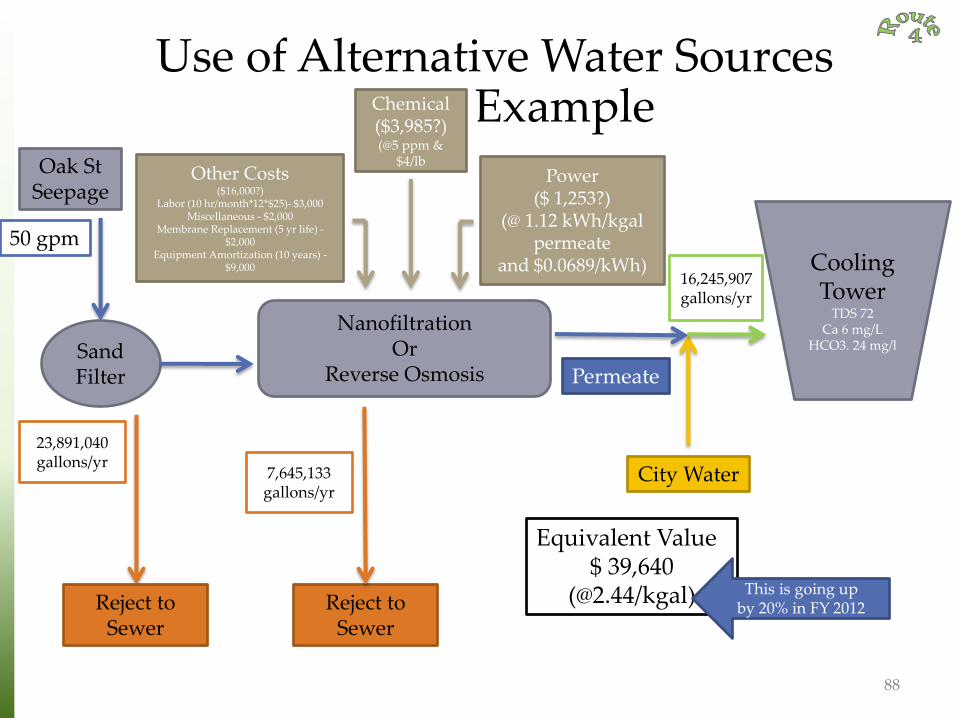
Use of Alternative Water Sources Example
Permeate
City Water
88
Sand Filter
Nanofiltration Or
Reverse Osmosis
Oak St Seepage
Reject to Sewer
50 gpm
Reject to Sewer
Cooling Tower
TDS 72 Ca 6 mg/L
HCO3. 24 mg/l
Equivalent Value $ 39,640
(@2.44/kgal)
Chemical ($3,985?) (@5 ppm &
$4/lb Other Costs
($16,000?) Labor (10 hr/month*12*$25)- $3,000
Miscellaneous - $2,000 Membrane Replacement (5 yr life) -
$2,000 Equipment Amortization (10 years) -
$9,000
Power ($ 1,253?)
(@ 1.12 kWh/kgal permeate
and $0.0689/kWh) 16,245,907 gallons/yr
7,645,133 gallons/yr
23,891,040 gallons/yr
This is going up by 20% in FY 2012
Oak Street Seepage - Summary
• Suggest taking a second look at this opportunity
• Positive cash flow is possible
• Uncertainties with water quality data need to be resolved (paper study/analytical data collection & pilot encouraged)
• If feasible, explore lease/contract option rather than ownership
89
ROUTE 5
Use CT blowdown to displace water use in another
application
90
Cooling Tower Blowdown as RO Input?
• Given the low COC at Abbott Tower and the large use, does it make sense to use the CT blow down as RO input?
• In other words, what benefits might accrue if Tower/RO is optimized as a system?
91
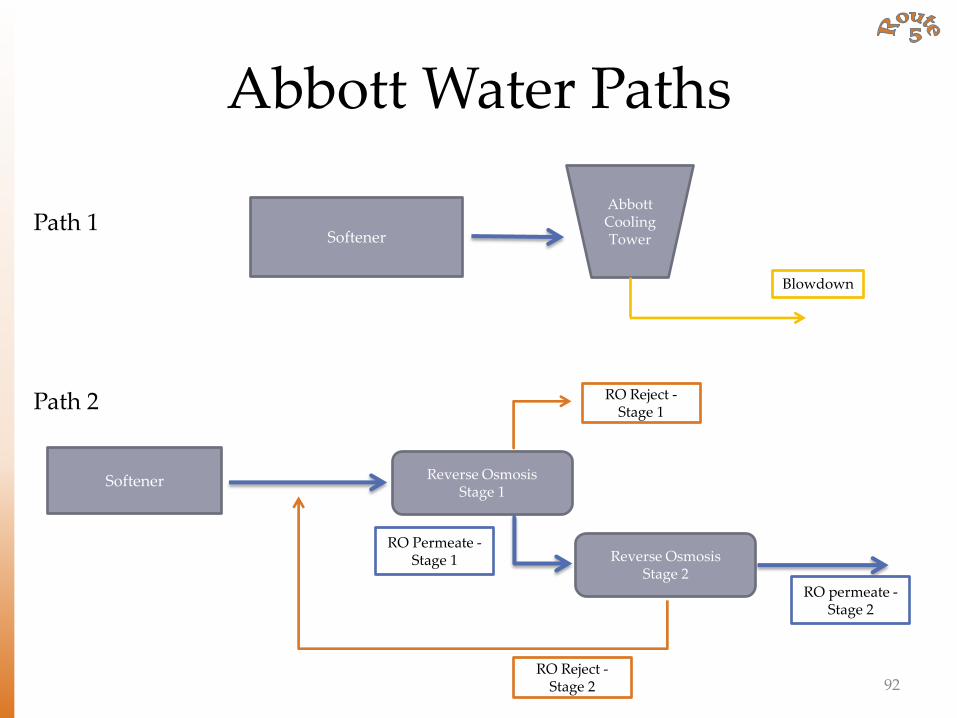
Abbott Water Paths
Softener Reverse Osmosis Stage 1
RO Reject - Stage 1
Reverse Osmosis Stage 2
RO Permeate - Stage 1
RO permeate - Stage 2
RO Reject -Stage 2
Path 1
Path 2
Abbott Cooling Tower Softener
Blowdown
92
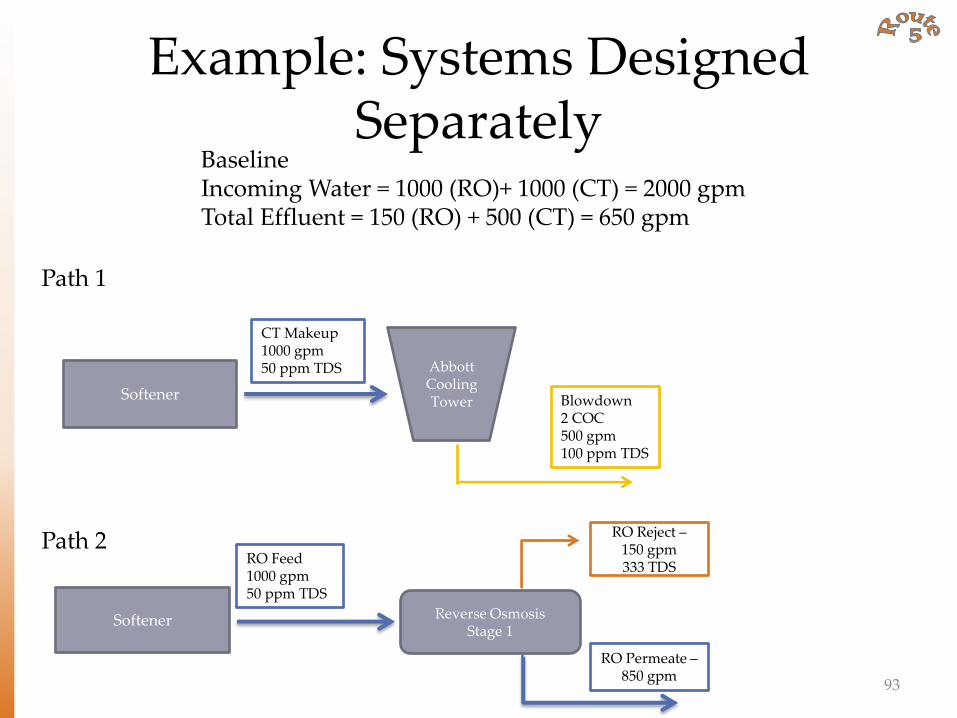
Example: Systems Designed Separately
Path 2
Softener Reverse Osmosis Stage 1
RO Reject – 150 gpm 333 TDS
RO Permeate – 850 gpm
RO Feed 1000 gpm 50 ppm TDS
Path 1
Abbott Cooling Tower Softener Blowdown
2 COC 500 gpm 100 ppm TDS
CT Makeup 1000 gpm 50 ppm TDS
Baseline Incoming Water = 1000 (RO)+ 1000 (CT) = 2000 gpm Total Effluent = 150 (RO) + 500 (CT) = 650 gpm
93

Example: Systems Designed as Parts of a Whole
Softener Reverse Osmosis Stage 1
RO Reject 775 gpm
TDS
RO Permeate 225 gpm 333 TDS
Abbott Cooling Tower
Softener
Path 1
Path 2
Blowdown 500 gpm
100 ppm TDS
Feed Water from Softener
500 gpm 50 ppm TDS
Blend Ratio is Variable
Feed to RO 1000 gpm
75 ppm TDS
Total Incoming Water = 500 (RO)+1000 (CT) = 1500 gpm Total Effluent Water = 225 (RO) + 0 (CT) = 225 gpm Baseline Incoming Water = 1000 (RO)+ 1000 (CT) = 2000 gpm Total Effluent = 150 (RO) + 500 (CT) = 650 gpm Reductions Incoming = 25%; Effluent = 65%
Design Issues Maintain Permeate Production Operational Changes to RO/CT Compatibility of Chemicals & so on
94
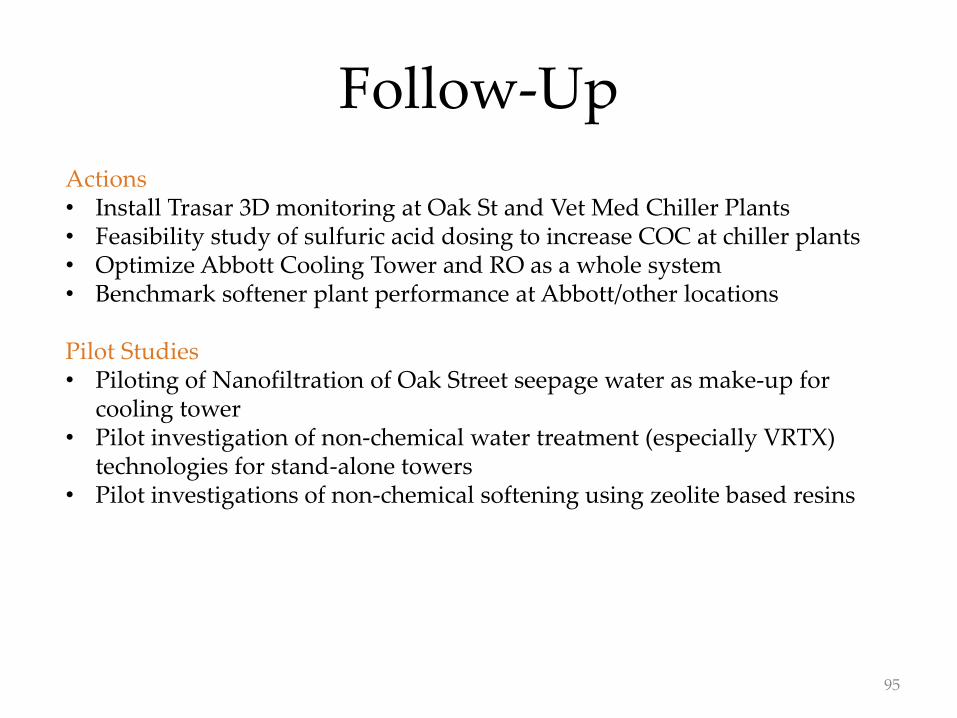
Actions • Install Trasar 3D monitoring at Oak St and Vet Med Chiller Plants • Feasibility study of sulfuric acid dosing to increase COC at chiller plants • Optimize Abbott Cooling Tower and RO as a whole system • Benchmark softener plant performance at Abbott/other locations Pilot Studies • Piloting of Nanofiltration of Oak Street seepage water as make-up for
cooling tower • Pilot investigation of non-chemical water treatment (especially VRTX)
technologies for stand-alone towers • Pilot investigations of non-chemical softening using zeolite based resins
Follow-Up
95
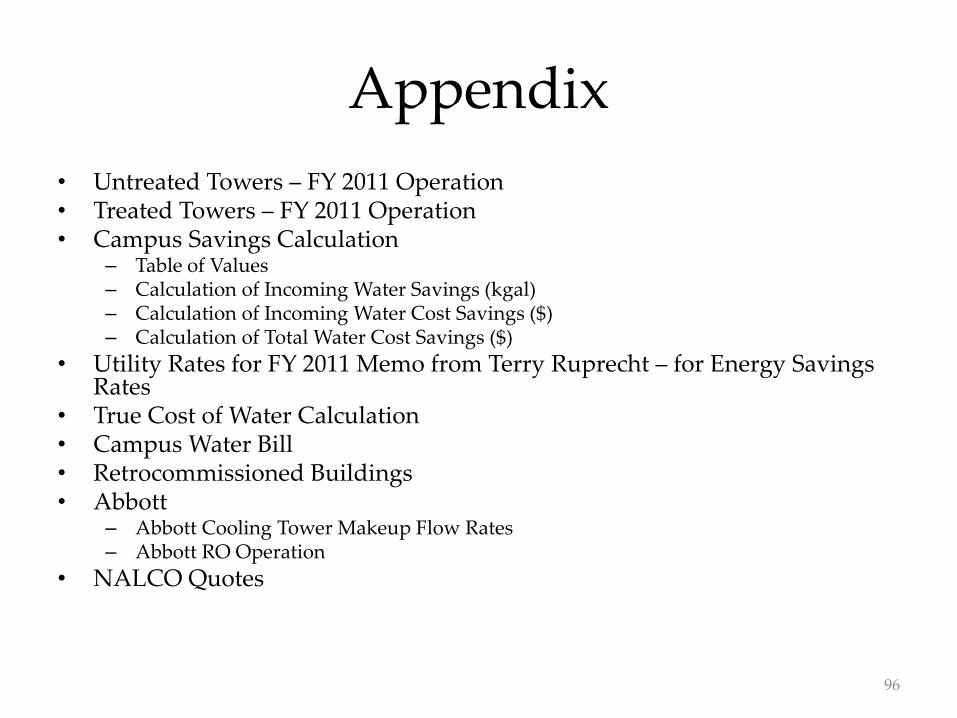
Appendix
• Untreated Towers – FY 2011 Operation • Treated Towers – FY 2011 Operation • Campus Savings Calculation
– Table of Values – Calculation of Incoming Water Savings (kgal) – Calculation of Incoming Water Cost Savings ($) – Calculation of Total Water Cost Savings ($)
• Utility Rates for FY 2011 Memo from Terry Ruprecht – for Energy Savings Rates
• True Cost of Water Calculation • Campus Water Bill • Retrocommissioned Buildings • Abbott
– Abbott Cooling Tower Makeup Flow Rates – Abbott RO Operation
• NALCO Quotes
96
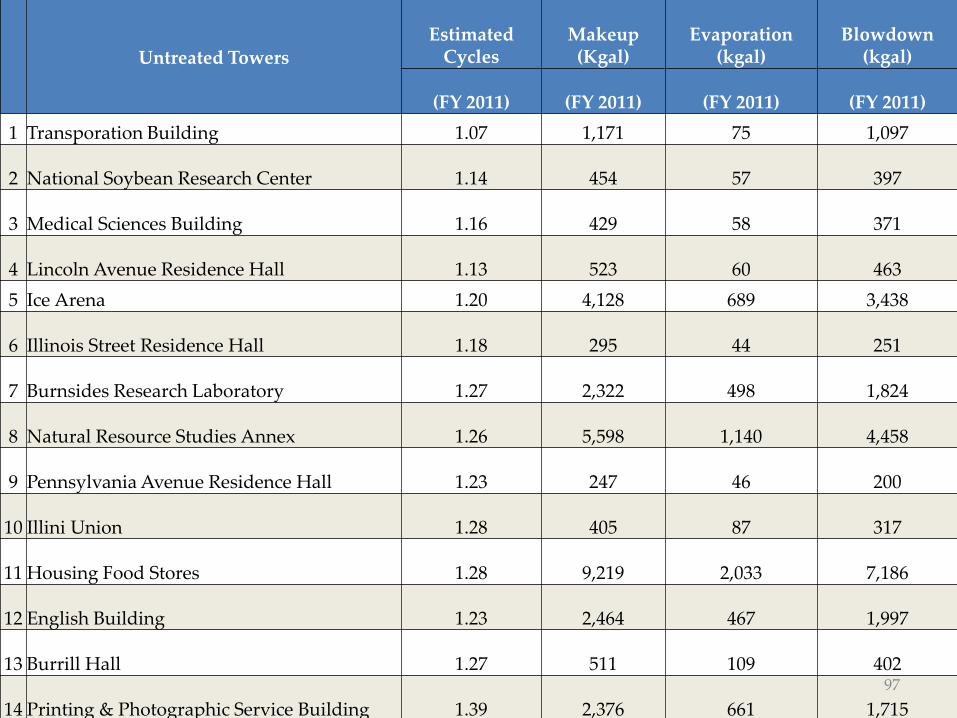
Untreated Towers Estimated
Cycles Makeup (Kgal)
Evaporation (kgal)
Blowdown (kgal)
(FY 2011) (FY 2011) (FY 2011) (FY 2011)
1 Transporation Building 1.07 1,171 75 1,097
2 National Soybean Research Center 1.14 454 57 397
3 Medical Sciences Building 1.16 429 58 371
4 Lincoln Avenue Residence Hall 1.13 523 60 463
5 Ice Arena 1.20 4,128 689 3,438
6 Illinois Street Residence Hall 1.18 295 44 251
7 Burnsides Research Laboratory 1.27 2,322 498 1,824
8 Natural Resource Studies Annex 1.26 5,598 1,140 4,458
9 Pennsylvania Avenue Residence Hall 1.23 247 46 200
10 Illini Union 1.28 405 87 317
11 Housing Food Stores 1.28 9,219 2,033 7,186
12 English Building 1.23 2,464 467 1,997
13 Burrill Hall 1.27 511 109 402
14 Printing & Photographic Service Building 1.39 2,376 661 1,715
15 Veterinary Medicine Chiller Plant (Meter ID 3) 1.36 4,125 1,085 3,039
16 Veterinary Medicine Chiller Plant (Meter ID 2) 1.41 4,182 1,210 2,972
17 Veterinary Medicine Chiller Plant (Meter ID 1) 1.34 27,503 6,922 20,581
18 Law Building 1.43 5,635 1,700 3,935
19 Illinois Sustainable Technology Center 1.58 3,600 1,316 2,284
Total 1.32 75,186 18,259 56,927
97

Treated Towers Estimated Cycles Makeup
(Kgal) Evaporation
(kgal) Blowdown
(kgal)
(FY 2011) (FY 2011) (FY 2011) (FY 2011)
Construction Engineering Research Lab - - - -
State Regional Office Building - - - -
1 Plant Sciences Laboratory 1.57
1,065
385
679
2 Water Survey Research Center 1.79
2,798
1,231
1,567
3 Abbott Power Plant 1.93
48,934
23,619
25,314
4 Animal Science Air Conditioning Center 2.27
16,809
9,388
7,421
5 Library Air Conditioning Center (Meter ID 5) 2.18
19,838
10,741
9,097
6 Temple Hoyne Buell Hall 2.89
1,208
789
419
7 Library Air Conditioning Center (Meter ID 4) 3.12
4,822
3,276
1,546
8 Library Air Conditioning Center (Meter ID 7) 3.01
5,793
3,872
1,921
9 Chemical & Life Sciences Lab 3.24
696
481
215
10 North Campus Chiller Plant (North Meter) 3.18
42,568
29,202
13,365
11 North Campus Chiller Plant (South Meter) 3.13
10,939
7,445
3,494
12 Oak Street Chiller Plant 3.54
92,015
66,023
25,992
13 Grainger Engineering Library 3.52
4,948
3,542
1,406
Total 2.73
252,431
159,996
92,435
98
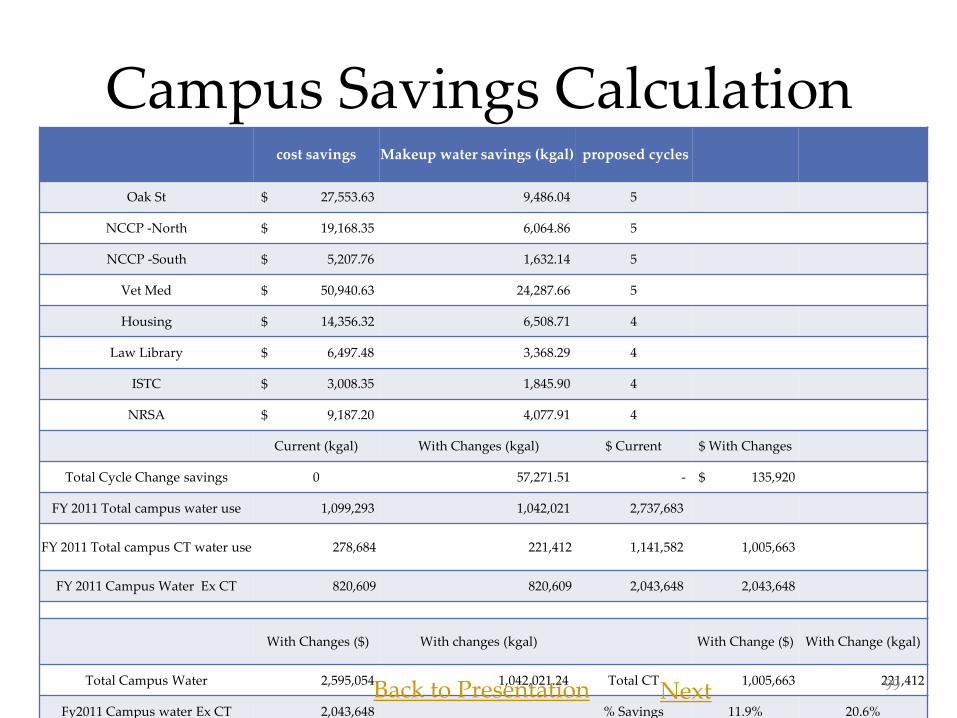
Campus Savings Calculation cost savings Makeup water savings (kgal) proposed cycles
Oak St $ 27,553.63 9,486.04 5
NCCP -North $ 19,168.35 6,064.86 5
NCCP -South $ 5,207.76 1,632.14 5
Vet Med $ 50,940.63 24,287.66 5
Housing $ 14,356.32 6,508.71 4
Law Library $ 6,497.48 3,368.29 4
ISTC $ 3,008.35 1,845.90 4
NRSA $ 9,187.20 4,077.91 4
Current (kgal) With Changes (kgal) $ Current $ With Changes
Total Cycle Change savings 0 57,271.51 - $ 135,920
FY 2011 Total campus water use 1,099,293 1,042,021 2,737,683
FY 2011 Total campus CT water use 278,684 221,412 1,141,582 1,005,663
FY 2011 Campus Water Ex CT 820,609 820,609 2,043,648 2,043,648
With Changes ($) With changes (kgal) With Change ($) With Change (kgal)
Total Campus Water 2,595,054 1,042,021.24 Total CT 1,005,663 221,412
Fy2011 Campus water Ex CT 2,043,648 % Savings 11.9% 20.6%
FY2011 Campus water CT Only 551,406
Savings in Incoming Water Bill 5.2% 5.2% Total Campus
Back to Presentation 99 Next

Campus Savings Calculation Incoming Water (kgal)
5.2% Savings in Total Campus
Incoming Water (kgal)
20.6% Savings in Campus Cooling
Tower (Ex Abbott) Incoming Water
(kgal)
Current FY 2011 Total Campus
Water Use 1,099,293 kgal
Cooling Towers Excluding Abbott
278,684 kgal
Abbott Cooling Tower
48,934 kgal
Campus Excluding Cooling Towers
771,675 kgal
FY 2011 with Changes
Total Campus Water Use
1,042,022 kgal
Cooling Towers Excluding Abbott
221,412 kgal
Abbott Cooling Tower
48,934 kgal
Campus Excluding Cooling Towers
771,675 kgal 100 Back to Presentation Next Previous
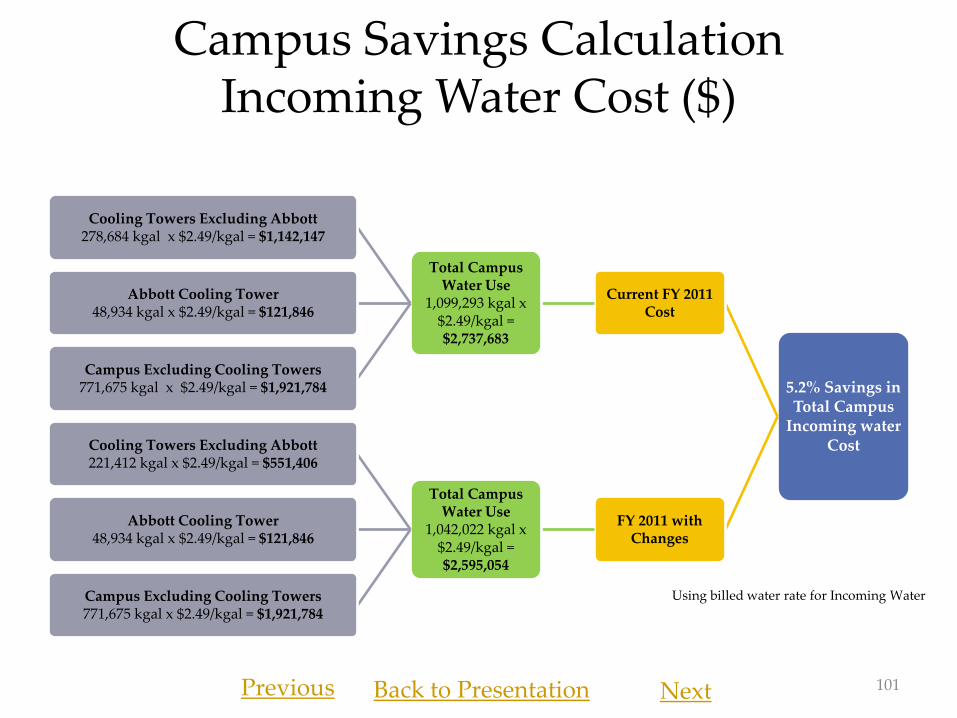
Campus Savings Calculation Incoming Water Cost ($)
5.2% Savings in Total Campus
Incoming water Cost
Current FY 2011 Cost
Total Campus Water Use
1,099,293 kgal x $2.49/kgal = $2,737,683
Cooling Towers Excluding Abbott 278,684 kgal x $2.49/kgal = $1,142,147
Abbott Cooling Tower 48,934 kgal x $2.49/kgal = $121,846
Campus Excluding Cooling Towers 771,675 kgal x $2.49/kgal = $1,921,784
FY 2011 with Changes
Total Campus Water Use
1,042,022 kgal x $2.49/kgal = $2,595,054
Cooling Towers Excluding Abbott 221,412 kgal x $2.49/kgal = $551,406
Abbott Cooling Tower 48,934 kgal x $2.49/kgal = $121,846
Campus Excluding Cooling Towers 771,675 kgal x $2.49/kgal = $1,921,784
Using billed water rate for Incoming Water
101 Back to Presentation Next Previous

Campus Savings Calculation Total Water Cost ($)
14.2% Savings in Campus
Cooling Tower (Ex Abbott) Water Cost
Current FY 2011 Settings
Total Campus Water Cost $2,801,307
Cooling Towers Excluding Abbott Incoming water : 278,684 kgal x $2.15/kgal = $599,169
Chemical treatment: 203, 497kgal x $1.08/kgal = $219,533 75,186 x $0.00/kgal = $0.00
Sewer : 278,684 kgal x 0.25 x $2.02/kgal = $140,735
TOTAL COST = $959,437
Abbott Cooling Tower Incoming water : 48,934 kgal x $2.15/kgal = $105,208
Chemical treatment: 48,934 kgal x $1.08/kgal = $52,849
Sewer : 48,934 kgal x 0.25 x $2.02/kgal = $ 24,712
TOTAL COST = $182,769
Campus Excluding Cooling Towers 771,675 kgal x $2.15/kgal = $1,659,101
FY 2011 with Changes
Oak St, NCCP (N&S), Vet Med to 5 COC
Housing, Law, ISTC, NRSA to 4 COC
Total Campus Water Cost
$2,666,280
Cooling Towers Excluding Abbott Incoming water : 221,413 kgal x $2.15/kgal = $476,036
Chemical treatment: 5 cycles : 139,861kgal x $1.18/kgal = $165,035 + 4 cycles : 66,227kgal x $1.08/kgal = $71,525
Untreated : 15,324 kgal x $0.00 = $0.00
Sewer : 221,413 kgal x 0.25 x $2.02/kgal = $111,813
TOTAL COST = $824,409
Abbott Cooling Tower - Unchanged Incoming water : 48,934 kgal x $2.15/kgal = $105,208
Chemical treatment: 48,934 kgal x $1.08/kgal = $52,849
Sewer : 12,234 kgal x $2.02/kgal = $ 24,712
TOTAL COST = $182,768
Campus Excluding Cooling Towers - Unchanged 771,675 kgal x $2.15/kgal = $1,659,101
Using Energy Savings Rates for Sewer and Incoming Water
102
Back to Presentation Previous
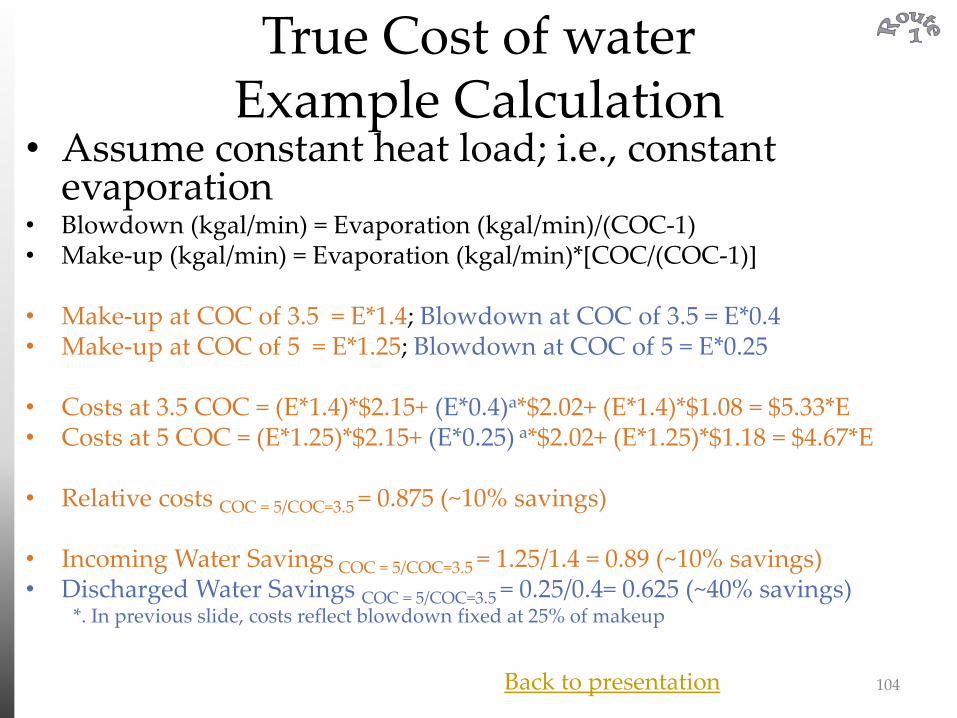
True Cost of water Example Calculation
• Assume constant heat load; i.e., constant evaporation
• Blowdown (kgal/min) = Evaporation (kgal/min)/(COC-1) • Make-up (kgal/min) = Evaporation (kgal/min)*[COC/(COC-1)]
• Make-up at COC of 3.5 = E*1.4; Blowdown at COC of 3.5 = E*0.4 • Make-up at COC of 5 = E*1.25; Blowdown at COC of 5 = E*0.25 • Costs at 3.5 COC = (E*1.4)*$2.15+ (E*0.4)a*$2.02+ (E*1.4)*$1.08 = $5.33*E • Costs at 5 COC = (E*1.25)*$2.15+ (E*0.25) a*$2.02+ (E*1.25)*$1.18 = $4.67*E
• Relative costs COC = 5/COC=3.5 = 0.875 (~10% savings) • Incoming Water Savings COC = 5/COC=3.5 = 1.25/1.4 = 0.89 (~10% savings) • Discharged Water Savings COC = 5/COC=3.5 = 0.25/0.4= 0.625 (~40% savings)
*. In previous slide, costs reflect blowdown fixed at 25% of makeup
104 Back to presentation

Retro-X: Buildings Completed
105
Building After (MMBTU) Before (MMBTU)
ACES Library Info. & Alumni Center 5,224 12,742
Animal Sciences Laboratory 6,852 9,943
Bevier Hall 8,921 11,304
Chemical & Life Sciences Laboratory 2,516 2,529
Coordinated Science Laboratory 12,886 20,704
Foellinger Auditorium 1,049 1,647
Foreign Languages Building 2,785 2,368
Henry Administration Building 3,390 5,170
Illini Union Bookstore 0 0
Krannert Center for Performing Arts 14,387 17,085
Loomis Laboratory of Physics 14,434 19,512
Madigan Laboratory Edward R 19,221 28,025
Mechanical Engineering Laboratory 14,132 22,944
Music Building 7,223 12,066
Nat Center for Supercomp Appl 8,265 16,270
National Soybean Research Center 5,710 9,026
Newmark Civil Engineering Building 11,028 21,964
Physical Plant Service Building 0 0
Psychology Laboratory 13,445 16,477
Siebel Center for Computer Science 18,832 32,241
Turner Hall 12,539 18,762
Undergraduate Library 7,282 6,961
Wohlers Hall 5,165 14,212
Grand Total 195,286 301,952
Back to presentation
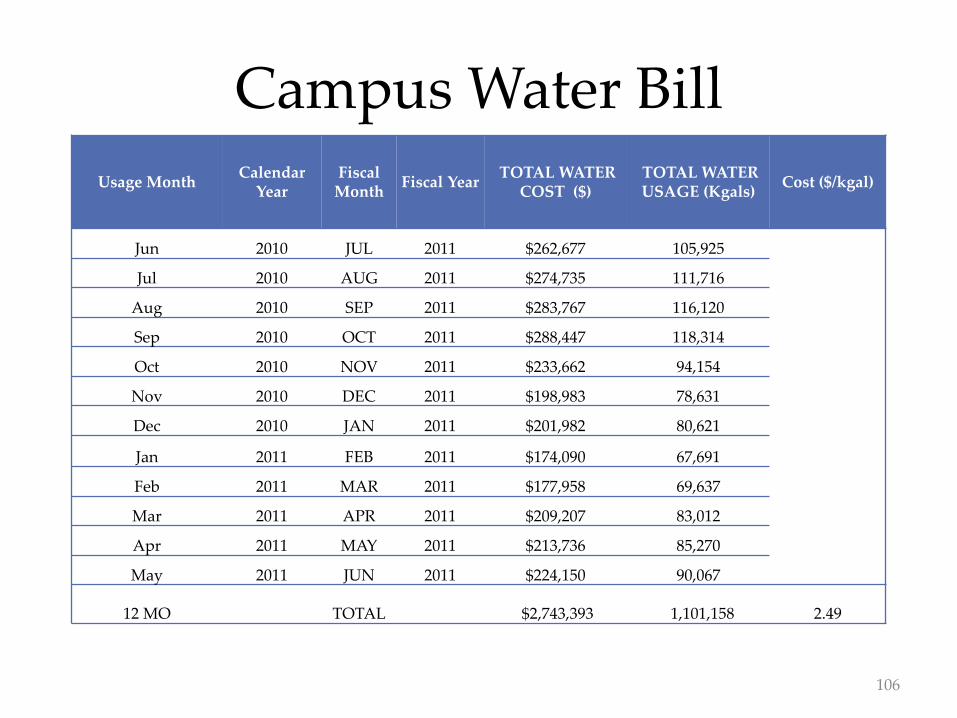
Campus Water Bill
Usage Month Calendar
Year Fiscal
Month Fiscal Year
TOTAL WATER COST ($)
TOTAL WATER USAGE (Kgals)
Cost ($/kgal)
Jun 2010 JUL 2011 $262,677 105,925
Jul 2010 AUG 2011 $274,735 111,716
Aug 2010 SEP 2011 $283,767 116,120
Sep 2010 OCT 2011 $288,447 118,314
Oct 2010 NOV 2011 $233,662 94,154
Nov 2010 DEC 2011 $198,983 78,631
Dec 2010 JAN 2011 $201,982 80,621
Jan 2011 FEB 2011 $174,090 67,691
Feb 2011 MAR 2011 $177,958 69,637
Mar 2011 APR 2011 $209,207 83,012
Apr 2011 MAY 2011 $213,736 85,270
May 2011 JUN 2011 $224,150 90,067
12 MO TOTAL $2,743,393 1,101,158 2.49
106
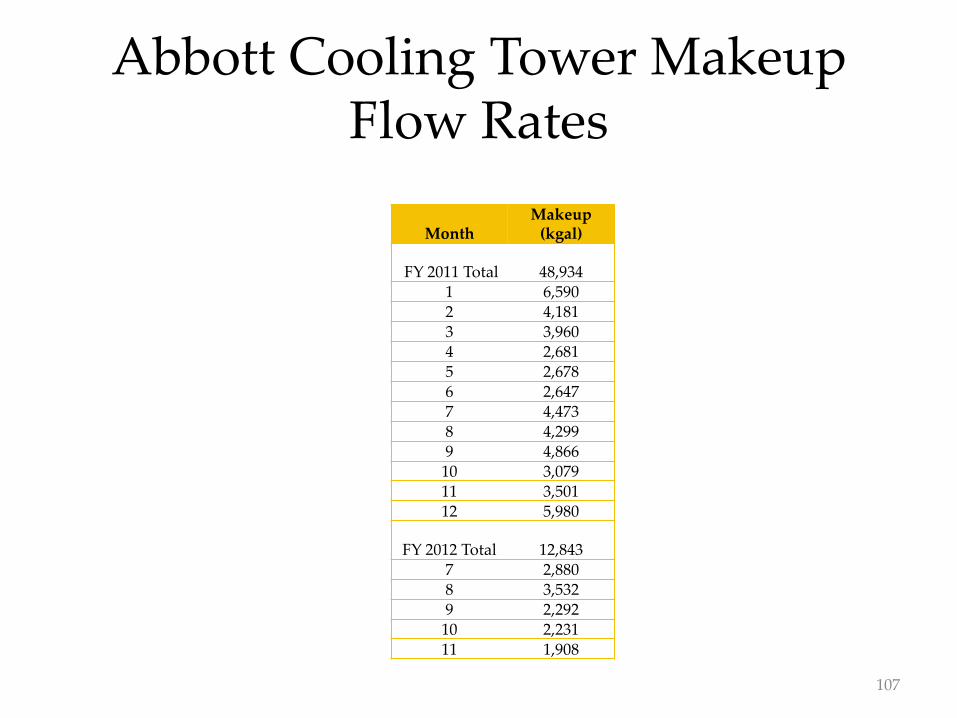
Abbott Cooling Tower Makeup Flow Rates
Month Makeup
(kgal)
FY 2011 Total 48,934 1 6,590 2 4,181 3 3,960 4 2,681 5 2,678 6 2,647 7 4,473 8 4,299 9 4,866 10 3,079 11 3,501 12 5,980
FY 2012 Total 12,843 7 2,880 8 3,532 9 2,292 10 2,231 11 1,908
107
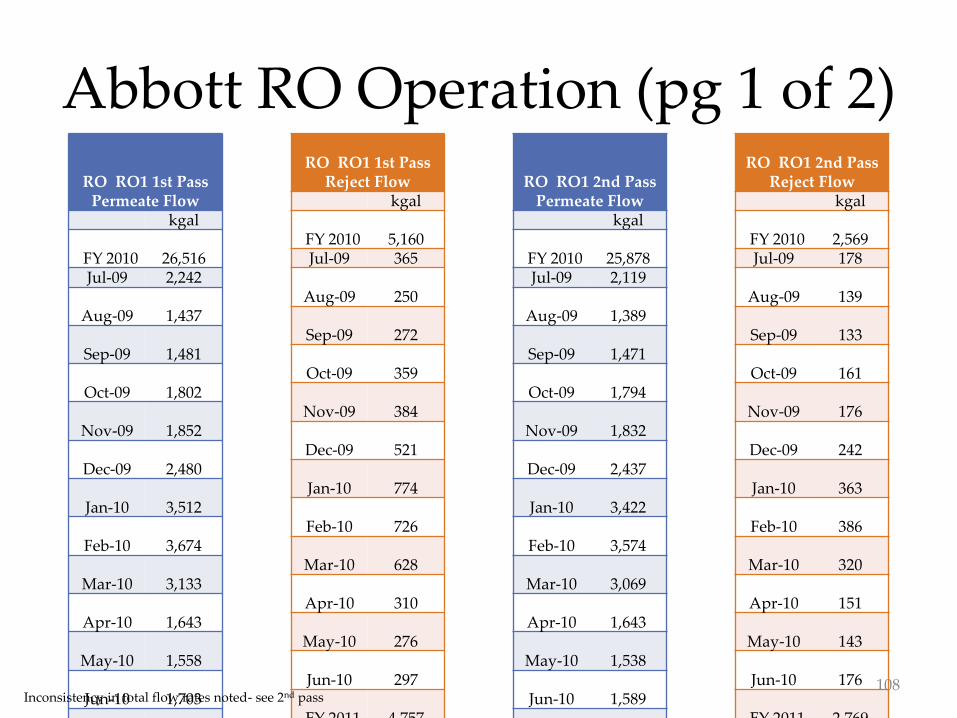
Abbott RO Operation (pg 1 of 2)
RO RO1 1st Pass Permeate Flow
kgal
FY 2010 26,516 Jul-09 2,242
Aug-09 1,437
Sep-09 1,481
Oct-09 1,802
Nov-09 1,852
Dec-09 2,480
Jan-10 3,512
Feb-10 3,674
Mar-10 3,133
Apr-10 1,643
May-10 1,558
Jun-10 1,703
FY 2011 25,007 Jul-10 1,869
Aug-10 1,678
Sep-10 1,913
Oct-10 1,846
Nov-10 2,251
Dec-10 3,484
Jan-11 3,288
Feb-11 3,052
Mar-11 2,524
Apr-11 2,042
May-11 1,060
RO RO1 1st Pass Reject Flow
kgal
FY 2010 5,160 Jul-09 365
Aug-09 250
Sep-09 272
Oct-09 359
Nov-09 384
Dec-09 521
Jan-10 774
Feb-10 726
Mar-10 628
Apr-10 310
May-10 276
Jun-10 297
FY 2011 4,757 Jul-10 334
Aug-10 299
Sep-10 348
Oct-10 337
Nov-10 416
Dec-10 649
Jan-11 618
Feb-11 577
Mar-11 505
Apr-11 443
May-11 229
RO RO1 2nd Pass Permeate Flow
kgal
FY 2010 25,878 Jul-09 2,119
Aug-09 1,389
Sep-09 1,471
Oct-09 1,794
Nov-09 1,832
Dec-09 2,437
Jan-10 3,422
Feb-10 3,574
Mar-10 3,069
Apr-10 1,643
May-10 1,538
Jun-10 1,589
FY 2011 21,496 Jul-10 1,684
Aug-10 1,577
Sep-10 1,760
Oct-10 1,698
Nov-10 2,059
Dec-10 2,219
Jan-11 2,801
Feb-11 1,964
Mar-11 2,512
Apr-11 1,908
May-11 1,314
RO RO1 2nd Pass Reject Flow
kgal
FY 2010 2,569 Jul-09 178
Aug-09 139
Sep-09 133
Oct-09 161
Nov-09 176
Dec-09 242
Jan-10 363
Feb-10 386
Mar-10 320
Apr-10 151
May-10 143
Jun-10 176
FY 2011 2,769 Jul-10 230
Aug-10 151
Sep-10 203
Oct-10 202
Nov-10 254
Dec-10 432
Jan-11 407
Feb-11 382
Mar-11 251
Apr-11 174
May-11 83
108 Inconsistency in total flow rates noted- see 2nd pass

Abbott RO Operation (pg 2 of 2) RO RO2 1st Pass Permeate
Flow
Sum of Flow (kgal)
FY 2010 24,682 Jul-09 2,784
Aug-09 2,162
Sep-09 1,847
Oct-09 1,696
Nov-09 1,808
Dec-09 1,636
Jan-10 1,427
Feb-10 1,500
Mar-10 1,540
Apr-10 2,184
May-10 2,479
Jun-10 3,621
FY 2011 22,788 Jul-10 2,982
Aug-10 2,078
Sep-10 2,630
Oct-10 1,965
Nov-10 1,191
Dec-10 1,823
Jan-11 1,954
Feb-11 1,586
Mar-11 1,598
Apr-11 2,208
May-11 2,772
RO RO2 1st Pass Reject Flow
Sum of Flow (kgal)
FY 2010 4,628 Jul-09 552
Aug-09 430
Sep-09 380
Oct-09 321
Nov-09 308
Dec-09 280
Jan-10 245
Feb-10 264
Mar-10 266
Apr-10 398
May-10 477
Jun-10 707
FY 2011 3,905 Jul-10 539
Aug-10 363
Sep-10 435
Oct-10 322
Nov-10 206
Dec-10 305
Jan-11 328
Feb-11 257
Mar-11 241
Apr-11 396
May-11 514
RO RO2 2nd Pass Permeate Flow
Sum of Flow (kgal)
FY 2010 23,278 Jul-09 2,588
Aug-09 2,013
Sep-09 1,712
Oct-09 1,615
Nov-09 1,727
Dec-09 1,572
Jan-10 1,360
Feb-10 1,438
Mar-10 1,485
Apr-10 2,084
May-10 2,338
Jun-10 3,348
FY 2011 21,959 Jul-10 2,801
Aug-10 1,964
Sep-10 2,512
Oct-10 1,908
Nov-10 1,314
Dec-10 1,756
Jan-11 1,895
Feb-11 1,534
Mar-11 1,543
Apr-11 2,112
May-11 2,619
RO RO2 2nd Pass Reject Flow
Sum of Flow (kgal)
FY 2010 2,537 Jul-09 298
Aug-09 228
Sep-09 194
Oct-09 200
Nov-09 196
Dec-09 165
Jan-10 129
Feb-10 134
Mar-10 136
Apr-10 209
May-10 250
Jun-10 397
FY 2011 2,187 Jul-10 313
Aug-10 206
Sep-10 243
Oct-10 177
Nov-10 120
Dec-10 177
Jan-11 173
Feb-11 140
Mar-11 128
Apr-11 211
May-11 298
109 Inconsistency in total flow rates noted- see 2nd pass
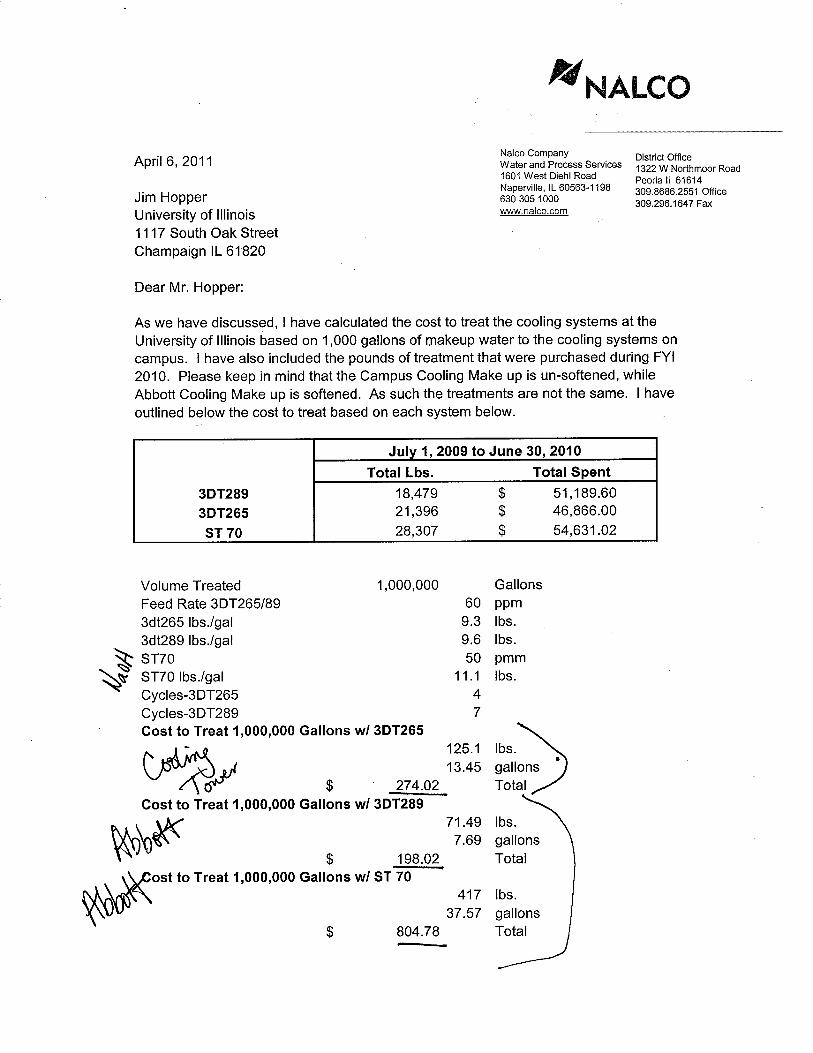

Nalco Company
Water and Process Services
1601 West Diehl Road
Naperville, IL 60563-1198
630 305 1000
www.nalco.com
District Office
1322 W Northmoor Road
Peoria Il 61614
309.8686.2551 Office
309.296.1647 Fax
July 21, 2011
Jennifer Deluhery
ISTC
One Hazelwood Drive
Champaign IL 61820
Jennifer:
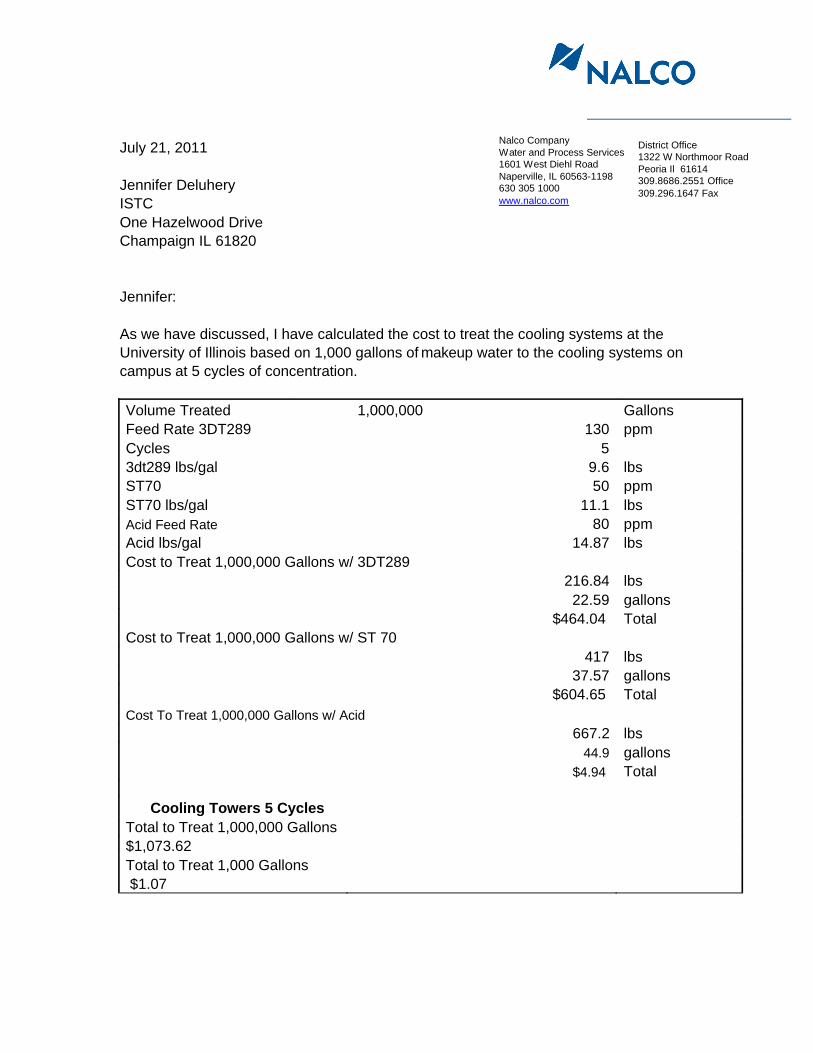
As we have discussed, I have calculated the cost to treat the cooling systems at the
University of Illinois based on 1,000 gallons of makeup water to the cooling systems on
campus at 5 cycles of concentration.
Volume Treated 1,000,000 Gallons
Feed Rate 3DT289 130 ppm
Cycles 5
3dt289 lbs/gal 9.6 lbs
ST70 50 ppm
ST70 lbs/gal 11.1 lbs
Acid Feed Rate 80 ppm
Acid lbs/gal 14.87 lbs
Cost to Treat 1,000,000 Gallons w/ 3DT289
216.84 lbs
22.59 gallons
$464.04 Total
Cost to Treat 1,000,000 Gallons w/ ST 70
417 lbs
37.57 gallons
$604.65 Total
Cost To Treat 1,000,000 Gallons w/ Acid
667.2 lbs
44.9 gallons
$4.94 Total
Cooling Towers 5 Cycles Total to Treat 1,000,000 Gallons
$1,073.62
Total to Treat 1,000 Gallons
$1.07

2 - July 22, 2011 NALCO COMPANY
The increase in Cycles of Concentration will need to be achieved with the use of Sulfuric Acidbeing fed to the cooling systems. Sulfuric Acid represents a significant safety concern that will need to be addressed prior to increasing the cycles at the University of Illinois. Currently we do not feed Sulfuric Acid to any system on site at the University.
I have also calculated the cost to treat 1000 gallons of make up to the Chilled loop at $19.24/1000 gallons.
As we have reviewed the installation of the 3DTrasar Controllers have shown a savings in water consumption. The installation of the units is dependent upon several factors such as sample line installation and electrical requirements. Installations of the units have been completed for $2,000.00 to $4,000.00.
Please let me know if you have any additional questions or concerns.
Sincerely,
Brett Willey
Nalco Company
309.660.4131

From: Brett Willey <[email protected]>
Sent: Thursday, October 27, 2011 9:55 AM
To: Jennifer Deluhery
Subject: RE: Check on Sulfuric Estimate
Hi Jennifer, I asked around and found that a ball park price for Acid (bulk) is around $0.16 per lb. In the calculation I used $0.11 per lb. I have updated the info below:
Volume Treated 1,000,000 Gallons
Feed Rate 3DT289 130 ppm
Cycles 5
3dt289 lbs/gal 9.6 lbs
ST70 50 ppm
ST70 lbs/gal 11.1 lbs
Acid Feed Rate 80 ppm
Acid lbs/gal 14.87 lbs
Cost to Treat 1,000,000 Gallons w/ 3DT289
216.84 lbs
22.59 gallons
$ 464.04 Total
Cost to Treat 1,000,000 Gallons w/ ST 70
417 lbs
37.57 gallons
$ 604.65 Total
Cost To Treat 1,000,000 Gallons w/ Acid 667.2 lbs
44.9 gallons
$ 106.75 Total
Cooling Towers 5 Cycles
Total to Treat 1,000,000 Gallons
$ 1,175.44
Total to Treat 1,000 Gallons
$ 1.18
Chilled Loop $ per 1000 Gallons of Make Up
$ 19.24
Brett


