

7/21/2019 Status Watersupply
http://slidepdf.com/reader/full/status-watersupply 1/869
Research Study Series No. 88
STATUS OF WATER SUPPLY,SANITATION AND SOLID WASTE MANAGEMENT
IN URBAN AREAS
Sponsored by
Central Public Health and Environmental Engineering Organisation(CPHEEO)
Ministry of Urban DevelopmentGovernment of India
National Institute of Urban Affairs1st & 2nd Floor, Core 4B, India Habitat Centre,
Lodhi Road, New Delhi – 110 003
June 2005

7/21/2019 Status Watersupply
http://slidepdf.com/reader/full/status-watersupply 2/869

7/21/2019 Status Watersupply
http://slidepdf.com/reader/full/status-watersupply 3/869
PROJECT TEAM
Project Coordinator: Usha P. Raghupathi
Research Assistance: Anjali Pancholy
Viraj Srivastav
M. Ahmed
Ajay Nigam
Special Assistance: Dr. Kusum Lata
EDP Assistance: Sangeeta Vijh
T. C. Sharma
Pre-Production Assistance: H.P. Pandey
M. Usman Khan

7/21/2019 Status Watersupply
http://slidepdf.com/reader/full/status-watersupply 4/869

7/21/2019 Status Watersupply
http://slidepdf.com/reader/full/status-watersupply 5/869
PREFACE
The urban population of India is growing rapidly and exerting considerable pressure on urban
services. It is evident that urban infrastructure has been unable to keep pace with the
growing population. A great challenge for Indian cities is to make cities livable by providing
every citizen with basic servies of acceptable quality. Urban local governments are the
institutions which are entrused with the task of providing these basic services but they are
often strapped of funds and unable to discharge their duties satisfactorily. In order to
understand what needs to be done to improve the provision of basic services, we need to
know the level of provision of these services. It is for this reason the Ministry of Urban
Development, Government of India, commissioned a study to assess the Status of Water
Supply, Sanitation and Solid Waste Management in Urban Areas of the country.
The main objective of the present study is to assess the status of water supply, sanitation
and solid waste management in 300 selected cities and towns and to estimate the
requirement of funds for full coverage of population by these services in the urban areas of
the country. The study is based on a detailed survey of the agencies responsible for the
provision, operations and management of these services in the selected cities and towns
including all the metropolitan cities in the country. The study, commissioned in 1999, took
about two years to complete. However, due to a number of reasons the study took unusually
long to be brought to its final form.
We would like to thank the Ministry of Urban Development and CPHEEO for entrusting this
study to NIUA. We are especially thankful to the then Secretary, Department of Poverty
Alleviation, in the Ministry, Shri S.S.Chattopadhyay, for assigning this study to us. Dr. S.R.
Shukla, Mr. V.B. Ramaprasad (Former Advisers, PHE), Mr. Sethuraman (present Jt.Adviser,
PHEE), Mr. B.B. Uppal, Mr. Sankara Narayanan and Mr. Sukanta Kar of CPHEEO provided
their full support throughout the study and gave their valuable comments, which have greatly
helped bring this report to its final shape.
The data from local governments and other line agencies were collected by engaging a
number of regional institutes, viz. Centre for Research for Rural and Industrial Development
(Chandigarh), ORG-MARG (Vadodra), National Centre for Human Settlements and
Environment (Bhopal) and Institute of Local Government & Urban Studies (Calcutta) and
NGOs viz. INDEP (Bangalore) and MaMista (Ghaziabad). We are thankful to Mr. J.P. Gupta,
Dr. S Ramarao, Mr. Ashok Gupta, Mrs. Chhanda Sarcar, Mr. Prashant Karkare, and Mr.
7/21/2019 Status Watersupply
http://slidepdf.com/reader/full/status-watersupply 6/869
Pankaj Bhargav for coordinating the arduous task of data collection work at these
institutions.
At the Institute Ms Usha P. Raghupathi very ably conducted this study. Ms. Anjali Pancholy
and Mr. Viraj Srivastav, Project Associates, Mr. Ajay Nigam and Mr. M. Ahmed, Junior
Research Officers who provided very valuable research support in the project assisted her.
Dr. Kusum Lata provided special assistance in the latter part of the study. Ms. Sangeeta Vijh
and Mr. Tek Chand Sharma of the computer unit carried out the tedious task of processing
the primary data, generating the final tables and printing the final report.
Finally, we would like to express our appreciation to all the local governments and line
agencies and others for providing data to us for this study.
New Delhi Prof. Usha P. Raghupathi
May, 2005 (Officer in-Charge)

7/21/2019 Status Watersupply
http://slidepdf.com/reader/full/status-watersupply 7/869
SPECIAL NOTE
The present study “Status of Water Supply, Sanitation and Solid Waste Management in
Urban Areas” was commissioned in 1999. The study started in April 1999. However, the
declaration of General Elections in the same year delayed data collection as most local
governments were engaged in election related work. Since the services selected for the
study were local subjects, local situations such as elections, floods, droughts, cyclones and
so on had a great impact on the time required for data collection. However, despite these
problems, the data were collected from most local bodies through personal visits. Only in
some cases, such as north-eastern states, Andaman and Nicobar Islands and Lakshadweep
Islands, the questionnaires were obtained by post.
The data obtained were scrutinized, cross-checked for inconsistencies and then finalized.
However, since the data management in local bodies is generally very poor, with some
exceptions, the information obtained from them, at times, did not seem very reliable, despite
the authentication by the local government with stamp and/or signature. NIUA then reverted
back to the local authorities to clarify/ correct the figures provided in the questionnaire. This
also proved to be a time-consuming process.
The report went through many iterations (over a period of 2-3 years) before finalisation, each
iteration incorporated useful and insightful comments of CPHEEO. However, some data gaps
still remained that were required to be filled. NIUA requested the Ministry’s help in this
matter.The Ministry was very helpful and sent letters, in early 2004, to all the states and
union territories to assist NIUA in filling the data gaps. However, even after sending
reminders and following up on telephone and making an all out effort, very few states/towns
responded. It was then decided to not wait any longer and the report was finalised in May
2005. Hence, there are still some ‘n.a. s’ in the report despite all these efforts. The report
therefore, is being submitted with some data gaps remaining.
In spite of these problems, the study is very useful. The uniqueness of the study is that it
covers all the states and union territories of the country and has put together data for each
service for the same year. This makes it possible to make inter-city comparisons.
Researchers and practitioners working with local governments would appreciate the value
of this effort and we hope that this study will be useful to all – administrators, policy makers,
practioners and researchers.
Study Coordinator

7/21/2019 Status Watersupply
http://slidepdf.com/reader/full/status-watersupply 8/869

7/21/2019 Status Watersupply
http://slidepdf.com/reader/full/status-watersupply 9/869
ix
CONTENTSPreface v
Special Note vii
Contents ix
List of Tables xiii
List of Abbreviations xix
Executive Summary 1
CHAPTER I
INTRODUCTION
1.1 BACKGROUND 11
1.2 OBJECTIVES 12
1.3 DATA BASE 14
1.4 METHODOLOGY 15
1.4.1 Selection of Towns 15
1.4.2 Questionnaires 16
1.4.3 Data Collection 16
1.5 SCOPE AND LIMITATIONS 17
1.6 TIME FRAME 17
1.7 PROCESSING OF DATA 18
1.8 STUDY OUTPUT 18
1.9 ORGANISATION OF THE REPORT 18
CHAPTER II
STATUS OF WATER SUPPLY 30
2.1 INTRODUCTION 30
2.2 COVERAGE OF POPULATION BY WATER SUPPLY 30
2.3 QUANTITY OF WATER SUPPLIED 33
2.3.1 Water Supplied for Domestic and Non-Domestic Uses 33
2.3.2 Utilization of Production Capacity 34
2.3.3 Duration of Supply 34
2.3.4 Water Consumption in Metropolitan Cities 35

7/21/2019 Status Watersupply
http://slidepdf.com/reader/full/status-watersupply 10/869
x
2.4 NORMS FOR WATER SUPPLY 36
2.4.1 CPHEEO Norms 37
2.4.2 Ninth Five Year Plan Norms 37
2.4.3 Norms Determined by the Individual Cities 37
2.5 PER CAPITA WATER SUPPLY AND ITS ADEQUACY 38
2.5.1 Per Capita Supply 39
2.5.2 Per Capita Domestic Supply 40
2.5.3 Exceptions 41
2.6 WATER SHORTAGE 41
2.7 UNACCOUNTED FOR WATER (UFW) 42
2.8 WATER CONNECTIONS 43
2.8.1 Total Water Connections 43
2.8.2 Metering of Connections 44
2.9 SOURCE AND STORAGE OF WATER 45
2.9.1 Dependence on Surface and Ground Water Sources 45
2.9.2 Distance to Source of Water Supply 47
2.9.3 Storage Capacity of Service Reservoirs 48
2.10 WATER TREATMENT 49
2.10.1 Water Treatment Plants 49
2.10.2 Monitoring Water Quality 49
2.10.3 Adequacy of Laboratory Facilities 51
2.11 INSTITUTIONAL ARRANGEMENTS FOR WATER SUPPLY 51
2.11.1 Institutional Arrangements in Major States 52
2.11.2 Exceptions 53
2.11.3 Institutional Arrangements in Smaller States and
Union Territories 54
2.12 STAFF POSITION 55
2.13 PRIVATISATION 56
2.14 WATER TARIFF 58
2.14.1 Charging for Water 58
2.14.2 Types of Water Tariff 58
2.14.3 Water Tariff in Metropolitan Cities 60
2.14.4 Water Tariff in Major States 63

7/21/2019 Status Watersupply
http://slidepdf.com/reader/full/status-watersupply 11/869
xi
2.15 REVENUE RECEIPTS AND REVENUE EXPENDITURE 67
2.15.1 Revenue Receipts 68
2.15.2 Revenue Expenditure 70
2.15.3 Cost Recovery 73
2.16 CAPITAL INVESTMENTS 79
2.17 ADDITIONAL INVESTMENT REQUIREMENTS 79
2.17.1 Projection Methodology 80
2.17.2 Projected Additional Capital Investment Requirements 83
CHAPTER III
WASTEWATER COLLECTION, TREATMENT AND DISPOSAL
AND LOW COST SANITATION 97
3.1 BACKGROUND 973.2 COVERAGE BY SEWERAGE SYSTEM 97
3.2.1 Urban Centres Covered 97
3.2.2 Population Covered 98
3.3 WASTEWATER GENERATION, COLLECTION AND DISPOSAL 98
3.3.1 Generation and Collection 98
3.3.2 Discharge of Wastewater 100
3.3.3 Recycling/Reuse of Wastewater 100
3.4 WASTEWATER TREATMENT 101
3.4.1 Treatment 101
3.4.2 Type of Treatment 102
3.4.3 Treatment Process 102
3.4.4 Sewage Treatment Plants 102
3.5 CHARGING FOR WASTEWATER 103
3.6 REVENUE RECEIPTS AND REVENUE EXPENDITURE 105
3.6.1 Revenue Receipts 1053.6.2 Cost Recovery 106
3.7 PRIVATISATION 108
3.8 CAPITAL EXPENDITURE 109
3.9 SEPTIC TANKS AND LOW COST SANITATION 109

7/21/2019 Status Watersupply
http://slidepdf.com/reader/full/status-watersupply 12/869
xii
3.10 ADDITIONAL CAPITAL INVESTMENT REQUIREMENTS 110
3.10.1 Projection Methodology 110
3.10.2 Assumptions used for Calculating
Investment Requirements 112
3.10.3 Projected Additional Investment Requirements 112
CHAPTER IV
MUNICIPAL SOLID WASTE MANAGEMENT 125
4.1 BACKGROUND 125
4.2 COVERAGE BY SOLID WASTE MANAGEMENT 125
4.3 SOLID WASTE GENERATION 126
4.3.1 Quantity Generated Per Day 126
4.3.2 Quantity of Domestic and Non-Domestic Waste 127
4.3.3 Hospital Waste 127
4.3.4 Per Capita Waste Generation 128
4.4 SOLID WASTE COLLECTION 129
4.4.1 Waste Collection Efficiency 129
4.4.2 Collection Frequency 130
4.5 SOLID WASTE DISPOSAL 130
4.5.1 Transportation of Waste 130
4.5.2 Method of Waste Disposal 132
4.6 STAFF POSITION 133
4.7 PRIVATISATION 134
4.8 REVENUE RECEIPTS AND EXPENDITURE 135
4.8.1 Revenue Receipts 135
4.8.2 Revenue Expenditure 135
4.8.3 Per Capita Revenue Receipts 136
4.8.4 Per Capita Expenditure 1364.8.5 Cost Recovery 137
4.9 ADDITIONAL INVESTMENT REQUIREMENTS 137
4.9.1 Projection Methodology 137
4.9.2 Assumptions Made for Calculating Investment Requirements 138
4.9.3 Projected Additional Investment Requirements 139
7/21/2019 Status Watersupply
http://slidepdf.com/reader/full/status-watersupply 13/869
xiii
CHAPTER V
CONCLUSIONS, SUMMARY OF RESULTS AND RECOMMENDATIONS 146
5.1 WATER SUPPLY 146
5.1.1 Conclusions 146
5.1.2 Summary of Results 148
5.1.3 Recommendations 150
5.2 SEWERAGE AND LOW COST SANITATION 150
5.2.1 Conclusions 150
5.2.2 Summary of Results 151
5.2.3 Recommendations 152
5.3 SOLID WASTE MANAGEMENT 153
5.3.1 Conclusions 1535.3.2 Summary of results 154
5.3.3 Recommendations 155
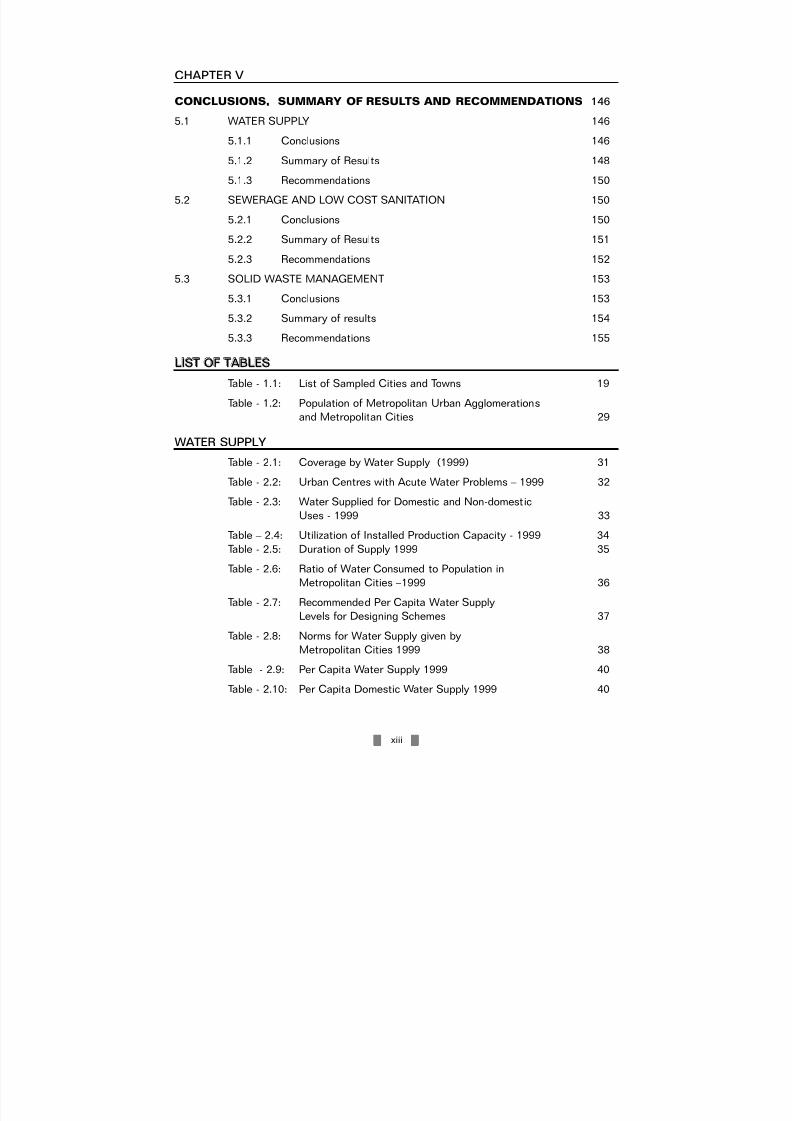
LIST OF TABLES
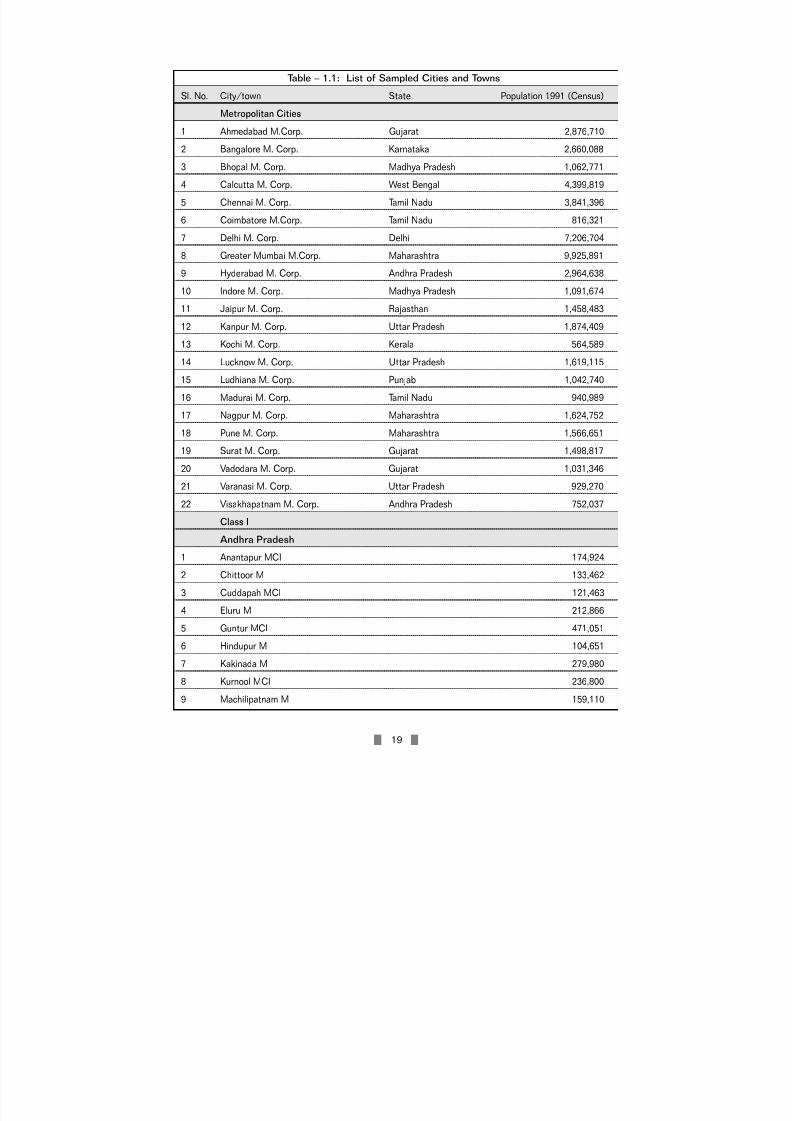
Table - 1.1: List of Sampled Cities and Towns 19
Table - 1.2: Population of Metropolitan Urban Agglomerations
and Metropolitan Cities 29
WATER SUPPLY
Table - 2.1: Coverage by Water Supply (1999) 31
Table - 2.2: Urban Centres with Acute Water Problems – 1999 32
Table - 2.3: Water Supplied for Domestic and Non-domestic
Uses - 1999 33
Table – 2.4: Utilization of Installed Production Capacity - 1999 34
Table - 2.5: Duration of Supply 1999 35
Table - 2.6: Ratio of Water Consumed to Population in
Metropolitan Cities –1999 36
Table - 2.7: Recommended Per Capita Water SupplyLevels for Designing Schemes 37
Table - 2.8: Norms for Water Supply given by
Metropolitan Cities 1999 38
Table - 2.9: Per Capita Water Supply 1999 40
Table - 2.10: Per Capita Domestic Water Supply 1999 40
7/21/2019 Status Watersupply
http://slidepdf.com/reader/full/status-watersupply 14/869
xiv
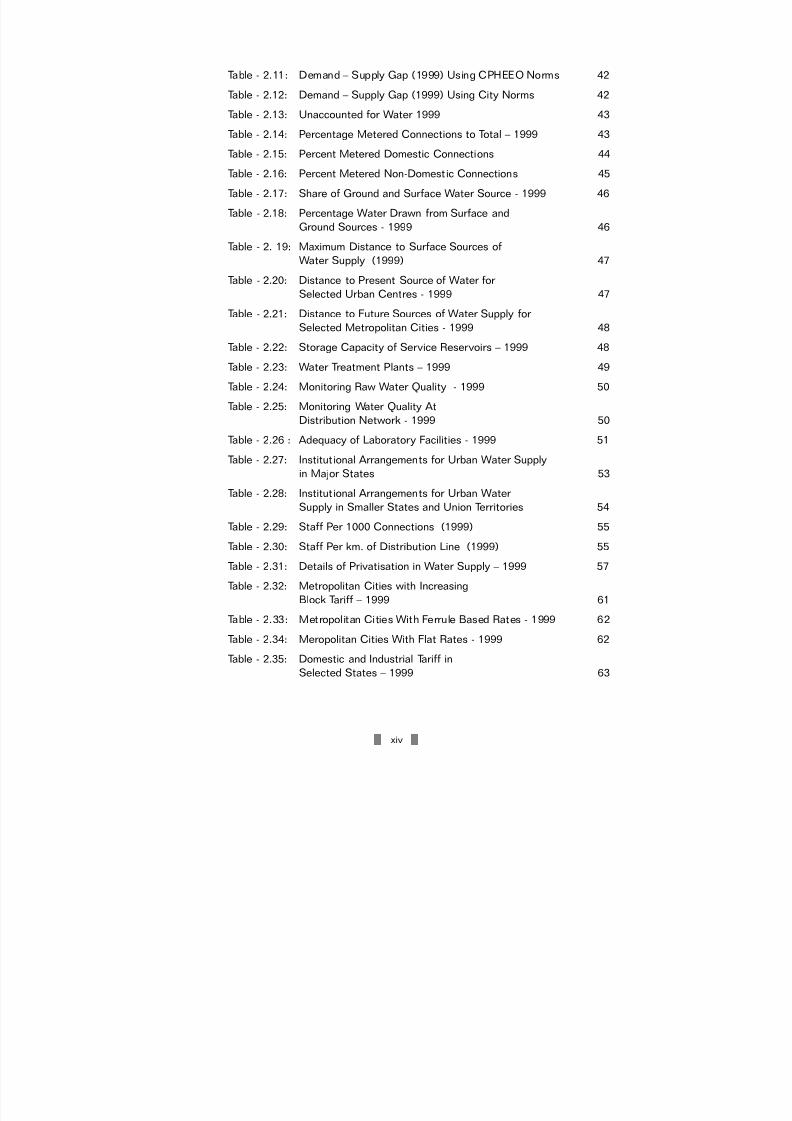
Table - 2.11: Demand – Supply Gap (1999) Using CPHEEO Norms 42
Table - 2.12: Demand – Supply Gap (1999) Using City Norms 42
Table - 2.13: Unaccounted for Water 1999 43
Table - 2.14: Percentage Metered Connections to Total – 1999 43
Table - 2.15: Percent Metered Domestic Connections 44
Table - 2.16: Percent Metered Non-Domestic Connections 45
Table - 2.17: Share of Ground and Surface Water Source - 1999 46
Table - 2.18: Percentage Water Drawn from Surface and
Ground Sources - 1999 46
Table - 2. 19: Maximum Distance to Surface Sources of
Water Supply (1999) 47
Table - 2.20: Distance to Present Source of Water for
Selected Urban Centres - 1999 47
Table - 2.21: Distance to Future Sources of Water Supply for
Selected Metropolitan Cities - 1999 48
Table - 2.22: Storage Capacity of Service Reservoirs – 1999 48
Table - 2.23: Water Treatment Plants – 1999 49
Table - 2.24: Monitoring Raw Water Quality - 1999 50
Table - 2.25: Monitoring Water Quality At
Distribution Network - 1999 50
Table - 2.26 : Adequacy of Laboratory Facilities - 1999 51
Table - 2.27: Institutional Arrangements for Urban Water Supply
in Major States 53
Table - 2.28: Institutional Arrangements for Urban Water
Supply in Smaller States and Union Territories 54
Table - 2.29: Staff Per 1000 Connections (1999) 55
Table - 2.30: Staff Per km. of Distribution Line (1999) 55
Table - 2.31: Details of Privatisation in Water Supply – 1999 57
Table - 2.32: Metropolitan Cities with Increasing
Block Tariff – 1999 61Table - 2.33: Metropolitan Cities With Ferrule Based Rates - 1999 62
Table - 2.34: Meropolitan Cities With Flat Rates - 1999 62
Table - 2.35: Domestic and Industrial Tariff in
Selected States – 1999 63

7/21/2019 Status Watersupply
http://slidepdf.com/reader/full/status-watersupply 15/869
xv
Table - 2.36: Percentage Revenue Receipts from
Water Charges – 1997-98 69
Table - 2.37: Percentage Revenue Receipts from
Water Tax - 1997-98 69
Table - 2.38: Percentage Revenue Receipts from Connection
Charges – 1997-98 70
Table - 2.39: Percentage Revenue Expenditure on Establishment in
Water Supply – 1997-98 71
Table - 2.40: Percentage Revenue Expenditure on Operation
and Maintenance – 1997-98 72
Table - 2.41: Percentage Revenue Expenditure on
Electricity – 1997-98 72
Table - 2.42: Percentage Revenue Expenditure on Consumables
and Repairs & Replacements – 1997-98 73
Table - 2.43: Revenue Receipts as a Percentage of Revenue
Expenditure in Water Supply -1997-98 74
Table - 2.44: Urban Centres with Revenue Surplus in
Water Supply – 1997-98 75
Table - 2.45: Revenue Receipts Per Kilolitre of Water
Supplied - 1997-98 76
Table - 2.46: Revenue Expenditure Per Kilolitre of
Water Supplied - 1997-98 77
Table - 2.47: Per capita Receipts from Water Supply - 1997-98 77
Table - 2.48: Per capita Revenue Expenditure on Water Supply 78
Table - 2.49: Summary of Revenue Receipts and Revenue
Expenditure -1997-98 78
Table - 2.50: Class-wise Projection of Urban Population* in
Different Years 80
Table - 2.51: Additional Population to be Covered in Different
Years by Size Class 80
Table - 2.52: Coverage of Population by Water Supply - 1999 81
Table - 2.53: Water Supply Norms Recommended By CPHEEO 81
Table - 2.54: Additional Water Requirements Using CPHEEO’s
Norms (in mld) 81
Table - 2.55: Task Forces Estimates of Per Capita Cost For
Water Supply Schemes 83
Table - 2.56: HUDCO Estimates of Per Capita Cost For
Water Supply Schemes 83

7/21/2019 Status Watersupply
http://slidepdf.com/reader/full/status-watersupply 16/869
xvi
Table - 2.57: NIUA Survey Estimates of Per Capita Cost of Water
Supply Schemes In Metropolitan Cities 84
Table - 2.58: Additional Capital Investment Requirement
Using Task Forces Per Capita Costs 85
Table - 2.59: Additional Capital Investment Requirement
Using HUDCO’s Per Capita Costs 85
Table - 2.60: Ninth Plan Estimates of Per Capita Cost for
Water Supply 85
Table - 2.61: Additional Capital Investment Requirement Using
Ninth Plan’s Per Capita Costs 86
Table - 2.62: HUDCO’s Estimates of Per Mld Cost for Water Supply 86
Table - 2.63: Additional Capital Investment Requirement
Using HUDCO’s Per Mld Costs - Low Estimate 87
Table - 2.64: Additional Capital Investment Requirement Using
HUDCO’s Per Mld Costs - High estimate 87
Table - AX - 2.1: Urban Centres with Water Supply Below Norm and
Additional Quantity Required to Reach Norms – 1999 89
Table - AX - 2.2: Urban Centres with Surplus Revenue
Receipts – 1997-98 94
Table – AX - 2.3: Year and Class Wise Projection of Urban
Population 96
WASTE WATER
Table - 3.1: Sampled urban centres withSewerage System - 1999 97
Table - 3.2: Sampled Cities with type of Sewerage System - 1999 98
Table - 3.3: Population Covered by Sewerage System – 1999 98
Table - 3.4: Volume of Wastewater Generated, Collected and
Treated – 1999 99
Table - 3.5: Wastewater Collection Efficiency - 1999 99
Table - 3.6: Discharge of Wastewater - 1999 100
Table - 3.7: Recycling of Wastewater - 1999 101
Table - 3.8: Wastewater Treated to Collected - 1999 101
Table - 3.9: Type of Wastewater Treatment - 1999 102
Table - 3.10: Wastewater Treatment Process - 1999 103
Table - 3.11: Sewage Treatment Plants - 1999 103
Table - 3.12: Sources of Revenue for Wastewater
Management - 1999 104

7/21/2019 Status Watersupply
http://slidepdf.com/reader/full/status-watersupply 17/869
xvii
Table - 3.13: Percentage Revenue Receipts from Sewerage/
Drainage Tax - 1997-98 105
Table - 3.14: Percentage Revenue Receipts from Connection
Charges - 1997-98 106
Table - 3.15: Percentage Revenue Receipts to Revenue
Expenditure - 1997-98 107
Table - 3.16: Privatisation in Wastewater Management - 1999 108
Table - 3.17: Population Dependant on Septic Tanks and LCS 110
Table - 3.18: Class-wise Projection of Urban Population in
Different Years (in million) 111
Table - 3.19: Additional Population to be Covered in Different
Years by Size Class 111
Table - 3.20: Coverage of Population by Safe Sanitation - 1999 111
Table - 3.21: Task Forces’ Per Capita Investment Costs for
Sanitation (Estimates at 1998-99 prices) 112
Table - 3.22: HUDCO’s Per Capita Investment Costs for
Sanitation (HUDCO estimates at 1998-99 prices) 112
Table - 3.23: Additional Investment Requirements for
Providing Safe Sanitation to Population
(Using Task Forces’ per capita cost estimates) 113
Table - 3.24: Additional Investment Requirements for
Providing Safe Sanitation to Population(Using HUDCO’s per capita cost estimates) 113
Table - AX- 3.1: Population Covered by Sewerage System and
Low Cost Sanitation - 1999 115
SOLID WASTE MANAGEMENT
Table - 4.1: Coverage of Population by Solid Waste
Management Service - 1999 126
Table - 4.2: Total and Per Capita Waste Generated - 1999 126
Table - 4.3: Waste Generation by Source - 1999 127
Table - 4.4: Collection of Hospital Waste - 1999 127
Table - 4.5: Treatment of Hospital Waste 128
Table - 4.6: Per Capita Waste Generation - 1999 129
Table - 4.7: Quantity of Solid Waste Generated and
Collected - 1999 129

7/21/2019 Status Watersupply
http://slidepdf.com/reader/full/status-watersupply 18/869
xviii
Table - 4.8: Waste collection efficiency -1999 130
Table - 4.9: Collection frequency - 1999 130
Table - 4.10: Transportation of Waste by Motorized Vehicles - 1999 131
Table - 4.11: Vehicle Maintenance Workshop - 1999 132
Table - 4.12: Main Method of Waste Disposal - 1999 132
Table - 4.13: Sanitary Workers Per 1000 Population - 1999 133
Table - 4.14: Privatisation of Solid Waste Management
Activities - 1999 134
Table - 4.15: Per Cent Share of Establishment
Expenditure - 1997-98 135
Table - 4.16: Per Capita Revenue Receipts from SWM (1997-98) 136
Table - 4.17: Per Capita Expenditure on Municipal Solid Waste
Management 1997-98 136
Table - 4.18: Per Capita Cost Recovery from Solid Waste
Management Service 1997-98 137
Table - 4.19: Year and Class Wise Projection of Urban Population 138
Table - 4.20: Additional Population to be Covered in
Different Years by Size Class 139
Table - 4.21: Population Not Covered by Solid Waste
Management - 1999 139
Table - 4.22: Task Forces Per Capita Investment Costs for
Solid Waste Management 139Table - 4.23: Additional Investment using Task Forces
Per Capita Cost Estimates 140
Table-AX-4.1: Treatment of Hospital Waste - 1999 141
Table-AX-4.2: Details of Privatisation in Solid Waste
Management - 1999 143
APPENDICES
Appendix 1: Water Supply and Water Tariff 157
Appendix 2: Waste-Water Management and Low CostSanitation, 1999 533
Appendix 3: Municipal Solid Waste Management,1999 645
ANNEXURE
Annex 1: Questionnaires 829
Annex 2: List of Collaborating Agencies 849
7/21/2019 Status Watersupply
http://slidepdf.com/reader/full/status-watersupply 19/869
xix
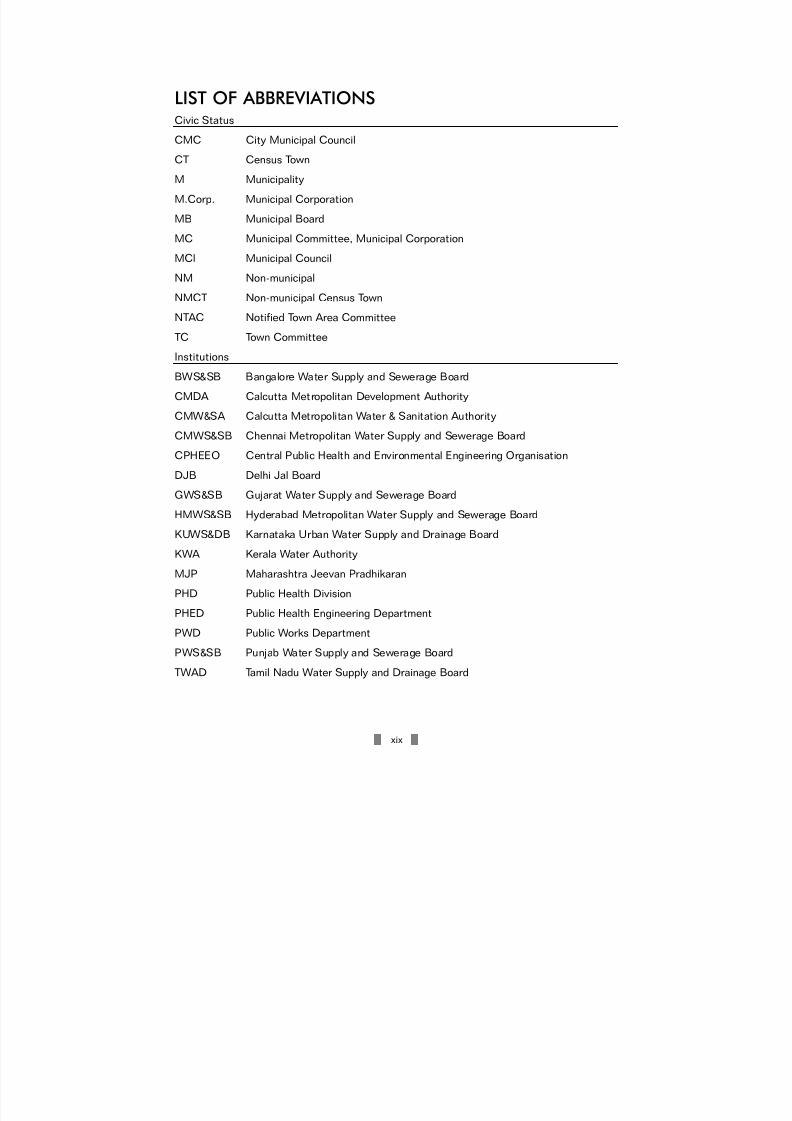
LIST OF ABBREVIATIONSCivic Status
CMC City Municipal Council
CT Census Town
M Municipality
M.Corp. Municipal Corporation
MB Municipal Board
MC Municipal Committee, Municipal Corporation
MCl Municipal Council
NM Non-municipal
NMCT Non-municipal Census TownNTAC Notified Town Area Committee
TC Town Committee
Institutions
BWS&SB Bangalore Water Supply and Sewerage Board
CMDA Calcutta Metropolitan Development Authority
CMW&SA Calcutta Metropolitan Water & Sanitation Authority
CMWS&SB Chennai Metropolitan Water Supply and Sewerage Board
CPHEEO Central Public Health and Environmental Engineering Organisation
DJB Delhi Jal Board
GWS&SB Gujarat Water Supply and Sewerage Board
HMWS&SB Hyderabad Metropolitan Water Supply and Sewerage Board
KUWS&DB Karnataka Urban Water Supply and Drainage Board
KWA Kerala Water Authority
MJP Maharashtra Jeevan Pradhikaran
PHD Public Health Division
PHED Public Health Engineering Department
PWD Public Works Department
PWS&SB Punjab Water Supply and Sewerage Board
TWAD Tamil Nadu Water Supply and Drainage Board
7/21/2019 Status Watersupply
http://slidepdf.com/reader/full/status-watersupply 20/869
xx
Others
n.a. Not available
n.r. Not reliable
ltrs. Litres
bu.n.a. Breakup not available
kl. Kilolitre (1000 litres)
lpcd Litres per capita per day
mld Million litres daily
m Metre
km. Kilometre
sq. km. Square kilometre
lakh 100,000
crore 10,000,000
gm. Gram
MT Metric tonne
arv Annual rateable valule
nrv Net rateable value
BOO Build-own-operate
IBT Increasing block tariff
LCS Low cost sanitationO&M Operation and maintenance
NGO Non-governmental organisation
UFW Unaccounted for water
SWM Solid Waste Management
STP Sewage Treatment Plant
WTP Water treatment plant

7/21/2019 Status Watersupply
http://slidepdf.com/reader/full/status-watersupply 21/869
1
EXECUTIVE SUMMARY
Providing water and sanitation to India’s millions is a challenging task. With over 20 million
people without access to safe water supply and 100 million without safe sanitation, the sheer
numbers indicate the massive effort required to provide these basic services to the peopleof the country. Just providing access, however, will not solve the problem unless the issues
of quality and adequacy are also addressed. The minimum needs should be met and the
quality of the services provided should be acceptable.
The present study assesses the status of three basic services - water supply, sanitation and
municipal solid waste management. It covers over 300 cities and towns in the country
including all metropolitan cities and selected Class I and Class II urban centres. The study
covers all the states and union territories including the capitals, excepting Patna and
Gandhinagar. The study was commissioned in 1999 and the data collection work took about
a year.
The main objectives of the study were to a) assess the status of water supply, sanitation and
solid waste management; b) analyse the revenue receipts and revenue expenditure of these
services; and c) estimate the additional capital investment requirements for full coverage of
population by these services from 1999 to 2022 (at five yearly intervals). The study covers
the physical and financial aspects of all the three services selected for the study. A conscious
decision was taken in the study to cover only the municipal area of the urban centres and not
the areas falling within the jurisdiction of other authorities such as development authorities,
cantonment boards, railways etc. This was done due to the time-frame of one year for the
study which did not permit data collection from different agencies for the same service. The
study gives the status of these services as provided by the public agencies and does not
cover private provision.
A study of this magnitude can be successful only with the cooperation of the local agencies,
which gave information on various aspects of the selected services. While every effort was
made to collect as accurate a data as possible, it was not always possible to check it with
the records of the agency. Records are often not computerised or kept properly, making data
authentication difficult. However, wherever other data sources were available, attempts were
made to cross-check the data collected and verify the authenticity of figures. Despite these
problems, the data provided by this study does give a broad picture of the overall situation
with respect to these services in the country.
Summary of FindingsOverall, the study confirms the normal notion that the metropolitan cities are better provided
for than the other size class of urban centres. The coverage of population with basic services
is higher for metropolitan cities than for other size class of urban centres. The investment
levels are higher in the metropolitan cities due to large concentration of population in them.
This could be one of the reasons for more people flocking to metropolitan cities – due to
better provision of basic amenities.

7/21/2019 Status Watersupply
http://slidepdf.com/reader/full/status-watersupply 22/869
2
The water supply situation, though much better in metropolitan cities at an aggregate level,
is reasonably good in many Class I and Class II urban centres too. The situation with respect
to wastewater management is much worse in smaller urban centres than in metropolitan
cities. A similar situation is obtained in respect of solid waste management where the
metropolitan cities fare much better than the other size class of urban centres. Financially
also, the metropolitan and larger urban centres fare much better than the smaller ones.
However, there are large variations in the status of individual urban centres with respect to
these services. The study found that in some cases the smaller urban centres showed much
better service provision than others. These isolated instances would be exceptions than the
rule.
Water Supply
The study indicates that the overall water supply situation, when looked at the city level, is
reasonably adequate in most cities and towns, the problem in many cases lies in the poor
distribution infrastructure. The water crisis is often related to the poor distribution of water
than the lack of water at source (e.g. Delhi). However, there are urban centres where water
source itself is depleting and is unable to cater to the water requirements of the urban
centres (e.g. towns of Tamil Nadu, Andhra Pradesh).
In most cities there are more households than water supply connections, indicating that
either there are many shared connections or households depend upon public stand posts.
The data indicates that many households have their own sources of water supply while
others complement own sources of supply with that of the public agency.
Unaccounted for water (UFW) data have been the most difficult to obtain. UFW is generally
an estimate worked out by the technical staff based on their perception of the situation.
Most cities do not have bulk meters or meters at all the user’s end. This makes the task of
calculating UFW very difficult. Therefore, the figures of UFW should be taken as the bestestimates that could be made by the technical staff of the water-supplying agency. Smaller
size towns that supply water from nearby sources or use ground water source have indicated
very small quantity of UFW. Therefore, the study indicates that the larger cities have greater
quantity of UFW than smaller size class of cities.
A very small percentage of urban centres have all connections metered (e.g. Bangalore,
Pune). About one-third of the urban centres covered do not have any metered connections.
In many urban centres a large percentage of domestic connections are unmetered while in a
little above one-fourth urban centres all non-domestic connections are also unmetered. This
needs to be taken up if tariff structures are to be rationalised and made a deterrent to
wastage of water.
Tariff data indicates that uniform volumetric charges and fixed charges (ferrule based etc.)
are the most common methods of charging. Incremental block tariff is mostly used in the
larger cities, with a few exceptions. In many cities, non-domestic connections are metered
while the domestic connections are unmetered. Since meters often do not work, many cities
charge fixed tariff for water supply based on the calculated consumption patterns.

7/21/2019 Status Watersupply
http://slidepdf.com/reader/full/status-watersupply 23/869
3
Most large cities depend upon surface sources for water supply, supplementing it with
ground water sources to meet the demand. However, the share of ground water increases
with a decrease in city size, with smaller size class of urban centres showing greater
dependence on ground water for water supply. The large investments required to supply
water from surface sources could be one reason for this pattern. This also reflects in the
existence of water treatment plants. While all metro cities using surface source have water
treatment plants, there is a small percentage of urban centres in other size classes that use
surface water but do not have water treatment plants.
There are many different types of institutional arrangements for water supply in the urban
areas of the country. The most common arrangement is that the capital works are done by a
state level agency and the local government does the O&M. However, there are wide
variations to this arrangement. These variations range from the state level agency managing
the entire water supply system in the entire state (Rajasthan) to the urban local body
performing all the tasks related to water supply (Mumbai).
Privatisation or public-private partnerships are still not very common in water supply with
less than one-tenth of the urban centres using private participation in this service.
Cost recovery is a major concern in water supply. While it is possible to achieve cost-
recovery in water supply, the fact is that almost four-fifths of the urban centres are unable
to recover even the O&M cost in this service. This indicates that while theoretically water
can be treated as an economic good, there are practical difficulties in implementing decisions
on raising water tariff. Water continues to be treated, as a social good and even recovering
O&M cost in most cities would require political consensus.
The additional capital investment requirements for covering the entire population with water
supply in the years to come is enormous, running into thousands of crores of rupees. While
it may be difficult to find resources to finance such large investments, private sectorparticipation could be encouraged. Public-private partnerships could reduce the financial
burden of public agencies to some extent and bring in some financial discipline into this
sector. While efforts have to be made to improve efficiency of water supply to reduce
operating costs, maintenance of existing assets would help in reducing new investment
requirements in the near future.
Recommendations
1. Problems of intra-city distribution should be taken up immediately by the local authorities
to address the problems of water shortage.
2. Steps should be taken to initiate capacity building in urban centres for estimation of
UFW. Financial assistance should also be provided to the water supplying agencies to
equip them with instruments for estimating UFW.
3. Metering of connections, both for bulk supply and retail distribution, must be
encouraged. Standard meters should be made available, at reasonable cost, to all urban
centres for this purpose.

7/21/2019 Status Watersupply
http://slidepdf.com/reader/full/status-watersupply 24/869
4
4. Tariff is a major concern in the water sector. Tariff should be increased at certain given
intervals, indexed to inflation and power tariff.
5. Getting surface water from distant sources is proving to be very expensive. Ground water
depletion can be controlled by undertaking rainwater harvesting in all urban centres.
Specific programmes/schemes should be initiated for aquifer re-charge.
6. In line with the provisions of 74th Constitution Amendment Act, the capacity of local
governments should be built to manage water supply systems. The local governments
should be given sufficient autonomy to decide on increase in water tariff required to
cover at least O&M costs.
7. Improving cost recovery should be linked to giving grants. Financial incentives could be
given to urban centres showing improved cost recovery. Technical assistance and
guidance should also be provided to local authorities to improve financial performance.
8. Private sector participation in this sector should be encouraged, wherever possible.
Unbundling of the service would allow private sector to participate in this service andimprove efficiency levels.
9. The additional capital investments required to cover the entire urban population with
water supply at the required norms will require huge investments that are not possible
for the Government to provide. Therefore, public-private participation must be
encouraged. New ways of financing for this sector should also be explored.
Sewerage and Sanitation
Wastewater disposal and treatment is a very major problem in most Indian cities. Non-
collection of wastewater and discharge of untreated wastewater into low-lying areas orvarious water bodies causes sever water and land pollution problems. This situation reduces
the availability of usable water for water supply.
The study indicates that while all the metropolitan cities have a sewerage system, a third- of
the Class I cities and less than one-fifth of the smaller sized urban centres have a sewerage
system. However, the coverage of population by the sewerage system is partial in all these
urban centres.
Wastewater generation is calculated at a minimum of 80 per cent of water supplied.
However, since people use their own sources of water, additional amounts of wastewater
may be generated, which have been taken into account in the present study. Wastewater
collection in most urban centres with sewerage system usually does not exceed about two-thirds of that generated. However, the wastewater treatment situation is quite alarming.
While the smaller sized urban centres with sewerage system treat less than one-fourth of the
wastewater generated, even the metropolitan cities treat only about two-fifths of the
wastewater generated. Wastewater disposal is done both on land and in water body by most
urban centres. Proximity to water body, local conditions and financial constraints determine
the place and method of wastewater disposal.
7/21/2019 Status Watersupply
http://slidepdf.com/reader/full/status-watersupply 25/869
5
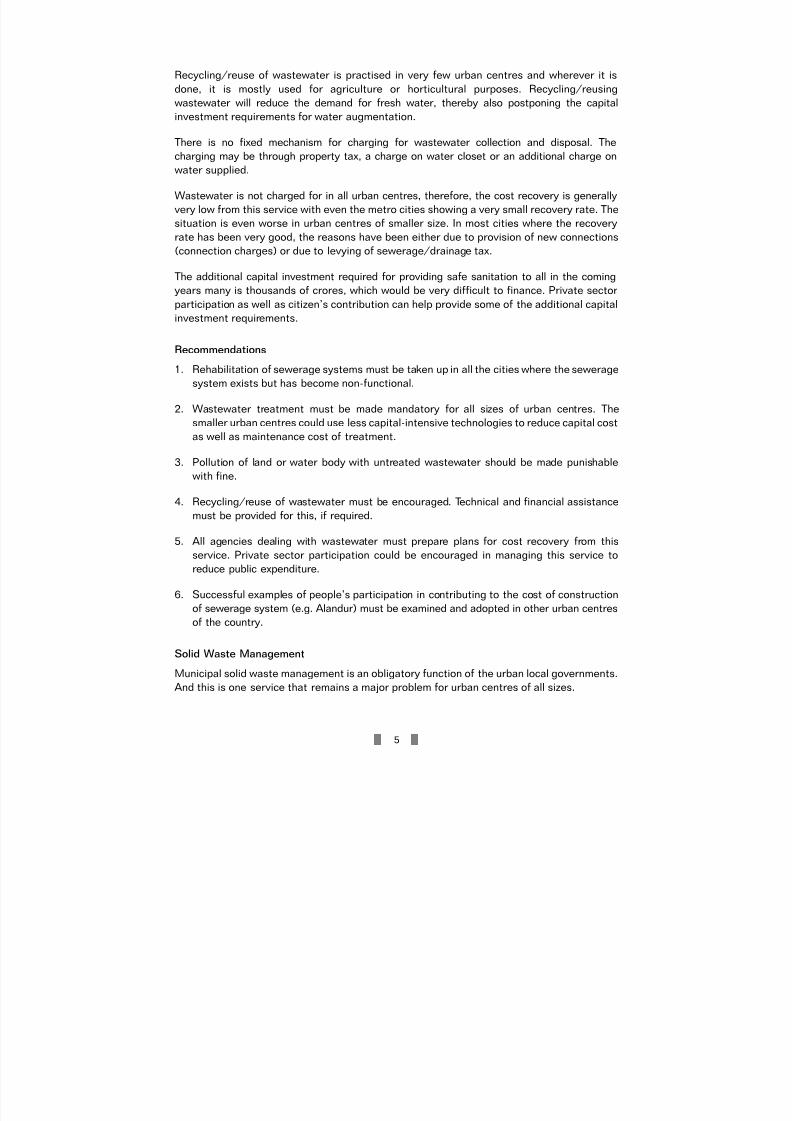
Recycling/reuse of wastewater is practised in very few urban centres and wherever it is
done, it is mostly used for agriculture or horticultural purposes. Recycling/reusing
wastewater will reduce the demand for fresh water, thereby also postponing the capital
investment requirements for water augmentation.
There is no fixed mechanism for charging for wastewater collection and disposal. The
charging may be through property tax, a charge on water closet or an additional charge on
water supplied.
Wastewater is not charged for in all urban centres, therefore, the cost recovery is generally
very low from this service with even the metro cities showing a very small recovery rate. The
situation is even worse in urban centres of smaller size. In most cities where the recovery
rate has been very good, the reasons have been either due to provision of new connections
(connection charges) or due to levying of sewerage/drainage tax.
The additional capital investment required for providing safe sanitation to all in the coming
years many is thousands of crores, which would be very difficult to finance. Private sector
participation as well as citizen’s contribution can help provide some of the additional capitalinvestment requirements.
Recommendations
1. Rehabilitation of sewerage systems must be taken up in all the cities where the sewerage
system exists but has become non-functional.
2. Wastewater treatment must be made mandatory for all sizes of urban centres. The
smaller urban centres could use less capital-intensive technologies to reduce capital cost
as well as maintenance cost of treatment.
3. Pollution of land or water body with untreated wastewater should be made punishable
with fine.
4. Recycling/reuse of wastewater must be encouraged. Technical and financial assistance
must be provided for this, if required.
5. All agencies dealing with wastewater must prepare plans for cost recovery from this
service. Private sector participation could be encouraged in managing this service to
reduce public expenditure.
6. Successful examples of people’s participation in contributing to the cost of construction
of sewerage system (e.g. Alandur) must be examined and adopted in other urban centres
of the country.
Solid Waste Management
Municipal solid waste management is an obligatory function of the urban local governments.
And this is one service that remains a major problem for urban centres of all sizes.

7/21/2019 Status Watersupply
http://slidepdf.com/reader/full/status-watersupply 26/869
6
The per capita waste generation has a positive correlation to the size class of urban centres
i.e. the larger the urban centre the more the waste generated.
The collection efficiency of solid waste is much better in larger cities than in smaller urban
centres. This could also be due to the motorised transportation vehicles deployed in larger
cities. Some of the smaller urban centres still depend on tricycles and animal carts for waste
collection. A factor that affects waste collection and transportation is the maintenance of
vehicles. Poor maintenance of fleet affects collection and transportation efficiency. Vehicles,
especially in smaller urban centres, are often not replaced even when there is a dire need to
replace them. Lack of finances for fleet replacement is a major cause of this state of affairs.
The main method of waste disposal continues to be open dumping in most urban centres.
While many urban centres have landfill sites, not all dispose their waste in these landfill sites
as sometimes the sites are far away from the city and the transportation costs become
prohibitive. Therefore, waste is dumped in some low-lying areas or disposed off just outside
the city periphery.
Hospital waste, though should be collected separately, is collected in a combined manner ina majority of urban centres, including some of the metropolitan cities.
Solid waste management is a labour intensive activity requiring adequate staff. However,
with a few exceptions, most urban centres fall short of staff for this activity. This impacts the
quality of service provided.
Privatisation is much more prevalent in this service than in the other two services covered in
the study. Many urban centres that have used this arrangement have been able to reduce
their expenditure on this service.
Cost recovery from solid waste management is extremely poor and therefore it becomes an
expenditure heavy service. Expenditure on establishment is the biggest head of expenditureon this service. Most urban centres spend over three-fourths of their solid waste
management budget on establishment.
The additional capital investment requirements worked out for this service in the coming
years indicate an investment of a couple of hundred crores per annum. However, these
figures will need to be revised taking into account the Hon’ble Supreme Court’s directives.
As construction of sanitary landfills is very expensive, this would add considerably to the
investment requirements.
Recommendations
1. Three ‘R’s of solid waste management i.e. reduce, reuse and recycle must be adopted byall urban centres. This will help in reducing the quantum of solid waste that the local
governments have to deal with.
2. Efficiency of waste collection must be improved in cities by bringing about the necessary
changes in the design of equipment used by sanitary staff, manpower management and
planning.

7/21/2019 Status Watersupply
http://slidepdf.com/reader/full/status-watersupply 27/869
7
3. Transportation fleet needs to be maintained well and needs to be modernised to improve
collection and transportation efficiency.
4. Crude/open dumping of waste must be completely discouraged by encouraging
controlled tipping.
5. All urban centres should identify landfill sites that are usable. In order to reduce thequantity of waste that goes to landfill sites, waste treatment such as neighbourhood
composting and recycling of waste must be encouraged.
6. Separate collection of hospital waste must be ensured in every city and incinerators must
be installed to deal with this waste. Landfill sites should apportion an area for the
disposal of hazardous waste from hospitals.
7. Private sector participation must continue to be encouraged in this sector to achieve
efficiency of operations and cost reduction. However, monitoring of privatised activities
should be improved in order to provide better quality of services to the people.
8. Plans to improve cost recovery from this service must be made by every local
government. New sources of revenue generation must be thought of.
9. People’s participation must be encouraged to keep cities clean and NGOs must be used
to do IEC work in communities.

7/21/2019 Status Watersupply
http://slidepdf.com/reader/full/status-watersupply 28/869
8
(Averages)
Indicators Metropolitan Class I Class II Total
cities cities towns
No. of sampled urban centres 22 164 115 301
Estimated population (1999) in ‘000 71,429 59,123 10,473 141,025
Population coverage (%) 98 91 89 94
Per capita supply (lpcd) 182 124 83 150
Per capita domestic supply (lpcd) 148 106 69 128
% urban centres with p.c. supply
below CPHEEO norm 50 40 52 46
% urban centres with p.c. supplybelow city norm 68 76 79 77
% supply required to be added toreach city norms 5 25 42 13
Quantity of water required to beadded to reach city norms (in mld) 1397 2209 439 4045
Unaccounted for water (%) 24 16 11 21
% connections metered 60 52 39 55
Staff per 1000 connections 14.5 7.9 6.8 10.9
Cost recovery (%) 70 55 44 65
Revenue receipts (Rs.) per kl. 2.16 1.02 1.21 1.73
Revenue expenditure (Rs.) ̀ per kl. 3.09 1.88 2.44 2.66
Deficit per kl. (Rs.) -0.93 -0.86 -1.23 -0.93
Revenue receipts per capita
(Rs. /annum) 149.43 48.65 39.41 100.55
Revenue expenditure per capita(Rs./annum) 214.12 89.40 77.86 153.89
Per capita deficit (Rs./ annum) -64.69 -40.75 -38.45 -53.34
Additional capital investment requirements* (1999-2022) range between Rs. 32118 and Rs. 35420 crores orbetween Rs.1396 and Rs. 1540 crores per annum.
Note: Revenue and expenditure figures are for financial year 1997-98. pc. refers to per capita *These requirements are for covering the entire urban population, in all size classes of urban centres, till the year 2022
and are based on two different per capita estimates used for projection.
Summary of Key Indicators for Water Supply – 1999
7/21/2019 Status Watersupply
http://slidepdf.com/reader/full/status-watersupply 29/869
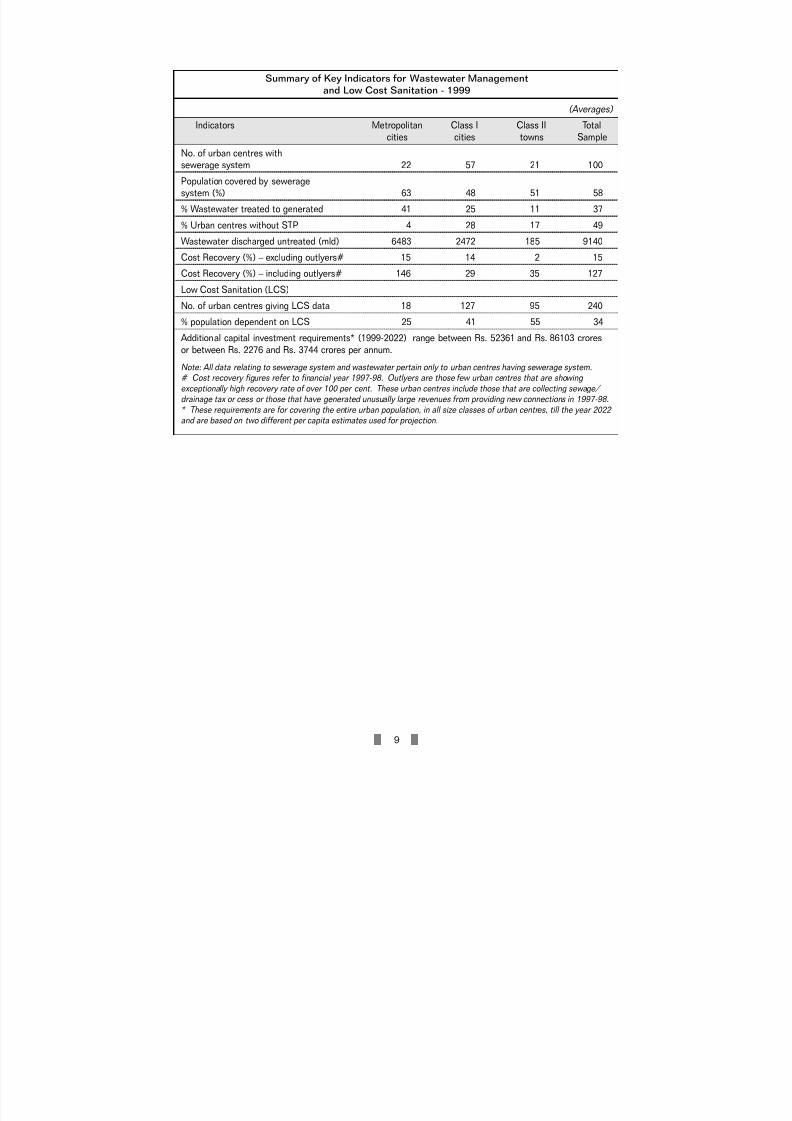
9
(Averages)
Indicators Metropolitan Class I Class II Total
cities cities towns Sample
No. of urban centres withsewerage system 22 57 21 100
Population covered by seweragesystem (%) 63 48 51 58
% Wastewater treated to generated 41 25 11 37
% Urban centres without STP 4 28 17 49
Wastewater discharged untreated (mld) 6483 2472 185 9140
Cost Recovery (%) – excluding outlyers# 15 14 2 15
Cost Recovery (%) – including outlyers# 146 29 35 127
Low Cost Sanitation (LCS)
No. of urban centres giving LCS data 18 127 95 240
% population dependent on LCS 25 41 55 34
Additional capital investment requirements* (1999-2022) range between Rs. 52361 and Rs. 86103 crores
or between Rs. 2276 and Rs. 3744 crores per annum.
Note: All data relating to sewerage system and wastewater pertain only to urban centres having sewerage system.# Cost recovery figures refer to financial year 1997-98. Outlyers are those few urban centres that are showing
exceptionally high recovery rate of over 100 per cent. These urban centres include those that are collecting sewage/ drainage tax or cess or those that have generated unusually large revenues from providing new connections in 1997-98.
* These requirements are for covering the entire urban population, in all size classes of urban centres, till the year 2022 and are based on two different per capita estimates used for projection.
Summary of Key Indicators for Wastewater Management
and Low Cost Sanitation - 1999

7/21/2019 Status Watersupply
http://slidepdf.com/reader/full/status-watersupply 30/869
10
(Averages)
Indicators Metropolitan Class I Class II Total
cities cities towns Sample
No. of responding urban centres 22 164 112 298
Population coverage (%) 90 95 93 92
Per capita waste generation (grams) 500 377 297 433
Waste collection efficiency (%) 91 85 75 88
Quantity of uncollected waste(MT/ day) 3170 3383 765 7318
Crude dumping of waste(% urban centres) 64 76 79 76
Sanitary workers per 1000 population 2.8 1.9 2.1 2.4
Share of establishment exp.on the service 81 84 81 82
Cost recovery (%) 7 9 5 7
Revenue receipts per capita (Rs. /annum) 12.8 6.66 2.96 10.12
Revenue expenditure per capita(Rs./annum) 189.39 73.12 63.15 140.63
Per capita deficit (Rs./ annum) 176.59 66.46 60.19 130.51
Additional capital investment requirements* (1999-2022) are projected to be about Rs. 3954 crores or Rs.172 crores per annum.
Note: Revenue and expenditure figures refer to financial year 1997-98 *These requirements are for covering the entire urban population, in all size classes of urban centres, till the year 2022.
Summary of Key Indicators for Solid Waste Management - 1999

7/21/2019 Status Watersupply
http://slidepdf.com/reader/full/status-watersupply 31/869
11
CHAPTER I
INTRODUCTION
1.1 BACKGROUND
Over 20 million people without access to safe water supply and over 100 million
people without safe sanitation facilities is the present (1999) basic services scenario
in the country. Clearly, the task at hand is challenging by any standard. With almost
7 million people being added to urban India every year, the situation is likely to get
worse if the problem of basic services is not addressed immediately. Efforts are being
made to provide basic services to those deprived of them, yet much more needs to
be done to improve the quality of life in urban India.
India’s ongoing economic liberalization programme aimed at increasing economic
growth along with poverty reduction, needs to be supported by provision of basic
infrastructure. Provision of water supply and sanitation will be essential to suchgrowth to ensure sustainability.These services have to not only be provided but
should meet minimum standards in terms of quantity, quality and reliability.
Constraints and bottlenecks in this sector have to be addressed on a priority basis to
keep up the momentum of economic growth.
Urban India is today faced with major problems such as shortage of safe drinking
water, inadequate sanitation facilities and poor solid waste management services.
With the urban population increasing from 160 million in 1981 to 217 million in 1991,
and reaching 285 million in 2001 (Census of India, 2001), the infrastructure in urban
areas has reached a breaking point. This situation has arisen because basic
infrastructure has not kept pace with demand. In 1991, the urban population of thecountry was residing in 4689 towns/3768 urban agglomerations, as per the Census
of India, 1991. The number of cities and towns has now increased to 5167 (Census,
2001). Increasing attention, therefore, needs to be focused on water supply,
sanitation and solid waste management services as these affect the quality of life of
citizens and the economic growth of the country.
Despite the importance of this sector, only a broad assessment of these services is
available in the country. The Economic Survey, 1998-991 showed that while 91.82 per
cent of the urban population in the country was covered by water supply, only 49.32
per cent of the urban population was covered by sanitation facilities. The data
available with CPHEEO (for end-March, 1997) puts these figures at 90 per cent and49 per cent respectively. The main data source, widely available, on the status of
water supply, waste-water, and solid waste management for Class I and Class II cities
and towns in the country is the one published by the Central Pollution Control Board.
These data, however, cover only limited aspects of these services. There is almost a
complete absence of data on the financial aspects of these services (such as water
7/21/2019 Status Watersupply
http://slidepdf.com/reader/full/status-watersupply 32/869
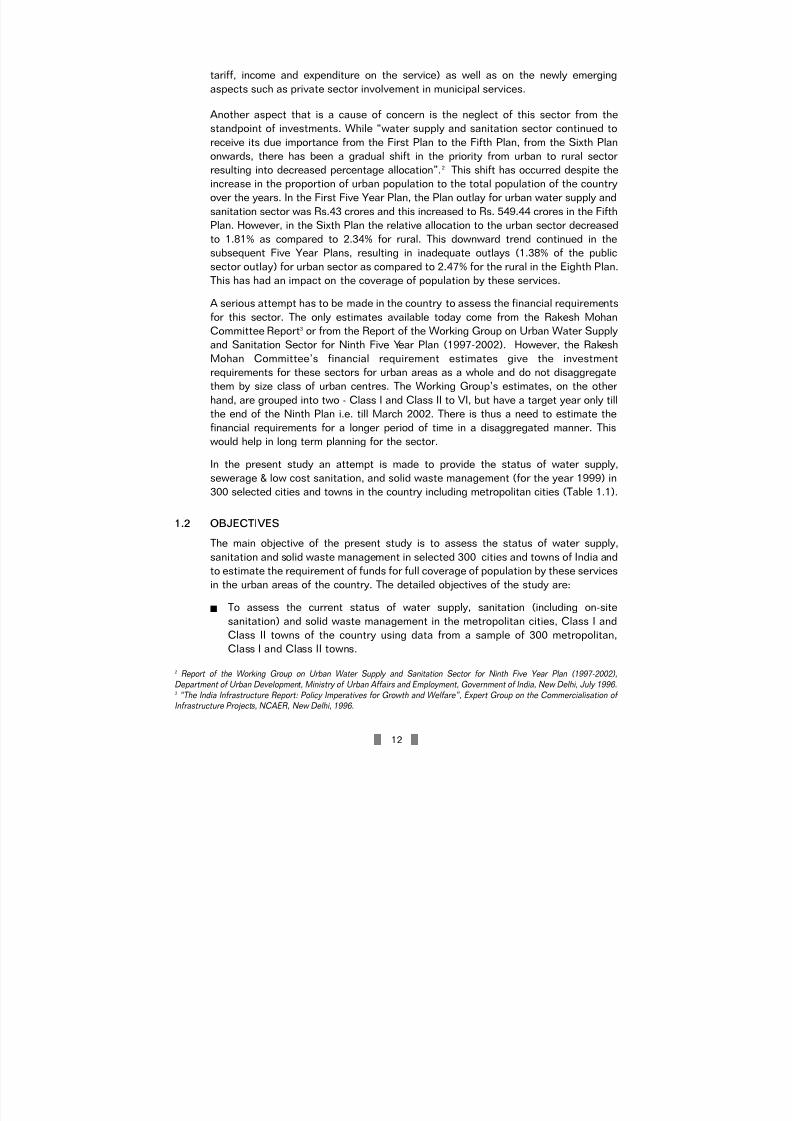
12
tariff, income and expenditure on the service) as well as on the newly emerging
aspects such as private sector involvement in municipal services.
Another aspect that is a cause of concern is the neglect of this sector from the
standpoint of investments. While “water supply and sanitation sector continued to
receive its due importance from the First Plan to the Fifth Plan, from the Sixth Plan
onwards, there has been a gradual shift in the priority from urban to rural sector
resulting into decreased percentage allocation”.2 This shift has occurred despite the
increase in the proportion of urban population to the total population of the country
over the years. In the First Five Year Plan, the Plan outlay for urban water supply and
sanitation sector was Rs.43 crores and this increased to Rs. 549.44 crores in the Fifth
Plan. However, in the Sixth Plan the relative allocation to the urban sector decreased
to 1.81% as compared to 2.34% for rural. This downward trend continued in the
subsequent Five Year Plans, resulting in inadequate outlays (1.38% of the public
sector outlay) for urban sector as compared to 2.47% for the rural in the Eighth Plan.
This has had an impact on the coverage of population by these services.
A serious attempt has to be made in the country to assess the financial requirementsfor this sector. The only estimates available today come from the Rakesh Mohan
Committee Report3 or from the Report of the Working Group on Urban Water Supply
and Sanitation Sector for Ninth Five Year Plan (1997-2002). However, the Rakesh
Mohan Committee’s financial requirement estimates give the investment
requirements for these sectors for urban areas as a whole and do not disaggregate
them by size class of urban centres. The Working Group’s estimates, on the other
hand, are grouped into two - Class I and Class II to VI, but have a target year only till
the end of the Ninth Plan i.e. till March 2002. There is thus a need to estimate the
financial requirements for a longer period of time in a disaggregated manner. This
would help in long term planning for the sector.
In the present study an attempt is made to provide the status of water supply,
sewerage & low cost sanitation, and solid waste management (for the year 1999) in
300 selected cities and towns in the country including metropolitan cities (Table 1.1).
1.2 OBJECTIVES
The main objective of the present study is to assess the status of water supply,
sanitation and solid waste management in selected 300 cities and towns of India and
to estimate the requirement of funds for full coverage of population by these services
in the urban areas of the country. The detailed objectives of the study are:
To assess the current status of water supply, sanitation (including on-site
sanitation) and solid waste management in the metropolitan cities, Class I and
Class II towns of the country using data from a sample of 300 metropolitan,
Class I and Class II towns.
2 Report of the Working Group on Urban Water Supply and Sanitation Sector for Ninth Five Year Plan (1997-2002),
Department of Urban Development, Ministry of Urban Affairs and Employment, Government of India, New Delhi, July 1996.3 “The India Infrastructure Report: Policy Imperatives for Growth and Welfare”, Expert Group on the Commercialisation of Infrastructure Projects, NCAER, New Delhi, 1996.

7/21/2019 Status Watersupply
http://slidepdf.com/reader/full/status-watersupply 33/869
13
To analyze the revenue receipts and revenue expenditure of the selected services,
i.e. water supply, sanitation and solid waste management and also to study the
capital investments on these services for the sampled cities and towns.
To estimate the capital investment requirements for full coverage of population by
these services from 1999 to 2022 A.D. (at 5 yearly intervals) for metropolitan
cities and for all classes of towns by size class.
The status of water supply broadly covers the following aspects:
(a) institutional arrangements for water supply
(b) the population served and per capita availability of water
(c) sources of water supply and distance to sources
(d) water supply by uses
(e) water losses
(f) water connections and other physical aspects
(g) water treatment
(h) privatisation aspects
(i) staff position
(j) water tariff
(k) revenue and expenditure on water supply
(l) capital works undertaken and proposed to be undertaken and their per capita
costs
The status of sewerage and sanitation broadly covers the following aspects:
(a) population coverage by sewerage system
(b) waste water generation and collection
(c) treatment of waste water
(d) recycling and reuse of waste water
(e) revenue and expenditure on the sewerage system
(f) staff position
(g) privatisation aspects
(h) capital works undertaken and proposed to be undertaken and their per capitacosts
(i) population covered by septic tanks and low cost sanitation facilities
The status of solid waste management broadly covers the following aspects:
(a) population covered by the service
(b) quantity of waste generated and collected

7/21/2019 Status Watersupply
http://slidepdf.com/reader/full/status-watersupply 34/869
14
(c) transportation of waste
(d) waste disposal methods
(e) details of treatment and disposal
(f) staff position
(g) privatisation aspects
(h) revenue and expenditure on solid waste management
(i) capital expenditure incurred and proposed to be incurred and their per capita
costs
A further attempt is made in the study to estimate the future investment
requirements. This estimate is based on:
(a) population projected for various years
(b) per capita cost of services
(c) backlog population to be covered and additional population to be covered in theyears to come
1.3 DATA BASE
The study covers a sample of 300 cities and towns drawn from metropolitan, Class I
and Class II population size classes (for a list of selected cities/towns see Table 1.1).
The study covers the entire country, i.e., all the 25 States and 7 Union Territories4. All
state and union territory capitals have also been covered in the study, regardless of
their size class, except for, Patna and Gandhinagar, where despite efforts, information
could not be obtained from the concerned agencies.
The data for the study has been obtained from the respective urban local bodies,
water supplying authorities and agencies doing capital works in the selected sample
cities and towns. The data, in the present study, has been organised into three groups
– metropolitan cities, Class I cities and Class II towns based on 1991 Census
population figures.
The metropolitan cities include 22** cities and urban agglomerations with million plus
population (as per Census of India, 1991). However, the population of only the main
city in the agglomeration has been taken in the present study. Therefore, six cities in
the metropolitan urban agglomerations list, which do not reach the million mark (as
per 1991 Census), have been included in the metropolitan cities group (Table 1.2).
This has been done in order to keep with the general perception of 23 metropolitan
cities in the country.
The Class I cities, in the present study, include cities with a population of between
100,000 and 1,000,000. In all the tables in the report, metropolitan cities have been
4 At present there are 28 states in the country but at the time of survey there were only 25 states.** Patna could not be included in the sample due to lack of response.

7/21/2019 Status Watersupply
http://slidepdf.com/reader/full/status-watersupply 35/869
15
excluded from Class I cities group. This has been done in order to highlight the status
of services in the Class I cities, other than the metropolitan cities.
The Class II towns, are towns with a population of between 50,000 and 100,000.
However, in the tables in the report, six towns with a population of less than 50,000
have been included in Class II towns. These are the capitals of the relatively small
states and union territories (Table 1.1). This has been done to avoid a fourth
classification of towns and arriving at extreme results due to the very small number
of sample towns in this category. The inclusion of these six towns in Class II category
does not alter the major findings of the study.
1.4 METHODOLOGY
As mentioned earlier, the responsibility for providing water supply and sanitation
rests with different agencies in different states. Therefore, data in respect of these
services has been obtained only from the respective agencies.
1.4.1 Selection of Towns
Selection of cities/towns has been done on purposive sampling basis. Of the
total 305 cities/towns that were selected, the sample was divided amongst the
Class I and Class II towns in a 2:1 ratio. This was done purposely in order to give
greater representation to Class I cities as these cities form a very large
proportion of the total urban centres in the country.
While selecting the towns from Class I size class, due consideration was given to the
towns with population of upto 5 lakhs, between 5 to 10 lakhs and above 10 lakhs.
All the state and union territory capitals, irrespective of their size class and all themetropolitan cities were included in the sample selected. However, reponse could
not be obtained from Patna and Gandhinagar.
Keeping in mind the time frame for the fieldwork, it was decided to select cities
that had relatively better accessibility. Some towns were also selected in clusters
in order to facilitate information collection.
In selecting the sample towns, care was taken to see that there was sufficient
geographical coverage within each state. In states where there were very few
Class I and II towns, this type of geographical coverage was not possible.
Urban agglomerations, as agglomerations, have not been included in the sample.
In most cases, only the main city/town in urban agglomerations have been
included in the list of selected towns. If the population of the main town in the
agglomeration fell below Class II level then the town was not selected.
Only towns with municipal status were selected. Exceptions were only those
state/ union territory capitals which had to be selected but did not have a
municipal civic status.

7/21/2019 Status Watersupply
http://slidepdf.com/reader/full/status-watersupply 36/869
16
In the selected towns, only the area falling under municipal jurisdiction has been
covered. Areas outside municipal jurisdiction have not been covered by the study.
In the towns without municipal bodies, area within the jurisdiction of the main
authority in-charge of providing the selected services have been covered.
A list of alternate cities/towns was also prepared simultaneously. This listconsisted of the remaining Class I and II towns, which were not included in the
main list of sample towns. This list was made in order to provide alternate sample
towns for survey in case there was a problem in data collection in the selected
towns.
Selection of cities/towns was done in consultation with CPHEEO.
1.4.2 Questionnaires
A specially designed questionnaire was prepared for each service covered in the
study i.e., water supply, sanitation and solid waste management for collectinginformation from the selected cities and towns.
Based on a questionnaire given by CPHEEO, a specially designed questionnaire
was prepared, incorporating many new aspects in order to provide better
understanding of the subject.
The questionnaires were designed keeping in mind the objectives of the study and
the clarity required at the field level for filling the questionnaire.
The size of the questionnaire was also an important consideration while designing
the questionnaire as the survey had to be completed within a specified time
frame.
Based on the agencies providing the services covered by the study, the
questionnaire was divided into three parts viz., water supply, sewerage and
sanitation, and solid waste management.
The questionnaire was also translated into Hindi in order to facilitate collection of
information in the northern states of the country.
The questionnaires were field tested before finalization. This step helped in
refining the questionnaires – both in content and in design (see Annex 1 for the
questionnaires used in the survey).
1.4.3 Data Collection
While the institutional arrangements for providing water supply and sewerage in
different states and union territories vests with different agencies, at times, even
within the same state different towns have different arrangements. In a given state
there could be one agency responsible for capital works (i.e. execution of projects)

7/21/2019 Status Watersupply
http://slidepdf.com/reader/full/status-watersupply 37/869
17
and another for operation and maintenance. The agencies could be fully government
departments, semi-autonomous boards and autonomous boards. Therefore, the
study had to obtain data from different public agencies in different states for water
supply and sewerage. However, in almost all the states and union territories, the
responsibility for solid waste management vests only with the local governments.
Exceptions to this are mainly found in small states and union territories.
Data was collected by first mailing the questionnaires and then making personal visits
to the selected towns.
a) Mailing
Questionnaires were mailed to different agencies in different towns. The
questionnaire pertaining to water supply and sewerage was mailed to the
agencies providing these services in the selected towns while the questionnaire
pertaining to solid waste management was sent to respective local governments,
with some exceptions.
b) Personal visits
Mailing of questionnaires to the selected towns was followed by personal visits
to almost all the towns, exceptions being the North-eastern states, Andaman &
Nicobar Islands, and Lakshadweep Islands. For personal visits, assistance of six
agencies was sought covering different regions of the country (see Annex 2 for
the list of collaborating agencies). This was done not only to save time and costs,
but also to overcome the language barrier.
1.5 SCOPE AND LIMITATIONS
The study looks at only the public provision of selected services but does not coverprivate arrangements made by individuals, communities or NGOs. The study
focusses on the city as a whole, and does not focus in detail on any specific group
such as the community groups or slums. The study does not cover intra-city
distribution of services, it only looks at the whole city as one unit.
The present study has not collected time series data but has collected data for one year
only. Since the present study’s focus is an overview of the status of the selected
services in the country, there is no in-depth analysis of problems in the report.
1.6 TIME FRAME
The study had a time frame of one year starting March, 1999. However, due to theall-India nature of the survey, the holding of one General Election during the survey
period and the happening of a major natural disaster like the cyclone in Orissa, and
other problems like floods in Bihar and so on, and also local level problems in data
collection, the study took longer to be completed than anticipated.
The major findings emerging from the survey were presented to the CPHEEO and the
draft report with the major findings was submitted in June 2000. A suggestion was

7/21/2019 Status Watersupply
http://slidepdf.com/reader/full/status-watersupply 38/869
18
made by the CPHEEO, at this stage, to change the organization of the data in the
report so that instead of presenting the data state-wise, it would be presented class-
wise. This entailed redoing all the tables and calculations, which further delayed the
submission of the final report. A revised draft report, incorporating the suggestions
given by the CPHEEO, was submitted to the Ministry of Urban Development
(MOUD&PA) in March 2001. The report was scrutinized by the CPHEEO and
comments sent to NIUA towards the end of 2001. The present report has incorporated
all the comments given by the CPHEEO on the draft reports.
The data in the study pertains to the year 1999, except for the data on revenue and
expenditure, which pertains to the financial year 1997-98.
1.7 PROCESSING OF DATA
The entire data collected from the field was processed and tabulated by the
Institute’s computer unit. This process, included writing of programme for data
feeding, coding of data, scrutinizing, preparing tables for the report as well as for the
statistical volumes.
1.8 STUDY OUTPUT
The study’s outputs are the following:
Assessment of the current status of water supply, sanitation (including on-site
sanitation) and solid waste management in the metropolitan cities and selected
Class I cities & Class II towns of the country.
Analysis of revenue income and revenue expenditure on the selected services, i.e.
water supply, sanitation and solid waste management services.
Estimation of future investment requirements for full coverage of population up to
2022 A.D. at five year intervals, i.e., for 2002, 2007, 2012, 2017 and 2022, for all
classes of cities and towns in the country.
1.9 ORGANISATION OF THE REPORT
The present report has been organised into five chapters. Chapter I contains the
introduction to the study. Chapters II, III and IV present the status of water supply,
sewerage & low cost sanitation, and solid waste management services respectively,
along with the additional investment requirements for each service. The final chapter,
Chapter V, presents the broad conclusions and summary of results emerging from the
study.
The data pertaining to the three services covered in the study have been presented
in the appendices. Appendix I gives data on Water Supply and Water Tariff,
Appendix II gives data on Wastewater Management and Low Cost Sanitation and
Appendix III gives data on Solid Waste Management.
7/21/2019 Status Watersupply
http://slidepdf.com/reader/full/status-watersupply 39/869
19
Table – 1.1: List of Sampled Cities and Towns
Sl. No. City/town State Population 1991 (Census)
Metropolitan Cities
1 Ahmedabad M.Corp. Gujarat 2,876,710
2 Bangalore M. Corp. Karnataka 2,660,088
3 Bhopal M. Corp. Madhya Pradesh 1,062,771
4 Calcutta M. Corp. West Bengal 4,399,819
5 Chennai M. Corp. Tamil Nadu 3,841,396
6 Coimbatore M.Corp. Tamil Nadu 816,321
7 Delhi M. Corp. Delhi 7,206,704
8 Greater Mumbai M.Corp. Maharashtra 9,925,891
9 Hyderabad M. Corp. Andhra Pradesh 2,964,638
10 Indore M. Corp. Madhya Pradesh 1,091,674
11 Jaipur M. Corp. Rajasthan 1,458,483
12 Kanpur M. Corp. Uttar Pradesh 1,874,409
13 Kochi M. Corp. Kerala 564,589
14 Lucknow M. Corp. Uttar Pradesh 1,619,115
15 Ludhiana M. Corp. Punjab 1,042,740
16 Madurai M. Corp. Tamil Nadu 940,989
17 Nagpur M. Corp. Maharashtra 1,624,752
18 Pune M. Corp. Maharashtra 1,566,651
19 Surat M. Corp. Gujarat 1,498,817
20 Vadodara M. Corp. Gujarat 1,031,346
21 Varanasi M. Corp. Uttar Pradesh 929,270
22 Visakhapatnam M. Corp. Andhra Pradesh 752,037
Class I
Andhra Pradesh
1 Anantapur MCI 174,924
2 Chittoor M 133,462
3 Cuddapah MCI 121,463
4 Eluru M 212,866
5 Guntur MCI 471,051
6 Hindupur M 104,651
7 Kakinada M 279,980
8 Kurnool MCI 236,800
9 Machilipatnam M 159,110

7/21/2019 Status Watersupply
http://slidepdf.com/reader/full/status-watersupply 40/869
20
Sl. No. City/town Population 1991 (Census)
10 Nandyal MCI 119,813
11 Nellore MCI 316,606
12 Nizamabad M 241,034
13 Ongole MCI 100,836
14 Qutubullapur M 106,591
15 Rajahmundry M. Corp. 324,851
16 Tenali M 143,726
17 Tirupati MCI 174,369
18 Vijayawada M. Corp. 701,827
19 Warangal M. Corp. 447,657
Bihar
20 Bihar Sharif M 201,323
21 Chhapra M 136,877
22 Gaya M. Corp. 291,675
23 Katihar M 135,436
24 Munger M 150,112
25 Ranchi M. Corp. 599,306
Gujarat
26 Anand M 110,000
27 Bharuch M 133,102
28 Bhavnagar M. Corp 402,338
29 Bhuj M 102,176
30 Jamnagar M. Corp. 341,637
31 Junagadh M 130,484
32 Nadiad M 167,051
33 Navsari M 126,089
34 Porbandar M 116,671
35 Rajkot M. Corp. 559,407
36 Surendranagar M 106,110
Haryana
37 Ambala MCI 119,338
38 Faridabad M. Corp. 617,717
39 Gurgaon MCI 121,486
40 Hisar MCI 172,677
41 Karnal MCI 176,131

7/21/2019 Status Watersupply
http://slidepdf.com/reader/full/status-watersupply 41/869
21
Sl. No. City/town Population 1991 (Census)
42 Rohtak MCI 216,096
Jammu & Kashmir
43 Jammu M. Corp. 716,000
Karnataka
44 Belgaum M. Corp. 326,399
45 Bellary CMC 245,391
46 Davangere MCI 266,082
47 Gadag-Betigeri CMC 134,051
48 Gulbarga M. Corp. 304,099
49 Hubli-Dharwar M. Corp. 678,298
50 Mandya M 120,265
51 Mangalore M. Corp. 273,304
52 Mysore M. Corp. 480,692
53 Shimoga CMC 179,258
54 Tumkur M 138,903
Kerala
55 Alappuzha MC 174,666
56 Kollam MC 139,852
57 Kozhikode M. Corp. 419,831
58 Thalaserry M 103,579
59 Thiruvananthapuram M. Corp. 524,006
Madhya Pradesh
60 Bhind M 109,755
61 Burhanpur M. Corp. 172,710
62 Dewas M. Corp. 164,364
63 Guna M 100,490
64 Gwalior M. Corp. 690,765
65 Jabalpur M. Corp. 741,927
66 Khandwa M 145,133
67 Morena M 105,135
68 Murwara (Katni) M. Corp. 163,431
69 Ratlam M. Corp. 183,375
70 Rewa M. Corp. 128,981
71 Satna M. Corp. 156,630
72 Shivpuri M 108,277

7/21/2019 Status Watersupply
http://slidepdf.com/reader/full/status-watersupply 42/869
22
Sl. No. City/town Population 1991 (Census)
Maharashtra
73 Amravati M. Corp. 421,576
74 Aurangabad M. Corp. 573,272
75 Bhusawal MCI 145,143
76 Chandrapur MCI 226,105
77 Dhule MCI 278,317
78 Ichalkaranji MCI 214,950
79 Jalgaon MCI 242,193
80 Kolhapur M. Corp. 406,370
81 Nanded Waghala M. Corp. 275,083
82 Nashik M. Corp. 656,925
83 Parbhani MCI 190,255
84 Solapur M. Corp. 604,215
85 Wardha M 102,985
86 Yavatmal MCI 108,578
Orissa
87 Bhubaneswar M. Corp. 411,542
88 Cuttack M. Corp. 403,418
89 Puri M 125,199
90 Rourkela M 140,408
91 Sambalpur M 131,138
Punjab
92 Amritsar M. Corp. 708,835
93 Bathinda MCI 159,042
94 Hoshiarpur MCI 122,705
95 Jalandhar M. Corp. 509,510
96 Moga MCI 108,304
97 Pathankot MCI 123,930
98 Patiala M. Corp. 238,368
Rajasthan
99 Ajmer MCI 402,700
100 Alwar M 205,086
101 Beawar M 105,363
102 Bhilwara M 183,965
103 Bikaner M 406,289
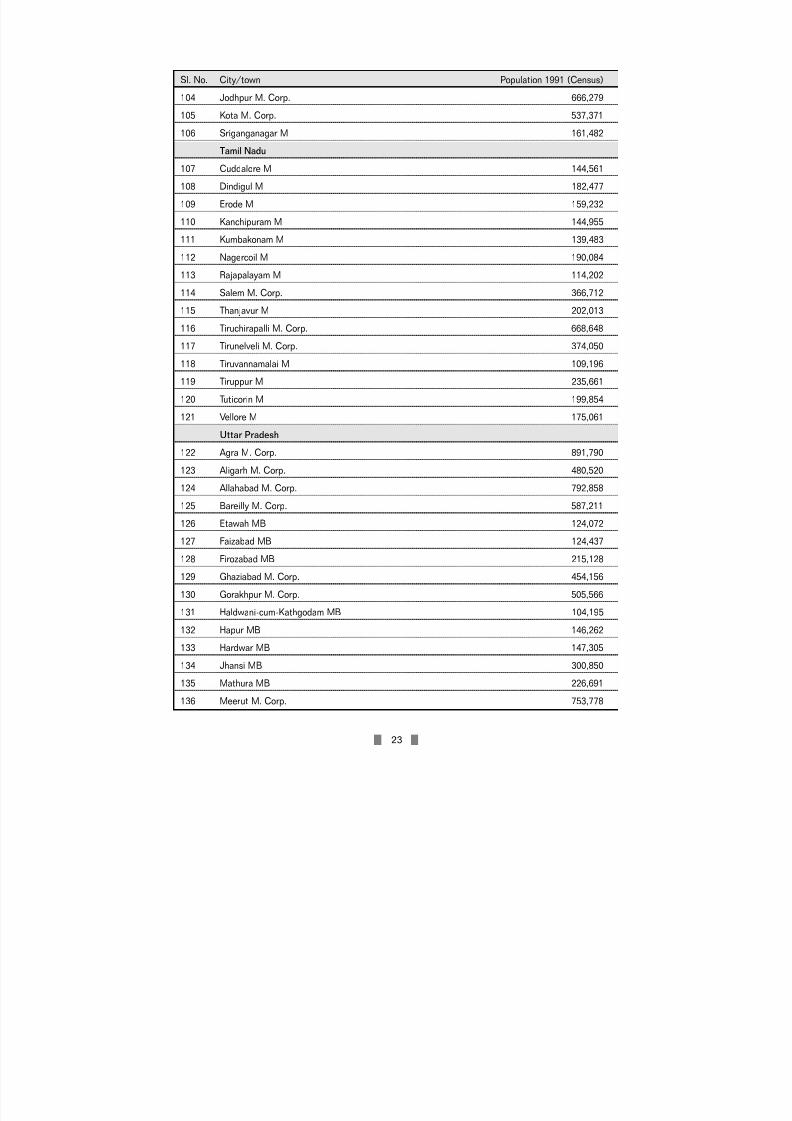
7/21/2019 Status Watersupply
http://slidepdf.com/reader/full/status-watersupply 43/869
23
Sl. No. City/town Population 1991 (Census)
104 Jodhpur M. Corp. 666,279
105 Kota M. Corp. 537,371
106 Sriganganagar M 161,482
Tamil Nadu
107 Cuddalore M 144,561
108 Dindigul M 182,477
109 Erode M 159,232
110 Kanchipuram M 144,955
111 Kumbakonam M 139,483
112 Nagercoil M 190,084
113 Rajapalayam M 114,202
114 Salem M. Corp. 366,712
115 Thanjavur M 202,013
116 Tiruchirapalli M. Corp. 668,648
117 Tirunelveli M. Corp. 374,050
118 Tiruvannamalai M 109,196
119 Tiruppur M 235,661
120 Tuticorin M 199,854
121 Vellore M 175,061
Uttar Pradesh
122 Agra M. Corp. 891,790
123 Aligarh M. Corp. 480,520
124 Allahabad M. Corp. 792,858
125 Bareilly M. Corp. 587,211
126 Etawah MB 124,072
127 Faizabad MB 124,437
128 Firozabad MB 215,128
129 Ghaziabad M. Corp. 454,156
130 Gorakhpur M. Corp. 505,566
131 Haldwani-cum-Kathgodam MB 104,195
132 Hapur MB 146,262
133 Hardwar MB 147,305
134 Jhansi MB 300,850
135 Mathura MB 226,691
136 Meerut M. Corp. 753,778

7/21/2019 Status Watersupply
http://slidepdf.com/reader/full/status-watersupply 44/869
24
Sl. No. City/town Population 1991 (Census)
137 Mirzapur MB 169,336
138 Moradabad M. Corp. 429,214
139 Muzaffarnagar MB 240,609
140 Rae Bareli MB 129,904
141 Rampur MB 243,742
142 Saharanpur MB 374,945
143 Sitapur MB 121,842
144 Unnao MB 107,425
West Bengal
145 Asansol M. Corp. 262,188
146 Baharampore M 115,144
147 Balurghat M 119,796
148 Bankura M 114,876
149 Barasat M 177,097
150 Burdwan M 102,660
151 Halisahar M 114,028
152 Krishnagar M 121,110
153 Midnapore M 125,498
154 North Barrackpore M 100,606
155 Santipur M 109,956
156 Siliguri M. Corp. 338,361
Small States
Assam
157 Guwahati M. Corp. 584,342
158 Jorhat MB 112,000
Manipur
159 Imphal MCI 198,535
Meghalaya
160 Shillong MB 131,719
Mizoram
161 Aizawl NM 155,240
Tripura
162 Agartala MCI 157,358
Union Territories
163 Chandigarh M. Corp. 504,094

7/21/2019 Status Watersupply
http://slidepdf.com/reader/full/status-watersupply 45/869
25
Sl. No. City/town Population 1991 (Census)
164 Pondicherry M 203,065
Class II
Andhra Pradesh
1 Anakapalle M 84,356
2 Dharmavaram M 78,961
3 Gudur MCI 55,984
4 Kapra M 87,747
5 Kavali MCI 65,910
6 Madanapalle M 73,820
7 Narasaraoper M 88,726
8 Rajendra Nagar MCI 84,520
9 Sangareddy MCI 50,123
10 Srikakulam MCI 88,883
11 Srikalahasti M 61,578
12 Suryapet MCI 60,630
Bihar
13 Buxar M 55,753
14 Deoghar M 76,380
15 Hajipur M 87,687
16 Hazaribagh M 97,824
17 Jehanabad M 52,332
18 Madhubani M 54,091
19 Mokama M 59,528
Gujarat
20 Amreli M 67,827
21 Ankleswar M 51,739
22 Dabhoi M 50,641
23 Dohad M 66,500
24 Gondal M 80,584
25 Jetpur M 73,560
26 Mehsana M 88,201
27 Palanpur M 80,657
Haryana
28 Jind MCI 85,315
29 Kaithal MCI 71,142

7/21/2019 Status Watersupply
http://slidepdf.com/reader/full/status-watersupply 46/869
26
Sl. No. City/town Population 1991 (Census)
30 Rewari MCI 75,342
31 Thanesar MCI 81,255
Jammu & Kashmir
32 Srinagar M. Corp. N.A.
Karnataka
33 Bagalkot CMC 76,903
34 Chikmagalur CMC 60,816
35 Gokak CMC 52,080
36 Hospet CMC 96,322
37 Kolar CMC 83,287
38 Rabkavi-Banhatti CMC 60,609
39 Ramanagaram CMC 50,437
Kerala
40 Changanessry MC 52,445
41 Payyanur M 64,032
42 Taliparamba M 60,226
43 Thrissur MC 74,604
Madhya Pradesh
44 Hoshangabad M 70,914
45 Itarsi M 77,334
46 Khargone M 66,786
47 Mandsaur M 95,907
48 Nagda M 79,622
49 Neemuch M 86,439
50 Sehore M 71,456
51 Shahdol M 55,508
52 Vidisha M 92,922
Maharashtra
53 Amalner MCI 76,442
54 Ballarpur MCI 83,511
55 Bhandara M 71,813
56 Kamptee MCI 78,612
57 Manmad MCI 61,312
58 Ratnagiri MCI 56,529
59 Satara MCI 95,180
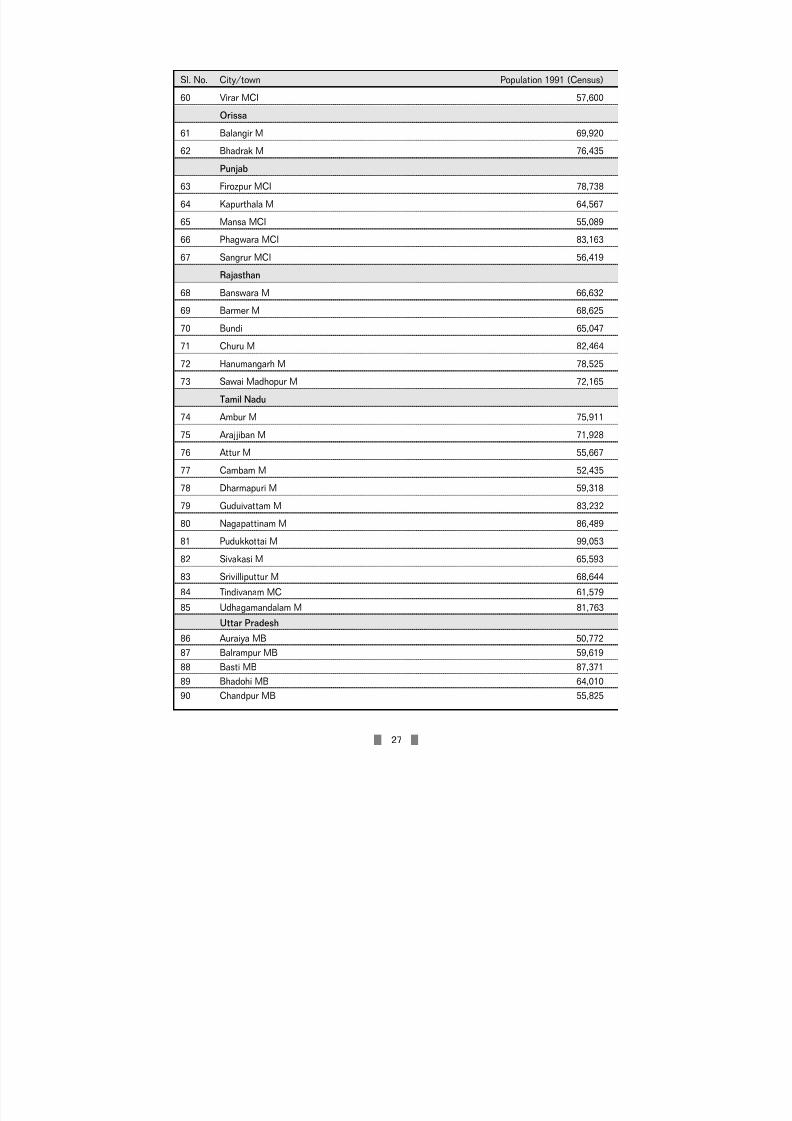
7/21/2019 Status Watersupply
http://slidepdf.com/reader/full/status-watersupply 47/869
27
Sl. No. City/town Population 1991 (Census)
60 Virar MCI 57,600
Orissa
61 Balangir M 69,920
62 Bhadrak M 76,435
Punjab
63 Firozpur MCI 78,738
64 Kapurthala M 64,567
65 Mansa MCI 55,089
66 Phagwara MCI 83,163
67 Sangrur MCI 56,419
Rajasthan
68 Banswara M 66,632
69 Barmer M 68,625
70 Bundi 65,047
71 Churu M 82,464
72 Hanumangarh M 78,525
73 Sawai Madhopur M 72,165
Tamil Nadu
74 Ambur M 75,911
75 Arajjiban M 71,928
76 Attur M 55,667
77 Cambam M 52,435
78 Dharmapuri M 59,318
79 Guduivattam M 83,232
80 Nagapattinam M 86,489
81 Pudukkottai M 99,053
82 Sivakasi M 65,593
83 Srivilliputtur M 68,644
84 Tindivanam MC 61,579
85 Udhagamandalam M 81,763
Uttar Pradesh
86 Auraiya MB 50,772
87 Balrampur MB 59,619
88 Basti MB 87,371
89 Bhadohi MB 64,010
90 Chandpur MB 55,825

7/21/2019 Status Watersupply
http://slidepdf.com/reader/full/status-watersupply 48/869
28
Sl. No. City/town Population 1991 (Census)
91 Etah MB 78,458
92 Ghazipur MB 76,547
93 Gonds MB 95,553
94 Lakhimpur MB 79,951
95 Lalitpur MB 79,870
96 Mughalsarai MB 66,529
97 Nawabganj-Barabanki MB 65,582
98 Orai MB 98,716
99 Roorkee MB 80,262
West Bengal
100 Bishnupur M 56,128
101 Chakdaha M 74,769
102 Contai M 53,484
103 Cooch Behar M 71,215
104 Darjeeling M 71,470105 Jalpaiguri M 68,732
106 Jangipur M 55,981
107 Katwa M 55,541
108 Raniganj M 61,997
Small States
Himachal Pradesh
109 Shimla M.Corp. 82,054
Nagaland
110 Kohima TC 51,418
Union Territories
111 Port Balir MCI 74,955
Others (Smaller than Class II towns)
Arunachal Pradesh
112 Itanagar CT 16,545
Goa
113 Panaji MCI 43,349
Sikkim
114 Gangtok NTAC 25,024
Union Territories
115 Daman MCI 26,906
116 Kavarathi NMCT 8,677
117 Silvassa 11,725

7/21/2019 Status Watersupply
http://slidepdf.com/reader/full/status-watersupply 49/869
29
(as per 1991 Census)
Sl. No. City Population of urban Population of the main city
agglomeration in the agglomeration
1 Greater Mumbai 12,596,243 9,925,891
2 Calcutta 11,021,918 4,399,819
3 Delhi 8,419,084 7,206,704
4 Chennai 5,421,985 3,841,396
5 Hyderabad 4,344,437 2,964,638
6 Bangalore 4,130,288 2,660,088
7 Ahmedabad 3,312,216 2,876,710
8 Pune 2,493,987 1,566,651
9 Kanpur 2,029,889 1,874,409
10 Lucknow 1,669,204 1,619,115
11 Nagpur 1,664,006 1,624,75212 Surat 1,518,950 1,498,817
13 Jaipur 1,518,235 1,458,483
14 Kochi 1,140,605 564,589
15 Vadodara 1,126,824 1,031,346
16 Indore 1,109,056 1,091,674
17 Coimbatore 1,100,746 816,321
18 Patna 1,099,647 917,243
19 Madurai 1,085,914 941,989
20 Bhopal 1,062,771 1,062,771
21 Vishakhapatnam 1,057,118 752,03722 Ludhiana 1,042,740 1,042,740
23 Varanasi 1,030,863 929,270
Total 70,996,726 52,667,453
Note: 1. There are 23 million plus cities/urban agglomerations and only 18 million plus cities in country as per
1991Census.
2. Kalyan Municipal Corporation, falling within Greater Mumbai urban agglomeration, has a population of 1,014,557.
This makes Kalyan a metropolitan city, by definition. However, Kalyan has not been included in the above list of metropolitan cities because only the main city of the agglomeration has been considered.
Source: Census of India 1991, Series 1 – India, General Population Tables Part II-A (ii) Towns and Urban
Agglomerations 1991 with their Population 1901-1991, Tables A-4, P.42 and p.204
Table – 1.2: Population of Metropolitan Urban Agglomerations and
Metropolitan Ciies

7/21/2019 Status Watersupply
http://slidepdf.com/reader/full/status-watersupply 50/869
30
CHAPTER II
STATUS OF WATER SUPPLY
2.1 INTRODUCTIONIndian cities and towns are increasingly facing potable water crisis due to mounting
demand and inadequate measures to meet the demand. This situation is the result
of an increase in urban population, depletion of nearby water sources, water
pollution, inefficient use of water, inefficient management of water supply systems
and multiple institutional arrangements. This situation needs to be improved so that
water is available to all at a reasonable cost. The present scenario of the public water
supply system, thus, needs to be understood well in order to take steps to improve
the system.
This chapter presents the status of public water supply system in 301 sampled
Class I and Class II urban centres, including most of the metropolitan cities in thecountry (as per Census of India, 1991). The total population covered by these 301
urban centres is 141.02 million, that is, 71.43 million in 22 metropolitan cities, 59.12
million in 164 Class I cities and 10.47 million in 115 Class II towns (Table A-1 in
Appendix I). The chapter covers different aspects of water supply including coverage,
quantity supplied, per capita supply, norms for supply, unaccounted for water, water
connections, source and storage of water, water treatment, institutional
arrangements, staff position, privatisation and financial aspects of water supply. The
chapter finally gives the additional capital investment requirements for covering the
entire population by water supply till the year 2022.
2.2 COVERAGE OF POPULATION BY WATER SUPPLY
The Approach Paper to the Ninth Plan (1997-2002) estimates that 85 per cent of the
country’s urban population has access to water supply. The Plan states that 100 per
cent of the population should be covered by water supply by the year 2002.
One of the obligatory functions of local bodies is to provide water supply to the
residents. Although this function has been taken over by para-statals or city level
boards in many urban centers, providing safe water to the entire population remains
the duty of the concerned public authority. However, covering the entire population
by water supply requires continuous investment in expanding and improving the water
supply system. The coverage of population by water supply has improved over theyears, however, 100 per cent coverage of urban population will take sometime to
achieve.
The average coverage of population by formal water supply in the sampled urban
areas is reasonably high with 94 per cent of the population being covered by the
service. The coverage is higher in the metropolitan cities (98%) than in Class I cities
(91%) and Class II towns (89%). (Table 2.1).
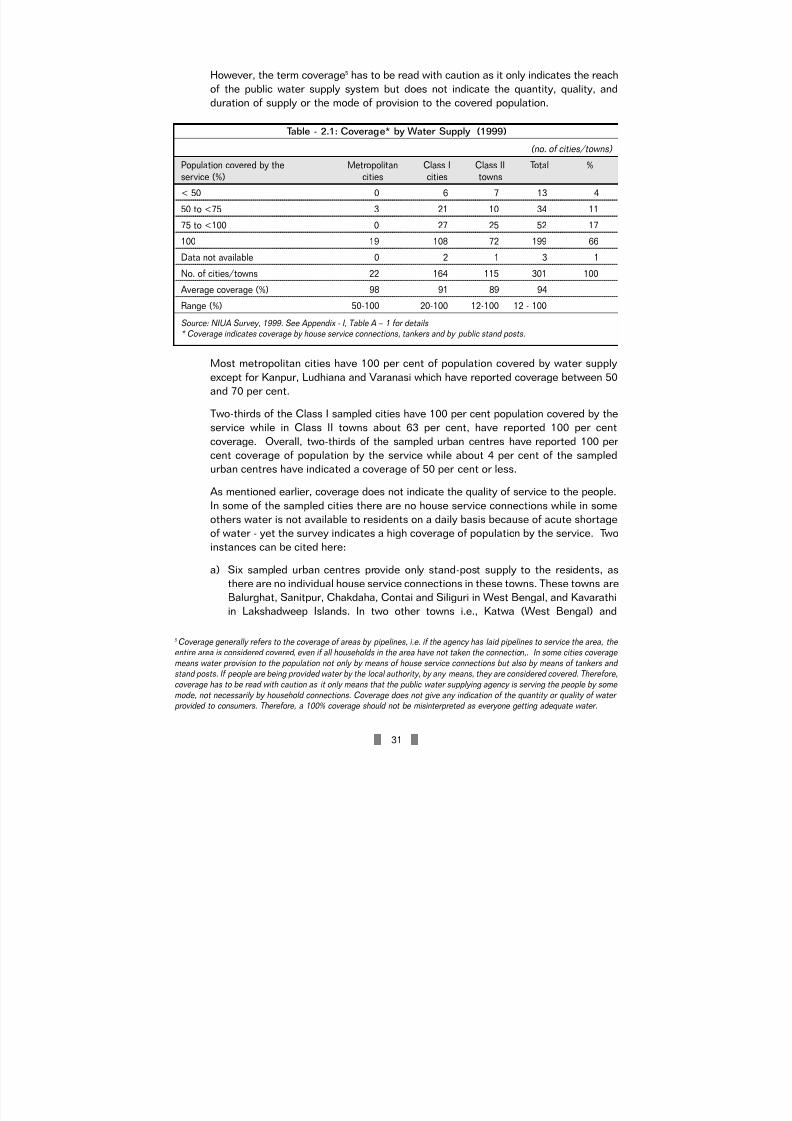
7/21/2019 Status Watersupply
http://slidepdf.com/reader/full/status-watersupply 51/869
31
However, the term coverage5 has to be read with caution as it only indicates the reach
of the public water supply system but does not indicate the quantity, quality, and
duration of supply or the mode of provision to the covered population.
Most metropolitan cities have 100 per cent of population covered by water supply
except for Kanpur, Ludhiana and Varanasi which have reported coverage between 50
and 70 per cent.
Two-thirds of the Class I sampled cities have 100 per cent population covered by the
service while in Class II towns about 63 per cent, have reported 100 per cent
coverage. Overall, two-thirds of the sampled urban centres have reported 100 per
cent coverage of population by the service while about 4 per cent of the sampledurban centres have indicated a coverage of 50 per cent or less.
As mentioned earlier, coverage does not indicate the quality of service to the people.
In some of the sampled cities there are no house service connections while in some
others water is not available to residents on a daily basis because of acute shortage
of water - yet the survey indicates a high coverage of population by the service. Two
instances can be cited here:
a) Six sampled urban centres provide only stand-post supply to the residents, as
there are no individual house service connections in these towns. These towns are
Balurghat, Sanitpur, Chakdaha, Contai and Siliguri in West Bengal, and Kavarathiin Lakshadweep Islands. In two other towns i.e., Katwa (West Bengal) and
(no. of cities/towns) Population covered by the Metropolitan Class I Class II Total %service (%) cities cities towns
< 50 0 6 7 13 4
50 to <75 3 21 10 34 11
75 to <100 0 27 25 52 17
100 19 108 72 199 66
Data not available 0 2 1 3 1
No. of cities/towns 22 164 115 301 100
Average coverage (%) 98 91 89 94
Range (%) 50-100 20-100 12-100 12 - 100
Source: NIUA Survey, 1999. See Appendix - I, Table A – 1 for details* Coverage indicates coverage by house service connections, tankers and by public stand posts.
Table - 2.1: Coverage* by Water Supply (1999)
5 Coverage generally refers to the coverage of areas by pipelines, i.e. if the agency has laid pipelines to service the area, the entire area is considered covered, even if all households in the area have not taken the connection,. In some cities coverage
means water provision to the population not only by means of house service connections but also by means of tankers and stand posts. If people are being provided water by the local authority, by any means, they are considered covered. Therefore,
coverage has to be read with caution as it only means that the public water supplying agency is serving the people by some
mode, not necessarily by household connections. Coverage does not give any indication of the quantity or quality of water provided to consumers. Therefore, a 100% coverage should not be misinterpreted as everyone getting adequate water.

7/21/2019 Status Watersupply
http://slidepdf.com/reader/full/status-watersupply 52/869
32
Payannur (Kerala) the population mainly depends on public stand-posts as there
are negligible individual connections. The population in these towns mostly use
informal sources of water supply, such as wells, handpumps, rivers, ponds etc. to
meet their daily water needs.
b) Twenty two sampled urban centres, despite 100 per cent coverage of population
by water supply, are unable to ensure daily water supply to the population.Surendranagar in Gujarat, for example, gets only 30 minutes of water once a
week while Gondal in the same state gets 20 minutes supply once in four days.
(Table 2.2).
Sl. No. State/city/town Frequency of water supply
Gujarat
1 Surendranagar 30 minutes once a week
2 Gondal 20 minutes once in four days
3 Amreli 60 minutes once in three days
4 Jetpur 20 minutes daily
5 Rajkot 30 minutes daily
Tamil Nadu
6 Attur Twice a week
7 Gudivattam Twice a week
8 Nagercoil Alternate days
9 Rajapalayam Alternate days
10 Tiruppur Alternate days
11 Vellore Alternate days
12 Sivakasi Alternate days
13 Srivilliputtur Alternate days
14 Udagamandalam Alternate days
Karnataka
15 Bangalore Alternate days
16 Tumkur Twice a week
17 Hubli – Dharwad Alternate days
18 Bagalkot Alternate days
19 Rabkavi-Banahatti Alternate days
Rajasthan
20 Bhilwara Twice a week
21 Barmer Twice a week
22 Beawar Alternate days
(In the above towns of Tamil Nadu, Karnataka and Rajasthan water is supplied for 1 to 3 hours)See Table A – 2 in Appendix – I for details
Table - 2.2: Urban Centres with Acute Water Problems – 1999
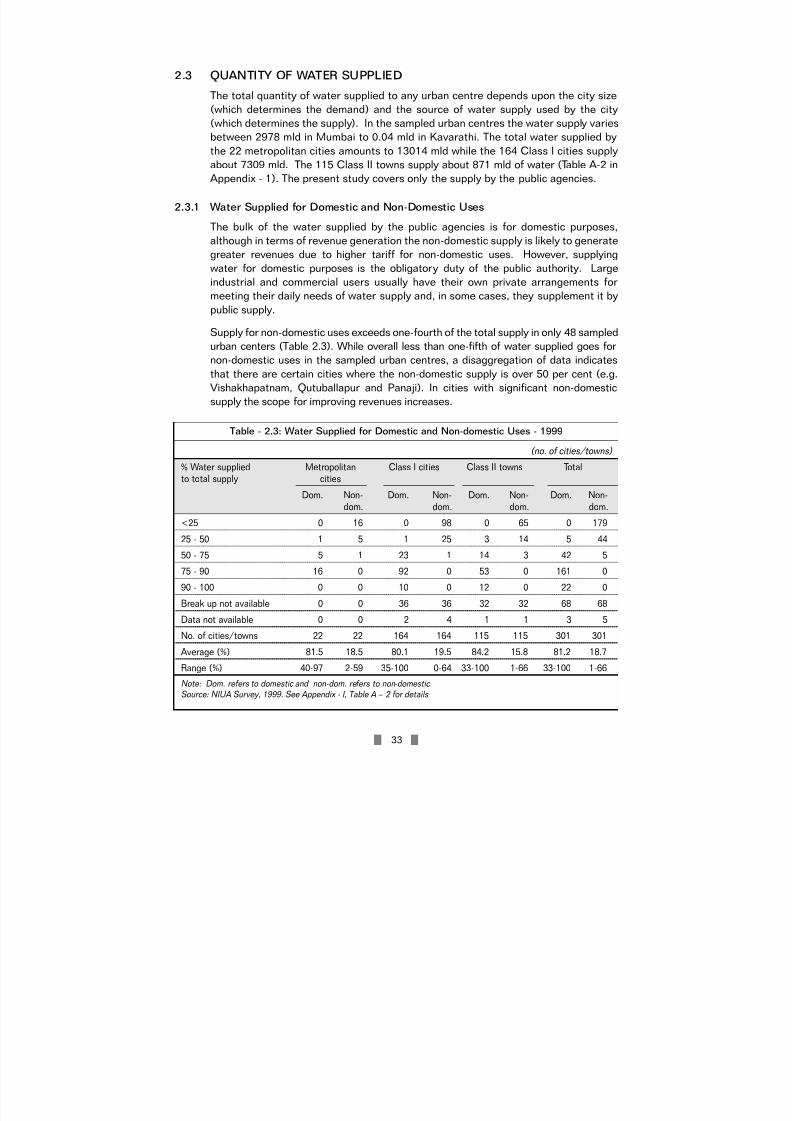
7/21/2019 Status Watersupply
http://slidepdf.com/reader/full/status-watersupply 53/869
33
2.3 QUANTITY OF WATER SUPPLIED
The total quantity of water supplied to any urban centre depends upon the city size
(which determines the demand) and the source of water supply used by the city
(which determines the supply). In the sampled urban centres the water supply varies
between 2978 mld in Mumbai to 0.04 mld in Kavarathi. The total water supplied by
the 22 metropolitan cities amounts to 13014 mld while the 164 Class I cities supplyabout 7309 mld. The 115 Class II towns supply about 871 mld of water (Table A-2 in
Appendix - 1). The present study covers only the supply by the public agencies.
2.3.1 Water Supplied for Domestic and Non-Domestic Uses
The bulk of the water supplied by the public agencies is for domestic purposes,
although in terms of revenue generation the non-domestic supply is likely to generate
greater revenues due to higher tariff for non-domestic uses. However, supplying
water for domestic purposes is the obligatory duty of the public authority. Large
industrial and commercial users usually have their own private arrangements for
meeting their daily needs of water supply and, in some cases, they supplement it bypublic supply.
Supply for non-domestic uses exceeds one-fourth of the total supply in only 48 sampled
urban centers (Table 2.3). While overall less than one-fifth of water supplied goes for
non-domestic uses in the sampled urban centres, a disaggregation of data indicates
that there are certain cities where the non-domestic supply is over 50 per cent (e.g.
Vishakhapatnam, Qutuballapur and Panaji). In cities with significant non-domestic
supply the scope for improving revenues increases.
(no. of cities/towns) % Water supplied Metropolitan Class I cities Class II towns Totalto total supply cities
Dom. Non- Dom. Non- Dom. Non- Dom. Non-dom. dom. dom. dom.
<25 0 16 0 98 0 65 0 179
25 - 50 1 5 1 25 3 14 5 44
50 - 75 5 1 23 1 14 3 42 5
75 - 90 16 0 92 0 53 0 161 0
90 - 100 0 0 10 0 12 0 22 0
Break up not available 0 0 36 36 32 32 68 68
Data not available 0 0 2 4 1 1 3 5
No. of cities/towns 22 22 164 164 115 115 301 301
Average (%) 81.5 18.5 80.1 19.5 84.2 15.8 81.2 18.7
Range (%) 40-97 2-59 35-100 0-64 33-100 1-66 33-100 1-66
Note: Dom. refers to domestic and non-dom. refers to non-domestic
Source: NIUA Survey, 1999. See Appendix - I, Table A – 2 for details
Table - 2.3: Water Supplied for Domestic and Non-domestic Uses - 1999

7/21/2019 Status Watersupply
http://slidepdf.com/reader/full/status-watersupply 54/869
34
2.3.2 Utilization of Production Capacity
Many urban centres have not been able to utilize the production capacity to the full.
This could be due to factors such as insufficient water (from source), intermittent
supply of electricity, aging pumps etc. The present study indicates that in only about
one-third of the sampled urban centres there is full utilization of the installed
production capacity. In little above one-third of the sampled urban centres thecapacity utilization is between 75 and 99 per cent while in one-fifth it is between 50
and 75. In the remaining urban centres the capacity utilization is less than 50 per cent
(Table 2.4). Better utilization of the unused production capacity may help urban
centres to improve supplies.
2.3.3 Duration of Supply
In most Indian cities water is supplied only intermittently and in the present survey
the duration of supply generally ranges between 1 and 6 hours daily.
Thiruvananthapuram, the capital of Kerala, with a per capita supply of 308 lpcd, has
24 hours supply. In the sampled urban centers, 15 per cent have duration of supply
of less than one hour while in 42 per cent of the urban centres the duration is
between 1 to 4 hours. Only in 13 per cent of the sampled urban centres the duration
of supply exceeds 6 hours (Table 2.5).
In some of the sampled urban centres severe water shortages have led to a
drought like condition where water supply has been highly rationed. For
instance, in Surendranagar, water is supplied for only half-an-hour once in six
days while in Gondal water is supplied for 20 minutes once in four days (in
1999). Water shortages have been mainly reported from the states of Gujarat,
Tamil Nadu, Karnataka and Rajasthan (see Table AX-2.1at the end of this
chapter). The availability of water (and electricity) and the capacity centers,
determine the duration of the supply system, rather than the size class of urban
of supply.
(no. of cities/towns)
Percentage Metropolitan Class I cities Class II towns Total
utilization cities
No. % No. % No. % No. %
> 100 0 0 1 1 3 3 4 1
100 5 23 48 30 36 31 89 30
75 to <100 12 55 60 36 34 29 106 35
50 to <75 2 9 33 20 24 21 59 20
< 50 2 9 13 8 10 9 25 8
Data not available 1 5 9 5 8 7 18 6
Total 22 100 164 100 115 100 301 100
Source: NIUA Survey, 1999. See Appendix - I, Table A – 2 for details
Table – 2.4: Utilization of Installed Production Capacity - 1999

7/21/2019 Status Watersupply
http://slidepdf.com/reader/full/status-watersupply 55/869
35
2.3.4 Water Consumption in Metropolitan CitiesThe total water requirement in the urban areas of the country is increasing with
urbanization. Larger cities, with higher levels of consumption and huge
population base, need more water than other sizes of urban centers. The
present study shows that the total water consumed in 22 metropolitan cities is
about13014 mld (through formal supply system) for an estimated population of
about 70 million (1999). Water supply in the three largest cities Mumbai, Delhi
and Calcutta (in municipal area only) is over 6600 mld for an estimated
population of about 29 million. As against the per capita supply norm of 150 lpcd
recommended for these cities by CPHEEO, the supply is 268 lpcd in Mumbai,
218 lpcd in Delhi and 173 lpcd in Calcutta (Table 2.6). In comparison, the 164
sampled Class I cities consume only 7309 mld of water for an estimatedpopulation of about 59 million while the 116 sampled Class II towns consume
871 mld of water for a population of about 11 million. Clearly then, limiting the
city size would have a bearing on the water requirement of urban areas. Since
it has not been possible to restrict the growth of large cities, distant water
sources have to be tapped at high cost to keep the citizens healthy and the
economic activities flourishing.
An examination of the ratio of water consumed to population, amongst metropolitan
cities, indicates that Pune, Mumbai and Delhi consume a larger proportion of water
than the proportion of population residing in them. Pune, with only 3 per cent of the
metropolitan population consumes 5 per cent of the water consumed in metropolitancities (1.56 times the metropolitan average) while Greater Mumbai with 16 per cent
of the population consumes 23 per cent of the water (1.48 times the metropolitan
average). Delhi with 17 per cent of the population consumes 20 per cent of the water
(1.2 times the metropolitan average).
(no. of cities/towns)
Duration of supply (hours/ day) Metropolitan Class I Class II Total %
cities cities towns
< 1 0 2 1 3 1
1 to <2 3 18 20 41 14
2 to < 4 8 50 39 97 32
4 to <6 3 26 17 46 15
6 and above 5 47 19 71 24
Uncertain/ variable/ non-daily 3 21 19 43 14
No. of responding cities/ towns 22 164 115 301 100
Range (hours/day) 1-8 1-24 1-12
Source: NIUA Survey, 1999. See Appendix - I, Table A – 2 for details
Table - 2.5: Duration of Supply (1999)

7/21/2019 Status Watersupply
http://slidepdf.com/reader/full/status-watersupply 56/869
36
2.4 NORMS FOR WATER SUPPLY
Water is basic to survival and well-being and, therefore, adequate quantity of waterof potable quality must be provided to all. Water needs may be broadly classified into
domestic and non-domestic. Domestic needs include water for drinking, cooking,
washing and cleaning (utensils, clothes, house) and for use in water closet. To this,
other requirements such as watering plants/garden and washing personal vehicle
etc. may be added. Non-domestic use of water would include industrial, commercial
and institutional uses, and water used for public purposes such as fire fighting, street
washing, watering trees/public gardens etc.
City Water % consum- Estimat- % popula- Coefficient Per Per
supplied ed to total ed total tion to of % water capita capita(mld) metro- population total consumed supply to supply to
politan 1999 metropoli- to % popu- total servedwater (‘000) tan popu- lation population popula-
supply lation (lpcd) tion(lpcd)
Pune 650 4.99 2,300 3.22 1.55 283 283
Greater Mumbai 2978 22.88 11,100 15.54 1.47 268 268
Delhi 2620 20.13 12,000 16.80 1.20 218 218
Varanasi 220 1.69 1,152 1.61 1.05 191 291
Bhopal 270 2.07 1,500 2.10 0.99 180 180
Nagpur 370 2.84 2,100 2.94 0.97 176 176
Calcutta 1035 7.95 6,000 8.40 0.95 173 173
Jaipur 340 2.61 2,000 2.80 0.93 170 170
Vadodara 237 1.82 1,400 1.96 0.93 169 169
Lucknow 410 3.15 2,500 3.50 0.90 164 164
Hyderabad 682 5.24 4,163 5.83 0.90 164 164
Indore 238 1.83 1,600 2.24 0.82 149 149
Bangalore 705 5.42 5,000 7.00 0.77 141 141
Surat 320 2.46 2,300 3.22 0.76 139 139
Ahmedabad 486 3.73 3,500 4.90 0.76 139 139
Visakhapatnam 168 1.29 1,280 1.79 0.72 131 131
Kanpur 310 2.38 2,500 3.50 0.68 124 248
Kochi 84 0.65 680 0.95 0.68 124 124Ludhiana 234 1.80 2,000 2.80 0.64 117 195
Coimbatore 105 0.81 971 1.36 0.60 108 108
Chennai 461 3.54 4,363 6.11 0.58 106 106
Madurai 90 0.69 1,020 1.43 0.49 88 88
Total 13014 100 71,429 100 1.0 182 189
Source: NIUA Survey, 1999.
Table - 2.6: Ratio of Water Consumed to Population in Metropolitan Cities –1999

7/21/2019 Status Watersupply
http://slidepdf.com/reader/full/status-watersupply 57/869
37
2.4.1 CPHEEO Norms
Norms for water supply suggested by the Central Public Health and Environmental
Engineering Organisation (CPHEEO) are given in Table 2.7. These norms are to be
followed by Indian cities and towns while designing water supply schemes.
2.4.2 Ninth Five Year Plan Norms
The norms for water supply followed by the Eighth Five Year Plan which have also
been maintained for the Ninth Five Year Plan are as follows:
125 lpcd for urban areas where piped water supply and underground sewerage
systems are available.
70 lpcd for urban areas provided with piped water supply but without underground
sewerage system.
40 lpcd for towns with spot-sources/stand posts. One source for 20 families
within a maximum walking distance of 100 meters.
These norms are marginally lower than the norms suggested by CPHEEO.
2.4.3 Norms Determined by the Individual Cities
Apart from the above norms, the cities themselves fix their own norms (Table 2.8).
These norms are used by the cities/towns to project their demand for water. The city
norms are based on the water needs of the city and on the availability of water there.
As per the individual cities, the norms for metropolitan cities vary from 65 lpcd in
Vishakhapatnam to 250 lpcd in Lucknow. To what extent should the public water
supply system meet these requirements? Since potable water is required for drinking,
cooking and washing utensils, the formal water supply system should, at the least,
meet these requirements. The non-domestic requirements of water will vary
Sl. No. Classification of towns/cities Recommended maximum
watersupply levels (lpcd)
1. Towns provided with piped water supply but withoutsewerage system 70
2. Cities provided with piped water supply wheresewerage system is existing/contemplated 135
3. Metropolitan and Mega cities provided with piped
water supply where sewerage system is existing/contemplated 150
Note: i) In urban areas, where water is provided through public stand posts, 40 lpcd should be considered.
Figures exclude “Unaccounted for Water (UFW)” which should be limited to 15%.Figures include requirements of water for commercial, institutional and minor industries. However, for bulk supply such
establishments should be assessed separately with proper justification.Source: Ministry of Urban Development, Central Public Health and Environmental Engineering Organisation Manual on
Water Supply and Treatment, Third Edition – Revised and Updated (May 1999), New Delhi.
Table – 2.7: Recommended Per Capita Water Supply Levels for Designing Schemes

7/21/2019 Status Watersupply
http://slidepdf.com/reader/full/status-watersupply 58/869
38
considerably between city sizes and will depend on the type of economic activities
being carried out.
2.5 PER CAPITA WATER SUPPLY AND ITS ADEQUACY
Per capita water supply, a measure of the quantity of water available per head, is an
indicator of the water supply situation in an area. However, this indicator is highly
sensitive to changes in population, as any change in population figures will directly
affect the per capita supply figures.
The per capita supply can be calculated in at least two different ways – one, by
dividing the total water supply by the total population, and two, by dividing the total
water supply by the population covered by the formal water supply system. Both
these methods of calculation can yield different results depending upon the coverage
of population by the service (The analysis presented in this report uses the former
method of calculation of per capita supply). These per capita calculations only give
City Own norms of cities (lpcd)
Ahmedabad 170Bangalore 140
Bhopal 150
Calcutta 227
Chennai 110
Coimbatore 150
Delhi 225
Greater Mumbai 240
Hyderabad 160
Indore 200
Jaipur 180
Kanpur 200
Kochi 150
Lucknow 250
Ludhiana 200
Madurai 110
Nagpur 175
Pune 160
Surat 140
Vadodara 180
Varanasi 270
Visakhapatnam 65
Source: NIUA Survey, 1999. See Appendix - I, Table A – 3 for details
Table - 2.8: Norms for Water Supply given by Metropolitan Cities (1999)

7/21/2019 Status Watersupply
http://slidepdf.com/reader/full/status-watersupply 59/869
39
the gross availability of water per head in a city but do not indicate the intra-city
distribution of water, which in some cities is highly inequitable. It also does not
indicate the water availability to domestic consumers as these gross per capita
figures include water supplied for all uses, i.e. domestic, industrial, commercial,
institutional and public uses (fire fighting, horticultural uses etc.). Dividing the water
supplied for domestic purposes by the total population can make a refinement to the
calculation and give an indication of the per capita water availability for domestic
users. Subtracting the unaccounted for water from the total supply and using only the
net water available for the calculation of per capita supply can make a further
refinement to the calculations.
Adequacy of supply can be gauged by measuring the actual supply against the norm
for supply. Therefore, adequacy of water supply in any city will depend on the norm
used. The norms for per capita supply recommended by CPHEEO (Table 2.7) are
based on the requirements of water taking into account the existence of sewerage
system. The norm for cities provided with piped water supply where sewerage system
exists or is contemplated is 150 lpcd for metropolitan and mega cities and 135 lpcd
for other size class of urban centres. However, irrespective of the size class, all urban
centres provided with piped water supply where no sewerage system exists or is
envisaged, the recommended norm is 70 lpcd. The norm for stand-post supply is 40
lpcd. These norms, however, exclude unaccounted for water (UFW) which, as per the
CPHEEO manual, should be limited to 15 per cent. The adequacy of per capita
supply discussed below, therefore, takes into account these aspects of recommended
norms.
While norms recommended by the CPHEEO are the most widely used (by local
authorities), each city/ town also often sets its own norm, which may differ from the
norm given by the CPHEEO. For instance, while the CPHEEO recommends a norm
of 150 lpcd for metropolitan and mega cities having a sewerage system or
contemplating one, the present survey indicates that 14 of the 22 metropolitan cities
in the sample use norms that are higher than 150 lpcd (Table 2.8). However, the
present study uses only the CPHEEO norms for analyzing the adequacy of water
supply.
2.5.1 Per Capita Supply
The present survey indicates that the average per capita supply in the sampled urban
centres is 150 litres per capita per day (lpcd) with a range of 20 lpcd to 308 lpcd (with
a few exceptions of less than 20 lpcd supply, particulary, in urban centers with only
stand post supply). The metropolitan cities, with an average per capita supply of 182lpcd, have almost one-and-a-half times the average supply available in Class I cities
(124 lpcd) and over two times the average supply available in Class II towns (83 lpcd)
(Table 2.9). When an acceptable level of 15 per cent unaccounted for water is
deducted from the supply levels given above, the average per capita figure for the
sampled urban centres falls to 127 lpcd, for metropolitan cities it drops to 155 lpcd,
while for Class I cities and Class II towns the per capita supply drops to 105 lpcd and
71 lpcd respectively.

7/21/2019 Status Watersupply
http://slidepdf.com/reader/full/status-watersupply 60/869
40
2.5.2 Per Capita Domestic Supply
The per capita domestic supply has been calculated by dividing the total water
supplied for domestic purposes by the population.The per capita total supply,
calculated by using the total water supplied for all uses, does not give a clear picture
with regard to what the domestic consumers get for their use. Therefore, to
understand if water supply is adequate for domestic purposes, the per capita
domestic supply needs to be looked at. The domestic per capita supply will almost
always be less than the total per capita supply, unless an urban centre does not
supply any water for non-domestic uses.
The average per capita domestic supply in the sampled urban centers is 128 lpcd with
a range of 14 to 258 lpcd. (Table 2.10). The average domestic supply in the
(no. of cities/towns)
Per capita water supply Metropolitan Class I Class II Total %(lpcd) cities cities towns
< 40 0 7 22 29 9.6
40 to < 70 0 21 32 53 17.6
70 to <135 7 99 41 147 48.8
135 to <150 4 10 8 22 7.3
150 and above 11 26 12 49 16.3
Data not available 0 1 0 1 0.3
No. of cities/ towns 22 164 115 301 100
Average (lpcd) 182 124 83 150
Range (lpcd) 88 - 283 23-308 14 - 210 14 –308
Note: The average excludes outlyers such as 4 lpcd for Tenali and 3 lpcd for Kavarathi
Source: NIUA Survey, 1999. See Appendix - I, Table A – 3 for details
Table - 2.9: Per Capita Water Supply (1999)
(no. of cities/towns)
Per capita water supply Metropolitan Class I Class II Total %
(lpcd) cities cities towns
< 40 0 9 22 31 10
40 to <70 2 27 25 54 18
70 to <135 12 68 29 109 36
135 to <150 2 9 2 13 5150 and above 6 12 4 22 7
Data not available 0 39 33 72 24
No. of cities/ towns 22 164 115 301 100
Average (lpcd) 148 106 69 128
Range (lpcd) 53 - 226 16-258 14-177 14-258
Source: NIUA Survey, 1999. See Appendix - I, Table A – 4 for details
Table - 2.10: Per Capita Domestic Water Supply (1999)
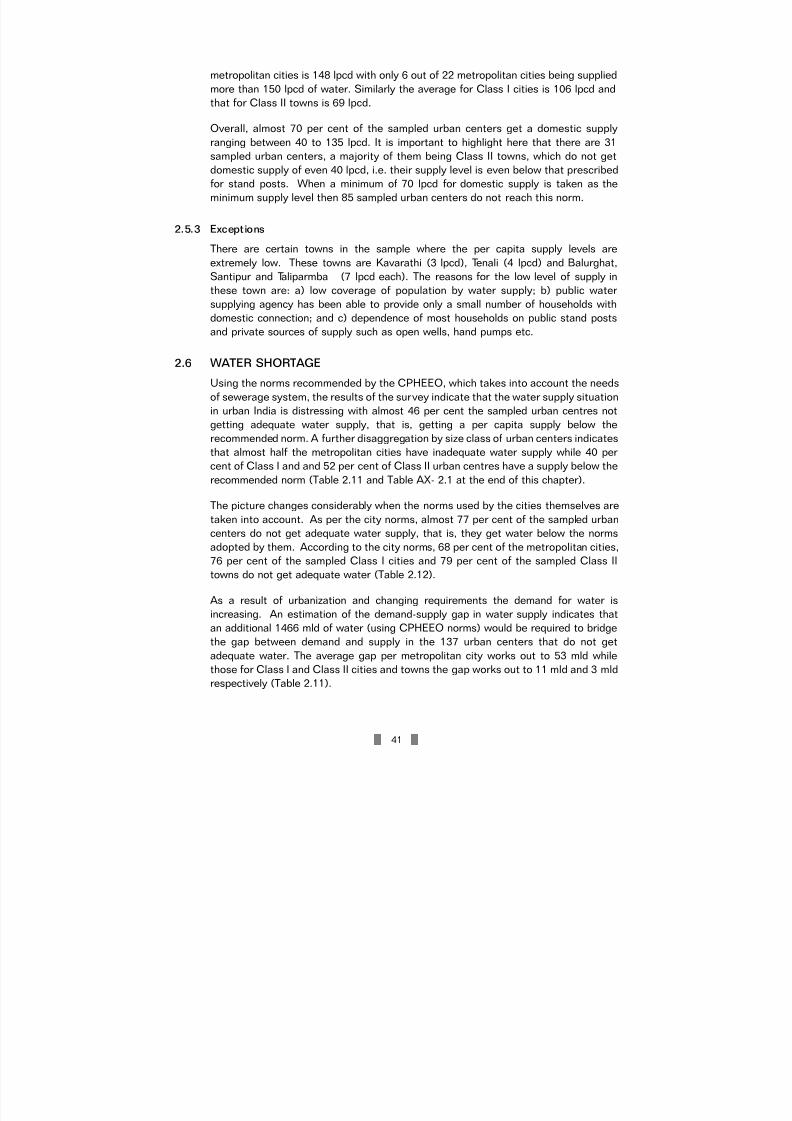
7/21/2019 Status Watersupply
http://slidepdf.com/reader/full/status-watersupply 61/869
41
metropolitan cities is 148 lpcd with only 6 out of 22 metropolitan cities being supplied
more than 150 lpcd of water. Similarly the average for Class I cities is 106 lpcd and
that for Class II towns is 69 lpcd.
Overall, almost 70 per cent of the sampled urban centers get a domestic supply
ranging between 40 to 135 lpcd. It is important to highlight here that there are 31
sampled urban centers, a majority of them being Class II towns, which do not get
domestic supply of even 40 lpcd, i.e. their supply level is even below that prescribed
for stand posts. When a minimum of 70 lpcd for domestic supply is taken as the
minimum supply level then 85 sampled urban centers do not reach this norm.
2.5.3 Exceptions
There are certain towns in the sample where the per capita supply levels are
extremely low. These towns are Kavarathi (3 lpcd), Tenali (4 lpcd) and Balurghat,
Santipur and Taliparmba (7 lpcd each). The reasons for the low level of supply in
these town are: a) low coverage of population by water supply; b) public water
supplying agency has been able to provide only a small number of households withdomestic connection; and c) dependence of most households on public stand posts
and private sources of supply such as open wells, hand pumps etc.
2.6 WATER SHORTAGE
Using the norms recommended by the CPHEEO, which takes into account the needs
of sewerage system, the results of the survey indicate that the water supply situation
in urban India is distressing with almost 46 per cent the sampled urban centres not
getting adequate water supply, that is, getting a per capita supply below the
recommended norm. A further disaggregation by size class of urban centers indicates
that almost half the metropolitan cities have inadequate water supply while 40 percent of Class I and and 52 per cent of Class II urban centres have a supply below the
recommended norm (Table 2.11 and Table AX- 2.1 at the end of this chapter).
The picture changes considerably when the norms used by the cities themselves are
taken into account. As per the city norms, almost 77 per cent of the sampled urban
centers do not get adequate water supply, that is, they get water below the norms
adopted by them. According to the city norms, 68 per cent of the metropolitan cities,
76 per cent of the sampled Class I cities and 79 per cent of the sampled Class II
towns do not get adequate water (Table 2.12).
As a result of urbanization and changing requirements the demand for water isincreasing. An estimation of the demand-supply gap in water supply indicates that
an additional 1466 mld of water (using CPHEEO norms) would be required to bridge
the gap between demand and supply in the 137 urban centers that do not get
adequate water. The average gap per metropolitan city works out to 53 mld while
those for Class I and Class II cities and towns the gap works out to 11 mld and 3 mld
respectively (Table 2.11).

7/21/2019 Status Watersupply
http://slidepdf.com/reader/full/status-watersupply 62/869
42
Using the city norms, the demand-supply gap for the 231 urban centers with a supply
below norm, works out to 4045 mld. The average gap per metropolitan city works out
to 93 mld, while for the Class I and Class II urban centers the gap is 18 and 5 mld
respectively (Table 2.12). Amongst the steps needed to bridge the gap between
demand and supply are efficiency improvements in the present system and new
investments to augment supplies.
2.7 UNACCOUNTED FOR WATER (UFW)
One of the main problems in the water supply sector today is the high level of
unaccounted for water (UFW). UFW includes both physical losses as well as revenue
losses (which include theft of water and illegal connections). The UFW in many Indian
cities is said to be as high as 40 – 50 per cent while the acceptable level is about 15
per cent (according to CPHEEO norms). Although the problem is huge, many local
governments find it difficult to realistically estimate UFW mainly due to lack of
knowledge of how to calculate UFW and also lack of equipment for determining UFW.
In addition, since meters are not installed on pipelines at the point of origin and at
consumers end (not all connections are metered), the estimation of physical leakages
as well as revenue losses is difficult.
Lack of reliable data on UFW is giving a somewhat distorted picture, which indicates
that in over three-fourths of the responding urban centres the UFW is less than 25
per cent (Table 2.13). In 22 responding metropolitan cities, almost 3007 mld of water
is unaccounted for, that is, the water is wasted and/or is unpaid for. While the UFW
Size class of Urban centres Quantity of Demand Demand - Averageurban centres with supply water supplied as per norm Supply per capita
below norm (mld) (mld) Gap (mld) gap (lpcd)
Metropolitan 11 3201.60 3782.10 580.50 23
Class I 66 2154.36 2857.10 702.74 29Class II 60 286.18 468.98 182.81 33
Total 137 5642.14 7108.18 1466.05 26
Source: NIUA Survey, 1999. See Appendix - I, Table A – 3 for details
Table - 2.11: Demand – Supply Gap (1999) Using CPHEEO Norms
Size class of Urban centres Quantity of Demand Demand - Averageurban centres with supply water supplied as per norm Supply per capita
below norm (mld) (mld) Gap (mld) gap (lpcd)
Metropolitan 15 7190.22 8586.90 1396.68 32
Class I 125 4433.08 6642.36 2209.28 52
Class II 91 599.66 1038.38 438.72 52
Total 231 12222.96 16267.64 4044.68 43
Source: NIUA Survey, 1999. See Appendix - I, Table A – 3 for details
Table - 2.12: Demand – Supply Gap (1999) Using City Norms

7/21/2019 Status Watersupply
http://slidepdf.com/reader/full/status-watersupply 63/869
43
in the three largest metropolitan cities (Mumbai, Chennai and Delhi) is between 20-
26 per cent of the total supply, in absolute terms the quantity of UFW is over 1400
mld. Just the daily physical losses in these cities would be sufficient to provide at
least one and-a-half day’s water supply to the 115 sampled Class II towns.
2.8 WATER CONNECTIONS
2.8.1 Total Water Connections
It is often recommended that all connections should be metered so as to improve
revenues from water supply as also to monitor supplies. Metering will allow charging
by the quantity of water consumed and will also allow for leakage detection.
(no. of cities/towns)
Unaccounted for Metropolitan Class I Class II Total %Water (%) cities cities towns
<15 3 95 75 173 57
15– 25 9 44 18 71 24
25 – 30 2 5 9 16 5
30 – 35 5 7 3 15 5
35 – 55 2 5 2 9 3
Data not available 1 8 8 17 6
No. of cities/ towns 22 164 115 301 100Average (%) 24 16 11 21
Range (%) 10-55 10-45 10-50 10-55
Source: NIUA Survey, 1999. See Appendix - I, Table A – 4 for details
Table - 2.13: Unaccounted for Water (1999)
(no. of cities/towns)
% Metered connections Metropolitan Class I Class II Total %
to total cities cities towns
0 2 50 44 96 32
<25 5 31 17 53 18
25 – 50 1 8 6 15 5
50 – 75 4 11 7 22 7
75 – 99 4 27 10 41 14100 3 23 19 45 15
n.a. 3 12 9 24 8
not applicable 0 2 3 5 2
Total no. of cities/ towns 22 164 115 301 100
Average (%) 60 52 39 55
Source: NIUA Survey, 1999. See Appendix - I, Table A – 5 for details
Table - 2.14: Percentage Metered Connections to Total – 1999
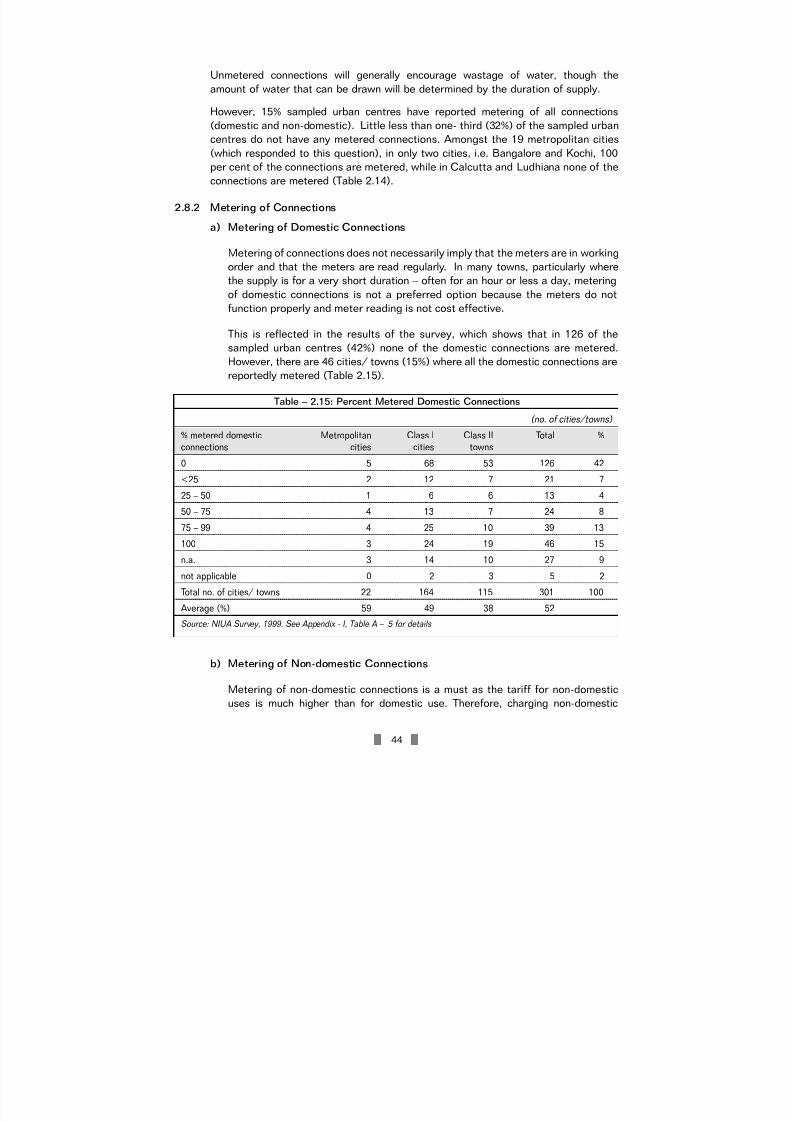
7/21/2019 Status Watersupply
http://slidepdf.com/reader/full/status-watersupply 64/869
44
Unmetered connections will generally encourage wastage of water, though the
amount of water that can be drawn will be determined by the duration of supply.
However, 15% sampled urban centres have reported metering of all connections
(domestic and non-domestic). Little less than one- third (32%) of the sampled urban
centres do not have any metered connections. Amongst the 19 metropolitan cities
(which responded to this question), in only two cities, i.e. Bangalore and Kochi, 100per cent of the connections are metered, while in Calcutta and Ludhiana none of the
connections are metered (Table 2.14).
2.8.2 Metering of Connections
a) Metering of Domestic Connections
Metering of connections does not necessarily imply that the meters are in working
order and that the meters are read regularly. In many towns, particularly where
the supply is for a very short duration – often for an hour or less a day, metering
of domestic connections is not a preferred option because the meters do not
function properly and meter reading is not cost effective.
This is reflected in the results of the survey, which shows that in 126 of the
sampled urban centres (42%) none of the domestic connections are metered.
However, there are 46 cities/ towns (15%) where all the domestic connections are
reportedly metered (Table 2.15).
b) Metering of Non-domestic Connections
Metering of non-domestic connections is a must as the tariff for non-domestic
uses is much higher than for domestic use. Therefore, charging non-domestic
(no. of cities/towns)
% metered domestic Metropolitan Class I Class II Total %
connections cities cities towns0 5 68 53 126 42
<25 2 12 7 21 7
25 – 50 1 6 6 13 4
50 – 75 4 13 7 24 8
75 – 99 4 25 10 39 13
100 3 24 19 46 15
n.a. 3 14 10 27 9
not applicable 0 2 3 5 2
Total no. of cities/ towns 22 164 115 301 100
Average (%) 59 49 38 52
Source: NIUA Survey, 1999. See Appendix - I, Table A – 5 for details
Table – 2.15: Percent Metered Domestic Connections
7/21/2019 Status Watersupply
http://slidepdf.com/reader/full/status-watersupply 65/869
45
users by the quantity of water consumed will increase revenue collection from
water charges. However, metering of all non-domestic connections is not
practiced in many urban centres.
The present survey indicates that non-domestic connections are metered in only
17 metropolitan cities while in 5 metro cities between 50 and 100 per cent of non-
domestic connections are metered. In 86 of the sampled urban centres (i.e. about
29%) none of the non-domestic connections are metered while in 128 urban
centres (i.e., about 43%) all the non-domestic connections are metered (Table
2.16). This indicates that metering of non-domestic connections needs to be
taken up on a priority basis.
2.9 SOURCE AND STORAGE OF WATER
2.9.1 Dependence on Surface and Ground Water Sources
Urban centers depend on both surface and ground water sources for supplying water.
However, the dependence on any source would be based on the availability and the
cost factors. While some urban centers may depend entirely on surface sources, such
as rivers, lakes and reservoirs, others may use a combination of surface and ground
water sources. The result of the present survey indicates that almost two-thirds ofthe urban centres depend on surface water and one-third on ground water. According
to the present survey 43 per cent of the sampled urban centres depend entirely on
surface water, 34 per cent depend entirely on ground water while 22 per cent use
both surface and ground water sources (Table 2.17).
Metropolitan cities mainly depend on surface water sources with partial dependence
on ground water sources. Amongst the 22 metropolitan cities 12 depend entirely on
(no. of cities/towns)
% Metered non-domestic Metropolitan Class I Class II Total %
connections cities cities towns
0 2 45 39 86 29
<25 0 6 3 9 3
25 – 50 0 3 1 4 1
50 – 75 2 1 2 5 2
75 – 99 3 8 4 15 5
100 12 76 40 128 43
n.a. 3 14 10 27 9
not applicable 0 11 16 27 9
Total no. of cities/towns 22 164 115 301 100
Average (%) 84 81 60 81Source: NIUA Survey, 1999. See Appendix - I, Table A – 5 for details
Table - 2.16: Percent Metered Non-Domestic Connections
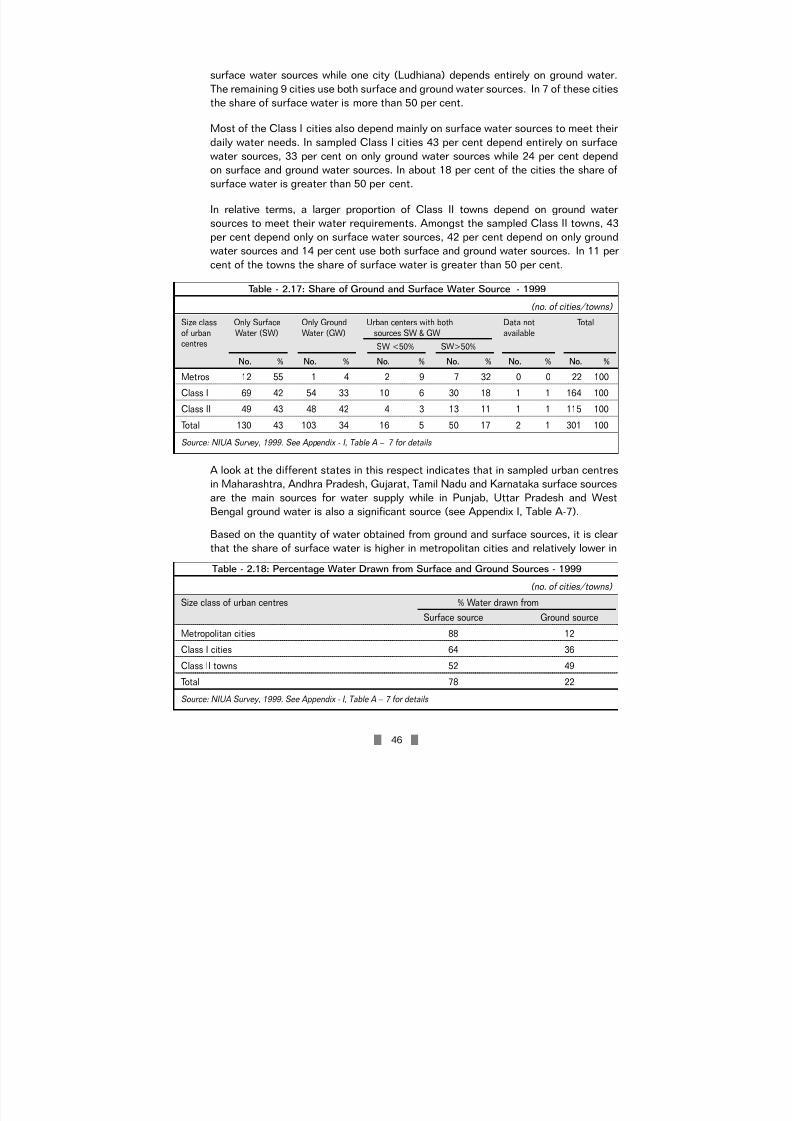
7/21/2019 Status Watersupply
http://slidepdf.com/reader/full/status-watersupply 66/869
46
surface water sources while one city (Ludhiana) depends entirely on ground water.
The remaining 9 cities use both surface and ground water sources. In 7 of these cities
the share of surface water is more than 50 per cent.
Most of the Class I cities also depend mainly on surface water sources to meet their
daily water needs. In sampled Class I cities 43 per cent depend entirely on surface
water sources, 33 per cent on only ground water sources while 24 per cent depend
on surface and ground water sources. In about 18 per cent of the cities the share of
surface water is greater than 50 per cent.
In relative terms, a larger proportion of Class II towns depend on ground water
sources to meet their water requirements. Amongst the sampled Class II towns, 43
per cent depend only on surface water sources, 42 per cent depend on only ground
water sources and 14 per cent use both surface and ground water sources. In 11 per
cent of the towns the share of surface water is greater than 50 per cent.
A look at the different states in this respect indicates that in sampled urban centres
in Maharashtra, Andhra Pradesh, Gujarat, Tamil Nadu and Karnataka surface sources
are the main sources for water supply while in Punjab, Uttar Pradesh and West
Bengal ground water is also a significant source (see Appendix I, Table A-7).
Based on the quantity of water obtained from ground and surface sources, it is clear
that the share of surface water is higher in metropolitan cities and relatively lower in
(no. of cities/towns)
Size class Only Surface Only Ground Urban centers with both Data not Total
of urban Water (SW) Water (GW) sources SW & GW availablecentres SW <50% SW>50%
No. % No. % No. % No. % No. % No. %
Metros 12 55 1 4 2 9 7 32 0 0 22 100
Class I 69 42 54 33 10 6 30 18 1 1 164 100
Class II 49 43 48 42 4 3 13 11 1 1 115 100
Total 130 43 103 34 16 5 50 17 2 1 301 100
Source: NIUA Survey, 1999. See Appendix - I, Table A – 7 for details
Table - 2.17: Share of Ground and Surface Water Source - 1999
(no. of cities/towns)
Size class of urban centres % Water drawn fromSurface source Ground source
Metropolitan cities 88 12
Class I cities 64 36
Class II towns 52 49
Total 78 22
Source: NIUA Survey, 1999. See Appendix - I, Table A – 7 for details
Table - 2.18: Percentage Water Drawn from Surface and Ground Sources - 1999

7/21/2019 Status Watersupply
http://slidepdf.com/reader/full/status-watersupply 67/869
47
Class II towns (Table 2.18). Overall, the survey result indicates that as city size
decreases the dependence on ground water increases.
Augmentation of water from surface sources, if located at great distances, is an
expensive option. However, wherever the option of using ground water is viable,
efforts should be made to maintain water tables at reasonable depth by recharging
ground water.
2.9.2 Distance to Source of Water Supply
Most settlements initially came up near sources of water, many of them on the banks
of rivers. However, rapid growth of many cities has rendered the nearby water
sources inadequate and cities have had to go further and further to get water for their
citizens. The present survey indicates that in a majority of the sampled cities the
source of water is in the city itself or adjoining it (Table 2.19).
These are cities that mainly depend on ground water source or nearby surface source.
At present some of the Class I cities are bringing water from over 100 kms. In most
such cases the source of water is a dam and therefore the distance is large (Table 2.20).
(no. of cities/towns)
Distance (km) Metropolitan Class I Class II Totalcities cities towns No. %
< 10 4 44 27 75 25
10 - 20 2 32 17 51 17
20 - 30 5 13 8 26 8
30 - 50 3 6 6 15 5
50 - 80 2 7 2 11 4
> 80 3 7 0 10 3
Data not available 3 55 55 113 37
Total 22 164 115 301 100Source: NIUA Survey, 1999. See Appendix - I, Table A – 7 for details
Table - 2. 19: Maximum Distance to Surface Sources of Water Supply (1999)
Cities Distance (km.)
Ranchi 292
Thaleserry 280Gadag-Betigeri 255
Jodhpur 209
Ajmer 140
Jalgaon 140
Solapur 103
Source: NIUA Survey, 1999. See Appendix - I, Table A – 7 for details
Table - 2.20 : Distance to Present Source of Water for Selected Urban Centres - 1999

7/21/2019 Status Watersupply
http://slidepdf.com/reader/full/status-watersupply 68/869
48
Metropolitan cities present a different picture. At present, only Mumbai goes as far
as 119 km. for getting water for its citizens. In most other cities the distance to water
source is less than 30 kms. However, the future sources of water supply for some
metropolitan cities are as far as 400 kms away (Tables 2.21).
2.9.3 Storage Capacity of Service Reservoirs
The minimum storage capacity of service reservoirs depends on many factors. The
CPHEEO Manual states that “A system supplied by pumps with 100% standby will
require less storage capacity than that with less standby provision. Similarly a system
divided into interconnected zones will require less storage capacity for all the zones
except for the zones at higher elevations”6. However, on an average, according to
CPHEEO, the storage capacity should be at least 30 per cent of the total water
supplied daily.
City Present source (km.) Future source (km.)
Mumbai 29 - 119 135 - 150
Delhi 26 320 - 400
Chennai - 400
Hyderabad 15 -18 60 - 100
Jaipur 25 120
Vishakhapatnam 15 - 73 60 - 150
Source: NIUA Survey, 1999. See Appendix - I, Table A – 7 for details
Table - 2.21: Distance to Future Sources of Water Supply for
Selected Metropolitan Cities - 1999
6 Ministry of Urban Development, ‘Manual on Water Supply and Treatment’ – Third edition – Revised and updated, CPHEEO,
New Delhi, May 1999.
(no. of cities/towns)
Storage as % Metropolitan Class I Class II Total %of Supply cities cities towns
< 10 0 16 13 29 10
10 – <30 7 49 24 80 27
30 – <50 6 40 23 69 23
50 – <75 2 24 22 48 16
75 - <100 2 7 10 19 6
100 & above 0 17 14 31 10Data not available 5 11 9 25 8
Total 22 164 115 301 100
Note: 37 sampled urban centers did not provide information on this aspect.
Source: NIUA Survey, 1999. See Appendix - I, Table A – 8 for details
Table - 2.22 : Storage Capacity of Service Reservoirs - 1999
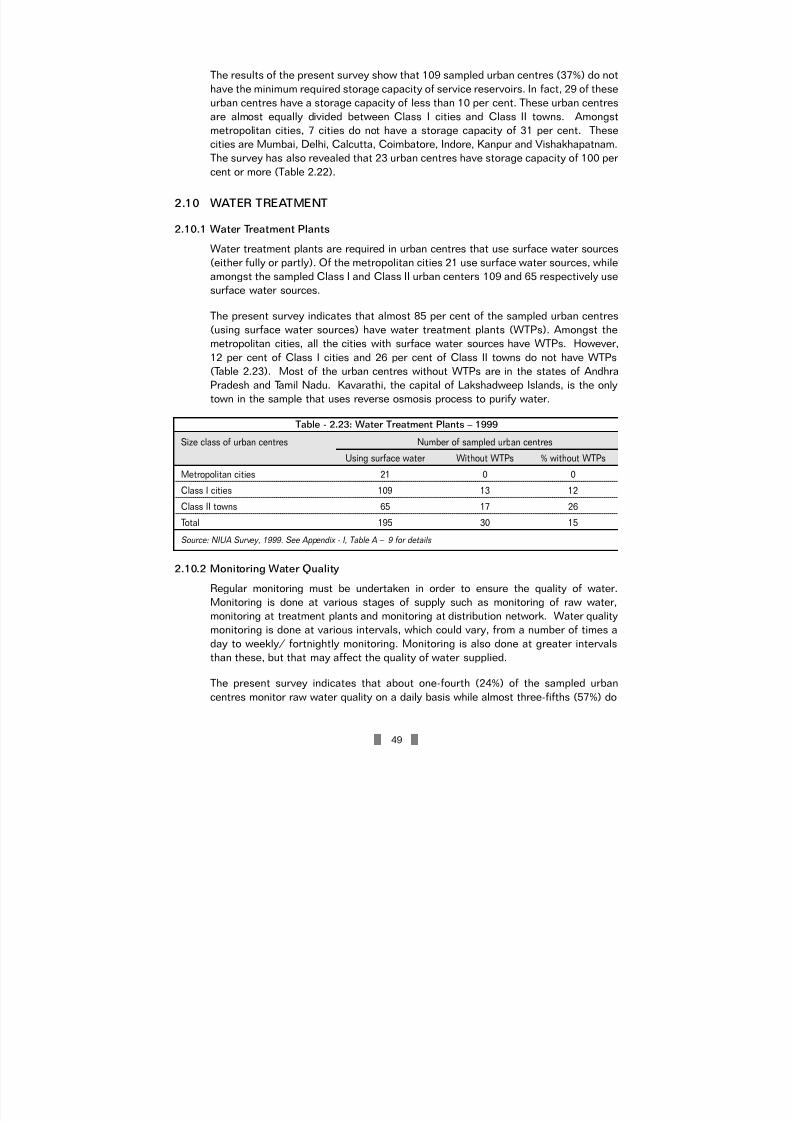
7/21/2019 Status Watersupply
http://slidepdf.com/reader/full/status-watersupply 69/869
49
The results of the present survey show that 109 sampled urban centres (37%) do not
have the minimum required storage capacity of service reservoirs. In fact, 29 of these
urban centres have a storage capacity of less than 10 per cent. These urban centres
are almost equally divided between Class I cities and Class II towns. Amongst
metropolitan cities, 7 cities do not have a storage capacity of 31 per cent. These
cities are Mumbai, Delhi, Calcutta, Coimbatore, Indore, Kanpur and Vishakhapatnam.
The survey has also revealed that 23 urban centres have storage capacity of 100 per
cent or more (Table 2.22).
2.10 WATER TREATMENT
2.10.1 Water Treatment Plants
Water treatment plants are required in urban centres that use surface water sources
(either fully or partly). Of the metropolitan cities 21 use surface water sources, while
amongst the sampled Class I and Class II urban centers 109 and 65 respectively use
surface water sources.
The present survey indicates that almost 85 per cent of the sampled urban centres
(using surface water sources) have water treatment plants (WTPs). Amongst the
metropolitan cities, all the cities with surface water sources have WTPs. However,
12 per cent of Class I cities and 26 per cent of Class II towns do not have WTPs
(Table 2.23). Most of the urban centres without WTPs are in the states of Andhra
Pradesh and Tamil Nadu. Kavarathi, the capital of Lakshadweep Islands, is the only
town in the sample that uses reverse osmosis process to purify water.
2.10.2 Monitoring Water Quality
Regular monitoring must be undertaken in order to ensure the quality of water.
Monitoring is done at various stages of supply such as monitoring of raw water,monitoring at treatment plants and monitoring at distribution network. Water quality
monitoring is done at various intervals, which could vary, from a number of times a
day to weekly/ fortnightly monitoring. Monitoring is also done at greater intervals
than these, but that may affect the quality of water supplied.
The present survey indicates that about one-fourth (24%) of the sampled urban
centres monitor raw water quality on a daily basis while almost three-fifths (57%) do
Size class of urban centres Number of sampled urban centres
Using surface water Without WTPs % without WTPs
Metropolitan cities 21 0 0
Class I cities 109 13 12
Class II towns 65 17 26
Total 195 30 15
Source: NIUA Survey, 1999. See Appendix - I, Table A – 9 for details
Table - 2.23: Water Treatment Plants – 1999

7/21/2019 Status Watersupply
http://slidepdf.com/reader/full/status-watersupply 70/869
50
not monitor the quality of raw water at all. Amongst the metropolitan cities, almost
14 cities (64%) monitor raw water quality daily while in Class I cities and Class II
towns daily monitoring of raw water is done by 37 cities (23%) and 21 towns (18%)
respectively. However, in as many as 7 metropolitan cities raw water quality is not
monitored at all. The number of Class I cities not monitoring raw water quality is 93
(57%) while the corresponding figure for Class II towns is 72 (63%) (Table 2.24).
At the treatment plant, water quality is not monitored at all in 38 (23%) urban centers
with WTPs, while in 14 (9%) it is done on a monthly basis and in 8 (5%) on a weekly
basis. In the other sampled urban centres the periodicity of monitoring water quality
at the treatment plant varies between alternate days to once in 6 months. In 18 of
the 21 metropolitan cities with WTPs, the water quality is tested daily at the
treatment plant. In 73 per cent of Class I cities (with WTPs) water quality is tested
at the treatment plant daily while the corresponding figure for Class II towns is 65 per
cent (see Appendix. I, Table A-9).
At the distribution network, water quality is monitored on a daily basis in 152 sampled
urban centres (50%) while it is not monitored at all in 59 urban centres (20%). Water
quality is monitored once a week in 20 sampled urban centers while in another 22 it is
monitored once a month. In about 40 sampled urban centers monitoring at the
distribution network is done at other frequencies (see Table 2.25).
(no. of cities/ towns)
Size class of urban centres Monitoring frequency
Nil Daily Monthly Others Total
Metropolitan cities 7 14 - 1 22
Class I cities 93 37 12 22 164
Class II towns 72 21 6 16 115
Total 172 72 18 39 301
% to total 57 24 6 13 100Source: NIUA Survey, 1999. See Appendix - I, Table A – 9 for details
Table - 2.24: Monitoring Raw Water Quality - 1999
(no. of cities/ towns)
Size class of urban Frequency of monitoringcentres Nil Daily Weekly Monthly Others n.a. Total
Metropolitan cities 1 20 - - 1 - 22
Class I cities 33 76 12 15 22 6 164
Class II towns 25 56 8 7 17 2 115
Total 59 152 20 22 40 8 301
Source: NIUA Survey,1999. See Appendix - I, Table A – 9 for details
Table - 2.25: Monitoring Water Quality At Distribution Network - 1999
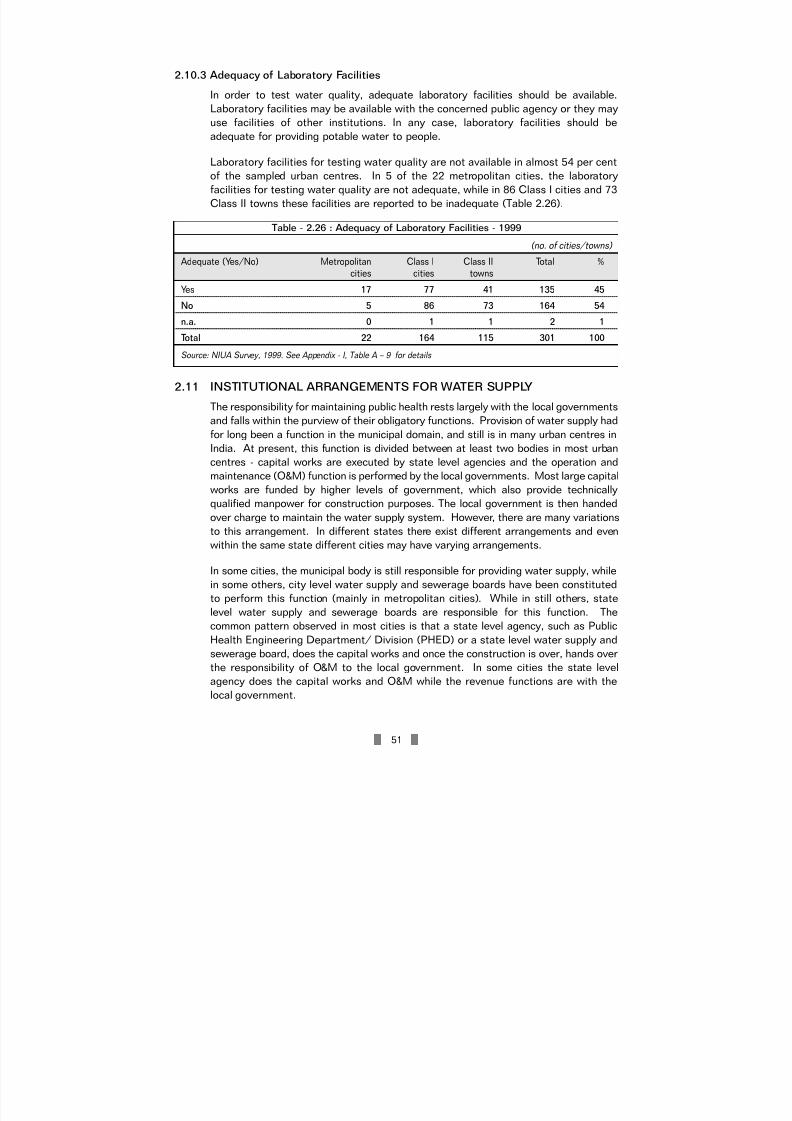
7/21/2019 Status Watersupply
http://slidepdf.com/reader/full/status-watersupply 71/869
51
2.10.3 Adequacy of Laboratory Facilities
In order to test water quality, adequate laboratory facilities should be available.
Laboratory facilities may be available with the concerned public agency or they may
use facilities of other institutions. In any case, laboratory facilities should be
adequate for providing potable water to people.
Laboratory facilities for testing water quality are not available in almost 54 per cent
of the sampled urban centres. In 5 of the 22 metropolitan cities, the laboratory
facilities for testing water quality are not adequate, while in 86 Class I cities and 73
Class II towns these facilities are reported to be inadequate (Table 2.26).
2.11 INSTITUTIONAL ARRANGEMENTS FOR WATER SUPPLY
The responsibility for maintaining public health rests largely with the local governments
and falls within the purview of their obligatory functions. Provision of water supply had
for long been a function in the municipal domain, and still is in many urban centres in
India. At present, this function is divided between at least two bodies in most urbancentres - capital works are executed by state level agencies and the operation and
maintenance (O&M) function is performed by the local governments. Most large capital
works are funded by higher levels of government, which also provide technically
qualified manpower for construction purposes. The local government is then handed
over charge to maintain the water supply system. However, there are many variations
to this arrangement. In different states there exist different arrangements and even
within the same state different cities may have varying arrangements.
In some cities, the municipal body is still responsible for providing water supply, while
in some others, city level water supply and sewerage boards have been constituted
to perform this function (mainly in metropolitan cities). While in still others, statelevel water supply and sewerage boards are responsible for this function. The
common pattern observed in most cities is that a state level agency, such as Public
Health Engineering Department/ Division (PHED) or a state level water supply and
sewerage board, does the capital works and once the construction is over, hands over
the responsibility of O&M to the local government. In some cities the state level
agency does the capital works and O&M while the revenue functions are with the
local government.
(no. of cities/towns)
Adequate (Yes/No) Metropolitan Class I Class II Total %cities cities towns
Yes 17 77 41 135 45
No 5 86 73 164 54
n.a. 0 1 1 2 1
Total 22 164 115 301 100
Source: NIUA Survey, 1999. See Appendix - I, Table A – 9 for details
Table - 2.26 : Adequacy of Laboratory Facilities - 1999

7/21/2019 Status Watersupply
http://slidepdf.com/reader/full/status-watersupply 72/869
52
In four of the metropolitan cities in the country viz., Bangalore, Chennai, Hyderbad
and Calcutta there are separate metropolitan authorities for water supply and
sewerage, which perform all the functions, related to water supply and sewerage. In
Delhi there is a city level board that performs these functions. These boards are as
follows:
City Name of city – level board
Delhi Delhi Jal Board (DJB)
Bangalore Bangalore Water Supply and Sewerage Board (BWS&SB)
Chennai Chennai Metropolitan Water Supply and Sewerage Board
(CMWS&SB)
Hyderabad Hyderabad Metropolitan Water Supply and Sewerage Board
(HMWS&SB)
Calcutta Calcutta Metropolitan Water & Sanitation Authority (CMW&SA),
since merged with CMDA
States with state-level water supply and sewerage boards or equivalent state-level
agencies are as follows:
State Name of state-level board/agency
Gujarat Gujarat Water Supply and Sewerage Board (GWS&SB)
Karnataka Karnataka Urban Water Supply and Drainage Board (KUWS&DB)
Kerala Kerala Water Authority (KWA)
Maharashtra Maharashtra Jeevan Pradhikaran (MJP)
Punjab Punjab Water Supply and Sewerage Board (PWS&SB)
Tamil Nadu Tamil Nadu Water Supply and Drainage (TWAD) Board
Uttar Pradesh Jal Nigam
2.11.1 Institutional Arrangements in Major States
In most states the state level agencies do only capital works while in some others
they perform other functions too. For instance, KWA in Kerala manages all the
functions of water supply throughout the state, KUWS&DB in Karnataka
produces water and sells it to most city governments for further distribution and
MJP in Maharashtra also performs O&M function in some cities in the state(Table 2.27).
In Rajasthan the entire function of water supply in all urban areas is with the state
PHED. Similarly, in Haryana, in all the towns, except in Faridabad where the
Corporation is responsible for water supply, it is the PHD that is responsible for
provision of water supply.

7/21/2019 Status Watersupply
http://slidepdf.com/reader/full/status-watersupply 73/869
53
In Uttar Pradesh there are seven Jal Sansthans, five of which are city level agencies
while two are regional level agencies. The cities of Kanpur, Lucknow, Varanasi,
Allahabad and Agra have city level Jal Sansthans to manage mainly O&M functions;
the two regional agencies are Kumaon Jal Sansthan and Jhansi Jal Sansthan.
2.11.2 Exceptions
There are exceptions, though, to the above pattern in many states. For instance, in
Hindupur and Srikalahasti in Andhra Pradesh, the municipality performs all the above
functions. In Kerala, Thrissur Municipal Council does the O&M and revenue related
functions in a state where KWA performs all the functions for all towns. In Madhya
Pradesh, in the towns of Satna and Rewa, PHED performs the O&M as well as
revenue related functions. In Maharashtra, the MJP performs all the functions related
to water supply in Amravati, Yavatmal, and Ballarpur.
State Capital works O & M Revenue functions
Andhra Pradesh PHED Municipal body Municipal body
Bihar PHED & Municipal body PHED & Municipal body Municipal body
Gujarat Municipal body & Municipal body Municipal bodyGWS&SB
Haryana PHD PHD PHD
Karnataka KUWS&DB Municipal body Municipal body
Kerala KWA KWA KWA
Madhya Pradesh Municipal body & Municipal body & Municipal body
PHED PHED
Maharashtra MJP & Corporation Municipal body Municipal body
Orissa PHED, Rural Water PHED, Rural Water PHED, Rural WaterSupply and Sanitation Supply and Sanitation Supply andDepartment, Housing Department Sanitation
and Urban Development DepartmentDeptt.
Punjab PWS&SB Municipal body & Municipal bodyPWS&SB
Rajasthan PHED PHED PHED
Tamil Nadu TWAD Board Municipal body & Municipal bodyTWAD Board
Uttar Pradesh Jal Nigam & Jal Sansthan & Jal Sansthan &Municipal body Municipal body Municipal body
West Bengal PHED & Municipal body PHED & Municipal bodyMunicipal body
Source: NIUA Survey,1999. See Appendix - I, Table A – 10 for details
Table - 2.27: Institutional Arrangements for Urban Water Supply in Major States

7/21/2019 Status Watersupply
http://slidepdf.com/reader/full/status-watersupply 74/869
54
2.11.3 Institutional Arrangements in Smaller States and Union Territories
In most of the smaller states and union territories the PHED or Public Works
Department (PWD) performs all the functions related to water supply. However,
there are exceptions to this pattern. For instance, in Port Blair, the Andaman PWD
does the capital works while the O&M function is shared between the PWD & the
Municipal Council, and the revenue related function is entirely with the MunicipalCouncil. In Agartala only the revenue related functions are with the local body, while
O&M and capital works are with PHED. In Chandigarh, the Corporation performs all
the functions related to water supply. In Shimla and Shillong the PHED & Irrigation
Department are responsible for capital works while O&M functions are performed by
the PHED and the municipal body. (Table 2.28).
S.N. State/ U.T. City/ town Capital works O & M Revenuefunctions
State
1 Arunachal Pradesh Itanagar PHED PHED PHED
2 Delhi Delhi Delhi Delhi DelhiJal Board Jal Board Jal Board
3 Goa Panjim PWD PWD PWD
4 Jammu & Kashmir Jammu PHED PHED PHED
5 Himachal Pradesh Shimla H.P.Irrigation Municipal MunicipalDeptt. & PHD Body & PHD Body
6 Manipur Imphal PHED PHED PHED7 Meghalaya Shillong PHED PHED & Municipal
Municipal Body Body
8 Mizoram Aizwal PHED PHED PHED
9 Nagaland Kohima PHED PHED PHED
10 Sikkim Gangtok n.a. n.a. n.a.
11 Tripura Agartala PHED PHED Municipal Body
Union Territory
1 Andaman and Port Blair PWD PWD & MunicipalNicobar Islands Municipal Body Body
2 Chandigarh Chandigarh Municipal Municipal MunicipalBody Body Body
3 Dadra & Nagar Haveli Silvassa PWD PWD PWD
4 Daman and Diu Daman PWD PWD PWD
5 Lakshadweep Kavarathi PWD PWD PWD
6 Pondicherry Pondicherry PWD PWD PWD
Source: NIUA Survey, 1999. See Appendix - I, Table A – 10 for details
Table – 2.28: Institutional Arrangements forUrban Water Supply in Smaller States and Union Territories

7/21/2019 Status Watersupply
http://slidepdf.com/reader/full/status-watersupply 75/869
55
2.12 STAFF POSITION
The staff position can be analysed by using indicators such as staff per 1000
connections or staff per km. of distribution lines. However, any attempt to analyse
whether the water utilities/ departments are overstaffed/ understaffed or have
the right number of staff would require a norm against which this can be judged.
In the absence of such norms, only the situation as it exists today can bedescribed. The staff here refers to the total staff, including managerial, technical
and O&M staff.
The present study indicates that the average staff per 1000 connections is 10.9 in the
sampled urban centres. The metropolitan cities have 14.5 staff per 1000 connections
while in the sampled Class I cities, the staff per 1000 connections averages 7.9 while
the average for Class II towns is 6.76 (Table 2. 29).
(no. of cities/ towns)
Staff/1000 connection Metropolitan Class I Class II Total %cities cities towns
<5 8 54 32 94 31
5 – 10 1 43 33 77 26
10 – 15 3 20 16 39 13
15 – 20 5 12 6 23 8
20 – 25 4 5 4 13 4
25- 50 1 10 4 15 5
Data not available 0 20 14 34 11
Data not reliable 0 0 6 6 2
Total 22 164 115 301 100
Average 14.5 7.9 6.76 10.9
Source: NIUA Survey, 1999. See Appendix - I, Table A – 11 for details
Table - 2.29: Staff Per 1000 Connections (1999)
(no. of cities/towns)
Staff/Km. of Metropolitan Class I Class II Total %
distribution line cities cities towns
< 0.5 5 48 28 81 27
0.5 - < 1.0 6 42 24 72 241.0 – 2.0 5 32 23 60 20
2.0 and above 5 22 25 52 17
n.a. 1 20 15 36 12
Total 22 164 115 301 100
Average 1.73 0.80 1.09 1.26
Source: NIUA Survey, 1999. See Appendix - I, Table A – 11 for details
Table - 2.30: Staff Per Km. of Distribution Line (1999)
7/21/2019 Status Watersupply
http://slidepdf.com/reader/full/status-watersupply 76/869
56
A disaggregation of these figures indicates that a little less than one-third of the
sampled urban centres have a staff of less than 5 per 1000 connections while another
little over one-fourth have a staff of between 5 to 10 per 1000 connections.
A look at the staff per kilometer of distribution line indicates that, on an average,
there are 1.26 staff per kilometer of distribution line in the sampled urban centers.
While metropolitan cities have more staff than this average, Class I and Class II
urban centers have less staff than the average (Table 2.30). The present survey
indicates that almost half the sampled urban centers have less than one staff per
kilometer of distribution line, with 27 per cent have less that 0.5 staff per kilometer
of distribution line.
2.13 PRIVATISATION
Involvement of private sector in the provision of water supply does not appear very
common in the sampled cities. Only 8 per cent of the cities have used private sector
for activities related to water supply. Private sector has been mainly involved in the
operation and maintenance of pipelines, treatment plants, tube-wells and pumpingstations. Private sector is also involved in billing and revenue collection activities
(Table 2.31).
Contracting has been the main mode of privatisation in these cities. While most cities
have only been able to give the cost of the activity after privatisation, which is the
payment actually being made to the contractor, only a few have calculated the cost
of the activity to the water supplying agency before the activity was privatised. This
indicates that privatisation in these cities has not been undertaken as a measure of
economy and efficiency but for reasons other than these.
Only 24 urban centres have used private sector for activities related to water
supply. One-third, that is, 8 of these urban centres are in Rajasthan, and the
remaining are in the states of Maharashtra, Karnataka, Gujarat, Uttar Pradesh
and Andhra Pradesh. Private sector participation has been used in water supply
sector since 1989, though in most of the urban centres it was introduced in 1992
and later.
Most urban centres have not provided information on cost of the activity before and
after privatisation. However, for the few cities for which this information is available
indicates that privatisation has helped in saving costs. For instance, in Ludhiana
maintenance of tube-wells has helped in cost savings of Rs. 5.5 lakhs and in Nashik
a cost saving of Rs. 8.45 lakhs has been achieved by giving maintenance of pumping
stations to private sector.
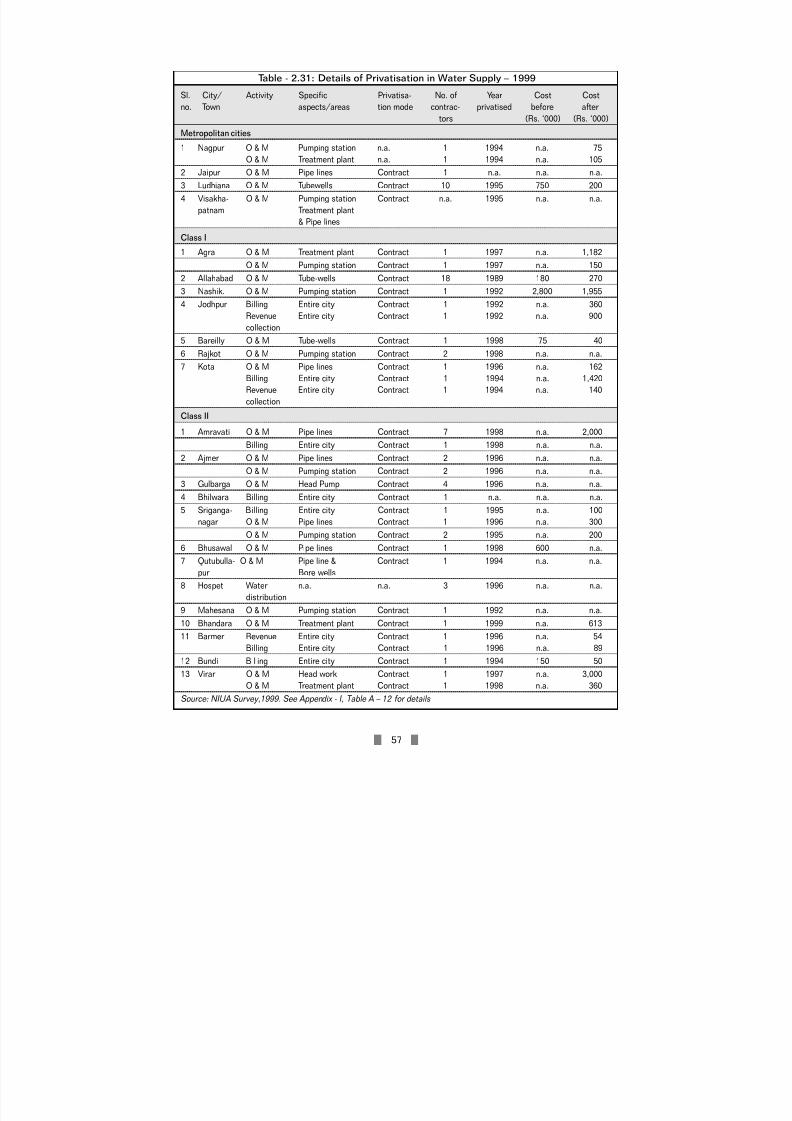
7/21/2019 Status Watersupply
http://slidepdf.com/reader/full/status-watersupply 77/869
57
Sl. City/ Activity Specific Privatisa- No. of Year Cost Cost
no. Town aspects/areas tion mode contrac- privatised before after
tors (Rs. ‘000) (Rs. ‘000)
Metropolitan cities
1 Nagpur O & M Pumping station n.a. 1 1994 n.a. 75O & M Treatment plant n.a. 1 1994 n.a. 105
2 Jaipur O & M Pipe lines Contract 1 n.a. n.a. n.a.
3 Ludhiana O & M Tubewells Contract 10 1995 750 200
4 Visakha- O & M Pumping station Contract n.a. 1995 n.a. n.a.
patnam Treatment plant
& Pipe lines
Class I
1 Agra O & M Treatment plant Contract 1 1997 n.a. 1,182
O & M Pumping station Contract 1 1997 n.a. 150
2 Allahabad O & M Tube-wells Contract 18 1989 180 270
3 Nashik. O & M Pumping station Contract 1 1992 2,800 1,955
4 Jodhpur Billing Entire city Contract 1 1992 n.a. 360
Revenue Entire city Contract 1 1992 n.a. 900
collection
5 Bareilly O & M Tube-wells Contract 1 1998 75 40
6 Rajkot O & M Pumping station Contract 2 1998 n.a. n.a.
7 Kota O & M Pipe lines Contract 1 1996 n.a. 162
Billing Entire city Contract 1 1994 n.a. 1,420
Revenue Entire city Contract 1 1994 n.a. 140
collection
Class II
1 Amravati O & M Pipe lines Contract 7 1998 n.a. 2,000
Billing Entire city Contract 1 1998 n.a. n.a.
2 Ajmer O & M Pipe lines Contract 2 1996 n.a. n.a.
O & M Pumping station Contract 2 1996 n.a. n.a.
3 Gulbarga O & M Head Pump Contract 4 1996 n.a. n.a.
4 Bhilwara Billing Entire city Contract 1 n.a. n.a. n.a.
5 Sriganga- Billing Entire city Contract 1 1995 n.a. 100
nagar O & M Pipe lines Contract 1 1996 n.a. 300
O & M Pumping station Contract 2 1995 n.a. 200
6 Bhusawal O & M Pipe lines Contract 1 1998 600 n.a.
7 Qutubulla- O & M Pipe line & Contract 1 1994 n.a. n.a.
pur Bore wells
8 Hospet Water n.a. n.a. 3 1996 n.a. n.a.
distribution
9 Mahesana O & M Pumping station Contract 1 1992 n.a. n.a.
10 Bhandara O & M Treatment plant Contract 1 1999 n.a. 613
11 Barmer Revenue Entire city Contract 1 1996 n.a. 54
Billing Entire city Contract 1 1996 n.a. 89
12 Bundi Billing Entire city Contract 1 1994 150 50
13 Virar O & M Head work Contract 1 1997 n.a. 3,000
O & M Treatment plant Contract 1 1998 n.a. 360
Source: NIUA Survey,1999. See Appendix - I, Table A – 12 for details
Table - 2.31: Details of Privatisation in Water Supply – 1999
7/21/2019 Status Watersupply
http://slidepdf.com/reader/full/status-watersupply 78/869
58
2.14 WATER TARIFF
2.14.1 Charging for Water
Tariff for water should ideally cover not only the cost of operation and maintenance
of the system but also the capital replacement cost. However, in most Indian cities
and towns even the operation and maintenance cost is not recovered. Water isconsidered to be an essential good and therefore, to be either provided at very low
rates or even free of cost. The rates fixed are also not revised frequently to reflect
the prevailing costs, widening the gap between the cost of production and tariff
charged. The present survey, however, reveals that this situation has undergone
some change and that many cities and towns have revised their tariff in the 1990s.
Water is charged for in three ways:
Through consumption based tariff
Through flat rates
Through water taxes
Tariff for water supply varies considerably between cities and between states.
Water tariff is different for domestic and non-domestic uses. The tariff is generally
much higher for industrial and commercial uses than for domestic use.
2.14.2 Types of Water Tariff
Water connections (domestic and non-domestic) can be of two types - metered and
unmetered. Water tariff for metered connections is consumption based, i.e. based on
the quantity of water consumed. Water tariff for unmetered connections is a flat rate
(fixed amount), which is not related to the quantity of water consumed.
a) Metered Rates
Consumption based water rates for metered connections are of two types:
a uniform volumetric rate per kilo litre (kl i.e.1000 litres) for the entire quantity
of water consumed in a month; and
an increasing block tariff (IBT) or slab based rate with higher rate per kilo litre
for higher quantities of water consumed per month, with a minimum monthly
fixed charge in some cities.
Uniform volumetric rate is a single rate per kilolitre of water for the entire
quantity of water consumed per month through a single connection, applied
uniformly to large as well as small consumers. Therefore, the monthly bill, where
this rate is used, is directly proportional to the quantity of water consumed.
On the other hand, IBT differentiates between the low end users and the high end
users and often cross-subsidises low end users by high end users. In IBT it is

7/21/2019 Status Watersupply
http://slidepdf.com/reader/full/status-watersupply 79/869
59
assumed that the poorest would have a consumption, which will generally not
exceed the first block, and so they will pay the lowest rates. However, the lowest
block, though it generally varies between 10 kl. to 25 kl., can be as high as 50 kl.
(e.g. Coimbatore). Most domestic consumers in the last case would fall in the
first block itself, while in others they may go upto the second or the third blocks.
So IBT needs to be studied in detail to know whether subsidies are being targeted
properly.
b) Unmetered Rates
Flat rate for unmetered connections can be grouped into four categories. These
categories are:
based on ferrule size of connection;
based on the number of taps in a house;
a fixed flat rate; and
a variable flat rate based on the annual rateable value (ARV) of property.
Ferrule based rates depend on the ferrule size (i.e. the diameter) of the
connection. Most domestic connections are only of half-inch diameter; larger
ferrule size connections are generally taken by large consumers such as
apartment blocks. Ferrule based rates are common in only a few states.
Tap based rates depend upon the number of taps in a house. Generally, the rate
for the first tap is higher than the rate for additional taps. These rates are much
less commonly used in the sampled urban centers than the ferrule based rates.
The fixed flat rate, charged either annually or at lesser intervals, is the most
common method of charging for water (for unmetered connections). The basis of
this flat rate is not explicitly stated but could be based on ferrule size, or the
duration of supply or some other basis known to local authorities.
Water tax, charged in a few urban centers in the sample, is a certain percentage
of the property tax. This ARV based charge for unmetered connections is not very
common in the sampled urban centers. However, the survey reveals that in some
urban centres a flat rate is charged but it is called water tax. While in yet other
cases, a flat rate, which is actually based on ferrule size but not explicitly stated,
so, is called water tax and not a water charge. These variations in the
nomenclature used for flat rates sometimes make it difficult to classify them (as
water tax or water charge).
Tariff for non-domestic uses, in some cities, are very elaborate. Cities
differentiate between different types of non-domestic uses in a fairly detailed
manner and charge different water rates for different uses. The schedule of tariff
for large cities often follows an elaborate categorisation by uses and the scale of

7/21/2019 Status Watersupply
http://slidepdf.com/reader/full/status-watersupply 80/869
60
activity. For instance, the water rates are different for small eating-places, big
restaurants and hotels. Domestic tariff is also fairly elaborate in larger cities
where there are individual houses as well as large apartment blocks. Tariff is
often higher for apartment blocks than for individual houses mainly on account of
larger ferrule size of connections. Water rates are also different for treated and
untreated water and for supplies within city limits and outside city limits.
Tariff for domestic connections are often significantly lower than those for non-
domestic connections, particularly industrial and commercial connections. There
is a cross-subsidy within the water sector whereby domestic consumers are
subsidised by industrial and commercial consumers. The extent of cross-subsidy
varies, though on an average industrial consumers pay between 2 to 10 times
higher tariff than domestic consumers. While in many cities in the sample,
industrial and commercial users are charged the same rate, institutional users are
often charged a different rate which may be the same as domestic rate or a rate
that is lower than the industrial and commercial rates.
With a few exceptions, stand posts are supplied water free of charge. In some
cities, such as Mumbai and Hyderabad, a system of metering of stand post
supplies is being introduced.
c) Water Tax
Water tax, in the sampled urban centres, is levied mainly in the states of Andhra
Pradesh, Tamil Nadu, Uttar Pradesh, Maharashtra, and Madhya Pradesh with a
few cities of Gujarat and Karnataka also levying water tax. The rate of water tax
varies from 3.5 per cent to 25 per cent in the sampled urban centres. Mumbai
levies a water tax of 50 per cent of the rateable value of the property.
2.14.3 Water Tariff in Metropolitan Cities
A comparison of tariff used by different metropolitan cities is made somewhat
difficult by the non-uniformity of structure. Each city uses a slightly different
structure such as different blocks in IBT or different ferrule sizes (see Appendix I) or
an entirely different basis of charging, such as property tax based rates. Despite
these, a broad overview of the tariff structure and rates is presented below.
a) Domestic Metered Rates
i) Uniform Volumetric Rates
In 12 of the 22 sampled metropolitan cities uniform volumetric rates are
charged for metered connections. Most metropolitan cities charge a rate
ranging between Rs. 2.00 and Rs. 3.50 per kl. per month. Only two
metropolitan cities viz., Madurai and Vishakhapatnam charge Rs. 5.00 per kl.
per month from their domestic consumers.
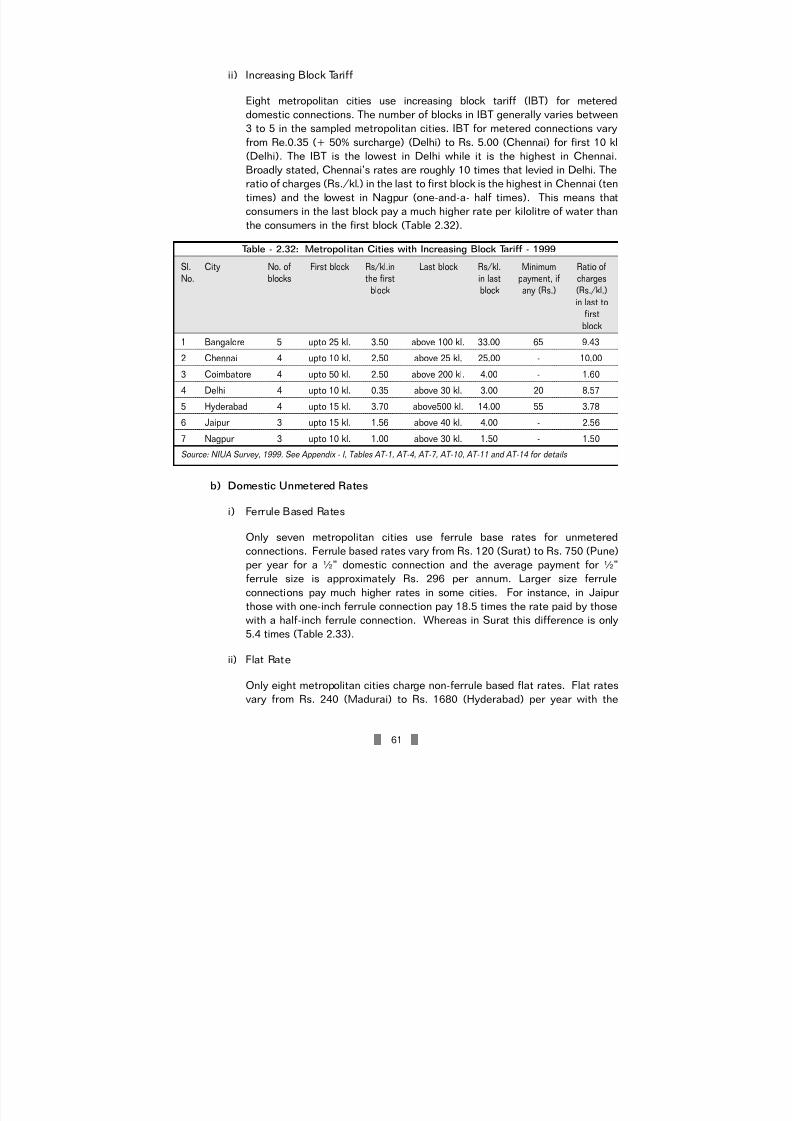
7/21/2019 Status Watersupply
http://slidepdf.com/reader/full/status-watersupply 81/869
61
ii) Increasing Block Tariff
Eight metropolitan cities use increasing block tariff (IBT) for metered
domestic connections. The number of blocks in IBT generally varies between
3 to 5 in the sampled metropolitan cities. IBT for metered connections vary
from Re.0.35 (+ 50% surcharge) (Delhi) to Rs. 5.00 (Chennai) for first 10 kl
(Delhi). The IBT is the lowest in Delhi while it is the highest in Chennai.
Broadly stated, Chennai’s rates are roughly 10 times that levied in Delhi. The
ratio of charges (Rs./kl.) in the last to first block is the highest in Chennai (ten
times) and the lowest in Nagpur (one-and-a- half times). This means that
consumers in the last block pay a much higher rate per kilolitre of water than
the consumers in the first block (Table 2.32).
b) Domestic Unmetered Rates
i) Ferrule Based Rates
Only seven metropolitan cities use ferrule base rates for unmetered
connections. Ferrule based rates vary from Rs. 120 (Surat) to Rs. 750 (Pune)
per year for a ½” domestic connection and the average payment for ½”
ferrule size is approximately Rs. 296 per annum. Larger size ferrule
connections pay much higher rates in some cities. For instance, in Jaipur
those with one-inch ferrule connection pay 18.5 times the rate paid by thosewith a half-inch ferrule connection. Whereas in Surat this difference is only
5.4 times (Table 2.33).
ii) Flat Rate
Only eight metropolitan cities charge non-ferrule based flat rates. Flat rates
vary from Rs. 240 (Madurai) to Rs. 1680 (Hyderabad) per year with the
Sl. City No. of First block Rs/kl.in Last block Rs/kl. Minimum Ratio ofNo. blocks the first in last payment, if charges
block block any (Rs.) (Rs./kl.)
in last tofirst
block
1 Bangalore 5 upto 25 kl. 3.50 above 100 kl. 33.00 65 9.43
2 Chennai 4 upto 10 kl. 2.50 above 25 kl. 25.00 - 10.00
3 Coimbatore 4 upto 50 kl. 2.50 above 200 kl. 4.00 - 1.60
4 Delhi 4 upto 10 kl. 0.35 above 30 kl. 3.00 20 8.57
5 Hyderabad 4 upto 15 kl. 3.70 above500 kl. 14.00 55 3.78
6 Jaipur 3 upto 15 kl. 1.56 above 40 kl. 4.00 - 2.56
7 Nagpur 3 upto 10 kl. 1.00 above 30 kl. 1.50 - 1.50
Source: NIUA Survey, 1999. See Appendix - I, Tables AT-1, AT-4, AT-7, AT-10, AT-11 and AT-14 for details
Table - 2.32: Metropolitan Cities with Increasing Block Tariff - 1999

7/21/2019 Status Watersupply
http://slidepdf.com/reader/full/status-watersupply 82/869
62
average charge working out to approximately Rs. 668 per year (Table 2.34).
c) Non-Domestic Tariff
The non-domestic tariffs are of two types – in some cities all the non-domestic
uses are clubbed together under one head “non-domestic ”, while in other cities
non-domestic uses are broken up into industrial, commercial and institutional
uses. In yet other cities, industrial tariff has been separated while tariff for all theother non-domestic uses have been clubbed together.
A strict comparison of rates is difficult, as explained earlier, due to different
blocks used by different cities. Broadly though, Coimbatore has the lowest rates
for non-domestic supply of Rs. 5.00 per kl. upto 50 kl. per month. Bangalore has
the highest rates in this category with the base block rate being Rs. 33 per kl.
upto 10 kl.
(in Rs. /year)
Sl. No. City Ferrule size1/2” (15mm) 3/4” (20mm) 1” (25mm)
1 Calcutta 120 480 780
2 Jaipur min. 240 min. 1440 min. 4440
3 Kanpur min. 360 - 1200 min. 540 - 1800 min. 840 - 2400
4 Nagpur 300 600 -
5 Pune 750 1500 4000
6 Surat 120 252 648
7 Vadodara 180 720 1440
Average 296 544 1059
Source: NIUA Survey, 1999. See Appendix- I, Tables AT – 2, AT-7, AT-10, AT-12, & AT-13 for details
Table - 2.33: Metropolitan Cities With Ferrule Based Rates - 1999
Sl. No. Metro cities Charges/ year (in Rs.)
1 Bhopal 720
2 Chennai 600
3 Coimbatore 300
4 Hyderabad 1680
5 Indore 720
6 Ludhiana 600
7 Madurai 240
8 Visakhapatnam 480
Average 667
Source: NIUA Survey, 1999. See Appendix - I, Tables AT–1, AT-6, AT-9, AT-11 for details
Table - 2.34: Meropolitan Cities With Flat Rates - 1999

7/21/2019 Status Watersupply
http://slidepdf.com/reader/full/status-watersupply 83/869
63
i) Industrial Tariff
The industrial tariff in the metropolitan cities varies from Rs. 8.00 (Surat) to
Rs. 22 per kl. per month (Indore) for metered connections. For unmetered
industrial connections the minimum tariff varies from Rs. 5760 per annum
(Kanpur) to Rs. 25200 per annum (Vadodara) for a 25 mm connection. Non-
ferrule based flat rate for industrial connections vary from Rs. 1200(Ludhiana) to Rs. 4800 per annum (Chennai). In Ahmedabad, the industrial
connections are charged 25-30 per cent of annual rateable value or a
minimum of Rs. 720 per annum.
2.14.4 Water Tariff in Major States
a) Andhra Pradesh
In Andhra Pradesh, the tariff for domestic metered connections varies from Rs.
1.50 per kl. in Nellore to Rs. 5.75 per kl. in Vijayawada (Table 2.35). Industrial
tariff for metered connections varies between Rs. 10.00 per kl. in Warangal to Rs.
15.00 per kl. in Tirupati. The tariff for metered industrial connections is almost
six times higher than the domestic rate in Nellore while it is about two-and-a-half
times the domestic rate in Vishakhapatnam. The flat rate tariff for unmetered
domestic connections varies from Rs. 360 per annum in Srikakulam to Rs. 720 per
annum in Warangal.
The domestic water connection charges mostly range between Rs. 4000 and Rs.
6000, though there are exceptions to this. In Hyderabad the connection charges
vary between Rs. 900 to Rs. 40,000 depending on the size of pipe and the size of
the plot. Tariff revisions in most of the sampled urban centres were done in 1999
(see Appendix – I, Table AT-1 for details).
Sl. State Metered Unmetered
No. Uniform volumetric rate (in Rs./kl.) Flat rate (in Rs./ annum)
Domestic Industrial Domestic Industrial
Min. Max. Min. Max. Min. Max. Min. Max.
1 Andhra Pradesh 1.50 5.75 10.00 15.00 360 720 -
2 Gujarat 1.50 5.00 8.00 25.00 120 300 360 - 6300 (Fr.)
3 Haryana 1.00 2.50 125 - 200 (Fr.) -
4 Karnataka 1.25 3.50 - 360 540 2160
5 Madhya Pradesh 0.33 3.00 2.20 22.00 144 720 480 3600
6 Maharashtra 1.00 5.75 8.00 28.00 160 806 213 3576
7 Punjab 1.20 2.50 240 360 360 1200
8 Tamil Nadu 1.00 5.00 3.75 20.00 240 816 480 4800
9 Uttar Pradesh 0.18 3.00 - - -
Note: Fr. refers to ferrule based rates
Source: NIUA Survey, 1999. See Appendix - I, Tables AT– 1,2,3,4,6,7,9,11 & 12 for details
Table - 2.35: Domestic and Industrial Tariff in Selected States – 1999

7/21/2019 Status Watersupply
http://slidepdf.com/reader/full/status-watersupply 84/869
64
b) Gujarat
In the sampled urban centres of Gujarat, the tariff for domestic metered
connections varies from Rs. 1.50 per kl. (Vadodara) to Rs. 5 per kl. (Bharuch).
Industiral tariff for metered connections varies between Rs. 8.00 (Surat) to Rs.
25.00 per kl. (Jamnagar) (Table 2.35). The tariff for metered industrial connections
is four times the domestic rate in Surat while they are seven times in Vadodara.
The tariff for unmetered connections based on ferrule size varies considerably
between cities ranging from Rs. 60 per annum for a ½” domestic connection in
Anand to Rs. 360 in Bhuj. The tariff for industrial unmetered ferrule based
connections varies between Rs. 360 per annum for a ½” connection in Palanpur
to Rs.6300 in Vadodara. The variation between domestic and industrial tariff is
as high as 35 times in Vadodara and as low as three times in Palanpur for a ½”
connection. The flat rate for unmetered connections (non-ferrule based) varies
from Rs. 120 per annum in Mehsana to Rs. 300 in Bhavnagar. The variation
between domestic and industrial tariff is as high as 42 times in Bhavnagar while
it is as low as two times in Junagadh.
The water connection charges in the state are highly variable with each city
charging a different amount. The connection charges in the sampled cities/
towns vary from Rs. 25 to Rs. 400 in Palanpur to Rs. 100 to Rs. 20000 in
Ahmedabad for various sizes of connections.
The water tariff was last revised in Surendranagar in 1976 though in most other
sampled cities/towns in the state the tariff was revised either in late 1980s or in
1990s (see Appendix – I, Table AT-2 for details).
c) Haryana
Similar to Punjab, Haryana too has a uniform water tariff for most of its cities and
towns. The domestic metered water rate is Re. 1.00 per kl. per month in almost
all the sampled cities and towns (Table 2.35). Industrial tariff is two-and-a-half
times the domestic rate at Rs. 2.50 per kl. per month while the commercial water
tariff is Rs. 2.00 per kl. per month. Unmetered domestic connections are charged
both by tap rates as well as by ferrule size of connection. The tap rate charges
are Rs. 50 per month for one tap and Rs. 80 per month for more taps in Rohtak
while the ferrule size based rates vary between Rs. 125 for 15 mm connection and
Rs. 200 per year for connections above 20 mm.
The connection rates for all uses are fixed at Rs. 300. The water tariff in the
sampled urban centres of the state was revised mostly in 1993 and 1994 (see
Appendix – I, Table AT-3 for details).
d) Karnataka
In Karnataka, larger cities have IBTs for water supply while almost all the other
sampled urban centres charge a fixed monthly amount for water. The cities with

7/21/2019 Status Watersupply
http://slidepdf.com/reader/full/status-watersupply 85/869
65
IBTs include Bangalore, Mysore, Hubli-Dharwad and Mangalore while Belgaum
has ferrule-based rates. The minimum rates for domestic metered connections
are Rs. 3.50 per kl. in Bangalore, Rs.1.25 in Mysore and Hubli-Dharwad and Rs.
1.40 per kl. in Mangalore. The fixed rates are generally Rs. 360 or Rs. 540 per
year (Table 2.35, also see Appendix – I, Table AT-4 for details).
e) Kerala
Kerala uses a block tariff structure for charging for water. However, the charging
system in Kerala is different to other states. Kerala charges a fixed amount for
each block and not a rate for each block. The lowest block in the state for
domestic users starts from 10 kl. with a rate of Rs. 22 and the amount increases
for every kilo litre (Table 2.35, also see Appendix – I, Table AT-5 for details).
f) Madhya Pradesh
In the sampled urban centres of Madhya Pradesh, the per kl. rate for domestic
metered connections varies between Rs. 0.33 in Satna to Rs. 3.00 in Jabalpur (Table2.35). The tariff for industrial metered connections varies from Rs. 2.20 per kl. in
Satna to Rs. 22.00 per kl. in Jabalpur. The industrial tariff for metered connections
is eleven times the domestic rate in Indore while it is less than double in Rewa.
The tariff for unmetered domestic connections varies from Rs. 144 per annum in
Rewa to Rs. 720 per annum in Bhopal. Industrial tariff for unmetered connections
varies from Rs. 480 per annum in Morena to Rs. 3,600 in Indore.
The water connection charges in Madhya Pradesh vary a great deal ranging from
Rs. 61 in Satna to Rs. 3,000 in Gwalior. The water tariff was last revised between
1997 and 1998 in most of the sampled urban centres in the state (see Appendix– I, Table AT-6 for details).
g) Maharashtra
The water tariff for domestic metered connections, in the sampled urban centres
of Maharashtra, varies from Rs. 1.50 per kl. in Mumbai to Rs. 5.75 per kl. in
Ballarpur. Industrial tariff for metered connections varies between Rs. 8.00 per
kl. in Ichalkaranji to Rs. 28.00 per kl. in Ballarpur (Table 2.35). The tariff for
metered industrial connections is eight times the domestic tariff in Nanded while
it is four times in Ichalkaranji.
The tariff for unmetered domestic connections varies from Rs. 106 per annum in
Yavatmal to Rs. 806 per annum in Amalner. The tariff for unmetered industrial
connections varies from Rs. 213 per annum in Bhandara to Rs. 3,576 per annum
in Ratnagiri.
The water connection charges varied between Rs. 21 in Chandrapur to Rs. 955 in
Bhandara. The tariff revisions in the sampled urban centres in the state were
mostly done between 1997 and 1999 (see Appendix – I, Table AT-7 for details).

7/21/2019 Status Watersupply
http://slidepdf.com/reader/full/status-watersupply 86/869
66
h) Orissa
The water tariff for domestic metered connections, in the sampled urban centres
of Orissa, varies from Rs. 1.50 per kl. in Sambalpur to Rs. 2.00 per kl. in Cuttak
and Puri. Industrial tariff for metered connections varies between Rs. 3.00 per kl.
in Sambalpur to Rs. 4.65 per kl. in Cuttak. The tariff for metered industrial
connections is about twice the domestic tariff in sampled urban centres.
The tariff for unmetered domestic connections varies from Rs. 360 per annum for
two taps in Sambalpur to Rs. 480 per annum for two taps in Cuttak, Puri and
Balangir. While in Bhadrak the tariff for unmetered domestic connections is 10%
of ARV.
The water connection charge is uniform for the sampled urban centres. Though
within an urban centre water connection charge varies from Rs. 3000 for
residential areas to Rs. 5000 for industrial and commercial areas. The tariff
revisions in the sampled urban centres in the state were done in 1996 (see
Appendix – I, Table AT-8 for details).
i) Punjab
Punjab has a uniform water tariff for most of its urban centres. Amongst the
sampled urban centres almost all domestic metered connections are charged Rs.
1.2 per kl. per month (Table 2.35). The industrial and commercial rate is double
the domestic rate i.e. Rs. 2.5 per kl. per month. The domestic unmetered rates
are by the number of taps in some cities and a fixed amount in some others. The
rate for the first tap is Rs. 20, and Rs. 7.5 for a second tap per month. Fixed flat
rate for unmetered domestic connections varies between Rs. 240 and Rs. 360 per
annum in most sampled urban centres with the exception of Ludhiana where this
rate is Rs. 600 per annum.
In Punjab, water connection charges varied from Rs. 15 in Jalandhar to Rs. 800
in Sangrur. The tariff revisions in the sampled urban centres in the state were
done between 1992 and 1999 (see Appendix – I, Table AT-9 for details).
j) Rajasthan
The urban centres of Rajasthan have a block tariff structure for domestic and non-
domestic connections. The domestic metered rates vary from Rs. 1.56 per kl to Rs.
4 per kl in different blocks while the un-metered rates vary from Rs. 240 to Rs.
1440 per year for ferrule sizes of 15mm and 20 mm. For non-domestic connectionsthe metered rates vary from Rs. 4.68 per kl. to Rs. 11.00 per kl in different blocks
while the un-metered rates vary from Rs. 612 to Rs. to Rs. 4440 for ferrule sizes
of 15mm to 25 mm (see Appendix – I, Table AT-10 for details).
k) Tamil Nadu
In the sampled urban centres of Tamil Nadu the tariff for domestic metered
connections varies from Rs. 1.00 per kl. in Ambur to Rs. 5.00 per kl. in Madurai

7/21/2019 Status Watersupply
http://slidepdf.com/reader/full/status-watersupply 87/869
67
(Table 2.35). Industrial tariff for metered connections varies from Rs. 3.75 per kl.
in Thiruvannamalai to Rs. 20.00 per kl. in Madurai. The tariff for metered
industrial connections is five times the domestic rate in Madurai while it is three
times in Thiruvannamalai.
The tariff for unmetered domestic connections varies from Rs. 240 per annum in
Madurai to Rs. 816 per annum in Puddukottai. The industrial tariff for unmetered
connections varies between Rs. 480 in Tirunelveli to Rs. 4,800 per annum in
Chennai.
The water connection charges varied from Rs. 1,000 in Madurai to Rs. 25,000 in
Salem. The water tariff was last revised between 1991 and 1999 in the sampled
urban centres in the state (see Appendix – I, Table AT-11 for details).
l) Uttar Pradesh
The water tariff in Uttar Pradesh is amongst the lowest in the country. The per kl.
rate for domestic metered connections varies from a low Rs. 0.18 in Ghazipur toRs. 3.00 in Agra (Table 2.35). The variation between domestic and industrial tariff
for metered connections varies from less than double in Saharanpur to about
eight times in Agra.
Water connection charges vary from Rs. 120 to Rs.5000 depending on size of
connection and other charges involved. Tariff revision in some cities has not been
done for many decades while in others the revision has been more recent, that is
in 1990s (see Appendix – I, Table AT-12 for details).
m) West Bengal
The urban centres of West Bengal have a ferrule based tariff structure for
unmetered domestic and non-domestic connections. The tariff ranges from Rs.
120 per annum for a ½” domestic connection in Calcutta to Rs. 360 in Darjeeling.
The annual tariff for non-domestic unmetered ferrule based connections in
Calcutta varies between Rs. 1560 per annum for a 1/8” connection to Rs.28,800
for 1”connection. The variation between domestic and industrial tariff is as high
as 60 times for a ½” connection (see Appendix – I, Table AT-13 for details).
2.15 REVENUE RECEIPTS AND REVENUE EXPENDITURE
Non-uniformity in the method of keeping municipal accounts across states and cities
makes the analysis of revenue receipts and revenue expenditure a difficult task. Urban
local governments keep accounts in different ways – some keep by departments while
others keep by major revenue expenditure heads such as establishment, electricity,
consumables and so on. This makes it difficult to segregate revenue expenditure for
a particular department. These differences in the methods of keeping accounts have
an impact on the analysis of revenue receipts and revenue expenditure presented here.

7/21/2019 Status Watersupply
http://slidepdf.com/reader/full/status-watersupply 88/869
68
Another factor which has an impact on the analysis of revenue receipts and revenue
expenditure is the fact that the financial data analysed here are not time series data,
but pertain to just one year i.e., 1997-98 financial year, which could be an unusual
year for some urban centres. However, such a large sample nullifies such differences
in the aggregate.
2.15.1 Revenue Receipts
The main sources of revenue receipts for the water supply department are water tax,
water charges, connection charges, bulk supply charges and other sources that vary
from city to city. Water tax, which is a certain percentage of property tax, is the main
source of revenue receipts for some urban centres while for some others water
charges are the main source of revenue receipts. Some urban centres levy water tax
as well as water charges. Water cess is also a source of revenue receipts for a few
urban centres. Water tax is a fixed amount that is recovered from all property tax
assessees, regardless of the quantity of water consumed. Water charge, on the other
hand, is related to consumption of water. Water charges that are fixed are not
directly related to water consumption, though they are fixed on the basis of the water
that can be consumed given the duration of supply and the ferrule size of the
connection.
Water charge is a more common source of revenue receipts than water tax in the
sampled urban centres. A larger percentage (29%) of the sampled urban centres raise
revenue through water charges than water tax (20%). However, about a third of the
urban centres (31%) raise revenues from both water charge and water tax. In the
remaining urban centres other sources of revenue receipts are more significant than
water charge and water tax7.
a) Water Charge
Water charge contributes an average of 69 per cent to the total revenue receipts
from this service in the sampled urban centres. The share of water charges to the
total revenue receipts from the service reduces with city size indicating that the
larger urban centres raise a larger proportion of revenue receipts from water
charge than water tax. Water charge is generally consumption based and
therefore, a significant share of revenue receipts from water charge is healthy for
the water supplying agency. About 74 urban centres that do not raise any
revenue receipts on this head (Table 2.36).
b) Water Tax
Water tax, on an average, contributes only about 15 per cent to the total revenue
receipts from this service. The share of water tax, to the total revenue receipts,
increases as the city size reduces (Table 2.37). This indicates that the smaller
size of urban centres rely more on tax than on charge. It is important for these
7 The analysis of revenue receipts is somewhat hampered by the fact that for some urban centres only aggregate figures of
revenue receipts are available and in some certain revenue receipt heads are clubbed together. Disaggregated figures (i.e.by individual revenue heads) are available for only 254 sampled urban centres.

7/21/2019 Status Watersupply
http://slidepdf.com/reader/full/status-watersupply 89/869
69
urban centres to switch to water charges to increase their revenue receipts from
sale of water as water tax is not an elastic source of revenue receipts.
c) Connection Charges
The share of water connection charges in the total revenue receipts from water
(no. of cities/towns)
% Revenue receipts from Metropolitan Class I Class II Total %
water charges cities cities towns
0 1 48 25 74 25
1 to <20 2 25 16 43 14
20 to <40 3 10 13 26 9
40 to <60 1 12 9 22 7
60 to <80 3 11 4 18 6
80 and above 8 39 23 70 23
Break up not available 4 9 11 24 8
Data not available 0 10 14 24 8
No. of cities/towns 22 164 115 301 100
Average (%) 74 54 42 69
Note: The total number of urban centres in the above table are 254 but the urban centres which do not generate revenues from water charges (first row) have been excluded for calculating the average. Therefore, the calculations are based only on 179 urban centres.
Source: NIUA Survey, 1999. See Appendix - I, Table A – 13 for details
Table - 2.36 : Percentage Revenue Receipts from Water Charges – 1997-98
(no. of cities and towns)
% Revenue receipts from Metropolitan Class I Class II Total %water tax cities cities towns
0 8 61 32 101 34
1 to <20 3 9 7 19 6
20 to <40 3 7 6 16 5
40 to <60 2 18 14 34 12
60 to <80 2 9 8 19 6
80 and above 1 42 23 66 22
Break up not available 3 8 11 22 7
Data not available 0 10 14 24 8
No. of cities/towns 22 164 115 301 100
Average (%) 11 25 37 15
Note: The total number of urban centres in the above table is 254 but the urban centres which do not generate revenues from water tax (first row) have been excluded for calculating the average. Therefore, the calculations are
based only on 152 urban centres.Source: NIUA Survey, 1999. See Appendix - I, Table A – 13 for details
Table - 2.37: Percentage Revenue Receipts from Water Tax - 1997-98

7/21/2019 Status Watersupply
http://slidepdf.com/reader/full/status-watersupply 90/869
70
supply averages only about 2 percent in the sampled urban centers (Table 2.38).
While some consider connection charges to be a part of revenue receipts, others
consider it to be a part of capital receipts. However, while revenue receipts from
connections charges is included in the revenue receipts in this study, the overall
results do not alter due to its inclusion, as its contribution to the total revenue
receipts from this service is insignificant.
Connection charges are the main source of revenue receipts for some urbancentres. For instance, in the sampled urban centres of West Bengal, where water
is supplied free of charge in most cities and towns, the main source of revenue
receipts is from connection charges.
2.15.2 Revenue Expenditure
Data on revenue expenditure suffers from the same problems explained earlier, i.e.
from different methods of keeping accounts. Different heads of revenue expenditure
are at times clubbed together8 or are available for the local body as a whole but not
for the water department separately. These have some impact on the revenue
expenditure analysis, though broad trends are available with the existing data.
The main heads of revenue expenditure on water supply are establishment,
electricity, consumables, repairs and replacements and certain other heads, which
vary from one city to the other.
8 Disaggregated figures for expenditure on establishment is available for 267 urban centers, while figures for expenditure on electricity, as a separate head, is available for only 130 sampled urban centers.
(no. of cities and towns)
% Revenue receipts from Metropolitan Class I Class II Total %connection charges cities cities towns
0 10 51 35 96 32
1 to <5 9 72 42 123 41
5 to <10 0 11 1 12 4
10 to <20 0 1 7 8 3
20 to <50 0 3 1 4 150 and above 0 8 4 12 4
Break up not available 3 8 11 22 7
Data not available 0 10 14 24 8
No. of cities/towns 22 164 115 301 100
Average (%) 1 7 8 2
Note: The total number of urban centres in the above table is 254 but the urban centres which do not generate
revenues from connection charges (first row) have been excluded for calculating the average. Therefore, the
calculations are based only on 158 urban centres.Source: NIUA Survey,1999. See Appendix - I, Table A – 13 for details
Table - 2.38: Percentage Revenue Receipts from Connection Charges – 1997-98
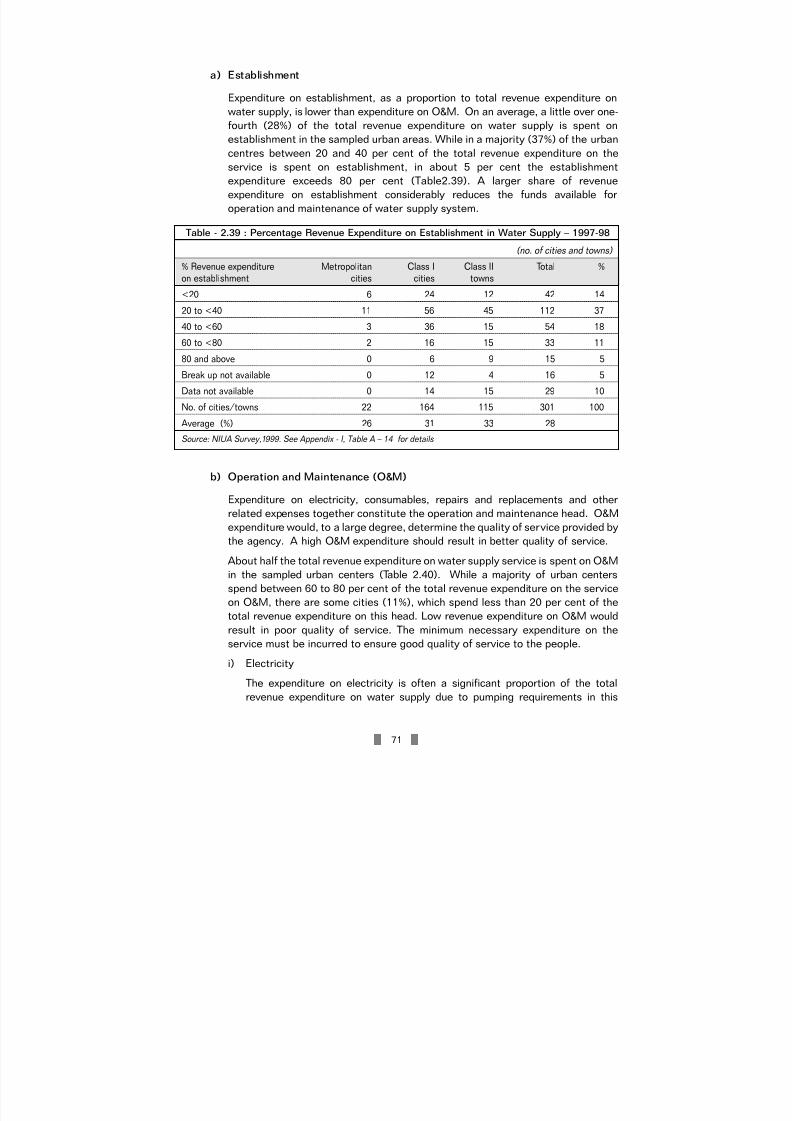
7/21/2019 Status Watersupply
http://slidepdf.com/reader/full/status-watersupply 91/869
71
a) Establishment
Expenditure on establishment, as a proportion to total revenue expenditure on
water supply, is lower than expenditure on O&M. On an average, a little over one-
fourth (28%) of the total revenue expenditure on water supply is spent on
establishment in the sampled urban areas. While in a majority (37%) of the urban
centres between 20 and 40 per cent of the total revenue expenditure on theservice is spent on establishment, in about 5 per cent the establishment
expenditure exceeds 80 per cent (Table2.39). A larger share of revenue
expenditure on establishment considerably reduces the funds available for
operation and maintenance of water supply system.
b) Operation and Maintenance (O&M)
Expenditure on electricity, consumables, repairs and replacements and other
related expenses together constitute the operation and maintenance head. O&M
expenditure would, to a large degree, determine the quality of service provided by
the agency. A high O&M expenditure should result in better quality of service.
About half the total revenue expenditure on water supply service is spent on O&M
in the sampled urban centers (Table 2.40). While a majority of urban centers
spend between 60 to 80 per cent of the total revenue expenditure on the service
on O&M, there are some cities (11%), which spend less than 20 per cent of thetotal revenue expenditure on this head. Low revenue expenditure on O&M would
result in poor quality of service. The minimum necessary expenditure on the
service must be incurred to ensure good quality of service to the people.
i) Electricity
The expenditure on electricity is often a significant proportion of the total
revenue expenditure on water supply due to pumping requirements in this
(no. of cities and towns)
% Revenue expenditure Metropolitan Class I Class II Total %on establishment cities cities towns
<20 6 24 12 42 14
20 to <40 11 56 45 112 37
40 to <60 3 36 15 54 18
60 to <80 2 16 15 33 11
80 and above 0 6 9 15 5
Break up not available 0 12 4 16 5
Data not available 0 14 15 29 10
No. of cities/towns 22 164 115 301 100
Average (%) 26 31 33 28
Source: NIUA Survey,1999. See Appendix - I, Table A – 14 for details
Table - 2.39 : Percentage Revenue Expenditure on Establishment in Water Supply – 1997-98

7/21/2019 Status Watersupply
http://slidepdf.com/reader/full/status-watersupply 92/869
72
service. On an average, the expenditure on electricity forms 36 per cent of the
total revenue expenditure on the service in the sampled urban centers (Table
2.41).
Only 199 urban centers could furnish disaggregated data on this head, the
others have given data only in a clubbed manner along with other expenses.
Not being able to segregate expenditure on electricity for water supply
department from the rest of the departments is one of the reasons for local
governments not being able to furnish data on expenditure on electricity.
Urban centers that rely on gravity would spend less on electricity as
compared to urban centers relying heavy on pumping. High expenditure on
electricity considerably increases the cost of production of water. Water
tariffs are often kept low for considerations other than cost. Making water
(no. of cities and towns)
% Revenue expenditure Metropolitan Class I Class II Total %on O&M (including cities cities towns
electricity
<20 0 7 12 19 6
20 to <40 5 17 16 38 13
40 to <60 4 43 16 63 21
60 to <80 9 53 43 105 35
80 and above 4 18 9 31 10
Break up not available 0 12 4 16 5
Data not available 0 14 15 29 10
No.of cities/towns 22 164 115 301 100
Average (%) 46 63 52 50
Source: NIUA Survey, 1999. See Appendix - I, Table A – 14 for details
Table - 2.40: Percentage Revenue Expenditure on Operation and Maintenance – 1997-98
(no. of cities and towns)
% Revenue expenditure on Metropolitan Class I Class II Total %electricity cities cities towns
<20 3 33 32 68 22
20 to <40 7 26 15 48 1640 to <60 5 36 20 61 21
60 and above 5 12 5 22 7
Break up not available 2 43 28 73 24
Data not available 0 14 15 29 10
No.of cities/towns 22 164 115 301 100
Average (%) 33 45 32 36
Source: NIUA Survey,1999. See Appendix - I, Table A – 14 for details
Table – 2.41: Percentage Revenue Expenditure on Electricity – 1997-98

7/21/2019 Status Watersupply
http://slidepdf.com/reader/full/status-watersupply 93/869
73
tariff more realistic by indexing it to electricity charges can help reduce the
revenue deficit on water supply account.
ii) Consumables and Repairs & Replacements
Consumables, such as bleaching powder, chlorine, alum etc. that are used for
treating water, are absolutely essential for making water potable. Therefore,expenditure on consumables will necessarily be incurred by all water
supplying departments/ agencies. Repairs and replacements of machinery,
pipelines etc. are also essential to keep the water supply running efficiently.
Therefore, expenditure on these two heads must be reflected in the water
supply accounts, though, often they are clubbed together. Expenditure
requirement on these heads will vary from one city to the other, depending on
the source of water and other local variations.
Expenditure on consumables and repairs & replacements do not exceed 10 per
cent of the total revenue expenditure in little less than one fourth of the
sampled urban centers while it lies between 10 to 30 per cent in about one-
third of the urban centers (Table 2.42).
2.15.3 Cost Recovery
Water supply is a service from which cost recovery is possible. However, this would
depend on the tariff structure as well as the efficiency of collection of dues in any
given city/ town. It is generally true that most water supply accounts show deficit
and the service has to be subsidized by higher levels of government to carry on
functioning. Yet there are urban centres where water supply accounts show a
positive balance with revenue receipts exceeding revenue expenditure.
(no. of cities and towns)
% Revenue Expenditure on consu- Metropolitan Class I Class II Total %
mables and repairs & replacements cities cities towns
<10 11 31 23 65 22
10 to 20 7 36 9 52 17
20 to 30 1 23 17 41 14
30 to 40 1 8 9 18 6
40 to 50 0 6 8 14 5
> 50 0 3 6 9 3
Break up not available 2 43 28 73 24
Data not available 0 14 15 29 9
No.of cities/towns 22 164 115 301 100
Average (%) 9 13 15 10
Source: NIUA Survey, 1999. See Appendix - I, Table A – 14 for details
Table - 2.42: Percentage Revenue Expenditure on
Consumables and Repairs & Replacements – 1997-98
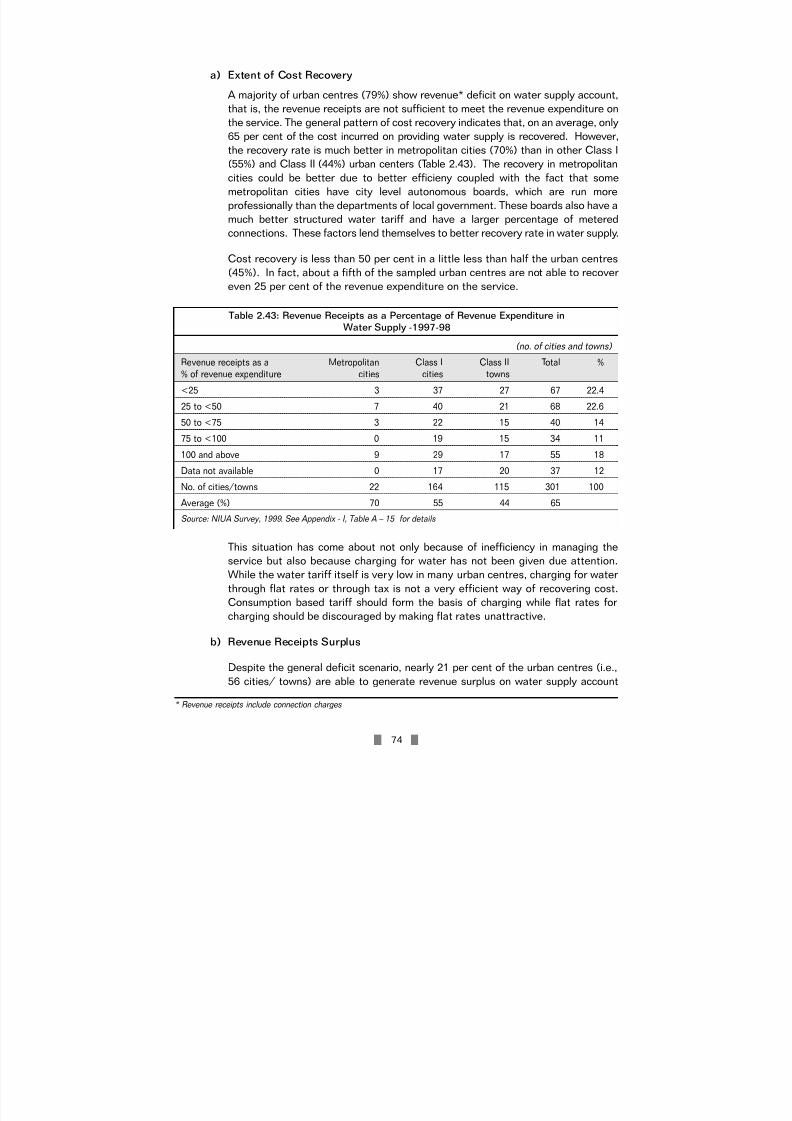
7/21/2019 Status Watersupply
http://slidepdf.com/reader/full/status-watersupply 94/869
74
a) Extent of Cost Recovery
A majority of urban centres (79%) show revenue* deficit on water supply account,
that is, the revenue receipts are not sufficient to meet the revenue expenditure on
the service. The general pattern of cost recovery indicates that, on an average, only
65 per cent of the cost incurred on providing water supply is recovered. However,
the recovery rate is much better in metropolitan cities (70%) than in other Class I(55%) and Class II (44%) urban centers (Table 2.43). The recovery in metropolitan
cities could be better due to better efficieny coupled with the fact that some
metropolitan cities have city level autonomous boards, which are run more
professionally than the departments of local government. These boards also have a
much better structured water tariff and have a larger percentage of metered
connections. These factors lend themselves to better recovery rate in water supply.
Cost recovery is less than 50 per cent in a little less than half the urban centres
(45%). In fact, about a fifth of the sampled urban centres are not able to recover
even 25 per cent of the revenue expenditure on the service.
This situation has come about not only because of inefficiency in managing the
service but also because charging for water has not been given due attention.
While the water tariff itself is very low in many urban centres, charging for water
through flat rates or through tax is not a very efficient way of recovering cost.
Consumption based tariff should form the basis of charging while flat rates forcharging should be discouraged by making flat rates unattractive.
b) Revenue Receipts Surplus
Despite the general deficit scenario, nearly 21 per cent of the urban centres (i.e.,
56 cities/ towns) are able to generate revenue surplus on water supply account
* Revenue receipts include connection charges
(no. of cities and towns)
Revenue receipts as a Metropolitan Class I Class II Total %% of revenue expenditure cities cities towns
<25 3 37 27 67 22.4
25 to <50 7 40 21 68 22.6
50 to <75 3 22 15 40 14
75 to <100 0 19 15 34 11
100 and above 9 29 17 55 18
Data not available 0 17 20 37 12
No. of cities/towns 22 164 115 301 100
Average (%) 70 55 44 65
Source: NIUA Survey, 1999. See Appendix - I, Table A – 15 for details
Table 2.43: Revenue Receipts as a Percentage of Revenue Expenditure inWater Supply -1997-98

7/21/2019 Status Watersupply
http://slidepdf.com/reader/full/status-watersupply 95/869
75
(Table A-2.2.). However, this needs to be qualified. Surplus revenue receipts over
revenue expenditure could be due to a number of reasons. Positive reasons include
improved water tariff, efficient management, efficient revenue collection
mechanism, and professional management and private sector participation
amongst others. Negative reasons include non-payment of outstanding bills and
loans (which do not get reflected in the budget) or low level of revenue expenditure
on O&M. Costs are also sometimes understated because of book adjustments
between service providers and electricity boards – these do not get reflected in the
revenue receipts and expenditure statement for the service. Adjustments made to
grants (for outstanding expenditure or loans) also do not get reflected in the
revenue receipts and expenditure statement, which could lead to a situation of
revenue surplus. However, if all payables and receivables are taken into account
City/ town Percentage revenue receiptsto revenue expenditure
Metropolitan cities
Visakhapatnam 274
Chennai 137
Hyderabad 106
Bangalore 103
Class I cities
Warangal 144
Jamnagar 129
Mangalore 202
Kolhapur 107
Cuddalore 150
Dindigul 122
Erode 102
Kanchipuram 154
Nagercoil 158
Rajapalaiyam 122
Salem 109
Tiruppur 259
Class II towns
Amalner MCl 166Ambur M 109
Dharmapuri M 133
Pudukkottai M 104
Tindivanam MC 108
Udhagamandalam M 109
Source: NIUA Survey, 1999. See Appendix - I, Table A – 15 for details
Table - 2.44 : Urban Centres with Revenue Surplus in Water Supply – 1997-98

7/21/2019 Status Watersupply
http://slidepdf.com/reader/full/status-watersupply 96/869
76
then the revenue surplus situation may change. It must be mentioned here that the
above analysis is for the financial year 1997-98 which could be an unusual year for
some water supply departments. A time-series data analysis would give a clearer
picture of the long-term trends in these urban centres.
However, a refinement can be made in order to understand whether these urban
centers are generating surplus after incurring some minimum necessary O&Mexpenditure. If an O&M expenditure of Re. 1.00 per kilolitre is taken as a cutoff 9
(assuming that this is the minimum amount that should be spent to supply treated
water) then only 22 of the 56 urban centres show revenue surplus (Table 2.44).
Of these 22 urban centres, 13 are in Tamil Nadu. The surplus revenue receipts
position in water supply in Tamil Nadu could be due to efficient management or
non-payment of dues and deferred payments in 1997-98.
c) Revenue Receipts and Revenue Expenditure Per Kilolitre
The average revenue receipts generated per kilolitre (kl.) of water supplied is Rs.
1.73 in the sampled urban centers as compared to the average revenueexpenditure of Rs. 2.66 per kl., thus leaving a deficit of Rs. 0.93 per kl.
Considering the fact that over 21,000 million litres of water is supplied daily in the
sampled urban centers, this deficit will add up to a huge sum. The metropolitan
cities spend more and generate more revenue receipts per kl., yet they are in
deficit of 0.93 per kl. (Table 2.45 and Table 2.46).
As compared to the expenditure per kl., the tariff charged is generally low. For
instance the average volumetric (per kl.) receipt in metropolitan cities is Rs. 2.16
9 If the cutoff is lowered to 0.50 paise per kilolitre then 41 urban centres show surplus revenue over expenditure (see Table-A-2.2).
(no. of cities and towns)
Revenue receipts Metropolitan Class I Class II Total %
(Rs.)/kl cities cities towns
< 0.25 1 25 15 41 13
0.25 - 0.50 2 26 22 50 16.6
0.50 - 0.75 3 34 12 49 16.4
0.75 - 1.00 7 15 12 34 11
1.00 - 2.00 2 32 24 58 19
2.00 - 3.00 2 14 7 23 8
> 3.00 5 8 10 23 8
Data not available 0 10 13 23 8
No. of cities/towns 22 164 115 301 100
Average (Rs./ kl.) 2.16 1.02 1.21 1.73
Source: NIUA Survey,1999.See Appendix - I, Table A – 15 for details
Table - 2.45 : Revenue Receipts Per Kilolitre of Water Supplied - 1997-98

7/21/2019 Status Watersupply
http://slidepdf.com/reader/full/status-watersupply 97/869
77
per kl. While the expenditure is Rs. 3.09 per kl. Bridging the gap between tariff
and expenditure is essential if water-supplying agencies have to break-even and
reduce dependence on higher levels of government for providing this basic
service.
d) Per Capita Revenue Receipts and Revenue Expenditure
As stated earlier, the gap between revenue receipts and revenue expenditure is
significant in Indian cities and towns. The average per capita revenue receipts
generated from water supply is a low Rs. 100.55 per annum or Rs. 8.38 per month
(Table 2.47), as compared to a per capita revenue expenditure of Rs. 153.89 per
annum or Rs. 12.82 per month (Table 2.48).
(no. of cities and towns)
Revenue expenditure Metropolitan Class I Class II Total %(Rs./kl.) cities cities towns
< 0.50 0 12 5 17 6
0.50 - 1.00 3 30 19 52 17
1.00 - 2.00 8 49 32 89 30
2.00 - 3.00 6 35 16 57 19
3.00 - 4.00 1 12 12 25 8
> 4.00 4 12 16 32 11
Data not available 0 14 15 29 9No. of cities/towns 22 164 115 301 100
Average (Rs./ kl.) 3.09 1.88 2.44 2.66
Source: NIUA Survey,1999. See Appendix - I, Table A – 15 for details
Table - 2.46: Revenue Expenditure Per Kilolitre of Water Supplied - 1997-98
(no. of cities and towns)
Per capita revenue Metropolitan Class I Class II Total %
receipts/annum (Rs.) cities cities towns
< 10 1 29 23 53 17
10 - 20 2 29 18 49 16
20 - 30 2 25 18 45 15
30 - 40 1 13 11 25 840 - 50 3 17 12 32 11
> 50 13 41 20 74 25
Data not available 0 10 13 23 8
No. of cities/towns 22 164 115 301 100
Average (Rs.) 149.43 48.65 39.41 100.55
Source: NIUA Survey,1999. See Appendix - I, Table A – 16 for details
Table - 2.47 : Per capita Revenue Receipts from Water Supply - 1997-98
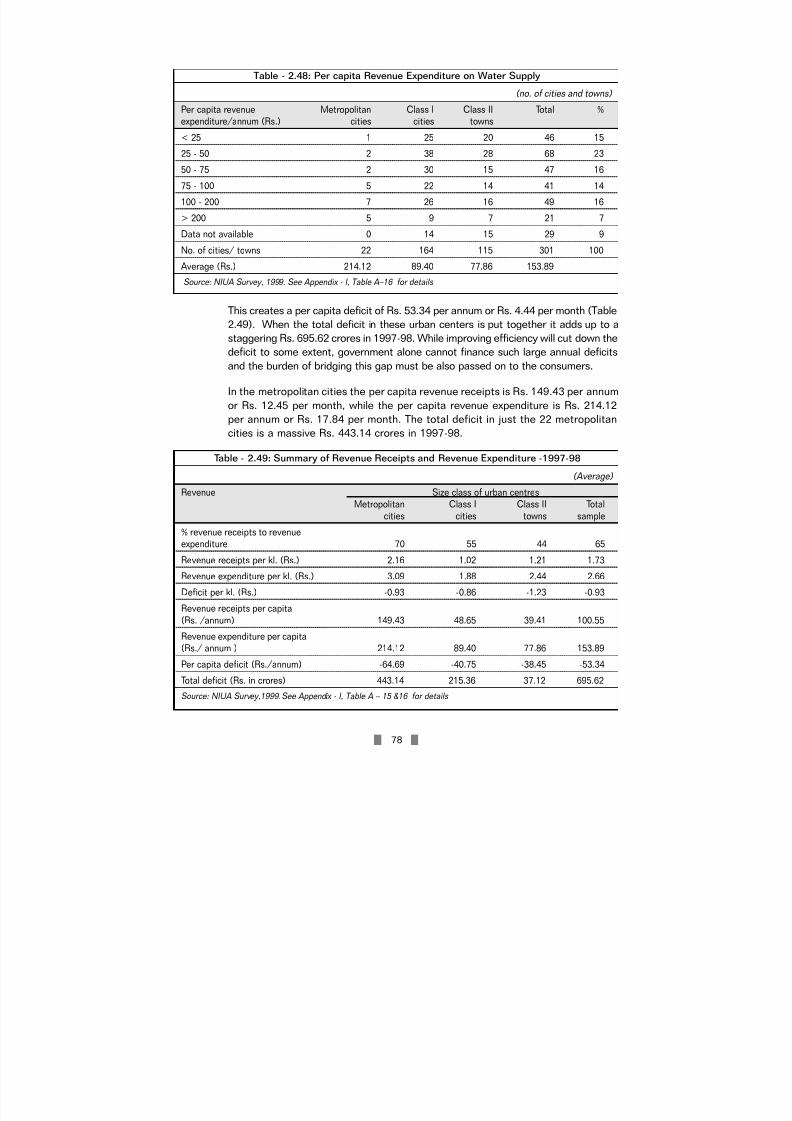
7/21/2019 Status Watersupply
http://slidepdf.com/reader/full/status-watersupply 98/869
78
This creates a per capita deficit of Rs. 53.34 per annum or Rs. 4.44 per month (Table
2.49). When the total deficit in these urban centers is put together it adds up to a
staggering Rs. 695.62 crores in 1997-98. While improving efficiency will cut down the
deficit to some extent, government alone cannot finance such large annual deficits
and the burden of bridging this gap must be also passed on to the consumers.
In the metropolitan cities the per capita revenue receipts is Rs. 149.43 per annum
or Rs. 12.45 per month, while the per capita revenue expenditure is Rs. 214.12
per annum or Rs. 17.84 per month. The total deficit in just the 22 metropolitan
cities is a massive Rs. 443.14 crores in 1997-98.
(no. of cities and towns)
Per capita revenue Metropolitan Class I Class II Total %expenditure/annum (Rs.) cities cities towns
< 25 1 25 20 46 15
25 - 50 2 38 28 68 23
50 - 75 2 30 15 47 16
75 - 100 5 22 14 41 14
100 - 200 7 26 16 49 16
> 200 5 9 7 21 7
Data not available 0 14 15 29 9
No. of cities/ towns 22 164 115 301 100
Average (Rs.) 214.12 89.40 77.86 153.89
Source: NIUA Survey, 1999. See Appendix - I, Table A–16 for details
Table - 2.48: Per capita Revenue Expenditure on Water Supply
(Average)
Revenue Size class of urban centresMetropolitan Class I Class II Total
cities cities towns sample
% revenue receipts to revenueexpenditure 70 55 44 65
Revenue receipts per kl. (Rs.) 2.16 1.02 1.21 1.73
Revenue expenditure per kl. (Rs.) 3.09 1.88 2.44 2.66
Deficit per kl. (Rs.) -0.93 -0.86 -1.23 -0.93
Revenue receipts per capita
(Rs. /annum) 149.43 48.65 39.41 100.55
Revenue expenditure per capita(Rs./ annum ) 214.12 89.40 77.86 153.89
Per capita deficit (Rs./annum) -64.69 -40.75 -38.45 -53.34
Total deficit (Rs. in crores) 443.14 215.36 37.12 695.62
Source: NIUA Survey,1999.See Appendix - I, Table A – 15 &16 for details
Table - 2.49: Summary of Revenue Receipts and Revenue Expenditure -1997-98

7/21/2019 Status Watersupply
http://slidepdf.com/reader/full/status-watersupply 99/869
79
2.16 CAPITAL INVESTMENTS
Improving the present supply of water as well as adding new infrastructure for
augmenting supplies requires capital expenditure. Cities incur capital expenditure on
source development, adding new infrastructure and upgrading existing systems.
It is important to point out here that most of the water augmentation schemes have
a 25 to 30 year life span and, therefore, cities may not incur capital expenditure every
year but would be doing so every few years. However, schemes for improving the
existing infrastructure may be undertaken more frequently. The present survey looks
at the capital expenditure incurred by the sampled cities in the last five years only,
i.e. since 1994. The survey indicates that capital expenditure has been incurred on
source development, laying new pipelines, adding new treatment plants, pumping
stations, and reservoirs, and on digging new tubewells. In the last five years most
cities have undertaken capital works on a combination of the above mentioned
components and only very few cities have reported expenditure on only one of the
above components.
The present survey indicates that only about two-fifths of the sampled cities haveundertaken capital works since 1994. The main components of capital expenditure on
laying pipelines has been the most common in the sampled cities since 1994 which
has been reported by almost one-fifth of the cities. The other major items of capital
expenditure have been pumping stations (in 13% of cities), reservoirs (in 11% of
cities), tubewells (in 10% of cities), and treatment plants (in 9% of cities). Source
development has been reported in only 4 per cent of the sampled cities (Table A-17
in Appendix - I).
Nearly one-third of the sampled cities have plans to undertake capital works in the
future. The components of capital works are similar to the above. Again, most cities
have indicated multiple components of capital works (Table A-18 in Appendix - I).
The total cost of capital works varies with the component and other technical details
of the component. Therefore, the per capita cost of capital works undertaken also has
a very wide range. Also many capital works components are not amenable to a per
capita cost calculation.
For instance, for capital works on laying down pipelines it is not possible to give a per
capita cost figure. Many cities have not given the per capita cost of capital works
undertaken. Hence no analysis of capital expenditure has been possible.
2.17 ADDITIONAL INVESTMENT REQUIREMENTSThe coverage of population by public water supply system is 93 per cent in the
sampled urban centres. The policy of the government aims at 100 per cent coverage
of population by water supply and this requires additional capital investments. The
present study gives the additional capital investment requirements for covering 100
per cent of the population by the public water supply system for the years 2002,
2007, 2012, 2017, and 2022 by the different size class of cities.

7/21/2019 Status Watersupply
http://slidepdf.com/reader/full/status-watersupply 100/869
80
2.17.1 Projection Methodology
For projecting the additional capital investment requirements the following were
required:
a) the total urban population projected till the year 2022 at five year intervals
starting 2002 A.D. – for which the Registrar General of India’s populationprojection has been used (Table 2.50);
b) the division of the projected additional urban population by size class of cities for
different years (Table 2.51);
c) the present coverage of population by the service by size class of urban centres
(Table 2.52);
(in million)
Year Size class of cities and towns
Metro I** II III IV V VI Total
% Urban population (1991) 23.00 33.67 13.33 16.35 9.77 3.43 0.45 100.00
1999 64.10 93.84 37.15 45.57 27.23 9.56 1.25 278.70
2002 69.34 101.51 40.19 49.29 29.45 10.34 1.36 301.48
2007 79.11 115.82 45.85 56.24 33.61 11.80 1.55 343.97
2012 89.58 131.14 51.92 63.68 38.05 13.36 1.75 389.48
2017 101.11 148.02 58.60 71.88 42.95 15.08 1.98 439.61
2022 114.16 167.13 66.17 81.16 48.50 17.03 2.23 496.37
Note: The proportion of population in each size class is for the individual cities and towns and not for urban
agglomerations and the proportions are assumed to be constant for the projected period i.e., upto 2022.Source for proportion of population in each size class - Census of India 1991, Series 1 - India, General Population
Tables Part II-A (ii) Towns and Urban Agglomerations 1991 with their Population 1901 - 1991, Statement-3, p.32 Source for size class-wise population distribution - Projections based on Census of India’s ‘Population Projections for
India and States 1996-2016’, Registrar General, India, New Delhi, 1996.* Population as on 1st July of the respective years ** Class I cities exclude metropolitan cities
Table - 2.50: Class-wise Projection of Urban Population* in Different Years
(in million)
Year Size class of cities and towns
Metro I II III IV V VI Total
Backlog 1999 1.92 9.38 4.09 5.01 3.00 1.05 0.14 24.591999-2002 5.24 7.67 3.04 3.73 2.22 0.78 0.10 22.79
2002-2007 9.77 14.31 5.66 6.95 4.15 1.46 0.19 42.49
2007-2012 10.47 15.32 6.07 7.44 4.45 1.56 0.20 45.51
2012-2017 11.53 16.88 6.68 8.20 4.90 1.72 0.23 50.13
2017-2022 13.05 19.11 7.57 9.28 5.55 1.95 0.26 56.76
Total 51.98 82.67 33.11 40.61 24.27 8.52 1.12 242.27
Table – 2.51: Additional Population to be Covered in Different Years by Size Class

7/21/2019 Status Watersupply
http://slidepdf.com/reader/full/status-watersupply 101/869
81
d) division of the projected population of population by dependence on surface and
ground water sources; and
e) water requirement (in mld) for the projected additional population – for which the
norm recommended by CPHEEO has been used (Table 2.53 & 2.54).
(used for calculating the backlog )
Size class of cities/ towns % covered by % not covered by
water supply water supply
Metro 97 3
I 90 10
II 89 11
III 89 11
IV 89 11
V 89 11
VI 89 11
Source: NIUA Survey, 1999
Table - 2.52: Coverage of Population by Water Supply - 1999
Size class of cities and towns Population Norm in lpcd
Metropolitan 1,000,000 and above 150
Class I 1,00,000 to 9,99,999 135
Class II 50,000 to 99,999 70
Class III 20,000 to 49,999 70
Class IV 10,000 to 19,999 70
Class V 5,000 to 9,999 70
Class VI Less than 5,000 70
Note: The above norms include 15% leakage
Source: Manual on Water Supply and Treatment, Third Edition, Ministry of Urban Development, Central Public Health and Environmental Engineering Organisation (CPHEEO), May 1999, p.11
Table - 2.53: Water Supply Norms Recommended By CPHEEO
(in mld)
Year Size class of cities and towns
Metro I II III IV V VI Total
1999* 288.45 1266.79 286.06 350.86 209.66 73.61 9.66 2485.08
2002 786.05 1035.64 212.60 260.76 155.82 54.70 7.18 2512.74
2007 1465.97 1931.45 396.49 486.32 290.60 102.02 13.38 4686.25
2012 1569.99 2068.50 424.63 520.83 311.22 109.26 14.33 5018.76
2017 1729.52 2278.68 467.77 573.75 342.85 120.36 15.79 5528.73
2022 1958.22 2580.00 529.63 649.62 388.18 136.28 17.88 6259.81
*Backlog
Table - 2.54: Additional Water Requirements Using CPHEEO’s Norms

7/21/2019 Status Watersupply
http://slidepdf.com/reader/full/status-watersupply 102/869
82
The additional population to be covered in different years by size class has been
arrived at by subtracting the latter year’s population by the previous one. The backlog
population to be covered as in 1999 has been calculated by the population not
covered as in 1999, which has been taken from the present survey.
a) Assumptions made for calculating investment requirements:
i) The Census of India’s publication (1996) titled ‘Population projection for India
and the states 1996-2016’ projects the population till the year 2016.
Thereafter, for projecting the population till the year 2022, the annual growth
rate of urban population during 2015-2016 (2.46% per annum) has been used
as a constant (see Table AX -2.3 at the end of this chapter).
ii) The percentage of population living in different size class of towns has been
kept constant at 1991 level for projections till the year 2022. Such an
assumption was necessitated due to the absence of any projection of
population by size class of towns available from the Registrar General’s
office.
iii) To calculate the backlog of population not covered by water supply in 1999,
the results of the present survey on coverage have been used for
metropolitan cities, Class I cities and Class II towns. However, since the
study does not cover the other size classes of towns (barring the capital
towns) the coverage figures for Class II towns have been used as proxy for
classes III to VI.
iv) The proportion of population dependant on surface and ground water, as given
by CPHEEO (i.e., 65% on surface water and 35% on ground water), has been
assumed to be constant over the various size classes of towns till the year
2022.
v) The norms for water supply used for different size classes of towns have been
assumed to be constant till the year 2022.
vi) The projection of investment requirements using Task Forces norms has
assumed that the surface water source is river and the ground water source
is not in hard rock.
b) Calculation of Additional Investment Requirements by Using Per Capita Costs
The calculation of additional investment requirements has been done by using the
per capita costs given by the Planning Commission (Task Forces on Housing and
Urban Development, 1983), and that given by HUDCO, (2000) (Tables 2.55 and
2.56).
The per capita cost of water supply schemes for metropolitan cities as
obtained from the respective cities are presented in Table 2.57. The per capita
cost estimates available are by the source of water i.e., surface and ground.
Therefore, the additional population projected till the year 2022 has been
divided by their dependence on surface and ground water sources. The

7/21/2019 Status Watersupply
http://slidepdf.com/reader/full/status-watersupply 103/869
83
CPHEEO average of 65% population’s dependence on surface water and 35%
population’s dependence on ground water has been used to arrive at the
number of people to be provided for by surface and ground water. The
population dependent on surface water has been multiplied by the per capita
cost of providing surface water and the population dependent on ground water
has been multiplied by the per capita cost of providing ground water. The
investment requirements thus worked out are given in Tables 2.58 and 2.59.
2.17.2 Projected Additional Capital Investment Requirements
In 1999, almost 25 million people were not covered by water supply in the urban areas
of the country and between 1999 and 2022 another 217.68 million would be added
to the urban population who will need to be covered by water supply (Table 2.50).
Therefore, provision for water supply for 242.27 million people has to be made in
order to cover the present uncovered population and future additions to the urban
population till the year 2022. This requires large financial investments to be made in
the water sector.
Estimation of per capita cost* of providing water supply have been made by the Task
Forces on Housing and Urban Development set up by the Planning Commission
(Table 2.55), HUDCO (Table 2.56), and the Working Group on Urban Water Supply
and Sanitation sector for Ninth Five Year Plan (Table 2.60). HUDCO has also
(Rs. at 1998-99 prices)
Population
>1 Lakh 50,000-1 Lakh < 50,000
Surface sources
Dam 1465.1 1352.4 1210.3
River 1489.6 1283.8 1274.0
Ground sources
Hard rock 1215.2 1117.2 1082.9
Others 1195.6 1215.2 1190.7
Source: Task Forces on Housing and Urban Development, Vol. II – Financing of Urban Development, Planning Commission, Government of India, New Delhi, December 1983, p. 31 (inflated to 1998-99 prices)
Table - 2.55: Task Forces Estimates of Per Capita Cost For Water Supply Schemes
Rs. at 1998-99 pricesSurface source 1944
Ground source 567
Source: Letter to NIUA dated 20th April, 2000 (deflated to 1998-99 prices)
Table - 2.56: HUDCO Estimates of Per Capita Cost For Water Supply Schemes
* Information on per capita cost of capital works has been obtained from the metropolitan cities too through the present survey, Table 2.) .however, it has not been possible to use these figures due to the large variations in the responses.

7/21/2019 Status Watersupply
http://slidepdf.com/reader/full/status-watersupply 104/869
84
estimated the per mld cost of urban water supply (Table 2.62). The present financial
requirement estimations are based on the cost estimates of these three sources. All
cost figures are at 1998-99 prices.
The additional capital investment required for providing water supply to theuncovered population in 1999 and the additional population from 1999 to 2022 A.D
is Rs. 32,117.87 crores (Table 2.58) or Rs. 1338.24 crores per annum using Task
Forces per capita costs.
Using HUDCO’s per capita cost estimates, the additional capital investment
requirement rises to Rs. 35,420.25 crores (Table 2.59) or Rs. 1540 crores per annum
for the same period. As against these, if the Ninth Plan’s per capita costs are used
(in Rs.)
Sl. No. City Past schemes Future schemes(1994 - 1999)
1 Ahmedabad 312 343
2 Bangalore 533 1400
3 Bhopal 382 521
4 Calcutta 318 399
5 Chennai 400 n.a
6 Coimbatore 564 920
7 Indore 816 816
8 Kanpur - Barrage unit 160 374 - 1233
Ganga Pollution Control Unit 1000 600
9 Lucknow - Reorganisation schemea) Tubewell schemes 600 - 1000 720 - 1200
b) Hilly region 1500 for gravity source 1800
with minor treatment works
4000-5500 for pumping 4800 - 6600
sources with fulltreatment works
10 Ludhiana 650 650
11 Madurai 398 n.a
12 Surat 1154 429
13 Vadodara 380 76914 Vishakhapatnam 414 577
15 Varanasi n.a. 1235
Note: The per capita cost of water supply schemes includes water treatment. The information presented in this table
has been furnished by the respective cities.Source: NIUA survey,1999.
Table - 2.57: NIUA Survey Estimates of Per Capita Cost ofWater Supply Schemes In Metropolitan Cities

7/21/2019 Status Watersupply
http://slidepdf.com/reader/full/status-watersupply 105/869
85
then investment requirements further rise to Rs. 40,379.52 for the same period or
Rs. 1682.48 crores per annum, including augmentation and rehabilitation (for those
already covered uptil 1999) (Table 2.61).
(Rs. in crores at 1998-99 prices)
Year Size class of cities and towns
Metro I II III IV V VI Total
1999* 266.66 1301.23 514.81 623.96 372.85 130.90 17.17 3227.58
1999-2002 726.68 1063.79 382.61 463.73 277.10 97.28 12.76 3023.95
2002-2007 1355.24 1983.96 713.57 864.85 516.79 181.43 23.80 5639.65
2007-2012 1451.40 2124.73 764.20 926.21 553.46 194.31 25.49 6039.81
2012-2017 1598.89 2340.63 841.85 1020.33 609.70 214.05 28.08 6653.53
2017-2022 1810.31 2650.14 953.17 1155.25 690.32 242.36 31.80 7533.35
Total 7209.18 11464.48 4170.22 5054.33 3020.23 1060.33 139.11 32117.87
*Backlog Rs. 1 crore = Rs. 10,000,000 or Rs. 10 million
Table - 2.58: Additional Capital Investment Requirement Using Task Forces Per Capita Costs
(Rs. in crores at 1998-99 prices)
Year Size class of cities and towns
Metro I II III IV V VI Total
1999* 281.15 1371.94 597.47 732.83 437.90 153.74 20.17 3595.19
1999-2002 766.17 1121.59 444.04 544.64 325.45 114.26 14.99 3331.14
2002-2007 1428.88 2091.76 828.13 1015.75 606.97 213.09 27.96 6212.54
2007-2012 1530.27 2240.18 886.89 1087.82 650.03 228.21 29.94 6653.35
2012-2017 1685.77 2467.81 977.01 1198.36 716.08 251.40 32.98 7329.42
2017-2022 1908.68 2794.14 1106.20 1356.82 810.77 284.64 37.34 8298.61
Total 7600.91 12087.43 4839.75 5936.22 3547.21 1245.34 163.38 35420.25*Backlog Rs. 1 crore = Rs. 10,000,000 or Rs. 10 million
Table - 2.59: Additional Capital Investment Requirement Using HUDCO’s Per Capita Costs
(in Rs.)*
Population
>1 Lakh 50,000-1 Lakh < 50,000
Surface source 1800 1500 1500
Ground source 1800 1500 1500
Rehabilitation/ Augmentation 750 750 750
Source: Report of the Working Group on Urban Water Supply and Sanitation Sector for Ninth Five Year Plan
(1997-2002), Department of Urban Development, Ministry of Urban Affairs and Employment, Government of India,New Delhi, July 1996, p. 86-87
* The source does not give the year of prices
Table - 2.60: Ninth Plan Estimates of Per Capita Cost for Water Supply

7/21/2019 Status Watersupply
http://slidepdf.com/reader/full/status-watersupply 106/869
86
Using the per mld cost of providing water, (using HUDCO’s estimates) (Table 2.62)
the requirements vary between Rs. 15825 crores (low estimate) to Rs. 40502 crores
(high estimate) during the period 1999-2022 for covering the entire population by
water supply (Table 2.63 and 2.64). The per annum investment requirements vary
between Rs. 688 crores (low) to Rs. 1761 crores (high) during the period 1999-2022
if the goal of covering 100 per cent of the population with water supply is to be
achieved.
These estimates are based, as stated earlier, on the population projections by the
Census of India, the assumptions made regarding size class distribution of
population, the division of population by dependence on surface and ground water
sources, and the per capita supply norms of the CPHEEO. The estimates do not
include the O&M costs of the existing or future systems (except the estimates made
using Ninth Plan per capita costs).
A few estimates are available on the additional investment requirements for the
urban areas of the country, though they are not strictly comparable with one another
as each estimate is based on different sets of assumptions regarding physical
specifications, service standards and the population to be covered. However, a
(Rs. in crores at 1998-99 prices)
Year Size class of cities and towns
Metro I II III IV V VI Total
1999* 346.14 1689.06 612.98 751.85 449.27 157.73 20.69 4027.71
1999-2002 943.26 1380.85 455.56 558.77 333.9 117.23 15.38 3804.95
2002-2007 1759.17 2575.27 849.63 1042.12 622.72 218.62 28.68 7096.21
2007-2012 1883.99 2758.00 909.91 1116.06 666.91 234.13 30.72 7599.71
2012-2017 2075.43 3038.25 1002.37 1229.47 734.67 257.92 33.84 8371.94
2017-2022 2349.87 3440.00 1134.92 1392.04 831.82 292.03 38.31 9478.99
Total 9357.85 14881.42 4965.37 6090.31 3639.29 1277.66 167.62 40379.52
1999 ** 4663.26 6333.97 2479.77 3041.57 1817.50 638.08 83.71 19057.87
Grand Total *** 14021.11 21215.39 7445.14 9131.88 5456.79 1915.74 251.34 59437.39
* Backlog ** Augmentation/ Rehabilitation for those covered till 1999
*** Grand Total is the sum of Total row and Augmentation/Rehabilitation for those covered till 1999 row
Table - 2.61: Additional Capital Investment Requirement Using Ninth Plan’s Per Capita Costs
(at 1998-99 prices) Low Estimate High Estimate
Rs./ mld (in crores) Rs./ mld (in crores)
Surface source 0.81 2.03
Ground source 0.20 0.61
Source: Letter to NIUA dated 20th April, 2000 (deflated to 1998-99 prices)
Table - 2.62: HUDCO’s Estimates of Per mld Cost for Water Supply
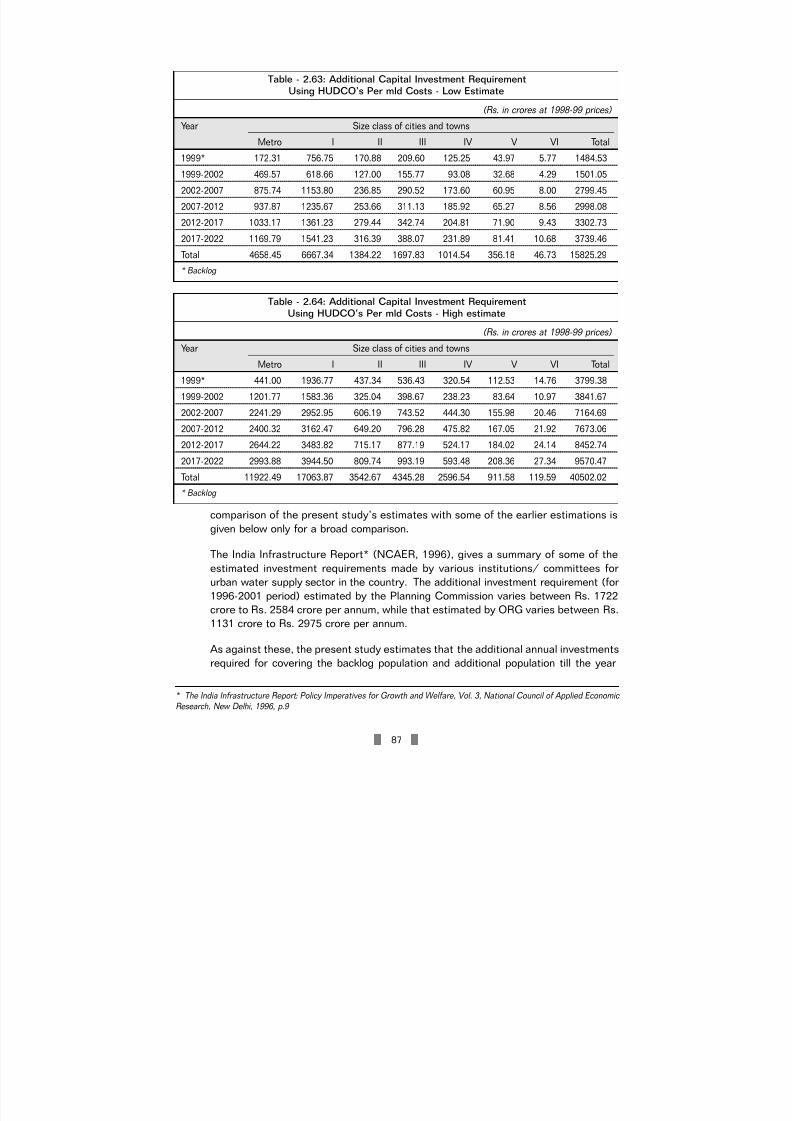
7/21/2019 Status Watersupply
http://slidepdf.com/reader/full/status-watersupply 107/869
87
comparison of the present study’s estimates with some of the earlier estimations is
given below only for a broad comparison.
The India Infrastructure Report* (NCAER, 1996), gives a summary of some of the
estimated investment requirements made by various institutions/ committees for
urban water supply sector in the country. The additional investment requirement (for
1996-2001 period) estimated by the Planning Commission varies between Rs. 1722
crore to Rs. 2584 crore per annum, while that estimated by ORG varies between Rs.
1131 crore to Rs. 2975 crore per annum.
As against these, the present study estimates that the additional annual investments
required for covering the backlog population and additional population till the year
(Rs. in crores at 1998-99 prices)
Year Size class of cities and towns
Metro I II III IV V VI Total
1999* 172.31 756.75 170.88 209.60 125.25 43.97 5.77 1484.53
1999-2002 469.57 618.66 127.00 155.77 93.08 32.68 4.29 1501.05
2002-2007 875.74 1153.80 236.85 290.52 173.60 60.95 8.00 2799.45
2007-2012 937.87 1235.67 253.66 311.13 185.92 65.27 8.56 2998.08
2012-2017 1033.17 1361.23 279.44 342.74 204.81 71.90 9.43 3302.73
2017-2022 1169.79 1541.23 316.39 388.07 231.89 81.41 10.68 3739.46
Total 4658.45 6667.34 1384.22 1697.83 1014.54 356.18 46.73 15825.29
* Backlog
Table - 2.63: Additional Capital Investment RequirementUsing HUDCO’s Per mld Costs - Low Estimate
(Rs. in crores at 1998-99 prices)
Year Size class of cities and towns
Metro I II III IV V VI Total
1999* 441.00 1936.77 437.34 536.43 320.54 112.53 14.76 3799.38
1999-2002 1201.77 1583.36 325.04 398.67 238.23 83.64 10.97 3841.67
2002-2007 2241.29 2952.95 606.19 743.52 444.30 155.98 20.46 7164.69
2007-2012 2400.32 3162.47 649.20 796.28 475.82 167.05 21.92 7673.06
2012-2017 2644.22 3483.82 715.17 877.19 524.17 184.02 24.14 8452.74
2017-2022 2993.88 3944.50 809.74 993.19 593.48 208.36 27.34 9570.47
Total 11922.49 17063.87 3542.67 4345.28 2596.54 911.58 119.59 40502.02
* Backlog
Table - 2.64: Additional Capital Investment RequirementUsing HUDCO’s Per mld Costs - High estimate
* The India Infrastructure Report: Policy Imperatives for Growth and Welfare, Vol. 3, National Council of Applied Economic
Research, New Delhi, 1996, p.9

7/21/2019 Status Watersupply
http://slidepdf.com/reader/full/status-watersupply 108/869
88
2022 with water supply will range between Rs. 1396 crore (Task Forces costs) to Rs.
1540 crore (HUDCO costs) at 1998-99 prices for the period 1999-2022. Adding the
cost of augmentation and rehabilitation (as given by the Ninth Plan Working Group)
the investment requirements go up to Rs. 59437 crores for the same period. In annual
terms, the additional investment requirement is estimated at Rs. 2584 crore till the
year 2022.
As per The India Infrastructure Report, the funds required for providing infrastructure
(water supply, sanitation and roads) to the urban population for the period 1996-2005
is about Rs. 28,000 crores, the annual requirement being Rs. 2800 crores for this
period. As against this the funds available are less than one-fifth of the requirement.
The remaining funds will necessarily have to be mobilised from other sources,
including the private sector, if the urban population is to be provided with basic
infrastructure.

7/21/2019 Status Watersupply
http://slidepdf.com/reader/full/status-watersupply 109/869
89
ANNEX TABLES
Table - AX - 2.1: Urban Centres with Water Supply Below Norm and Additional Quantity
Required to Reach Norms – 1999
Sl. City/Town Sewer- Estima- Water Per capita CPH- Demand AdditionalNo. ed (S)/ ted supply supply EEO as per water
Unsewe- popu- (mld)- (lpcd) - 1999 norm norm required -red (US) lation 1999 (lpcd) (mld)- 1999
1999 total served 1999 mld lpcd
(‘000) pop. pop.
Metropolitan Cities
1 Ahmedabad M.Corp. S 3,500 486.00 139 139 150 525.00 39.00 11.14
2 Bangalore M.Corp. S 5,000 705.50 141 141 150 750.00 44.50 8.90
3 Chennai M.Corp. S 4,363 461.00 106 106 150 654.45 193.45 44.34
4 Coimbatore M.Corp S 971 105.00 108 108 150 145.65 40.65 41.86
5 Indore M.Corp. S 1,600 238.00 149 149 150 240.00 2.00 1.25
6 Kanpur M.Corp. S 2,500 310.10 124 248 150 375.00 64.90 25.96
7 Kochi M.Corp. S 680 84.00 124 124 150 102.00 18.00 26.47
8 Ludhiana M.Corp. S 2,000 234.00 117 195 150 300.00 66.00 33.00
9 Madurai M.Corp. S 1,020 90.00 88 88 150 153.00 63.00 61.76
10 Surat M.Corp. S 2,300 320.00 139 139 150 345.00 25.00 10.87
11 Visakhapatnam M.Corp. S 1,280 168.00 131 131 150 192.00 24.00 18.75
Class I Cities
1 Anantapur MCI US 250 14.06 56 56 70 17.50 3.44 13.76
2 Eluru M S 247 23.71 96 96 135 33.35 9.63 39.00
3 Guntur MCI S 557 74.90 135 135 135 75.17 0.27 0.49
4 Kakinada M US 325 21.33 66 88 70 22.75 1.42 4.37
5 Kurnool MCI US 282 6.50 23 23 70 19.71 13.21 46.91
6 Nandyal MCI US 150 10.00 67 67 70 10.50 0.50 3.33
7 Nizamabad M US 285 15.00 53 53 70 19.95 4.95 17.37
8 Tenali M US 170 0.68 4 20 70 11.90 11.22 65.98
9 Munger M US 210 10.00 48 80 70 14.70 4.70 22.38
10 Anand M S 175 11.00 63 63 135 23.63 12.63 72.14
11 Bhavnagar M.Corp. S 550 70.00 127 127 135 74.25 4.25 7.7312 Nadiad M S 300 21.00 70 70 135 40.50 19.50 65.00
13 Navsari M S 139 16.30 117 117 135 18.77 2.47 17.73
14 Rajkot M.Corp. S 1,000 106.60 107 107 135 135.00 28.40 28.40
15 Surendranagar M US 150 5.60 37 37 70 10.50 4.90 32.67
16 Ambala MCI S 141 16.20 115 120 135 19.04 2.84 20.11
17 Gurgaon MCI S 175 18.50 106 124 135 23.63 5.13 29.29
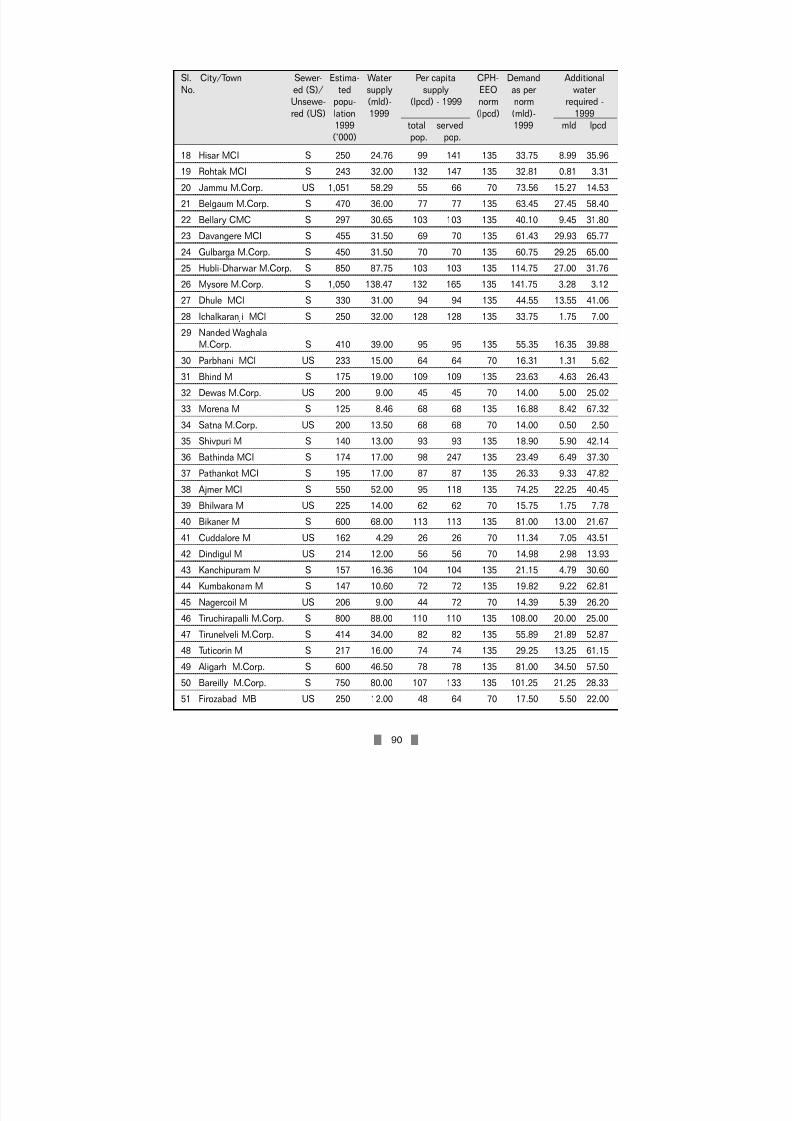
7/21/2019 Status Watersupply
http://slidepdf.com/reader/full/status-watersupply 110/869
90
18 Hisar MCI S 250 24.76 99 141 135 33.75 8.99 35.96
19 Rohtak MCI S 243 32.00 132 147 135 32.81 0.81 3.31
20 Jammu M.Corp. US 1,051 58.29 55 66 70 73.56 15.27 14.53
21 Belgaum M.Corp. S 470 36.00 77 77 135 63.45 27.45 58.40
22 Bellary CMC S 297 30.65 103 103 135 40.10 9.45 31.80
23 Davangere MCI S 455 31.50 69 70 135 61.43 29.93 65.77
24 Gulbarga M.Corp. S 450 31.50 70 70 135 60.75 29.25 65.00
25 Hubli-Dharwar M.Corp. S 850 87.75 103 103 135 114.75 27.00 31.76
26 Mysore M.Corp. S 1,050 138.47 132 165 135 141.75 3.28 3.12
27 Dhule MCl S 330 31.00 94 94 135 44.55 13.55 41.0628 Ichalkaranji MCl S 250 32.00 128 128 135 33.75 1.75 7.00
29 Nanded WaghalaM.Corp. S 410 39.00 95 95 135 55.35 16.35 39.88
30 Parbhani MCl US 233 15.00 64 64 70 16.31 1.31 5.62
31 Bhind M S 175 19.00 109 109 135 23.63 4.63 26.43
32 Dewas M.Corp. US 200 9.00 45 45 70 14.00 5.00 25.02
33 Morena M S 125 8.46 68 68 135 16.88 8.42 67.32
34 Satna M.Corp. US 200 13.50 68 68 70 14.00 0.50 2.50
35 Shivpuri M S 140 13.00 93 93 135 18.90 5.90 42.14
36 Bathinda MCI S 174 17.00 98 247 135 23.49 6.49 37.30
37 Pathankot MCI S 195 17.00 87 87 135 26.33 9.33 47.82
38 Ajmer MCI S 550 52.00 95 118 135 74.25 22.25 40.45
39 Bhilwara M US 225 14.00 62 62 70 15.75 1.75 7.78
40 Bikaner M S 600 68.00 113 113 135 81.00 13.00 21.67
41 Cuddalore M US 162 4.29 26 26 70 11.34 7.05 43.51
42 Dindigul M US 214 12.00 56 56 70 14.98 2.98 13.93
43 Kanchipuram M S 157 16.36 104 104 135 21.15 4.79 30.60
44 Kumbakonam M S 147 10.60 72 72 135 19.82 9.22 62.81
45 Nagercoil M US 206 9.00 44 72 70 14.39 5.39 26.2046 Tiruchirapalli M.Corp. S 800 88.00 110 110 135 108.00 20.00 25.00
47 Tirunelveli M.Corp. S 414 34.00 82 82 135 55.89 21.89 52.87
48 Tuticorin M S 217 16.00 74 74 135 29.25 13.25 61.15
49 Aligarh M.Corp. S 600 46.50 78 78 135 81.00 34.50 57.50
50 Bareilly M.Corp. S 750 80.00 107 133 135 101.25 21.25 28.33
51 Firozabad MB US 250 12.00 48 64 70 17.50 5.50 22.00
Sl. City/Town Sewer- Estima- Water Per capita CPH- Demand Additional
No. ed (S)/ ted supply supply EEO as per waterUnsewe- popu- (mld)- (lpcd) - 1999 norm norm required -
red (US) lation 1999 (lpcd) (mld)- 19991999 total served 1999 mld lpcd(‘000) pop. pop.

7/21/2019 Status Watersupply
http://slidepdf.com/reader/full/status-watersupply 111/869
91
52 Ghaziabad M.Corp. S 887 110.00 124 124 135 119.75 9.75 10.99
53 Gorakhpur M.Corp. S 600 74.00 123 164 135 81.00 7.00 11.67
54 Hapur MB S 200 14.00 70 108 135 27.00 13.00 65.00
55 Hardwar MB S 300 39.00 130 217 135 40.50 1.50 5.00
56 Mathura MB S 400 26.73 67 103 135 54.00 27.27 68.18
57 Meerut M.Corp. S 1,250 132.00 106 106 135 168.75 36.75 29.40
58 Mirzapur MB S 210 25.00 119 183 135 28.35 3.35 15.95
59 Rampur MB US 317 19.76 62 62 70 22.19 2.43 7.67
60 Balurghat M US 132 0.86 7 7 70 9.24 8.38 63.50
61 Krishnagar M US 145 5.97 41 68 70 10.17 4.20 28.9462 Santipur M US 134 0.91 7 23 70 9.37 8.47 63.22
63 Silliguri M.Corp. US 500 17.97 36 36 70 35.00 17.03 34.06
64 Guwahati M.Corp. US 995 55.00 55 126 70 69.65 14.65 14.72
65 Aizwal NM US 244 10.80 44 135 70 17.08 6.28 25.74
66 Pondicherry M S 290 33.35 115 115 135 39.15 5.80 20.00
Class II Towns
1 Anakapalle M US 115 3.64 32 32 70 8.05 4.41 38.35
2 Kapra M US 120 4.55 38 47 70 8.40 3.85 32.08
3 Kavali MCI US 85 4.95 58 58 70 5.95 1.00 11.76
4 Narasaraopet M US 95 4.50 47 47 70 6.65 2.15 22.63
5 Rajendra nagar MCI US 120 5.10 42 42 70 8.40 3.30 27.53
6 Sangareddy MCI US 60 3.86 64 64 70 4.20 0.34 5.67
7 Srikakulam MCI US 100 6.81 68 68 70 7.00 0.19 1.90
8 Buxar M US 67 3.90 58 71 70 4.68 0.78 11.61
9 Deoghar M US 100 3.00 30 38 70 7.00 4.00 40.00
10 Hazaribagh M US 119 7.26 61 73 70 8.33 1.07 9.02
11 Mokama M US 66 1.96 30 30 70 4.62 2.66 40.30
12 Mahesana M S 138 14.80 107 107 135 18.63 3.83 27.75
13 Palanpur M US 117 4.00 34 34 70 8.19 4.19 35.81
14 Kaithal MCI S 95 10.75 114 142 135 12.76 2.01 21.30
15 Rewari MCI S 105 11.35 108 108 135 14.18 2.83 26.90
16 Thanesar MCI S 100 13.22 132 184 135 13.50 0.28 2.80
17 Gokak CMC US 68 4.55 67 67 70 4.76 0.21 3.09
18 Kolar CMC S 112 8.00 71 71 135 15.12 7.12 63.57
19 Rabkavi-Banhatti
Sl. City/Town Sewer- Estima- Water Per capita CPH- Demand Additional
No. ed (S)/ ted supply supply EEO as per waterUnsewe- popu- (mld)- (lpcd) - 1999 norm norm required -
red (US) lation 1999 (lpcd) (mld)- 19991999 total served 1999 mld lpcd(‘000) pop. pop.

7/21/2019 Status Watersupply
http://slidepdf.com/reader/full/status-watersupply 112/869
92
CMC US 72 4.54 63 63 70 5.04 0.50 6.94
20 Ramanagaram CMC US 70 4.50 64 64 70 4.90 0.40 5.71
21 Changanessary MC US 62 4.00 65 65 70 4.34 0.34 5.48
22 Payyanur M US 71 1.50 21 21 70 4.94 3.44 48.72
23 Taliparamba M US 52 0.39 7 7 70 3.64 3.26 62.60
24 Ballarpur MCl US 109 7.00 64 64 70 7.62 0.62 5.72
25 Kamptee MCl US 95 3.60 38 38 70 6.65 3.05 32.11
26 Itarsi M US 105 5.86 56 56 70 7.35 1.49 14.19
27 Nagda M US 100 3.03 30 34 70 7.00 3.98 39.75
28 Neemuch M US 100 5.90 59 59 70 6.97 1.07 10.7129 Sehore M US 100 5.30 53 53 70 7.00 1.70 17.00
30 Shahdol M US 75 4.67 62 62 70 5.25 0.58 7.73
31 Bhadrak M US 93 3.00 32 32 70 6.51 3.51 37.74
32 Mansa MCI S 67 7.95 119 241 135 8.99 1.04 15.57
33 Hanumangarh M US 125 7.20 58 58 70 8.75 1.55 12.40
34 Ambur M US 86 5.59 65 65 70 6.00 0.41 4.77
35 Arakkonam M US 88 4.00 45 45 70 6.16 2.16 24.55
36 Attur M US 64 2.98 47 47 70 4.48 1.50 23.44
37 Cumbum M US 54 2.70 50 70 70 3.75 1.05 19.63
38 Dharmapuri M US 67 3.00 45 45 70 4.66 1.66 24.95
39 Guduivattam M US 95 5.80 61 61 70 6.66 0.86 9.06
40 Nagapattinam M S 112 7.80 70 70 135 15.15 7.35 65.48
41 Srivilliputtur M US 74 3.50 47 47 70 5.17 1.67 22.64
42 Tindivanam MC US 70 1.90 27 30 70 4.90 3.00 42.86
43 Udhagamandalam M S 100 4.00 40 40 135 13.50 9.50 95.00
44 Auraiya MB US 90 4.50 50 50 70 6.30 1.80 20.00
45 Balrampur MB US 70 2.79 40 186 70 4.90 2.11 30.14
46 Bhadohi MB US 125 4.00 32 105 70 8.75 4.75 38.00
47 Chandpur MB US 80 3.24 41 60 70 5.60 2.36 29.50
48 Etah MB S 135 4.00 30 42 135 18.23 14.23 105.37
49 Mughalsarai MB US 160 4.00 25 200 70 11.19 7.19 44.97
50 Orai MB S 170 8.24 48 69 135 22.95 14.71 86.53
51 Bishnupur M US 67 2.61 39 105 70 4.72 2.11 31.28
52 Chakdaha M US 90 1.90 21 54 70 6.28 4.38 48.83
Sl. City/Town Sewer- Estima- Water Per capita CPH- Demand Additional
No. ed (S)/ ted supply supply EEO as per waterUnsewe- popu- (mld)- (lpcd) - 1999 norm norm required -
red (US) lation 1999 (lpcd) (mld)- 19991999 total served 1999 mld lpcd(‘000) pop. pop.

7/21/2019 Status Watersupply
http://slidepdf.com/reader/full/status-watersupply 113/869
93
53 Contai M US 114 1.57 14 14 70 7.98 6.41 56.20
54 Darjeeling M S 150 6.00 40 40 135 20.25 14.25 95.00
55 Jalpaiguri M US 101 4.91 49 n.a. 70 7.08 2.17 21.43
56 Jangipur M US 78 3.00 38 71 70 5.47 2.47 31.63
57 Katwa M US 68 1.50 22 55 70 4.74 3.24 47.83
58 Raniganj M US 121 5.08 42 79 70 8.47 3.39 28.02
59 Kohima TC US 103 2.90 28 28 70 7.21 4.31 41.84
60 Kavarathi NMCT US 11 0.04 3 3 70 0.78 0.74 66.67
Note: CPHEEO norms state that where there is no sewerage system existing or envisaged 70 lpcd supply may be
sufficient, irrespective of the size class of town.) Source: NIUA Survey,1999 Also see Appendix - I, Table A – 3
Sl. City/Town Sewer- Estima- Water Per capita CPH- Demand Additional
No. ed (S)/ ted supply supply EEO as per waterUnsewe- popu- (mld)- (lpcd) - 1999 norm norm required -red (US) lation 1999 (lpcd) (mld)- 1999
1999 total served 1999 mld lpcd(‘000) pop. pop.

7/21/2019 Status Watersupply
http://slidepdf.com/reader/full/status-watersupply 114/869
94
Sl.No. City/Town % Revenue receipts to O&M expenditurerevenue expenditure per kl. (Rs.)
Metropolitan cities
1 Bangalore 103 3.70
2 Chennai 137 1.28
3 Coimbatore 282 0.24
4 Greater Mumbai 135 0.94
5 Hyderabad 106 2.14
6 Kanpur 118 0.23
7 Kochi 133 0.89
8 Madurai 123 0.53
9 Visakhapatnam 274 1.30
Class I
1 Anantapur 143 0.972 Nellore 104 0.52
3 Tenali 122 1.98
4 Waranga 144 1.01
5 Gaya 188 break-up n.a.
6 Jamnagar 129 1.06
7 Belgaum 166 0.49
8 Bellary 134 0.52
9 Mangalore 202 1.30
10 Thiruvananthapuram 179 0.30
11 Kolhapur 107 1.94
12 Ratlam 218 0.68
13 Kota 130 0.14
14 Cuddalore 150 1.85
15 Dindigul 122 1.95
16 Erode 102 1.03
17 Kanchipuram 154 1.00
18 Kumbakonam 251 0.40
19 Nagercoil 158 1.81
20 Rajapalaiyam 122 1.35
21 Salem 109 1.20
22 Thanjavur 150 0.54
23 Tirunelveli 104 0.89
24 Tirunvannamalai 115 0.75
25 Tiruppur 259 1.44
Table - AX -2.2 : Urban Centres with Surplus Revenue Receipts – 1997-98

7/21/2019 Status Watersupply
http://slidepdf.com/reader/full/status-watersupply 115/869
95
Sl.No. City/Town % Revenue receipts to O&M expenditure
revenue expenditure per kl. (Rs.)
26 Aligarh 113 0.21
27 Haldwani-cum-Kathgodam 115 0.48
28 Muzaffarnagar 100 0.03
29 Saharanpur 102 0.06
Class II
1 Anakapalle 176 0.91
2 Srikakulam 106 0.82
3 Suryapet 116 0.50
4 Gondal 99 0.07
5 Chikmaglur 167 0.29
6 Gokak 168 0.84
7 Amalner 166 2.03
8 Hanumangarh 207 0.589 Ambur 109 1.10
10 Attur M 229 0.74
11 Cambam M 122 0.83
12 Dharmapuri M 133 1.53
13 Nagapattinam M 148 0.57
14 Pudukkottai M 104 2.12
15 Tindivanam MC 108 2.03
16 Udhagamandalam M 109 1.81
17 Auraiya 105 0.10
18 Chandpur 177 0.80
Source: NIUA Survey, 1999. See Appendix - I, Table A – 13 & 14 for details

7/21/2019 Status Watersupply
http://slidepdf.com/reader/full/status-watersupply 116/869
96
(In million)
Year Size class of cities and towns
Metro cities I II III IV V VI Total
Proportion of population in different size classes
% population
1991 23.00 33.67 13.33 16.35 9.77 3.43 0.45 100.00
1999 64.10 93.84 37.15 45.57 27.23 9.56 1.25 278.70
2000 65.83 96.36 38.15 46.79 27.96 9.82 1.29 286.20
2001 67.57 98.91 39.16 48.03 28.70 10.08 1.32 293.77
2002 69.34 101.51 40.19 49.29 29.45 10.34 1.36 301.48
2003 71.19 104.21 41.26 50.60 30.24 10.62 1.39 309.50
2004 73.09 107.00 42.36 51.96 31.05 10.90 1.43 317.80
2005 75.06 109.88 43.50 53.36 31.88 11.19 1.47 326.35
2006 77.07 112.82 44.67 54.79 32.74 11.49 1.51 335.092007 79.11 115.82 45.85 56.24 33.61 11.80 1.55 343.97
2008 81.17 118.83 47.05 57.70 34.48 12.11 1.59 352.93
2009 83.25 121.87 48.25 59.18 35.36 12.42 1.63 361.96
2010 85.35 124.94 49.46 60.67 36.25 12.73 1.67 371.08
2011 87.46 128.03 50.69 62.17 37.15 13.04 1.71 380.24
2012 89.58 131.14 51.92 63.68 38.05 13.36 1.75 389.48
2013 91.76 134.33 53.18 65.23 38.98 13.68 1.80 398.98
2014 94.01 137.62 54.48 66.83 39.93 14.02 1.84 408.74
2015 96.32 141.00 55.82 68.47 40.91 14.36 1.88 418.77
2016 98.68 144.46 57.19 70.15 41.92 14.72 1.93 429.06
2017 101.11 148.02 58.60 71.88 42.95 15.08 1.98 439.61
2018 103.60 151.66 60.04 73.64 44.01 15.45 2.03 450.42
2019 106.14 155.38 61.52 75.45 45.09 15.83 2.08 461.49
2020 108.75 159.20 63.03 77.31 46.20 16.22 2.13 472.83
2021 111.43 163.12 64.58 79.21 47.33 16.62 2.18 484.46
2022 114.16 167.13 66.17 81.16 48.50 17.03 2.23 496.37
Table - AX-2.3: Year and Class Wise Projection of Urban Population

7/21/2019 Status Watersupply
http://slidepdf.com/reader/full/status-watersupply 117/869
97
CHAPTER III
WASTEWATER COLLECTION, TREATMENT AND
DISPOSAL AND LOW COST SANITATION
3.1 BACKGROUND
Wastewater disposal is a major problem in most Indian cities. Only a small
percentage of urban centres in the country have a sewerage system and even where
the system exists, the coverage of population by the sewerage system is partial. In
some cities the system does not function properly or is defunct. Many urban centres
with sewerage system do not have sewage treatment plants to treat wastewater.
Discharge of untreated sewage into water bodies pollutes the limited water sources
near urban centres. Improper collection and treatment of wastewater creates
insanitary conditions and results in serious health problems.
3.2 COVERAGE BY SEWERAGE SYSTEM
3.2.1 Urban Centres Covered
Providing most urban centres with a sewerage system requires substantial financial
resources and in order to keep the system operational, a minimum required level of
water supply has to be ensured. Most Indian cities do not have the funds to construct
a sewerage system along with the required treatment facilities. The present survey
indicates while all the responding metropolitan cities (22) have a sewerage system,
only 57 out of the 164 sampled Class I cities (i.e. 35%) and 21 out of 115 sampled
Class II towns (i.e. 18%) have reported having a functioning sewerage system.
Overall, only about 34 per cent of the sampled urban centres (i.e., 100 cities/towns)
have a sewerage system. (Table 3.1).
Of the urban centres with a sewerage system, about 38 per cent have a combined
system of wastewater collection, i.e., combined with storm water drainage, while 60
per cent centres have a separate system (Table 3.2).
(no. of cities/towns)
Sewerage system Metro cities Class I Class II Total %
Yes 22 57 21 100 34
Not functional - 12 2 14 4
No - 88 86 174 58
n.a. - 7 6 13 4Total 22 164 115 301 100
Source: NIUA Survey, 1999
Table - 3.1: Sampled Urban Centres with Sewerage System - 1999
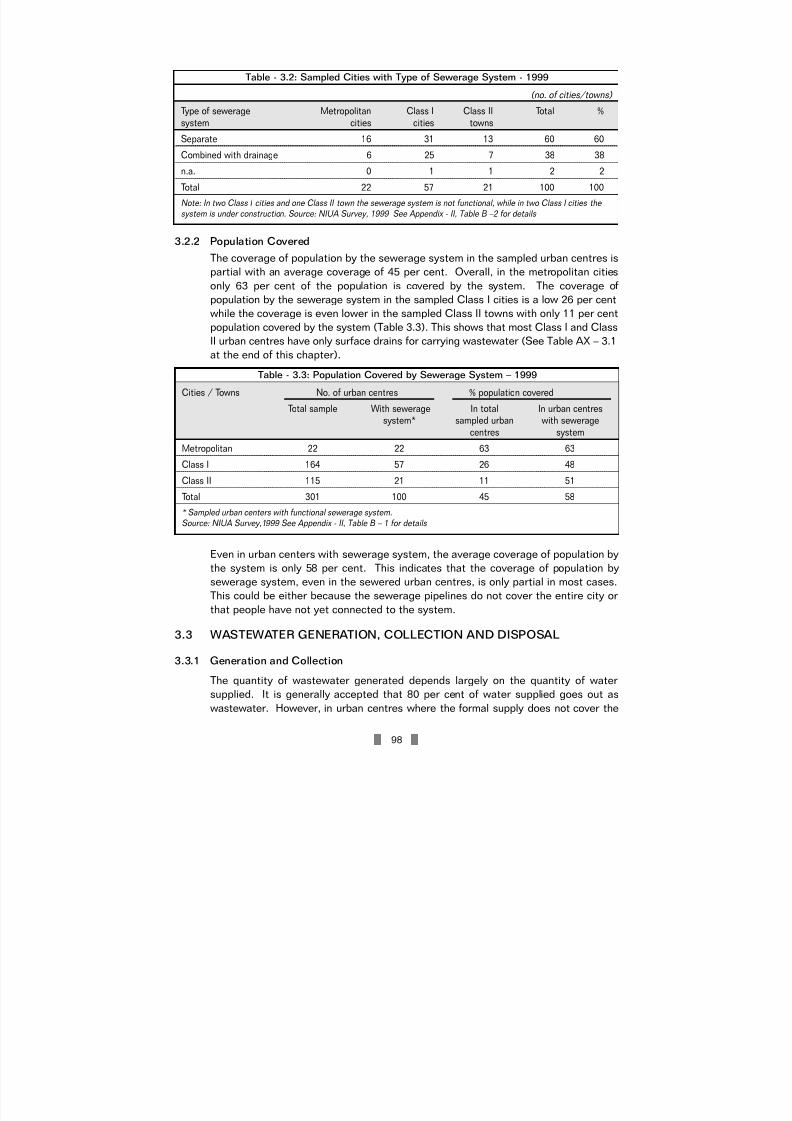
7/21/2019 Status Watersupply
http://slidepdf.com/reader/full/status-watersupply 118/869
98
3.2.2 Population Covered
The coverage of population by the sewerage system in the sampled urban centres is
partial with an average coverage of 45 per cent. Overall, in the metropolitan cities
only 63 per cent of the population is covered by the system. The coverage of
population by the sewerage system in the sampled Class I cities is a low 26 per centwhile the coverage is even lower in the sampled Class II towns with only 11 per cent
population covered by the system (Table 3.3). This shows that most Class I and Class
II urban centres have only surface drains for carrying wastewater (See Table AX – 3.1
at the end of this chapter).
Even in urban centers with sewerage system, the average coverage of population by
the system is only 58 per cent. This indicates that the coverage of population by
sewerage system, even in the sewered urban centres, is only partial in most cases.
This could be either because the sewerage pipelines do not cover the entire city or
that people have not yet connected to the system.
3.3 WASTEWATER GENERATION, COLLECTION AND DISPOSAL
3.3.1 Generation and Collection
The quantity of wastewater generated depends largely on the quantity of water
supplied. It is generally accepted that 80 per cent of water supplied goes out as
wastewater. However, in urban centres where the formal supply does not cover the
(no. of cities/towns)
Type of sewerage Metropolitan Class I Class II Total %
system cities cities towns
Separate 16 31 13 60 60
Combined with drainage 6 25 7 38 38
n.a. 0 1 1 2 2
Total 22 57 21 100 100
Note: In two Class I cities and one Class II town the sewerage system is not functional, while in two Class I cities the
system is under construction. Source: NIUA Survey, 1999 See Appendix - II, Table B –2 for details
Table - 3.2: Sampled Cities with Type of Sewerage System - 1999
Cities / Towns No. of urban centres % population covered
Total sample With sewerage In total In urban centressystem* sampled urban with sewerage
centres system
Metropolitan 22 22 63 63Class I 164 57 26 48
Class II 115 21 11 51
Total 301 100 45 58
* Sampled urban centers with functional sewerage system.
Source: NIUA Survey,1999 See Appendix - II, Table B – 1 for details
Table - 3.3: Population Covered by Sewerage System – 1999

7/21/2019 Status Watersupply
http://slidepdf.com/reader/full/status-watersupply 119/869
99
entire population, informal sources of water supply would also contribute to
wastewater generation. The wastewater collection system has to, therefore, be
designed for at least 80 per cent of the formal water supply.
The present survey indicates that, on an average, only 59 per cent of the wastewater
generated is collected by the sewerage system in the responding urban centres
(having a sewerage system). This indicates that either the sewerage system has only
a limited capacity to collect wastewater or that the entire population for which the
system has been designed has not obtained connection to the system. The
wastewater collection efficiency is not very different in the responding urban centres
of different size classes with the percentage wastewater collected ranging between
52 to 65 per cent of the wastewater generated (Table 3.4 & 3.5).
In a little over one-third of the sampled urban centres, having a sewerage system, the
wastewater collected amounts to less than half of what is generated daily. In fact, in
16 per cent of these urban centres less than a quarter of the wastewater generated
Waste water volume Metropolitan Class I Class II Total
cities cities towns
Wastewater generated (mld) 10907.0 3298.2 208.3 14413.5
Wastewater collected (mld) 6707.0 1703.7 135.8 8546.6
Wastewater treated (mld) 4424.3 826.1 23.6 5274.0
Wastewater discharged untreated (mld) 6482.7 2472.1 184.7 9139.5
% collected to generated 61 52 65 59
% treated to collected 66 48 17 62
% treated to generated 41 25 11 37
No. of cities/ towns 21 57 21 100* Excludes Lucknow for which information on quantity of waste water treated was not availaleSource: NIUA Survey, 1999. See Appendix - II, Table B – 2 for details
Table - 3.4: Volume of Wastewater Generated, Collected and Treated – 1999
(no. of cities/towns)
% waste water collected Metropolitan Class I Class II Total %
to generated cities cities towns
≤ 25 2 12 2 16 16
>25 to 50 6 17 2 25 25
>50 to 75 11 17 12 40 40>75 to 99 3 11 5 19 19
100 0 0 0 0 0
n.a. 0 0 0 0 0
Total no. of urban cetres 22 57 21 100 100
Average (%) 61 52 65 59
Source: NIUA Survey,1999. See Appendix - II, Table B – 2 for details
Table - 3.5: Wastewater Collection Efficiency - 1999

7/21/2019 Status Watersupply
http://slidepdf.com/reader/full/status-watersupply 120/869
100
is collected daily (Table 3.5). Low coverage of population by sewers, even in the urban
centres with a sewerage system, is the reason for the low collection efficiency. There
is thus a need to expand the coverage of the sewerage system in order to improve
the collection efficiency.
3.3.2 Discharge of Wastewater
Almost 36 per cent of the responding urban centres discharge wastewater only into
water body while 22 per discharge only on land. Nearly 41 percent of the urban
centres use both land and water body for discharging wastewater. The place of
wastewater disposal depends on the option selected by the concerned authority,
which may be based on local and financial considerations (Table 3.6).
3.3.3 Recycling/Reuse of Wastewater
Recycling/ reuse of wastewater is not practiced in many urban centres. The presentstudy indicates that only 44 urban centres in the sample recycle/reuse wastewater
for agriculture/ horticultural purposes. In 16 of these urban centres 100 per cent of
the wastewater collected is recycled while in 6 urban centres less than ten percent of
wastewater is recycled (Table 3.7).
A disaggregation of urban centers that recycle wastewater indicates that 26 per cent
of wastewater collected is recycled in the 11 metropolitan cities, 55 percent in the 25
Class I cities and 100 per cent in the 8 Class II towns. This indicates that as the size
of the urban centers decrease the greater is the recycling of wastewater (in
percentage terms). This could be due to the proximity of agricultural fields allowing
the wastewater to be recycled and also the lack of funds to set up water treatment
plants. Overall, about 30 per cent of the wastewater collected is recycled.
Recycling of wastewater not only helps reduce pollution of land and water bodies
but also has implications for water demand and additional investment
requirements in water supply. Recycling/ reuse of wastewater can reduce or
postpone the need for developing new sources of water supply and also help
improve the environment.
(no. of cities/towns)
Discharge of Metropolitan Class I Class II Total %
Wastewater into cities cities towns
Land 3 19 0 22 22
Water body 9 20 7 36 36
Land and water body 10 18 13 41 41
n.a. 0 0 1 1 1
Total 22 57 21 100 100
Source: NIUA Survey,1999. See Appendix - II, Table B – 2 for details
Table - 3.6: Discharge of Wastewater - 1999

7/21/2019 Status Watersupply
http://slidepdf.com/reader/full/status-watersupply 121/869
101
3.4 WASTE WATER TREATMENT
3.4.1 Treatment
Disposal of untreated wastewater pollutes water bodies/ land and is a major health
hazard. Many urban centres, in the present study, either do not have any treatment
facilities or have inadequate treatment facilities. Only 62 per cent of the wastewater
collected, in 100 sampled urban centres with functional sewerage system, is given
any form of treatment before disposal while the rest is disposed off untreated into
land or water body. In actual terms, about 9139 million litres of wastewater is
discharged untreated into land or water bodies everyday from just these 100 urban
centres in the country. A larger percentage of wastewater collected is treated in the
metropolitan cities (66%) than in the Class I cities (48%) and Class II towns (17%).
In terms of volume, the quantity of wastewater discharged untreated from the 21
metropolitan cities is 6483 million litres daily (Table 3.4 & 3.8).The present survey indicates that in 47 per cent of the sampled urban centres, with
(no. of cities/towns)
% Recycle/reuse of sewage Metropolitan Class I Class II Total %for agriculture/horticulture cities cities towns
<10 4 2 0 6 14
10 – 25 2 1 0 3 7
25 – 50 3 6 0 9 20
>50 2 16 8 26 59
Total 11 25 8 44 100
Average (%) 26 55 100 30
Source: NIUA Survey, 1999. See Appendix - II, Table B – 4 for details
Table - 3.7: Recycling of Wastewater - 1999
(no. of cities/towns)
% waste water treated Metropolitan Class I Class II Total %to collected cities cities towns
0 3 29 15 47 47
1 to 25 1 2 1 4 4
25 – 50 2 5 0 7 7
50 - 75 5 5 0 10 1075 - 99 0 5 0 5 5
100 10 11 5 26 26
n.a. 1 0 0 1 1
Total no. of urban cetres 22 57 21 100 100
Average (%) 66 48 17 62
Source: NIUA Survey,1999. See Appendix - II, Table B – 2 for details
Table - 3.8: Wastewater Treated to Collected - 1999

7/21/2019 Status Watersupply
http://slidepdf.com/reader/full/status-watersupply 122/869
102
sewerage system, the entire wastewater collected is discharged without any
treatment. While in almost one-fourth of the urban centres 100 per cent of the
wastewater collected is treated before disposal (Table 3.8). A majority of the sampled
class II towns and a significant percentage of Class I cities, with sewerage system,
do not have wastewater treatment facilities, and hence do not treat the wastewater
before discharging. The level of water and land pollution due to untreated wastewater
in the relatively smaller urban centres can be gauged by this situation. Efforts will
have to be made to provide at least primary wastewater treatment facilities in these
towns to reduce the level of pollution created by the discharge of untreated
wastewater.
3.4.2 Type of Treatment
In about 19 per cent of the responding urban centres only primary treatment is
provided to wastewater before disposal into land or water body, while 38 per cent of
urban centres also provide secondary treatment to wastewater before disposal (Table
3.9).
A larger percentage of metropolitan cities provide secondary treatment to
wastewater than the other size class of urban centres. Almost two-fifths of the
responding urban centres do not provide any treatment to water before disposal.
3.4.3 Treatment Process
The most commonly used wastewater treatment process in the responding urban
centres, with sewerage system, is extended aeration, which is practiced in 33 per
cent of the responding urban centres. Activated sludge process is used in 9 per
cent and stabilization ponds in 3 per cent of the responding urban centres (Table3.10).
3.4.4 Sewage Treatment Plants
All urban centres with sewerage system should have STPs to treat wastewater. The
present survey shows that STPs are available in only 50 of the 100 urban centres with
sewerage system (Table 3.11).
(no. of cities/towns)
Type of wastewater Metropolitan Class I Class II Total %treatment cities cities towns
Primary 9 8 2 19 19
Primary and Secondary 9 24 5 38 38
None 3 26 14 43 43
n.a. 1 1 0 2 2
Total 22 57 21 100 100
Source: NIUA Survey,1999. See Appendix - II, Table B – 3 for details
Table - 3.9: Type of Wastewater Treatment - 1999

7/21/2019 Status Watersupply
http://slidepdf.com/reader/full/status-watersupply 123/869
103
While most of the metropolitan cities (18 out of 22) have STPs, only 28 of the 57
Class I cities and 4 of the 21 Class II towns with sewerage system have STPs. There
is thus a need to construct sewage treatment plants in all the urban centres with
sewerage system.
3.5 CHARGING FOR WASTEWATER
Providing sewerage system along with treatment facilities is an expensive
proposition. In Indian cities and towns there is no established mechanism for cost
recovery from this service. The present survey reveals that charging for wastewatercollection and treatment in the sampled urban centres is done by three methods:
Levying a tax (sewerage/ drainage tax) – this is a percentage of property tax and
varies from 1 per cent to 25 per cent of annual rateable value (arv) of property.
Levying a charge per water closet (WC) – this type of charge is common in most
sampled urban centres of Haryana and in some urban centres of Punjab and
Andhra Pradesh. The rate charged per water closet varies from Rs. 24 to Rs. 200
(no. of cities/towns)
Wastewater treatment Metropolitan Class I Class II Total %process cities cities towns
Extended aeration 10 19 4 33 33
Activated sludge process 4 4 1 9 9
Stabilization pond 1 2 0 3 3
Up-flow anaerobic sludge
blanket (UASB) 0 5 0 5 5
Others* 3 0 2 5 5
n.a. 1 1 0 2 2
None 3 26 14 43 43
Total 22 57 21 100 100
Source: NIUA Survey, 1999. See Appendix - II, Table B – 3 for details
* Others include cases where there is a combination of 2 treatment processes or a different process from the choices
given.
Table - 3.10: Wastewater Treatment Process – 1999
(no. of cities/towns)
With Sewage Without Sewage TotalTreatment Plant Treatment Plant
Metropolitan Cities 18 4 22
Class I Cities 29 28 57
Class II Towns 4 17 21
Total 51 49 100
Source: NIUA Survey, 1999 See Appendix - II, Table B – 3 for details
Table – 3.11: Sewage Treatment Plants – 1999

7/21/2019 Status Watersupply
http://slidepdf.com/reader/full/status-watersupply 124/869
104
per year in the sampled urban centres. This charge, in some cities, is also called
tax (and not a charge).
Levying a surcharge on water – this is practised in only four of the sampled urban
centres (Bangalore, Chennai, Hyderabad and Ajmer). The surcharge varies from
20 to 35 per cent of water charges in these cities.
Others methods of charging - In some cities the basis of charging is different to all
the other sampled urban centres. Calcutta charges a certain percentage of water tax
as sewerage tax while in Mangalore the basis of charging is by area (Table 3.12 ).
Metropolitan Cities Rate (percentage of property tax)
Delhi 5% of arv
Greater Mumbai 25% of arv
Jaipur 20% of arv
Kanpur 4 % of arvLucknow 3 % of arv
Pune 4% of arv
Other cities Rate (percentage of property tax)
Allahabad 4 % of arv
Bareilly 4 % of arv
Bhind 1.5% to 2.5% on arv
Bhuj 6% of arv
Ghaziabad 2.5 % of arv
Hardwar 2 % of arv
Kolhapur 1.5 to 2.5% of arv
Mirzapur 2.5%of arv
Morena 3% of arv
Navsari 6% of arv
Rajkot 9% of arv
Roorkee 5 % of arv
Solapur 1% of arv
Tiruchirapalli 1.5 % of arv
City Rate (per water closet - domestic)
Ambala Rs. 60 per wc/ yr.
Bhubaneswar Rs.120 per wc/yr.
Dhule Rs. 200 per wc/yr.
Eluru Rs. 24 per wc/ yr.
Guntur Rs. 60 per wc/yr. & Rs. 120 per wc/ yr.
(non-domestic)
Gurgaon Rs. 60 per wc/ yr.
Table - 3.12 : Sources of Revenue for Wastewater Management – 1999
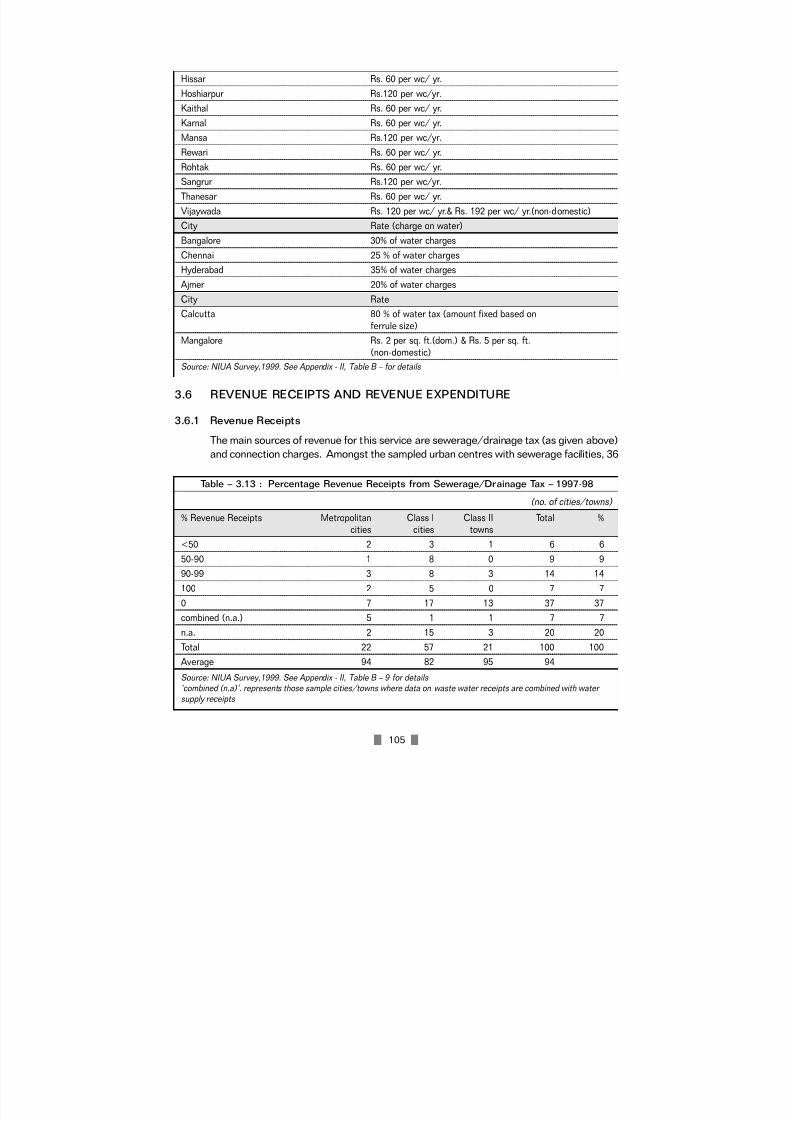
7/21/2019 Status Watersupply
http://slidepdf.com/reader/full/status-watersupply 125/869
105
3.6 REVENUE RECEIPTS AND REVENUE EXPENDITURE
3.6.1 Revenue Receipts
The main sources of revenue for this service are sewerage/drainage tax (as given above)
and connection charges. Amongst the sampled urban centres with sewerage facilities, 36
Hissar Rs. 60 per wc/ yr.
Hoshiarpur Rs.120 per wc/yr.
Kaithal Rs. 60 per wc/ yr.
Karnal Rs. 60 per wc/ yr.
Mansa Rs.120 per wc/yr.
Rewari Rs. 60 per wc/ yr.
Rohtak Rs. 60 per wc/ yr.
Sangrur Rs.120 per wc/yr.
Thanesar Rs. 60 per wc/ yr.
Vijaywada Rs. 120 per wc/ yr.& Rs. 192 per wc/ yr.(non-domestic)
City Rate (charge on water)
Bangalore 30% of water charges
Chennai 25 % of water charges
Hyderabad 35% of water charges
Ajmer 20% of water charges
City RateCalcutta 80 % of water tax (amount fixed based on
ferrule size)
Mangalore Rs. 2 per sq. ft.(dom.) & Rs. 5 per sq. ft.
(non-domestic)
Source: NIUA Survey,1999. See Appendix - II, Table B – for details
(no. of cities/towns)
% Revenue Receipts Metropolitan Class I Class II Total %cities cities towns
<50 2 3 1 6 6
50-90 1 8 0 9 9
90-99 3 8 3 14 14
100 2 5 0 7 7
0 7 17 13 37 37combined (n.a.) 5 1 1 7 7
n.a. 2 15 3 20 20
Total 22 57 21 100 100
Average 94 82 95 94
Source: NIUA Survey,1999. See Appendix - II, Table B – 9 for details ‘combined (n.a)’. represents those sample cities/towns where data on waste water receipts are combined with water
supply receipts
Table – 3.13 : Percentage Revenue Receipts from Sewerage/Drainage Tax – 1997-98

7/21/2019 Status Watersupply
http://slidepdf.com/reader/full/status-watersupply 126/869
106
urban centres have indicated revenues from sewage/drainage tax (Table 3.13) while 48
have indicated revenues from connection charges in 1997-98. (Table 3.14).
Only 20 urban centres, with sewerage system, have generated revenues from both
sewerage/drainage tax and connection charges in 1997-98. As can be seen from Table
3.13, sewerage/ drainage tax forms a very high percentage of revenues (over 50%) for
this service. In 7 sampled urban centres the entire revenue comes only from tax sources.
Revenues from connection charges, forms a relatively smaller proportion of revenues
for this service. In a large number of sampled urban centres the revenues from
connection charges form less than a quarter of the total revenues from sewerage
service. However, there are 18 urban centres whose entire revenue comes only from
connection charges (Table 3.14).
3.6.2 Cost Recovery
Wastewater management is a service from which cost recovery is generally very low
and it is often considered an expenditure-dominated service. Although partial cost
recovery is observed in some urban centres, the recovery rates are generally very
low. There are some urban centres where no revenue is generated from the service.
As indicated earlier, the main source of revenue for the service is from tax, though
charges per water closet also allows reasonable recovery.
The present survey shows that, despite the general grim scenario, 12* sewered urban
centres are able to recover full cost of the service while a majority of urban centres
are able to recover only less than 25 per cent of the expenditure on the service.
(no. of cities/towns)
% Revenue Receipts Metropolitan Class I Class II Total %
cities cities towns<25 3 13 5 21 21
25 - 50 1 3 1 5 5
50 - 75 1 0 0 1 1
75 - 99 0 2 1 3 3
100 3 7 8 18 18
0 7 16 2 25 25
combined (n.a.) 5 1 1 7 7
n.a. 2 15 3 20 20
Total 22 57 21 100 100
Average 22 27 52 24
Source: NIUA Survey,1999. See Appendix - II, Table B – 9 for details ‘combined (n.a)’. represents those sample cities/towns where data on waste water receipts are combined with water
supply receipts
Table – 3.14 : Percentage Revenue Receipts from Connection Charges – 1997-98
* These urban centres exclude Chennai, Bangalore and Hyderabad for which water and sewerage accounts are given together. These cities also show excess income over expenditure on water supply and sewerage services.

7/21/2019 Status Watersupply
http://slidepdf.com/reader/full/status-watersupply 127/869
107
Some urban centres (12 in this sample) do not generate any revenue from the service
(Table 3.15).
The average cost recovery in the metropolitan cities from this service is a mere 15
per cent if the outlyers are excluded. These outlyers are 4 metro cities (Mumbai,
Pune, Madurai and Vadodara), which generate excess revenue to expenditure. If
these cities are included in the calculation of average, then the cost recovery fromthe service, in metropolitan cities, goes up to a staggering 146 per cent. Similarly, the
low cost recovery rates in Class I and Class II urban centers also show significant
variations when extreme values (recovery of over 100 per cent) are excluded from the
calculation of average (Table 3.15).
The reasons for a few urban centres generating excess revenue over expenditure in
1997-98 needs to be explained. The present study considers sewerage/drainage tax
and connection charges as revenue sources for this service. Some of the urban
centres that have shown an excess of revenue over expenditure in this service in
1997-98 have significant tax collections on this head, as is the case in Vadodara,
Vijayawada, Bhuj and Mangalore. Mumbai generates substantial revenues fromsurcharge on measured water supplied, and from sewerage tax and sewerage
benefit tax. Pune generates significant revenues from drainage charges, sewerage
benefit tax and connection charges. Guntur and Tiruchirapalli have shown unusually
high revenues in 1997-98 owing mainly to the underground drainage development
charges (which are one time charges). Tiruchirapalli has also given the O&M of the
sewerage system to private contractors, the cost of which is not entered in the
books on this head. Some of the other reasons for excess revenues over expenditure
(no. of cities/towns)
% Receipts to Metropolitan Class I Class II Total %Expenditure cities cities towns
0 0 11 2 13 13
0-25 6 22 8 36 36
25-50 3 5 2 10 10
50-75 0 4 3 7 7
75-100 2 1 1 4 4
>100 4 7 1 12 12
combined (n.a.) 5 1 1 7 7
n.a. 2 6 3 11 11
Total 22 57 21 100 100
Average (%)* 146 29 35 127
Average (%)** 15 14 2 15
Source: NIUA Survey, 1999. See Appendix - II, Table B –11 for details ‘combined (n.a)’. represents those sample
cities/towns where data on waste water receipts are combined with water supply receipts
* Average with outlyers ** Average without outlyers
Table – 3.15 : Percentage Revenue Receipts to Revenue Expenditure – 1997-98
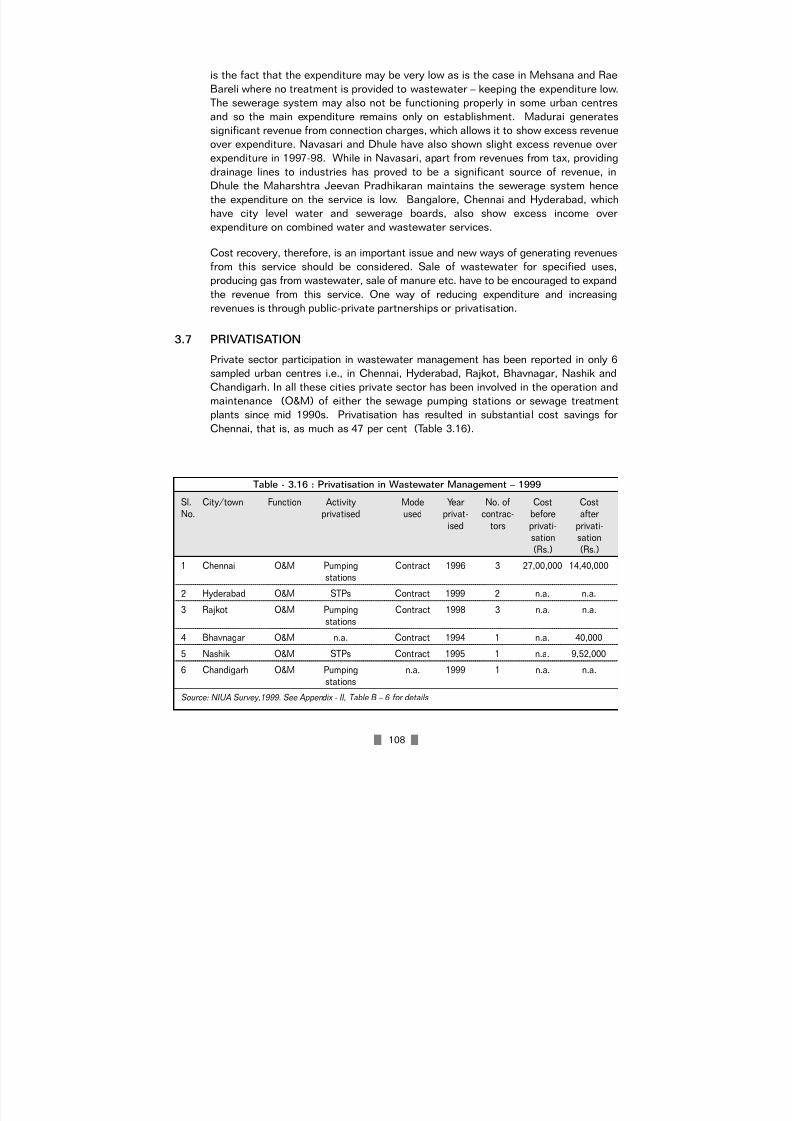
7/21/2019 Status Watersupply
http://slidepdf.com/reader/full/status-watersupply 128/869
108
is the fact that the expenditure may be very low as is the case in Mehsana and Rae
Bareli where no treatment is provided to wastewater – keeping the expenditure low.
The sewerage system may also not be functioning properly in some urban centres
and so the main expenditure remains only on establishment. Madurai generates
significant revenue from connection charges, which allows it to show excess revenue
over expenditure. Navasari and Dhule have also shown slight excess revenue over
expenditure in 1997-98. While in Navasari, apart from revenues from tax, providing
drainage lines to industries has proved to be a significant source of revenue, in
Dhule the Maharshtra Jeevan Pradhikaran maintains the sewerage system hence
the expenditure on the service is low. Bangalore, Chennai and Hyderabad, which
have city level water and sewerage boards, also show excess income over
expenditure on combined water and wastewater services.
Cost recovery, therefore, is an important issue and new ways of generating revenues
from this service should be considered. Sale of wastewater for specified uses,
producing gas from wastewater, sale of manure etc. have to be encouraged to expand
the revenue from this service. One way of reducing expenditure and increasing
revenues is through public-private partnerships or privatisation.
3.7 PRIVATISATION
Private sector participation in wastewater management has been reported in only 6
sampled urban centres i.e., in Chennai, Hyderabad, Rajkot, Bhavnagar, Nashik and
Chandigarh. In all these cities private sector has been involved in the operation and
maintenance (O&M) of either the sewage pumping stations or sewage treatment
plants since mid 1990s. Privatisation has resulted in substantial cost savings for
Chennai, that is, as much as 47 per cent (Table 3.16).
Sl. City/town Function Activity Mode Year No. of Cost CostNo. privatised used privat- contrac- before after
ised tors privati- privati-sation sation(Rs.) (Rs.)
1 Chennai O&M Pumping Contract 1996 3 27,00,000 14,40,000stations
2 Hyderabad O&M STPs Contract 1999 2 n.a. n.a.
3 Rajkot O&M Pumping Contract 1998 3 n.a. n.a.stations
4 Bhavnagar O&M n.a. Contract 1994 1 n.a. 40,000
5 Nashik O&M STPs Contract 1995 1 n.a. 9,52,000
6 Chandigarh O&M Pumping n.a. 1999 1 n.a. n.a.stations
Source: NIUA Survey,1999. See Appendix - II, Table B – 6 for details
Table - 3.16 : Privatisation in Wastewater Management – 1999

7/21/2019 Status Watersupply
http://slidepdf.com/reader/full/status-watersupply 129/869
109
3.8 CAPITAL EXPENDITURE
While a majority of the cities do not have underground drainage systems, only a few
unsewered cities have indicated capital investment in sewerage related works. Most
of the capital works are Capital expenditure on sewerage related works has been
undertaken in only about 21 per cent of the sampled cities. The expenditure has been
incurred mainly for augmentation (12% cities), improving existing systems (4% cities)and adding new pipelines (5% cities). The components of expenditure also include
treatment plants (3% cities), pumping stations and creating treatment facility such as
lagoons. (See Appendix II, Table B-7).
As per the present survey, not too many unsewered urban centres are undertaking
capital works in the near future to provide safe sanitation to their population. Only
about 10 cities have indicated capital expenditure on sewerage related works of
which only two are non-sewered urban centres. There is, thus a need to make
additional capital investments to provide safe sanitation to all.
3.9 SEPTIC TANKS AND LOW COST SANITATION
Providing sewerage system in urban centres, though desirable, requires heavy
capital investment for construction and requires regular funds for maintenance.
However, providing sewerage system to all urban centres may not be feasible or
desirable, given the water supply situation and the state of municipal finances (the
present survey shows that almost half the sampled urban centres do not get
adequate water). Therefore, the urban centres that do not have sewerage system
and cannot provide one, can opt for low cost solutions. Septic tanks and low cost
sanitation systems are the solutions for providing safe sanitation facilities for such
urban centres and even for those that have partial coverage by sewerage system. A
section of the population in most urban centres uses community toilets while theremaining resort to open defecation. Dry latrines too are still in existence in some
cities. Data on this aspect was very difficult to obtain from local governments. Even
where data has been provided by the agency concerned, the data were not found to
be very reliable.
Most urban centres have population that depend on septic tanks and low cost
sanitation, even in the urban centres that have a sewerage system (Table AX-3.1 at
the end of this chapter). The present survey indicates that almost one-third (34%) of
the population in the sampled urban centres10 is covered by septic tanks and low cost
sanitation. The percentage of population dependent on low cost sanitation is higher
in Class I and Class II urban centres as the population covered by sewerage systemin these urban centres is low (Table 3.17).
10 Data on low cost sanitation has been furnished only by about 80 per cent of the sampled urban centres.

7/21/2019 Status Watersupply
http://slidepdf.com/reader/full/status-watersupply 130/869
110
3.10 ADDITIONAL CAPITAL INVESTMENT REQUIREMENTS
A little above 50 per cent of the population is covered by sanitation facilities in urbanIndia at present. Lack of facilities for wastewater management creates insanitary
conditions and therefore, there is a need to accord high priority to wastewater
management.
The target of the government is to eventually provide safe sanitation facilities to 100
per cent of urban population. However, the target for the immediate future (that is till
2002) is to cover 75 per cent of the population by the service. Achieving these
targets requires substantial investments in this sector. The present study has
projected the additional investment requirements in this sector to cover 75 per cent
of the population by the year 2002 and the entire population with safe sanitation
facilities thereafter till 2022.
3.10.1 Projection Methodology
For projecting the additional capital investment requirements the following were
required:
a) the total urban population projected till the year 2022 at five year intervals
starting 2002 A.D. – for which the Registrar General of India’s population
projection has been used (Table 3.18).
b) the division of the projected urban population by size class of urban centres for
different years (Table 3.19);
c) the present uncovered population by the service by size class of urban centres(Table 3.20).
The backlog population to be covered has been calculated by using the
percentage population not covered in 1999, which has been taken from the
present survey. The population to be covered in different years, including the
backlog till 1999, by size class has been arrived at by using the 9th Plan target of
covering 75 per cent of the population till the year 2002 and covering 100 per cent
of the population thereafter.
(no. of cities/towns)
% Population Metropolitan Class I Class II Total %
cities cities towns
<25 8 46 15 69 26
25 - 50 10 26 26 62 23
50 - 75 0 27 30 57 22
>75 0 28 24 52 20
Data not available 4 15 5 24 9
Total 22 142 100 264 100
Average (%) 25 41 55 34
Source: NIUA Survey,1999.See Appendix - II, Table B – 12 for details
Table – 3.17 : Population Dependant on Septic Tanks and LCS

7/21/2019 Status Watersupply
http://slidepdf.com/reader/full/status-watersupply 131/869
111
(in million)
Year Size class of cities and towns
Metro I** II III IV V VI Total
1991(% Population)23.00 33.67 13.33 16.35 9.77 3.43 0.45 100.00
1999 64.10 93.84 37.15 45.57 27.23 9.56 1.25 278.70
2002 69.34 101.51 40.19 49.29 29.45 10.34 1.36 301.48
2007 79.11 115.82 45.85 56.24 33.61 11.80 1.55 343.97
2012 89.58 131.14 51.92 63.68 38.05 13.36 1.75 389.48
2017 101.11 148.02 58.60 71.88 42.95 15.08 1.98 439.61
2022 114.16 167.13 66.17 81.16 48.50 17.03 2.23 496.37
Note: The proportion of population in each size class is for the individual cities and towns and not for urban
agglomerations and the proportions are assumed to be constant for the projected period i.e., upto 2022.
Source for proportion of population in each size class - Census of India 1991, Series 1 - India, General Population Tables Part II-A (ii) Towns and Urban Agglomerations 1991 with their Population 1901 - 1991, Statement-3, p.32
Source for size class-wise population distribution - Projections based on Census of India’s ‘Population Projections for India and States 1996-2016’, Registrar General, India, New Delhi, 1996.
* Population as on 1st July of the respective years. ** Class I cities exclude metropolitan cities.
Table – 3.18 : Class-wise Projection of Urban Population* in Different Years
(in million)
Year Size class of cities and towns
Metro I II III IV V VI Total
Backlog 1999 21.63 52.08 24.80 30.42 18.18 6.38 0.84 154.32
1999-2002 9.34 18.77 8.48 10.40 6.21 2.18 0.29 55.67
2002-2007 12.89 20.56 8.49 10.41 6.22 2.18 0.29 61.05
2007-2012 10.47 15.32 6.07 7.44 4.45 1.56 0.20 45.51
2012-2017 11.53 16.88 6.68 8.20 4.90 1.72 0.23 50.13
2017-2022 13.05 19.11 7.57 9.28 5.55 1.95 0.26 56.76
Total 78.91 142.73 62.08 76.14 45.50 15.97 2.10 423.43
Source: Derived from Table 3.18 Calculations till 2002 are based on 75% coverage of population
Table – 3.19 : Additional Population to be Covered in Different Years by Size Class
(used for calculating the backlog)
Size class of cities/towns % Population covered % Population not covered
Metro 59 41
I 70 30
II 65 35
III 50 50
IV 50 50
V 50 50
VI 50 50
Source: NIUA Survey,1999. See Appendix - II, Table B – 12 for details
Table – 3.20 : Coverage of Population by Safe Sanitation - 1999
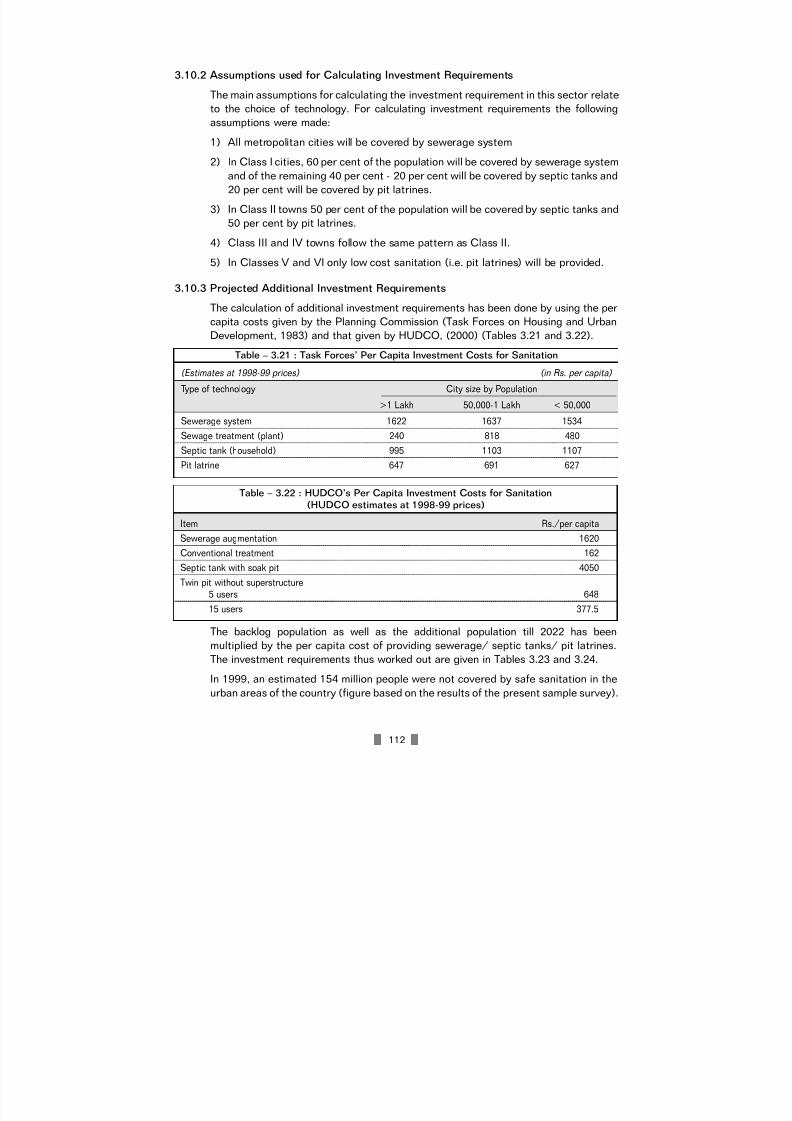
7/21/2019 Status Watersupply
http://slidepdf.com/reader/full/status-watersupply 132/869
112
3.10.2 Assumptions used for Calculating Investment Requirements
The main assumptions for calculating the investment requirement in this sector relate
to the choice of technology. For calculating investment requirements the following
assumptions were made:
1) All metropolitan cities will be covered by sewerage system
2) In Class I cities, 60 per cent of the population will be covered by sewerage system
and of the remaining 40 per cent - 20 per cent will be covered by septic tanks and
20 per cent will be covered by pit latrines.
3) In Class II towns 50 per cent of the population will be covered by septic tanks and
50 per cent by pit latrines.
4) Class III and IV towns follow the same pattern as Class II.
5) In Classes V and VI only low cost sanitation (i.e. pit latrines) will be provided.
3.10.3 Projected Additional Investment Requirements
The calculation of additional investment requirements has been done by using the per
capita costs given by the Planning Commission (Task Forces on Housing and Urban
Development, 1983) and that given by HUDCO, (2000) (Tables 3.21 and 3.22).
The backlog population as well as the additional population till 2022 has been
multiplied by the per capita cost of providing sewerage/ septic tanks/ pit latrines.
The investment requirements thus worked out are given in Tables 3.23 and 3.24.
In 1999, an estimated 154 million people were not covered by safe sanitation in the
urban areas of the country (figure based on the results of the present sample survey).
(Estimates at 1998-99 prices) (in Rs. per capita)
Type of technology City size by Population
>1 Lakh 50,000-1 Lakh < 50,000
Sewerage system 1622 1637 1534
Sewage treatment (plant) 240 818 480
Septic tank (household) 995 1103 1107Pit latrine 647 691 627
Table – 3.21 : Task Forces’ Per Capita Investment Costs for Sanitation
Item Rs./per capita
Sewerage augmentation 1620
Conventional treatment 162
Septic tank with soak pit 4050
Twin pit without superstructure5 users 648
15 users 377.5
Table – 3.22 : HUDCO’s Per Capita Investment Costs for Sanitation
(HUDCO estimates at 1998-99 prices)

7/21/2019 Status Watersupply
http://slidepdf.com/reader/full/status-watersupply 133/869
113
Between 1999 and 2022 over 200 million would be added to the urban population of
the country and this additional population will also have to be covered by safe
sanitation. Provision, therefore, has to be made to cover over 400 million people by
safe sanitation between 1999 and 2022. This requires huge financial investments to
be made in the sanitation sector.
The present financial requirement estimations are based on the per capita cost
estimates provided by the Task Forces on Housing and Urban Development andHUDCO. All cost figures are at 1998-99 prices.
The additional capital investment required to cover 75 per cent of the uncovered
population upto the year 2002 (i.e. 209.99 million people) is Rs. 25,446.69 crores
using Task Forces per capita cost estimates. Using HUDCO’s per capita cost
estimates, the additional capital investment requirement goes upto Rs. 43,511.96
crores for the same period. Almost three-fourths of this investment will be required
(Rs. in crores - at 1998-99 prices)
Year Size class of cities and towns
Metro I II III IV V VI Total
Backlog 1999 4028.19 7528.07 2223.61 2727.38 1629.75 400.20 52.50 18589.71
1999-2002 1738.86 2713.69 760.15 932.37 557.14 136.81 17.95 6856.98
2002-2007 2254.48 2746.51 697.95 856.07 511.55 125.62 16.48 7208.64
2007-2012 1948.88 2214.83 543.95 667.18 398.68 97.90 12.84 5884.25
2012-2017 2146.91 2439.88 599.22 734.97 439.19 107.85 14.15 6482.17
2017-2022 2430.81 2762.51 678.45 832.16 497.26 122.11 16.02 7339.32
Total 14548.14 20405.48 5503.32 6750.14 4033.57 990.48 129.95 52361.07
Table–3.23: Additional Investment Requirements for Providing Safe Sanitation to Population
(Using Task Forces per capita cost estimates)
(Rs. in crores - at 1998-99 prices)
Year Size class of cities and towns
Metro I II III IV V VI Total
Backlog
1999 3855.13 10461.69 5824.97 7144.65 4269.31 413.48 54.25 32023.48
1999-2002 1664.15 3771.19 1991.30 2442.45 1459.49 141.35 18.54 11488.48
2002-2007 2157.61 3816.80 1828.34 2242.57 1340.05 129.78 17.03 11532.18
2007-2012 1865.15 3077.92 1424.92 1747.75 1044.37 101.15 13.27 9274.54
2012-2017 2054.67 3390.68 1569.71 1925.34 1150.50 111.42 14.62 10216.95
2017-2022 2326.37 3839.04 1777.28 2179.94 1302.63 126.16 16.55 11567.96
Total 13923.08 28357.33 14416.53 17682.70 10566.36 1023.33 134.26 86103.59
Note: Rs. 1 crore = Rs. 10,000,000
Table – 3.24: Additional Investment Requirements for Providing Safe Sanitation to Population
(Using HUDCO’s per capita cost estimates)

7/21/2019 Status Watersupply
http://slidepdf.com/reader/full/status-watersupply 134/869
114
to cover only the backlog population. Between 2002 and 2022 an investment totalling
Rs. 26,914.38 crores will be required to be invested to cover the additional population
by safe sanitation (using Task Forces per capita cost estimates). For the same period,
the total investment required would be Rs. 42,591.63 crores if HUDCO’s per capita
cost estimates are used.
The total investment required for the period 1999 to 2022 is a whopping Rs. 52,361.07 crores (using Task Forces per capita cost estimates) or Rs. 86,103.59 crores
(using HUDCO’s per capita cost estimates). The per annum investment during this
period works out to Rs. 2,276.57 crores or Rs. 3,743.63 crores respectively using the
above two estimates.
For financing such huge investments, government’s resources should be
supplemented by mobilizing resources from the private sector and from the people
themselves. Mechanisms for charging for wastewater service must be accorded
adequate attention to generate additional resources to maintain the infrastructure
and assets created.

7/21/2019 Status Watersupply
http://slidepdf.com/reader/full/status-watersupply 135/869
115
ANNEX TABLE
Sl. City/ town Population Population covered Population Total
No. 1999 by sewerage covered by populationsystem low cost coveredsanitation
Number % Number % Number %
Metropolitan Cities
1 Ahmedabad M.Corp. 3,500,000 2,800,000 80 700000 20 3500000 100
2 Bangalore M.Corp. 5,000,000 3,900,000 78 1100000 22 5000000 100
3 Bhopal M.Corp. 1,500,000 200,000 13 300000 20 500000 33
4 Calcutta M.Corp. 4,870,000 2,200,000 45 1300000 27 3500000 72
5 Chennai M.Corp. 4,363,000 4,100,000 94 n.a. n.a. n.a. n.a.
6 Coimbatore M.Corp. 971,000 270,000 28 388400 40 658400 687 Delhi M.Corp. 12,000,000 8,500,000 71 n.a. n.a. n.a. n.a.
8 Greater MumbaiM.Corp. 11,100,000 8,400,000 76 2000000 18 10400000 94
9 Hyderabad M.Corp. 4,163,000 2,350,000 56 n.a. n.a. n.a. n.a.
10 Indore M.Corp. 1,600,000 640,000 40 480000 30 1120000 70
11 Jaipur M.Corp. 2,000,000 1,000,000 50 860000 43 1860000 93
12 Kanpur M.Corp. 2,500,000 1,500,000 60 1000000 40 2500000 100
13 Kochi M.Corp. 680,000 20,000 3 n.a. n.a. n.a. n.a.
14 Lucknow M.Corp. 2,500,000 800,000 32 950000 38 1750000 70
15 Ludhiana M.Corp. 2,000,000 1,200,000 60 37860 2 1237860 62
16 Madurai M.Corp. 1,020,000 350,000 34 26500 3 376500 37
17 Nagpur M.Corp. 2,100,000 1,260,000 60 112222 5 1372222 65
18 Pune M.Corp. 2,300,000 1,732,000 75 500000 22 2232000 97
19 Surat M.Corp. 2,300,000 1,200,000 52 1000000 43 2200000 96
20 Vadodara M.Corp. 1,400,000 875,000 63 375000 27 1250000 89
21 Varanasi M.Corp. 1,152,295 700,000 61 449395 39 1149395 100
22 Visakhapatnam M.Corp. 1,280,000 90,000 7 578000 45 668000 52
Class I
Andhra Pradesh1 Anantapur MCl 250,000 0 0 175000 70 175000 70
2 Chittoor M 149,257 0 0 125000 84 125000 84
3 Cuddapah MCl 166,000 0 0 141000 85 141000 85
4 Eluru M 247,000 100,000 40 147000 60 247000 100
5 Guntur MCl 556,820 100,000 18 n.a. n.a. n.a. n.a.
6 Hindupur M 140,000 0 0 28910 21 28910 21
Table- AX- 3.1: Population Covered by Sewerage System and Low Cost Sanitation – 1999

7/21/2019 Status Watersupply
http://slidepdf.com/reader/full/status-watersupply 136/869
116
7 Kakinada M 325,000 0 0 232750 72 232750 72
8 Kurnool MCl 281,507 30,000 11 24000 9 54000 19
9 Machilipatnam M 200,000 0 0 170000 85 170000 85
10 Nandyal MCl 150,000 0 0 42976 29 42976 29
11 Nellore MCl 404,000 0 0 183000 45 183000 45
12 Nizamabad M 285,000 0 0 26855 9 26855 9
13 Ongole MCl 180,000 0 0 n.a. n.a. n.a. n.a.
14 Qutubullapur M 250,000 0 0 110000 44 110000 44
15 Rajahmundry M.Corp. 380,000 0 0 n.a. n.a. n.a. n.a.
16 Tenali M 250,000 0 0 15710 6 15710 617 Tirupati MCl 210,000 0 0 170000 81 170000 81
18 Vijaywada M.Corp. 836,850 292,900 35 543950 65 836850 100
19 Warangal M.Corp. 680,000 0 0 187639 28 187639 28
Bihar
20 Bihar Sharif M 250,000 0 0 22000 9 22000 9
21 Chhapra M 200,000 0 0 n.a. n.a. n.a. n.a.
22 Gaya M.Corp. 400,000 0 0 300000 75 300000 75
23 Katihar M 200,000 0 0 20000 10 20000 10
24 Munger M 210,000 0 0 52000 25 52000 25
25 Ranchi M.Corp. 700,000 0 0 n.a. n.a. n.a. n.a.
Gujarat
26 Anand M 175,000 105,000 60 60000 34 165000 94
27 Bharuch M 159,000 0 0 30000 19 30000 19
28 Bhavnagar M.Corp. 550,000 300,000 55 125000 23 425000 77
29 Bhuj M 118,000 106,000 90 11000 9 117000 99
30 Jamnagar M.Corp. 500,000 0 0 250000 50 250000 50
31 Junagadh M 165,000 0 0 8000 5 8000 5
32 Nadiad M 300,000 140,000 47 60000 20 200000 67
33 Navsari M 139,000 118,000 85 n.a. n.a. n.a. n.a.34 Porbandar M 142,000 0 0 90000 63 90000 63
35 Rajkot M.Corp. 1,000,000 550,000 55 64000 6 614000 61
36 Surendranagar M 150,000 0 0 150000 100 150000 100
Haryana
37 Ambala MCl 141,000 18,160 13 122470 87 140630 100
38 Faridabad M.Corp. 1,150,000 632,500 55 n.a. n.a. n.a. n.a.
Sl. City/ town Population Population covered Population Total
No. 1999 by sewerage covered by populationsystem low cost covered
sanitation
Number % Number % Number %

7/21/2019 Status Watersupply
http://slidepdf.com/reader/full/status-watersupply 137/869
117
39 Gurgaon MCl 175,000 109,000 62 28900 17 137900 79
40 Hissar MCl 250,000 130,000 52 25000 10 155000 62
41 Karnal MCl 220,000 112,000 51 30525 14 142525 65
42 Rohtak MCl 243,000 183,000 75 50000 21 233000 96
Jammu & Kashmir
43 Jammu M.Corp. 1050800 0 0 n.a. n.a. n.a. n.a.
Karnataka
44 Belgaum M.Corp. 470,000 235,000 50 n.a. n.a. n.a. n.a.
45 Bellary CMC 297,000 129,000 43 30000 10 159000 54
46 Davangere MCl 455,000 318500 70 45500 10 364000 8047 Gadag-Betigeri CMC 148,353 0 0 65000 44 65000 44
48 Gulbarga M.Corp. 450,000 150,000 33 75000 17 225000 50
49 Hubli-DharwadM. Corp. 850,000 450,000 53 102000 12 552000 65
50 Mandya M 140,000 0 0 56000 40 56000 40
51 Mangalore M.Corp. 410,000 250,000 61 10230 2 260230 63
52 Mysore M.Corp. 1,050,000 400,000 38 150000 14 550000 52
53 Shimoga CMC 221,860 80,600 36 n.a. n.a. n.a. n.a.
54 Tumkur M 300,000 0 0 49815 17 49815 17
Kerala
55 Alappuzha MC 200,000 0 0 150000 75 150000 75
56 Kollam MC 160,000 0 0 112000 70 112000 70
57 Kozhikode M.Corp. 493,000 0 0 450000 91 450000 91
58 Thalaserry M 134,000 0 0 28652 21 28652 21
59 Thiruvananthapuram M.Corp. 585,000 0 0 585000 100 585000 100
Maharashtra
60 Amravati M.Corp. 500,000 0 0 350000 70 350000 70
61 Aurangabad M.Corp. 868,000 684,000 79 155000 18 839000 97
62 Bhusawal M.Cl. 200,000 0 0 113460 57 113460 5763 Chandrapur MCl 295,000 0 0 n.a. n.a. n.a. n.a.
64 Dhule MCl 330,000 150,000 45 105000 32 255000 77
65 Ichalkaranji MCl 250,000 197,500 79 52500 21 250000 100
66 Jalgaon MCl 400,000 0 0 217000 54 217000 54
67 Kolhapur M.Corp. 502,000 200,000 40 n.a. n.a. n.a. n.a.
68 Nanded Waghala M.Corp. 410,000 250,000 61 150000 37 400000 98
Sl. City/ town Population Population covered Population Total
No. 1999 by sewerage covered by populationsystem low cost covered
sanitation
Number % Number % Number %

7/21/2019 Status Watersupply
http://slidepdf.com/reader/full/status-watersupply 138/869
118
69 Nashik M.Corp. 838,760 500,000 60 335500 40 835500 100
70 Parbhani MCl 233,000 0 0 28000 12 28000 12
71 Solapur M.Corp. 900,000 810,000 90 n.a. n.a. n.a. n.a.
72 Wardha M 150,000 0 0 10370 7 10370 7
73 Yavatmal MCl 130,000 0 0 43000 33 43000 33
Madhya Pradesh
74 Bhind M 175,000 40,000 23 n.a. n.a. n.a. n.a.
75 Burhanpur M.Corp. 210,000 0 0 n.a. n.a. n.a. n.a.
76 Dewas M.Corp. 200,000 0 0 n.a. n.a. n.a. n.a.
77 Guna M 125,000 0 0 75000 60 75000 6078 Gwalior M.Corp. 900,000 516,000 57 200000 22 716000 80
79 Jabalpur M.Corp. 1,000,000 0 0 900000 90 900000 90
80 Khandwa M 175,000 0 0 n.a. n.a. n.a. n.a.
81 Morena M 125,000 16,000 13 106000 85 122000 98
82 Murwara-Katni M.Corp. 180,000 0 0 n.a. n.a. n.a. n.a.
83 Ratlam M.Corp. 235,000 0 0 188500 80 188500 80
84 Rewa M.Corp. 180,000 0 0 102520 57 102520 57
85 Satna M.Corp. 200,000 0 0 172000 86 172000 86
86 Shivpuri M 140,000 5,000 4 100000 71 105000 75
Orissa
87 Bhubaneswar M.Corp. 653,830 200,000 31 n.a. n.a. n.a. n.a.
88 Cuttack M.Corp. 563,346 0 0 400000 71 400000 71
89 Puri M 149,802 0 0 98840 66 98840 66
90 Rourkela M 199,700 0 0 n.a. n.a. n.a. n.a.
91 Sambalpur M 157,040 0 0 n.a. n.a. n.a. n.a.
Punjab
92 Amritsar M.Corp. 843,320 505,992 60 190560 23 696552 83
93 Bathinda MCl 174,000 68,848 40 40000 23 108848 63
94 Hoshiarpur MCl 145,000 87,000 60 29500 20 116500 8095 Jalandhar M. Corp. 738,000 440,000 60 295200 40 735200 100
96 Moga MCl 147,865 99,500 67 30000 20 129500 88
97 Pathankot MCl 195,000 80,000 41 59640 31 139640 72
98 Patiala M.Corp. 328,000 200,000 61 128000 39 328000 100
Rajasthan
99 Ajmer MCl 550,000 58,000 11 96000 17 154000 28
Sl. City/ town Population Population covered Population Total
No. 1999 by sewerage covered by populationsystem low cost covered
sanitation
Number % Number % Number %

7/21/2019 Status Watersupply
http://slidepdf.com/reader/full/status-watersupply 139/869
119
100 Alwar M 300,000 0 0 150002 50 150002 50
101 Beawar M 141,000 0 0 n.a. n.a. n.a. n.a.
102 Bhilwara M 225,000 0 0 170000 76 170000 76
103 Bikaner M 600,000 126,000 21 330000 55 456000 76
104 Jodhpur M.Corp. 1,000,000 327,000 33 65055 7 392055 39
105 Kota M.Corp. 750,000 0 0 28660 4 28660 4
106 Sriganganagar M 225,000 0 0 64018 28 64018 28
Tamil Nadu
107 Cuddalore M 162,000 0 0 140000 86 140000 86
108 Dindigul M 214,000 0 0 85000 40 85000 40109 Erode M 173,600 0 0 136800 79 136800 79
110 Kanchipuram M 156,700 115,950 74 40750 26 156700 100
111 Kumbakonam M 146,833 38,000 26 94080 64 132080 90
112 Nagercoil M 205,500 0 0 185000 90 185000 90
113 Rajapalaiyam M 123,310 0 0 n.a. n.a. n.a. n.a.
114 Salem M.Corp. 447,388 0 0 n.a. n.a. n.a. n.a.
115 Thanjavur M 216,900 0 0 19275 9 19275 9
116 Tiruchirapalli M.Corp. 800,000 8,000 1 279700 35 287700 36
117 Tirunelveli M.Corp. 414,000 70,000 17 n.a. n.a. n.a. n.a.
118 Tirunvannamalai M 128,500 0 0 6690 5 6690 5
119 Tiruppur M 294,761 0 0 229300 78 229300 78
120 Tuticorin M 216,670 40,000 18 n.a. n.a. n.a. n.a.
121 Vellore M 176,000 0 0 175061 99 175061 99
Uttar Pradesh
122 Agra M.Corp. 1,150,000 0 0 n.a. n.a. n.a. n.a.
123 Aligarh M.Corp. 600,000 120,000 20 350000 58 470000 78
124 Allahabad M.Corp. 1,015,000 600,000 59 415000 41 1015000 100
125 Bareilly M.Corp. 750,000 300,000 40 150000 20 450000 60
126 Etawah MB 140,000 0 0 70000 50 70000 50127 Faizabad MB 170,000 0 0 n.a. n.a. n.a. n.a.
128 Firozabad MB 250,000 0 0 100000 40 100000 40
129 Ghaziabad M.Corp. 887,000 763,193 86 125000 14 888193 100
130 Gorakhpur M.Corp. 600,000 300,000 50 75000 13 375000 63
131 Haldwani-cum-
Kathgodam MB 140,612 0 0 27500 20 27500 20
Sl. City/ town Population Population covered Population Total
No. 1999 by sewerage covered by populationsystem low cost covered
sanitation
Number % Number % Number %

7/21/2019 Status Watersupply
http://slidepdf.com/reader/full/status-watersupply 140/869
120
132 Hapur MB 200,000 75,000 38 18500 9 93500 47
133 Hardwar MB 300,000 184,000 61 n.a. n.a. n.a. n.a.
134 Jhansi MB 506,600 0 0 230240 45 230240 45
135 Mathura MB 400,000 50,000 13 n.a. n.a. n.a. n.a.
136 Meerut M.Corp. 1,250,000 315,000 25 650000 52 965000 77
137 Mirzapur MB 210,000 153,168 73 56740 27 209908 100
138 Moradabad M.Corp. 670,000 0 0 n.a. n.a. n.a. n.a.
139 Muzaffarnagar MB 325,000 80,000 25 241000 74 321000 99
140 Rae Bareli MB 175,000 70,000 40 105000 60 175000 100
141 Rampur 317,000 0 0 n.a. n.a. n.a. n.a.142 Saharanpur MB 540,000 360,000 67 178200 33 538200 100
143 Unnao MB 121,000 0 0 33000 27 33000 27
144 Sitapur MB 150,000 0 0 33000 22 33000 22
West Bengal
145 Asansol M.Corp. 314,625 36,000 11 183000 58 219000 70
146 Balurghat M 143,000 0 0 130000 91 130000 91
147 Bankura M 132,000 0 0 126035 95 126035 95
148 Barasat M 151,000 0 0 120000 79 120000 79
149 Berhampore M 150,000 0 0 n.a. n.a. n.a. n.a.
150 Burdwan M 323,000 0 0 240000 74 240000 74
151 Halisahar M 149,000 0 0 15700 11 15700 11
152 Krishna Nagar M 145,272 0 0 116216 80 116216 80
153 Midnapur M 158,000 0 0 125000 79 125000 79
154 North Barrackpur M 118,374 0 0 20105 17 20105 17
155 Santipur M 133,911 0 0 65000 49 65000 49
156 Siliguri M.Corp. 500,000 0 0 341000 68 341000 68
Small States
157 Agartala MCl 200,000 0 0 176000 88 176000 88
158 Aizwal 244,000 0 0 n.a. n.a. n.a. n.a.159 Guwahati M.Corp. 995,000 0 0 n.a. n.a. n.a. n.a.
160 Imphal MCl 245,000 0 0 177000 72 177000 72
161 Jorhat MB 170,000 0 0 n.a. n.a. n.a. n.a.
162 Shillong MB 216,732 0 0 209007 96 209007 96
Union Territories
163 Chandigarh M.Corp. 850,000 850,000 100 100
Sl. City/ town Population Population covered Population Total
No. 1999 by sewerage covered by populationsystem low cost covered
sanitation
Number % Number % Number %

7/21/2019 Status Watersupply
http://slidepdf.com/reader/full/status-watersupply 141/869
121
164 Pondicherry M 290,000 83,000 29 102500 35 185500 64
CLASS II
Andhra Pradesh
1 Anakapalle M 115,000 0 0 25000 22 25000 22
2 Dharmavaram M 100,000 0 0 10000 10 10000 10
3 Gudur MCl 72,000 0 0 38684 54 38684 54
4 Kapra M 120,000 0 0 98332 82 98332 82
5 Kavali MCl 85,000 0 0 31000 36 31000 36
6 Madanapalle M 100,000 0 0 94000 94 94000 94
7 Narasaraopet M 95,000 0 0 n.a. n.a. n.a. n.a.8 Rajendra Nagar MCl 120,000 0 0 19600 16 19600 16
9 Sangareddy MCl 60,000 0 0 22000 37 22000 37
10 Srikakulam MCl 100,000 0 0 100000 100 100000 100
11 Srikalahasti M 70,000 0 0 70000 100 70000 100
12 Suryapet MCl 89,000 0 0 45680 51 45680 51
Bihar
13 Buxar M 66,790 0 0 55600 83 55600 83
14 Deoghar M 100,000 0 0 40000 40 40000 40
15 Hajipur M 115,000 0 0 2000 2 2000 2
16 Hazaribagh M 119,054 0 0 n.a. n.a. n.a. n.a.
17 Jehanabad M 57,030 0 0 30000 53 30000 53
18 Madhubani M 65,000 0 0 35000 54 35000 54
19 Mokama M 66,000 0 0 n.a. n.a. n.a. n.a.
Gujarat
20 Amreli M 85,000 0 0 64000 75 64000 75
21 Ankleswar M 60,000 40,000 67 n.a. n.a. n.a. n.a.
22 Dabhoi M 65,000 7,000 11 32600 50 39600 61
23 Dohad M 78,000 0 0 70000 90 70000 90
24 Gondal M 100,000 0 0 80000 80 80000 8025 Jetpur M 125,000 0 0 125000 100 125000 100
26 Mahesana M 138,000 100,000 72 20000 14 120000 87
27 Palanpur M 117,000 0 0 100000 85 100000 85
Haryana
28 Jind MCl 114,000 72,000 63 41900 37 113900 100
29 Kaithal MCl 94,545 51,000 54 13000 14 64000 68
Sl. City/ town Population Population covered Population Total
No. 1999 by sewerage covered by populationsystem low cost covered
sanitation
Number % Number % Number %

7/21/2019 Status Watersupply
http://slidepdf.com/reader/full/status-watersupply 142/869
122
30 Rewari MCl 105,000 65,000 62 40000 38 105000 100
31 Thanesar MCl 100,000 65,000 65 21000 21 86000 86
Karnataka
32 Bagalkot CMC 100,000 0 0 32000 32 32000 32
33 Chikmaglur CMC 100,000 60,000 60 40000 40 100000 100
34 Gokak CMC 68,000 0 0 25000 37 25000 37
35 Hospet CMC 114,150 0 0 n.a. n.a. n.a. n.a.
36 Kolar CMC 112,000 7,500 0 n.a. n.a. n.a. n.a.
37 Rabkavi-Banhatti
CMC 72,000 0 0 72000 100 72000 100
38 Ramanagaram CMC 70,000 0 0 40000 57 40000 57
Kerala
39 Changanessary MC 62,000 0 0 6500 10 6500 10
40 Payyanur M 70,500 0 0 8764 12 8764 12
41 Taliparamba M 52,000 0 0 9000 17 9000 17
42 Thrissur MC 91,000 0 0 54600 60 54600 60
Maharashtra
43 Amalner MCl 100,000 0 0 76000 76 76000 76
44 Ballarpur MCl 108,900 0 0 73500 67 73500 67
45 Bhandara M 76,000 0 0 45000 59 45000 59
46 Kamptee MCl 95,000 0 0 11800 12 11800 12
47 Manmad MCl 87,000 0 0 50000 57 50000 57
48 Ratnagiri MCl 70,000 0 0 28000 40 28000 40
49 Satara MCl 100,000 0 0 95180 95 95180 95
50 Virar MCl 100,000 0 0 100000 100 100000 100
Madhya Pradesh
51 Hoshangabad M 100,000 0 0 n.a. n.a. n.a. n.a.
52 Itarsi M 105,000 0 0 n.a. n.a. n.a. n.a.
53 Khargone M 80,000 0 0 n.a. n.a. n.a. n.a.54 Mandsaur M 123,000 0 0 62000 50 62000 50
55 Nagda M 100,000 0 0 n.a. n.a. n.a. n.a.
56 Neemuch M 99,506 0 0 n.a. n.a. n.a. n.a.
57 Sehore M 100,000 0 0 80000 80 80000 80
58 Shahdol M 75,000 0 0 56000 75 56000 75
59 Vidisha M 125,000 0 0 57000 46 57000 46
Sl. City/ town Population Population covered Population Total
No. 1999 by sewerage covered by populationsystem low cost covered
sanitation
Number % Number % Number %

7/21/2019 Status Watersupply
http://slidepdf.com/reader/full/status-watersupply 143/869
123
Orissa
60 Balangir M 82,600 0 0 n.a. n.a. n.a. n.a.
61 Bhadrak M 93,000 0 0 n.a. n.a. n.a. n.a.
Punjab
62 Ferozepur MCl 93,006 76,595 82 16400 18 92995 100
63 Kapurthala M 84,765 53,000 63 n.a. n.a. n.a. n.a.
64 Mansa MCl 66,568 33,000 50 31765 48 64765 97
65 Phagwara MCl 108,472 48,800 45 43070 40 91870 85
66 Sangrur MCl 70,060 65,160 93 4900 7 70060 100
Rajasthan67 Banswara M 110,000 0 0 n.a. n.a. n.a. n.a.
68 Barmer M 84,000 0 0 60000 71 60000 71
69 Bundi M 80,000 0 0 25,000 31 25000 31
70 Churu M 100,250 0 0 n.a. n.a. n.a. n.a.
71 Hanumangarh M 125,000 0 0 50,000 40 50000 40
72 Sawai Madhopur M 89,200 0 0 44,126 49 44126 49
Tamil Nadu
73 Ambur M 85,700 0 0 43000 50 43000 50
74 Arakkonam M 88,000 0 0 9750 11 9750 11
75 Attur M 64,000 0 0 56000 88 56000 88
76 Cumbum M 53,600 0 0 33570 63 33570 63
77 Dharmapuri M 66,600 0 0 34000 51 34000 51
78 Gudiyatham M 95,175 0 0 90500 95 90500 95
79 Nagapattinam M 112,200 28,000 25 80000 71 108000 96
80 Pudukkottai M 108,000 0 0 74900 69 74900 69
81 Sivakasi M 70,100 0 0 35000 50 35000 50
82 Srivilliputtur M 73,900 0 0 n.a. n.a. n.a. n.a.
83 Tindivanam M 70,000 0 0 70000 100 70000 100
84 Udhagamandalam M 100,000 51,000 51 3125 3 54125 54Uttar Pradesh
85 Auraiya MB 90,000 2,000 2 45820 51 47820 53
86 Balrampur MB 70,000 0 0 18000 26 18000 26
87 Basti MB 110,000 0 0 65000 59 65000 59
88 Bhadohi MB 125,000 25,000 20 75000 60 100000 80
89 Chandpur MB 80,000 0 0 35700 45 35700 45
Sl. City/ town Population Population covered Population Total
No. 1999 by sewerage covered by populationsystem low cost covered
sanitation
Number % Number % Number %

7/21/2019 Status Watersupply
http://slidepdf.com/reader/full/status-watersupply 144/869
124
90 Etah MB 135,000 40,000 30 20000 15 60000 44
91 Ghazipur MB 95,565 0 0 38230 40 38230 40
92 Gonda MB 114,000 0 0 48000 42 48000 42
93 Lakhimpur MB 100,000 0 0 70000 70 70000 70
94 Lalitpur MB 100,000 0 0 89230 89 89230 89
95 Mughalsarai MB 159,804 23,970 15 135,834 85 159804 100
96 Nawabganj-Barabanki MB 90,000 0 0 60000 67 60000 67
97 Orai MB 170,000 0 0 150000 88 150000 88
98 Roorkee MB 100,000 60,000 60 34000 34 94000 94
West Bengal99 Bishnupur M 67,400 0 0 48610 72 48610 72
100 Chakdaha M 89,730 0 0 58900 66 58900 66
101 Contai M 114,000 0 0 90000 79 90000 79
102 Cooch Behar M 99,400 0 0 60000 60 60000 60
103 Darjeeling M 150,000 30,000 20 78000 52 108000 72
104 Jalpaiguri M 101,088 0 0 29677 29 29677 29
105 Jangipur M 78,191 0 0 35780 46 35780 46
106 Katwa M 67,664 0 0 50000 74 50000 74
107 Raniganj M 121,000 0 0 87000 72 87000 72
Small States
108 Kohima TC 103,000 0 0 10000 10 10000 10
109 Shimla M.Corp. 111,000 72,000 65 39000 35 111000 100
110 Itanagar NTAC 33,540 0 0 28200 84 28200 84
111 Panaji MCl 57,190 30,000 52 14050 25 44050 77
Union Territories
112 Port Blair MCl 105,000 0 0 n.a. n.a. n.a. n.a.
113 Daman MCl 35,000 0 0 n.a. n.a. n.a. n.a.
114 Kavarathi 11,107 0 0 n.a. n.a. n.a. n.a.
115 Silvassa 20,000 0 0 20000 100 20000 100Source: NIUA Survey,1999. See Appendix - II, Table B – 12
Sl. City/ town Population Population covered Population Total
No. 1999 by sewerage covered by populationsystem low cost covered
sanitation
Number % Number % Number %

7/21/2019 Status Watersupply
http://slidepdf.com/reader/full/status-watersupply 145/869
125
CHAPTER IV
MUNICIPAL SOLID WASTE MANAGEMENT
4.1 BACKGROUNDGeneration of solid waste continues to increase in urban India with rapid urbanization,
rising incomes, changing consumption patterns and a shift from recycling to a throw-
away society. In urban areas the problem of solid waste management (SWM) is very
acute due to dense development and congestion. Solid waste management is an
obligatory function of urban local bodies (ULBs) in India. Most ULBs are unable to
cope with the challenging task of collection, transportation and disposal of solid
wastes not only due to rapid urbanization and rising incomes but also due to the non-
availability of required open-spaces near urban centres for landfilling. Waste,
therefore, often accumulates in open spaces, wasteland, streets, and even stagnant
water bodies causing serious health and environmental problems. Accumulation of
uncollected wastes pollutes ground water (through leachates) and surface water (dueto runoff during rains).
While SWM generally consumes a significant proportion of municipal budgets,
revenues from the service are negligible. The ULBs are also often under-staffed and
lack adequate number of vehicles to transport waste. Disposal of waste is becoming
an even more serious problem in SWM with land availability within accessible
distance becoming scarce mainly due to rapid growth of cities and towns.
Management of municipal solid waste is a service, which needs efficiency
improvements and also substantial financial support in order to bring about
significant change in the service.
This chapter presents the status of solid waste management in the country in respect
of coverage, generation, collection, transportation, disposal, staffing, privatization
efforts, and revenue receipts and expenditure. The chapter also gives the additional
investment requirements to improve the service and its coverage.
4.2 COVERAGE BY SOLID WASTE MANAGEMENT
While the municipal governments are obligated to provide this service to the entire
population within their jurisdiction, the overall coverage11 by the service in the
sampled cities is 92 per cent (Table 4.1). This indicates that local governments have
not been able to extend this service to about 8 per cent of the population in the
aggregate. There is no major difference in coverage of population by the service
between metropolitan cities, sampled Class I cities and Class II towns. Coverage
here does not, however, indicate the quality of service provided i.e., the collection
efficiency or frequency of cleaning (which have been dealt with in the following
paragraphs). Since solid waste management falls in the domain of public goods, non-
11 Coverage only means that the local body provides sweeping and collection services in the area. However, the quality of
service, frequency of collection and lifting of waste are not indicated by coverage.

7/21/2019 Status Watersupply
http://slidepdf.com/reader/full/status-watersupply 146/869
126
provision of this service or provision of poor quality service can creates health risks
to not only the population not covered by the service but also for other citizens.
4.3 SOLID WASTE GENERATION
4.3.1 Quantity Generated Per Day
The total quantity of solid waste generated by almost 140.6 million people (1999) in
the 298 responding urban centres amounts to over 60,823 MT per day (Table 4.2). In
the country’s largest cities such as Delhi and Mumbai the daily waste generation is
as high as 6,000 metric tonnes (MT) while in some of the other sampled class II cities
solid waste generated is as low as 4 MT (Dohad, Sawai Madhopur, Silvasa &
Cumbum) and 5 MT (Chandpur in Uttar Pradesh). In over two-thirds (69%) of the
sampled urban centres the average daily solid waste generation is less than 100 MT.
Overall, the total solid waste generation does not exceed 500 MT in about 92 per
cent of the sampled urban centres (Appendix - III, Table C-2). The variations in the
quantity of waste generated in cities depends upon the population size of the city, the
floating population, the income levels of the population, the economic activities, the
cultural habits of people, and so on.
(no. of cities/towns)
% Coverage Metropolitan Class I Class II Total %cities cities towns
<25 0 0 0 0 0
25 - 50 1 2 1 4 1.3
50 - 75 2 10 9 21 7.1
75 - 99 3 26 19 48 16.1
100 16 124 82 222 74.5
n.a. 0 2 1 3 1.0
Total cities/towns 22 164 112 298 100
Average (%) 90 95 93 92
Source: NIUA Survey,1999. See Appendix - III, Table C – 1 for details
Table - 4.1: Coverage of Population by Solid Waste Management Service - 1999
(no. of cities/towns)
Size class of No. of Municipal Quantity of solid Per capita
city/ town sampled cities/ population waste generated waste generated
towns 1999 daily (MT) daily (gms.)(in million)
Metropolitan 22 70.30 35157 500
Class I 164 59.94 22587 377
Class II 112 10.36 3079 297
Total 298 140.60 60823 433
Source: NIUA Survey,1999. See Appendix - III, Table C – 2 for details
Table - 4.2: Total and Per Capita Waste Generated –1999

7/21/2019 Status Watersupply
http://slidepdf.com/reader/full/status-watersupply 147/869
127
4.3.2 Quantity of Domestic and Non-Domestic Waste
The quantity of waste generated by different sources would depend on the nature of
activities in the urban centers. Not all cities have been able to provide the quantity
of waste generated by domestic and non-domestic sources – only about three-fourths
(77%) of the urban centers have provided data on this aspect. The survey results
show that, on an average, about two-thirds (31475 MT & 63%) of the wastegenerated is from domestic source while about one-third of the waste generated is
from non-domestic sources (18130 MT & 37%) (Table 4.3).
4.3.3 Hospital Waste
Collection of hospital waste is increasingly becoming an important issue and this
aspect needs urgent attention. Hospital/ medical waste, by law, must be collectedseparately from municipal wastes and major hospitals should have their own
incinerators to incinerate such waste. The remnants from incineration and the parts
that cannot/ should not be incinerated should be landfilled in a separate zone at the
landfill site
However, hospital waste is collected separately in only 66 cities and towns in a
sample of 298. In three-fourths of the sampled urban centres the hospital waste is
(no. of cities/towns)
Size class of Respond- Data Waste generated Waste % waste generatedcity/ town ing cities / not by Source by source
towns available (MT per day) from cities
responding(MT
Domestic Non- per day) Domestic NonDomestic Domestic
Metropolitan 17 5 19645 10449 30094 65 35
Class I 128 36 10309 6812 17121 60 40
Class II 83 29 1521 869 2390 64 36
Total 228 70 31475 18130 49605 63 37
Source: NIUA Survey, 1999. See Appendix - III, Table C – 2 for details
Table - 4.3: Waste Generation by Source - 1999
(no. of cities/towns)
Collection method Metropolitan Class I Class II Total %cities cities towns
Combined 6 133 91 230 77
Separate 16 29 21 66 22
n.a. 0 2 0 2 1
Total cities/towns 22 164 112 298 100
n.a. in case of Class I cities are for Halisahar in W. Bengal & Jorhat in Assam Source: NIUA Survey, 1999. See Appendix - III, Table C – 2 for details
Table - 4.4: Collection of Hospital Waste - 1999

7/21/2019 Status Watersupply
http://slidepdf.com/reader/full/status-watersupply 148/869
128
collected along with municipal solid waste (Table 4.4). This poses great health risks
to the workers dealing with waste, and more specifically to the rag pickers.
In a majority of the metropolitan cities, 16 out of the responding 22 cities, hospital
waste is collect separately though only in 11 of these cities this waste is
incinerated (Table 4.5). Overall, incineration of hospital waste is practiced in only
53 per cent of the sampled urban centres where hospital waste is collected
separately (see Table - AX-4.1 at the end of this chapter). However, in the absence
of proper landfill sites, the remains from incinerators too are landfilled along with
other wastes.
4.3.4 Per Capita Waste Generation
Per capita waste generation is a very sensitive measure, which is affected by the
population and the waste generation figures used. In the present study, the per
capita waste generation has been calculated using the estimated population of
1999 and the estimated daily waste generation in the urban centers (both as
furnished by the local governments). The daily waste generation figure is an
average for the year as the waste generated varies considerably between seasons.
The daily waste generated is also grossly overstated by many urban centers, as
these are estimates provided by the local governments. In the absence of
weighbridges, it is not possible for the local governments to estimate the waste
generated accurately. These estimated figures of waste generated as well as
population projected have affected the per capita waste generation figures in
various urban centers.
The daily per capita waste generation in the sampled cities averages 433 grams. In
metropolitan cities the average daily per capita waste generated is the highest
among the sampled cities, averaging 500 grams, while in the sampled Class I cities itis 377 grams and it is 297 grams in the sampled Class II towns (Table 4.6). While 12
per cent of the of the sampled urban centres have a per capita waste generation of
less than 150 grams daily, almost 18 per cent urban centres have a per capita waste
generation of over 500 grams daily. Higher per capita waste generation poses a
greater burden on local governments to make arrangements for collection,
transportation, and disposal of this waste.
(no. of cities/towns)
Method of treatment Metropolitan Class I Class II Total %
cities cities towns
Incineration 11 18 6 35 53
None 3 5 11 19 29
n.a. 2 6 4 12 18
Total cities/towns 16 29 21 66 100
Source: NIUA Survey,1999. See Appendix - III, Table C – 2 for details
Table - 4.5: Treatment of Hospital Waste

7/21/2019 Status Watersupply
http://slidepdf.com/reader/full/status-watersupply 149/869
129
4.4 SOLID WASTE COLLECTION
4.4.1 Waste Collection Efficiency
The task of collecting the huge quantities of waste generated in urban areas is a
daunting task for local governments. It means organising the staff for collection,
arranging transportation and finding ways of disposing the waste collected. On an
average, only 88 per cent of the solid waste generated is collected daily. In actual
terms, of the 60823 MT of solid waste generated per day in the sampled urban
centres, only 53505 MT is collected, leaving 7318 MT uncollected daily.
In the 22 metropolitan cities, despite a collection efficiency of 91 per cent, an
estimated 3170 MT of waste is left uncollected daily (Table 4.7). Such huge quantities
of uncollected waste can be a potential source of major diseases, in addition to being
very unpleasant visually.
The present survey indicates that 100 per cent collection of waste has been achieved
in only about one-third (32%) of the sampled cities. In 5 per cent of the sampled cities
less than 50 per cent of waste generated is collected. The waste collection efficiency
is better in metropolitan cities, where 91 per cent of the daily waste generated is
collected, than in the Class I cities and Class II towns where 85 per cent and 75 per
cent respectively of the daily waste generated is collected (Table 4.8).
(no. of cities/towns)
Per capita waste Metropolitan Class I Class II Total %
generation (gms./per day) cities cities towns
<150 0 14 22 36 12
150 - 250 0 32 28 60 20
250 - 350 2 37 22 61 20
350 - 500 7 40 26 73 25
>500 13 41 14 68 23
Total cities/towns 22 164 112 298 100
Average (gms) 500 377 297 433
Source: NIUA Survey,1999. See Appendix - III, Table C - 1 & 2 for details
Table - 4.6: Per Capita Waste Generation - 1999
Size class of Sample Quantity Quantitity Quantity % solidcity/town cities/ of waste of waste left un- waste
towns generated collected collected collected
daily (MT) daily (MT) daily (MT) daily
Metropolitan 22 35157 31987 3170 91
Class I 164 22587 19204 3383 85
Class II 112 3079 2314 765 75
Total 298 60823 53505 7318 88
Source: NIUA Survey,1999. See Appendix - III, Table C –2 for details
Table - 4.7: Quantity of Solid Waste Generated and Collected –1999

7/21/2019 Status Watersupply
http://slidepdf.com/reader/full/status-watersupply 150/869
130
4.4.2 Collection Frequency
In most cities waste is collected once or twice daily i.e., street sweeping and
collection. In 57 per cent of the sampled urban centres waste is collected once a daywhile in about 37 per cent of the sampled urban centres the collection is twice a day.
A small percentage of cities have reported lesser frequency of waste collection such
as on alternate days, twice weekly and weekly (Table 4.9).
4.5 SOLID WASTE DISPOSAL
4.5.1 Transportation of Waste
The quantity of waste transported is a function of the number of vehicles of each
type, their capacity, and the number of trips they make. For example if a city has 3
trucks with a capacity of 3 tons making two trips a day, the total waste transported
would be given as 18 tons. However, the actual waste transported could be 15 tons
or any such figure. On the other hand, if the waste is construction waste, then the
weight would increase considerably. Also the number of trips is an average for the
year. The capacity of the vehicles must also be read with caution. The capacity of
each vehicle given by the local government is the designed capacity of the vehicle.
(no. of cities/towns)
% waste collected to Metropolitan Class I Class II Total %
generated cities cities towns
<50 0 4 9 13 5
50-75 2 28 27 57 19
75-99 13 78 41 132 44
100 7 54 35 96 32
Total cities/towns 22 164 112 298 100
Average 91 85 75 88
Source: NIUA Survey,1999. See Appendix - III, Table C – 2 for details
Table - 4.8: Waste collection efficiency -1999
(no. of cities/towns)
Collection frequency Metropolitan Class I Class II Total %cities cities towns
Once daily 17 90 64 171 57
Twice daily 4 64 42 110 37
Others 0 7 5 12 4
n.a. 1 3 1 5 2
Total cities/towns 22 164 112 298 100
Note: Other includes alternate days, twice weekly, and weekly Source: NIUA Survey,1999. See Appendix - III, Table C – 2 for details
Table - 4.9: Collection frequency - 1999
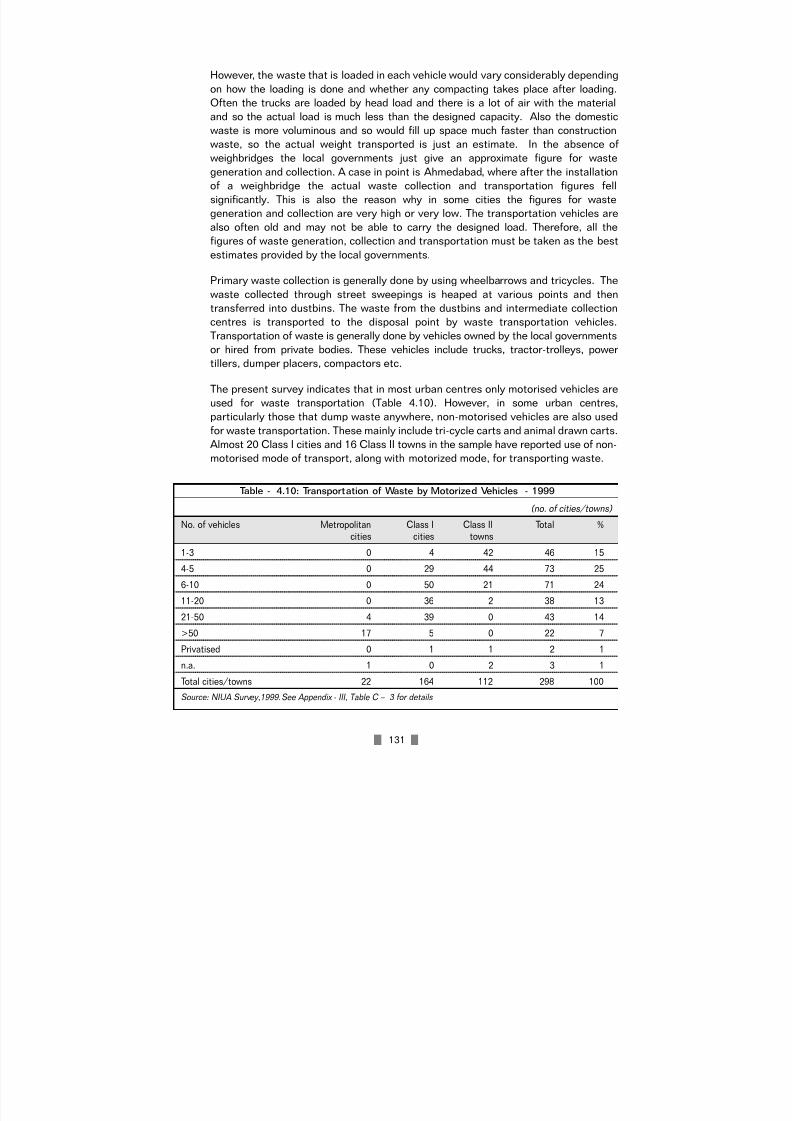
7/21/2019 Status Watersupply
http://slidepdf.com/reader/full/status-watersupply 151/869
131
However, the waste that is loaded in each vehicle would vary considerably depending
on how the loading is done and whether any compacting takes place after loading.
Often the trucks are loaded by head load and there is a lot of air with the material
and so the actual load is much less than the designed capacity. Also the domestic
waste is more voluminous and so would fill up space much faster than construction
waste, so the actual weight transported is just an estimate. In the absence of
weighbridges the local governments just give an approximate figure for waste
generation and collection. A case in point is Ahmedabad, where after the installation
of a weighbridge the actual waste collection and transportation figures fell
significantly. This is also the reason why in some cities the figures for waste
generation and collection are very high or very low. The transportation vehicles are
also often old and may not be able to carry the designed load. Therefore, all the
figures of waste generation, collection and transportation must be taken as the best
estimates provided by the local governments.
Primary waste collection is generally done by using wheelbarrows and tricycles. The
waste collected through street sweepings is heaped at various points and then
transferred into dustbins. The waste from the dustbins and intermediate collection
centres is transported to the disposal point by waste transportation vehicles.
Transportation of waste is generally done by vehicles owned by the local governments
or hired from private bodies. These vehicles include trucks, tractor-trolleys, power
tillers, dumper placers, compactors etc.
The present survey indicates that in most urban centres only motorised vehicles are
used for waste transportation (Table 4.10). However, in some urban centres,
particularly those that dump waste anywhere, non-motorised vehicles are also used
for waste transportation. These mainly include tri-cycle carts and animal drawn carts.
Almost 20 Class I cities and 16 Class II towns in the sample have reported use of non-
motorised mode of transport, along with motorized mode, for transporting waste.
(no. of cities/towns)
No. of vehicles Metropolitan Class I Class II Total %cities cities towns
1-3 0 4 42 46 15
4-5 0 29 44 73 25
6-10 0 50 21 71 24
11-20 0 36 2 38 1321-50 4 39 0 43 14
>50 17 5 0 22 7
Privatised 0 1 1 2 1
n.a. 1 0 2 3 1
Total cities/towns 22 164 112 298 100
Source: NIUA Survey,1999.See Appendix - III, Table C – 3 for details
Table - 4.10: Transportation of Waste by Motorized Vehicles - 1999
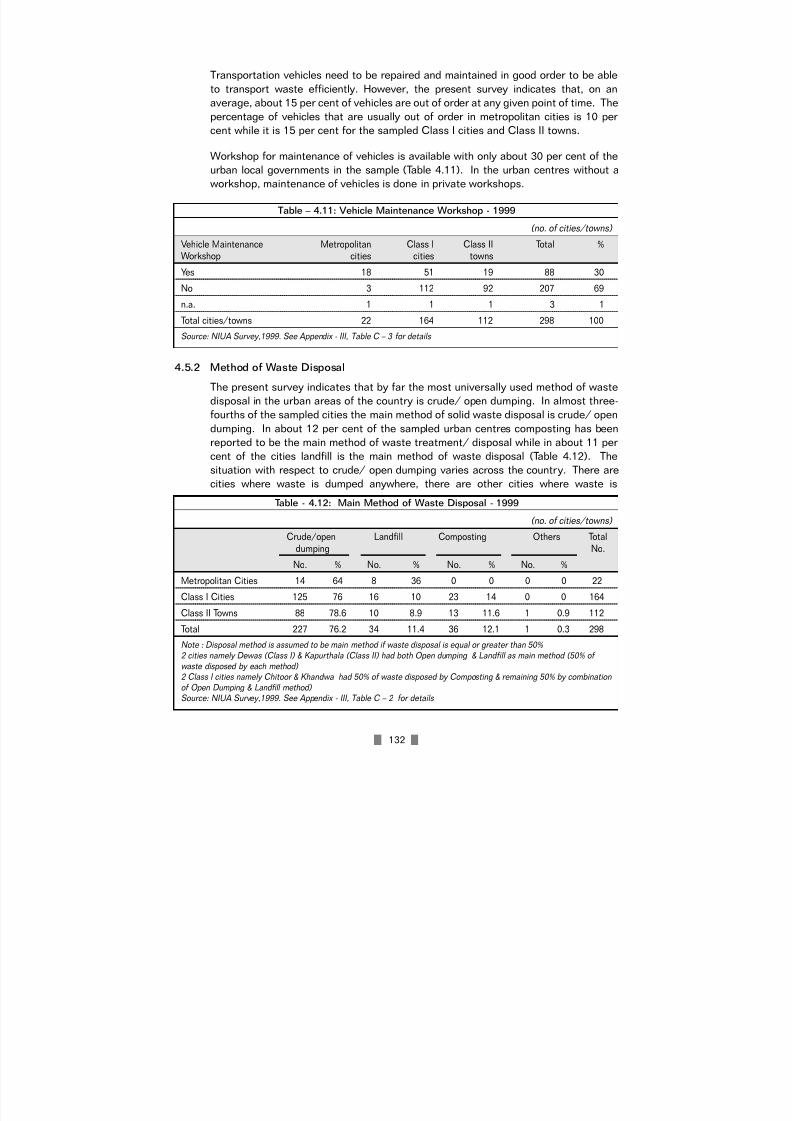
7/21/2019 Status Watersupply
http://slidepdf.com/reader/full/status-watersupply 152/869
132
Transportation vehicles need to be repaired and maintained in good order to be able
to transport waste efficiently. However, the present survey indicates that, on an
average, about 15 per cent of vehicles are out of order at any given point of time. The
percentage of vehicles that are usually out of order in metropolitan cities is 10 per
cent while it is 15 per cent for the sampled Class I cities and Class II towns.
Workshop for maintenance of vehicles is available with only about 30 per cent of the
urban local governments in the sample (Table 4.11). In the urban centres without a
workshop, maintenance of vehicles is done in private workshops.
4.5.2 Method of Waste Disposal
The present survey indicates that by far the most universally used method of waste
disposal in the urban areas of the country is crude/ open dumping. In almost three-
fourths of the sampled cities the main method of solid waste disposal is crude/ open
dumping. In about 12 per cent of the sampled urban centres composting has been
reported to be the main method of waste treatment/ disposal while in about 11 per
cent of the cities landfill is the main method of waste disposal (Table 4.12). The
situation with respect to crude/ open dumping varies across the country. There are
cities where waste is dumped anywhere, there are other cities where waste is
(no. of cities/towns)
Vehicle Maintenance Metropolitan Class I Class II Total %Workshop cities cities towns
Yes 18 51 19 88 30
No 3 112 92 207 69
n.a. 1 1 1 3 1
Total cities/towns 22 164 112 298 100
Source: NIUA Survey,1999. See Appendix - III, Table C – 3 for details
Table – 4.11: Vehicle Maintenance Workshop - 1999
(no. of cities/towns)
Crude/open Landfill Composting Others Total
dumping No.
No. % No. % No. % No. %
Metropolitan Cities 14 64 8 36 0 0 0 0 22
Class I Cities 125 76 16 10 23 14 0 0 164
Class II Towns 88 78.6 10 8.9 13 11.6 1 0.9 112
Total 227 76.2 34 11.4 36 12.1 1 0.3 298
Note : Disposal method is assumed to be main method if waste disposal is equal or greater than 50%
2 cities namely Dewas (Class I) & Kapurthala (Class II) had both Open dumping & Landfill as main method (50% of
waste disposed by each method) 2 Class I cities namely Chitoor & Khandwa had 50% of waste disposed by Composting & remaining 50% by combination
of Open Dumping & Landfill method) Source: NIUA Survey,1999. See Appendix - III, Table C – 2 for details
Table - 4.12: Main Method of Waste Disposal - 1999

7/21/2019 Status Watersupply
http://slidepdf.com/reader/full/status-watersupply 153/869
133
dumped in low-lying areas, and then there are cities where the waste is dumped but
at specified sites. Often crudely dumped waste and waste collected in small heaps
along street sides are burnt leading to air pollution. Despite having landfill sites, some
cities do not make use of them as the sites are far away from the city and
transportation costs are high, therefore crude/open dumping is resorted to in such
cases (e.g. Jodhpur).
In many urban centres any open site where waste is dumped is called landfill site. The
present survey indicates that in 227 sampled cities and towns waste is dumped at
specific open sites which are not developed landfill sites - these include 14
metropolitan cities, 125 Class I cities and 88 Class II towns. Overall, while 34
sampled urban centres have indicated having a landfill site at present (8 metropolitan
cities, 16 Class I cities and 10 Class II towns), 38 other urban centres have plans for
developing landfill sites in the future (4 metropolitan cities, 24 Class I cities and 10
Class II towns). Developing sanitary landfill sites is, thus, a necessity to dispose off
waste scientifically and in an environmentally sound manner.
4.6 STAFF POSITION
Solid waste management is a labour intensive service and one of the problems that
Urban Local Bodies face in providing this service is shortage of staff. The Report of
the Committee on Urban Wastes (1975) had recommended a norm of 2.8 sanitary
workers per 1000 population. The present survey indicates that this norm is not met
in almost four-fifth (80%) of the sampled urban centres. This could also be partly due
to privatisation of the collection and transportation functions in many cities. The
average number of sanitary workers per 1000 population in the sampled urban
centres is 2.4 i.e., 0.4 short of the norm mentioned above. In the metropolitan cities
there are an average of 2.8 sanitary workers per 1000 population whereas this
average is 1.9 in Class I cities and 2.1 in Class II towns (Table-4.13). Inadequatenumber of sanitary workers for the area and population covered affects the collection
efficiency and therefore, the quality of service. In order to improve the solid waste
management collection efficiency, private contractors and NGOs could be involved,
as has been done in many cities.
(no. of cities/towns)
Sanitary workers Metropolitan Class I Class II Total %per 1000 population cities cities towns
<2 8 89 61 158 53
2 to <3 11 45 33 89 30
3 to <4 2 19 11 32 11
4 – 8 1 5 3 9 3
n.a. 0 6 4 10 3
Total cities/towns 22 164 112 298 100
Average 2.8 1.9 2.1 2.4
Source: NIUA Survey,1999. See Appendix - III, Table C – 8 for details
Table – 4.13: Sanitary Workers Per 1000 Population - 1999

7/21/2019 Status Watersupply
http://slidepdf.com/reader/full/status-watersupply 154/869
134
4.7 PRIVATISATION
Solid waste management is a service in which private sector involvement is being
encouraged by the government. Many cities have already privatised sweeping and
collection activities. Transportation of waste is another area where privatisation has
taken place. Even at the disposal stage, private sector is being involved in setting up
composting plants and waste-to-energy plants (Table-4.14). Privatisation has helpedlocal governments to reduce expenditure and improve the coverage of population by
the service.
The present survey indicates that private sector involvement in solid waste
management has been found in 65 of the 298 sampled urban centres (i.e., 22%).
Almost 46 per cent of these urban centres are using private sector for primary
collection activity i.e., sweeping and collection while in 17 per cent of these urbancentres the private sector has been involved for transportation of waste. In the
remaining 37 per cent of the sampled urban centres private sector has been involved
in disposal, composting and drain cleaning etc. (see Table – AX - 4.2 at the end of this
chapter).
Private sector involvement is the maximum in the metropolitan cities where 12 of the
22 responding cities are using private sector for mainly primary collection and
transportation activities. The use of private sector in SWM is still not very common
in the Class I and Class II urban centres as the present survey shows that
privatization has taken place in only 38 Class I cities and 15 Class II towns.
Most local governments that have privatized activities under SWM have not
furnished information on cost savings due to the involvement of private sector. While
a few local governments have given only the cost before privatization, some others
have only given the cost of the activity after privatization. Very few local
governments have provided information on cost of the activity before and after
privatization. In some of these urban centres cost savings between 22 and 51 per
cent have been achieved due to privatization.
(no. of cities/towns)
Activity privatized Metropolitan Class I Class II Total %
cities cities towns
Primary collection 6 16 8 30 46
Transportation 4 5 2 11 17
Disposal 0 2 0 2 3Composting 1 4 0 5 8
Others* 1 11 5 17 26
Total cities/towns 12 38 15 65 100
* Combinations of activities Source: NIUA Survey,1999. See Appendix - III, Table C –9 for details
Table – 4.14: Privatisation of Solid Waste Management Activities – 1999

7/21/2019 Status Watersupply
http://slidepdf.com/reader/full/status-watersupply 155/869
135
4.8 REVENUE RECEIPTS AND EXPENDITURE
4.8.1 Revenue Receipts
Solid waste management is a service that is low on revenue generation. The service
either generates no revenue or the revenue generated is not very significant. No
direct revenue accrues from this service except in a few urban centers. Revenue fromthe service mainly comes in the form of tax, which is a certain percentage of the
property tax. However, only 42 urban centres in the sample have reported revenue
from sanitation tax, sanitation cess or conservancy tax. A small number of cities have
reported revenue receipts from sale of compost. Nearly 71% of the sampled cities
have not reported any revenue receipts from the service (see Appndix III, Table C-
10). The expenditure incurred on the service has to, therefore, be met from the
general revenues of the local government.
4.8.2 Revenue Expenditure
Analysis of expenditure on solid waste management is made difficult by the method
of keeping accounts by various local governments. While expenditure on salary andwages is relatively easy to obtain, expenses on heads such as consumables and
vehicle repairs are often clubbed together with other expenses.
Management of municipal solid waste generally consumes a large share of the total
municipal expenditure. The share of this service as a percentage of the total
municipal budget is known to be as high as 50 per cent. The present survey indicates
that the expenditure on solid waste management forms an average of 18 per cent of
the total municipal budget of the responding urban centres.
The share of expenditure on establishment is very high on this service as municipal
solid waste management is a labour intensive service. On an average, the
expenditure on establishment forms over four-fifths of the total expenditure on the
service. More than two-thirds (73%) of the responding urban centres spend over 75
per cent of their solid waste management expenditure on establishment (Table 4.15).
(no. of cities/towns)
% Expenditure on Metropolitan Class I Class II Total %establishment cities cities towns
<25 1 3 0 4 1
25 - 50 0 5 4 9 3
50 - 75 4 18 11 33 11>75 15 121 80 216 73
bu .n.a. 1 3 3 7 2
n.a. 1 14 14 29 10
Total cities/towns 22 164 112 298 100
Average (%) 81 84 81 82
bu n.a. breakup not available Source: NIUA Survey,1999. See Appendix - III, Table C –11 for details
Table – 4.15: Per Cent Share of Establishment Expenditure - 1997-98

7/21/2019 Status Watersupply
http://slidepdf.com/reader/full/status-watersupply 156/869
136
4.8.3 Per Capita Revenue Receipts
Solid waste management is a service from which user charges are not recovered by
the local government. The cost recovery, to whatever extent, is based on tax/ cess.
Therefore, it should come as no shock that, on an average, only Rs. 10.1 per capita
per annum is recovered from the service (Table 4.16). In almost one-third of the
responding urban centres the recovery is less than Rs. 0.25 per capita per annum.
4.8.4 Per Capita Expenditure
In the sampled cities, the average per capita expenditure on the service is Rs. 121 per
annum. The average per capita expenditure in metropolitan cities on the service is Rs.156 per annum while it is Rs. 87 and Rs. 86 in sampled Class I cities and Class II towns
respectively (Table 4.17). Since there are no norms available for per capita
expenditure on municipal solid waste management, it is difficult to know whether the
(no. of cities/towns)
Per capita revenue Metropolitan Class I Class II Total %receipts (Rs./annum) cities cities towns
<0.25 2 20 7 29 9.8
0.25 to <1 2 10 4 16 5.4
1 to <5 0 8 6 14 4.7
5 to <7.5 1 3 3 7 2.4
7.5 to <10 0 6 0 6 2.010 and above 3 9 2 14 4.7
Total responding cities / towns 8 56 22 86 28.9
n.a. 14 108 90 212 71.1
Total cities/towns 22 164 112 298 100.0
Average (Rs. per annum) 12.8 6.6 2.8 10.1
Source: NIUA Survey,1999. See Appendix - III, Table C –10 for details
Table - 4.16: Per Capita Revenue Receipts from SWM (1997-98)
(no. of cities/towns)
Per capita expenditure Metropolitan Class I Class II Total %
(Rs/annum) cities cities towns
<50 5 37 28 70 23
50 to 100 4 80 43 127 43
100 to 200 10 27 21 58 19
200 to 300 1 3 4 8 3
> 300 1 2 2 5 2
n.a. 1 15 14 30 10
Total cities/towns 22 164 112 299 100
Average (Rs. per annum) 156.06 87.27 85.99 121.21
Source: NIUA Survey, 1999See Appendix - III, Table C – 11 for details
Table – 4.17: Per Capita Expenditure on Municipal Solid Waste Management 1997-98
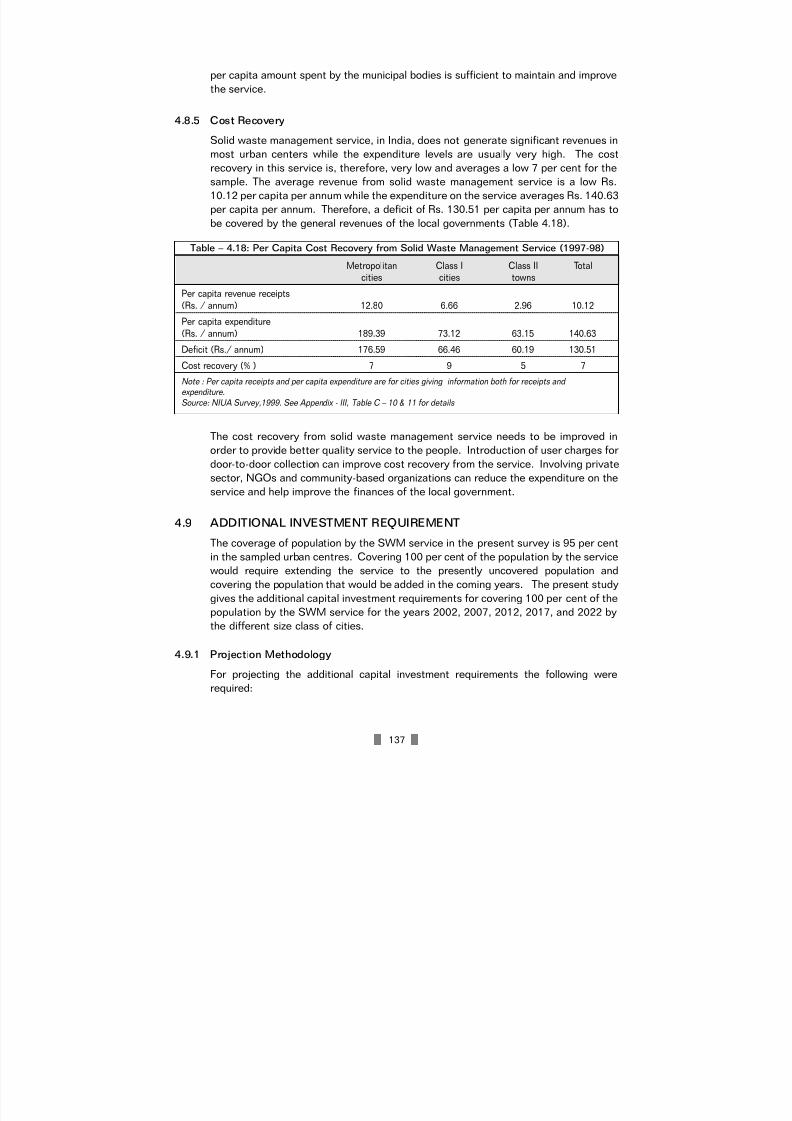
7/21/2019 Status Watersupply
http://slidepdf.com/reader/full/status-watersupply 157/869
137
per capita amount spent by the municipal bodies is sufficient to maintain and improve
the service.
4.8.5 Cost Recovery
Solid waste management service, in India, does not generate significant revenues in
most urban centers while the expenditure levels are usually very high. The costrecovery in this service is, therefore, very low and averages a low 7 per cent for the
sample. The average revenue from solid waste management service is a low Rs.
10.12 per capita per annum while the expenditure on the service averages Rs. 140.63
per capita per annum. Therefore, a deficit of Rs. 130.51 per capita per annum has to
be covered by the general revenues of the local governments (Table 4.18).
The cost recovery from solid waste management service needs to be improved in
order to provide better quality service to the people. Introduction of user charges fordoor-to-door collection can improve cost recovery from the service. Involving private
sector, NGOs and community-based organizations can reduce the expenditure on the
service and help improve the finances of the local government.
4.9 ADDITIONAL INVESTMENT REQUIREMENT
The coverage of population by the SWM service in the present survey is 95 per cent
in the sampled urban centres. Covering 100 per cent of the population by the service
would require extending the service to the presently uncovered population and
covering the population that would be added in the coming years. The present study
gives the additional capital investment requirements for covering 100 per cent of thepopulation by the SWM service for the years 2002, 2007, 2012, 2017, and 2022 by
the different size class of cities.
4.9.1 Projection Methodology
For projecting the additional capital investment requirements the following were
required:
Metropolitan Class I Class II Totalcities cities towns
Per capita revenue receipts
(Rs. / annum) 12.80 6.66 2.96 10.12
Per capita expenditure
(Rs. / annum) 189.39 73.12 63.15 140.63
Deficit (Rs./ annum) 176.59 66.46 60.19 130.51
Cost recovery (% ) 7 9 5 7
Note : Per capita receipts and per capita expenditure are for cities giving information both for receipts andexpenditure.
Source: NIUA Survey,1999. See Appendix - III, Table C – 10 & 11 for details
Table – 4.18: Per Capita Cost Recovery from Solid Waste Management Service (1997-98)

7/21/2019 Status Watersupply
http://slidepdf.com/reader/full/status-watersupply 158/869
138
a) the total urban population projected till the year 2022 at five year intervals
starting 2002 A.D. – for which the Registrar General of India’s population
projection has been used;
b) the division of projected urban population by size class of cities for different years
(Table 4.19);
c) the present coverage of population by the service by size class of urban centres;
4.9.2 Assumptions Made for Calculating Investment Requirements
The Census of India’s publication (1996) titled ‘Population projection for India and the
states 1996-2016’ projects the population till the year 2016. Thereafter, for
projecting the population till the year 2022, the annual growth rate of urban
population during 2015-2016 (2.46% per annum) has been used as a constant.
The percentage of population living in different size class of towns has been kept
constant at 1991 level for projections till the year 2022. Such an assumption was
necessitated due to the absence of any projection of population by size class of
towns available from the Registrar General’s office.
To calculate the backlog of population not covered by SWM service in 1999, the
results of the present survey on coverage have been used for metropolitan cities,
Class I cities and Class II towns. However, since the study does not cover the other
size classes of towns (barring the capital towns) the coverage figures for Class IItowns have been used as proxy for classes III to VI.
The additional population to be covered in different years by size class has been
arrived at by subtracting the latter year’s population by the previous one. The
backlog population to be covered in 1999 has been calculated by the population not
covered till 1999, which has been taken from the present survey (Table 4.20 and
4.21).
Year Metro I II III IV V VI Total
1991
(% population) 23.00 33.67 13.33 16.35 9.77 3.43 0.45 100.00
1999 64099850 93836607 37150044 45566633 27228502 9559239 1254128 278695000
2002 69340170 101507979 40187151 49291817 29454498 10340730 1356656 301479000
2007 79113330 115815036 45851334 56239259 33605967 11798205 1547870 343971000
2012 89579940 131137243 51917417 63679653 38052001 13359095 1752651 389478000
2017 101110092 148016382 58599892 71876087 42949808 15078592 1978241 4396090942022 114164910 167127501 66166011 81156360 48495268 17025463 2233661 496369174
Note: 1991 The proportion of population in each size class is for the individual cities and towns and not for urban agglomerations and the proportions are assumed to be constant for the projected period i.e., upto 2022.
Source for proportion of population in each size class - Census of India 1991, Series 1 - India, General Population
Tables Part II-A (ii) Towns and Urban Agglomerations 1991 with their Population 1901 - 1991, Statement-3, p.32 Source for size class-wise population distribution - Projections based on Census of India’s ‘Population Projections for
India and States 1996-2016’, Registrar General, India, New Delhi, 1996. * Population as on 1st July of the given year
Table - 4.19: Year and Class Wise Projection of Urban Population*

7/21/2019 Status Watersupply
http://slidepdf.com/reader/full/status-watersupply 159/869
139
4.9.3 Projected Additional Investment Requirements
The calculation of additional investment requirements has been done by using the percapita costs given by the Planning Commission (Task Forces on Housing and Urban
Development, 1983) (Table 4.22). The per capita cost estimates available are for
primary collection, transportation and disposal. For calculating the additional
investment requirements the total cost of the service covering all the three stages
has been taken. For metropolitan cities the costs given for ‘Calcutta Corporation’
Year Metro I II III IV V VI Total
1999* 61535856 89144776 34549540 42376968 25322506 8890092 1166339 262986078
1999-2002 5240320 7671373 3037107 3725184 2225997 781491 102528 22784000
2002-2007 9773160 14307056 5664184 6947442 4151468 1457476 191214 42492000
2007-2012 10466610 15322207 6066083 7440395 4446034 1560890 204782 45507000
2012-2017 11530152 16879139 6682475 8196434 4897808 1719497 225590 50131094
2017-2022 13054818 19111119 7566119 9280273 5545460 1946871 255420 56760080
Total 111600916 162435670 63565508 77966696 46589273 16356316 2145872
* Backlog
Table – 4.20: Additional Population to be Covered in Different Years by Size Class
Class Uncovered Per capita waste
population (%) generation (gms)
Metro 4 499
I 5 379
II 7 296
III 7 296
IV 7 296
V 7 296
VI 7 296
Source: NIUA Survey, 1999
Table – 4.21: Population Not Covered by Solid Waste Management – 1999
(Rs. at 1998-99 prices)
Smaller urban locations Calcutta Corporation
Primary collection 34.3 49
Transportation :
Trucks/containers 49 107.8
Workshops 36.75 73.5
Disposal 24.5 24.5
Total 144.55 254.8
Source: Task Forces on Housing and Urban Development, Vol. II – Financing of Urban Development, Planning
Commission, Government of India, New Delhi, December 1983, p. 38 (inflated to 1998-99 prices)
Table – 4.22: Task Forces Per Capita Investment Costs for Solid Waste Management

7/21/2019 Status Watersupply
http://slidepdf.com/reader/full/status-watersupply 160/869
140
have been used while for other classes of cities and towns the costs given for ‘smaller
urban locations’ has been used. The backlog population and the additional population
to be covered by the service has then been multiplied by this cost figure to arrive at
the additional investment requirements for covering 100 per cent population by the
service.
Municipal solid waste service at present covers 95 per cent of the population, on an
average, in the sampled urban centres. The backlog population to be covered by the
service was about 263 million in 1999. In order to extend this service to the presently
uncovered population, and to the additional population to be added till the end of
2022, an amount of Rs. 3953.79 crores at 1998-99 prices (based on Task Forces per
capita cost estimates) will need to be invested during 1999-2022 period. In annual
terms an investment of Rs. 171.90 crores will be needed to cover the uncovered and
additional population by the service between 1999 and 2022 (Table 4.23).
Regardless of the method of estimation, financing an investment of this magnitude
will require resource mobilization from non-governmental sources. Encouraging
private sector participation in waste recovery programmes, mobilizing community
based organizations and NGOs to take up primary waste collection activities and
finding new revenue sources (such as fines) in this sector will help to reduce the
financial burden on the government and improve the delivery of this service.
(Rs. in crores at 1998-99 prices)
Year Metro I II III IV V VI Total
Backlog 1999 65.33 67.82 37.59 46.11 27.55 9.67 1.27 255.34
1999-2002 133.52 110.89 43.90 53.85 32.18 11.30 1.48 387.12
2002-2007 249.02 206.81 81.88 100.43 60.01 21.07 2.76 721.97
2007-2012 266.69 221.48 87.69 107.55 64.27 22.56 2.96 773.20
2012-2017 293.79 243.99 96.60 118.48 70.80 24.86 3.26 851.76
2017-2022 332.64 276.25 109.37 134.15 80.16 28.14 3.69 964.40
Total 1340.99 1127.24 457.02 560.56 334.96 117.60 15.43 3953.79
Table – 4.23: Additional Investment using Task Forces Per Capita Cost Estimates

7/21/2019 Status Watersupply
http://slidepdf.com/reader/full/status-watersupply 161/869
141
ANNEX TABLES
City/ town Treatment
Metropolitan cities
Ahmedabad M.Corp. Incineration
Bangalore M.Corp. Incineration
Bhopal M.Corp. n.a.
Calcutta M.Corp. n.a.
Chennai M.Corp. None
Coimbatore M.Corp. Incineration
Delhi M.Corp. Incineration
Greater Mumbai M.Corp. Incineration
Hyderabad M.Corp. IncinerationIndore M.Corp. Incineration
Jaipur M.Corp. Incineration
Madurai M.Corp. Incineration
Nagpur M.Corp. Incineration
Surat M.Corp. None
Vadodara M.Corp. Incineration
Visakhapatnam M.Corp. None
Class I cities
Agartala MCl n.a.
Alappuzha MC Incineration
Balurghat M None
Bhilwara M n.a.
Chhapra M Incineration
Cuddalore M Incineration
Dewas M.Corp. Incineration
Dindigul M Incineration
Gulbarga M.Corp. n.a.
Guwahati M.Corp. Incineration
Imphal MCl NoneJodhpur M.Corp. Incineration
Kanchipuram M None
Kollam MC Incineration
Kozhikode M.Corp. Incineration
Kumbakonam M Incineration
Mathura MB Incineration
Table -AX- 4.1: Treatment of Hospital Waste* - 1999

7/21/2019 Status Watersupply
http://slidepdf.com/reader/full/status-watersupply 162/869
142
City/ town Treatment
Nagercoil M Incineration
Nandyal MCl n.a.
Ongole MCl n.a.
Pondicherry M Incineration
Rajkot M.Corp. None
Ratlam M.Corp. n.a.
Salem M.Corp. Incineration
Srinagar M.Corp. Incineration
Thanjavur M Incineration
Thiruvananthapuram M.Corp. Incineration
Tiruchirapalli M.Corp. None
Vijaywada M.Corp. Incineration
Class II towns
Ambur M n.a.
Ankleswar M None
Ballarpur MCl Incineration
Contai M None
Cooch Behar M None
Dharmapuri M Incineration
Ghazipur MB n.a.
Gokak CMC None
Jalpaiguri M None
Katwa M NoneLalitpur MB n.a.
Mahesana M None
Nagapattinam M Incineration
Panaji MCl Incineration
Port Blair MCl Incineration
Pudukkottai M None
Rajendra Nagar MCl None
Raniganj M None
Sawai Madhopur M n.a.
Thrissur MC Incineration
Tindivanam M None
* In urban centres collecting hospital waste separately.
Source: NIUA Survey, 1999 See Appendix - III, Table C – 5 for details

7/21/2019 Status Watersupply
http://slidepdf.com/reader/full/status-watersupply 163/869
143
Sl. City/Town Details of privatisation
No. Aspect Specific Area Mode Year of No. of Cost (Rs.’000)
privatised covered used privatisa- contrac- before after
tion tors priva- priva-tisation tisation
Metropolitan Cities
1 Bangalore M.Corp. Sweeping n.a. Contract 1989 120 n.a. n.a.
2 Calcutta M.Corp. Transportation - n.a. n.a. n.a. n.a. n.a.
3 Chennai M.Corp. Collection 3 Zones BOO Starting 2000 1 n.a. n.a.
4 Delhi M.Corp. Composting n.a. Contract 1999 1 n.a. n.a.
5 Greater MumbaiM.Corp. Transportation n.a. Contract n.a. n.a. n.a. n.a.
6 Hyderabad M.Corp. Sweeping n.a. n.a. 1998 122 n.a. n.a.
7 Jaipur M.Corp. Transportation n.a. n.a. 1990 18 n.a. n.a.
8 Ludhiana M.Corp. Sweeping & n.a. CBO n.a. 114 2827 n.a.
collection9 Madurai M.Corp. Transportation Commercial Contract 1998 2 n.a. n.a.
10 Nagpur M.Corp. Collection n.a. Contract 1997 2 n.a. n.a.
11 Surat M.Corp. Collection & n.a. n.a. n.a. 2 n.a. n.a.
transportation
12 Visakhapatnam Sweeping & n.a. n.a. 1994 5 n.a. n.a.
M.Corp. collection
Class I Cities
Andhra Pradesh
1 Anantapur MCl Sweeping n.a. Contract 1997 1 11500 14500
2 Chittoor M Sweeping & n.a. Contract 1999 1 n.a. n.a.
collection3 Eluru M Collection & n.a. Contract 1998 2 n.a. 1800
disposal
4 Guntur MCl Collection & n.a. Contract 1996 3 n.a. 3864disposal
5 Hindupur M Sweeping & n.a. Contract 1996 1 n.a. 100collection
6 Nandyal MCl Sweeping n.a. NGO 1998 1 n.a. n.a.
7 Nellore MCl Sweeping n.a. Contract 1998 5 23843 27812
8 Qutubullapur M Sweeping n.a. Contract 1997 5 2000 4200
9 Tenali M Collection & n.a. Contract 1998 1 n.a. 144
disposal
10 Tirupati MCl Sweeping & n.a. Contract 1997 4 n.a. n.a.
collection
11 Vijaywada M.Corp. Disposal & n.a. n.a. n.a. 3 n.a. n.a.
treatment
Bihar
12 Gaya M.Corp. Drain cleaning n.a. Contract 1999 4 n.a. 740
Table – AX- 4.2: Details of Privatisation in Solid Waste Management – 1999

7/21/2019 Status Watersupply
http://slidepdf.com/reader/full/status-watersupply 164/869
144
Gujarat
13 Bhuj M Collection & transportation - - - - - -
14 Jamnagar Primary collection n.a. Contract 1987 6 8000 2200
15 Rajkot M.Corp. Collection & n.a. Contract 1990 9 n.a. 7000transportation
Jammu & Kashmir
16 Srinagar M.Corp. Collection New colonies Contract 1999 3 n.a. n.a.
Karnataka
17 Belgaum M.Corp. Transportation n.a. Contract 1994 2 n.a. n.a.
18 Bellary CMC Sweeping & n.a. Contract 1998 2 n.a. n.a.
transportation
19 Davangere MCl Composting n.a. Auction 1996 55 n.a. n.a.20 Hubli-Dharwad Vermi-composting n.a. Contract 1998 1 n.a. n.a.
M.Corp.
21 Mysore M.Corp. Sweeping & n.a. Contract 1998 7 n.a. n.a.transportation
22 Shimoga CMC Disposal n.a. Contract 1994 6 n.a. n.a.
Kerala
23 Alappuzha MC Disposal n.a. Contract 1999 1 n.a. n.a.
Madhya Pradesh
24 Jabalpur M.Corp. Sweeping n.a. Contract 1998 1 1164 770
Maharashtra
25 Amravati M.Corp. Sweeping n.a. Contract 1985 2 n.a. 700
26 Aurangabad M.Corp. Composting Entire city Contract 1997 1 n.a. 30000
27 Nanded Waghala Sweeping Entire city Contract 1997 1 n.a. 1000
M.Corp.
28 Nashik M.Corp. Transportation n.a. Contract 1997 77 n.a. 26500
29 Parbhani MCl Transportation n.a. Contract 1999 2 n.a. 1205
Orissa
30 Bhubaneswar Collection n.a. Contract n.a. n.a. n.a. n.a.
M.Corp.
Rajasthan
31 Ajmer MCl Transportation Entire city n.a. 1998 2 n.a. n.a.
32 Sriganganagar M Sweeping Entire city Contract 1994 3 700 350
Tamil Nadu
33 Tiruppur M Secondary Major roads Contract 1997 1 n.a. n.a.
collection
West Bengal
34 Asansol M.Corp. Primary collection n.a. Contract n.a. 7 n.a. n.a.& transportation
Sl. City/Town Details of privatisation
No. Aspect Specific Area Mode Year of No. of Cost (Rs.’000)
privatised covered used privatisa- contrac- before aftertion tors priva- priva-
tisation tisation

7/21/2019 Status Watersupply
http://slidepdf.com/reader/full/status-watersupply 165/869
145
Assam
35 Guwahati M.Corp. Transportation Entire city Contract 1988 13 n.a. n.a.
Tripura
38 Agartala MCl Composting n.a. n.a. 1999 n.a. n.a. n.a.
Union Territories
39 Chandigarh M.Corp. Sweeping & n.a. Contract 1996 3 n.a. 2720collection
40 Pondicherry M Sweeping & n.a. Contract 1997 1 n.a. n.a.collection
Class II Towns
Andhra Pradesh
1 Kapra M Sweeping n.a. n.a. 1999 3 4640 29082 Madanapalle M Sweeping & n.a. Contract n.a. 2 n.a. 97
collection
3 Narasaraopet M Collection & n.a. Contract 1998 1 n.a. 1248
disposal
4 Rajendra Nagar MCl Sweeping & n.a. NGO 1997 1 20 85
disposal
5 Srikalahasti M Sweeping & n.a. Contract 1998 n.a. n.a. -
disposal
6 Suryapet MCl Sweeping & n.a. Contract 1997 2 n.a. n.a.
disposal
Karnataka
7 Bagalkot CMC Sweeping n.a. Contract 1999 2 n.a. n.a.
8 Chikmagalur CMC Collection & Entire town Contract 1997 1 n.a. n.a.
transportation
9 Gokak CMC Sweeping & n.a. n.a. 1999 1 n.a. n.a.
transportation
10 Rabkavi-Banhatti Transportation n.a. Auction n.a. n.a. n.a. n.a.
CMC
Maharashtra
11 Bhandara M Nala cleaning n.a. n.a. 1999 1 n.a. n.a.
12 Kamptee MCl Sweeping & Commercial Contract 1999 1 25 18collection
13 Manmad MCl Transportation n.a. Contract 1999 1 300 147
14 Virar MCl Sweeping & Entire town Contract 1999 1 4500 3500
collection
Goa
15 Panaji MCl Collection, Restaurants Contract 1995 2 n.a. n.a.transportation &
disposal
Source: NIUA Survey,1999. See Appendix - III, Table C – 9 for details
Sl. City/Town Details of privatisation
No. Aspect Specific Area Mode Year of No. of Cost (Rs.’000)privatised covered used privatisa- contrac- before after
tion tors priva- priva-
tisation tisation

7/21/2019 Status Watersupply
http://slidepdf.com/reader/full/status-watersupply 166/869
146
CHAPTER V
CONCLUSIONS, SUMMARY OF RESULTS AND
RECOMMENDATIONS
Water supply, sanitation and solid waste management constitute basic essential services for
which the main responsibility lies with the public authorities. Provision of potable water and
safe sanitation to all is the ultimate goal of the government. However, achieving this goal
and providing services at the desired level have been the main challenge for public
authorities concerned with these services. Solid waste management is another essential
service, the responsibility for which lies with the local governments. All these basic services
have a major impact on the health of the citizens and therefore need to be accorded high
priority in planning and implementation. However, in order to understand the magnitude of
the problem, an overview of the status of these basic services is necessary.
The present report brings out the status of these three essential services (as in 1999) bylooking at the coverage, the service levels, and the investment requirements to achieve 100
per cent coverage at the desired level. The broad conclusions drawn from the study are
presented in subsequent paragraphs.
5.1 WATER SUPPLY
5.1.1 Conclusions
Water is essential for survival and is required in adequate quantity to remain healthy.
Increasing urbanization, growing water demands, pollution of nearby water sources
and depletion of sources due to over exploitation have all contributed to the current
crisis of potable water. It is thus time to take stock of the situation and initiate
remedial measures to avoid the impending crisis.
Institutional arrangements for providing water supply are complex with multiple
agencies being involved in various stages of provision. The general pattern is that
the responsibility for carrying out capital works, in most cities, rests with a state level
agency and the operation and maintenance function is with the local government.
There are many variations to this pattern by states and cities. Multiplicity of agencies
has implications for the functioning of the service, as it does not allow the urban local
governments to take all decisions regarding the service. This is essential to give
autonomy of operations to the urban local governments.
The norms for water need to be made more realistic by basing them on the actual
needs. Water requirements change with income levels, economic activities, social
habits and technology. Revising norms periodically will make planning for water more
realistic. The present survey is an indicator of this, with the norms given by the cities
themselves varying considerably from the norms recommended by CPHEEO.
The coverage of population by water supply has improved steadily over the years and
in the present survey it has reached 94 per cent (1999). However, it still falls short

7/21/2019 Status Watersupply
http://slidepdf.com/reader/full/status-watersupply 167/869
147
of the target of covering 100 per cent of the population by water supply. Coverage
by itself is not sufficient to ensure that adequate quantity of water is available to all
at the required pressure and for adequate number of hours in a day. Despite full
coverage of population by water supply, there are cities/ towns that do not get water
daily or get water for only half-an-hour or less per day. Therefore, coverage has to
be seen against the quantity of water available, duration of supply and quality of
water supplied.
The per capita supply meets the city norms in only one- third of the urban centres.
The situation is equally alarming in all size classes of urban centres, the per capita
deficiency in relatively smaller urban centres is much worse than large urban centres.
To improve the supply, not only are finances required to fund new schemes for water
supply, but also efficiency in operations and cost recovery are also required.
Water is supplied only for a limited number of hours daily in almost all the urban
centres. A round the clock supply, though desirable, is not possible in many cases
due to inadequate water at source and other factors such as limited pumping and
treatment capacity.
Unaccounted for water (UFW), which averages 21 per cent in the sampled urban
centres, is another major problem that needs to be plugged. The urban local bodies
do not have adequate capacity to detect and plug these leakages, be they physical
or financial. The estimation of UFW is also very poor in most urban centres, mainly
because all connections are not metered in most cities. Almost one-third of the
sampled urban centres do not have any metered connections and this makes leakage
detection a difficult task. In order to estimate UFW more accurately and reduce
losses, leakage detection programmes need to be undertaken in most urban centres.
Reducing water losses will effectively increase water availability and will reduce the
requirement of funds for future investments.
With cities expanding rapidly, newer sources of water have to be tapped, and these
are often further away from the city. Some of the metropolitan cities, which
depended on nearby sources of water supply earlier, have to go much further in future
to supply water to their population. Delhi, which has its present source at less than
30 km distance, will go as far as 300 to 400 kms in future to provide adequate water
to its population.
The demand for water will continue to increase in future due to increasing population
and also due to changing non-domestic water requirements. The demand-supply gap
in Class I cities is the highest amongst the sampled urban centres and this indicatesthat an increase in population has not led to a concomitant increase in water supply.
To improve the situation, not only are additional finances required but also efficiency
of operations needs to improve.
Quality of water supplied also needs improvement. There are still some cities that
use surface water but do not have water treatment plants. Laboratory facilities for
testing water quality are also inadequate in a large number of urban centres. Water

7/21/2019 Status Watersupply
http://slidepdf.com/reader/full/status-watersupply 168/869
148
supplied in urban centres with inadequate testing can result in serious health
problems. Monitoring raw water quality is not done at all in a large number of urban
centres. This would indicate that the treatment provided to water to make it potable
does not have a scientific basis and the treatment may not be adequate.
There is more staff per 1000 connections in metropolitan cities than in other size
class of cities. Since norms for staff per 1000 connections are not available for water
supply, it is difficult to estimate whether the water utilities/urban local bodies are
overstaffed.
Private sector involvement in water supply is not very common yet, with less than
one-tenth of the sampled urban centres reporting private sector participation in the
service. Wherever private sector has been involved, it has been mainly in operation
and maintenance activities. A significant intervention by private sector in water
supply has not yet happened though several attempts have been made in this
direction. The main advantage of private sector participation in areas such as source
development will be that the financial burden on local governments or the existing
utilities will reduce considerably. Private sector will also introduce financial discipline,
which will help improve the recovery from water supply.
Water rates are still very low in many states and not sufficient to cover the
expenditure on the service. Domestic users are heavily subsidized by industrial and
commercial users who pay a rate that is, on an average, two to ten times that paid
by domestic users. While most urban centres have revised water tariff in early to
mid-1990s, the revision in many cases has been marginal and does not reflect the real
costs.
Revenue receipts from water supply are unable to meet the expenditure in over two-
thirds of the sampled urban centres despite the fact that water supply is amenableto cost recovery. This is an area that needs to be investigated further to accurately
pinpoint reasons for losses. Accounting improvements are also necessary in many
urban centres to enable accurate assessment of revenues and expenditure on the
service.
Additional capital investments in water supply are required to cover the presently
uncovered population by water supply and also cover the population that will be
added to the urban population between 1999-2022. Annual investment in the range
of Rs. 13 to 15 billion (1999- 2002) is not possible to mobilize from the government
alone; private sector participation has to be encouraged not only to bring in money
but also to cut down costs.
5.1.2 Summary of Results
1. The average coverage of population by public water supply system in the sampled
towns is 94 per cent. The coverage is marginally better in metropolitan cities with
an average of 98 per cent.
2. In 7 urban centers (4 Class I cities & 2 Class II cities of West Bengal & Kavarathi

7/21/2019 Status Watersupply
http://slidepdf.com/reader/full/status-watersupply 169/869
149
U.T.) only stand posts cover the entire population, as there are no individual
connections.
3. The per capita supply in the sampled cities is 150 lpcd. This per capita supply is
at an acceptable level as per the CPHEEO norms. The average supply in
metropolitan cities is 182 lpcd, while in the sampled Class I and Class II urban
centres it is 124 lpcd and 83 lpcd respectively.
4. The per capita domestic supply averages 128 lpcd for the sampled urban centres.
In metropolitan cities the average domestic supply is 148 lpcd while it is 106 lpcd
and 69 lpcd in Class I and Class II urban centres respectively.
5. Unaccounted for water in the sampled urban centers averages 21 per cent. While
UFW is 24 per cent in the metropolitan cities, it is 16 per cent in the sampled
Class I cities and 11 per cent in the Class II towns.
6. The average quantity of water required to be added to reach the city norms in the
sampled urban centres is 4045 mld. In the metropolitan cities the quantity
required is 1397 mld while in Class I cities the quantity required is 2209 mld and
in Class II towns it is 439 mld.
7. The average percentage of total individual connections that are metered is a low
55 per cent in the sampled urban centers. In 15 per cent of the urban centers all
the domestic connections are metered while in 42 per cent of the urban centers
none of the domestic connections are metered.
8. Water treatment plants are not available in 30 (out of 195) urban centers using
surface water. While all the metropolitan cities using surface water have water
treatment plants, the corresponding figure for Class I cities is 96 (out of 109) and
48 (out of 65) for Class II towns.
9. Raw water quality is not monitored at all in 172 sampled urban centers.10. Average staff per 1000 connections is 10.9 in the sampled urban centers. In
metropolitan cities this figure is 14.5 while in Class I cities it is 7.9 and it is 6.8 in
Class II towns.
11. Private sector has been involved in the water supply service in only 8 per cent of
the sampled cities.
12. The tariff for domestic water supply per kilolitre is largely in the range of Re. 1.00
to Rs. 5.00 per kl. The tariff has been revised in most cities in the 1990s. Water
tariff for non-domestic supplies are at least double but go upto 10 times the tariff
charged for domestic use. Tariff for domestic water is amongst the lowest in U.P
and highest in Kerala.
13. The investment requirements for covering the entire population by water supply
by the year 2022 is Rs. 32118 crores at 1998-99 prices (using Task Forces per
capita cost estimates) and Rs. 35420 crores (using HUDCO’s per capita cost
estimates). The per annum investment requirement works out to be Rs.1396
crores during the period 1999-2022 for the former and Rs. 1540 crores for the
latter. Using HUDCO’s per mld cost estimates, the additional capital investment

7/21/2019 Status Watersupply
http://slidepdf.com/reader/full/status-watersupply 170/869
150
requirements vary between Rs. 15825 crores (low estimate) to Rs. 40502 crores
(high estimate) for the period 1999-2022 at 1998-99 prices.
5.1.3 Recommendations
1. Problems of intra-city distribution should be taken up immediately by the local
authorities to address the problems of water shortage.2. Steps should be taken to initiate capacity building in urban centres for estimation
of UFW. Financial assistance should also be provided to the water supplying
agencies to equipping with the instruments for estimating UFW.
3. Metering of connections, both for bulk supply and retail distribution, must be
encouraged. Standard meters should be made available, at reasonable cost, to
all urban centres for this purpose.
4. Tariff is a major concern in the water sector. Tariff should be increased at certain
given intervals, indexed to inflation and power tariff.
5. Getting surface water from distant sources is proving to be very expensive.Ground water depletion can be controlled by undertaking rainwater harvesting in
all urban centres. Specific programmes/ schemes should be initiated for aquifer
re-charge.
6. In line with the provisions of 74th Constitution Amendment Act, the capacity of
local governments should be built to manage water supply systems. The local
governments should be given sufficient autonomy to decide on increase in water
tariff required to cover at least O&M costs.
7. Improving cost recovery should be linked to giving grants. Financial incentives
could be given to urban centres showing improved cost recovery. Technical
assistance and guidance should also be provided to local authorities to improve
financial performance.
8. Private sector participation in this sector should be encouraged, wherever
possible. Unbundling of the service would allow private sector to participate in
this service and improve efficiency levels.
9. The additional capital investments required to cover the entire urban population
with water supply at the required norms will require huge investments that are not
possible for the Government to provide. Therefore, public-private participation
must be encouraged. New ways of financing for this sector should also be
explored.
5.2 SEWERAGE AND LOW COST SANITATION
5.2.1 Conclusions
The situation with respect to safe sanitation is not very encouraging in the urban
areas of the country. Only one-third of the 301 sampled urban centres have
sewerage system and the population covered by them is about 45%. Even in urban
centres with sewerage system, the coverage of population is only partial (58%).

7/21/2019 Status Watersupply
http://slidepdf.com/reader/full/status-watersupply 171/869
151
A significant amount of wastewater generated is not collected in these urban centres.
And even where it is collected, a large percentage of wastewater is not treated. In
fact, overall close to two-thirds of the wastewater generated is not treated in the
sampled urban centres. When this is translated into actual terms, the level of land
and water pollution due to discharge of untreated wastewater is huge. Significantly,
over half the urban centres, with sewerage system have sewage treatment plants.
Only primary treatment is given to wastewater in a small number of the urban centres
while in a larger number waste water is also given secondary treatment.
Recycling of wastewater is not yet very common in the sampled urban centres. Only
a small percentage of urban centres recycle wastewater, using it mainly for irrigating
agricultural fields.
The main sources of revenue receipts for this service is sewerage/ drainage tax
though sewerage benefit tax is also levied in two metropolitan cities, generating
substantial revenues on this account. Levying a surcharge on water for managing
wastewater is not very common and is used in just a few urban centres. Levying acharge per water closet is common in some of the towns.
Cost recovery from this service is very low in most urban centres.. However, some of
the urban centres are able to generate substantial revenues from the service,
showing positive balance on the revenue account in this service.
Low cost sanitation covers about one-third of the population in the sampled urban
centres. However, a significant percentage of the population is still not covered by
safe sanitation and is forced to use open spaces for defecation. Some people still
depend on dry latrines, though information on this aspect is not very easy to obtain.
The investment required for providing safe sanitation to all is huge and is difficult forthe government alone to finance it. Private sector participation as well as users
contribution can ease the financial burden on the government.
5.2.2 Summary of Results
1. Overall, only about one-third of the sampled urban centres (i.e., 100 cities/towns)
have a sewerage system.
2. Of the urban centres with a sewerage system, about 38 per cent have a combined
system of wastewater collection, i.e., combined with storm water drainage, while
60 per cent centres have a separate system.
3. The coverage of population by sewerage system in the sampled urban centres is
partial with an average coverage of 45 per cent.
4. Only 59 per cent of the wastewater generated is collected by the sewerage
system in the urban centres having a sewerage system.
5. Low coverage of population by sewerage system is the main reason for the low
collection efficiency.

7/21/2019 Status Watersupply
http://slidepdf.com/reader/full/status-watersupply 172/869
152
6. In 47 per cent of the sampled urban centres, with sewerage system, the entire
wastewater collected is discharged without any treatment.
7. In about 19 per cent of the responding urban centres only primary treatment is
provided to wastewater before disposal into land or water body, while 38 per cent
of urban centres also provide secondary treatment to wastewater before
disposal.
8. The most commonly used wastewater treatment process in the responding urban
centres, with sewerage system, is extended aeration.
9. Recycling/ reuse of wastewater is done in only 44 urban centres having a
sewerage system.
10. The present survey shows that STPs are available in only 51 of the 100 urban
centres with sewerage system.
11. The present survey reveals that charging for wastewater collection and treatment
in the sampled urban centres is mainly done in three ways: through taxes, by a
surcharge on water, and by a charge per water closet.
12. Amongst the sampled urban centres with sewerage facilities, 36 urban centres
have indicated revenues from sewage/drainage tax while 48 have indicated
revenues from connection charges in 1997-98.
13. There are 13 urban centres, with sewerage system, where no revenue is
generated from the service.
14. The cost recovery from the service is generally low and averages about 27 per
cent in non-metropolitan urban centres.
15. The present survey indicates that 34 per cent of the population in the sampled
urban centres is covered by septic tanks and low cost sanitation.
16. The additional investment required for covering the entire population by safe
sanitation facilities is Rs. 52361 crores for the period 1999-2022 (using Task
Forces cost estimates) and Rs. 86103 crores for the same period (using
HUDCO’s cost estimates).
5.2.3 Recommendations
1. Rehabilitation of sewerage systems must be taken up in all the cities where the
sewerage system exists but has become non-functional.
2. Wastewater treatment must be made mandatory for all sizes of urban centres.The smaller urban centres could use less capital-intensive technologies to reduce
capital cost as well as maintenance cost of treatment.
3. Pollution of land or water body with untreated wastewater should be made
punishable with fine.
4. Recycling/ reuse of wastewater must be encouraged. Technical and financial
assistance must be provided for this, if required.

7/21/2019 Status Watersupply
http://slidepdf.com/reader/full/status-watersupply 173/869
153
5. All agencies dealing with wastewater must prepare plans for cost recovery from
this service. Private sector participation could be encouraged in managing this
service to reduce public expenditure.
6. Successful examples of people’s participation in contributing to the cost of
construction of sewerage system (e.g. Alandur) must be examined and adopted
in other urban centres of the country.
5.3 SOLID WASTE MANAGEMENT
5.3.1 Conclusions
The status of solid waste management needs to be improved considerably in urban
India. While the coverage by the service, which indicates only the reach of the
agency, but not the quality of service delivered, is fairly high at 92 per cent of the
total population, the service delivery needs improvement. The waste collection
efficiency in smaller cities and towns needs even more improvement as these urban
centres lack sufficient staff and waste transportation vehicles. They also lack vehiclemaintenance facilities and funds to keep the waste transportation vehicles in good
order to lift waste efficiently and regularly.
One of the areas that need immediate and urgent attention is the disposal of waste.
With three-fourths of the waste being dumped crudely, the quality of urban
environment is deteriorating rapidly. Landfill sites need to be identifed and developed
on a priority basis and waste treatment facilities (e.g. composting) need to be
developed on scientific lines. Decentralisation of waste management, wherever
possible, should be resorted to in order to reduce the quantity of waste that needs to
be transported and also the land requirement for waste treatment. Waste
segregation at source and recycling of waste should be encouraged. Waste reductionand recycling should be promoted at the household and neighbourhood level.
Hospital waste should not be allowed to be mixed with municipal waste, as is
happening in most cities and towns today. The provisions of the Bio-Medical Waste
(Management and Handling) Rules, 1998 should be implemented and action taken in
case of non-compliance.
Privatisation of activities under solid waste managment must be encouraged. Although
only 65 sampled urban centres have involved private sector in waste management, the
cost savings have been encouraging in some cities. These experiences must be studied
in detail and replicated wherever possible, particularly in cities/towns where there is
shortage of staff and the coverage by the service is not full.
Solid waste management is a service that is expenditure heavy with very meager
revenues, if at all there is any revenue from the service. Cost recovery from the
service, at present, is dismal with only a fraction of the expenditure on the service
being recovered. The per capita per day expenditure on the service is only about
Rs. 0.33 paise. Expenditure norms, based on performance norms, should be fixed in
order to guide the local governments in improving the quality of service provided.
7/21/2019 Status Watersupply
http://slidepdf.com/reader/full/status-watersupply 174/869
154
Since there is no separate account maintained for solid waste management, it is
difficult to assess the financial condition of the service and suggest improvements.
The revenue generated from the service, through taxes, though not very significant,
is deposited in the general revenue account of the local body and the expenditure too
is made from the general revenue account. Efficiency and cost savings cannot be
instituted or financial discipline brought in unless the accounting system is improved.
Improving the accounting should also be taken up on a priority basis by local
governments to bring about cost savings and revenue improvements in the service.
At the same time, new sources of revenue in solid waste management such as fine
for littering, user charges for bulk waste generators and other commercial
establishments, user charges for domestic waste collection (door-to-door) and
levying of tipping fees should be considered by local governments for improving
revenue from this service.
Additional funds required for investment in solid waste managment to cover 100 per
cent of the population by the service cannot be financed by the government alone.
Resource mobilization from private sector and financial institutions must be explored
for improving solid waste managment in urban areas of the country.
5.3.2 Summary of results
1. The average coverage of population by solid waste management is 92 per cent in
the sampled urban centres.
2. The average per capita waste generation in the sample is 433 grams per day. The
per capita waste generation is the highest in metropolitan cities with 500 grams
per day followed by Class I cities with 377 and class II towns 297 grams waste
generation per capita per day.
3. The total waste generated in the 298 responding cities and towns is 60823 MT
per day, of which 7318 MT of waste gets left uncollected daily. This gives a waste
collection efficiency of 88 percent. The waste collection efficiency reduces with
city size. Metropolitan cities collect an average of 91 per cent of the waste
generated daily while the collection efficiency is 85 per cent in Class I cities and
75 per cent in Class II towns.
4. Hospital waste is collected separately in only 22 per cent of the urban centres; in
77 per cent hospital waste is still collected along with municipal waste.
5. Even in urban centres where hospital waste is collected separately, no treatmentis given to this waste in about 29 per cent of such cities.
6. The most prevalent method of waste disposal is crude/ open dumping. Almost
three-fourths of the urban centres resort to this method for waste disposal.
Landfill is the main method of waste disposal in 11 per cent of the urban centres
(most common in metropolitan cities) while composting is the main method in 12
per cent of the urban centres.

7/21/2019 Status Watersupply
http://slidepdf.com/reader/full/status-watersupply 175/869
155
7. The average staff per 1000 population for solid waste management is 2.4, while
the norm for the service is 2.8 workers per 1000 population. Metropolitan cities
with 2.8 staff per 1000 population are above the sample average while the other
urban centres fall short of this average (1.9 in Class I cities and 2.1 in Class II
towns).
8. Private sector involvement in solid waste management has been found in only 22
per cent of the urban centres. Largest involvement of private sector is in primary
collection followed by transportation.
9. Revenue receipts from solid waste management is negligible in most urban
centres and is generated mainly from taxes.
10. Establishment consumes about four-fifth of the total expenditure on the service.
This is not abnormal as this is a labour intensive service and there is very little
mechanisation at the primary collection stage.
11. The average per capita revenue from the service is Rs. 10.1 per annum, withmetropolitan cities generating Rs. 12.8, Class I cities Rs. 6.6 and Class II towns
generating low revenue of Rs. 2.8 per capita per annum.
12. The average per capita expenditure on the service is about 12 times the revenue
generated from the service. The per capita expenditure on the service is Rs.
121.21 per annum. The per capita expenditure on the service is higher in
metropolitan cities than in other urban centres. Metropolitan cities spend an
average of Rs. 156.06 per capita per annum, Class I cities spend Rs. 87.27 and
Class II towns spend an average of Rs. 85.99 per capita per annum on solid waste
managment.
13. Cost recovery from solid waste managment is a dismal 7 per cent. The average
deficit per capita per annum is Rs. 130.51 with the deficit being the highest in
metropolitan cities – Rs. 176.59 as compared to Rs. 66.46 in Class I cities and Rs.
60.19 in Class II cities.
14. The additional investment requirement for covering 100 per cent of population by
solid waste managment during 1999-2022 period is Rs. 3954 crores at 1998-99
prices (based on Task Forces per capita cost estimates). The investment
requirement per annum works out to Rs. 172 crores during this period.
5.3.3 Recommendations
1. Three ‘R’s of solid waste management i.e. reduce, reuse and recycle must be
adopted by all urban centres. This will help in reducing the quantum of solid waste
that the local governments have to deal with.
2. Efficiency of waste collection must be improved in cities by bringing about the
necessary changes in the design of equipment used by sanitary staff, manpower
management and planning.

7/21/2019 Status Watersupply
http://slidepdf.com/reader/full/status-watersupply 176/869
156
3. Transportation fleet needs to be maintained well and needs to be modernised to
improve collection and transportation efficiency.
4. Crude/open dumping of waste must be completely discouraged by engaging in
controlled tipping.
5. All urban centres should identify landfill sites that are usable. In order to reducethe quantity of waste that goes to landfill sites, waste treatment such as
neighbourhood composting and recycling of waste must be encouraged.
6. Separate collection of hospital waste must be ensured in every city and
incinerators must be installed to deal with this waste. Landfill sites should
apportion an area for the disposal of hazardous waste from hospitals.
7. Private sector participation must continue to be encouraged in this sector to
achieve efficiency of operations and cost reduction. However, monitoring of
privatised activities should be improved in order to provide better quality of
services to the people.
8. Plans to improve cost recovery from this service must be made by every local
government. New sources of revenue generation must be thought of.
9. People’s participation must be encouraged to keep cities clean and NGOs must
be used to do information, education and communication work in communities.

7/21/2019 Status Watersupply
http://slidepdf.com/reader/full/status-watersupply 177/869
A P P
E NDI X I
WA T E R S UP P L Y
A ND WA T E R T A R
I F F

7/21/2019 Status Watersupply
http://slidepdf.com/reader/full/status-watersupply 178/869

7/21/2019 Status Watersupply
http://slidepdf.com/reader/full/status-watersupply 179/869
M e t r o p ol i t an Ci t i e s
1 8 1
Cl a s sI Ci t i e s
1 8 2
Cl a s sI I T own s
1 9 0
A- 3
W
a t er S u p pl i e d ,E s t i m a t e d D em an d an d S u p pl yD ef i ci t
u
si n g CP HE E ON or m an d Ci t y
N or m ,1 9 9 9
1 9 7
M e t r o p ol i t an Ci t i e s
1 9 9
Cl a s sI Ci t i e s
2 0 0
Cl a s sI I T own s
2 0 7
A-4
U
n a c c o un t e d f or W a t er an d N e
t Q u an t i t y of W a t er S u p pl i e d ,1 9 9 9
2 1 3
M e t r o p ol i t an Ci t i e s
2 1 5
Cl a s sI Ci t i e s
2 1 6
Cl a s sI I T own s
2 2 4
A- 5
W
a t er S u p pl y C onn e c t i on s-M
e t er e d an d Unm e t er e d an d
N
um b er of S t an d p o s t s ,1 9 9 9
2 3 1
M e t r o p ol i t an Ci t i e s
2 3 3
Cl a s sI Ci t i e s
2 3 4
Cl a s sI I T own s
2 4 1
A- 6
D
e t ai l s of H e a d w or k s ,1 9 9 9
2 4 7
M e t r o p ol i t an Ci t i e s
2 4 9
Cl a s sI Ci t i e s
2 5 0
Cl a s sI I T own s
2 5 7
A-7
S
o ur c e of W a t er ,1 9 9 9
2 6 3
M e t r o p ol i t an Ci t i e s
2 6 5
Cl a s sI Ci t i e s
2 6 6
Cl a s sI I T own s
2 7 3
A- 8
L
en g t h of Di s t r i b u t i onN e t w or k an d W a t er S t or a g e C a p a ci t y
,1 9 9 9
2 7 9
M e t r o p ol i t an Ci t i e s
2 8 1
Cl a s sI Ci t i e s
2 8 2
Cl a s sI I T own s
2 8 9

7/21/2019 Status Watersupply
http://slidepdf.com/reader/full/status-watersupply 180/869
,
M e t r o p ol i t an Ci t i e s
3 3 3
Cl a s sI Ci t i e s
3 3 4
Cl a s sI I T own s
3 4 1
A-1 2
D
e t ai l s of P r i v a t i s a t i oni nW a t e
r S u p pl y ,1 9 9 9
3 4 7
M e t r o p ol i t an Ci t i e s
3 4 9
Cl a s sI Ci t i e s
3 5 0
Cl a s sI I T own s
3 5 1
A-1 3
R
ev en u eR e c ei p t sf r omW a t er S u p pl y ,1 9 9 7 - 9 8
3 5 3
M e t r o p ol i t an Ci t i e s
3 5 5
Cl a s sI Ci t i e s
3 5 6
Cl a s sI I T own s
3 6 3
A-1 4
R
ev en u eE x p en d i t ur e onW a t er
S u p pl y ,1 9 9 7 - 9 8
3 6 9
M e t r o p ol i t an Ci t i e s
3 7 1
Cl a s sI Ci t i e s
3 7 2
Cl a s sI I T own s
3 7 9
A-1 5
C
o s t R e c ov er y an d R ev en u e-E x p en d i t ur e G a p ,1 9 9 7 - 9 8
3 8 5
M e t r o p ol i t an Ci t i e s
3 8 7
C
l a s sI Ci t i e s
3 8 8
Cl a s sI I T own s
3 9 6
A-1 6
P
er C a pi t aR ev en u eR e c ei p t s a
n d E x p en d i t ur e ,1 9 9 7 - 9 8
4 0 3
M e t r o p ol i t an Ci t i e s
4 0 5
Cl a s sI Ci t i e s
4 0 6
Cl a s sI I T own s
4 1 3
A-1 7
C
a pi t al W or k s un d er t ak en b e t w
e en1 9 9 4 an d 1 9 9 9
4 1 9
M e t r o p ol i t an Ci t i e s
4 2 1
Cl a s sI Ci t i e s
4 2 2
Cl a s sI I T own s
4 2 6
A-1 8
C
a pi t al W or k s t o b e un d er t ak e
ni nF u t ur e
4 2 9
M e t r o p ol i t an Ci t i e s
4 3 1
Cl a s sI Ci t i e s
4 3 2
Cl a s sI I T own s
4 3 5

7/21/2019 Status Watersupply
http://slidepdf.com/reader/full/status-watersupply 181/869
AT - 5
K
er al a
4 6 9
AT - 6
M
a d h y aP r a d e sh
4 7 3
AT -7
M
ah ar a sh t r a
4 7 7
AT - 8
O
r i s s a
4 8 7
AT - 9
P
un j a b
4 9 1
AT -1 0
R
a j a s t h an
4 9 5
AT -1 1
T
ami l N a d u
4 9 9
AT -1 2
U
t t ar P r a d e sh
5 0 5
AT -1 3
W
e s t B en g al
5 1 9
AT -1 4
S
m al l S t a t e s an d Uni onT er r i t or i e s
5 2 5

7/21/2019 Status Watersupply
http://slidepdf.com/reader/full/status-watersupply 182/869

7/21/2019 Status Watersupply
http://slidepdf.com/reader/full/status-watersupply 183/869
A -1
P OP U
L A T I O N ,A R E A , S L U MP OP UL A T I O N ,1 9 9 9

7/21/2019 Status Watersupply
http://slidepdf.com/reader/full/status-watersupply 184/869

7/21/2019 Status Watersupply
http://slidepdf.com/reader/full/status-watersupply 185/869
Sl. City/Town Population ('000) % Population Area (Sq.km.)
No 1991 1999 covered by water 1991 1999 (Census) (Estimated)* supply 1999 (Census) (Estimated)*
1 2 3 4 5 6
METROPOLITAN CITIES
1 Ahmedabad M.Corp. 2,877 3,500 100 190.84 190.84
2 Bangalore M.Corp. 2,660 5,000 100 445.91 482.00#
3 Bhopal M.Corp. 1,063 1,500 100 284.09 284.09
4 Calcutta M.Corp. 4,400 6,000 100 187.33 187.33
5 Chennai M.Corp. 3,841 4,363 100 174.00 174.00
6 Coimbatore M.Corp 816 971 100 105.60 105.60
7 Delhi M.Corp. 7,207 12,000 100 1485.00 1485.00
8 Greater Mumbai M.Corp. 9,926 11,100 100 437.71 437.71
9 Hyderabad M.Corp. 2,965 4,163 100 172.00 172.00
10 Indore M.Corp. 1,092 1,600 100 137.17 137.1711 Jaipur M.Corp. 1,458 2,000 100 200.40 200.40
12 Kanpur M.Corp. 1,874 2,500 50 106.00 227.67
13 Kochi M.Corp. 565 680 100 94.88 94.88
14 Lucknow M.Corp. 1,619 2,500 100 290.00 310.00
15 Ludhiana M.Corp. 1,043 2,000 60 134.67 165.00
16 Madurai M.Corp. 941 1,020 100 51.96 51.96
17 Nagpur M.Corp. 1,625 2,100 100 217.56 217.56
18 Pune M.Corp. 1,567 2,300 100 146.00 416.00
19 Surat M.Corp. 1,499 2,300 100 112.28 112.28
20 Vadodara M.Corp. 1,031 1,400 100 108.26 108.26
21 Varanasi M.Corp. 929 1,152 70 73.89 73.8922 Visakhapatnam M.Corp. 752 1,280 100 78.33 107.00
Total - Metropolitan Cities 51,749 71,429 98 5,234 5,741
* Estimated by Water Supplying agencies of respective cities/towns # Area covered by utility ** For entire Delhi not just for M.Corp
M.Corp's slum population as per 2001 census is 1854,685 ~ Mumbai's slum population has reduced due to slum redevelopment schemSource: Respective urban local governments/relevant agencies, NIUA Survey,
1 6 5
A-1: Population, Area, Slum Population, 1999

7/21/2019 Status Watersupply
http://slidepdf.com/reader/full/status-watersupply 186/869
CLASS I
Andhra Pradesh1 Anantapur MCI 175 250 100 16.00 16.00
2 Chittoor M 133 149 100 33.57 33.57
3 Cuddapah MCI 121 166 100 6.84 6.84
4 Eluru M 213 247 100 14.55 14.55
5 Guntur MCI 471 557 100 45.79 45.79
6 Hindupur M 105 140 75 36.18 36.18
7 Kakinada M 280 325 75 30.51 30.51
8 Kurnool MCI 237 282 100 15.01 15.01
9 Machilipatnam M 159 200 100 26.67 26.67
10 Nandyal MCI 120 150 100 15.42 15.42
11 Nellore MCI 317 404 100 48.39 48.3912 Nizamabad M 241 285 100 30.50 30.50
13 Ongole MCI 101 180 100 25.89 25.89
14 Qutubullapur M 107 250 52 46.87 46.87
15 Rajahmundry M.Corp. 325 380 100 44.50 44.50
16 Tenali M 144 170 20 15.12 15.12
17 Tirupati MCI 174 210 100 21.96 24.00
18 Vijaywada M.Corp. 702 837 100 58.00 58.00
19 Warangal M.Corp. 448 680 100 68.50 68.50
Bihar
20 Bihar Sharif M 201 250 70 19.43 19.43
21 Chhapra M 137 200 100 8.00 8.0022 Gaya M.Corp. 292 400 100 17.50 17.50
23 Katihar M 135 200 75 12.00 12.00
24 Munger M 150 210 60 19.00 19.00
25 Ranchi M.Corp. 599 700 93 177.19 177.19
1 6 6
Sl. City/Town Population ('000) % Population Area (Sq.km.)
No 1991 1999 covered by water 1991 1999 (Census) (Estimated)* supply 1999 (Census) (Estimated)*
1 2 3 4 5 6

7/21/2019 Status Watersupply
http://slidepdf.com/reader/full/status-watersupply 187/869
Gujarat
26 Anand M 110 175 100 21.13 23.1427 Bharuch M 133 159 100 18.43 19.93
28 Bhavnagar M.Corp. 402 550 100 53.40 53.40
29 Bhuj M 102 118 100 9.45 9.49
30 Jamnagar M.Corp. 342 500 100 26.40 26.40
31 Junagadh M 130 165 100 30.00 30.00
32 Nadiad M 167 300 100 28.48 28.48
33 Navsari M 126 139 100 8.52 8.55
34 Porbandar M 117 142 100 12.30 12.30
35 Rajkot M.Corp. 559 1,000 100 69.00 104.86
36 Surendranagar M 106 150 100 14.19 36.87
Haryana37 Ambala MCI 119 141 96 16.94 16.94
38 Faridabad M.Corp. 618 1,150 100 178.00 208.00
39 Gurgaon MCI 121 175 85 15.33 16.57
40 Hisar MCI 173 250 70 45.42 45.42
41 Karnal MCI 176 220 85 22.10 22.10
42 Rohtak MCI 216 243 89 20.38 28.38
Jammu & Kashmir
43 Jammu M.Corp. 716 1,051 84 n.a. 130.36
Karnataka
44 Belgaum M.Corp. 326 470 100 141.95 n.a.
45 Bellary CMC 245 297 100 81.95 81.9546 Davangere MCI 266 455 99 31.80 31.80
47 Gadag-Betigeri CMC 134 148 100 15.36 54.58
48 Gulbarga M.Corp. 304 450 100 55.00 55.00
49 Hubli-Dharwar M.Corp. 648 850 100 188.77 188.77
1 6 7
Sl. City/Town Population ('000) % Population Area (Sq.km.)
No 1991 1999 covered by water 1991 1999 (Census) (Estimated)* supply 1999 (Census) (Estimated)*
1 2 3 4 5 6

7/21/2019 Status Watersupply
http://slidepdf.com/reader/full/status-watersupply 188/869
50 Mandya M 120 140 100 17.03 n.a.
51 Mangalore M.Corp. 273 410 90 74.71 116.7752 Mysore M.Corp. 481 1,050 80 64.00 100.00
53 Shimoga CMC 179 222 100 35.00 50.00
54 Tumkur M 139 300 60 15.93 45.90
Kerala
55 Alappuzha MC 175 200 100 42.00 42.00
56 Kollam MC 140 160 100 18.45 18.45
57 Kozhikode M.Corp. 420 493 100 84.23 84.23
58 Thalaserry M 104 134 100 15.35 15.35
59 Thiruvananthapuram M.Corp. 524 585 100 78.40 78.40
Madhya Pradesh
60 Bhind M 110 175 100 17.18 17.1861 Burhanpur M.Corp. 173 210 100 24.00 24.00
62 Dewas M.Corp. 164 200 100 100.22 100.22
63 Guna M 100 125 70 45.75 45.75
64 Gwalior M.Corp. 691 900 94 n.a. 166.83
65 Jabalpur M.Corp. 742 1,000 100 133.99 133.99
66 Khandwa M 145 175 100 35.77 35.77
67 Morena M 105 125 100 12.00 12.00
68 Murwara (Katni) M.Corp. 163 180 100 107.10 107.10
69 Ratlam M.Corp. 183 235 100 39.00 39.00
70 Rewa M.Corp. 129 180 70 54.99 54.99
71 Satna M.Corp. 157 200 100 62.24 62.2472 Shivpuri M 108 140 100 81.10 81.10
Maharashtra
73 Amravati M.Corp. 422 500 100 121.00 121.00
74 Aurangabad M.Corp. 573 868 100 138.00 138.00
1 6 8
Sl. City/Town Population ('000) % Population Area (Sq.km.)
No 1991 1999 covered by water 1991 1999 (Census) (Estimated)* supply 1999 (Census) (Estimated)*
1 2 3 4 5 6

7/21/2019 Status Watersupply
http://slidepdf.com/reader/full/status-watersupply 189/869
75 Bhusawal MCl 145 200 100 13.58 13.58
76 Chandrapur MCl 226 295 100 45.00 45.0077 Dhule MCl 278 330 100 46.46 46.46
78 Ichalkaranji MCl 215 250 100 29.91 29.91
79 Jalgaon MCl 242 400 100 65.64 65.64
80 Kolhapur M.Corp. 406 502 100 66.00 66.00
81 Nanded Waghala M.Corp. 275 410 100 20.60 46.00
82 Nashik M.Corp. 657 839 100 259.13 259.13
83 Parbhani MCl 190 233 100 57.60 57.60
84 Solapur M.Corp. 604 900 100 180.66 n.a.
85 Wardha M 103 150 100 9.04 9.04
86 Yavatmal MCl 109 130 100 10.69 10.69
Orissa87 Bhubaneswar M.Corp. 412 654 100 124.74 n.a.
88 Cuttack M.Corp. 403 563 100 80.00 80.00
89 Puri M 125 150 71 16.84 16.84
90 Rourkela M 140 200 85 52.00 52.00
91 Sambalpur M 131 157 100 33.46 33.46
Punjab
92 Amritsar M.Corp. 709 843 60 133.00 133.00
93 Bathinda MCI 159 174 40 97.00 99.00
94 Hoshiarpur MCI 123 145 69 35.00 35.00
95 Jalandhar M.Corp. 510 738 89 98.00 110.00
96 Moga MCI 108 148 70 18.50 18.5097 Pathankot MCI 124 195 100 22.10 22.10
98 Patiala M.Corp. 238 328 65 41.00 41.00
Rajasthan
99 Ajmer MCI 403 550 80 199.00 220.00
1 6 9
Sl. City/Town Population ('000) % Population Area (Sq.km.)
No 1991 1999 covered by water 1991 1999 (Census) (Estimated)* supply 1999 (Census) (Estimated)*
1 2 3 4 5 6

7/21/2019 Status Watersupply
http://slidepdf.com/reader/full/status-watersupply 190/869
100 Alwar M 205 300 90 58.15 58.15
101 Beawar M 105 141 100 17.74 17.69102 Bhilwara M 184 225 100 69.00 69.00
103 Bikaner M 416 600 100 175.76 175.76
104 Jodhpur M.Corp. 666 1,000 94 78.57 78.57
105 Kota M.Corp. 537 750 100 221.00 221.00
106 Sriganganagar M 161 225 100 18.00 20.87
Tamil Nadu
107 Cuddalore M 145 162 100 27.62 27.62
108 Dindigul M 182 214 100 14.01 14.01
109 Erode M 159 174 100 8.44 8.44
110 Kanchipuram M 145 157 100 11.60 11.60
111 Kumbakonam M 139 147 100 12.58 12.58112 Nagercoil M 190 206 61 24.27 24.27
113 Rajapalayam M 114 123 100 11.36 11.36
114 Salem M.Corp. 367 447 100 91.34 91.34
115 Thanjavur M 202 217 80 36.31 36.31
116 Tiruchirapalli M.Corp. 669 800 100 n.a. 146.90
117 Tirunelveli M.Corp. 374 414 100 108.65 108.65
118 Tirunvannamalai M 109 129 100 13.64 13.64
119 Tiruppur M 236 295 100 27.19 27.19
120 Tuticorin M 200 217 100 13.47 13.47
121 Vellore M 175 176 100 11.65 11.65
Uttar Pradesh122 Agra M.Corp. 892 1,150 75 121.57 121.57
123 Aligarh M.Corp. 481 600 100 62.00 62.00
124 Allahabad M.Corp. 793 1,015 75 70.05 70.05
125 Bareilly M.Corp. 587 750 80 106.43 106.43
1 7 0
Sl. City/Town Population ('000) % Population Area (Sq.km.)
No 1991 1999 covered by water 1991 1999 (Census) (Estimated)* supply 1999 (Census) (Estimated)*
1 2 3 4 5 6

7/21/2019 Status Watersupply
http://slidepdf.com/reader/full/status-watersupply 191/869
126 Etawah MB 124 140 100 33.74 33.74
127 Faizabad MB 124 170 100 16.50 16.50128 Firozabad MB 215 250 75 45.00 50.00
129 Ghaziabad M.Corp. 454 887 100 63.78 200.00
130 Gorakhpur M.Corp. 506 600 75 119.00 143.00
131 Haldwani-cum-Kathgodam MB 104 141 100 10.62 10.62
132 Hapur MB 146 200 65 14.20 14.20
133 Hardwar MB 147 300 60 11.91 11.91
134 Jhansi MB 301 507 80 48.00 48.00
135 Mathura MB 227 400 65 25.23 25.23
136 Meerut M.Corp. 754 1,250 100 141.94 141.94
137 Mirzapur MB 169 210 65 30.59 30.59
138 Moradabad M.Corp. 429 670 100 50.48 50.48139 Muzaffarnagar MB 241 325 80 12.00 12.00
140 Rae Bareli MB 130 175 75 32.69 32.69
141 Rampur MB 244 317 100 48.00 48.00
142 Saharanpur MB 375 540 50 25.75 25.75
143 Sitapur MB 122 150 100 35.00 35.00
144 Unnao MB 107 121 100 21.50 21.50
West Bengal
145 Asansol M.Corp. 262 315 100 25.02 n.a.
146 Baharampur M 115 143 100 16.67 15.65
147 Balurghat M 120 132 100 6.50 8.50
148 Bankura M 115 151 70 18.13 19.06149 Barasat M 103 150 38 20.26 34.50
150 Burdwan M 245 323 70 34.18 34.18
151 Halisahar M 114 149 100 8.29 8.29
152 Krishnagar M 121 145 60 15.96 15.96
1 7 1
Sl. City/Town Population ('000) % Population Area (Sq.km.)
No 1991 1999 covered by water 1991 1999 (Census) (Estimated)* supply 1999 (Census) (Estimated)*
1 2 3 4 5 6
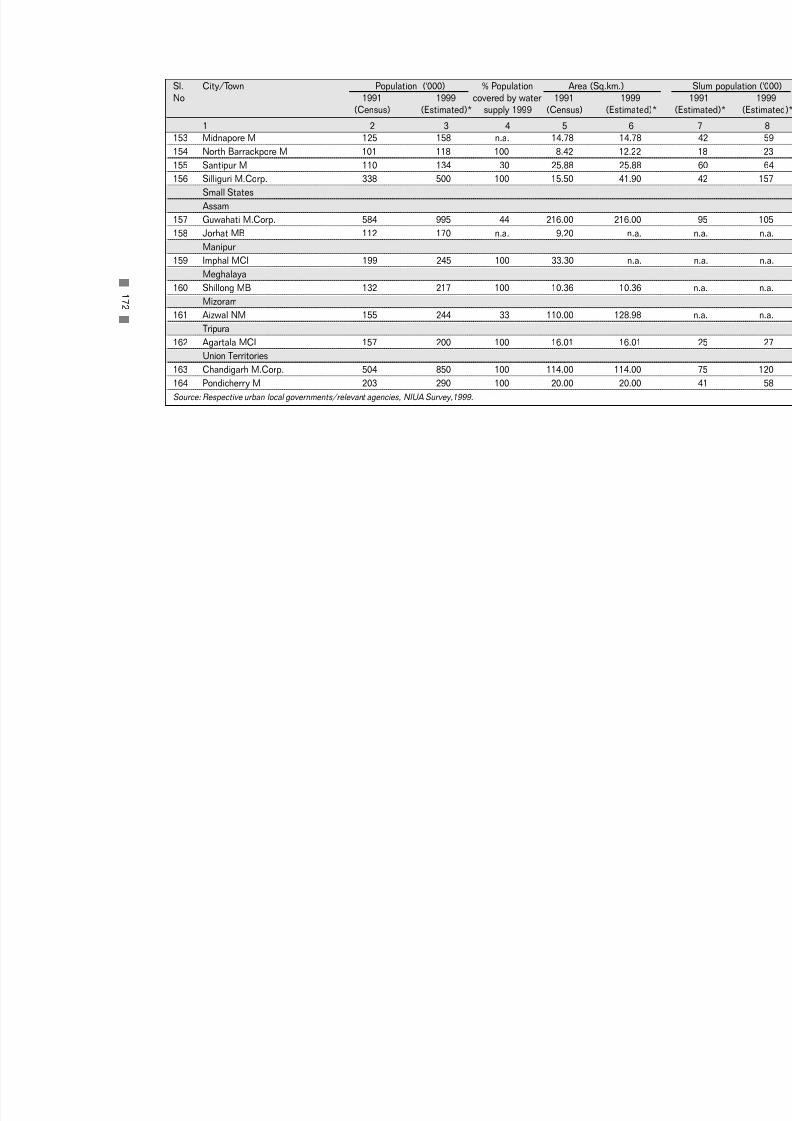
7/21/2019 Status Watersupply
http://slidepdf.com/reader/full/status-watersupply 192/869
153 Midnapore M 125 158 n.a. 14.78 14.78
154 North Barrackpore M 101 118 100 8.42 12.22155 Santipur M 110 134 30 25.88 25.88
156 Silliguri M.Corp. 338 500 100 15.50 41.90
Small States
Assam
157 Guwahati M.Corp. 584 995 44 216.00 216.00
158 Jorhat MB 112 170 n.a. 9.20 n.a.
Manipur
159 Imphal MCI 199 245 100 33.30 n.a.
Meghalaya
160 Shillong MB 132 217 100 10.36 10.36
Mizoram161 Aizwal NM 155 244 33 110.00 128.98
Tripura
162 Agartala MCI 157 200 100 16.01 16.01
Union Territories
163 Chandigarh M.Corp. 504 850 100 114.00 114.00
164 Pondicherry M 203 290 100 20.00 20.00
Source: Respective urban local governments/relevant agencies, NIUA Survey,1999.
1 7 2
Sl. City/Town Population ('000) % Population Area (Sq.km.)
No 1991 1999 covered by water 1991 1999 (Census) (Estimated)* supply 1999 (Census) (Estimated)*
1 2 3 4 5 6

7/21/2019 Status Watersupply
http://slidepdf.com/reader/full/status-watersupply 193/869
CLASS II
Andhra Pradesh1 Anakapalle M 84 115 100 23.28 23.28
2 Dharmavaram M 79 100 100 40.45 40.45
3 Gudur MCI 56 72 100 9.10 9.80
4 Kapra M 88 120 80 43.90 65.00
5 Kavali MCI 66 85 100 22.95 22.95
6 Madanapalle M 74 100 90 7.74 14.20
7 Narasaraopet M 89 95 100 7.65 7.65
8 Rajendra nagar MCI 85 120 100 58.00 58.00
9 Sangareddy MCI 50 60 100 13.69 13.69
10 Srikakulam MCI 89 100 100 14.10 14.10
11 Srikalahasti M 62 70 86 12.80 12.8012 Suryapet MCI 61 89 80 23.54 23.54
Bihar
13 Buxar M 56 67 82 9.75 9.75
14 Deoghar M 76 100 80 n.a. n.a.
15 Hajipur M 88 115 100 15.00 15.00
16 Hazaribagh M 98 119 84 19.00 19.00
17 Jehanabad M 52 57 89 8.00 8.00
18 Madhubani M 54 65 69 19.00 19.00
19 Mokama M 60 66 100 10.00 10.00
Gujarat
20 Amreli M 68 85 100 11.44 13.5921 Ankleswar M 52 60 100 11.05 11.05
22 Dabhoi M 51 65 100 23.82 23.82
23 Dohad M 67 78 100 6.54 7.00
24 Gondal M 81 100 100 11.00 11.00
1 7 3
Sl. City/Town Population ('000) % Population Area (Sq.km.)
No 1991 1999 covered by water 1991 1999 (Census) (Estimated)* supply 1999 (Census) (Estimated)*
1 2 3 4 5 6

7/21/2019 Status Watersupply
http://slidepdf.com/reader/full/status-watersupply 194/869
25 Jetpur M 74 125 100 6.88 36.00
26 Mahesana M 88 138 100 12.87 12.8727 Palanpur M 81 117 100 23.48 23.48
Haryana
28 Jind MCI 85 114 80 15.30 21.00
29 Kaithal MCI 71 95 80 3.05 5.05
30 Rewari MCI 75 105 100 12.58 18.43
31 Thanesar MCI 81 100 72 32.25 32.25
Karnataka
32 Bagalkot CMC 77 100 85 48.25 48.25
33 Chikmaglur CMC 61 100 100 27.50 27.50
34 Gokak CMC 52 68 100 33.05 33.05
35 Hospet CMC 96 114 100 20.73 50.9236 Kolar CMC 83 112 100 12.50 21.47
37 Rabkavi-Banhatti CMC 61 72 100 8.49 12.00
38 Ramanagaram CMC 50 70 100 11.60 17.80
Kerala
39 Changanessary MC 52 62 100 13.50 13.50
40 Payyanur M 64 71 100 54.63 54.63
41 Taliparamba M 60 52 100 43.36 18.21
42 Thrissur MC 75 91 100 16.65 16.65
Madhya Pradesh
43 Hoshangabad M 71 100 100 24.26 24.26
44 Itarsi M 77 105 100 14.07 14.0745 Khargone M 67 80 100 10.00 10.00
46 Mandsaur M 96 123 100 10.36 10.36
47 Nagda M 80 100 89 23.00 23.00
48 Neemuch M 86 100 100 13.43 13.43
1 7 4
Sl. City/Town Population ('000) % Population Area (Sq.km.)
No 1991 1999 covered by water 1991 1999 (Census) (Estimated)* supply 1999 (Census) (Estimated)*
1 2 3 4 5 6

7/21/2019 Status Watersupply
http://slidepdf.com/reader/full/status-watersupply 195/869
49 Sehore M 71 100 100 18.00 18.00
50 Shahdol M 56 75 100 19.92 19.9251 Vidisha M 93 125 100 5.83 5.83
Maharashtra
52 Amalner MCl 76 100 100 9.71 9.71
53 Ballarpur MCl 84 109 100 8.19 9.07
54 Bhandara M 72 76 79 16.83 16.83
55 Kamptee MCl 79 95 100 4.27 4.27
56 Manmad MCl 61 87 100 23.45 23.45
57 Ratnagiri MCl 57 70 100 10.49 10.49
58 Satara MCl 95 100 100 8.16 8.16
59 Virar MCl 58 100 100 19.54 19.54
Orissa60 Balangir M 70 83 58 n.a. n.a.
61 Bhadrak M 76 93 100 80.00 80.00
Punjab
62 Firozpur MCI 79 93 88 11.33 11.33
63 Kapurthala M 65 85 63 16.00 16.00
64 Mansa MCI 55 67 50 23.47 23.47
65 Phagwara MCI 83 108 80 16.00 16.00
66 Sangrur MCI 56 70 98 10.36 18.00
Rajasthan
67 Banswara M 67 110 100 10.01 10.01
68 Barmer M 69 84 76 10.29 6.2569 Bundi M 65 80 100 22.76 30.00
70 Churu M 82 100 100 35.00 35.00
71 Hanumangarh M 79 125 100 13.42 13.42
72 Sawai Madhopur M 72 89 100 11.50 11.50
1 7 5
Sl. City/Town Population ('000) % Population Area (Sq.km.)
No 1991 1999 covered by water 1991 1999 (Census) (Estimated)* supply 1999 (Census) (Estimated)*
1 2 3 4 5 6
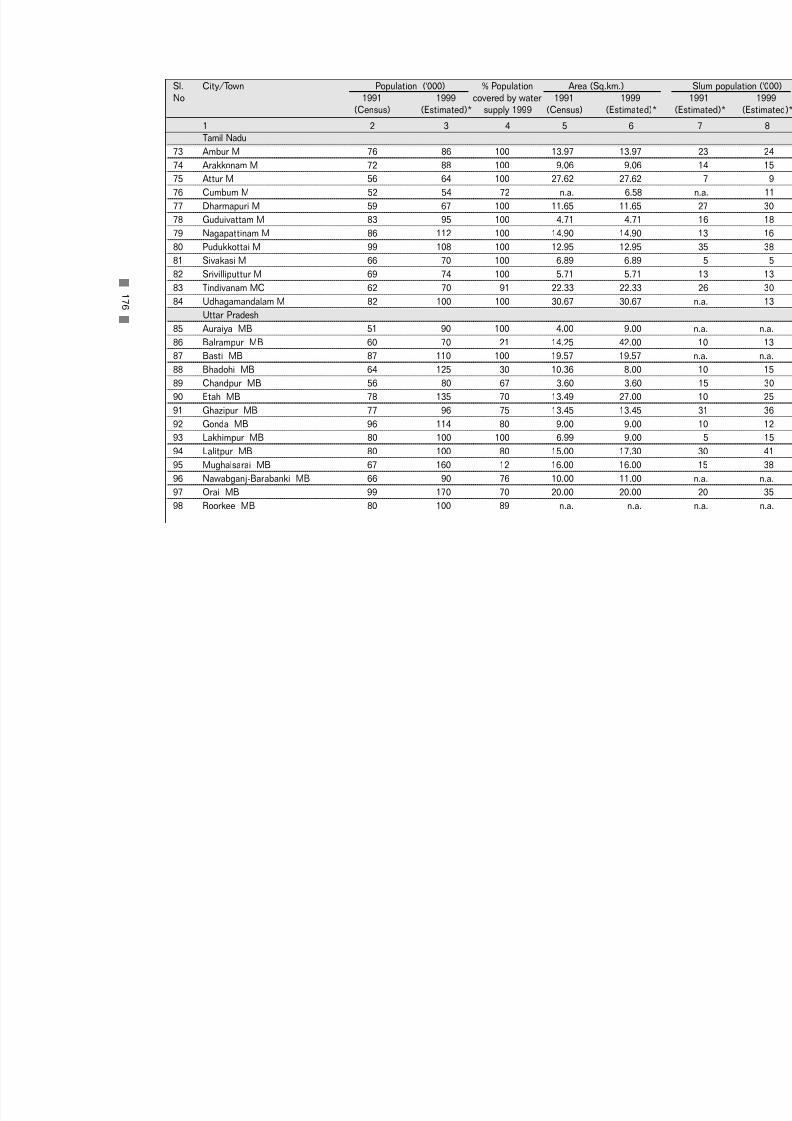
7/21/2019 Status Watersupply
http://slidepdf.com/reader/full/status-watersupply 196/869
Tamil Nadu
73 Ambur M 76 86 100 13.97 13.9774 Arakkonam M 72 88 100 9.06 9.06
75 Attur M 56 64 100 27.62 27.62
76 Cumbum M 52 54 72 n.a. 6.58
77 Dharmapuri M 59 67 100 11.65 11.65
78 Guduivattam M 83 95 100 4.71 4.71
79 Nagapattinam M 86 112 100 14.90 14.90
80 Pudukkottai M 99 108 100 12.95 12.95
81 Sivakasi M 66 70 100 6.89 6.89
82 Srivilliputtur M 69 74 100 5.71 5.71
83 Tindivanam MC 62 70 91 22.33 22.33
84 Udhagamandalam M 82 100 100 30.67 30.67Uttar Pradesh
85 Auraiya MB 51 90 100 4.00 9.00
86 Balrampur MB 60 70 21 14.25 42.00
87 Basti MB 87 110 100 19.57 19.57
88 Bhadohi MB 64 125 30 10.36 8.00
89 Chandpur MB 56 80 67 3.60 3.60
90 Etah MB 78 135 70 13.49 27.00
91 Ghazipur MB 77 96 75 13.45 13.45
92 Gonda MB 96 114 80 9.00 9.00
93 Lakhimpur MB 80 100 100 6.99 9.00
94 Lalitpur MB 80 100 80 15.00 17.3095 Mughalsarai MB 67 160 12 16.00 16.00
96 Nawabganj-Barabanki MB 66 90 76 10.00 11.00
97 Orai MB 99 170 70 20.00 20.00
98 Roorkee MB 80 100 89 n.a. n.a.
1 7 6
Sl. City/Town Population ('000) % Population Area (Sq.km.)
No 1991 1999 covered by water 1991 1999 (Census) (Estimated)* supply 1999 (Census) (Estimated)*
1 2 3 4 5 6
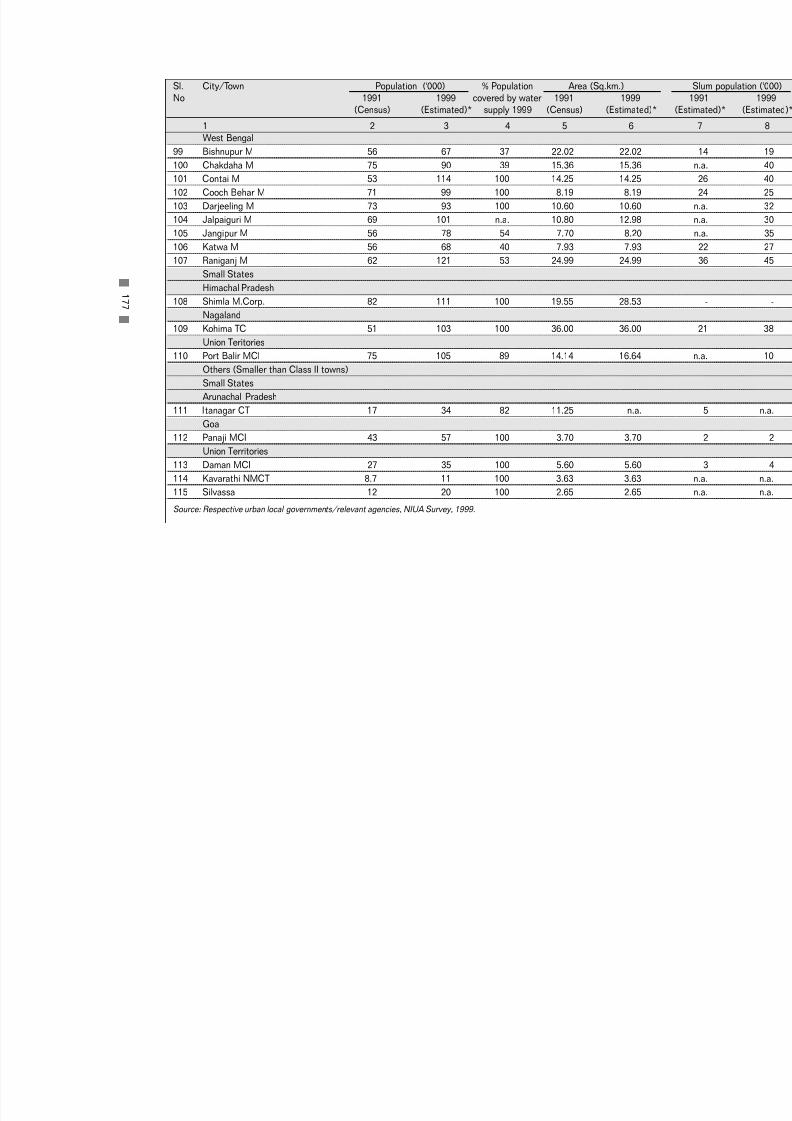
7/21/2019 Status Watersupply
http://slidepdf.com/reader/full/status-watersupply 197/869
West Bengal
99 Bishnupur M 56 67 37 22.02 22.02100 Chakdaha M 75 90 39 15.36 15.36
101 Contai M 53 114 100 14.25 14.25
102 Cooch Behar M 71 99 100 8.19 8.19
103 Darjeeling M 73 93 100 10.60 10.60
104 Jalpaiguri M 69 101 n.a. 10.80 12.98
105 Jangipur M 56 78 54 7.70 8.20
106 Katwa M 56 68 40 7.93 7.93
107 Raniganj M 62 121 53 24.99 24.99
Small States
Himachal Pradesh
108 Shimla M.Corp. 82 111 100 19.55 28.53Nagaland
109 Kohima TC 51 103 100 36.00 36.00
Union Teritories
110 Port Balir MCI 75 105 89 14.14 16.64
Others (Smaller than Class II towns)
Small States
Arunachal Pradesh
111 Itanagar CT 17 34 82 11.25 n.a.
Goa
112 Panaji MCI 43 57 100 3.70 3.70
Union Territories113 Daman MCI 27 35 100 5.60 5.60
114 Kavarathi NMCT 8.7 11 100 3.63 3.63
115 Silvassa 12 20 100 2.65 2.65
Source: Respective urban local governments/relevant agencies, NIUA Survey, 1999.
1 7 7
Sl. City/Town Population ('000) % Population Area (Sq.km.)
No 1991 1999 covered by water 1991 1999 (Census) (Estimated)* supply 1999 (Census) (Estimated)*
1 2 3 4 5 6

7/21/2019 Status Watersupply
http://slidepdf.com/reader/full/status-watersupply 198/869

7/21/2019 Status Watersupply
http://slidepdf.com/reader/full/status-watersupply 199/869
A -2
Q
UA NT I T Y OF WA T E R S UP P L I E DB Y U S E ,
D UR A T I O NA NDF R E Q UE N C Y OF S UP P L Y ,1 9 9 9

7/21/2019 Status Watersupply
http://slidepdf.com/reader/full/status-watersupply 200/869

7/21/2019 Status Watersupply
http://slidepdf.com/reader/full/status-watersupply 201/869
1 8 1
Metropolitan Cities
1 Ahmedabad M.Corp. 486 467 19.0 139 486 100 on dem
2 Bangalore M.Corp. 706 606 99.4 141 724 97
3 Bhopal M.Corp. 270 204 65.7 180 322 84
4 Calcutta M.Corp. 1035 906 129.4 173 1090 95
5 Chennai M.Corp. 461 418 43.0 106 461 100
6 Coimbatore M.Corp 105 103 2.3 108 232 45
7 Delhi M.Corp. 2620 2165 454.9 218 2620 100 12
8 Greater Mumbai M.Corp. 2978 2453 524.7 268 3277 91
9 Hyderabad M.Corp. 682 361 321.0 164 744 9210 Indore M.Corp. 238 199 38.7 149 238 100
11 Jaipur M.Corp. 340 332 7.6 170 n.a. n.a. on dem
12 Kanpur M.Corp. 310 225 85.0 124 350 89
13 Kochi M.Corp. 84 59 25.2 124 190 44
14 Lucknow M.Corp. 410 349 61.5 164 455 90
15 Ludhiana M.Corp. 234 200 34.1 117 234 100
16 Madurai M.Corp. 90 67 23.0 88 110 82
17 Nagpur M.Corp. 370 211 158.8 176 416 89
18 Pune M.Corp. 650 520 130.0 283 725 90
19 Surat M.Corp. 320 299 21.0 139 476 67 on dem
20 Vadodara M.Corp. 240 188 52.0 171 298 81 on dem21 Varanasi M.Corp. 220 198 22.0 191 360 61
22 Visakhapatnam M.Corp. 168 68 100.0 131 185 91
Source: Respective urban local government/relevant agencies, NIUA Survey,1999.
A-2 : Quantity of Water Supplied by Use, Duration and Frequency of Supply, 19
Sl. City/Town Total Quantity of water Per- Installed % Da
No. quantity supplied by uses (mld) capita production utilization supof water Domestic Non- supply capacity of capacity throsupplied domestic (lpcd) (mld) tank
(mld) (‘0001 2 3 4 6 7 8 9

7/21/2019 Status Watersupply
http://slidepdf.com/reader/full/status-watersupply 202/869
CLASS I
Andhra Pradesh
1 Anantapur MCI 14 11 2.8 56 14 100 1
2 Chittoor M 16 16 0.3 106 20 79
3 Cuddapah MCI 17 15 2 101 n.a. n.a.
4 Eluru M 24 23 0.3 96 24 100
5 Guntur MCI 75 66 9 135 75 100
6 Hindupur M 10 10 0.4 71 20 50
7 Kakinada M 21 21 0.7 66 n.a. n.a.
8 Kurnool MCI 7 5 2 23 7 100 1
9 Machilipatnam M 21 11 9 103 24 8610 Nandyal MCI 10 7 4 67 10 100
11 Nellore MCI 43 33 10 107 45 97
12 Nizamabad M 15 11 4 53 28 55 3
13 Ongole MCI 16 13 3 90 19 86
14 Qutubullapur M 30 13 17 118 n.a. n.a. 1
15 Rajahmundry M.Corp. 33 32 0.7 86 33 100
16 Tenali M 0.7 0.7 n.a. 4* 2 43
17 Tirupati MCI 29 23 5 136 29 100
18 Vijaywada M.Corp. 146 143 3 174 160 91
19 Warangal M.Corp. 68 55 13 100 68 100
Bihar20 Bihar Sharif M 30 Break-up not available 120 32 94
21 Chhapra M 14 Break-up not available 70 18 78
22 Gaya M.Corp. 36 Break-up not available 91 36 100 on dem
23 Katihar M 15 Break-up not available 75 20 75
24 Munger M 10 Break-up not available 48 10 100
1 8 2
Sl. City/Town Total Quantity of water Per- Installed % DaNo. quantity supplied by uses (mld) capita production utilization sup
of water Domestic Non- supply capacity of capacity throsupplied domestic (lpcd) (mld) tank
(mld) (‘000
1 2 3 4 6 7 8 9
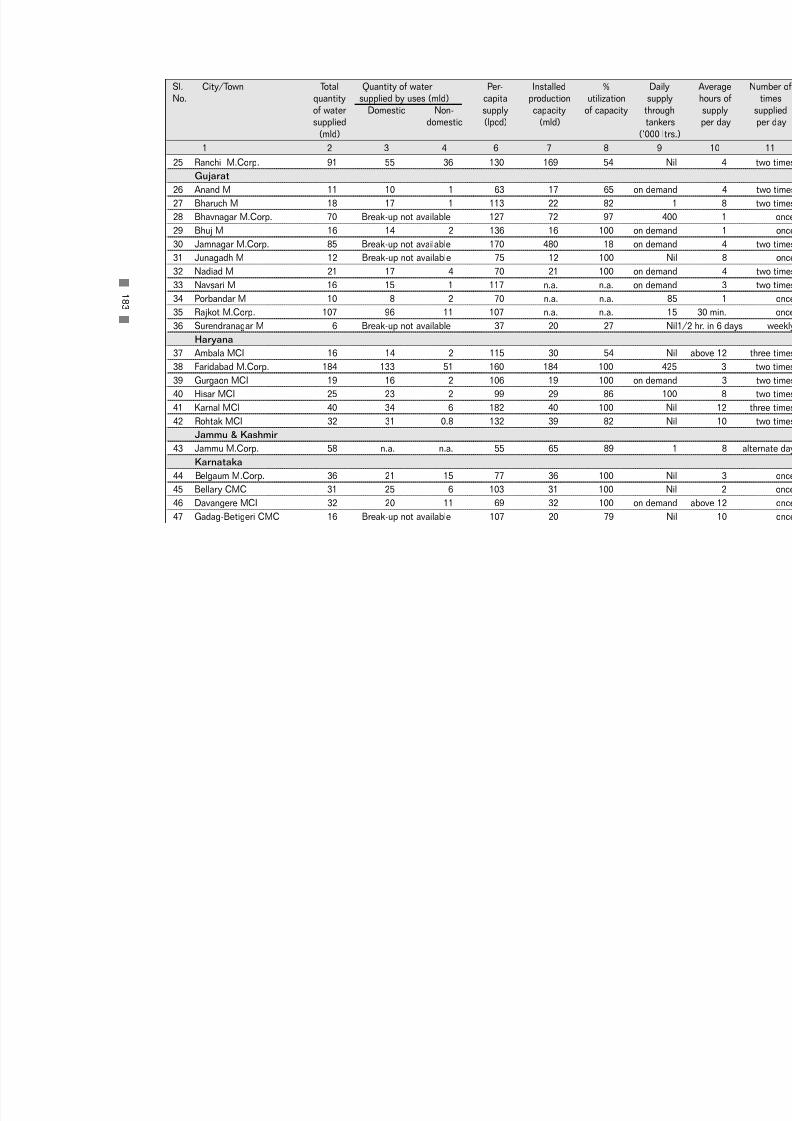
7/21/2019 Status Watersupply
http://slidepdf.com/reader/full/status-watersupply 203/869
25 Ranchi M.Corp. 91 55 36 130 169 54
Gujarat
26 Anand M 11 10 1 63 17 65 on dem
27 Bharuch M 18 17 1 113 22 82
28 Bhavnagar M.Corp. 70 Break-up not available 127 72 97
29 Bhuj M 16 14 2 136 16 100 on dem
30 Jamnagar M.Corp. 85 Break-up not available 170 480 18 on dem
31 Junagadh M 12 Break-up not available 75 12 100
32 Nadiad M 21 17 4 70 21 100 on dem
33 Navsari M 16 15 1 117 n.a. n.a. on dem
34 Porbandar M 10 8 2 70 n.a. n.a.35 Rajkot M.Corp. 107 96 11 107 n.a. n.a.
36 Surendranagar M 6 Break-up not available 37 20 27
Haryana
37 Ambala MCI 16 14 2 115 30 54
38 Faridabad M.Corp. 184 133 51 160 184 100
39 Gurgaon MCI 19 16 2 106 19 100 on dem
40 Hisar MCI 25 23 2 99 29 86
41 Karnal MCI 40 34 6 182 40 100
42 Rohtak MCI 32 31 0.8 132 39 82
Jammu & Kashmir
43 Jammu M.Corp. 58 n.a. n.a. 55 65 89Karnataka
44 Belgaum M.Corp. 36 21 15 77 36 100
45 Bellary CMC 31 25 6 103 31 100
46 Davangere MCI 32 20 11 69 32 100 on dem
47 Gadag-Betigeri CMC 16 Break-up not available 107 20 79
1 8 3
Sl. City/Town Total Quantity of water Per- Installed % DaNo. quantity supplied by uses (mld) capita production utilization sup
of water Domestic Non- supply capacity of capacity throsupplied domestic (lpcd) (mld) tank
(mld) (‘000
1 2 3 4 6 7 8 9

7/21/2019 Status Watersupply
http://slidepdf.com/reader/full/status-watersupply 204/869
48 Gulbarga M.Corp. 32 24 7 70 61 52
49 Hubli-Dharwar M.Corp. 88 68 19 103 108 81 on dem
50 Mandya M 13 11 2 92 14 95
51 Mangalore M.Corp. 85 56 29 207 91 93 on dem
52 Mysore M.Corp. 138 103 35 132 138 100
53 Shimoga CMC 34 32 1 152 34 100
54 Tumkur M 22 21 0.6 73 44 50
Kerala
55 Alappuzha MC 15 Break-up not available 75 18 83
56 Kollam MC 18 13 5 113 58 31
57 Kozhikode M.Corp. 72 61 11 146 77 9458 Thalaserry M 27 20 7 201 27 100
59 ThiruvananthapuramM.Corp. 180 151 29 308 260 69
Madhya Pradesh
60 Bhind M 19 19 0.05 109 21 90
61 Burhanpur M.Corp. 19 Break-up not available 90 19 100
62 Dewas M.Corp. 9 Break-up not available 45 n.a. n.a.
63 Guna M 12 10 2 97 12 100 on dem
64 Gwalior M.Corp. 150 124 25 166 159 94 on dem
65 Jabalpur M.Corp. 109 75 33 109 200 54 5
66 Khandwa M 16 Break-up not available 91 24 6867 Morena M 8 7 1 68 8 100
68 Murwara (Katni) M.Corp. 13 8 5 71 15 86
69 Ratlam M.Corp. 18 18 0.4 78 27 67
70 Rewa M.Corp. 20 Break-up not available 111 27 74
71 Satna M.Corp. 14 9 5 68 14 100
1 8 4
Sl. City/Town Total Quantity of water Per- Installed % DaNo. quantity supplied by uses (mld) capita production utilization sup
of water Domestic Non- supply capacity of capacity throsupplied domestic (lpcd) (mld) tank
(mld) (‘000
1 2 3 4 6 7 8 9

7/21/2019 Status Watersupply
http://slidepdf.com/reader/full/status-watersupply 205/869
72 Shivpuri M 13 11 2 93 13 100 on dem
Maharashtra
73 Amravati M.Corp. 60 45 15 120 95 63
74 Aurangabad M.Corp. 168 130 38 194 168 100
75 Bhusawal MCl 22 Break-up not available 110 28 79
76 Chandrapur MCl 30 29 0.6 102 52 58
77 Dhule MCl 31 29 2 94 71 44
78 Ichalkaranji MCl 32 26 6 128 54 59
79 Jalgaon MCl 56 Break-up not available 140 56 100
80 Kolhapur M.Corp. 85 70 15 169 85 100 on dem
81 Nanded WaghalaM.Corp. 39 35 4 95 98 40
82 Nashik M.Corp. 158 136 22 188 158 100
83 Parbhani MCl 15 15 0.01 64 22 69 1
84 Solapur M.Corp. 125 111 14 139 216 58 3
85 Wardha M 12 12 0 82 12 100
86 Yavatmal MCl 13 11 2 100 16 80
Orissa
87 Bhubaneswar M.Corp. 150 97 53 229 259 58
88 Cuttack M.Corp. 146 126 20 259 146 100
89 Puri M 24 16 8 160 24 100
90 Rourkela M 18 18 0.4 90 18 10091 Sambalpur M 19 15 4 118 19 100
Punjab
92 Amritsar M.Corp. 127 89 38 151 180 71
93 Bathinda MCI 17 13 4 98 17 100
94 Hoshiarpur MCI 22 Break-up not available 150 22 100
1 8 5
Sl. City/Town Total Quantity of water Per- Installed % DaNo. quantity supplied by uses (mld) capita production utilization sup
of water Domestic Non- supply capacity of capacity throsupplied domestic (lpcd) (mld) tank
(mld) (‘000
1 2 3 4 6 7 8 9

7/21/2019 Status Watersupply
http://slidepdf.com/reader/full/status-watersupply 206/869
95 Jalandhar M.Corp. 175 157 17 237 209 84
96 Moga MCI 20 18 2 135 29 70
97 Pathankot MCI 17 14 3 87 28 60
98 Patiala M.Corp. 60 55 5 183 80 75
Rajasthan
99 Ajmer MCI 52 Break-up not available 95 146 36
100 Alwar M 32 27 6 107 32 100
101 Beawar M 11 10 1 80 23 49
102 Bhilwara M 14 Break-up not available 62 32 44
103 Bikaner M 68 46 22 113 68 100
104 Jodhpur M.Corp. 176 Break-up not available 176 316 56105 Kota M.Corp. 160 120 40 213 166 97
106 Sriganganagar M 22 20 2 98 32 69 on dem
Tamil Nadu
107 Cuddalore M 4 4 0.3 26 5 86
108 Dindigul M 12 11 1 56 12 100
109 Erode M 22 17 5 127 30 74
110 Kanchipuram M 16 14 3 104 22 76
111 Kumbakonam M 11 9 2 72 11 95
112 Nagercoil M 9 8 1 44 11 86
113 Rajapalayam M 9 8 0.5 71 43 20
114 Salem M.Corp. 50 45 5 112 53 95115 Thanjavur M 24 Break-up not available 111 25 97 on dem
116 Tiruchirapalli M.Corp. 88 79 9 110 88 100
117 Tirunelveli M.Corp. 34 32 2 82 34 100
118 Tirunvannamalai M 14 Break-up not available 105 18 75
119 Tiruppur M 29 Break-up not available 97 49 58
1 8 6
Sl. City/Town Total Quantity of water Per- Installed % DaNo. quantity supplied by uses (mld) capita production utilization sup
of water Domestic Non- supply capacity of capacity throsupplied domestic (lpcd) (mld) tank
(mld) (‘000
1 2 3 4 6 7 8 9
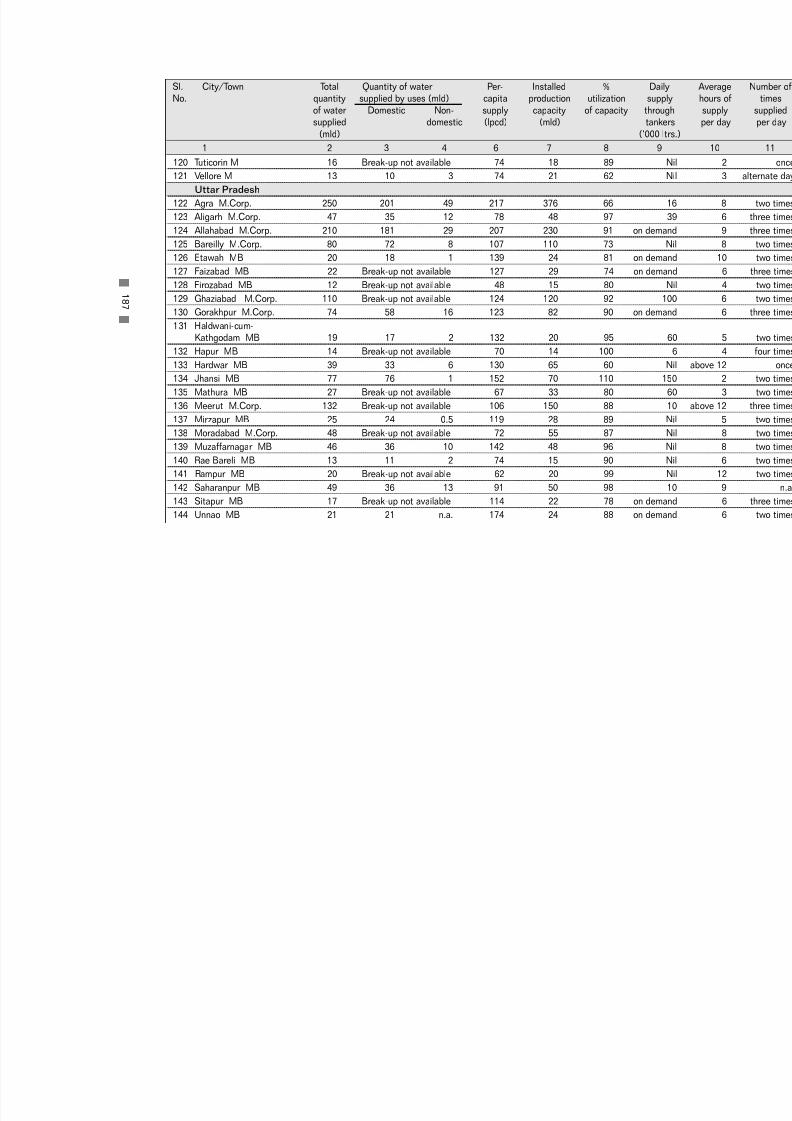
7/21/2019 Status Watersupply
http://slidepdf.com/reader/full/status-watersupply 207/869
120 Tuticorin M 16 Break-up not available 74 18 89
121 Vellore M 13 10 3 74 21 62
Uttar Pradesh
122 Agra M.Corp. 250 201 49 217 376 66
123 Aligarh M.Corp. 47 35 12 78 48 97
124 Allahabad M.Corp. 210 181 29 207 230 91 on dem
125 Bareilly M.Corp. 80 72 8 107 110 73
126 Etawah MB 20 18 1 139 24 81 on dem
127 Faizabad MB 22 Break-up not available 127 29 74 on dem
128 Firozabad MB 12 Break-up not available 48 15 80
129 Ghaziabad M.Corp. 110 Break-up not available 124 120 92130 Gorakhpur M.Corp. 74 58 16 123 82 90 on dem
131 Haldwani-cum-Kathgodam MB 19 17 2 132 20 95
132 Hapur MB 14 Break-up not available 70 14 100
133 Hardwar MB 39 33 6 130 65 60
134 Jhansi MB 77 76 1 152 70 110
135 Mathura MB 27 Break-up not available 67 33 80
136 Meerut M.Corp. 132 Break-up not available 106 150 88
137 Mirzapur MB 25 24 0.5 119 28 89
138 Moradabad M.Corp. 48 Break-up not available 72 55 87
139 Muzaffarnagar MB 46 36 10 142 48 96140 Rae Bareli MB 13 11 2 74 15 90
141 Rampur MB 20 Break-up not available 62 20 99
142 Saharanpur MB 49 36 13 91 50 98
143 Sitapur MB 17 Break-up not available 114 22 78 on dem
144 Unnao MB 21 21 n.a. 174 24 88 on dem
1 8 7
Sl. City/Town Total Quantity of water Per- Installed % DaNo. quantity supplied by uses (mld) capita production utilization sup
of water Domestic Non- supply capacity of capacity throsupplied domestic (lpcd) (mld) tank
(mld) (‘000
1 2 3 4 6 7 8 9
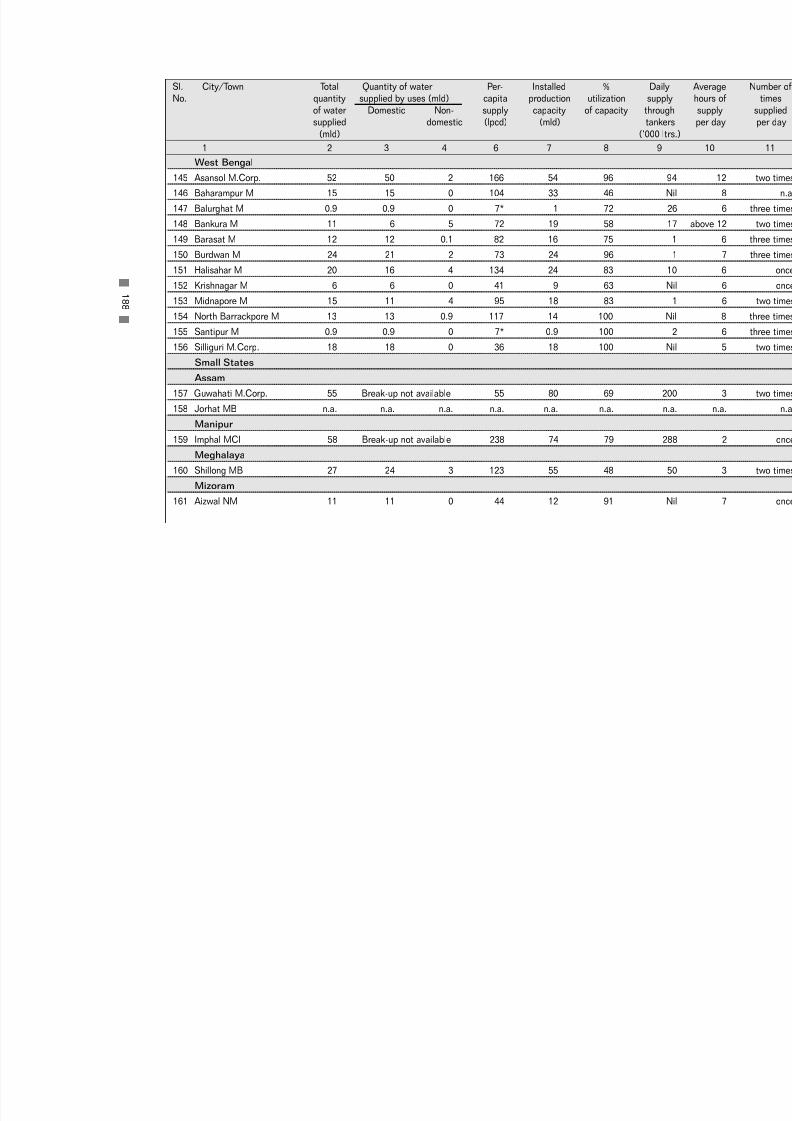
7/21/2019 Status Watersupply
http://slidepdf.com/reader/full/status-watersupply 208/869
West Bengal
145 Asansol M.Corp. 52 50 2 166 54 96
146 Baharampur M 15 15 0 104 33 46
147 Balurghat M 0.9 0.9 0 7* 1 72
148 Bankura M 11 6 5 72 19 58
149 Barasat M 12 12 0.1 82 16 75
150 Burdwan M 24 21 2 73 24 96
151 Halisahar M 20 16 4 134 24 83
152 Krishnagar M 6 6 0 41 9 63
153 Midnapore M 15 11 4 95 18 83154 North Barrackpore M 13 13 0.9 117 14 100
155 Santipur M 0.9 0.9 0 7* 0.9 100
156 Silliguri M.Corp. 18 18 0 36 18 100
Small States
Assam
157 Guwahati M.Corp. 55 Break-up not available 55 80 69
158 Jorhat MB n.a. n.a. n.a. n.a. n.a. n.a.
Manipur
159 Imphal MCI 58 Break-up not available 238 74 79
Meghalaya
160 Shillong MB 27 24 3 123 55 48
Mizoram
161 Aizwal NM 11 11 0 44 12 91
1 8 8
Sl. City/Town Total Quantity of water Per- Installed % DaNo. quantity supplied by uses (mld) capita production utilization sup
of water Domestic Non- supply capacity of capacity throsupplied domestic (lpcd) (mld) tank
(mld) (‘000
1 2 3 4 6 7 8 9

7/21/2019 Status Watersupply
http://slidepdf.com/reader/full/status-watersupply 209/869
Tripura
162 Agartala MCI 22 15 7 109 n.a. n.a.
Union Territories
163 Chandigarh M.Corp. 227 121 106 267 295 77
164 Pondicherry M 33 29 5 115 33 100
* reasons for low lpcd : a) low coverage of population by water supply, b) public water supply agency has been able to provide only a smdomestic connection, c) dependence of most households on stand posts and private sources of supply
Source: Respective urban local governments/relevant agencies, NIUA Survey,1999.
1 8 9
Sl. City/Town Total Quantity of water Per- Installed % DaNo. quantity supplied by uses (mld) capita production utilization sup
of water Domestic Non- supply capacity of capacity throsupplied domestic (lpcd) (mld) tank
(mld) (‘000
1 2 3 4 6 7 8 9

7/21/2019 Status Watersupply
http://slidepdf.com/reader/full/status-watersupply 210/869
CLASS II
Andhra Pradesh
1 Anakapalle M 4 2 1 32 4 100
2 Dharmavaram M 8 7 1 79 8 100
3 Gudur MCI 7 7 0.5 99 8 88
4 Kapra M 5 5 0 38 7 63
5 Kavali MCI 5 5 0 58 n.a. n.a.
6 Madanapalle M 8 7 0.2 77 9 87
7 Narasaraopet M 5 Break-up not available 47 5 100
8 Rajendra nagar MCI 5 3 2 42 6 91
9 Sangareddy MCI 4 3 0.4 64 4 10010 Srikakulam MCI 7 7 0.2 68 7 100
11 Srikalahasti M 7 7 0.2 97 10 71
12 Suryapet MCI 8 6 2 85 8 100
Bihar
13 Buxar M 4 4 0 58 8 49
14 Deogha r M 3 Break-up not available 30 3 100
15 Hajipur M 11 Break-up not available 96 14 79
16 Hazaribagh M 7 Break-up not available 61 82 9
17 Jehanabad M 8 Break-up not available 140 n.a. n.a.
18 Madhubani M 8 Break-up not available 123 12 67
19 Mokama M 2 Break-up not available 30 2 100Gujarat
20 Amreli M n.a. n.a. n.a. 118 10 100
21 Ankleswar M 10 Break-up not available 167 10 100
22 Dabhoi M 9 Break-up not available 138 9 100 on dem
1 9 0
Sl. City/Town Total Quantity of water Per- Installed % DaNo. quantity supplied by uses (mld) capita production utilization sup
of water Domestic Non- supply capacity of capacity throsupplied domestic (lpcd) (mld) tank
(mld) (‘000
1 2 3 4 6 7 8 9

7/21/2019 Status Watersupply
http://slidepdf.com/reader/full/status-watersupply 211/869
23 Dohad M 7 7 0.6 96 10 75 on dem
24 Gondal M 13 11 2 130 7 182
25 Jetpur M 11 Break-up not available 91 n.a. n.a. on dem
26 Mahesana M 15 Break-up not available 107 n.a. n.a. on dem
27 Palanpur M 4 Break-up not available 34 n.a. n.a. on dem
Haryana
28 Jind MCI 16 15 0.9 138 16 100
29 Kaithal MCI 11 10 0.7 114 17 63
30 Rewari MCI 11 11 0 108 11 100
31 Thanesar MCI 13 12 0.9 132 13 100Karnataka
32 Bagalkot CMC 12 11 1 122 14 90
33 Chikmaglur CMC 15 13 3 150 15 100 on dem
34 Gokak CMC 5 4 0.7 67 5 83
35 Hospet CMC 16 12 4 140 16 100
36 Kolar CMC 8 7 1 71 9 89 on dem
37 Rabkavi-Banhatti CMC 5 3 1 63 5 100
38 Ramanagaram CMC 5 Break-up not available 64 n.a. n.a.
Kerala
39 Changanessary MC 4 3 1 65 6 67
40 Payyanur M 1.5 1.5 0.01 21 2 100
41 Taliparamba M 0.4 Break-up not available 7* 0.5 80
42 Thrissur MC 18 12 6 198 51 36
Madhya Pradesh
43 Hoshangabad M 8 5 4 81 8 100
1 9 1
Sl. City/Town Total Quantity of water Per- Installed % DaNo. quantity supplied by uses (mld) capita production utilization sup
of water Domestic Non- supply capacity of capacity throsupplied domestic (lpcd) (mld) tank
(mld) (‘000
1 2 3 4 6 7 8 9

7/21/2019 Status Watersupply
http://slidepdf.com/reader/full/status-watersupply 212/869
44 Itarsi M 6 4 1 56 6 100
45 Khargone M 13 Break-up not available 163 11 122
46 Mandsaur M 9 9 0.4 73 14 66
47 Nagda M 3 Break-up not available 30 3 100
48 Neemuch M 6 Break-up not available 59 7 87 on dem
49 Sehore M 5 5 0.3 53 12 44
50 Shahdol M 5 Break-up not available 62 7 64
51 Vidisha M 9 9 0.1 72 9 100
Maharashtra
52 Amalner MCl 15 Break-up not available 150 16 94
53 Ballarpur MCl 7 7 0.4 64 8 9254 Bhandara M 9 7 2 118 9 100
55 Kamptee MCl 4 3 0.5 38 N. App. N. App.
56 Manmad MCl 7 7 0.5 83 16 46
57 Ratnagiri MCl 8 8 0.2 114 17 48
58 Satara MCl 11 9 2 110 12 92
59 Virar MCl 9 8 0.8 90 21 43
Orissa
60 Balangir M 7 2 5 87 18 40
61 Bhadrak M 3 1.5 2 32 4 75 on dem
Punjab
62 Firozpur MCI 20 15 4 210 21 9263 Kapurthala M 14 13 1 165 18 76
64 Mansa MCI 8 8 0 119 11 70
65 Phagwara MCI 15 12 3 136 19 80
66 Sangrur MCI 13 12 0.4 181 14 91
1 9 2
Sl. City/Town Total Quantity of water Per- Installed % DaNo. quantity supplied by uses (mld) capita production utilization sup
of water Domestic Non- supply capacity of capacity throsupplied domestic (lpcd) (mld) tank
(mld) (‘000
1 2 3 4 6 7 8 9

7/21/2019 Status Watersupply
http://slidepdf.com/reader/full/status-watersupply 213/869
Rajasthan
67 Banswara M 10 Break-up not available 89 10 100
68 Barmer M 7 6 0.03 77 7 100
69 Bundi M 8 6 2 100 9 89
70 Churu M 8 5 2 77 8 95
71 Hanumangarh M 7 6 1 58 8 90
72 Sawai Madhopur M 8 7 1 87 8 100
Tamil Nadu
73 Ambur M 6 Break-up not available 65 8 75
74 Arakkonam M 4 Break-up not available 45 5 80
75 Attur M 3 2 0.6 47 5 6076 Cumbum M 3 3 0.07 50 n.a. n.a.
77 Dharmapuri M 3 3 0.1 45 3 100
78 Guduivattam M 6 Break-up not available 61 8 73
79 Nagapattinam M 8 6 1 70 10 81
80 Pudukkottai M 8 8 0.3 73 8 100
81 Sivakasi M 5 Break-up not available 74 7 79
82 Srivilliputtur M 4 3 0.08 47 4 79
83 Tindivanam MC 2 2 0.2 27 1 131
84 Udhagamandalam M 4 Break-up not available 40 4 92
Uttar Pradesh
85 Auraiya MB 5 4 0.2 50 6 75 on dem86 Balrampur MB 3 Break-up not available 40 4 70 on dem
87 Basti MB 10 Break-up not available 91 12 83 on dem
88 Bhadohi MB 4 4 0 32 4 100
89 Chandpur MB 3 3 0.2 41 5 60
90 Etah MB 4 4 0 30 4 98
1 9 3
Sl. City/Town Total Quantity of water Per- Installed % DaNo. quantity supplied by uses (mld) capita production utilization sup
of water Domestic Non- supply capacity of capacity throsupplied domestic (lpcd) (mld) tank
(mld) (‘000
1 2 3 4 6 7 8 9
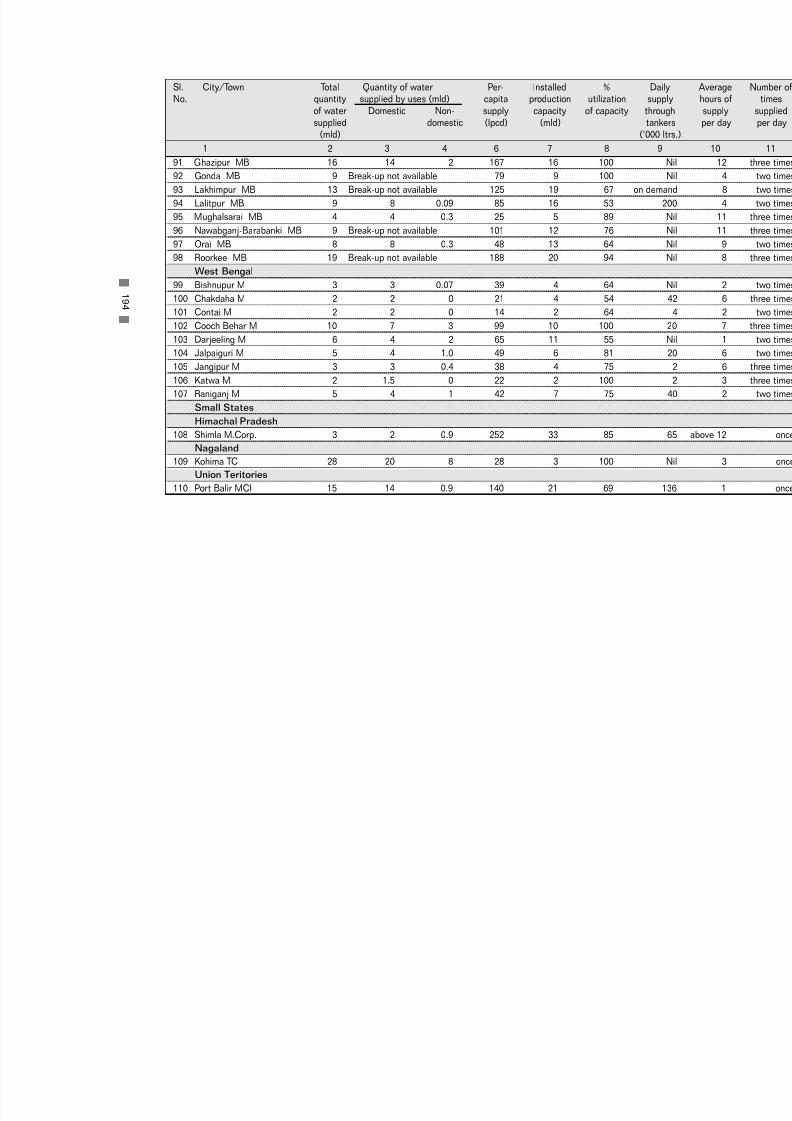
7/21/2019 Status Watersupply
http://slidepdf.com/reader/full/status-watersupply 214/869
91 Ghazipur MB 16 14 2 167 16 100
92 Gonda MB 9 Break-up not available 79 9 100
93 Lakhimpur MB 13 Break-up not available 125 19 67 on dem
94 Lalitpur MB 9 8 0.09 85 16 53
95 Mughalsarai MB 4 4 0.3 25 5 89
96 Nawabganj-Barabanki MB 9 Break-up not available 101 12 76
97 Orai MB 8 8 0.3 48 13 64
98 Roorkee MB 19 Break-up not available 188 20 94
West Bengal
99 Bishnupur M 3 3 0.07 39 4 64
100 Chakdaha M 2 2 0 21 4 54101 Contai M 2 2 0 14 2 64
102 Cooch Behar M 10 7 3 99 10 100
103 Darjeeling M 6 4 2 65 11 55
104 Jalpaiguri M 5 4 1.0 49 6 81
105 Jangipur M 3 3 0.4 38 4 75
106 Katwa M 2 1.5 0 22 2 100
107 Raniganj M 5 4 1 42 7 75
Small States
Himachal Pradesh
108 Shimla M.Corp. 3 2 0.9 252 33 85
Nagaland109 Kohima TC 28 20 8 28 3 100
Union Teritories
110 Port Balir MCI 15 14 0.9 140 21 69
1 9 4
Sl. City/Town Total Quantity of water Per- Installed % DaNo. quantity supplied by uses (mld) capita production utilization sup
of water Domestic Non- supply capacity of capacity throsupplied domestic (lpcd) (mld) tank
(mld) (‘000
1 2 3 4 6 7 8 9

7/21/2019 Status Watersupply
http://slidepdf.com/reader/full/status-watersupply 215/869
Others (Smaller than Class II towns)
Small States
Arunachal Pradesh
111 Itanagar CT 6 5 0.7 164 6 100
Goa
112 Panaji MCI 12 5 6 206 72 16
Union Territories
113 Daman MCI 8 Break-up not available 229 16 50
114 Kavarathi NMCT 0.04 0.04 0 3* 0.1 31
115 Silvassa 1 1.3 0.1 71 1 100
* reasons for low lpcd : a) low coverage of population by water supply, b) public water supply agency has been able to provide only a smdomestic connection, c) dependence of most households on stand posts and private sources of supply
Source: Respective urban local governments/relevant agencies, NIUA Survey, 1999
1 9 5
Sl. City/Town Total Quantity of water Per- Installed % DaNo. quantity supplied by uses (mld) capita production utilization sup
of water Domestic Non- supply capacity of capacity throsupplied domestic (lpcd) (mld) tank
(mld) (‘000
1 2 3 4 6 7 8 9

7/21/2019 Status Watersupply
http://slidepdf.com/reader/full/status-watersupply 216/869

7/21/2019 Status Watersupply
http://slidepdf.com/reader/full/status-watersupply 217/869
A - 3
WA T
E R S UP P L I E D ,E S
T I MA T E DDE MA N
DA ND
S UP P L Y DE F I C I T U S I N
G C P HE E O N OR MA ND
C I T Y N OR M ,1 9 9 9

7/21/2019 Status Watersupply
http://slidepdf.com/reader/full/status-watersupply 218/869

7/21/2019 Status Watersupply
http://slidepdf.com/reader/full/status-watersupply 219/869
Metropolitan Cities
1 Ahmedabad M.Corp. S 3500 486 139 150 170 525
2 Bangalore M.Corp. S 5000 706 141 150 140 750
3 Bhopal M.Corp. S 1500 270 180 150 150 225
4 Calcutta M.Corp. S 6000 1035 173 150 227 900
5 Chennai M.Corp. S 4363 461 106 150 110 654
6 Coimbatore M.Corp S 971 105 108 150 150 146
7 Delhi M.Corp. S 12000 2620 218 150 225 1800
8 Greater Mumbai M.Corp. S 11100 2978 268 150 240 1665
9 Hyderabad M.Corp. S 4163 682 164 150 160 624
10 Indore M.Corp. S 1600 238 149 150 200 240
11 Jaipur M.Corp. S 2000 340 170 150 180 300
12 Kanpur M.Corp. S 2500 310 124 150 200 375
13 Kochi M.Corp. S 680 84 124 150 150 102
14 Lucknow M.Corp. S 2500 410 164 150 250 375
15 Ludhiana M.Corp. S 2000 234 117 150 200 300
16 Madurai M.Corp. S 1020 90 88 150 110 153
17 Nagpur M.Corp. S 2100 370 176 150 175 315
18 Pune M.Corp. S 2300 650 283 150 160 345
19 Surat M.Corp. S 2300 320 139 150 140 345
20 Vadodara M.Corp. S 1400 240 171 150 180 21021 Varanasi M.Corp. S 1152 220 191 150 270 173
22 Visakhapatnam M.Corp. S 1280 168 131 150 65 192
S = having sewerage system US = not having sewerage system
Source: Respective urban local governments/relevant agencies, NIUA Survey, 1999
Sl. City/Town S/US Population Water supplied CPHEEO Norm Demand for
No. (‘000) 1999 mld lpcd norm adopted by CPHEEO(lpcd) city (lpcd) norm
1 2 3 4 5 6 7 8
1 9 9
A-3 : Water Supplied, Estimated Demand and Supply Deficit using CPHEEO Norm and Ci
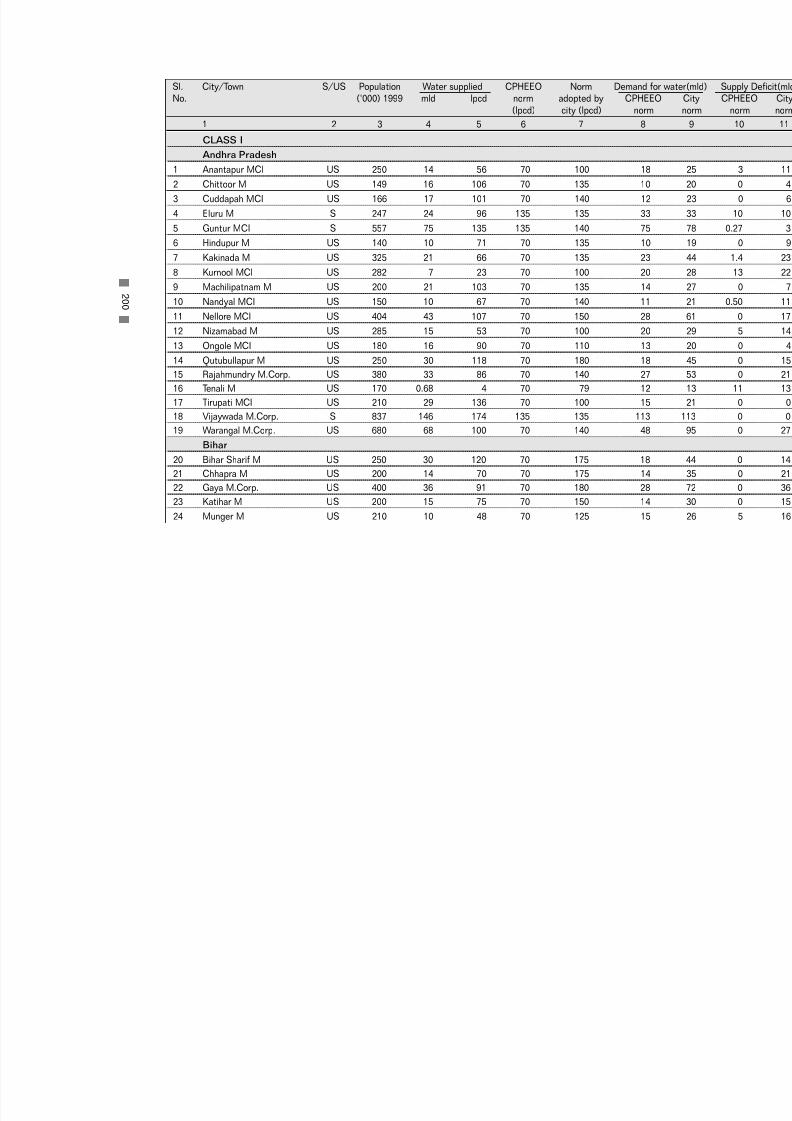
7/21/2019 Status Watersupply
http://slidepdf.com/reader/full/status-watersupply 220/869
CLASS I
Andhra Pradesh
1 Anantapur MCI US 250 14 56 70 100 18
2 Chittoor M US 149 16 106 70 135 10
3 Cuddapah MCI US 166 17 101 70 140 12
4 Eluru M S 247 24 96 135 135 33
5 Guntur MCI S 557 75 135 135 140 75
6 Hindupur M US 140 10 71 70 135 10
7 Kakinada M US 325 21 66 70 135 23
8 Kurnool MCI US 282 7 23 70 100 20
9 Machilipatnam M US 200 21 103 70 135 14
10 Nandyal MCI US 150 10 67 70 140 11
11 Nellore MCI US 404 43 107 70 150 28
12 Nizamabad M US 285 15 53 70 100 20
13 Ongole MCI US 180 16 90 70 110 13
14 Qutubullapur M US 250 30 118 70 180 18
15 Rajahmundry M.Corp. US 380 33 86 70 140 27
16 Tenali M US 170 0.68 4 70 79 12
17 Tirupati MCI US 210 29 136 70 100 15
18 Vijaywada M.Corp. S 837 146 174 135 135 113
19 Warangal M.Corp. US 680 68 100 70 140 48
Bihar
20 Bihar Sharif M US 250 30 120 70 175 18
21 Chhapra M US 200 14 70 70 175 14
22 Gaya M.Corp. US 400 36 91 70 180 28
23 Katihar M US 200 15 75 70 150 14
24 Munger M US 210 10 48 70 125 15
2 0 0
Sl. City/Town S/US Population Water supplied CPHEEO Norm Demand forNo. (‘000) 1999 mld lpcd norm adopted by CPHEEO
(lpcd) city (lpcd) norm
1 2 3 4 5 6 7 8
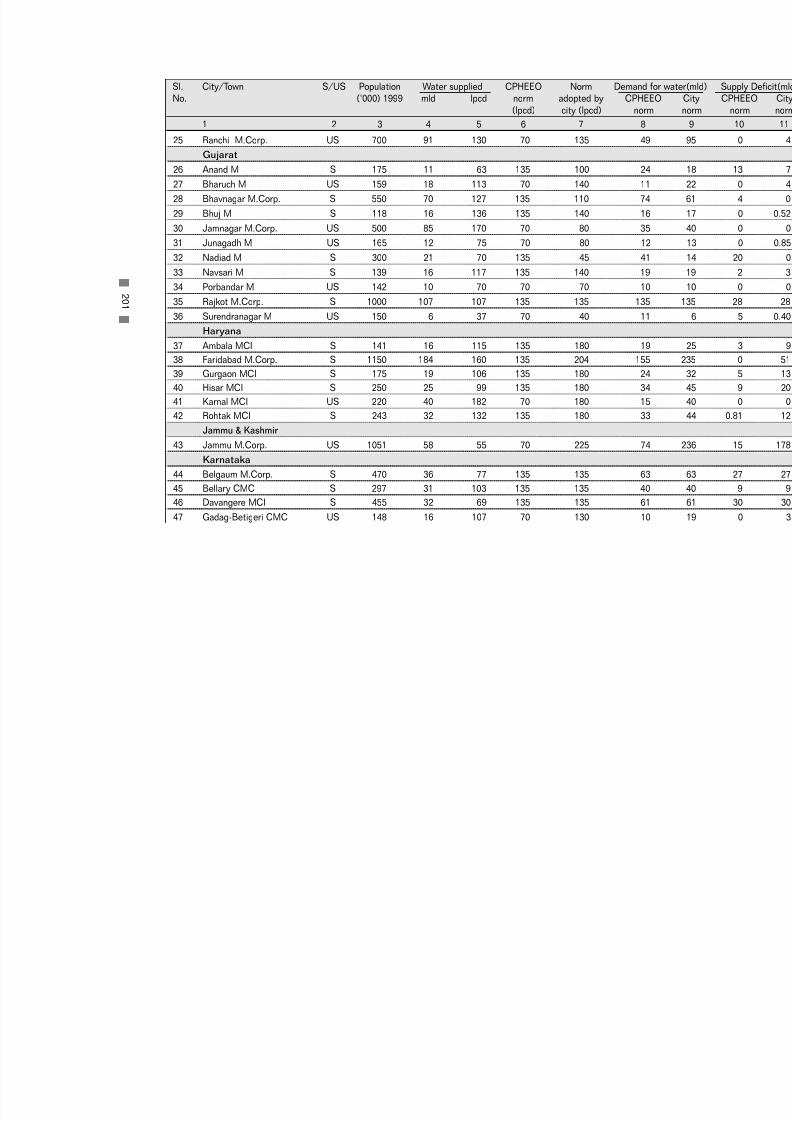
7/21/2019 Status Watersupply
http://slidepdf.com/reader/full/status-watersupply 221/869
25 Ranchi M.Corp. US 700 91 130 70 135 49
Gujarat
26 Anand M S 175 11 63 135 100 24
27 Bharuch M US 159 18 113 70 140 11
28 Bhavnagar M.Corp. S 550 70 127 135 110 74
29 Bhuj M S 118 16 136 135 140 16
30 Jamnagar M.Corp. US 500 85 170 70 80 35
31 Junagadh M US 165 12 75 70 80 12
32 Nadiad M S 300 21 70 135 45 41
33 Navsari M S 139 16 117 135 140 19
34 Porbandar M US 142 10 70 70 70 10
35 Rajkot M.Corp. S 1000 107 107 135 135 135
36 Surendranagar M US 150 6 37 70 40 11
Haryana
37 Ambala MCI S 141 16 115 135 180 19
38 Faridabad M.Corp. S 1150 184 160 135 204 155
39 Gurgaon MCI S 175 19 106 135 180 24
40 Hisar MCI S 250 25 99 135 180 34
41 Karnal MCI US 220 40 182 70 180 15
42 Rohtak MCI S 243 32 132 135 180 33
Jammu & Kashmir
43 Jammu M.Corp. US 1051 58 55 70 225 74
Karnataka
44 Belgaum M.Corp. S 470 36 77 135 135 63
45 Bellary CMC S 297 31 103 135 135 40
46 Davangere MCI S 455 32 69 135 135 61
47 Gadag-Betigeri CMC US 148 16 107 70 130 10
2 0 1
Sl. City/Town S/US Population Water supplied CPHEEO Norm Demand forNo. (‘000) 1999 mld lpcd norm adopted by CPHEEO
(lpcd) city (lpcd) norm
1 2 3 4 5 6 7 8

7/21/2019 Status Watersupply
http://slidepdf.com/reader/full/status-watersupply 222/869
48 Gulbarga M.Corp. S 450 32 70 135 135 61
49 Hubli-Dharwar M.Corp. S 850 88 103 135 135 115
50 Mandya M US 140 13 92 70 136 10
51 Mangalore M.Corp. S 410 85 207 135 135 55
52 Mysore M.Corp. S 1050 138 132 135 135 142
53 Shimoga CMC S 222 34 152 135 135 30
54 Tumkur M US 300 22 73 70 100 21
Kerala
55 Alappuzha MC US 200 15 75 70 150 14
56 Kollam MC US 160 18 113 70 150 11
57 Kozhikode M.Corp. US 493 72 146 70 150 35
58 Thalaserry M US 134 27 201 70 135 9
59 ThiruvananthapuramM.Corp. US 585 180 308 70 180 41
Madhya Pradesh
60 Bhind M S 175 19 109 135 120 24
61 Burhanpur M.Corp. US 210 19 90 70 133 15
62 Dewas M.Corp. US 200 9 45 70 135 14
63 Guna M US 125 12 97 70 135 9
64 Gwalior M.Corp. S 900 150 166 135 180 122
65 Jabalpur M.Corp. US 1000 109 109 70 140 70
66 Khandwa M US 175 16 91 70 150 1267 Morena M S 125 8 68 135 110 17
68 Murwara (Katni)M.Corp. US 180 13 71 70 140 13
69 Ratlam M.Corp. US 235 18 78 70 130 16
70 Rewa M.Corp. US 180 20 111 70 180 13
2 0 2
Sl. City/Town S/US Population Water supplied CPHEEO Norm Demand forNo. (‘000) 1999 mld lpcd norm adopted by CPHEEO
(lpcd) city (lpcd) norm
1 2 3 4 5 6 7 8

7/21/2019 Status Watersupply
http://slidepdf.com/reader/full/status-watersupply 223/869
71 Satna M.Corp. US 200 14 68 70 135 14
72 Shivpuri M S 140 13 93 135 150 19
Maharashtra
73 Amravati M.Corp. US 500 60 120 70 150 35
74 Aurangabad M.Corp. S 868 168 194 135 138 117
75 Bhusawal MCl US 200 22 110 70 110 14
76 Chandrapur MCl US 295 30 102 70 135 21
77 Dhule MCl S 330 31 94 135 100 45
78 Ichalkaranji MCl S 250 32 128 135 140 34
79 Jalgaon MCl US 400 56 140 70 140 28
80 Kolhapur M.Corp. S 502 85 169 135 150 68
81 Nanded Waghala M.Corp. S 410 39 95 135 140 5582 Nashik M.Corp. S 839 158 188 135 180 113
83 Parbhani MCl US 233 15 64 70 140 16
84 Solapur M.Corp. S 900 125 139 135 150 122
85 Wardha M US 150 12 82 70 135 11
86 Yavatmal MCl US 130 13 100 70 100 9
Orissa
87 Bhubaneswar M.Corp. S 654 150 229 135 235 88
88 Cuttack M.Corp. US 563 146 259 70 200 39
89 Puri M US 150 24 160 70 150 10
90 Rourkela M US 200 18 90 70 185 14
91 Sambalpur M US 157 19 118 70 125 11
Punjab
92 Amritsar M.Corp. S 843 127 151 135 200 114
93 Bathinda MCI S 174 17 98 135 182 23
94 Hoshiarpur MCI S 145 22 150 135 200 20
2 0 3
Sl. City/Town S/US Population Water supplied CPHEEO Norm Demand forNo. (‘000) 1999 mld lpcd norm adopted by CPHEEO
(lpcd) city (lpcd) norm
1 2 3 4 5 6 7 8

7/21/2019 Status Watersupply
http://slidepdf.com/reader/full/status-watersupply 224/869
95 Jalandhar M.Corp. S 738 175 237 135 200 100
96 Moga MCI S 148 20 135 135 200 20
97 Pathankot MCI S 195 17 87 135 180 26
98 Patiala M.Corp. S 328 60 183 135 180 44
Rajasthan
99 Ajmer MCI S 550 52 95 135 140 74
100 Alwar M US 300 32 107 70 100 21
101 Beawar M US 141 11 80 70 120 10
102 Bhilwara M US 225 14 62 70 100 16
103 Bikaner M S 600 68 113 135 175 81
104 Jodhpur M.Corp. S 1000 176 176 135 150 135
105 Kota M.Corp. US 750 160 213 70 200 53
106 Sriganganagar M US 225 22 98 70 140 16
Tamil Nadu
107 Cuddalore M US 162 4 26 70 70 11
108 Dindigul M US 214 12 56 70 100 15
109 Erode M US 174 22 127 70 110 12
110 Kanchipuram M S 157 16 104 135 91 21
111 Kumbakonam M S 147 11 72 135 100 20
112 Nagercoil M US 206 9 44 70 70 14
113 Rajapalayam M US 123 9 71 70 70 9
114 Salem M.Corp. US 447 50 112 70 110 31
115 Thanjavur M US 217 24 111 70 110 15
116 Tiruchirapalli M.Corp. S 800 88 110 135 110 108
117 Tirunelveli M.Corp. S 414 34 82 135 70 56
118 Tirunvannamalai M US 129 14 105 70 100 9
119 Tiruppur M US 295 29 97 70 110 21
120 Tuticorin M S 217 16 74 135 70 29
2 0 4
Sl. City/Town S/US Population Water supplied CPHEEO Norm Demand forNo. (‘000) 1999 mld lpcd norm adopted by CPHEEO
(lpcd) city (lpcd) norm
1 2 3 4 5 6 7 8

7/21/2019 Status Watersupply
http://slidepdf.com/reader/full/status-watersupply 225/869
121 Vellore M US 176 13 74 70 120 12
Uttar Pradesh
122 Agra M.Corp. US 1150 250 217 70 150 81
123 Aligarh M.Corp. S 600 47 78 135 97 81
124 Allahabad M.Corp. S 1015 210 207 135 250 137
125 Bareilly M.Corp. S 750 80 107 135 225 101
126 Etawah MB US 140 20 139 70 175 10
127 Faizabad MB US 170 22 127 70 130 12
128 Firozabad MB US 250 12 48 70 200 18
129 Ghaziabad M.Corp. S 887 110 124 135 200 120
130 Gorakhpur M.Corp. S 600 74 123 135 150 81
131 Haldwani-cum-Kathgodam MB US 141 19 132 70 200 10
132 Hapur MB S 200 14 70 135 200 27
133 Hardwar MB S 300 39 130 135 210 41
134 Jhansi MB US 507 77 152 70 160 35
135 Mathura MB S 400 27 67 135 200 54
136 Meerut M.Corp. S 1250 132 106 135 200 169
137 Mirzapur MB S 210 25 119 135 200 28
138 Moradabad M.Corp. US 670 48 72 70 120 47
139 Muzaffarnagar MB US 325 46 142 70 200 23
140 Rae Bareli MB US 175 13 74 70 160 12
141 Rampur MB US 317 20 62 70 200 22
142 Saharanpur MB US 540 49 91 70 225 38
143 Sitapur MB US 150 17 114 70 200 11
144 Unnao MB S 121 21 174 135 180 16
West Bengal
145 Asansol M.Corp. S 315 52 166 135 135 42
2 0 5
Sl. City/Town S/US Population Water supplied CPHEEO Norm Demand forNo. (‘000) 1999 mld lpcd norm adopted by CPHEEO
(lpcd) city (lpcd) norm
1 2 3 4 5 6 7 8

7/21/2019 Status Watersupply
http://slidepdf.com/reader/full/status-watersupply 226/869
146 Baharampur M US 143 15 104 70 100 10
147 Balurghat M US 132 0.86 7 70 100 9
148 Bankura M US 151 11 72 70 100 11
149 Barasat M US 150 12 82 70 114 11
150 Burdwan M US 323 24 73 70 100 23
151 Halisahar M US 149 20 134 70 135 10
152 Krishnagar M US 145 6 41 70 90 10
153 Midnapore M US 158 15 95 70 100 11
154 North Barrackpore M US 118 14 117 70 120 8
155 Santipur M US 134 0.91 7 70 100 9
156 Silliguri M.Corp. US 500 18 36 70 70 35
Small States
Assam
157 Guwahati M.Corp. US 995 55 55 70 150 70
158 Jorhat MB US 170 n.a. n.a. 70 n.a. 12
Manipur
159 Imphal MCI US 245 58 238 70 160 17
Meghalaya
160 Shillong MB US 217 27 123 70 157 15
Mizoram
161 Aizwal NM US 244 11 44 70 135 17
Tripura
162 Agartala MCI US 200 22 109 70 110 14Union Territories
163 Chandigarh M.Corp. S 850 227 267 135 200 115
164 Pondicherry M S 290 33 115 135 150 39
S = having sewerage system US = not having sewerage system
Source: Respective urban local governments/relevant agencies, NIUA Survey,1999.
2 0 6
Sl. City/Town S/US Population Water supplied CPHEEO Norm Demand forNo. (‘000) 1999 mld lpcd norm adopted by CPHEEO
(lpcd) city (lpcd) norm
1 2 3 4 5 6 7 8

7/21/2019 Status Watersupply
http://slidepdf.com/reader/full/status-watersupply 227/869
CLASS II
Andhra Pradesh
1 Anakapalle M US 115 4 32 70 140 8
2 Dharmavaram M US 100 8 79 70 125 7
3 Gudur MCI US 72 7 99 70 110 5
4 Kapra M US 120 5 38 70 116 8
5 Kavali MCI US 85 5 58 70 110 6
6 Madanapalle M US 100 8 77 70 114 7
7 Narasaraopet M US 95 5 47 70 100 7
8 Rajendra nagar MCI US 120 5 42 70 36 8
9 Sangareddy MCI US 60 4 64 70 100 4
10 Srikakulam MCI US 100 7 68 70 100 711 Srikalahasti M US 70 7 97 70 110 5
12 Suryapet MCI US 89 8 85 70 140 6
Bihar
13 Buxar M US 67 4 58 70 125 5
14 Deoghar M US 100 3 30 70 150 7
15 Hajipur M US 115 11 96 70 150 8
16 Hazaribagh M US 119 7 61 70 270 8
17 Jehanabad M US 57 8 140 70 175 4
18 Madhubani M US 65 8 123 70 175 5
19 Mokama M US 66 2 30 70 70 5
Gujarat
20 Amreli M US 85 10 118 70 90 6
21 Ankleswar M S 60 10 167 135 190 8
22 Dabhoi M S 65 9 138 135 70 9
23 Dohad M US 78 7 96 70 65 5
2 0 7
Sl. City/Town S/US Population Water supplied CPHEEO Norm Demand forNo. (‘000) 1999 mld lpcd norm adopted by CPHEEO
(lpcd) city (lpcd) norm
1 2 3 4 5 6 7 8

7/21/2019 Status Watersupply
http://slidepdf.com/reader/full/status-watersupply 228/869
24 Gondal M US 100 13 130 70 45 7
25 Jetpur M US 125 11 91 70 100 9
26 Mahesana M S 138 15 107 135 107 19
27 Palanpur M US 117 4 34 70 140 8
Haryana
28 Jind MCI S 114 16 138 135 180 15
29 Kaithal MCI S 95 11 114 135 180 13
30 Rewari MCI S 105 11 108 135 135 14
31 Thanesar MCI S 100 13 132 135 182 14
Karnataka
32 Bagalkot CMC US 100 12 122 70 135 7
33 Chikmaglur CMC S 100 15 150 135 135 1434 Gokak CMC US 68 5 67 70 70 5
35 Hospet CMC US 114 16 140 70 70 8
36 Kolar CMC S 112 8 71 135 80 15
37 Rabkavi-Banhatti CMC US 72 5 63 70 150 5
38 Ramanagaram CMC US 70 5 64 70 80 5
Kerala
39 Changanessary MC US 62 4 65 70 70 4
40 Payyanur M US 71 1.5 21 70 60 5
41 Taliparamba M US 52 0.39 7 70 40 4
42 Thrissur MC US 91 18 198 70 170 6
Madhya Pradesh
43 Hoshangabad M US 100 8 81 70 80 7
44 Itarsi M US 105 6 56 70 80 7
45 Khargone M US 80 13 163 70 200 6
46 Mandsaur M US 123 9 73 70 125 9
2 0 8
Sl. City/Town S/US Population Water supplied CPHEEO Norm Demand forNo. (‘000) 1999 mld lpcd norm adopted by CPHEEO
(lpcd) city (lpcd) norm
1 2 3 4 5 6 7 8

7/21/2019 Status Watersupply
http://slidepdf.com/reader/full/status-watersupply 229/869
47 Nagda M US 100 3 30 70 35 7
48 Neemuch M US 100 6 59 70 100 7
49 Sehore M US 100 5 53 70 100 7
50 Shahdol M US 75 5 62 70 100 5
51 Vidisha M US 125 9 72 70 120 9
Maharashtra
52 Amalner MCl US 100 15 150 70 90 7
53 Ballarpur MCl US 109 7 64 70 80 8
54 Bhandara M US 76 9 118 70 135 5
55 Kamptee MCl US 95 4 38 70 35 7
56 Manmad MCl US 87 7 83 70 100 6
57 Ratnagiri MCl US 70 8 114 70 140 558 Satara MCl US 100 11 110 70 120 7
59 Virar MCl US 100 9 90 70 100 7
Orissa
60 Balangir M US 83 7 87 70 135 6
61 Bhadrak M US 93 3 32 70 125 7
Punjab
62 Firozpur MCI S 93 20 210 135 170 13
63 Kapurthala M S 85 14 165 135 140 11
64 Mansa MCI S 67 8 119 135 180 9
65 Phagwara MCI S 108 15 136 135 160 15
66 Sangrur MCI S 70 13 181 135 200 9
Rajasthan
67 Banswara M US 110 10 89 70 80 8
68 Barmer M US 84 7 77 70 100 6
69 Bundi M US 80 8 100 70 100 6
2 0 9
Sl. City/Town S/US Population Water supplied CPHEEO Norm Demand forNo. (‘000) 1999 mld lpcd norm adopted by CPHEEO
(lpcd) city (lpcd) norm
1 2 3 4 5 6 7 8

7/21/2019 Status Watersupply
http://slidepdf.com/reader/full/status-watersupply 230/869
70 Churu M US 100 8 77 70 125 7
71 Hanumangarh M US 125 7 58 70 150 9
72 Sawai Madhopur M US 89 8 87 70 100 6
Tamil Nadu
73 Ambur M US 86 6 65 70 70 6
74 Arakkonam M US 88 4 45 70 70 6
75 Attur M US 64 3 47 70 70 4
76 Cumbum M US 54 3 50 70 70 4
77 Dharmapuri M US 67 3 45 70 110 5
78 Guduivattam M US 95 6 61 70 70 7
79 Nagapattinam M S 112 8 70 135 100 15
80 Pudukkottai M US 108 8 73 70 100 881 Sivakasi M US 70 5 74 70 70 5
82 Srivilliputtur M US 74 4 47 70 70 5
83 Tindivanam MC US 70 2 27 70 70 5
84 Udhagamandalam M S 100 4 40 135 70 14
Uttar Pradesh
85 Auraiya MB US 90 5 50 70 75 6
86 Balrampur MB US 70 3 40 70 175 5
87 Basti MB US 110 10 91 70 150 8
88 Bhadohi MB US 125 4 32 70 200 9
89 Chandpur MB US 80 3 41 70 150 6
90 Etah MB S 135 4 30 135 150 18
91 Ghazipur MB US 96 16 167 70 200 7
92 Gonda MB US 114 9 79 70 150 8
93 Lakhimpur MB US 100 13 125 70 180 7
94 Lalitpur MB US 100 9 85 70 150 7
2 1 0
Sl. City/Town S/US Population Water supplied CPHEEO Norm Demand forNo. (‘000) 1999 mld lpcd norm adopted by CPHEEO
(lpcd) city (lpcd) norm
1 2 3 4 5 6 7 8

7/21/2019 Status Watersupply
http://slidepdf.com/reader/full/status-watersupply 231/869

7/21/2019 Status Watersupply
http://slidepdf.com/reader/full/status-watersupply 232/869
Goa
112 Panaji MCI S 57 12 206 135 142 8
Union Territories
113 Daman MCI US 35 8 229 70 60 2
114 Kavarathi NMCT US 11 0.04 3 70 55 0.78
115 Silvassa US 20 1.4 71 70 60 1.4
S = having sewerage system US = not having sewerage system
Source: Respective urban local governments/relevant agencies, NIUA Survey, 1999
Sl. City/Town S/US Population Water supplied CPHEEO Norm Demand foNo. (‘000) 1999 mld lpcd norm adopted by CPHEEO
(lpcd) city (lpcd) norm
1 2 3 4 5 6 7 8
2 1 2

7/21/2019 Status Watersupply
http://slidepdf.com/reader/full/status-watersupply 233/869
A -4
U
NA C C O U NT E DF OR WA T E R A ND
NE T
Q
UA NT I T Y OF WA T E R S UP P L I E D ,1 9 9 9

7/21/2019 Status Watersupply
http://slidepdf.com/reader/full/status-watersupply 234/869
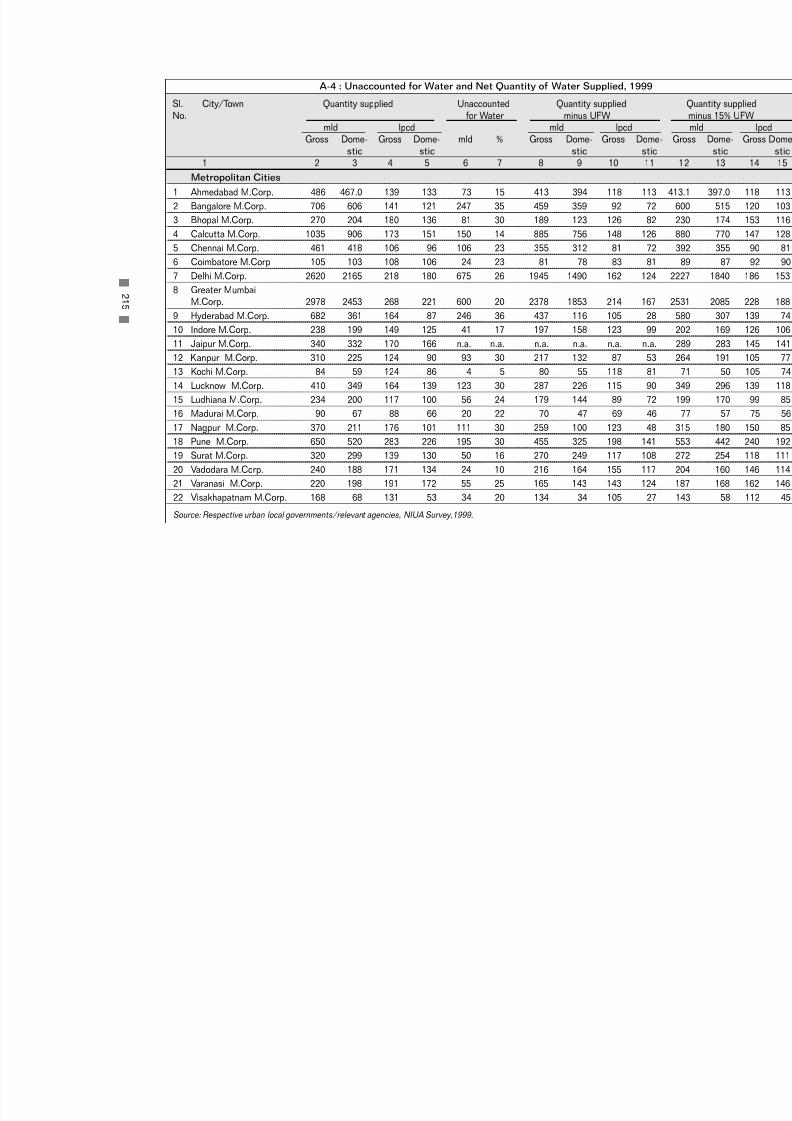
7/21/2019 Status Watersupply
http://slidepdf.com/reader/full/status-watersupply 235/869

7/21/2019 Status Watersupply
http://slidepdf.com/reader/full/status-watersupply 236/869
CLASS I
Andhra Pradesh
1 Anantapur MCI 14 11 56 45 0.50 4 14 11 54 43
2 Chittoor M 16 16 106 104 4 23 12 12 82 80
3 Cuddapah MCI 17 15 101 87 3 20 13 11 81 67
4 Eluru M 24 23 96 95 2 10 21 21 87 86
5 Guntur MCI 75 66 135 118 19 26 55 46 100 83
6 Hindupur M 10 9.6 71 69 0.10 1 9.9 9.5 71 68
7 Kakinada M 21 21 66 63 0.64 3 21 20 64 61
8 Kurnool MCI 6.5 4.5 23 16 0.50 8 6.0 4.0 21 14
9 Machilipatnam M 21 11 103 55 0.87 4 20 10 98 51
10 Nandyal MCI 10 6.5 67 43 0.40 4 9.6 6.1 64 41
11 Nellore MCI 43 33 107 81 2 4 41 31 103 77
12 Nizamabad M 15 11 53 40 5 30 11 6.9 37 24
13 Ongole MCI 16 13 90 74 0.90 6 15 12 85 69
14 Qutubullapur M 30 13 118 50 6 20 24 6.6 94 26
15 Rajahmundry M.Corp. 33 32 86 84 3 10 29 29 77 76
16 Tenali M 0.68 0.65 4 4 0.03 5 0.7 0.6 4 4
17 Tirupati MCI 29 23 136 111 5 18 23 18 112 87
18 Vijaywada M.Corp. 146 143 174 170 29 20 117 113 139 136
19 Warangal M.Corp. 68 55 100 81 5 7 64 51 94 74
Bihar
20 Bihar Sharif M 30 n.a. 120 n.a. 7 23 23 n.a. 92 n.a.
21 Chhapra M 14 n.a. 70 n.a. 2 14 12 n.a. 60 n.a.
22 Gaya M.Corp. 36 n.a. 91 n.a. 7 19 29 n.a. 74 n.a.
2 1 6
Sl. City/Town Quantity supplied Unaccounted Quantity supplied No. for Water minus UFW
mld lpcd mld lpcdGross Dome- Gross Dome- mld % Gross Dome- Gross Dome
stic stic stic stic
1 2 3 4 5 6 7 8 9 10 11

7/21/2019 Status Watersupply
http://slidepdf.com/reader/full/status-watersupply 237/869
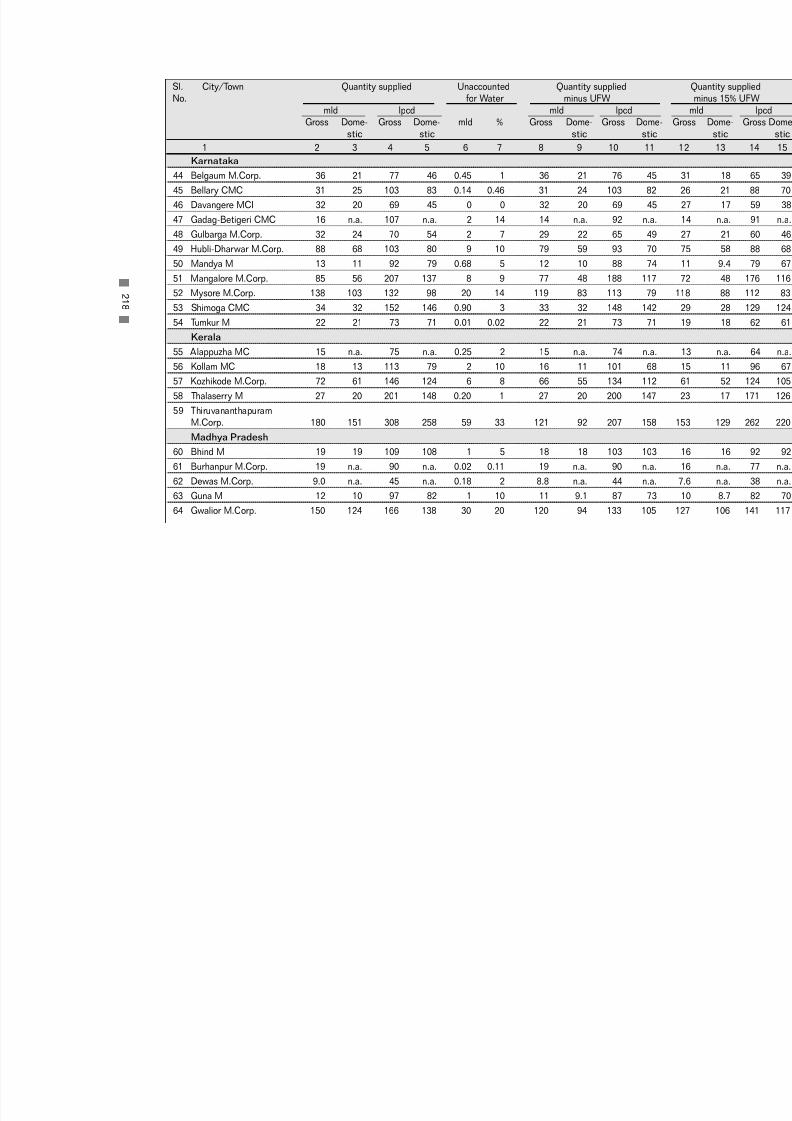
7/21/2019 Status Watersupply
http://slidepdf.com/reader/full/status-watersupply 238/869
Karnataka
44 Belgaum M.Corp. 36 21 77 46 0.45 1 36 21 76 45
45 Bellary CMC 31 25 103 83 0.14 0.46 31 24 103 82
46 Davangere MCI 32 20 69 45 0 0 32 20 69 45
47 Gadag-Betigeri CMC 16 n.a. 107 n.a. 2 14 14 n.a. 92 n.a.
48 Gulbarga M.Corp. 32 24 70 54 2 7 29 22 65 49
49 Hubli-Dharwar M.Corp. 88 68 103 80 9 10 79 59 93 70
50 Mandya M 13 11 92 79 0.68 5 12 10 88 74
51 Mangalore M.Corp. 85 56 207 137 8 9 77 48 188 117
52 Mysore M.Corp. 138 103 132 98 20 14 119 83 113 79
53 Shimoga CMC 34 32 152 146 0.90 3 33 32 148 142
54 Tumkur M 22 21 73 71 0.01 0.02 22 21 73 71
Kerala
55 Alappuzha MC 15 n.a. 75 n.a. 0.25 2 15 n.a. 74 n.a.
56 Kollam MC 18 13 113 79 2 10 16 11 101 68
57 Kozhikode M.Corp. 72 61 146 124 6 8 66 55 134 112
58 Thalaserry M 27 20 201 148 0.20 1 27 20 200 147
59 ThiruvananthapuramM.Corp. 180 151 308 258 59 33 121 92 207 158
Madhya Pradesh
60 Bhind M 19 19 109 108 1 5 18 18 103 10361 Burhanpur M.Corp. 19 n.a. 90 n.a. 0.02 0.11 19 n.a. 90 n.a.
62 Dewas M.Corp. 9.0 n.a. 45 n.a. 0.18 2 8.8 n.a. 44 n.a.
63 Guna M 12 10 97 82 1 10 11 9.1 87 73
64 Gwalior M.Corp. 150 124 166 138 30 20 120 94 133 105
2 1 8
Sl. City/Town Quantity supplied Unaccounted Quantity supplied No. for Water minus UFW
mld lpcd mld lpcdGross Dome- Gross Dome- mld % Gross Dome- Gross Dome
stic stic stic stic
1 2 3 4 5 6 7 8 9 10 11

7/21/2019 Status Watersupply
http://slidepdf.com/reader/full/status-watersupply 239/869
65 Jabalpur M.Corp. 109 75 109 75 9 8 99 66 99 66
66 Khandwa M 16 n.a. 91 n.a. 0.03 0.16 16 n.a. 91 n.a.
67 Morena M 8.5 7.4 68 59 0.50 6 8.0 6.9 64 55
68 Murwara (Katni) M.Corp. 13 8.0 71 44 2 16 11 6.0 60 33
69 Ratlam M.Corp. 18 18 78 76 0.18 1 18 18 77 75
70 Rewa M.Corp. 20 n.a. 111 n.a. 5 23 16 n.a. 86 n.a.
71 Satna M.Corp. 14 9.0 68 45 2 11 12 7.5 60 38
72 Shivpuri M 13 11 93 80 1 10 12 10.0 84 71
Maharashtra
73 Amravati M.Corp. 60 45 120 90 22 37 38 23 76 46
74 Aurangabad M.Corp. 168 130 194 150 20 12 148 110 171 127
75 Bhusawal MCl 22 n.a. 110 n.a. 2 9 20 n.a. 100 n.a.
76 Chandrapur MCl 30 29 102 100 4 13 26 25 88 86
77 Dhule MCl 31 29 94 89 1 3 30 28 91 86
78 Ichalkaranji MCl 32 26 128 105 5 14 28 22 110 87
79 Jalgaon MCl 56 n.a. 140 n.a. n.a. n.a. n.a. n.a. n.a. n.a.
80 Kolhapur M.Corp. 85 70 169 139 34 40 51 36 102 72
81 Nanded Waghala M.Corp. 39 35 95 85 4 10 35 31 85 75
82 Nashik M.Corp. 158 136 188 162 14 9 144 122 172 145
83 Parbhani MCl 15 15 64 64 2 10 14 13 58 58
84 Solapur M.Corp. 125 111 139 123 10 8 115 101 128 112
85 Wardha M 12 12 82 82 1 10 11 11 74 74
86 Yavatmal MCl 13 11 100 86 1 11 12 9.6 89 74
Orissa
87 Bhubaneswar M.Corp. 150 97 229 148 30 20 120 67 184 102
2 1 9
Sl. City/Town Quantity supplied Unaccounted Quantity supplied No. for Water minus UFW
mld lpcd mld lpcdGross Dome- Gross Dome- mld % Gross Dome- Gross Dome
stic stic stic stic
1 2 3 4 5 6 7 8 9 10 11

7/21/2019 Status Watersupply
http://slidepdf.com/reader/full/status-watersupply 240/869
88 Cuttack M.Corp. 146 126 259 223 44 30 102 82 181 145
89 Puri M 24 16 160 109 4 15 20 13 136 85
90 Rourkela M 18 18 90 88 2 12 16 16 80 78
91 Sambalpur M 19 15 118 94 2 11 17 13 105 82
Punjab
92 Amritsar M.Corp. 127 89 151 105 59 32 68 30 81 35
93 Bathinda MCI 17 13 98 74 0.30 2 17 13 96 72
94 Hoshiarpur MCI 22 n.a. 150 n.a. 3 15 18 n.a. 127 n.a.
95 Jalandhar M.Corp. 175 157 237 213 43 25 131 114 178 154
96 Moga MCI 20 18 135 122 0.83 4 19 17 130 116
97 Pathankot MCI 17 14 87 70 2 12 15 12 77 60
98 Patiala M.Corp. 60 55 183 167 11 18 49 44 149 134
Rajasthan
99 Ajmer MCI 52 n.a. 95 n.a. 5 10 47 n.a. 85 n.a.
100 Alwar M 32 27 107 88 2 6 30 25 100 82
101 Beawar M 11 10 80 71 n.a. n.a. n.a. n.a. n.a. n.a.
102 Bhilwara M 14 n.a. 62 n.a. 0.76 5 13 n.a. 59 n.a.
103 Bikaner M 68 46 113 77 18 26 51 28 84 47
104 Jodhpur M.Corp. 176 n.a. 176 n.a. 40 23 136 n.a. 136 n.a.
105 Kota M.Corp. 160 120 213 160 n.a. n.a. n.a. n.a. n.a. n.a.
106 Sriganganagar M 22 20 98 88 1 5 21 19 93 83
Tamil Nadu
107 Cuddalore M 4.3 4.0 26 25 0 0 4.3 4.0 26 25
108 Dindigul M 12 11 56 51 0 0 12 11 56 51
109 Erode M 22 17 127 96 2 7 21 15 118 87
2 2 0
Sl. City/Town Quantity supplied Unaccounted Quantity supplied No. for Water minus UFW
mld lpcd mld lpcdGross Dome- Gross Dome- mld % Gross Dome- Gross Dome
stic stic stic stic
1 2 3 4 5 6 7 8 9 10 11

7/21/2019 Status Watersupply
http://slidepdf.com/reader/full/status-watersupply 241/869

7/21/2019 Status Watersupply
http://slidepdf.com/reader/full/status-watersupply 242/869
133 Hardwar MB 39 33 130 109 8 20 31 25 104 83
134 Jhansi MB 77 76 152 150 22 29 55 54 109 106
135 Mathura MB 27 n.a. 67 n.a. 5 20 21 n.a. 53 n.a.
136 Meerut M.Corp. 132 n.a. 106 n.a. 53 40 79 n.a. 63 n.a.
137 Mirzapur MB 25 24 119 117 6 25 19 18 89 87
138 Moradabad M.Corp. 48 n.a. 72 n.a. 4 8 44 n.a. 66 n.a.
139 Muzaffarnagar MB 46 36 142 111 9 20 37 27 113 82
140 Rae Bareli MB 13 11 74 62 4 30 9.1 6.9 52 39
141 Rampur MB 20 n.a. 62 n.a. 0.98 5 19 n.a. 59 n.a.
142 Saharanpur MB 49 36 91 68 7 15 42 29 77 54
143 Sitapur MB 17 n.a. 114 n.a. 2 11 15 n.a. 102 n.a.
144 Unnao MB 21 21 174 174 3 15 18 18 148 148
West Bengal
145 Asansol M.Corp. 52 50 166 160 10 20 42 40 133 127
146 Baharampur M 15 15 104 104 4 25 11 11 78 78
147 Balurghat M 0.86 0.86 7 7 0.29 33 0.6 0.6 4 4
148 Bankura M 11 5.6 72 37 2 18 8.9 3.6 59 24
149 Barasat M 12 12 82 81 1 10 11 11 74 73
150 Burdwan M 24 21 73 66 6 25 18 15 55 48
151 Halisahar M 20 16 134 107 0.50 3 20 16 131 104
152 Krishnagar M 6.0 6.0 41 41 1 23 4.6 4.6 32 32
153 Midnapore M 15 11 95 69 2 16 13 8.4 80 53
154 North Barrackpore M 13 13 113 106 0.50 4 13 12 109 101
155 Santipur M 0.91 0.91 7 7 0.22 24 0.7 0.7 5 5
156 Silliguri M.Corp. 18 18 36 36 n.a. n.a. n.a. n.a. n.a. n.a.
2 2 2
Sl. City/Town Quantity supplied Unaccounted Quantity supplied No. for Water minus UFW
mld lpcd mld lpcdGross Dome- Gross Dome- mld % Gross Dome- Gross Dome
stic stic stic stic
1 2 3 4 5 6 7 8 9 10 11

7/21/2019 Status Watersupply
http://slidepdf.com/reader/full/status-watersupply 243/869

7/21/2019 Status Watersupply
http://slidepdf.com/reader/full/status-watersupply 244/869
CLASS II
Andhra Pradesh
1 Anakapalle M 3.6 2.4 32 21 0.50 14 3.1 1.9 27 17
2 Dharmavaram M 7.9 6.7 79 67 0.40 5 7.5 6.3 75 63
3 Gudur MCI 7.1 6.6 99 92 0.18 3 6.9 6.5 96 90
4 Kapra M 4.6 4.6 38 38 0.91 20 3.6 3.6 30 30
5 Kavali MCI 5.0 5.0 58 58 0 0 5.0 5.0 58 58
6 Madanapalle M 7.7 7.5 77 75 n.a. n.a. n.a. n.a. n.a. n.a.
7 Narasaraopet M 4.5 n.a. 47 n.a. 0.45 10 4.1 n.a. 43 n.a.
8 Rajendra nagar MCI 5.1 3.3 42 28 0.51 10 4.6 2.8 38 23
9 Sangareddy MCI 3.9 3.5 64 58 0.30 8 3.6 3.2 59 53
10 Srikakulam MCI 6.8 6.6 68 66 0.30 4 6.5 6.3 65 63
11 Srikalahasti M 6.8 6.6 97 94 0.23 3 6.6 6.4 94 91
12 Suryapet MCI 7.6 5.5 85 62 0.50 7 7.1 5.0 79 57
Bihar
13 Buxar M 3.9 3.9 58 58 0 0 3.9 3.9 58 58
14 Deoghar M 3.0 n.a. 30 n.a. 0.50 17 2.5 n.a. 25 n.a.
15 Hajipur M 11 n.a. 96 n.a. 1 10 9.9 n.a. 86 n.a.
16 Hazaribagh M 7.3 n.a. 61 n.a. 0.11 2 7.2 n.a. 60 n.a.
17 Jehanabad M 8.0 n.a. 140 n.a. 2 25 6.0 n.a. 105 n.a.
18 Madhubani M 8.0 n.a. 123 n.a. 2 25 6.0 n.a. 92 n.a.
19 Mokama M 2.0 n.a. 30 n.a. n.a. n.a. n.a. n.a. n.a. n.a.
Gujarat
20 Amreli M 10 n.a. 118 n.a. 1 10 9.0 n.a. 106 n.a.
21 Ankleswar M 10 n.a. 167 n.a. 1 10 9.0 n.a. 150 n.a.
2 2 4
Sl. City/Town Quantity supplied Unaccounted Quantity supplied No. for Water minus UFW
mld lpcd mld lpcdGross Dome- Gross Dome- mld % Gross Dome- Gross Dome
stic stic stic stic
1 2 3 4 5 6 7 8 9 10 11

7/21/2019 Status Watersupply
http://slidepdf.com/reader/full/status-watersupply 245/869
22 Dabhoi M 9.0 n.a. 138 n.a. 1 11 8.0 n.a. 123 n.a.
23 Dohad M 7.5 6.8 96 87 0.45 6 7.0 6.4 90 82
24 Gondal M 13 11 130 111 0.20 2 13 11 128 109
25 Jetpur M 11 n.a. 91 n.a. 0.50 4 11 n.a. 87 n.a.
26 Mahesana M 15 n.a. 107 n.a. 0 0 15 n.a. 107 n.a.
27 Palanpur M 4.0 n.a. 34 n.a. n.a. n.a. n.a. n.a. n.a. n.a.
Haryana
28 Jind MCI 16 15 138 130 0.50 3 15 14 134 126
29 Kaithal MCI 11 10 114 106 2 19 8.8 8.0 93 85
30 Rewari MCI 11 11 108 108 2 18 9.3 9.3 89 89
31 Thanesar MCI 13 12 132 123 2 15 11 10 112 103
Karnataka
32 Bagalkot CMC 12 11 122 109 0 0 12 11 122 109
33 Chikmaglur CMC 15 13 150 125 0 0 15 13 150 125
34 Gokak CMC 4.6 3.9 67 57 0.02 0.44 4.5 3.8 67 57
35 Hospet CMC 16 12 140 108 0.48 3 16 12 136 104
36 Kolar CMC 8.0 6.9 71 62 0.80 10 7.2 6.1 64 54
37 Rabkavi-Banhatti CMC 4.5 3.2 63 44 n.a. n.a. n.a. n.a. n.a. n.a.
38 Ramanagaram CMC 4.5 n.a. 64 n.a. 0.67 15 3.8 n.a. 55 n.a.
Kerala
39 Changanessary MC 4.0 2.6 65 42 0.32 8 3.7 2.3 59 37
40 Payyanur M 1.5 1.5 21 21 0.15 10 1.3 1.3 19 19
41 Taliparamba M 0.38 n.a. 7 n.a. 0.06 15 0 n.a. 6 n.a.
42 Thrissur MC 18 12 198 131 0.18 1 18 12 196 129
Madhya Pradesh
43 Hoshangabad M 8.1 4.6 81 46 2 20 6.5 3.0 65 30
2 2 5
Sl. City/Town Quantity supplied Unaccounted Quantity supplied No. for Water minus UFW
mld lpcd mld lpcdGross Dome- Gross Dome- mld % Gross Dome- Gross Dome
stic stic stic stic
1 2 3 4 5 6 7 8 9 10 11

7/21/2019 Status Watersupply
http://slidepdf.com/reader/full/status-watersupply 246/869

7/21/2019 Status Watersupply
http://slidepdf.com/reader/full/status-watersupply 247/869
66 Sangrur MCI 13 12 181 175 2 12 11 11 160 154
Rajasthan
67 Banswara M 9.8 n.a. 89 n.a. 2 18 8.0 n.a. 73 n.a.
68 Barmer M 6.5 6.5 77 77 n.a. n.a. n.a. n.a. n.a. n.a.
69 Bundi M 8.0 5.8 100 73 0.80 10 7.2 5.0 90 63
70 Churu M 7.7 5.4 77 54 1 16 6.5 4.1 64 41
71 Hanumangarh M 7.2 5.9 58 48 0.12 2 7.1 5.8 57 47
72 Sawai Madhopur M 7.8 6.7 87 76 0.20 3 7.6 6.5 85 73
Tamil Nadu
73 Ambur M 5.6 n.a. 65 n.a. 0.51 9 5.1 n.a. 59 n.a.
74 Arakkonam M 4.0 n.a. 45 n.a. 0 0 4.0 n.a. 45 n.a.
75 Attur M 3.0 2.4 47 38 0.28 9 2.7 2.1 42 34
76 Cumbum M 2.7 2.6 50 49 0.10 4 2.6 2.5 49 47
77 Dharmapuri M 3.0 2.9 45 43 0.15 5 2.9 2.7 43 41
78 Guduivattam M 5.8 n.a. 61 n.a. 0 0 5.8 n.a. 61 n.a.
79 Nagapattinam M 7.8 6.4 70 57 0 0 7.8 6.4 70 57
80 Pudukkottai M 7.9 7.6 73 70 0.10 1 7.8 7.5 72 69
81 Sivakasi M 5.2 n.a. 74 n.a. 0.10 2 5.1 n.a. 73 n.a.
82 Srivilliputtur M 3.5 3.4 47 46 0.10 3 3.4 3.3 46 45
83 Tindivanam MC 1.9 1.7 27 24 0 0 1.9 1.7 27 24
84 Udhagamandalam M 4.0 n.a. 40 n.a. 0 0 4.0 n.a. 40 n.a.
Uttar Pradesh
85 Auraiya MB 4.5 4.3 50 48 1 22 3.5 3.3 39 37
86 Balrampur MB 2.8 n.a. 40 n.a. 0.13 5 2.7 n.a. 38 n.a.
87 Basti MB 10 n.a. 91 n.a. 2 20 8.0 n.a. 73 n.a.
2 2 7
Sl. City/Town Quantity supplied Unaccounted Quantity supplied No. for Water minus UFW
mld lpcd mld lpcdGross Dome- Gross Dome- mld % Gross Dome- Gross Dome
stic stic stic stic
1 2 3 4 5 6 7 8 9 10 11

7/21/2019 Status Watersupply
http://slidepdf.com/reader/full/status-watersupply 248/869
88 Bhadohi MB 4.0 4.0 32 32 0.50 13 3.5 3.5 28 28
89 Chandpur MB 3.2 3.1 41 38 0.29 9 3.0 2.8 37 35
90 Etah MB 4.0 4.0 30 30 2 50 2.0 2.0 15 15
91 Ghazipur MB 16 14 167 142 2 14 14 11 145 120
92 Gonda MB 9.0 n.a. 79 n.a. 3 28 6.5 n.a. 57 n.a.
93 Lakhimpur MB 13 n.a. 125 n.a. 0.50 4 12 n.a. 120 n.a.
94 Lalitpur MB 8.5 8.4 85 84 2 18 7.0 6.9 70 69
95 Mughalsarai MB 4.0 3.7 25 23 0.60 15 3.4 3.1 21 19
96 Nawabganj-Barabanki MB 9.1 n.a. 101 n.a. 0.91 10 8.2 n.a. 91 n.a.
97 Orai MB 8.2 8.0 48 47 2 28 6.0 5.7 35 34
98 Roorkee MB 19 n.a. 188 n.a. 5 26 14 n.a. 140 n.a.
West Bengal
99 Bishnupur M 2.6 2.5 39 38 0.80 30 1.8 1.7 27 26
100 Chakdaha M 1.9 1.9 21 21 0.25 13 1.7 1.7 18 18
101 Contai M 1.6 1.6 14 14 0.73 46 0.8 0.8 7 7
102 Cooch Behar M 9.9 7.2 99 73 0.04 0.41 9.8 7.2 99 72
103 Darjeeling M 6.0 3.9 65 42 2 31 4.2 2.1 45 22
104 Jalpaiguri M 4.9 3.9 49 39 1 30 3.5 2.5 34 24
105 Jangipur M 3.0 2.6 38 33 0.75 25 2.3 1.9 29 24
106 Katwa M 1.5 1.5 22 22 0.37 25 1.1 1.1 17 17107 Raniganj M 5.1 3.6 42 30 2 30 3.6 2.1 30 17
Small States
Himachal Pradesh
109 Shimla M.Corp. 28 20 252 177 3 11 25 17 225 150
2 2 8
Sl. City/Town Quantity supplied Unaccounted Quantity supplied No. for Water minus UFW
mld lpcd mld lpcdGross Dome- Gross Dome- mld % Gross Dome- Gross Dome
stic stic stic stic
1 2 3 4 5 6 7 8 9 10 11

7/21/2019 Status Watersupply
http://slidepdf.com/reader/full/status-watersupply 249/869
Nagaland
108 Kohima TC 2.9 2.0 28 19 0.58 20 2.3 1.4 23 14
Union Teritories
110 Port Balir MCI 15 14 140 132 0.70 5 14 13 134 125
Others (Smaller than Class II towns)
Small States
Arunachal Pradesh
111 Itanagar CT 5.5 4.8 164 143 1 25 4.1 3.4 123 102
Goa
112 Panaji MCI 12 5.4 206 94 1 8 11 4.4 189 76
Union Territories
113 Daman MCI 8.0 n.a. 229 n.a. 0.40 5 7.6 n.a. 217 n.a.
114 Kavarathi NMCT 0.04 0.04 3 3 0 3 0.04 0.04 3 3
115 Silvassa 1.4 1.3 71 65 n.a. n.a. n.a. n.a. n.a. n.a.
Source: Respective urban local governments/relevant agencies, NIUA Survey,1999.
2 2 9
Sl. City/Town Quantity supplied Unaccounted Quantity supplied No. for Water minus UFW
mld lpcd mld lpcdGross Dome- Gross Dome- mld % Gross Dome- Gross Dome
stic stic stic stic
1 2 3 4 5 6 7 8 9 10 11

7/21/2019 Status Watersupply
http://slidepdf.com/reader/full/status-watersupply 250/869

7/21/2019 Status Watersupply
http://slidepdf.com/reader/full/status-watersupply 251/869
A - 5
WA T E R S UP P L Y
C O N NE C T I O N S
-
ME T E R E DA ND U N ME T E R E D
A ND N U MB E R O
F S T A NDP O S T S ,
1 9 9 9

7/21/2019 Status Watersupply
http://slidepdf.com/reader/full/status-watersupply 252/869

7/21/2019 Status Watersupply
http://slidepdf.com/reader/full/status-watersupply 253/869

7/21/2019 Status Watersupply
http://slidepdf.com/reader/full/status-watersupply 254/869
CLASS I
Andhra Pradesh
1 Anantapur MCI 12166 222 12388 0 222 0
2 Chittoor M 4232 62 4294 0 62 0
3 Cuddapah MCI 8234 0 8234 0 0 0
4 Eluru M 9700 212 9912 0 212 0
5 Guntur MCI 26770 1046 27816 0 1046 0
6 Hindupur M 3857 160 4017 0 160 0
7 Kakinada M 10940 430 11370 0 430 0
8 Kurnool MCI 13658 75 13733 8 75 0.06
9 Machilipatnam M 8980 527 9507 250 527 3
10 Nandyal MCI 6482 162 6644 0 162 0
11 Nellore MCI 15102 411 15513 111 202 1
12 Nizamabad M 10844 147 10991 0 0 0
13 Ongole MCI 10606 1 10607 306 1 3
14 Qutubullapur M 8300 26 8326 300 26 4
15 Rajahmundry M.Corp. 16800 400 17200 0 400 0
16 Tenali M 299 0 299 0 0 0
17 Tirupati MCI 1898 70 1968 0 70 0
18 Vijaywada M.Corp. 34200 2916 37116 0 2800 0
19 Warangal M.Corp. 32000 419 32419 0 419 0
Bihar
20 Bihar Sharif M n.a. n.a. n.a. n.a. n.a. n.a.21 Chhapra M n.a. n.a. n.a. n.a. n.a. n.a.
22 Gaya M.Corp. n.a. n.a. n.a. n.a. n.a. n.a.
23 Katihar M n.a. n.a. n.a. n.a. n.a. n.a.
24 Munger M n.a. n.a. n.a. n.a. n.a. n.a.
2 3 4
Sl. City/Town No. of water supply connections No. of connections metered %ConNo. Domestic Non- Total Domestic Non- Domestic
domestic domestic
1 2 3 4 5 6 8

7/21/2019 Status Watersupply
http://slidepdf.com/reader/full/status-watersupply 255/869

7/21/2019 Status Watersupply
http://slidepdf.com/reader/full/status-watersupply 256/869
48 Gulbarga M.Corp. 9253 83 9336 0 0 0
49 Hubli-Dharwar M.Corp. 53888 2845 56733 53698 2845 100
50 Mandya M 7730 309 8039 0 0 0
51 Mangalore M.Corp. 31222 3178 34400 30976 3178 99
52 Mysore M.Corp. n.a. 1102 n.a. n.a. 1102 n.a.
53 Shimoga CMC 19000 700 19700 11000 700 58
54 Tumkur M 14947 430 15377 0 0 0
Kerala
55 Alappuzha MC 19516 1080 20596 19516 1080 100
56 Kollam MC n.a. n.a. n.a. n.a. n.a. n.a.
57 Kozhikode M.Corp. 17762 7376 25138 17762 7376 100
58 Thalaserry M 4762 691 5453 4762 691 10059 Thiruvananthapuram
M.Corp. 107000 12000 119000 107000 12000 100
Madhya Pradesh
60 Bhind M 14570 20 14590 0 0 0
61 Burhanpur M.Corp. 13246 400 13646 0 0 0
62 Dewas M.Corp. 12436 36 12472 0 0 0
63 Guna M 8067 115 8182 0 115 0
64 Gwalior M.Corp. 70231 1632 71863 0 0 0
65 Jabalpur M.Corp. 41964 521 42485 25000 0 60
66 Khandwa M 10459 368 10827 0 0 0
67 Morena M 8750 n.a. 8,750 0 n.a. 0
68 Murwara (Katni) M.Corp. 8179 395 8574 3725 0 46
69 Ratlam M.Corp. 27057 571 27628 15 0 0.06
70 Rewa M.Corp. 13252 136 13388 12350 136 93
71 Satna M.Corp. 11651 294 11945 11651 294 100
2 3 6
Sl. City/Town No. of water supply connections No. of connections metered %ConNo. Domestic Non- Total Domestic Non- Domestic
domestic domestic
1 2 3 4 5 6 8
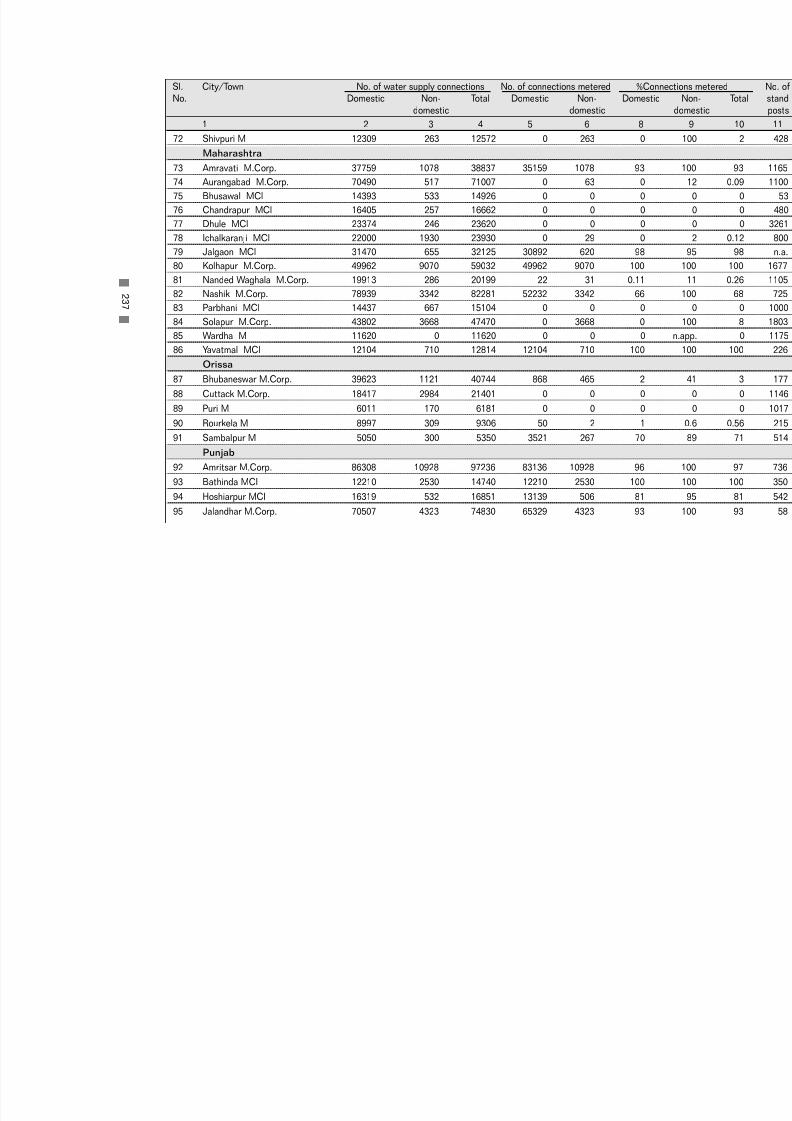
7/21/2019 Status Watersupply
http://slidepdf.com/reader/full/status-watersupply 257/869
72 Shivpuri M 12309 263 12572 0 263 0
Maharashtra
73 Amravati M.Corp. 37759 1078 38837 35159 1078 93
74 Aurangabad M.Corp. 70490 517 71007 0 63 0
75 Bhusawal MCl 14393 533 14926 0 0 0
76 Chandrapur MCl 16405 257 16662 0 0 0
77 Dhule MCl 23374 246 23620 0 0 0
78 Ichalkaranji MCl 22000 1930 23930 0 29 0
79 Jalgaon MCl 31470 655 32125 30892 620 98
80 Kolhapur M.Corp. 49962 9070 59032 49962 9070 100
81 Nanded Waghala M.Corp. 19913 286 20199 22 31 0.11
82 Nashik M.Corp. 78939 3342 82281 52232 3342 66
83 Parbhani MCl 14437 667 15104 0 0 0
84 Solapur M.Corp. 43802 3668 47470 0 3668 0
85 Wardha M 11620 0 11620 0 0 0
86 Yavatmal MCl 12104 710 12814 12104 710 100
Orissa
87 Bhubaneswar M.Corp. 39623 1121 40744 868 465 2
88 Cuttack M.Corp. 18417 2984 21401 0 0 0
89 Puri M 6011 170 6181 0 0 0
90 Rourkela M 8997 309 9306 50 2 1
91 Sambalpur M 5050 300 5350 3521 267 70
Punjab
92 Amritsar M.Corp. 86308 10928 97236 83136 10928 96
93 Bathinda MCI 12210 2530 14740 12210 2530 100
94 Hoshiarpur MCI 16319 532 16851 13139 506 81
95 Jalandhar M.Corp. 70507 4323 74830 65329 4323 93
2 3 7
Sl. City/Town No. of water supply connections No. of connections metered %ConNo. Domestic Non- Total Domestic Non- Domestic
domestic domestic
1 2 3 4 5 6 8

7/21/2019 Status Watersupply
http://slidepdf.com/reader/full/status-watersupply 258/869
96 Moga MCI 15482 1545 17027 15437 1545 100
97 Pathankot MCI 18600 483 19083 17429 483 94
98 Patiala M.Corp. 37747 1560 39307 37747 1560 100
Rajasthan
99 Ajmer MCI 58233 3133 61366 58024 3133 100
100 Alwar M 31910 2458 34368 23896 2458 75
101 Beawar M 15977 429 16406 1201 429 8
102 Bhilwara M 20681 3449 24130 20309 3401 98
103 Bikaner M 64539 4900 69439 41747 4900 65
104 Jodhpur M.Corp. 90685 6384 97069 85600 6384 94
105 Kota M.Corp. 66213 4388 70601 66213 4388 100
106 Sriganganagar M 21706 2004 23710 21004 2004 97Tamil Nadu
107 Cuddalore M 6798 202 7000 6798 202 100
108 Dindigul M 14938 542 15480 14938 542 100
109 Erode M 15082 1525 16607 9238 1525 61
110 Kanchipuram M 14349 419 14768 8923 419 62
111 Kumbakonam M 9238 167 9405 3515 167 38
112 Nagercoil M 18697 461 19158 18697 461 100
113 Rajapalayam M 13007 436 13443 0 436 0
114 Salem M.Corp. 47481 487 47968 47481 487 100
115 Thanjavur M 16183 670 16853 16183 670 100
116 Tiruchirapalli M.Corp. 43600 1004 44604 29467 1004 68
117 Tirunelveli M.Corp. 8530 223 8753 3193 223 37
118 Tirunvannamalai M 9670 187 9857 4420 187 46
119 Tiruppur M 34902 3910 38812 29992 3910 86
120 Tuticorin M 24995 1082 26077 24995 1082 100
2 3 8
Sl. City/Town No. of water supply connections No. of connections metered %ConNo. Domestic Non- Total Domestic Non- Domestic
domestic domestic
1 2 3 4 5 6 8

7/21/2019 Status Watersupply
http://slidepdf.com/reader/full/status-watersupply 259/869
121 Vellore M 14002 1888 15890 0 0 0
Uttar Pradesh
122 Agra M.Corp. 108800 2900 111700 105800 2900 97
123 Aligarh M.Corp. 30750 3300 34050 30750 3300 100
124 Allahabad M.Corp. 87000 1215 88215 39000 1215 45
125 Bareilly M.Corp. 46625 2172 48797 46625 2150 100
126 Etawah MB 14430 884 15314 14380 300 100
127 Faizabad MB 11965 1410 13375 11965 1410 100
128 Firozabad MB 17300 2125 19425 17300 2125 100
129 Ghaziabad M.Corp. 8482 0 8,482 5537 0 65
130 Gorakhpur M.Corp. 15856 344 16200 15000 274 95
131 Haldwani-cum-
Kathgodam MB 12201 2144 14345 12107 2144 99
132 Hapur MB 8014 5141 13155 4574 2715 57
133 Hardwar MB 16230 6070 22300 0 0 0
134 Jhansi MB 27487 553 28040 27077 553 99
135 Mathura MB 15302 1000 16302 9517 0 62
136 Meerut M.Corp. 70314 4598 74912 1914 4598 3
137 Mirzapur MB 16100 365 16465 6500 350 40
138 Moradabad M.Corp. 31000 1000 32000 0 0 0
139 Muzaffarnagar MB 26860 650 27510 0 0 0
140 Rae Bareli MB 4231 542 4773 4231 542 100
141 Rampur MB 13995 302 14297 11995 302 86142 Saharanpur MB 28200 2530 30730 28200 2530 100
143 Sitapur MB 7000 400 7400 6350 400 91
144 Unnao MB 4700 350 5050 4700 350 100
West Bengal
145 Asansol M.Corp. 10634 11 10645 0 0 0
2 3 9
Sl. City/Town No. of water supply connections No. of connections metered %ConNo. Domestic Non- Total Domestic Non- Domestic
domestic domestic
1 2 3 4 5 6 8

7/21/2019 Status Watersupply
http://slidepdf.com/reader/full/status-watersupply 260/869
146 Baharampur M Break-up not available 9,693 0 0 n.a.
147 Balurghat M 6500 0 6500 0 0 0
148 Bankura M 785 1300 2085 0 0 0
149 Barasat M 9693 8 9701 0 0 0
150 Burdwan M 36000 215 36215 0 0 0
151 Halisahar M 502 0 502 0 0 0
152 Krishnagar M 7300 0 7300 0 0 0
153 Midnapore M 4880 130 5010 0 0 0
154 North Barrackpore M 11665 140 11805 0 0 0
155 Santipur M 0 0 0 0 0 n.app.
156 Silliguri M.Corp. 0 0 0 0 0 n.app.
Small States
Assam
157 Guwahati M.Corp. Break-up not available 40,000 n.a. n.a. n.a.
158 Jorhat MB n.a. n.a. n.a. n.a. n.a. n.a.
Manipur
159 Imphal MCI 10214 165 10379 0 0 0
Meghalaya
160 Shillong MB 8331 186 8517 0 1 0
Mizoram
161 Aizwal NM 10540 0 10540 0 0 0
Tripura
162 Agartala MCI 22682 1240 23922 0 0 0Union Territories
163 Chandigarh M.Corp. 105648 38140 143788 82184 38140 78
164 Pondicherry M 42817 4468 47285 42817 4468 100
n.a. = not available ; n.app. = not applicable
Source: Respective urban local governments/relevant agencies, NIUA Survey,1999.
2 4 0
Sl. City/Town No. of water supply connections No. of connections metered %ConNo. Domestic Non- Total Domestic Non- Domestic
domestic domestic
1 2 3 4 5 6 8

7/21/2019 Status Watersupply
http://slidepdf.com/reader/full/status-watersupply 261/869
CLASS II
Andhra Pradesh
1 Anakapalle M 1969 31 2000 0 31 0
2 Dharmavaram M 4024 303 4327 6 23 0.15
3 Gudur MCI 3805 181 3986 0 181 0
4 Kapra M n.a. n.a. n.a. n.a. n.a. n.a.
5 Kavali MCI 940 0 940 0 0 0
6 Madanapalle M 5778 53 5831 0 53 0
7 Narasaraopet M 2977 137 3114 0 117 0
8 Rajendra nagar MCI 3400 28 3428 0 28 0
9 Sangareddy MCI 4400 50 4450 0 50 0
10 Srikakulam MCI 4086 114 4200 51 114 1
11 Srikalahasti M 3695 86 3781 0 86 0
12 Suryapet MCI 4624 263 4887 0 0 0
Bihar
13 Buxar M 3385 0 3385 0 0 0
14 Deoghar M n.a. n.a. n.a. n.a. n.a. n.a.
15 Hajipur M 670 0 670 0 0 0
16 Hazaribagh M n.a. n.a. n.a. n.a. n.a. n.a.
17 Jehanabad M n.a. n.a. n.a. n.a. n.a. n.a.
18 Madhubani M 13328 63 13391 1203 63 9
19 Mokama M n.a. 33 33 n.a. n.a. n.a.
Gujarat
20 Amreli M n.a. n.a. n.a. n.a. n.a. n.a.
21 Ankleswar M Break-up not available 9,327 n.a. n.a. n.a.
22 Dabhoi M Break-up not available 12,011 Break-up not available n.a.
23 Dohad M 14953 1662 16615 0 0 0
2 4 1
Sl. City/Town No. of water supply connections No. of connections metered %ConNo. Domestic Non- Total Domestic Non- Domestic
domestic domestic
1 2 3 4 5 6 8

7/21/2019 Status Watersupply
http://slidepdf.com/reader/full/status-watersupply 262/869
24 Gondal M 8915 322 9237 0 0 0
25 Jetpur M Break-up not available 10,443 n.a. n.a. n.a.
26 Mahesana M 15287 640 15927 15 0 0.10
27 Palanpur M 11694 671 12365 0 0 0
Haryana
28 Jind MCI 10197 216 10413 28 0 0.27
29 Kaithal MCI 7975 140 8115 0 0 0
30 Rewari MCI 12787 0 12787 0 0 0
31 Thanesar MCI 8827 296 9123 0 0 0
Karnataka
32 Bagalkot CMC 6100 0 6100 0 0 0
33 Chikmaglur CMC 7189 304 7493 0 0 034 Gokak CMC 5027 272 5299 0 0 0
35 Hospet CMC 5735 280 6015 0 0 0
36 Kolar CMC 8125 2100 10225 0 0 0
37 Rabkavi-Banhatti CMC 3245 213 3458 0 2 0
38 Ramanagaram CMC 5171 394 5565 0 0 0
Kerala
39 Changanessary MC 5949 610 6559 5949 610 100
40 Payyanur M 2 7 9 2 7 100
41 Taliparamba M 177 92 269 177 92 100
42 Thrissur MC 9949 4970 14919 9949 4970 100
Madhya Pradesh
43 Hoshangabad M 6000 1030 7030 0 0 0
44 Itarsi M 4950 93 5043 0 0 0
45 Khargone M 4426 100 4526 0 0 0
46 Mandsaur M 11120 622 11742 0 0 0
2 4 2
Sl. City/Town No. of water supply connections No. of connections metered %ConNo. Domestic Non- Total Domestic Non- Domestic
domestic domestic
1 2 3 4 5 6 8
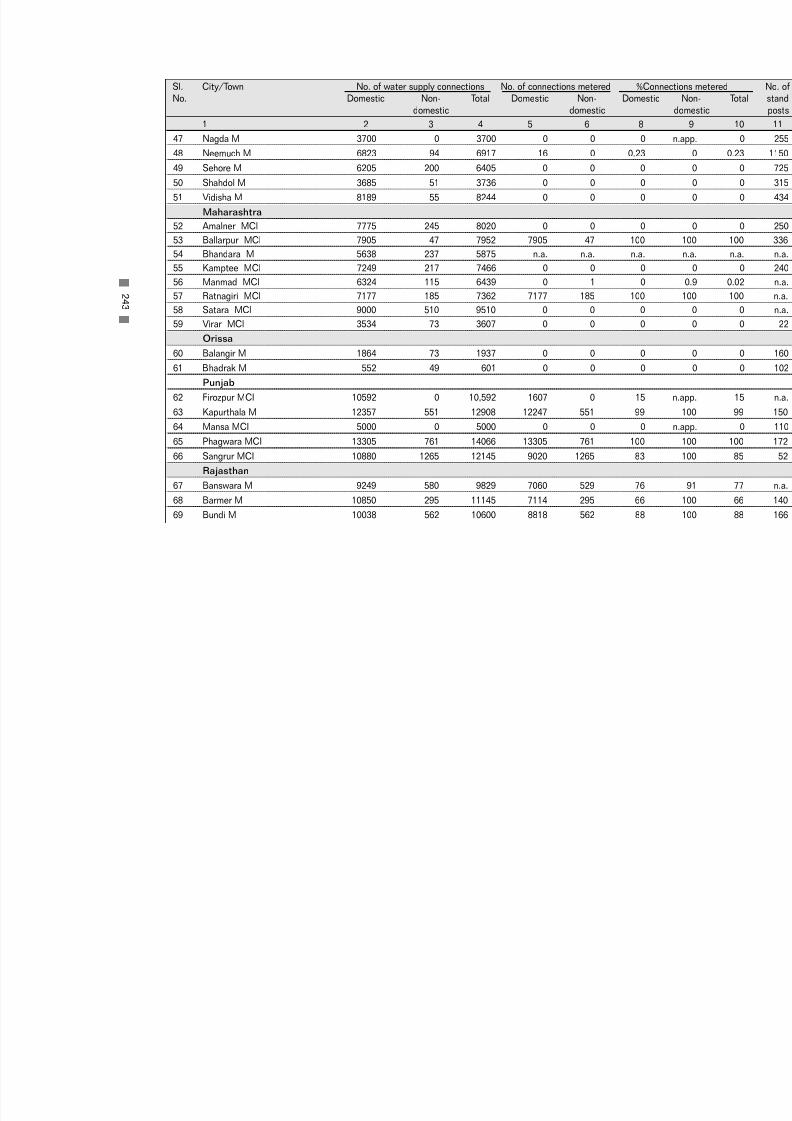
7/21/2019 Status Watersupply
http://slidepdf.com/reader/full/status-watersupply 263/869
47 Nagda M 3700 0 3700 0 0 0
48 Neemuch M 6823 94 6917 16 0 0.23
49 Sehore M 6205 200 6405 0 0 0
50 Shahdol M 3685 51 3736 0 0 0
51 Vidisha M 8189 55 8244 0 0 0
Maharashtra
52 Amalner MCl 7775 245 8020 0 0 0
53 Ballarpur MCl 7905 47 7952 7905 47 100
54 Bhandara M 5638 237 5875 n.a. n.a. n.a.
55 Kamptee MCl 7249 217 7466 0 0 0
56 Manmad MCl 6324 115 6439 0 1 0
57 Ratnagiri MCl 7177 185 7362 7177 185 10058 Satara MCl 9000 510 9510 0 0 0
59 Virar MCl 3534 73 3607 0 0 0
Orissa
60 Balangir M 1864 73 1937 0 0 0
61 Bhadrak M 552 49 601 0 0 0
Punjab
62 Firozpur MCI 10592 0 10,592 1607 0 15
63 Kapurthala M 12357 551 12908 12247 551 99
64 Mansa MCI 5000 0 5000 0 0 0
65 Phagwara MCI 13305 761 14066 13305 761 100
66 Sangrur MCI 10880 1265 12145 9020 1265 83
Rajasthan
67 Banswara M 9249 580 9829 7060 529 76
68 Barmer M 10850 295 11145 7114 295 66
69 Bundi M 10038 562 10600 8818 562 88
2 4 3
Sl. City/Town No. of water supply connections No. of connections metered %ConNo. Domestic Non- Total Domestic Non- Domestic
domestic domestic
1 2 3 4 5 6 8

7/21/2019 Status Watersupply
http://slidepdf.com/reader/full/status-watersupply 264/869
70 Churu M 12783 12 12795 5997 12 47
71 Hanumangarh M 14695 351 15046 7439 181 51
72 Sawai Madhopur M 8914 394 9308 7635 394 86
Tamil Nadu
73 Ambur M 6818 250 7068 6818 250 100
74 Arakkonam M 5248 52 5300 4287 52 82
75 Attur M 5236 108 5344 5236 108 100
76 Cumbum M 4345 98 4443 2964 98 68
77 Dharmapuri M 5762 157 5919 5762 157 100
78 Guduivattam M 5497 71 5568 0 0 0
79 Nagapattinam M 4385 176 4561 4385 176 100
80 Pudukkottai M 8788 106 8894 8788 106 10081 Sivakasi M 6618 420 7038 4486 420 68
82 Srivilliputtur M 5877 98 5975 2717 98 46
83 Tindivanam MC 2911 74 2985 2534 74 87
84 Udhagamandalam M 565 6 571 565 6 100
Uttar Pradesh
85 Auraiya MB 5543 308 5851 5543 308 100
86 Balrampur MB 2527 244 2771 1430 138 57
87 Basti MB 8300 500 8800 3300 500 40
88 Bhadohi MB 5020 0 5020 4070 0 81
89 Chandpur MB 4063 26 4089 1588 11 39
90 Etah MB 6050 0 6050 6050 0 100
91 Ghazipur MB 8482 0 8482 5537 0 65
92 Gonda MB 6701 209 6910 0 0 0
93 Lakhimpur MB 10000 0 10000 4500 0 45
94 Lalitpur MB 15653 94 15747 8653 94 55
2 4 4
Sl. City/Town No. of water supply connections No. of connections metered %ConNo. Domestic Non- Total Domestic Non- Domestic
domestic domestic
1 2 3 4 5 6 8

7/21/2019 Status Watersupply
http://slidepdf.com/reader/full/status-watersupply 265/869
95 Mughalsarai MB 2177 65 2242 922 60 42
96 Nawabganj-Barabanki MB 7381 963 8344 7381 963 100
97 Orai MB 7108 250 7358 6845 214 96
98 Roorkee MB 9605 1440 11045 9605 1440 100
West Bengal
99 Bishnupur M 2345 53 2398 0 0 0
100 Chakdaha M 0 0 0 0 0 n.app.
101 Contai M 0 0 0 0 0 n.app.
102 Cooch Behar M 6067 1025 7092 0 0 0
103 Darjeeling M 4500 623 5123 0 0 0
104 Jalpaiguri M 2937 35 2972 0 0 0
105 Jangipur M 235 12 247 0 0 0106 Katwa M 100 0 100 0 0 0
107 Raniganj M 2365 885 3250 0 0 0
Small States
Nagaland
109 Kohima TC 4882 350 5232 0 0 0
Himachal Pradesh
108 Shimla M.Corp. 9878 6251 16129 9878 6251 100
Union Teritories
110 Port Balir MCI 17854 290 18144 0 0 0
Others (Smaller than Class II towns)Small States
Arunachal Pradesh
111 Itanagar CT 4210 210 4420 0 0 0
2 4 5
Sl. City/Town No. of water supply connections No. of connections metered %ConNo. Domestic Non- Total Domestic Non- Domestic
domestic domestic
1 2 3 4 5 6 8

7/21/2019 Status Watersupply
http://slidepdf.com/reader/full/status-watersupply 266/869
Goa
112 Panaji MCI 6382 420 6802 6357 420 100
Union Territories
113 Daman MCI 8500 25 8525 8500 25 100
114 Kavarathi NMCT 0 0 0 0 0 n.app.
115 Silvassa 1465 6 1471 0 0 0
n.a. = not available ; n.app. = not applicable Source: Respective urban local governments/relevant agencies, NIUA Survey, 1999
2 4 6
Sl. City/Town No. of water supply connections No. of connections% Connections MeteNo. Domestic Non- Total Domestic Non- Domestic
domestic domestic1 2 3 4 5 6 8

7/21/2019 Status Watersupply
http://slidepdf.com/reader/full/status-watersupply 267/869
A - 6
DE T A I L S OF H
E A D W OR K S ,1 9 9
9

7/21/2019 Status Watersupply
http://slidepdf.com/reader/full/status-watersupply 268/869

7/21/2019 Status Watersupply
http://slidepdf.com/reader/full/status-watersupply 269/869
METROPOLITAN CITIES
1 Ahmedabad M.Corp. n.app. n.app. n.app. n.app. n.app.
2 Bangalore M.Corp. 3 Gravity 18.0 Gravity 28.0
3 Bhopal M.Corp. 2 129.0 16.0
4 Calcutta M.Corp. 1 15.2 3.0 18.0 3.0
5 Chennai M.Corp. 3 n.a. n.a. n.a. n.a.
6 Coimbatore M.Corp 2 Gravity 36.0 Gravity 95.0
7 Delhi M.Corp. 2 10.0 46.0 10.0 46.0
8 Greater Mumbai M.Corp. 6 37.0 240.0 - -
9 Hyderabad M.Corp. 4 n.a. 9.0 n.a. 28.410 Indore M.Corp. 3 48.0 3.5 Gravity 3.0
11 Jaipur M.Corp. 1 n.a. n.a. n.a. n.a.
12 Kanpur M.Corp. 1 30.0 15.0 - -
13 Kochi M.Corp. 1 n.a. n.a. n.a. n.a.
14 Lucknow M.Corp. 1 34.0 1.8
15 Ludhiana M.Corp. n.app. n.app. n.app. n.app. n.app.
16 Madurai M.Corp. 3 Gravity 16.0 Gravity 16.0
17 Nagpur M.Corp. 3 36.0 3.0 36.0 3.0
18 Pune M.Corp. 1 n.a. n.a. n.a. n.a.
19 Surat M.Corp. 3 35.0 0.5 35.0 -20 Vadodara M.Corp. 2 Gravity 7.0 10.0 0.5
21 Varanasi M.Corp. 1 50.0 1.5 - -
22 Visakhapatnam M.Corp. 7 30.0 18.0 - -
Source: Respective urban local governments/relevant agencies, NIUA Survey,1999.
2 4 9
Sl. City/Town No. of headworks Headwork 1 Headwork 2No. (for surface Total raw Raw water Total raw Raw water
water source) water pumping conveying water pumping conveyinghead (m) main (km) head (m) main (km)
1 2 3 4 5 6
A-6 : Details of Headworks, 1999

7/21/2019 Status Watersupply
http://slidepdf.com/reader/full/status-watersupply 270/869
CLASS IAndhra Pradesh
1 Anantapur MCI 5 31.0 3.0 - -
2 Chittoor M 2 65.0 8.9 65.0 9.7
3 Cuddapah MCI 3 14.0 8.0
4 Eluru M 1 30.0 16.0 - -
5 Guntur MCI 3 18.0 2.0 - -
6 Hindupur M 1 n.a. n.a. n.a. n.a.
7 Kakinada M 2 10.0 11.0 7.0 14.0
8 Kurnool MCI 1 7.5 3.5 - -
9 Machilipatnam M 1 8.0 0.1 - -
10 Nandyal MCI 1 7.2 n.a. - -
11 Nellore MCI 1 n.a. n.a. - -
12 Nizamabad M 1 14.0 12.0 - -
13 Ongole MCI 2 6.0 2.2 50.0 16.0
14 Qutubullapur M n.a. n.a. n.a. n.a. n.a.
15 Rajahmundry M.Corp. 1 15.0 0.4 - -
16 Tenali M 1 30.5 5.0 - -
17 Tirupati MCI 1 40.0 1.2 - -
18 Vijaywada M.Corp. 1 15.0 - - -
19 Warangal M.Corp. 2 17.0 15.0 n.a. 8.0
Bihar
20 Bihar Sharif M n.a. n.a. n.a. n.a. n.a.
21 Chhapra M n.a. n.a. n.a. n.a. n.a.
22 Gaya M.Corp. n.a. n.a. n.a. n.a. n.a.
23 Katihar M n.a. n.a. n.a. n.a. n.a.
24 Munger M n.a. n.a. n.a. n.a. n.a.
2 5 0
Sl. City/Town No. of headworks Headwork 1 Headwork 2No. (for surface Total raw Raw water Total raw Raw water
water source) water pumping conveying water pumping conveyinghead (m) main (km) head (m) main (km)
1 2 3 4 5 6

7/21/2019 Status Watersupply
http://slidepdf.com/reader/full/status-watersupply 271/869
25 Ranchi M.Corp. 3 100.0 380.6 - -Gujarat
26 Anand M 1 3.0 n.a. - -
27 Bharuch M 1 n.a. 17.0 - -
28 Bhavnagar M.Corp. 4 100.0 46.0 18.0 3.0
29 Bhuj M 16 n.a. 16.0 n.a. n.a.
30 Jamnagar M.Corp. 5 n.a. 35.0 - -
31 Junagadh M 33 n.a. n.a. n.a. n.a.
32 Nadiad M 2 Gravity 4.5 - -
33 Navsari M 28 n.a. n.a. n.a. n.a.
34 Porbandar M 2 40.0 9.0 36.0 n.a.
35 Rajkot M.Corp. 4 Gravity 5.0 15.0 7.8
36 Surendranagar M 1 n.a. 3.5 - -
Haryana
37 Ambala MCI n.a. n.a. n.a. n.a. n.a.
38 Faridabad M.Corp. n.a. n.a. n.a. n.a. n.a.
39 Gurgaon MCI n.a. n.a. n.a. n.a. n.a.
40 Hisar MCI 1 Gravity 8.0 - -
41 Karnal MCI n.a. n.a. n.a. n.a. n.a.
42 Rohtak MCI 2 5.0 4.0 5.0 2.0
Jammu & Kashmir
43 Jammu M.Corp. 2 200.0 0.5 120.0 0.5
Karnataka
44 Belgaum M.Corp. 1 Gravity 22.0 - -
45 Bellary CMC 2 1400.0 18.0 Gravity 16.0
46 Davangere MCI 2 n.a. 14.0 n.a. 77.0
47 Gadag-Betigeri CMC 1 130.0 12.1 - -
2 5 1
Sl. City/Town No. of headworks Headwork 1 Headwork 2No. (for surface Total raw Raw water Total raw Raw water
water source) water pumping conveying water pumping conveyinghead (m) main (km) head (m) main (km)
1 2 3 4 5 6

7/21/2019 Status Watersupply
http://slidepdf.com/reader/full/status-watersupply 272/869
48 Gulbarga M.Corp. 3 105.0 26.0 100.0 18.049 Hubli-Dharwar M.Corp. 2 n.a. 30.0 n.a. 18.0
50 Mandya M 2 103.0 12.7 Gravity 1.3
51 Mangalore M.Corp. 2 109.0 17.5 47.2 16.7
52 Mysore M.Corp. 1 30.0 9.5 - -
53 Shimoga CMC 2 6.0 10.0 10.0 50.0
54 Tumkur M 2 30.0 0.8 12.0 0.2
Kerala
55 Alappuzha MC n.a. n.a. n.a. n.a. n.a.
56 Kollam MC 1 Gravity 26.0 - -
57 Kozhikode M.Corp. 3 Gravity 14.0 Gravity 8.0
58 Thalaserry M 1 63.6 2.8 - -
59 Thiruvananthapuram M.Corp. 3 80.0 16.0 35.0 0.6
Madhya Pradesh
60 Bhind M n.a. n.a. n.a. n.a. n.a.
61 Burhanpur M.Corp. n.a. n.a. n.a. n.a. n.a.
62 Dewas M.Corp. 1 20.0 30.0 - -
63 Guna M 1 30.0 0.3 - -
64 Gwalior M.Corp. 1 6.0 15.6 - -
65 Jabalpur M.Corp. 3 40.0 0.7 n.a. 6.0
66 Khandwa M 2 25.0 0.5 15.0 0.4
67 Morena M n.a. n.a. n.a. n.a. n.a.
68 Murwara (Katni) M.Corp. 1 0.5 2.5 - -
69 Ratlam M.Corp. 1 15.0 3.0 - -
70 Rewa M.Corp. 2 20.0 0.5 25.0 0.4
71 Satna M.Corp. 1 50.0 14.0 - -
72 Shivpuri M 1 34.0 8.0 - -
2 5 2
Sl. City/Town No. of headworks Headwork 1 Headwork 2No. (for surface Total raw Raw water Total raw Raw water
water source) water pumping conveying water pumping conveyinghead (m) main (km) head (m) main (km)
1 2 3 4 5 6

7/21/2019 Status Watersupply
http://slidepdf.com/reader/full/status-watersupply 273/869
Maharashtra73 Amravati M.Corp. 1 103.0 55.0 - -
74 Aurangabad M.Corp. 3 125.0 22.0 Gravity 4.0
75 Bhusawal MCl 1 42.0 1.5 - -
76 Chandrapur MCl 2 n.a. 17.0 n.a. 2.0
77 Dhule MCl 3 100.0 40.0 50.0 5.0
78 Ichalkaranji MCl 1 55.0 3.5 - -
79 Jalgaon MCl 1 n.a. 140.0 - -
80 Kolhapur M.Corp. 3 40.0 1.0 45.0 3.0
81 Nanded Waghala M.Corp. 3 48.0 5.0 56.0 4.0
82 Nashik M.Corp. 3 57.0 2.2 39.0 3.3
83 Parbhani MCl 1 81.0 9.0 - -
84 Solapur M.Corp. 3 15.0 8.0 95.0 30.0
85 Wardha M 2 54.0 9.0 81.0 8.2
86 Yavatmal MCl 1 62.0 3.8 - -
Orissa
87 Bhubaneswar M.Corp. 5 60.0 30.0 60.0 30.0
88 Cuttack M.Corp. n.a. n.a. n.a. n.a. n.a.
89 Puri M 2 60.0 7.0 50.0 4.0
90 Rourkela M 1 60.0 1.0 - -
91 Sambalpur M 3 13.0 2.5 20.0 1.2
Punjab
92 Amritsar M.Corp. n.a. n.a. n.a. n.a. n.a.
93 Bathinda MCI 1 12.0 0.2 - -
94 Hoshiarpur MCI n.a. n.a. n.a. n.a. n.a.
95 Jalandhar M.Corp. n.a. n.a. n.a. n.a. n.a.
96 Moga MCI n.a. n.a. n.a. n.a. n.a.
2 5 3
Sl. City/Town No. of headworks Headwork 1 Headwork 2No. (for surface Total raw Raw water Total raw Raw water
water source) water pumping conveying water pumping conveyinghead (m) main (km) head (m) main (km)
1 2 3 4 5 6

7/21/2019 Status Watersupply
http://slidepdf.com/reader/full/status-watersupply 274/869
97 Pathankot MCI n.a. n.a. n.a. n.a. n.a.98 Patiala M.Corp. n.a. n.a. n.a. n.a. n.a.
Rajasthan
99 Ajmer MCI 2 n.a. 170.0
100 Alwar M n.a. n.a. n.a. n.a. n.a.
101 Beawar M 3 n.a. 55.0 100.0 6.0
102 Bhilwara M 1 30.0 13.0 - -
103 Bikaner M 1 7.0 n.a. - -
104 Jodhpur M.Corp. 1 182.5 209.2 - -
105 Kota M.Corp. 1 50.0 2.9 - -
106 Sriganganagar M 1 12.0 2.8 - -
Tamil Nadu
107 Cuddalore M 2 14.5 7.0 26.5 7.0
108 Dindigul M 2 60.0 8.0 70.0 21.0
109 Erode M 1 n.a. 13.6 - -
110 Kanchipuram M 2 n.a. 38.0 n.a. 4.0
111 Kumbakonam M 1 4.0 12.0 - -
112 Nagercoil M 1 4.0 18.5 - -
113 Rajapalayam M 1 12.0 3.0 - -
114 Salem M.Corp. 1 n.a. 21.0 - -
115 Thanjavur M 2 43.3 5.0 13.0 15.0
116 Tiruchirapalli M.Corp. n.a. n.a. n.a. n.a. n.a.117 Tirunelveli M.Corp. 4 60.0 0.8 - -
118 Tirunvannamalai M 2 18.0 0.6 18.0 0.6
119 Tiruppur M 1 n.a. 54.0 - -
120 Tuticorin M 1 n.a. 3.5 - -
121 Vellore M 3 40.0 2.0 60.0 8.0
2 5 4
Sl. City/Town No. of headworks Headwork 1 Headwork 2No. (for surface Total raw Raw water Total raw Raw water
water source) water pumping conveying water pumping conveyinghead (m) main (km) head (m) main (km)
1 2 3 4 5 6

7/21/2019 Status Watersupply
http://slidepdf.com/reader/full/status-watersupply 275/869
Uttar Pradesh122 Agra M.Corp. 2 17.0 3.0 31.0 3.0
123 Aligarh M.Corp. 40 24.0 10.0 - -
124 Allahabad M.Corp. 1 40.0 5.0 - -
125 Bareilly M.Corp. 33 n.a. n.a. n.a. n.a.
126 Etawah MB 7 60.0 17.5 n.a. n.a.
127 Faizabad MB n.a. n.a. n.a. n.a. n.a.
128 Firozabad MB n.a. n.a. n.a. n.a. n.a.
129 Ghaziabad M.Corp. 116 - - - -
130 Gorakhpur M.Corp. 60 n.a. n.a. n.a. n.a.
131 Haldwani-cum-
Kathgodam MB 1 120.0 2.5 - -
132 Hapur MB 14 n.a. n.a. n.a. n.a.
133 Hardwar MB 33 n.a. n.a. n.a. n.a.
134 Jhansi MB 7 40.0 12.0 - -
135 Mathura MB 54 n.a. n.a. n.a. n.a.
136 Meerut M.Corp. 50 n.a. 32.0 n.a. n.a.
137 Mirzapur MB 28 n.a. 15.0 - -
138 Moradabad M.Corp. 19 20.0 88.0 n.a. n.a.
139 Muzaffarnagar MB 21 n.a. 105.0 n.a. n.a.
140 Rae Bareli MB 20 n.a. 1.5 n.a. n.a.
141 Rampur MB 12 n.a. n.a. n.a. n.a.
142 Saharanpur MB 26 n.a. 1.0 n.a. n.a.
143 Sitapur MB n.a. n.a. n.a. n.a. n.a.
144 Unnao MB n.a. n.a. n.a. n.a. n.a.
West Bengal
145 Asansol M.Corp. 1 15.0 0.4 - -
2 5 5
Sl. City/Town No. of headworks Headwork 1 Headwork 2No. (for surface Total raw Raw water Total raw Raw water
water source) water pumping conveying water pumping conveyinghead (m) main (km) head (m) main (km)
1 2 3 4 5 6
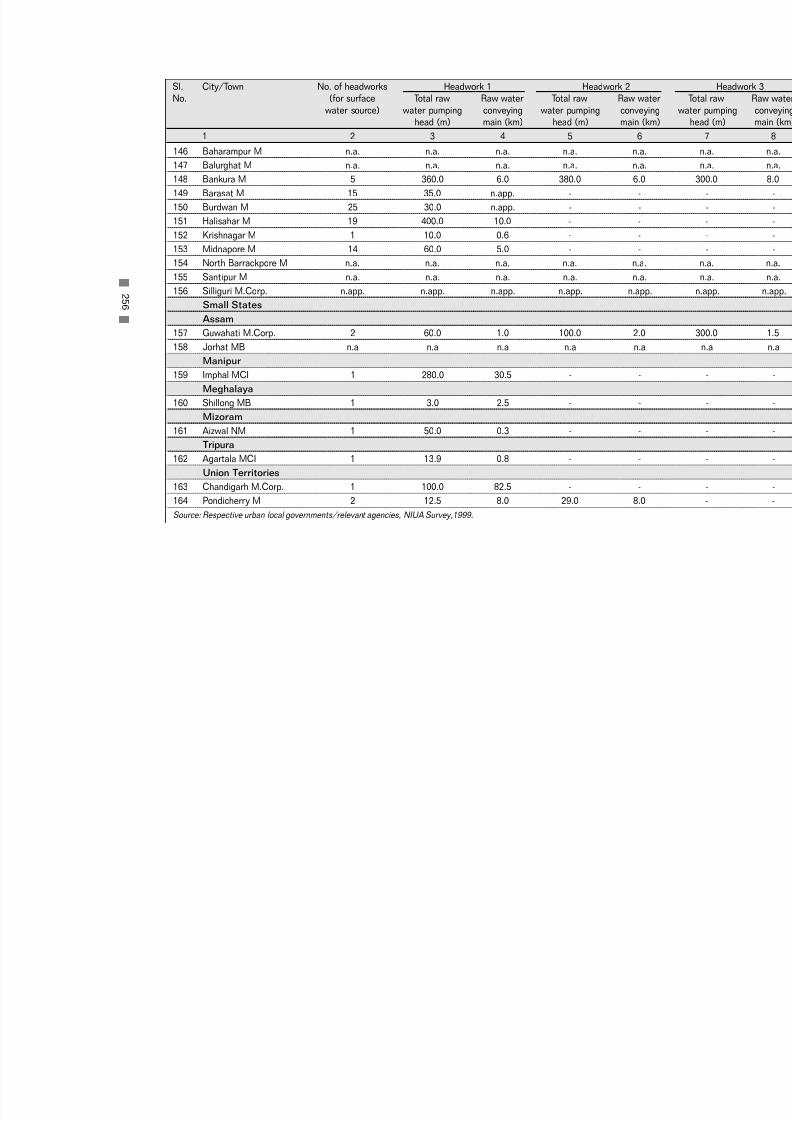
7/21/2019 Status Watersupply
http://slidepdf.com/reader/full/status-watersupply 276/869
146 Baharampur M n.a. n.a. n.a. n.a. n.a.147 Balurghat M n.a. n.a. n.a. n.a. n.a.
148 Bankura M 5 360.0 6.0 380.0 6.0
149 Barasat M 15 35.0 n.app. - -
150 Burdwan M 25 30.0 n.app. - -
151 Halisahar M 19 400.0 10.0 - -
152 Krishnagar M 1 10.0 0.6 - -
153 Midnapore M 14 60.0 5.0 - -
154 North Barrackpore M n.a. n.a. n.a. n.a. n.a.
155 Santipur M n.a. n.a. n.a. n.a. n.a.
156 Silliguri M.Corp. n.app. n.app. n.app. n.app. n.app.
Small States
Assam
157 Guwahati M.Corp. 2 60.0 1.0 100.0 2.0
158 Jorhat MB n.a n.a n.a n.a n.a
Manipur
159 Imphal MCI 1 280.0 30.5 - -
Meghalaya
160 Shillong MB 1 3.0 2.5 - -
Mizoram
161 Aizwal NM 1 50.0 0.3 - -
Tripura
162 Agartala MCI 1 13.9 0.8 - -
Union Territories
163 Chandigarh M.Corp. 1 100.0 82.5 - -
164 Pondicherry M 2 12.5 8.0 29.0 8.0
Source: Respective urban local governments/relevant agencies, NIUA Survey,1999.
2 5 6
Sl. City/Town No. of headworks Headwork 1 Headwork 2No. (for surface Total raw Raw water Total raw Raw water
water source) water pumping conveying water pumping conveyinghead (m) main (km) head (m) main (km)
1 2 3 4 5 6

7/21/2019 Status Watersupply
http://slidepdf.com/reader/full/status-watersupply 277/869
CLASS IIAndhra Pradesh
1 Anakapalle M 1 Gravity 3.9 - -
2 Dharmavaram M 1 57.0 15.0 - 2.5
3 Gudur MCI 3 18.0 2.0 - -
4 Kapra M n.a. n.a. n.a. n.a. n.a.
5 Kavali MCI n.a. n.a. n.a. n.a. n.a.
6 Madanapalle M 1 100.0 2.5 - -
7 Narasaraopet M 1 Gravity 1.5 - -
8 Rajendra nagar MCI 2 12.0 0.3 12.0 0.3
9 Sangareddy MCI 1 Gravity 0.5 - -10 Srikakulam MCI 1 20.0 3.0 - -
11 Srikalahasti M 1 12.0 7.0 - -
12 Suryapet MCI 1 34.0 15.9 - -
Bihar
13 Buxar M n.a. n.a. n.a. n.a. n.a.
14 Deoghar M n.a. n.a. n.a. n.a. n.a.
15 Hajipur M n.a. n.a. n.a. n.a. n.a.
16 Hazaribagh M 2 79.3 8.0 n.a. 8.0
17 Jehanabad M n.a. n.a. n.a. n.a. n.a.
18 Madhubani M n.a. n.a. n.a. n.a. n.a.
19 Mokama M 1 110.0 n.a. - -
Gujarat
20 Amreli M 1 n.a. 43.0 - -
21 Ankleswar M 7 n.a. n.a. - -
22 Dabhoi M 1 16.0 7.0 n.a. n.a.
2 5 7
Sl. City/Town No. of headworks Headwork 1 Headwork 2No. (for surface Total raw Raw water Total raw Raw water
water source) water pumping conveying water pumping conveyinghead (m) main (km) head (m) main (km)
1 2 3 4 5 6
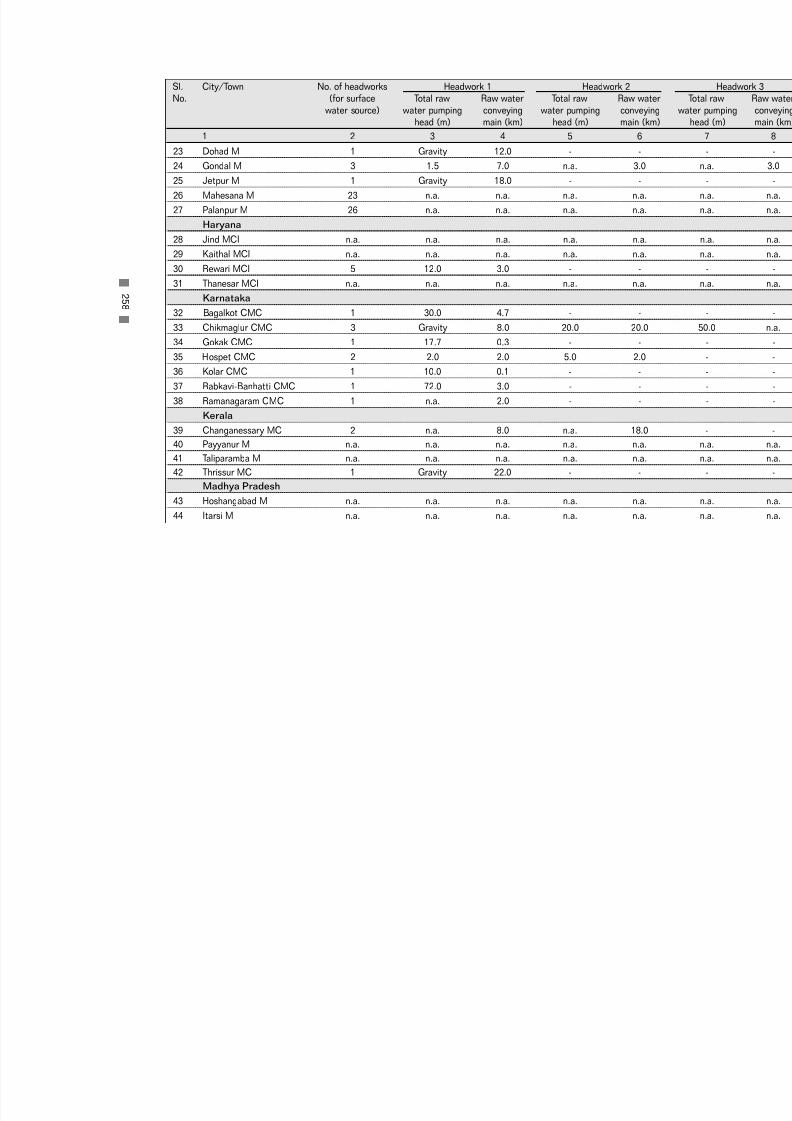
7/21/2019 Status Watersupply
http://slidepdf.com/reader/full/status-watersupply 278/869
23 Dohad M 1 Gravity 12.0 - -24 Gondal M 3 1.5 7.0 n.a. 3.0
25 Jetpur M 1 Gravity 18.0 - -
26 Mahesana M 23 n.a. n.a. n.a. n.a.
27 Palanpur M 26 n.a. n.a. n.a. n.a.
Haryana
28 Jind MCI n.a. n.a. n.a. n.a. n.a.
29 Kaithal MCI n.a. n.a. n.a. n.a. n.a.
30 Rewari MCI 5 12.0 3.0 - -
31 Thanesar MCI n.a. n.a. n.a. n.a. n.a.
Karnataka32 Bagalkot CMC 1 30.0 4.7 - -
33 Chikmaglur CMC 3 Gravity 8.0 20.0 20.0
34 Gokak CMC 1 17.7 0.3 - -
35 Hospet CMC 2 2.0 2.0 5.0 2.0
36 Kolar CMC 1 10.0 0.1 - -
37 Rabkavi-Banhatti CMC 1 72.0 3.0 - -
38 Ramanagaram CMC 1 n.a. 2.0 - -
Kerala
39 Changanessary MC 2 n.a. 8.0 n.a. 18.0
40 Payyanur M n.a. n.a. n.a. n.a. n.a.
41 Taliparamba M n.a. n.a. n.a. n.a. n.a.
42 Thrissur MC 1 Gravity 22.0 - -
Madhya Pradesh
43 Hoshangabad M n.a. n.a. n.a. n.a. n.a.
44 Itarsi M n.a. n.a. n.a. n.a. n.a.
2 5 8
Sl. City/Town No. of headworks Headwork 1 Headwork 2No. (for surface Total raw Raw water Total raw Raw water
water source) water pumping conveying water pumping conveyinghead (m) main (km) head (m) main (km)
1 2 3 4 5 6
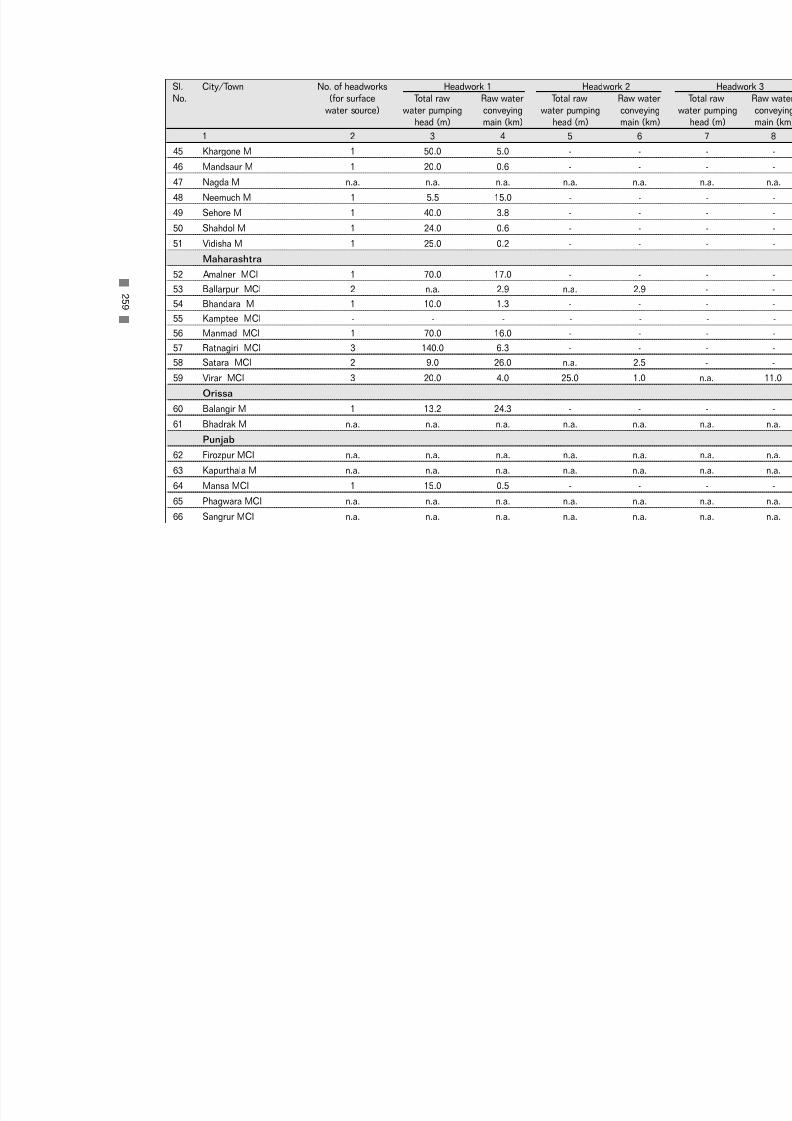
7/21/2019 Status Watersupply
http://slidepdf.com/reader/full/status-watersupply 279/869
45 Khargone M 1 50.0 5.0 - -
46 Mandsaur M 1 20.0 0.6 - -
47 Nagda M n.a. n.a. n.a. n.a. n.a.
48 Neemuch M 1 5.5 15.0 - -
49 Sehore M 1 40.0 3.8 - -
50 Shahdol M 1 24.0 0.6 - -
51 Vidisha M 1 25.0 0.2 - -
Maharashtra
52 Amalner MCl 1 70.0 17.0 - -
53 Ballarpur MCl 2 n.a. 2.9 n.a. 2.9
54 Bhandara M 1 10.0 1.3 - -
55 Kamptee MCl - - - - -
56 Manmad MCl 1 70.0 16.0 - -
57 Ratnagiri MCl 3 140.0 6.3 - -
58 Satara MCl 2 9.0 26.0 n.a. 2.5
59 Virar MCl 3 20.0 4.0 25.0 1.0
Orissa
60 Balangir M 1 13.2 24.3 - -
61 Bhadrak M n.a. n.a. n.a. n.a. n.a.
Punjab
62 Firozpur MCI n.a. n.a. n.a. n.a. n.a.
63 Kapurthala M n.a. n.a. n.a. n.a. n.a.
64 Mansa MCI 1 15.0 0.5 - -
65 Phagwara MCI n.a. n.a. n.a. n.a. n.a.
66 Sangrur MCI n.a. n.a. n.a. n.a. n.a.
2 5 9
Sl. City/Town No. of headworks Headwork 1 Headwork 2No. (for surface Total raw Raw water Total raw Raw water
water source) water pumping conveying water pumping conveyinghead (m) main (km) head (m) main (km)
1 2 3 4 5 6

7/21/2019 Status Watersupply
http://slidepdf.com/reader/full/status-watersupply 280/869
Rajasthan67 Banswara M 1 6.0 13.0 - -
68 Barmer M n.a. n.a. n.a. n.a. n.a.
69 Bundi M n.a. n.a. n.a. n.a. n.a.
70 Churu M 1 70.0 47.0 - -
71 Hanumangarh M 1 12.0 n.a. - -
72 Sawai Madhopur M 1 110.0 19.0 - -
Tamil Nadu
73 Ambur M 3 56.0 6.0 63.0 2.0
74 Arakkonam M 2 30.0 5.0 40.0 16.0
75 Attur M 2 13.0 17.0 7.5 57.076 Cumbum M 1 1.0 18.0 - -
77 Dharmapuri M 1 n.a. 50.3 - -
78 Guduivattam M 2 n.a. 10.0 n.a. 2.0
79 Nagapattinam M 1 Gravity 26.0 - -
80 Pudukkottai M 2 Gravity 8.0 n.a. 26.0
81 Sivakasi M 1 15.0 2.2 - -
82 Srivilliputtur M 1 Gravity 6.7 - -
83 Tindivanam MC 2 24.0 24.0 19.0 21.0
84 Udhagamandalam M 1 200.0 18.6 - -
Uttar Pradesh
85 Auraiya MB 6 n.a. n.a. n.a. n.a.
86 Balrampur MB 4 n.a. n.a. n.a. n.a.
87 Basti MB n.a. n.a. n.a. n.a. n.a.
88 Bhadohi MB 4 n.a. n.a. n.a. n.a.
89 Chandpur MB 3 n.a. n.a. n.a. n.a.
2 6 0
Sl. City/Town No. of headworks Headwork 1 Headwork 2No. (for surface Total raw Raw water Total raw Raw water
water source) water pumping conveying water pumping conveyinghead (m) main (km) head (m) main (km)
1 2 3 4 5 6

7/21/2019 Status Watersupply
http://slidepdf.com/reader/full/status-watersupply 281/869
90 Etah MB 3 n.a. 4.5 n.a. n.a.91 Ghazipur MB 12 n.a. n.a. n.a. n.a.
92 Gonda MB n.a. n.a. n.a. n.a. n.a.
93 Lakhimpur MB 6 60.0 10.0 n.a. n.a.
94 Lalitpur MB 3 30.0 3.0 - -
95 Mughalsarai MB 4 n.a. 150.0 n.a. n.a.
96 Nawabganj-Barabanki MB n.a. n.a. n.a. n.a. n.a.
97 Orai MB 16 n.a. 0.5 n.a. n.a.
98 Roorkee MB 12 n.a. n.a. n.a. n.a.
West Bengal
99 Bishnupur M 2 83.0 4.5100 Chakdaha M 2 n.a. n.a. n.a. n.a.
101 Contai M 24 n.a. n.a. n.a. n.a.
102 Cooch Behar M n.a. n.a. n.a. n.a. n.a.
103 Darjeeling M 2 500.0 9.0 300.0 9.0
104 Jalpaiguri M 7 42.0 0.3 n.a. n.a.
105 Jangipur M 1 14.0 0.3 - -
106 Katwa M n.a. n.a. n.a. n.a. n.a.
107 Raniganj M 1 15.0 5.0 - -
Small States
Nagaland
108 Kohima TC 1 Gravity 12.0 - -
Himachal Pradesh
109 Shimla M.Corp. 5 1480.0 13.9 965.0 7.1
Union Teritories
110 Port Balir MCI n.a. n.a. n.a. n.a. n.a.
2 6 1
Sl. City/Town No. of headworks Headwork 1 Headwork 2No. (for surface Total raw Raw water Total raw Raw water
water source) water pumping conveying water pumping conveyinghead (m) main (km) head (m) main (km)
1 2 3 4 5 6
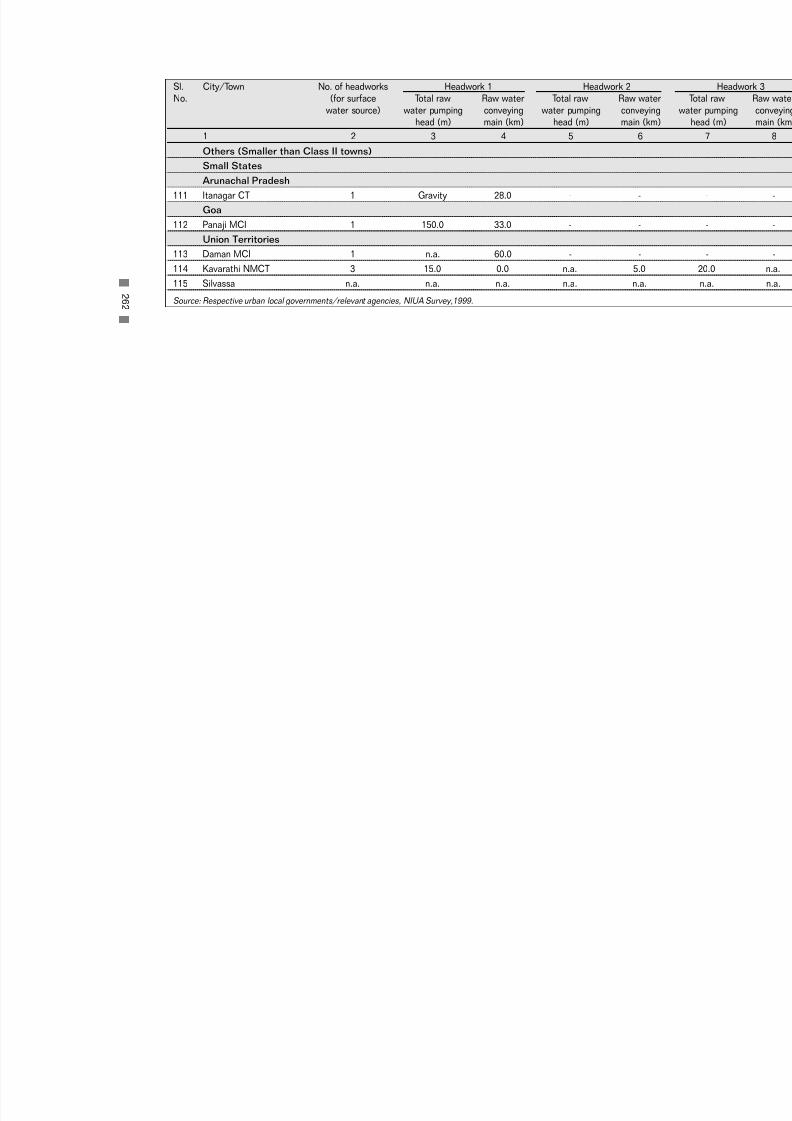
7/21/2019 Status Watersupply
http://slidepdf.com/reader/full/status-watersupply 282/869
2 6 2
Others (Smaller than Class II towns)Small States
Arunachal Pradesh
111 Itanagar CT 1 Gravity 28.0 - -
Goa
112 Panaji MCI 1 150.0 33.0 - -
Union Territories
113 Daman MCI 1 n.a. 60.0 - -
114 Kavarathi NMCT 3 15.0 0.0 n.a. 5.0
115 Silvassa n.a. n.a. n.a. n.a. n.a.
Source: Respective urban local governments/relevant agencies, NIUA Survey,1999.
Sl. City/Town No. of headworks Headwork 1 Headwork 2No. (for surface Total raw Raw water Total raw Raw water
water source) water pumping conveying water pumping conveyinghead (m) main (km) head (m) main (km)
1 2 3 4 5 6

7/21/2019 Status Watersupply
http://slidepdf.com/reader/full/status-watersupply 283/869
A - 7
S O UR C E O
F WA T E R ,1 9 9 9

7/21/2019 Status Watersupply
http://slidepdf.com/reader/full/status-watersupply 284/869

7/21/2019 Status Watersupply
http://slidepdf.com/reader/full/status-watersupply 285/869
Metropolitan Cities
1 Ahmedabad M.Corp. 145 345.0 490.0 30 70 980.0 100.0 1080.0 91
2 Bangalore M.Corp. 706 - 706 100 - 770 - 770 100
3 Bhopal M.Corp. 250 20 270 93 7 355 - 355 100
4 Calcutta M.Corp. 899 136 1035 87 13 - - - -
5 Chennai M.Corp. 440 21 461 95 5 233 - 233 100
6 Coimbatore M.Corp 105 - 105 100 - - - - -
7 Delhi M.Corp. 2320 300 2620 89 11 3650 - 3650 100
8 Greater Mumbai
M.Corp. 2978 - 2978 100 - 2589 - 2589 1009 Hyderabad M.Corp. 682 - 682 100 - 1230 - 1230 100
10 Indore M.Corp. 204 34 238 86 14 920 - 920 100
11 Jaipur M.Corp. 42 298 340 12 88 360 - 360 100
12 Kanpur M.Corp. 310 - 310 100 - 228 14 242 94
13 Kochi M.Corp. 84 - 84 100 - - - - -
14 Lucknow M.Corp. 240 170 410 59 41 - - - -
15 Ludhiana M.Corp. - 234 234 - 100 - 149 149 -
16 Madurai M.Corp. 90 - 90 100 - - - - -
17 Nagpur M.Corp. 370 - 370 100 - 1550 - 1550 100
18 Pune M.Corp. 650 - 650 100 - - - - -
19 Surat M.Corp. 320 - 320 100 - 270 - 270 10020 Vadodara M.Corp. 230 7.0 237 97 3 240 - 240 100
21 Varanasi M.Corp. 220 - 220 100 - - - - -
22 Visakhapatnam M.Corp. 168 - 168 100 - 140 - 140 100
Source: Respective urban local governments/relevant agencies, NIUA Survey,1999.
2 6 5
Sl. City/Town Present source of water supply Future source of water suppl
No. Quantity (mld) obtained % water obtained Quantity (mld) to be % wate
from obtained from obtaSurface Ground Total Surface Ground Surface Ground Total Surface
source source source source source source source
1 2 3 4 5 6 7 8 9 10
A-7 : Source of Water, 1999
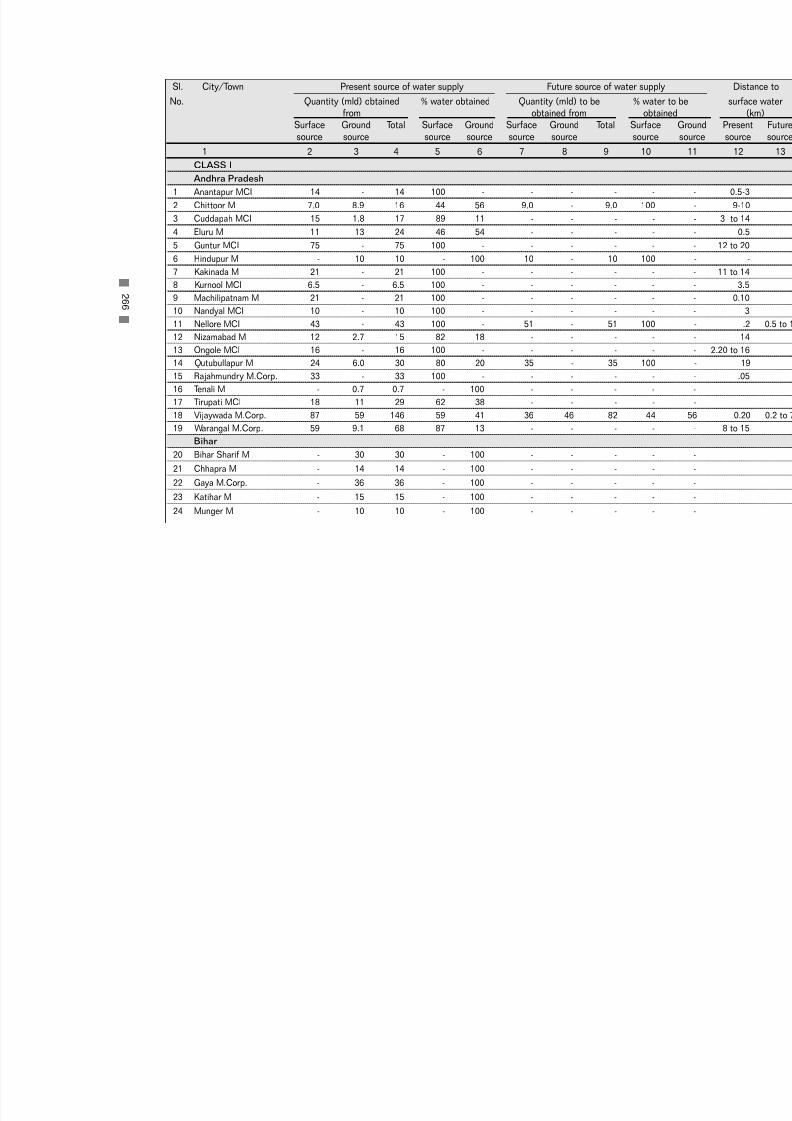
7/21/2019 Status Watersupply
http://slidepdf.com/reader/full/status-watersupply 286/869
CLASS I
Andhra Pradesh
1 Anantapur MCI 14 - 14 100 - - - - -
2 Chittoor M 7.0 8.9 16 44 56 9.0 - 9.0 100
3 Cuddapah MCI 15 1.8 17 89 11 - - - -
4 Eluru M 11 13 24 46 54 - - - -
5 Guntur MCI 75 - 75 100 - - - - -
6 Hindupur M - 10 10 - 100 10 - 10 100
7 Kakinada M 21 - 21 100 - - - - -
8 Kurnool MCI 6.5 - 6.5 100 - - - - -
9 Machilipatnam M 21 - 21 100 - - - - -10 Nandyal MCI 10 - 10 100 - - - - -
11 Nellore MCI 43 - 43 100 - 51 - 51 100
12 Nizamabad M 12 2.7 15 82 18 - - - -
13 Ongole MCI 16 - 16 100 - - - - -
14 Qutubullapur M 24 6.0 30 80 20 35 - 35 100
15 Rajahmundry M.Corp. 33 - 33 100 - - - - -
16 Tenali M - 0.7 0.7 - 100 - - - -
17 Tirupati MCI 18 11 29 62 38 - - - -
18 Vijaywada M.Corp. 87 59 146 59 41 36 46 82 44
19 Warangal M.Corp. 59 9.1 68 87 13 - - - -
Bihar
20 Bihar Sharif M - 30 30 - 100 - - - -
21 Chhapra M - 14 14 - 100 - - - -
22 Gaya M.Corp. - 36 36 - 100 - - - -
23 Katihar M - 15 15 - 100 - - - -
24 Munger M - 10 10 - 100 - - - -
2 6 6
Sl. City/Town Present source of water supply Future source of water suppl
No. Quantity (mld) obtained % water obtained Quantity (mld) to be % watefrom obtained from obta
Surface Ground Total Surface Ground Surface Ground Total Surface
source source source source source source source
1 2 3 4 5 6 7 8 9 10

7/21/2019 Status Watersupply
http://slidepdf.com/reader/full/status-watersupply 287/869
25 Ranchi M.Corp. 91 - 91 100 - 46 36 82 56
Gujarat
26 Anand M - 11 11 - 100 - - - -
27 Bharuch M 16 2.0 18 89 11 - - - -
28 Bhavnagar M.Corp. 70 - 70 100 - - - - -
29 Bhuj M - 16 16 - 100 5.0 - 5.0 100
30 Jamnagar M.Corp. 85 - 85 100 - - - - -
31 Junagadh M - 12 12 - 100 - - - -
32 Nadiad M 10 11 21 48 52 17 - 17 100
33 Navsari M 0 16 16 0 100 30 - 30 100
34 Porbandar M 10 - 10 100 - - - - -35 Rajkot M.Corp. 107 - 107 100 - 40 - 40 100
36 Surendranagar M 5.6 - 5.6 100 - - - - -
Haryana
37 Ambala MCI 10 6.2 16 62 38 - - - -
38 Faridabad M.Corp. - 184 184 - 100 - 45 45 -
39 Gurgaon MCI - 19 19 - 100 16 - 16 100
40 Hisar MCI 25 - 25 100 - - - - -
41 Karnal MCI - 40 40 - 100 - - - -
42 Rohtak MCI 32 - 32 100 - - - - -
Jammu & Kashmir
43 Jammu M.Corp. 41 17 58 70 30 72 5.4 77 93
Karnataka
44 Belgaum M.Corp. 36 - 36 100 - 2.0 - 2.0 -
45 Bellary CMC 31 - 31 100 - - - - -
46 Davangere MCI 27 4.5 32 86 14 4.5 - 4.5 100
47 Gadag-Betigeri CMC 14 2.3 16 86 14 - - - -
2 6 7
Sl. City/Town Present source of water supply Future source of water suppl
No. Quantity (mld) obtained % water obtained Quantity (mld) to be % watefrom obtained from obta
Surface Ground Total Surface Ground Surface Ground Total Surface
source source source source source source source
1 2 3 4 5 6 7 8 9 10
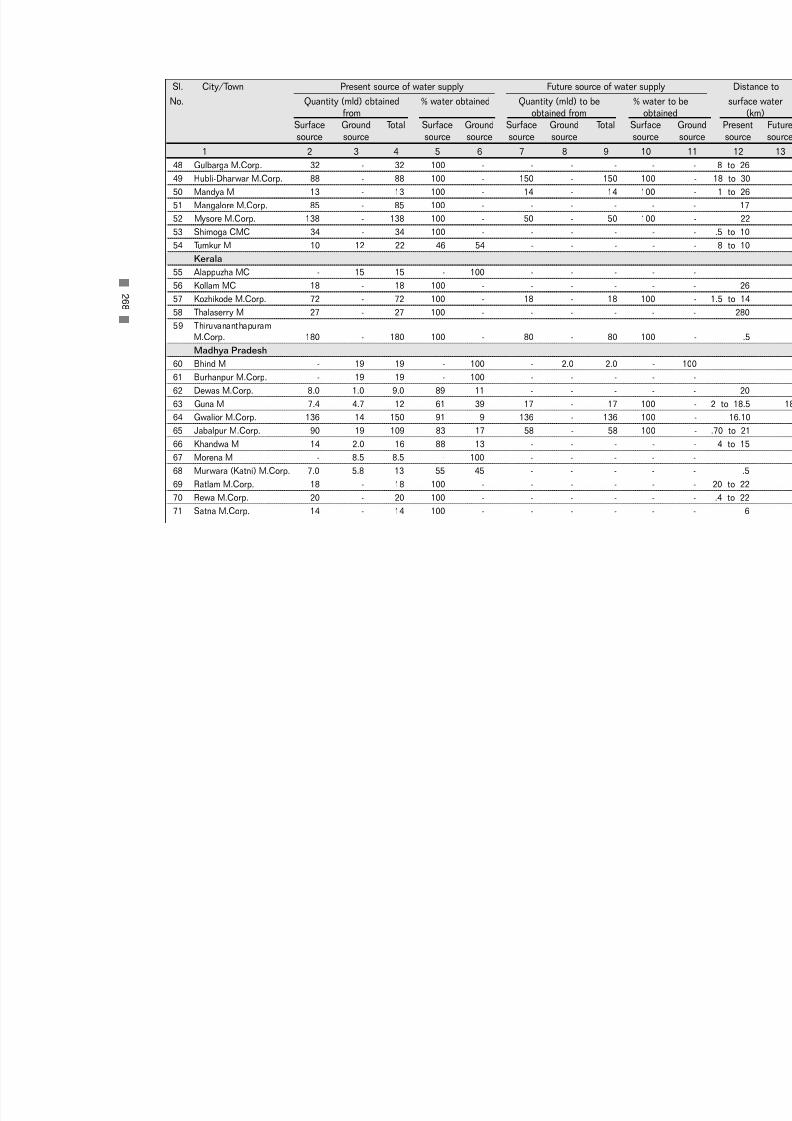
7/21/2019 Status Watersupply
http://slidepdf.com/reader/full/status-watersupply 288/869
48 Gulbarga M.Corp. 32 - 32 100 - - - - -
49 Hubli-Dharwar M.Corp. 88 - 88 100 - 150 - 150 100
50 Mandya M 13 - 13 100 - 14 - 14 100
51 Mangalore M.Corp. 85 - 85 100 - - - - -
52 Mysore M.Corp. 138 - 138 100 - 50 - 50 100
53 Shimoga CMC 34 - 34 100 - - - - -
54 Tumkur M 10 12 22 46 54 - - - -
Kerala
55 Alappuzha MC - 15 15 - 100 - - - -
56 Kollam MC 18 - 18 100 - - - - -
57 Kozhikode M.Corp. 72 - 72 100 - 18 - 18 10058 Thalaserry M 27 - 27 100 - - - - -
59 Thiruvananthapuram
M.Corp. 180 - 180 100 - 80 - 80 100
Madhya Pradesh
60 Bhind M - 19 19 - 100 - 2.0 2.0 -
61 Burhanpur M.Corp. - 19 19 - 100 - - - -
62 Dewas M.Corp. 8.0 1.0 9.0 89 11 - - - -
63 Guna M 7.4 4.7 12 61 39 17 - 17 100
64 Gwalior M.Corp. 136 14 150 91 9 136 - 136 100
65 Jabalpur M.Corp. 90 19 109 83 17 58 - 58 100
66 Khandwa M 14 2.0 16 88 13 - - - -
67 Morena M - 8.5 8.5 - 100 - - - -
68 Murwara (Katni) M.Corp. 7.0 5.8 13 55 45 - - - -
69 Ratlam M.Corp. 18 - 18 100 - - - - -
70 Rewa M.Corp. 20 - 20 100 - - - - -
71 Satna M.Corp. 14 - 14 100 - - - - -
2 6 8
Sl. City/Town Present source of water supply Future source of water suppl
No. Quantity (mld) obtained % water obtained Quantity (mld) to be % watefrom obtained from obta
Surface Ground Total Surface Ground Surface Ground Total Surface
source source source source source source source
1 2 3 4 5 6 7 8 9 10

7/21/2019 Status Watersupply
http://slidepdf.com/reader/full/status-watersupply 289/869
72 Shivpuri M 6.0 7.0 13 46 54 35 - 35 100
Maharashtra
73 Amravati M.Corp. 60 - 60 100 - 156 - 156 100
74 Aurangabad M.Corp. 168 - 168 100 - - - - -
75 Bhusawal MCl 22 - 22 100 - 18 - 18 100
76 Chandrapur MCl 30 - 30 100 - 64 - 64 100
77 Dhule MCl 31 - 31 100 - - - - -
78 Ichalkaranji MCl 32 - 32 100 - 54 - 54 100
79 Jalgaon MCl 56 - 56 100 - 130 - 130 100
80 Kolhapur M.Corp. 85 - 85 100 - 76 - 76 100
81 Nanded Waghala M.Corp. 37 2.0 39 95 5 133 - 133 10082 Nashik M.Corp. 158 - 158 100 - 747 - 747 100
83 Parbhani MCl 15 - 15 100 - 15 - 15 100
84 Solapur M.Corp. 125 - 125 100 - 80 - 80 100
85 Wardha M 12 - 12 100 - - - - -
86 Yavatmal MCl 13 - 13 100 - 13 - 13 100
Orissa
87 Bhubaneswar M.Corp. 114 37 150 76 24 - - - -
88 Cuttack M.Corp. - 146 146 - 100 - - - -
89 Puri M - 24 24 - 100 - 5.5 5.5 -
90 Rourkela M 18 - 18 100 - - - - -
91 Sambalpur M 17 1.1 19 94 6 40 - 40 100
Punjab
92 Amritsar M.Corp. - 127 127 - 100 - 40 40 -
93 Bathinda MCI 17 - 17 100 - - - - -
94 Hoshiarpur MCI - 22 22 - 100 - - - -
95 Jalandhar M.Corp. - 175 175 - 100 - - - -
2 6 9
Sl. City/Town Present source of water supply Future source of water suppl
No. Quantity (mld) obtained % water obtained Quantity (mld) to be % watefrom obtained from obta
Surface Ground Total Surface Ground Surface Ground Total Surface
source source source source source source source
1 2 3 4 5 6 7 8 9 10

7/21/2019 Status Watersupply
http://slidepdf.com/reader/full/status-watersupply 290/869
96 Moga MCI - 20 20 - 100 - 0.9 0.9 -
97 Pathankot MCI - 17 17 - 100 - - - -
98 Patiala M.Corp. - 60 60 - 100 - - - -
Rajasthan
99 Ajmer MCI 46 6.0 52 88 12 - - - -
100 Alwar M - 32 32 - 100 - 26 26 -
101 Beawar M 11 - 11 100 - 13 - 13 100
102 Bhilwara M 12 2.0 14 86 14 40 - 40 100
103 Bikaner M 33 35 68 49 51 60 - 60 100
104 Jodhpur M.Corp. 158 18 176 90 10 140 - 140 100
105 Kota M.Corp. 160 - 160 100 - 208 - 208 100106 Sriganganagar M 20 2.0 22 91 9 - - - -
Tamil Nadu
107 Cuddalore M 3.5 0.8 4.3 82 18 - - - -
108 Dindigul M 12 - 12 100 - - - - -
109 Erode M 22 - 22 100 - - - - -
110 Kanchipuram M 16 - 16 100 - - - - -
111 Kumbakonam M 11 - 11 100 - - - - -
112 Nagercoil M 9.0 - 9.0 100 - - - - -
113 Rajapalayam M 8.8 - 8.8 100 - 1.3 - 1.3 100
114 Salem M.Corp. 50 - 50 100 - - - - -
115 Thanjavur M 24 - 24 100 - - - - -116 Tiruchirapalli M.Corp. - 88 88 - 100 20 - 20 100
117 Tirunelveli M.Corp. 34 - 34 100 - 7.7 - 7.7 100
118 Tirunvannamalai M 14 - 14 100 - - - - -
119 Tiruppur M 29 - 29 100 - 49 - 49 100
120 Tuticorin M 16 - 16 100 - 6.0 - 6.0 100
2 7 0
Sl. City/Town Present source of water supply Future source of water suppl
No. Quantity (mld) obtained % water obtained Quantity (mld) to be % watefrom obtained from obta
Surface Ground Total Surface Ground Surface Ground Total Surface
source source source source source source source
1 2 3 4 5 6 7 8 9 10

7/21/2019 Status Watersupply
http://slidepdf.com/reader/full/status-watersupply 291/869
121 Vellore M 13 - 13 100 - 10 - 10 100
Uttar Pradesh
122 Agra M.Corp. 250 - 250 100 - - - - -
123 Aligarh M.Corp. - 47 47 - 100 - 12 12 -
124 Allahabad M.Corp. 90 120 210 43 57 - - - -
125 Bareilly M.Corp. - 80 80 - 100 - 55 55 -
126 Etawah MB - 20 20 - 100 - - - -
127 Faizabad MB - 22 22 - 100 - - - -
128 Firozabad MB - 12 12 - 100 - - - -
129 Ghaziabad M.Corp. - 110 110 - 100 - 4.0 4.0 -
130 Gorakhpur M.Corp. - 74 74 - 100 - - - -
131 Haldwani-cum-
Kathgodam MB 19 - 19 100 - - - - -
132 Hapur MB - 14 14 - 100 - - - -
133 Hardwar MB - 39 39 - 100 - - - -
134 Jhansi MB 68 9.2 77 88 12 - - - -
135 Mathura MB - 27 27 - 100 101 - 101 100
136 Meerut M.Corp. - 132 132 - 100 - - - -
137 Mirzapur MB 8.0 17 25 32 68 - - - -
138 Moradabad M.Corp. 48 - 48 100 - - - - -
139 Muzaffarnagar MB - 46 46 - 100 - - - -
140 Rae Bareli MB - 13 13 - 100 - - - -
141 Rampur MB - 20 20 - 100 - 2.8 2.8 -142 Saharanpur MB - 49 49 - 100 - 7.2 7.2 -
143 Sitapur MB - 17 17 - 100 - - - -
144 Unnao MB - 21 21 - 100 - - - -
West Bengal -
145 Asansol M.Corp. 52 - 52 100 - 60 - 60 100
2 7 1
Sl. City/Town Present source of water supply Future source of water suppl
No. Quantity (mld) obtained % water obtained Quantity (mld) to be % watefrom obtained from obta
Surface Ground Total Surface Ground Surface Ground Total Surface
source source source source source source source
1 2 3 4 5 6 7 8 9 10

7/21/2019 Status Watersupply
http://slidepdf.com/reader/full/status-watersupply 292/869
146 Baharampur M 7.3 7.6 15 49 51 - 675 675 -
147 Balurghat M - 0.9 0.9 - 100 - - - -
148 Bankura M - 11 11 - 100 - 3.8 3.8 -
149 Barasat M - 12 12 - 100 - - - -
150 Burdwan M - 24 24 - 100 - 7.2 7.2 -
151 Halisahar M - 20 20 - 100 0.3 - 0.3 100
152 Krishnagar M 0.8 5.2 6.0 13 87 - 5.9 5.9 -
153 Midnapore M - 15 15 - 100 - - - -
154 North Barrackpore M - 14 14 - 100 - 2.9 2.9 -
155 Santipur M - 0.9 0.9 - 100 - - - -
156 Silliguri M.Corp. 18 - 18 100 - 60 - 60 100Small States
Assam
157 Guwahati M.Corp. 50 5.0 55 91 9 276 - 276 100
158 Jorhat MB n.a. n.a. n.a. n.a. n.a. - - - -
Manipur
159 Imphal MCI 47 12 58 80 20 - - - -
Meghalaya
160 Shillong MB 27 - 27 100 - - - - -
Mizoram
161 Aizwal NM 11 - 11 100 - 37 - 37 100
Tripura
162 Agartala MCI 14 8.2 22 63 38 18 - 18 100
Union Territories
163 Chandigarh M.Corp. 182 45 227 80 20 - - - -
164 Pondicherry M - 33 33 - 100 - - - -
Source: Respective urban local governments/relevant agencies, NIUA Survey,1999.
2 7 2
Sl. City/Town Present source of water supply Future source of water suppl
No. Quantity (mld) obtained % water obtained Quantity (mld) to be % watefrom obtained from obta
Surface Ground Total Surface Ground Surface Ground Total Surface
source source source source source source source
1 2 3 4 5 6 7 8 9 10

7/21/2019 Status Watersupply
http://slidepdf.com/reader/full/status-watersupply 293/869
CLASS II
Andhra Pradesh
1 Anakapalle M 3.6 - 3.6 100 - 3.0 - 3.0 100
2 Dharmavaram M - 7.9 7.9 - 100 - 0.6 0.6 -
3 Gudur MCI - 7.1 7.1 - 100 - - - -
4 Kapra M 4.6 - 4.6 100 - 4.2 - 4.2 100
5 Kavali MCI - 5.0 5.0 - 100 - - - -
6 Madanapalle M 2.3 5.5 7.7 29 71 12 - 12 100
7 Narasaraopet M 4.5 - 4.5 100 - 7.0 - 7.0 100
8 Rajendra nagar MCI - 5.1 5.1 - 100 3.0 - 3.0 100
9 Sangareddy MCI 2.7 1.1 3.9 70 30 6.8 - 6.8 100
10 Srikakulam MCI 4.8 2.0 6.8 70 30 8.0 - 8.0 100
11 Srikalahasti M 6.8 - 6.8 100 - 4.1 - 4.1 100
12 Suryapet MCI 4.5 3.0 7.6 60 40 17 - 17 100
Bihar
13 Buxar M - 3.9 3.9 - 100 - 0.3 0.3 -
14 Deoghar M - 3.0 3.0 - 100 - - - -
15 Hajipur M - 11 11 - 100 - - - -
16 Hazaribagh M 7.3 - 7.3 100 - - - - -
17 Jehanabad M 8.0 - 8.0 100 - - - - -
18 Madhubani M - 8.0 8.0 - 100 - - - -
19 Mokama M - 2.0 2.0 - 100 - - - -
Gujarat
20 Amreli M 10 - 10 100 - 18 - 18 100
21 Ankleswar M 10 - 10 100 - 10 - 10 100
22 Dabhoi M - 9.0 9.0 - 100 1.9 - 1.9 100
2 7 3
Sl. City/Town Present source of water supply Future source of water suppl
No. Quantity (mld) obtained % water obtained Quantity (mld) to be % watefrom obtained from obta
Surface Ground Total Surface Ground Surface Ground Total Surface
source source source source source source source
1 2 3 4 5 6 7 8 9 10

7/21/2019 Status Watersupply
http://slidepdf.com/reader/full/status-watersupply 294/869
23 Dohad M 7.5 - 7.5 100 - 1.7 - 1.7 100
24 Gondal M 13 - 13 100 - 4.0 - 4.0 100
25 Jetpur M 11 - 11 100 - - - - -
26 Mahesana M - 15 15 - 100 - - - -
27 Palanpur M - 4.0 4.0 - 100 - - - -
Haryana
28 Jind MCI - 16 16 - 100 - - - -
29 Kaithal MCI - 11 11 - 100 102 - 102 100
30 Rewari MCI 6.8 4.5 11 60 40 - - - -
31 Thanesar MCI - 13 13 - 100 - - - -
Karnataka
32 Bagalkot CMC 9.0 3.2 12 74 26 - - - -
33 Chikmaglur CMC 6.0 9.0 15 40 60 - - - -
34 Gokak CMC 4.6 - 4.6 100 - - - - -
35 Hospet CMC 16 - 16 100 - 45 - 45 100
36 Kolar CMC 4.0 4.0 8.0 50 50 0.1 0.1 0.2 50
37 Rabkavi-Banhatti CMC 4.5 - 4.5 100 - 14 - 14 100
38 Ramanagaram CMC 3.2 1.3 4.5 71 29 15 - 15 100
Kerala
39 Changanessary MC 4.0 - 4.0 100 - - - - -
40 Payyanur M - 1.5 1.5 - 100 - - - -
41 Taliparamba M - 0.4 0.4 - 100 - - - -
42 Thrissur MC 18 - 18 100 - - - - -
Madhya Pradesh
43 Hoshangabad M - 8.1 8.1 - 100 - - - -
44 Itarsi M - 5.9 5.9 - 100 - - - -
2 7 4
Sl. City/Town Present source of water supply Future source of water suppl
No. Quantity (mld) obtained % water obtained Quantity (mld) to be % watefrom obtained from obta
Surface Ground Total Surface Ground Surface Ground Total Surface
source source source source source source source
1 2 3 4 5 6 7 8 9 10

7/21/2019 Status Watersupply
http://slidepdf.com/reader/full/status-watersupply 295/869
45 Khargone M 12 1.0 13 92 8 - - - -
46 Mandsaur M 9.0 - 9.0 100 - 991 - 991 100
47 Nagda M 2.3 0.8 3.0 75 25 16 - 16 100
48 Neemuch M 5.0 0.9 5.9 85 15 - - - -
49 Sehore M 5.3 - 5.3 100 - 7.5 - 7.5 100
50 Shahdol M 4.7 - 4.7 100 - 8.8 - 8.8 100
51 Vidisha M 9.0 - 9.0 100 - 9.0 - 9.0 100
Maharashtra
52 Amalner MCl 10 5.0 15 67 33 - - - -
53 Ballarpur MCl 6.9 0.1 7.0 99 1 30 0.2 30 100
54 Bhandara M 9.0 - 9.0 100 - 18 - 18 100
55 Kamptee MCl n.a. - n. app. n.a. - 10 - 10 100
56 Manmad MCl 7.2 - 7.2 100 - 20 - 20 100
57 Ratnagiri MCl 8.0 - 8.0 100 - - - - -
58 Satara MCl 11 - 11 100 - - - - -
59 Virar MCl 9.0 - 9.0 100 - 20 - 20 100
Orissa
60 Balangir M 7.2 - 7.2 100 - - - - -
61 Bhadrak M - 3.0 3.0 - 100 - - - -
Punjab
62 Firozpur MCI - 20 20 - 100 - - - -
63 Kapurthala M - 14 14 - 100 - - - -
64 Mansa MCI 8.0 - 8.0 100 - - - - -
65 Phagwara MCI - 15 15 - 100 - - - -
66 Sangrur MCI - 13 13 - 100 - - - -
2 7 5
Sl. City/Town Present source of water supply Future source of water suppl
No. Quantity (mld) obtained % water obtained Quantity (mld) to be % watefrom obtained from obta
Surface Ground Total Surface Ground Surface Ground Total Surface
source source source source source source source
1 2 3 4 5 6 7 8 9 10
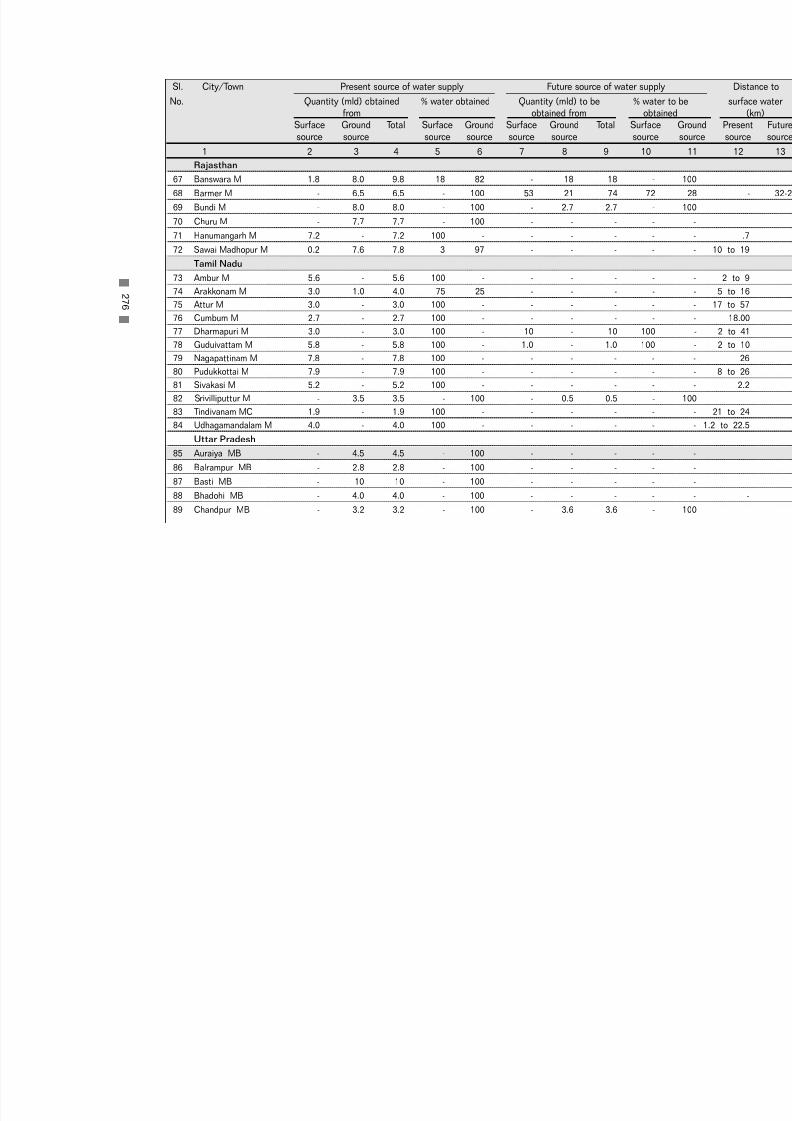
7/21/2019 Status Watersupply
http://slidepdf.com/reader/full/status-watersupply 296/869
Rajasthan
67 Banswara M 1.8 8.0 9.8 18 82 - 18 18 -
68 Barmer M - 6.5 6.5 - 100 53 21 74 72
69 Bundi M - 8.0 8.0 - 100 - 2.7 2.7 -
70 Churu M - 7.7 7.7 - 100 - - - -
71 Hanumangarh M 7.2 - 7.2 100 - - - - -
72 Sawai Madhopur M 0.2 7.6 7.8 3 97 - - - -
Tamil Nadu
73 Ambur M 5.6 - 5.6 100 - - - - -
74 Arakkonam M 3.0 1.0 4.0 75 25 - - - -
75 Attur M 3.0 - 3.0 100 - - - - -
76 Cumbum M 2.7 - 2.7 100 - - - - -
77 Dharmapuri M 3.0 - 3.0 100 - 10 - 10 100
78 Guduivattam M 5.8 - 5.8 100 - 1.0 - 1.0 100
79 Nagapattinam M 7.8 - 7.8 100 - - - - -
80 Pudukkottai M 7.9 - 7.9 100 - - - - -
81 Sivakasi M 5.2 - 5.2 100 - - - - -
82 Srivilliputtur M - 3.5 3.5 - 100 - 0.5 0.5 -
83 Tindivanam MC 1.9 - 1.9 100 - - - - -
84 Udhagamandalam M 4.0 - 4.0 100 - - - - -
Uttar Pradesh
85 Auraiya MB - 4.5 4.5 - 100 - - - -
86 Balrampur MB - 2.8 2.8 - 100 - - - -
87 Basti MB - 10 10 - 100 - - - -
88 Bhadohi MB - 4.0 4.0 - 100 - - - -
89 Chandpur MB - 3.2 3.2 - 100 - 3.6 3.6 -
2 7 6
Sl. City/Town Present source of water supply Future source of water suppl
No. Quantity (mld) obtained % water obtained Quantity (mld) to be % watefrom obtained from obta
Surface Ground Total Surface Ground Surface Ground Total Surface
source source source source source source source
1 2 3 4 5 6 7 8 9 10
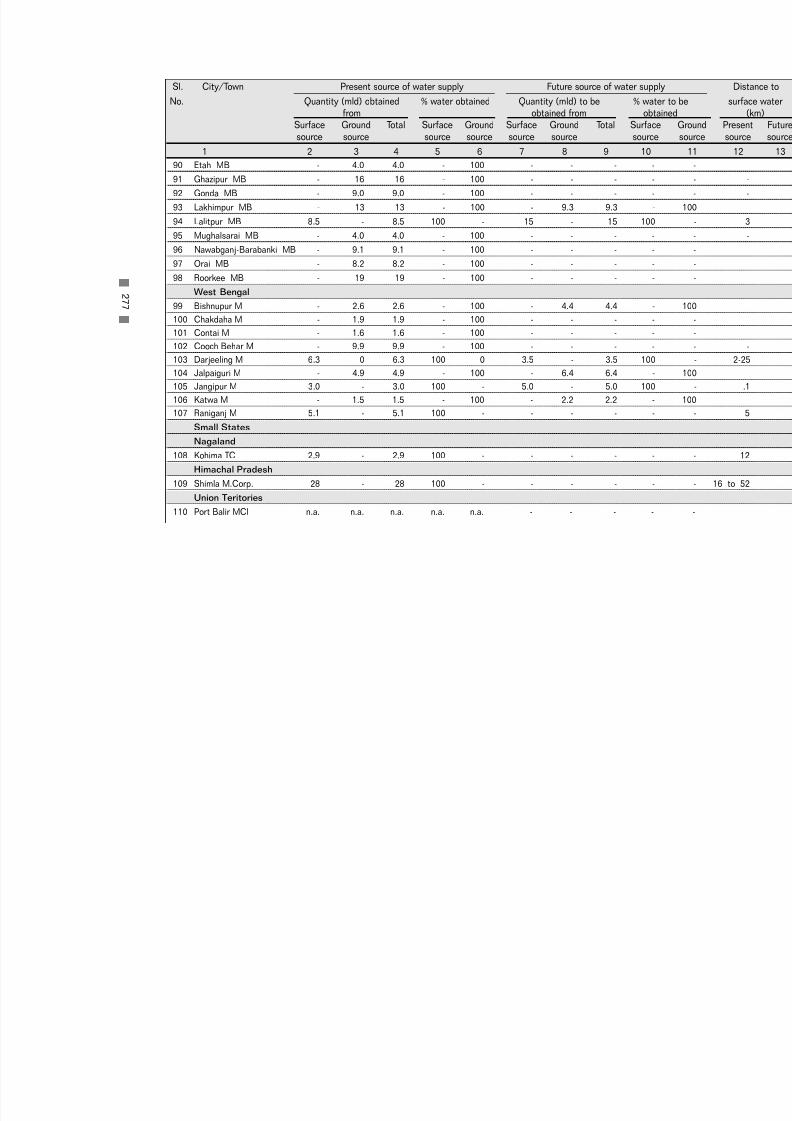
7/21/2019 Status Watersupply
http://slidepdf.com/reader/full/status-watersupply 297/869
90 Etah MB - 4.0 4.0 - 100 - - - -
91 Ghazipur MB - 16 16 - 100 - - - -
92 Gonda MB - 9.0 9.0 - 100 - - - -
93 Lakhimpur MB - 13 13 - 100 - 9.3 9.3 -
94 Lalitpur MB 8.5 - 8.5 100 - 15 - 15 100
95 Mughalsarai MB - 4.0 4.0 - 100 - - - -
96 Nawabganj-Barabanki MB - 9.1 9.1 - 100 - - - -
97 Orai MB - 8.2 8.2 - 100 - - - -
98 Roorkee MB - 19 19 - 100 - - - -
West Bengal
99 Bishnupur M - 2.6 2.6 - 100 - 4.4 4.4 -
100 Chakdaha M - 1.9 1.9 - 100 - - - -
101 Contai M - 1.6 1.6 - 100 - - - -
102 Cooch Behar M - 9.9 9.9 - 100 - - - -
103 Darjeeling M 6.3 0 6.3 100 0 3.5 - 3.5 100
104 Jalpaiguri M - 4.9 4.9 - 100 - 6.4 6.4 -
105 Jangipur M 3.0 - 3.0 100 - 5.0 - 5.0 100
106 Katwa M - 1.5 1.5 - 100 - 2.2 2.2 -
107 Raniganj M 5.1 - 5.1 100 - - - - -
Small States
Nagaland
108 Kohima TC 2.9 - 2.9 100 - - - - -
Himachal Pradesh
109 Shimla M.Corp. 28 - 28 100 - - - - -
Union Teritories
110 Port Balir MCI n.a. n.a. n.a. n.a. n.a. - - - -
2 7 7
Sl. City/Town Present source of water supply Future source of water suppl
No. Quantity (mld) obtained % water obtained Quantity (mld) to be % watefrom obtained from obta
Surface Ground Total Surface Ground Surface Ground Total Surface
source source source source source source source
1 2 3 4 5 6 7 8 9 10

7/21/2019 Status Watersupply
http://slidepdf.com/reader/full/status-watersupply 298/869
Others (Smaller than Class II towns)
Small States
Arunachal Pradesh
111 Itanagar CT 5.5 - 5.5 100 - - - - -
Goa
112 Panaji MCI 12 - 12 100 - - - - -
Union Territories
113 Daman MCI 8.0 - 8.0 100 - - - - -
114 Kavarathi NMCT - - 0 - - 0.4 0.2 0.6 67
115 Silvassa - 1.4 1.4 - 100 - 1.7 1.7 -
Source: Respective urban local governments/relevant agencies, NIUA Survey,1999.
2 7 8
Sl. City/Town Present source of water supply Future source of water suppl
No. Quantity (mld) obtained % water obtained Quantity (mld) to be % watefrom obtained from obta
Surface Ground Total Surface Ground Surface Ground Total Surface
source source source source source source source
1 2 3 4 5 6 7 8 9 10
7/21/2019 Status Watersupply
http://slidepdf.com/reader/full/status-watersupply 299/869
A - 8
L E N
GT H OF DI S T R I B
UT I O N NE T W OR K A ND
WA T E R S T OR A G
E C A P A C I T Y ,1 9
9 9

7/21/2019 Status Watersupply
http://slidepdf.com/reader/full/status-watersupply 300/869

7/21/2019 Status Watersupply
http://slidepdf.com/reader/full/status-watersupply 301/869
Metropolitan Cities1 Ahmedabad M.Corp. 2351 12 91 423
2 Bangalore M.Corp. n.a. n.a. 95 653
3 Bhopal M.Corp. 2800 11 42 n.a.
4 Calcutta M.Corp. 4110 22 9 291
5 Chennai M.Corp. 1795 10 n.a. n.a.
6 Coimbatore M.Corp 557 5 27 28
7 Delhi M.Corp. 7906 5 67 730
8 Greater Mumbai M.Corp. 4000 9 26 808
9 Hyderabad M.Corp. 1936 11 122 n.a.
10 Indore M.Corp. 1200 9 22 60
11 Jaipur M.Corp. 3000 15 90 122
12 Kanpur M.Corp. 1315 25 33 39
13 Kochi M.Corp. 750 8 17 42
14 Lucknow M.Corp. 1800 8 38 178
15 Ludhiana M.Corp. 840 12 46 102
16 Madurai M.Corp. 423 8 27 n.a.
17 Nagpur M.Corp. 1000 5 28 125
18 Pune M.Corp. 2000 5 35 212
19 Surat M.Corp. 1814 16 24 n.a.20 Vadodara M.Corp. 375 3 18 126
21 Varanasi M.Corp. 516 10 24 80
22 Visakhapatnam M.Corp. 845 8 44 44
Source: Respective urban local governments/relevant agencies, NIUA Survey, 1999.
2 8 1
Sl. City/Town Length of Distribution Length No. of storage Storage caNo. Network (km.) per sq.km. reservoirs (million lit
1 2 3 4 5
A-8 : Length of Distribution Network and Water Storage Capacity, 1999

7/21/2019 Status Watersupply
http://slidepdf.com/reader/full/status-watersupply 302/869
CLASS I
Andhra Pradesh
1 Anantapur MCI 161 10 8 2.3
2 Chittoor M 25 1 1 1.1
3 Cuddapah MCI 13 2 8 16.8
4 Eluru M 18 1 8 16.5
5 Guntur MCI 83 2 21 74.9
6 Hindupur M 24 1 46 4.8
7 Kakinada M 80 3 8 8.5
8 Kurnool MCI n.a. n.a. 11 3.2
9 Machilipatnam M 47 2 5 4.5
10 Nandyal MCI n.a. n.a. 3 1.6
11 Nellore MCI n.a. n.a. 19 15.2
12 Nizamabad M n.a. n.a. 8 n.a.
13 Ongole MCI 57 2 5 5.2
14 Qutubullapur M 91 3 1 0.9
15 Rajahmundry M.Corp. 280 6 12 32.7
16 Tenali M 6 2 1 0.7
17 Tirupati MCI 22 1 n.a. n.a.
18 Vijaywada M.Corp. 350 6 29 23.2
19 Warangal M.Corp. 220 3 16 4.8
Bihar
20 Bihar Sharif M 130 10 6 11.021 Chhapra M 63 8 6 0.8
22 Gaya M.Corp. 110 6 7 13.0
23 Katihar M 79 7 3 3.8
24 Munger M 105 9 4 55.0
2 8 2
Sl. City/Town Length of Distribution Length No. of storage Storage caNo. Network (km.) per sq.km. reservoirs (million lit
1 2 3 4 5

7/21/2019 Status Watersupply
http://slidepdf.com/reader/full/status-watersupply 303/869
25 Ranchi M.Corp. 381 2 7 n.a.
Gujarat
26 Anand M 110 5 8 8.6
27 Bharuch M 93 5 5 6.0
28 Bhavnagar M.Corp. 500 9 9 30.0
29 Bhuj M 70 7 6 5.0
30 Jamnagar M.Corp. n.a. n.a. 4 218.0
31 Junagadh M 80 3 - n.a.
32 Nadiad M 85 3 7 9.6
33 Navsari M n.a. n.a. 8 11.0
34 Porbandar M 144 12 7 5.0
35 Rajkot M.Corp. 700 7 21 65.0
36 Surendranagar M 350 9 2 n.a.
Haryana
37 Ambala MCI 177 14 11 11.6
38 Faridabad M.Corp. 858 4 13 25.2
39 Gurgaon MCI 106 8 11 6.8
40 Hisar MCI 220 7 11 10.7
41 Karnal MCI 134 10 8 6.7
42 Rohtak MCI 125 7 6 8.0
Jammu & Kashmir
43 Jammu M.Corp. 231 2 26 n.a.
Karnataka44 Belgaum M.Corp. 220 n.a. n.a. 8.0
45 Bellary CMC 320 4 14 15.5
46 Davangere MCI 200 0 1 n.a.
47 Gadag-Betigeri CMC 123 2 2 1.4
2 8 3
Sl. City/Town Length of Distribution Length No. of storage Storage caNo. Network (km.) per sq.km. reservoirs (million lit
1 2 3 4 5
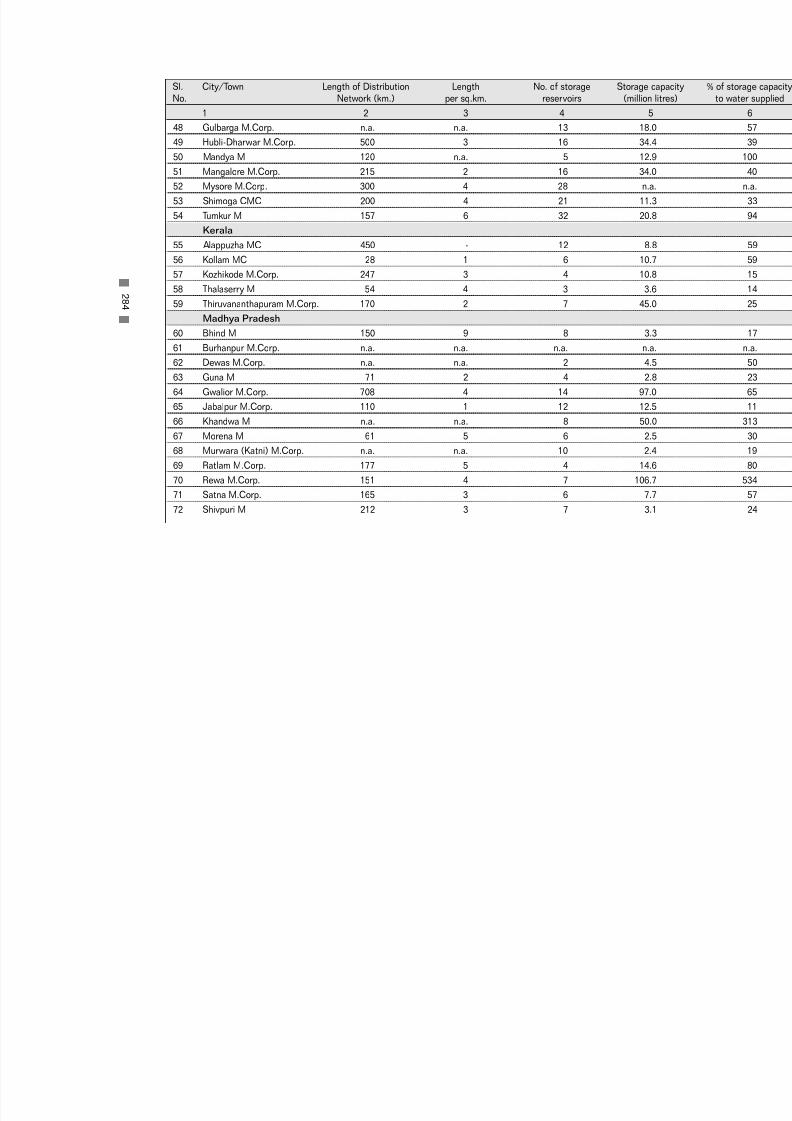
7/21/2019 Status Watersupply
http://slidepdf.com/reader/full/status-watersupply 304/869
48 Gulbarga M.Corp. n.a. n.a. 13 18.0
49 Hubli-Dharwar M.Corp. 500 3 16 34.4
50 Mandya M 120 n.a. 5 12.9
51 Mangalore M.Corp. 215 2 16 34.0
52 Mysore M.Corp. 300 4 28 n.a.
53 Shimoga CMC 200 4 21 11.3
54 Tumkur M 157 6 32 20.8
Kerala
55 Alappuzha MC 450 - 12 8.8
56 Kollam MC 28 1 6 10.7
57 Kozhikode M.Corp. 247 3 4 10.8
58 Thalaserry M 54 4 3 3.6
59 Thiruvananthapuram M.Corp. 170 2 7 45.0
Madhya Pradesh
60 Bhind M 150 9 8 3.3
61 Burhanpur M.Corp. n.a. n.a. n.a. n.a.
62 Dewas M.Corp. n.a. n.a. 2 4.5
63 Guna M 71 2 4 2.8
64 Gwalior M.Corp. 708 4 14 97.0
65 Jabalpur M.Corp. 110 1 12 12.5
66 Khandwa M n.a. n.a. 8 50.0
67 Morena M 61 5 6 2.5
68 Murwara (Katni) M.Corp. n.a. n.a. 10 2.469 Ratlam M.Corp. 177 5 4 14.6
70 Rewa M.Corp. 151 4 7 106.7
71 Satna M.Corp. 165 3 6 7.7
72 Shivpuri M 212 3 7 3.1
2 8 4
Sl. City/Town Length of Distribution Length No. of storage Storage caNo. Network (km.) per sq.km. reservoirs (million lit
1 2 3 4 5

7/21/2019 Status Watersupply
http://slidepdf.com/reader/full/status-watersupply 305/869
Maharashtra
73 Amravati M.Corp. 380 3 7 17.6
74 Aurangabad M.Corp. 500 4 19 48.0
75 Bhusawal MCl 80 8 4 4.6
76 Chandrapur MCl 116 3 5 9.7
77 Dhule MCl 45 - 13 19.1
78 Ichalkaranji MCl 69 2 5 32.0
79 Jalgaon MCl 140 2 12 18.0
80 Kolhapur M.Corp. 300 5 14 28.1
81 Nanded Waghala M.Corp. 425 9 7 108.5
82 Nashik M.Corp. 600 2 51 67.2
83 Parbhani MCl 300 5 5 13.7
84 Solapur M.Corp. 208 n.a. 21 75.0
85 Wardha M 125 14 7 12.3
86 Yavatmal MCl 187 - 3 6.1
Orissa
87 Bhubaneswar M.Corp. 578 2 105 48.1
88 Cuttack M.Corp. 266 n.a. 16 4.9
89 Puri M 250 23 4 3.2
90 Rourkela M 96 n.a. 9 10.0
91 Sambalpur M 36 1 15 36.0
Punjab
92 Amritsar M.Corp. 750 9 28 22.393 Bathinda MCI 195 n.a. 2 4.5
94 Hoshiarpur MCI 149 6 7 4.5
95 Jalandhar M.Corp. 573 5 22 18.1
96 Moga MCI 90 7 7 3.1
2 8 5
Sl. City/Town Length of Distribution Length No. of storage Storage caNo. Network (km.) per sq.km. reservoirs (million lit
1 2 3 4 5

7/21/2019 Status Watersupply
http://slidepdf.com/reader/full/status-watersupply 306/869
97 Pathankot MCI 172 8 6 5.5
98 Patiala M.Corp. 280 14 14 12.2
Rajasthan
99 Ajmer MCI 355 2 31 30.0
100 Alwar M 250 4 33 14.0
101 Beawar M 110 6 14 4.1
102 Bhilwara M 450 7 7 4.7
103 Bikaner M 1160 7 36 26.4
104 Jodhpur M.Corp. 1200 16 23 50.8
105 Kota M.Corp. 350 2 30 39.6
106 Sriganganagar M 227 - - 94.3
Tamil Nadu
107 Cuddalore M 74 3 4 2.7
108 Dindigul M 43 3 8 10.2
109 Erode M 164 19 7 10.5
110 Kanchipuram M 120 10 8 10.6
111 Kumbakonam M 101 8 2 9.0
112 Nagercoil M 14 1 3 2.4
113 Rajapalayam M 44 4 3 3.0
114 Salem M.Corp. 274 3 18 16.5
115 Thanjavur M 240 7 13 9.2
116 Tiruchirapalli M.Corp. 350 2 9 0.5
117 Tirunelveli M.Corp. 228 2 22 17.0118 Tirunvannamalai M 72 5 8 6.6
119 Tiruppur M 315 12 11 10.8
120 Tuticorin M 118 9 3 4.3
121 Vellore M 25 2 5 7.4
2 8 6
Sl. City/Town Length of Distribution Length No. of storage Storage caNo. Network (km.) per sq.km. reservoirs (million lit
1 2 3 4 5

7/21/2019 Status Watersupply
http://slidepdf.com/reader/full/status-watersupply 307/869
Uttar Pradesh
122 Agra M.Corp. 187 3 6 30.0
123 Aligarh M.Corp. 370 6 15 n.a.
124 Allahabad M.Corp. 1050 20 16 152.0
125 Bareilly M.Corp. 492 6 18 18.8
126 Etawah MB 160 5 9 6.8
127 Faizabad MB 100 6 5 0.6
128 Firozabad MB 81 2 6 4.6
129 Ghaziabad M.Corp. 650 3 31 42.6
130 Gorakhpur M.Corp. 570 5 12 9.2
131 Haldwani-cum-Kathgodam MB 34 3 7 3.9
132 Hapur MB 100 10 5 3.7
133 Hardwar MB 132 18 7 9.9
134 Jhansi MB 200 8 7 15.0
135 Mathura MB 120 n.a. 17 6.1
136 Meerut M.Corp. 532 4 21 34.0
137 Mirzapur MB 250 13 7 8.3
138 Moradabad M.Corp. 89 2 9 11.3
139 Muzaffarnagar MB 345 36 4 4.2
140 Rae Bareli MB 180 7 11 8.7
141 Rampur MB 63 2 6 2.2
142 Saharanpur MB 1395 n.a. 8 7.1
143 Sitapur MB 120 5 6 6.6144 Unnao MB 71 3 6 1.9
West Bengal
145 Asansol M.Corp. 2740 n.a. 10 15.0
146 Baharampur M 348 22 3 15.0
2 8 7
Sl. City/Town Length of Distribution Length No. of storage Storage caNo. Network (km.) per sq.km. reservoirs (million lit
1 2 3 4 5

7/21/2019 Status Watersupply
http://slidepdf.com/reader/full/status-watersupply 308/869
147 Balurghat M 30 4 2 0.9
148 Bankura M 400 32 7 2.0
149 Barasat M 130 12 3 0.8
150 Burdwan M 225 9 6 1.1
151 Halisahar M 135 16 5 2.1
152 Krishnagar M 100 10 4 1.1
153 Midnapore M 320 17 4 1.4
154 North Barrackpore M 110 9 4 1.1
155 Santipur M 43 5 2 0.9
156 Silliguri M.Corp. 60 1 3 1.5
Small States
Assam
157 Guwahati M.Corp. 425 5 28 17.0
158 Jorhat MB n.a. n.a. n.a. n.a.
Manipur
159 Imphal MCI 363 3 2 30.2
Meghalaya
160 Shillong MB 172 17 9 11.0
Mizoram
161 Aizwal NM 1128 26 16 10.8
Tripura
162 Agartala MCI 175 11 13 5.0
Union Territories163 Chandigarh M.Corp. n.a. n.a. 33 159.0
164 Pondicherry M 54 3 8 0.9
Source: Respective urban local governments/relevant agencies, NIUA Survey,1999.
2 8 8
Sl. City/Town Length of Distribution Length No. of storage Storage caNo. Network (km.) per sq.km. reservoirs (million lit
1 2 3 4 5

7/21/2019 Status Watersupply
http://slidepdf.com/reader/full/status-watersupply 309/869
CLASS II
Andhra Pradesh
1 Anakapalle M 14 1 2 1.4
2 Dharmavaram M n.a. n.a. 5 0.4
3 Gudur MCI 21 2 6 3.9
4 Kapra M 112 2 5 7.3
5 Kavali MCI n.a. n.a. 2 0.9
6 Madanapalle M 132 15 5 4.0
7 Narasaraopet M 50 7 4 3.8
8 Rajendra nagar MCI 36 1 5 2.3
9 Sangareddy MCI 14 1 2 2.0
10 Srikakulam MCI 34 2 3 2.9
11 Srikalahasti M 22 2 7 9.012 Suryapet MCI 56 3 2 2.3
Bihar
13 Buxar M 54 6 n.a. 0.7
14 Deoghar M 46 n.a. 1 1.5
15 Hajipur M 8 1 1 0.2
16 Hazaribagh M 72 4 4 18.2
17 Jehanabad M 76 11 4 5.0
18 Madhubani M 113 9 6 11.1
19 Mokama M n.a. n.a. 2 n.a.
Gujarat
20 Amreli M n.a. n.a. 3 4.0
21 Ankleswar M 19 2 - n.a.
22 Dabhoi M 18 1 5 5.0
23 Dohad M 70 10 3 1.5
24 Gondal M 67 6 7 4.0
2 8 9
Sl. City/Town Length of Distribution Length No. of storage Storage caNo. Network (km.) per sq.km. reservoirs (million lit
1 2 3 4 5

7/21/2019 Status Watersupply
http://slidepdf.com/reader/full/status-watersupply 310/869
25 Jetpur M 75 2 3 6.9
26 Mahesana M 107 8 3 7.5
27 Palanpur M n.a. n.a. 6 4.6
Haryana
28 Jind MCI 102 6 5 1.2
29 Kaithal MCI 67 13 3 0.4
30 Rewari MCI 200 11 1 0.5
31 Thanesar MCI 40 1 3 1.5
Karnataka
32 Bagalkot CMC 80 2 1 2.3
33 Chikmaglur CMC 28 1 14 1.4
34 Gokak CMC 20 1 1 0.1
35 Hospet CMC 80 2 2 1.8
36 Kolar CMC 40 2 13 3.0
37 Rabkavi-Banhatti CMC 48 4 1 2.3
38 Ramanagaram CMC 17 1 7 6.8
Kerala
39 Changanessary MC 125 9.3 2 3.9
40 Payyanur M 17 0.3 1 0.1
41 Taliparamba M 24 1 2 0.5
42 Thrissur MC 12 1 4 34.1
Madhya Pradesh
43 Hoshangabad M 19 1 6 34.644 Itarsi M n.a. n.a. 4 20.0
45 Khargone M 33 3 3 6.0
46 Mandsaur M 32 3 6 4.5
47 Nagda M n.a. n.a. 3 n.a.
2 9 0
Sl. City/Town Length of Distribution Length No. of storage Storage caNo. Network (km.) per sq.km. reservoirs (million lit
1 2 3 4 5

7/21/2019 Status Watersupply
http://slidepdf.com/reader/full/status-watersupply 311/869
48 Neemuch M 88 7 7 5.0
49 Sehore M 60 3 2 2.3
50 Shahdol M 45 2 3 2.0
51 Vidisha M 36 6 4 2.5
Maharashtra
52 Amalner MCl 13 1 2 3.1
53 Ballarpur MCl 50 6 2 1.7
54 Bhandara M 20 2 1 2.7
55 Kamptee MCl 8 2 2 2.4
56 Manmad MCl 70 3 6 4.1
57 Ratnagiri MCl 18 2 6 77.6
58 Satara MCl 111 14 0 9.0
59 Virar MCl 35 2 4 2.0Orissa
60 Balangir M 21 n.a. 6 6.2
61 Bhadrak M 22 0 0 n.a.
Punjab
62 Firozpur MCI 70 8 6 3.6
63 Kapurthala M 101 6 4 1.8
64 Mansa MCI 31 3 2 0.9
65 Phagwara MCI 87 7 6 3.0
66 Sangrur MCI 71 4 2 0.7
Rajasthan
67 Banswara M n.a. n.a. 14 n.a.
68 Barmer M 210 44 6 4.0
69 Bundi M 90 3 20 7.2
70 Churu M 124 4 6 3.5
71 Hanumangarh M 119 9 4 13.5
2 9 1
Sl. City/Town Length of Distribution Length No. of storage Storage caNo. Network (km.) per sq.km. reservoirs (million lit
1 2 3 4 5

7/21/2019 Status Watersupply
http://slidepdf.com/reader/full/status-watersupply 312/869
72 Sawai Madhopur M 12 1 9 4.2
Tamil Nadu
73 Ambur M 75 5 1 1.8
74 Arakkonam M 65 7 3 1.2
75 Attur M 46 2 3 0.3
76 Cumbum M 44 n.a. 4 1.6
77 Dharmapuri M 41 4 2 2.3
78 Guduivattam M 45 10 3 1.8
79 Nagapattinam M 100 7 5 3.6
80 Pudukkottai M 66 5 4 7.4
81 Sivakasi M 70 10 5 3.0
82 Srivilliputtur M 38 7 2 2.2
83 Tindivanam MC 25 1 2 0.1
84 Udhagamandalam M n.a. n.a. n.a. n.a.
Uttar Pradesh
85 Auraiya MB 15 2 4 3.1
86 Balrampur MB 45 5 3 3.1
87 Basti MB 60 3 3 0.1
88 Bhadohi MB 47 16 2 1.0
89 Chandpur MB 21 9 1 0.3
90 Etah MB 120 6 2 1.7
91 Ghazipur MB 128 13 6 7.0
92 Gonda MB 92 15 4 5.0
93 Lakhimpur MB 30 3 4 2.3
94 Lalitpur MB 146 11 3 4.2
95 Mughalsarai MB 32 16 2 0.3
96 Nawabganj-Barabanki MB 70 9 3 2.7
97 Orai MB 75 5 4 1.4
98 Roorkee MB 80 n.a. 5 5.8
2 9 2
Sl. City/Town Length of Distribution Length No. of storage Storage caNo. Network (km.) per sq.km. reservoirs (million lit
1 2 3 4 5

7/21/2019 Status Watersupply
http://slidepdf.com/reader/full/status-watersupply 313/869
West Bengal
99 Bishnupur M 12 2 2 0.9
100 Chakdaha M 52 9 3 1.4
101 Contai M 42 3 1 0.6
102 Cooch Behar M 102 12 3 1.0
103 Darjeeling M 207 20 3 n.a.
104 Jalpaiguri M 104 8 6 2.8
105 Jangipur M 14 4 1 1.0
106 Katwa M 1 0 1 0.7
107 Raniganj M 30 n.a. 4 1.4
Small States
Nagaland
108 Kohima TC n.a. n.a. 26 3.6Himachal Pradesh
109 Shimla M.Corp. 105 4 33 23.2
Union Teritories
110 Port Balir MCI 80 6 36 10.7
Others (Smaller than Class II towns)
Small States
Arunachal Pradesh
111 Itanagar CT 250 n.a. n.a. n.a.
Goa
112 Panaji MCI 2 1 8 10.0
Union Territories113 Daman MCI 50 9 10 1.4
114 Kavarathi NMCT 20 5 0 n.a.
115 Silvassa 11 4 1 0.4
Source: Respective urban local governments/relevant agencies, NIUA Survey,1999.
2 9 3
Sl. City/Town Length of Distribution Length No. of storage Storage caNo. Network (km.) per sq.km. reservoirs (million lit
1 2 3 4 5

7/21/2019 Status Watersupply
http://slidepdf.com/reader/full/status-watersupply 314/869

7/21/2019 Status Watersupply
http://slidepdf.com/reader/full/status-watersupply 315/869
A - 9
WA T E R T R E
A T ME NT ,1 9 9 9

7/21/2019 Status Watersupply
http://slidepdf.com/reader/full/status-watersupply 316/869

7/21/2019 Status Watersupply
http://slidepdf.com/reader/full/status-watersupply 317/869
Metropolitan Cities
1 Ahmedabad M.Corp. Chlorine Corporation Yes - daily Nil
2 Bangalore M.Corp. Chlorine Municipality No No yearly Nil
3 Bhopal M.Corp. Alum & Chlorine Corporation Yes - daily daily
4 Calcutta M.Corp. Alum & Chlorine Corporation Yes - daily daily
5 Chennai M.Corp. Alum & Chlorine PHED Yes - daily daily
6 Coimbatore M.Corp Chlorine PHED Yes - Nil Nil
7 Delhi M.Corp. Alum & Chlorine DJB Yes - daily daily
8 Greater Mumbai M.Corp. Alum & Chlorine Corporation No No daily daily
9 Hyderabad M.Corp. n.a. HWS & SB Yes - daily daily
10 Indore M.Corp. A+C+BP+Others Corporation Yes - daily daily
11 Jaipur M.Corp. Alum & Chlorine PHED Yes - Nil daily
12 Kanpur M.Corp. Alum & Chlorine Jal Sansthan Yes - daily daily
13 Kochi M.Corp. Alum & Chlorine KWA Yes - daily daily
14 Lucknow M.Corp. Alum, Chlorine & B.P. Jal Sansthan Yes - Nil daily
15 Ludhiana M.Corp. Chlorine Corporation Yes - Nil Nil
16 Madurai M.Corp. Chlorine Kings Institute,
Guindy, Chennai No No daily daily
17 Nagpur M.Corp. Alum & Chlorine Corporation No Yes Nil weekly
18 Pune M.Corp. Alum & Chlorine Corporation Yes - daily daily
19 Surat M.Corp. Alum & Chlorine Corporation Yes - hourly hourly tw
20 Vadodara M.Corp. Alum & Chlorine Corporation Yes - daily daily
21 Varanasi M.Corp. Alum, Chlorine & B.P. Jal Sansthan Yes - daily daily
22 Visakhapatnam M.Corp. Alum & Chlorine Corporation No Yes Nil daily
Source: Respective urban local governments/relevant agencies, NIUA Survey, 1999
2 9 7
Sl. City/Town Type of treatment Water quality Labo- If no, Periodicity PeriodicityNo. provided monitoring ratory any of moni- monitoring
agency facilities future toring Treat-adequate plans raw ment
water plant1 2 3 4 5 6 7
A-9 : Water Treatment, 1999

7/21/2019 Status Watersupply
http://slidepdf.com/reader/full/status-watersupply 318/869
CLASS I
Andhra Pradesh
1 Anantapur MCI n.a. Municipality No Yes daily daily
2 Chittoor M Chlorine Municipality No No nil Nil
3 Cuddapah MCI Nil Council No No Nil Nil
4 Eluru M Alum & Chlorine Municipality No No Nil twicea week
5 Guntur MCI Alum, Chlorine & B.P. Corporation Yes - Nil daily
6 Hindupur M Bleaching Powder Municipality No No twice Nilweekly
7 Kakinada M Alum & Chlorine Municipality No No Nil monthly
8 Kurnool MCI n.a. Corporation Yes - daily daily
9 Machilipatnam M Alum, Chlorine & B.P. Municipality Yes - monthly monthly
10 Nandyal MCI Alum & Chlorine Municipality No No daily daily
11 Nellore MCI Alum & Chlorine Municipality Yes - Nil Nil
12 Nizamabad M Alum & Chlorine Municipality No No daily Nil
13 Ongole MCI Alum & Chlorine Municipality Yes - Nil daily
14 Qutubullapur M Alum & Chlorine HWS & SB Yes - Nil daily
15 Rajahmundry M.Corp. Alum & Chlorine Corporation No No Nil every 3months
16 Tenali M Alum & Chlorine Municipality Yes - Nil fort-nightly
17 Tirupati MCI Alum & Chlorine Council No Yes n.a. n.a.
18 Vijaywada M.Corp. Alum, Chlorine & B.P. Corporation Yes - Nil fort-nightly
19 Warangal M.Corp. Rapid gravity filters Corporation No Yes daily daily alt
2 9 8
Sl. City/Town Type of treatment Water quality Labo- If no, Periodicity PeriodicityNo. provided monitoring ratory any of moni- monitoring
agency facilities future toring treat-adequate plans raw ment
water plant
1 2 3 4 5 6 7

7/21/2019 Status Watersupply
http://slidepdf.com/reader/full/status-watersupply 319/869
Bihar
20 Bihar Sharif M Chlorine PHED Yes - Nil Nil
21 Chhapra M Alum & B.P. Council Yes - n.a. n.a.
22 Gaya M.Corp. Chlorine PHED No Yes Nil Nil
23 Katihar M Chlorine PHED Yes - Nil Nil
24 Munger M Chlorine Municipality No No Nil Nil
25 Ranchi M.Corp. Chlorine PHED No Yes daily daily
Gujarat
26 Anand M Chlorine Municipality No Yes weekly Nil
27 Bharuch M Alum & Chlorine Municipality Yes - daily daily
28 Bhavnagar M.Corp. Chlorine Corporation Yes - daily daily
29 Bhuj M Chlorine Municipality No Yes monthly Nil
30 Jamnagar M.Corp. Alum Corporation Yes - daily daily
31 Junagadh M Bleaching Powder Municipality No No Nil Nil
32 Nadiad M Chlorine Municipality No No Nil Nil
33 Navsari M Chlorine Municipality No No Nil Nil
34 Porbandar M Chlorine GWSSB Yes - monthly daily
35 Rajkot M.Corp. Chlorine Corporation Yes - daily daily a
36 Surendranagar M Alum & Chlorine GWSSB No No every 6 monthly
monthsHaryana
37 Ambala MCI Alum & Chlorine PHD Yes - daily daily
38 Faridabad M.Corp. Chlorine Corporation No No Nil Nil
39 Gurgaon MCI Chlorine PHED Yes - Nil daily
2 9 9
Sl. City/Town Type of treatment Water quality Labo- If no, Periodicity PeriodicityNo. provided monitoring ratory any of moni- monitoring
agency facilities future toring treat-adequate plans raw ment
water plant
1 2 3 4 5 6 7

7/21/2019 Status Watersupply
http://slidepdf.com/reader/full/status-watersupply 320/869
40 Hisar MCI Alum & Chlorine PHD Yes - every 6 daily amonths
41 Karnal MCI Chlorine PWD, PHD Yes - Nil Nil
42 Rohtak MCI Chlorine PWD, PHD Yes - every 6 daily
months
Jammu & Kashmir
43 Jammu M.Corp. Chlorine PHED Yes - 0 daily b
Karnataka
44 Belgaum M.Corp. Alum & Chlorine Corporation Yes - Nil daily
45 Bellary CMC Alum & Chlorine Municipality Yes - twice daily daily fo
46 Davangere MCI Alum & Chlorine Council No Yes Nil daily47 Gadag-Betigeri CMC Alum & Chlorine KWSS & DB No No Nil Nil
48 Gulbarga M.Corp. Alum & Chlorine KWSS & DB No Yes Nil weekly
49 Hubli-Dharwar M.Corp. Alum & Chlorine KWSS & DB Yes - Nil daily
50 Mandya M Alum & Chlorine KWSS & DB No Yes Nil daily
51 Mangalore M.Corp. Alum & Chlorine Corporation No Yes daily daily
52 Mysore M.Corp. Alum & Chlorine Corporation Yes - daily daily
53 Shimoga CMC Alum & Chlorine Council Yes - weekly weekly
54 Tumkur M Alum & Chlorine Municipality No No Nil daily
Kerala
55 Alappuzha MC Bleaching Powder KWA No No Nil Nil
56 Kollam MC Alum, Chlorine & B.P. KWA Yes - Nil daily
57 Kozhikode M.Corp. Chlorine KWA Yes - Nil daily
58 Thalaserry M Alum & Chlorine KWA Yes - Nil daily
59 ThiruvananthapuramM.Corp. n.a. KWA Yes - daily daily
3 0 0
Sl. City/Town Type of treatment Water quality Labo- If no, Periodicity PeriodicityNo. provided monitoring ratory any of moni- monitoring
agency facilities future toring treat-adequate plans raw ment
water plant
1 2 3 4 5 6 7

7/21/2019 Status Watersupply
http://slidepdf.com/reader/full/status-watersupply 321/869
Madhya Pradesh
60 Bhind M Bleaching Powder PHE Yes - Nil Nil
61 Burhanpur M.Corp. Bleaching Powder Corporation No No Nil Nil
62 Dewas M.Corp. Alum & Chlorine Corporation No No Nil every 3 months
63 Guna M Chlorine PHE Yes - daily daily
64 Gwalior M.Corp. Chlorine Corporation Yes - weekly daily
65 Jabalpur M.Corp. Alum & Chlorine Corporation Yes - daily daily
66 Khandwa M Alum & Chlorine Corporation No Yes daily daily
67 Morena M Bleaching Powder Municipality No No Nil Nil
68 Murwara (Katni) M.Corp. Alum & Chlorine Corporation No No Irregular Irregular
69 Ratlam M.Corp. Alum & Chlorine PHE Yes - Nil daily
70 Rewa M.Corp. Alum, Chlorine & B.P. PHE Yes - Nil daily
71 Satna M.Corp. Alum & Chlorine PHE Yes - weekly daily
72 Shivpuri M Alum & Chlorine Municipality Yes - 0 daily
Maharashtra
73 Amravati M.Corp. Alum & Chlorine MJP Yes - monthly weekly
74 Aurangabad M.Corp. Alum, Chlorine & B.P. Corporation Yes - monthly twice
weekly
75 Bhusawal MCl Alum, Chlorine & B.P. Council Yes - Nil daily
76 Chandrapur MCl Chlorine & B.P. KWA Yes - n.a. n.a.77 Dhule MCl Chlorine Council Yes - every 3 daily
months
78 Ichalkaranji MCl Alum & Chlorine Council Yes - daily daily
79 Jalgaon MCl Alum & Chlorine Council Yes - Nil daily
3 0 1
Sl. City/Town Type of treatment Water quality Labo- If no, Periodicity PeriodicityNo. provided monitoring ratory any of moni- monitoring
agency facilities future toring treat-adequate plans raw ment
water plant
1 2 3 4 5 6 7

7/21/2019 Status Watersupply
http://slidepdf.com/reader/full/status-watersupply 322/869
80 Kolhapur M.Corp. Chlorine, BP & Others Corporation No Yes weekly weekly
81 Nanded Waghala M.Corp. Alum & Chlorine Corporation No No monthly weekly
82 Nashik M.Corp. Alum & Chlorine Corporation No Yes daily daily
83 Parbhani MCl Alum & Chlorine Council No No Nil daily
84 Solapur M.Corp. Alum & Chlorine Corporation Yes - daily daily
85 Wardha M Alum & B.P. Municipality Yes - Nil daily
86 Yavatmal MCl Alum & Chlorine MJP Yes - monthly daily
Orissa
87 Bhubaneswar M.Corp. Chlorine PHED Yes - daily daily
88 Cuttack M.Corp. Chlorine PHED Yes - n.a. n.a.
89 Puri M Chlorine PHED Yes - monthly Nil
90 Rourkela M n.a. n.a. No Yes n.a. n.a.
91 Sambalpur M Chlorine PHED No Yes daily daily
Punjab
92 Amritsar M.Corp. Chlorine Corporation Yes - Nil Nil
93 Bathinda MCI Alum & Chlorine PHED Yes - Nil Nil
94 Hoshiarpur MCI Chlorine Council No No Nil Nil
95 Jalandhar M.Corp. Chlorine Corporation No Yes Nil Nil
96 Moga MCI Chlorine Council No No Nil Nil97 Pathankot MCI Chlorine Council No No Nil Nil
98 Patiala M.Corp. Chlorine Corporation Yes - Nil Nil
Rajasthan
99 Ajmer MCI Chlorine PHED Yes - Nil daily
3 0 2
Sl. City/Town Type of treatment Water quality Labo- If no, Periodicity PeriodicityNo. provided monitoring ratory any of moni- monitoring
agency facilities future toring treat-adequate plans raw ment
water plant
1 2 3 4 5 6 7

7/21/2019 Status Watersupply
http://slidepdf.com/reader/full/status-watersupply 323/869
100 Alwar M Chlorine PHED Yes - Nil Nil
101 Beawar M Alum & Chlorine Corporation Yes - Nil daily
102 Bhilwara M Chlorine PHED Yes - daily daily
103 Bikaner M Alum & Chlorine PHED Yes - daily daily
104 Jodhpur M.Corp. Alum & Chlorine PHED Yes - daily daily
105 Kota M.Corp. Chlorine PHED Yes - daily daily
106 Sriganganagar M Chlorine PHED Yes No daily daily
Tamil Nadu
107 Cuddalore M Nil Council No No Nil Nil
108 Dindigul M Bleaching Powder Municipality No No daily Nil
109 Erode M Chlorine Municipality No No Nil daily
110 Kanchipuram M Chlorine Municipality No No Nil Nil
111 Kumbakonam M Chlorine Kings Institute, No No Nil NilGuindy, Chennai
112 Nagercoil M Chlorine Kings Institute, No No Nil dailyGuindy, Chennai
113 Rajapalayam M Chlorine Municipality No No monthly monthly
114 Salem M.Corp. Chlorine PHED No No Nil daily
115 Thanjavur M Chlorine Kings Institute, No No Nil daily
Guindy, Chennai
116 Tiruchirapalli M.Corp. Alum, Chlorine & B.P. Corporation No Yes Nil Nil
117 Tirunelveli M.Corp. Chlorine P. H. Preventive Yes - Nil weeklyMedicine, Chennai
118 Tirunvannamalai M Alum & Chlorine Municipality Yes - every 4 every 4
months months
3 0 3
Sl. City/Town Type of treatment Water quality Labo- If no, Periodicity PeriodicityNo. provided monitoring ratory any of moni- monitoring
agency facilities future toring treat-adequate plans raw ment
water plant
1 2 3 4 5 6 7

7/21/2019 Status Watersupply
http://slidepdf.com/reader/full/status-watersupply 324/869
119 Tiruppur M Alum Municipality No No daily daily
120 Tuticorin M Alum & Chlorine TWAD Board No No Nil Nil
121 Vellore M Chlorine Municipality Yes - Nil Nil
Uttar Pradesh
122 Agra M.Corp. Alum & Chlorine Jal Sansthan Yes - twice four times
daily a day
123 Aligarh M.Corp. Chlorine Corporation No Yes Nil Nil
124 Allahabad M.Corp. Alum, Chlorine & B.P. Jal Sansthan Yes - Nil daily
125 Bareilly M.Corp. Chlorine PHED Yes - daily Nil
126 Etawah MB Chlorine Municipality No No Nil Nil
127 Faizabad MB Chlorine Municipality No No Nil Nil
128 Firozabad MB Chlorine Municipality Yes - Nil weekly
129 Ghaziabad M.Corp. Chlorine Corporation Yes - Nil Nil
130 Gorakhpur M.Corp. Chlorine Corporation No No Nil Nil
131 Haldwani-cum- MB Chlorine Kumaun No No daily dailyKathgodam Jal Sansthan
132 Hapur MB Chlorine Municipality No No Nil Nil
133 Hardwar MB Chlorine Municipality No No Nil every 3
months
134 Jhansi MB Alum & Chlorine Jal Sansthan No No daily daily
135 Mathura MB Chlorine Municipality No Yes Nil Nil
136 Meerut M.Corp. Chlorine Corporation No No Nil Nil
137 Mirzapur MB Alum & Chlorine Municipality Yes - daily daily
3 0 4
Sl. City/Town Type of treatment Water quality Labo- If no, Periodicity PeriodicityNo. provided monitoring ratory any of moni- monitoring
agency facilities future toring treat-adequate plans raw ment
water plant
1 2 3 4 5 6 7

7/21/2019 Status Watersupply
http://slidepdf.com/reader/full/status-watersupply 325/869
138 Moradabad M.Corp. Chlorine Corporation No No Nil daily
139 Muzaffarnagar MB Chlorine Municipality No No Nil daily
140 Rae Bareli MB Bleaching Powder Municipality No No Nil n.a.
141 Rampur MB Chlorine & B.P. Municipality No No Nil Nil
142 Saharanpur MB Chlorine Municipality No No Nil daily
143 Sitapur MB Chlorine PHED No No Nil Nil
144 Unnao MB Chlorine Municipality No No Nil Nil
West Bengal
145 Asansol M.Corp. Alum & Chlorine Corporation No Yes monthly monthly
146 Baharampur M Chlorine Housing & Urban Yes - Nil NilDev. Deptt.
147 Balurghat M Alum & Chlorine BWSSB Yes - Nil daily
148 Bankura M Chlorine PHED Yes - weekly Nil
149 Barasat M Chlorine PHED No No Nil Nil
150 Burdwan M Alum & Others Municipality No No Nil twice
daily
151 Halisahar M Nil N.App. No No Nil Nil
152 Krishnagar M Alum & Chlorine Municipality No No Nil monthly
153 Midnapore M Chlorine Municipality No No Nil Nil
154 North Barrackpore M Chlorine CMC No No Nil Nil
155 Santipur M Chlorine PHED No No Nil Nil
156 Silliguri M.Corp. Alum & Chlorine PHED Yes - weekly daily
3 0 5
Sl. City/Town Type of treatment Water quality Labo- If no, Periodicity PeriodicityNo. provided monitoring ratory any of moni- monitoring
agency facilities future toring treat-adequate plans raw ment
water plant
1 2 3 4 5 6 7

7/21/2019 Status Watersupply
http://slidepdf.com/reader/full/status-watersupply 326/869
Small States
Assam
157 Guwahati M.Corp. Alum & B.P. Public Analyst, No Yes every 6 monthlyGovt. of Assam months
158 Jorhat MB n.a. n.a. n.a. n.a. n.a. n.a.
Manipur
159 Imphal MCI Lime PHED No Yes monthly monthly
Meghalaya
160 Shillong MB Alum & Chlorine PHED Yes - monthly daily
Mizoram
161 Aizwal NM n.a. PHED No No daily daily
Tripura
162 Agartala MCI Alum & Chlorine PHED Yes - daily daily
Union Territories
163 Chandigarh M.Corp. Chlorine & B.P. Municipality No No Nil Nil
164 Pondicherry M Chlorine PWD No No Nil Nil
Source: Respective urban local governments/relevant agencies, NIUA Survey,1999.
3 0 6
Sl. City/Town Type of treatment Water quality Labo- If no, Periodicity PeriodicitNo. provided monitoring ratory any of moni- monitoring
agency facilities future toring treat-adequate plans raw ment
water plant
1 2 3 4 5 6 7

7/21/2019 Status Watersupply
http://slidepdf.com/reader/full/status-watersupply 327/869
CLASS II
Andhra Pradesh
1 Anakapalle M Chlorine Municipality No No Nil Nil
2 Dharmavaram M Chlorine Municipality No Yes Nil Nil
3 Gudur MCI Alum & Chlorine Council No No Nil Nil
4 Kapra M n.a. HWS & SB No No daily Nil
5 Kavali MCI Alum & Chlorine Municipality No No daily Nil
6 Madanapalle M Chlorine Municipality Yes - daily Nil
7 Narasaraopet M Alum, Chlorine & B.P. Municipality Yes - daily daily
8 Rajendra nagar MCI Alum & Chlorine PHD Yes - daily daily
9 Sangareddy MCI Nil Council No No Nil Nil tw
10 Srikakulam MCI Chlorine Municipality No No fortnightly daily
11 Srikalahasti M Nil Municipality No No Nil Nil
12 Suryapet MCI Alum & Chlorine Council No Yes monthly daily
Bihar
13 Buxar M Nil PHED No No Nil Nil
14 Deoghar M Chlorine Municipality No No Nil Nil
15 Hajipur M Chlorine PHED Yes - monthly Nil
16 Hazaribagh M Chlorine PHED Yes - every 6 every 6
months months
17 Jehanabad M Chlorine Municipality No No Nil Nil
18 Madhubani M Chlorine Municipality Yes - Nil Nil
19 Mokama M n.a. PHED No No Nil Nil
Gujarat
20 Amreli M Alum & Chlorine Municipality No No Nil daily
3 0 7
Sl. City/Town Type of treatment Water quality Labo- If no, Periodicity PeriodicityNo. provided monitoring ratory any of moni- monitoring
agency facilities future toring treat-adequate plans raw ment
water plant
1 2 3 4 5 6 7

7/21/2019 Status Watersupply
http://slidepdf.com/reader/full/status-watersupply 328/869
21 Ankleswar M Chlorine Municipality No No Nil Nil
22 Dabhoi M Chlorine Baroda M.Corp. Yes - n.a. n.a.
23 Dohad M Alum & Chlorine Municipality No Yes Nil daily
24 Gondal M Bleaching Powder Municipality No Yes Nil daily
25 Jetpur M Alum & Chlorine Municipality No Yes Nil daily
26 Mahesana M Chlorine Municipality No No Nil Nil
27 Palanpur M Chlorine Municipality No No every 6 Nil
months
Haryana
28 Jind MCI Chlorine PHD Yes - Nil daily
29 Kaithal MCI Chlorine PHD No Yes Nil Nil
30 Rewari MCI Alum & B.P. PHD Yes - monthly daily
31 Thanesar MCI Chlorine PHED No Yes Nil monthly
Karnataka
32 Bagalkot CMC Alum & Chlorine Municipality No No every 3 every 3
months months
33 Chikmaglur CMC Chlorine Municipality No No Nil Nil
34 Gokak CMC Alum & Chlorine Council Yes - Nil daily
35 Hospet CMC Chlorine & B.P. Council Yes - Nil alternate day
36 Kolar CMC Alum & Chlorine Council No No daily daily
37 Rabkavi-Banhatti CMC Alum & Chlorine Council No No daily daily
38 Ramanagaram CMC Alum & B.P. Council No No monthly monthly
Kerala
39 Changanessary MC Alum & Chlorine CMWSSB Yes - daily daily
3 0 8
Sl. City/Town Type of treatment Water quality Labo- If no, Periodicity PeriodicityNo. provided monitoring ratory any of moni- monitoring
agency facilities future toring treat-adequate plans raw ment
water plant
1 2 3 4 5 6 7

7/21/2019 Status Watersupply
http://slidepdf.com/reader/full/status-watersupply 329/869
40 Payyanur M Bleaching Powder KWA Yes - Nil Nil
41 Taliparamba M Chlorine & B.P. KWA Yes - Nil Nil
42 Thrissur MC Alum & Chlorine KWA Yes - Nil daily
Madhya Pradesh
43 Hoshangabad M Nil Municipality No No Nil Nil
44 Itarsi M Nil Municipality No No Nil Nil o
45 Khargone M Alum & Chlorine Municipality No No Nil Nil
46 Mandsaur M Alum & Chlorine Municipality Yes - daily daily
47 Nagda M Alum & Chlorine Municipality No No Nil monthly
48 Neemuch M Chlorine Municipality No Yes daily daily
49 Sehore M Alum & Chlorine Municipality Yes - monthly daily
50 Shahdol M Chlorine Municipality Yes - Nil monthly
51 Vidisha M Bleaching Powder Municipality No Yes twice dailydaily
Maharashtra
52 Amalner MCl Alum & Chlorine Council Yes - daily daily
53 Ballarpur MCl Chlorine Municipality No No Nil Nil
54 Bhandara M Alum & Chlorine Municipality Yes - Nil daily
55 Kamptee MCl Alum & Chlorine Corporation No No Nil Nil
56 Manmad MCl Alum & Chlorine Council Yes - daily daily
57 Ratnagiri MCl Alum Council Yes - Nil Nil
58 Satara MCl No No 0 0
3 0 9
Sl. City/Town Type of treatment Water quality Labo- If no, Periodicity PeriodicityNo. provided monitoring ratory any of moni- monitoring
agency facilities future toring treat-adequate plans raw ment
water plant
1 2 3 4 5 6 7

7/21/2019 Status Watersupply
http://slidepdf.com/reader/full/status-watersupply 330/869
59 Virar MCl Alum & Chlorine Council Yes - daily daily
Orissa
60 Balangir M Alum & Chlorine MJP Yes - daily daily
61 Bhadrak M Chlorine PHED No Yes Nil Nil
Punjab
62 Firozpur MCI Chlorine PWS & SB Yes - Nil Nil
63 Kapurthala M Chlorine Council No No Nil Nil
64 Mansa MCI Alum & B.P. PWS & SB Yes - daily daily
65 Phagwara MCI Chlorine Council No No Nil Nil
66 Sangrur MCI Chlorine PWS & SB No No Nil Nil a
Rajasthan
67 Banswara M Nil N.App. No No Nil Nil
68 Barmer M Chlorine Municipality Yes - Nil Nil
69 Bundi M Chlorine PHED Yes - Nil daily
70 Churu M Alum & Chlorine TWAD Board & Yes - Nil daily
Kings Institute,Guindy, Chennai
71 Hanumangarh M Alum & Chlorine PHED Yes - daily daily
72 Sawai Madhopur M Chlorine PHED Yes - daily daily
Tamil Nadu
73 Ambur M Chlorine Municipality No No Nil Nil
74 Arakkonam M Chlorine Municipality No No Nil Nil
75 Attur M Alum & Chlorine Municipality No No Nil Nil
76 Cumbum M Chlorine PHED No No Nil Nil
3 1 0
Sl. City/Town Type of treatment Water quality Labo- If no, Periodicity PeriodicityNo. provided monitoring ratory any of moni- monitoring
agency facilities future toring treat-adequate plans raw ment
water plant
1 2 3 4 5 6 7

7/21/2019 Status Watersupply
http://slidepdf.com/reader/full/status-watersupply 331/869
77 Dharmapuri M Chlorine Water Analyst, Yes - every 6 every 6 Coimbatore months months
78 Guduivattam M Alum & Chlorine Municipality No No daily Nil
79 Nagapattinam M Chlorine Kings Institute, No No Nil Nil
Guindy, Chennai
80 Pudukkottai M Bleaching Powder TWAD Board No No daily Nil
81 Sivakasi M Chlorine Municipality No No Nil daily
82 Srivilliputtur M Chlorine Kings Institute, No No Nil dailyGuindy, Chennai
83 Tindivanam MC Chlorine Kings Institute, No No Nil Nil
Guindy, Chennai84 Udhagamandalam M Alum & Chlorine Water Analyst, No No Nil daily
Coimbatore
Uttar Pradesh
85 Auraiya MB Chlorine Municipality No No Nil Nil tw
86 Balrampur MB Chlorine PHED Yes - Nil Nil
87 Basti MB Alum & Chlorine PWS & SB No No Nil daily
88 Bhadohi MB Chlorine Municipality No No Nil daily
89 Chandpur MB Alum & Chlorine Council Yes - daily daily
90 Etah MB Chlorine Jal Sansthan No No Nil daily
91 Ghazipur MB Bleaching Powder Municipality Yes - Nil daily
92 Gonda MB Bleaching Powder Municipality Yes - Nil Nil
93 Lakhimpur MB Chlorine Municipality No No Nil Nil
94 Lalitpur MB Alum & Chlorine Jal Sansthan No No every 4 daily
months
95 Mughalsarai MB Bleaching Powder Municipality No No Nil monthly
3 1 1
Sl. City/Town Type of treatment Water quality Labo- If no, Periodicity PeriodicityNo. provided monitoring ratory any of moni- monitoring
agency facilities future toring treat-adequate plans raw ment
water plant
1 2 3 4 5 6 7

7/21/2019 Status Watersupply
http://slidepdf.com/reader/full/status-watersupply 332/869
96 Nawabganj-Barabanki MB Chlorine Municipality No No Nil Nil tw
97 Orai MB Chlorine Jal Sansthan No No Nil Nil tw
98 Roorkee MB Chlorine Municipality No No Nil Nil
West Bengal
99 Bishnupur M Chlorine PHED No No Nil Nil
100 Chakdaha M Alum & Chlorine PHED Yes - daily daily
101 Contai M Chlorine PHED No No Nil Nil
102 Cooch Behar M Chlorine Kings Institute, No No Nil Nil
Guindy, Chennai
103 Darjeeling M Chlorine & Others Municipality No No Nil Nil
104 Jalpaiguri M Chlorine Municipality No Yes Nil Nil
105 Jangipur M Alum & Chlorine PHED No No Nil monthly
106 Katwa M Chlorine PHED No No Nil Nil
107 Raniganj M Alum & Chlorine PHED No No Nil daily
Small States
Himachal Pradesh
109 Shimla M.Corp. Alum & Chlorine PHD Yes - daily daily
Nagaland
108 Kohima TC Alum & Chlorine n.a. No Yes Nil Nil
Union Teritories
110 Port Balir MCI n.a. n.a. n.a. n.a. n.a. n.a.
Others (Smaller than Class II towns)
Small States
Arunachal Pradesh
111 Itanagar CT Alum & Chlorine PHED No Yes Nil Nil
3 1 2
Sl. City/Town Type of treatment Water quality Labo- If no, Periodicity PeriodicityNo. provided monitoring ratory any of moni- monitoring
agency facilities future toring treat-adequate plans raw ment
water plant
1 2 3 4 5 6 7

7/21/2019 Status Watersupply
http://slidepdf.com/reader/full/status-watersupply 333/869
Goa
112 Panaji MCI Alum, Chlorine & PWD Yes - daily daily
Others
Union Territories
113 Daman MCI Alum & Chlorine PWD Yes - fort- dailynightly
114 Kavarathi NMCT Chlorine LPWD Yes - daily Nil
115 Silvassa Rapid sand aeration PWD No Yes monthly Nil
Source: Respective urban local governments/relevant agencies, NIUA Survey,1999.
3 1 3
Sl. City/Town Type of treatment Water quality Labo- If no, Periodicity PeriodicitNo. provided monitoring ratory any of moni- monitoring
agency facilities future toring treat-adequate plans raw ment
water plant
1 2 3 4 5 6 7

7/21/2019 Status Watersupply
http://slidepdf.com/reader/full/status-watersupply 334/869

7/21/2019 Status Watersupply
http://slidepdf.com/reader/full/status-watersupply 335/869
A -1 0
I N S T
I T UT I O NA L A R R A N GE ME NT S F OR WA T E R
S UP P
L Y ,1 9 9 9

7/21/2019 Status Watersupply
http://slidepdf.com/reader/full/status-watersupply 336/869

7/21/2019 Status Watersupply
http://slidepdf.com/reader/full/status-watersupply 337/869
Metropolitan Cities1 Ahmedabad M.Corp. Corporation Corporation
2 Bangalore M.Corp. BWSSB BWSSB
3 Bhopal M.Corp. Corporation Corporation
4 Calcutta M.Corp. CMC, CMDA & CMWSA CMC & CMWSA
5 Chennai M.Corp. CMWSSB CMWSSB
6 Coimbatore M.Corp TWAD Board Corporation
7 Delhi M.Corp. DJB DJB
8 Greater Mumbai M.Corp. Corporation Corporation
9 Hyderabad M.Corp. HMWS & SB HMWS & SB
10 Indore M.Corp. Corporation Corporation
11 Jaipur M.Corp. PHED PHED
12 Kanpur M.Corp. Jal Nigam Jal Sansthan
13 Kochi M.Corp. KWA KWA
14 Lucknow M.Corp. Jal Nigam Jal Sansthan
15 Ludhiana M.Corp. PWS & SB Corporation
16 Madurai M.Corp. TWAD Board Corporation
17 Nagpur M.Corp. Corporation Corporation
18 Pune M.Corp. Corporation Corporation
19 Surat M.Corp. Corporation Corporation
20 Vadodara M.Corp. Corporation Corporation
21 Varanasi M.Corp. Jal Nigam Jal Sansthan
22 Visakhapatnam M.Corp. PHED & Corporation Corporation
Source: Respective urban local governments/relevant agencies, NIUA Survey, 1999
3 1 7
Sl. City/Town Institutional Arrangements for Water supply 199
No. Capital works Operation & Maintenance
1 2 3
A-10 : Institutional Arrangements for Water Supply, 1999

7/21/2019 Status Watersupply
http://slidepdf.com/reader/full/status-watersupply 338/869
CLASS I
Andhra Pradesh1 Anantapur MCI PHED Council
2 Chittoor M PHED Municipality
3 Cuddapah MCI PHED Council
4 Eluru M PHED Municipality
5 Guntur MCI PHED Corporation
6 Hindupur M PHED Municipality
7 Kakinada M PHED Municipality
8 Kurnool MCI PHED Municipality
9 Machilipatnam M PHED Municipality
10 Nandyal MCI PHED Municipality
11 Nellore MCI PHED Municipality
12 Nizamabad M Council Council
13 Ongole MCI PHED Municipality
14 Qutubullapur M HMWS & SB HMWS & SB
15 Rajahmundry M.Corp. PHED Corporation
16 Tenali M PHED Municipality
17 Tirupati MCI PHED Council
18 Vijaywada M.Corp. PHED & Corporation Corporation
19 Warangal M.Corp. PHED Corporation
Bihar
20 Bihar Sharif M Municipality Municipality
21 Chhapra M PHED PHED
22 Gaya M.Corp. Corporation Corporation
23 Katihar M Municipality Municipality
24 Munger M Municipality Municipality
3 1 8
Sl. City/Town Institutional Arrangements for Water supply 199
No. Capital works Operation & Maintenance
1 2 3

7/21/2019 Status Watersupply
http://slidepdf.com/reader/full/status-watersupply 339/869
25 Ranchi M.Corp. PHED PHED
Gujarat26 Anand M nagarpalika nagarpalika
27 Bharuch M nagarpalika nagarpalika
28 Bhavnagar M.Corp. Corporation Corporation
29 Bhuj M nagarpalika nagarpalika
30 Jamnagar M.Corp. Corporation Corporation
31 Junagadh M nagarpalika nagarpalika
32 Nadiad M nagarpalika nagarpalika
33 Navsari M nagarpalika nagarpalika
34 Porbandar M GWSSB nagarpalika
35 Rajkot M.Corp. Corporation Corporation
36 Surendranagar M GWSSB nagarpalika
Haryana
37 Ambala MCI PHD PHD
38 Faridabad M.Corp. Corporation Corporation
39 Gurgaon MCI PHD PHD
40 Hisar MCI PHD PHD
41 Karnal MCI PWD (PHD) PWD (PHD)
42 Rohtak MCI PWD (PHD) PWD (PHD)
Jammu & Kashmir
43 Jammu M.Corp. PHED PHED
Karnataka
44 Belgaum M.Corp. KUWSDB Corporation
45 Bellary CMC KUWSDB Municipality
46 Davangere MCI KUWSDB Council
47 Gadag-Betigeri CMC KUWSDB Council
3 1 9
Sl. City/Town Institutional Arrangements for Water supply 199
No. Capital works Operation & Maintenance
1 2 3

7/21/2019 Status Watersupply
http://slidepdf.com/reader/full/status-watersupply 340/869
48 Gulbarga M.Corp. KUWSDB Corporation
49 Hubli-Dharwar M.Corp. KUWSDB Corporation50 Mandya M KUWSDB KUWSDB & CMC
51 Mangalore M.Corp. KUWSDB Corporation
52 Mysore M.Corp. KUWSDB Corporation
53 Shimoga CMC KUWSDB Municipality
54 Tumkur M KUWSDB Municipality
Kerala
55 Alappuzha MC KWA KWA
56 Kollam MC KWA KWA
57 Kozhikode M.Corp. KWA KWA
58 Thalaserry M KWA KWA
59 Thiruvananthapuram M.Corp. KWA KWA
Madhya Pradesh
60 Bhind M Municipality & PHED Municipality & PHED
61 Burhanpur M.Corp. n.a. Municipality
62 Dewas M.Corp. Corporation Corporation
63 Guna M PHED Municipality
64 Gwalior M.Corp. Corporation Corporation
65 Jabalpur M.Corp. Corporation Corporation
66 Khandwa M Corporation Corporation
67 Morena M Municipality Municipality
68 Murwara (Katni) M.Corp. PHED & Corporation Corporation
69 Ratlam M.Corp. PHED Corporation
70 Rewa M.Corp. PHED PHED
71 Satna M.Corp. PHED PHED
72 Shivpuri M PHED Municipality
3 2 0
Sl. City/Town Institutional Arrangements for Water supply 199
No. Capital works Operation & Maintenance
1 2 3
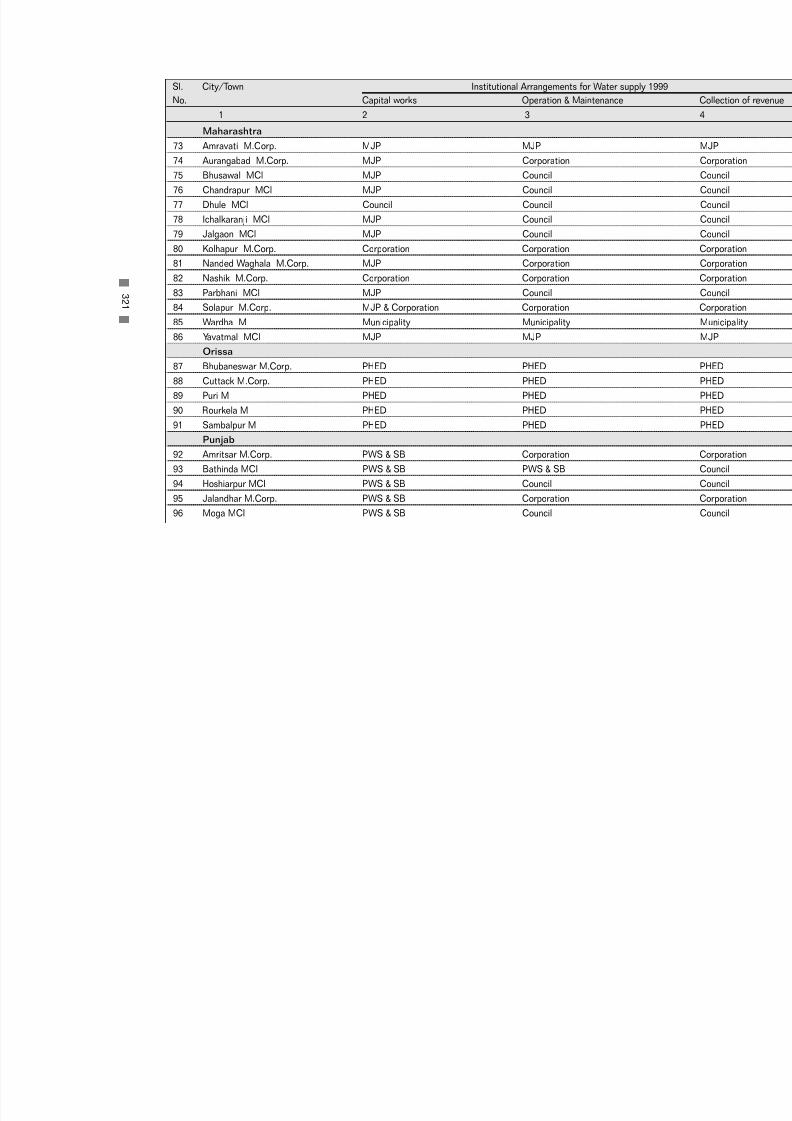
7/21/2019 Status Watersupply
http://slidepdf.com/reader/full/status-watersupply 341/869
Maharashtra
73 Amravati M.Corp. MJP MJP74 Aurangabad M.Corp. MJP Corporation
75 Bhusawal MCl MJP Council
76 Chandrapur MCl MJP Council
77 Dhule MCl Council Council
78 Ichalkaranji MCl MJP Council
79 Jalgaon MCl MJP Council
80 Kolhapur M.Corp. Corporation Corporation
81 Nanded Waghala M.Corp. MJP Corporation
82 Nashik M.Corp. Corporation Corporation
83 Parbhani MCl MJP Council
84 Solapur M.Corp. MJP & Corporation Corporation
85 Wardha M Municipality Municipality
86 Yavatmal MCl MJP MJP
Orissa
87 Bhubaneswar M.Corp. PHED PHED
88 Cuttack M.Corp. PHED PHED
89 Puri M PHED PHED
90 Rourkela M PHED PHED
91 Sambalpur M PHED PHED
Punjab
92 Amritsar M.Corp. PWS & SB Corporation
93 Bathinda MCI PWS & SB PWS & SB
94 Hoshiarpur MCI PWS & SB Council
95 Jalandhar M.Corp. PWS & SB Corporation
96 Moga MCI PWS & SB Council
3 2 1
Sl. City/Town Institutional Arrangements for Water supply 199
No. Capital works Operation & Maintenance
1 2 3

7/21/2019 Status Watersupply
http://slidepdf.com/reader/full/status-watersupply 342/869
97 Pathankot MCI PWS & SB Council
98 Patiala M.Corp. PWS & SB CorporationRajasthan
99 Ajmer MCI PHED PHED
100 Alwar M PHED PHED
101 Beawar M PHED PHED
102 Bhilwara M PHED PHED
103 Bikaner M PHED PHED
104 Jodhpur M.Corp. PHED PHED
105 Kota M.Corp. PHED PHED
106 Sriganganagar M PHED PHED
Tamil Nadu
107 Cuddalore M TWAD Board Municipality
108 Dindigul M TWAD Board Municipality
109 Erode M TWAD Board Municipality
110 Kanchipuram M TWAD Board Municipality
111 Kumbakonam M TWAD Board Municipality
112 Nagercoil M TWAD Board Municipality
113 Rajapalayam M TWAD Board Municipality
114 Salem M.Corp. Corporation Corporation
115 Thanjavur M TWAD Board Municipality
116 Tiruchirapalli M.Corp. TWAD Board Corporation
117 Tirunelveli M.Corp. TWAD Board Corporation
118 Tirunvannamalai M TWAD Board Municipality
119 Tiruppur M TWAD Board Municipality
120 Tuticorin M TWAD Board Municipality
121 Vellore M TWAD Board Municipality
3 2 2
Sl. City/Town Institutional Arrangements for Water supply 199
No. Capital works Operation & Maintenance
1 2 3

7/21/2019 Status Watersupply
http://slidepdf.com/reader/full/status-watersupply 343/869
Uttar Pradesh
122 Agra M.Corp. Jal Nigam Jal Sansthan123 Aligarh M.Corp. Jal Nigam Corporation
124 Allahabad M.Corp. Jal Nigam Jal Sansthan
125 Bareilly M.Corp. Jal Nigam Corporation
126 Etawah MB Municipality Municipality
127 Faizabad MB Jal Nigam Municipality
128 Firozabad MB Municipality Municipality
129 Ghaziabad M.Corp. Jal Nigam Corporation
130 Gorakhpur M.Corp. Jal Nigam Corporation
131 Haldwani-cum-Kathgodam MB Jal Nigam Kumaun Jal Sansthan
132 Hapur MB Municipality Municipality
133 Hardwar MB Jal Nigam Municipality
134 Jhansi MB Jal Nigam Jal Sansthan
135 Mathura MB Jal Nigam Municipality
136 Meerut M.Corp. Corporation Corporation
137 Mirzapur MB Jal Nigam Municipality
138 Moradabad M.Corp. Jal Nigam Corporation
139 Muzaffarnagar MB Jal Nigam Municipality
140 Rae Bareli MB Jal Nigam Municipality
141 Rampur MB Municipality Municipality
142 Saharanpur MB Jal Nigam Municipality
143 Sitapur MB Jal Nigam Municipality
144 Unnao MB Jal Nigam Municipality
West Bengal
145 Asansol M.Corp. PHED PHED & Corporation
146 Baharampur M Municipality Municipality
3 2 3
Sl. City/Town Institutional Arrangements for Water supply 199
No. Capital works Operation & Maintenance
1 2 3

7/21/2019 Status Watersupply
http://slidepdf.com/reader/full/status-watersupply 344/869
147 Balurghat M PHED PHED
148 Bankura M PHED Municipality149 Barasat M Municipality & CMWSA Municipality & CMWSA
150 Burdwan M Municipality Municipality
151 Halisahar M Municipality Municipality
152 Krishnagar M PHED Municipality
153 Midnapore M PHED Municipality
154 North Barrackpore M Municipality Municipality
155 Santipur M PHED PHED
156 Silliguri M.Corp. PHED PHED
Small States
Assam
157 Guwahati M.Corp. Corporation Corporation158 Jorhat MB n.a. n.a.
Manipur
159 Imphal MCI PHED PHED
Meghalaya
160 Shillong MB PHED PHED
Mizoram
161 Aizwal NM PHED PHED
Tripura
162 Agartala MCI PHED PHED
Union Territories
163 Chandigarh M.Corp. Corporation Corporation
164 Pondicherry M PWD PWD
Source: Respective urban local governments/relevant agencies, NIUA Survey,1999.
3 2 4
Sl. City/Town Institutional Arrangements for Water supply 199
No. Capital works Operation & Maintenance
1 2 3

7/21/2019 Status Watersupply
http://slidepdf.com/reader/full/status-watersupply 345/869
CLASS II
Andhra Pradesh1 Anakapalle M PHED Municipality
2 Dharmavaram M PHED Municipality
3 Gudur MCI PHED Council
4 Kapra M HMWS & SB HMWS & SB
5 Kavali MCI PHED Municipality
6 Madanapalle M PHED Municipality
7 Narasaraopet M PHED Municipality
8 Rajendra nagar MCI PHED PHED & Municipality
9 Sangareddy MCI PHED Municipality
10 Srikakulam MCI PHED Municipality
11 Srikalahasti M Municipality Municipality12 Suryapet MCI PHED Council
Bihar
13 Buxar M Bihar Jal Parishad PHED
14 Deoghar M Municipality Municipality
15 Hajipur M PHED PHED
16 Hazaribagh M PHED Municipality
17 Jehanabad M Municipality Municipality
18 Madhubani M Municipality Municipality
19 Mokama M PHED PHED
Gujarat
20 Amreli M nagarpalika nagarpalika
21 Ankleswar M nagarpalika nagarpalika
22 Dabhoi M nagarpalika nagarpalika
23 Dohad M nagarpalika nagarpalika
24 Gondal M nagarpalika nagarpalika
3 2 5
Sl. City/Town Institutional Arrangements for Water supply 199
No. Capital works Operation & Maintenance
1 2 3

7/21/2019 Status Watersupply
http://slidepdf.com/reader/full/status-watersupply 346/869
25 Jetpur M nagarpalika nagarpalika
26 Mahesana M nagarpalika nagarpalika27 Palanpur M nagarpalika nagarpalika
Haryana
28 Jind MCI PHD PHD
29 Kaithal MCI PHD PHD
30 Rewari MCI PHD PHD
31 Thanesar MCI PHD PHD
Karnataka
32 Bagalkot CMC KUWSDB & PWD Municipality
33 Chikmaglur CMC PWD & Council Council
34 Gokak CMC KUWSDB Council
35 Hospet CMC KUWSDB Council36 Kolar CMC KUWSDB Council
37 Rabkavi-Banhatti CMC KUWSDB Council
38 Ramanagaram CMC KUWSDB Council
Kerala
39 Changanessary MC KWA KWA
40 Payyanur M KWA KWA
41 Taliparamba M KWA KWA
42 Thrissur MC KWA Council
Madhya Pradesh
43 Hoshangabad M Municipality Municipality
44 Itarsi M Municipality Municipality
45 Khargone M Municipality Municipality
46 Mandsaur M Municipality Municipality
47 Nagda M Municipality Municipality
48 Neemuch M Municipality Municipality
3 2 6
Sl. City/Town Institutional Arrangements for Water supply 199
No. Capital works Operation & Maintenance
1 2 3
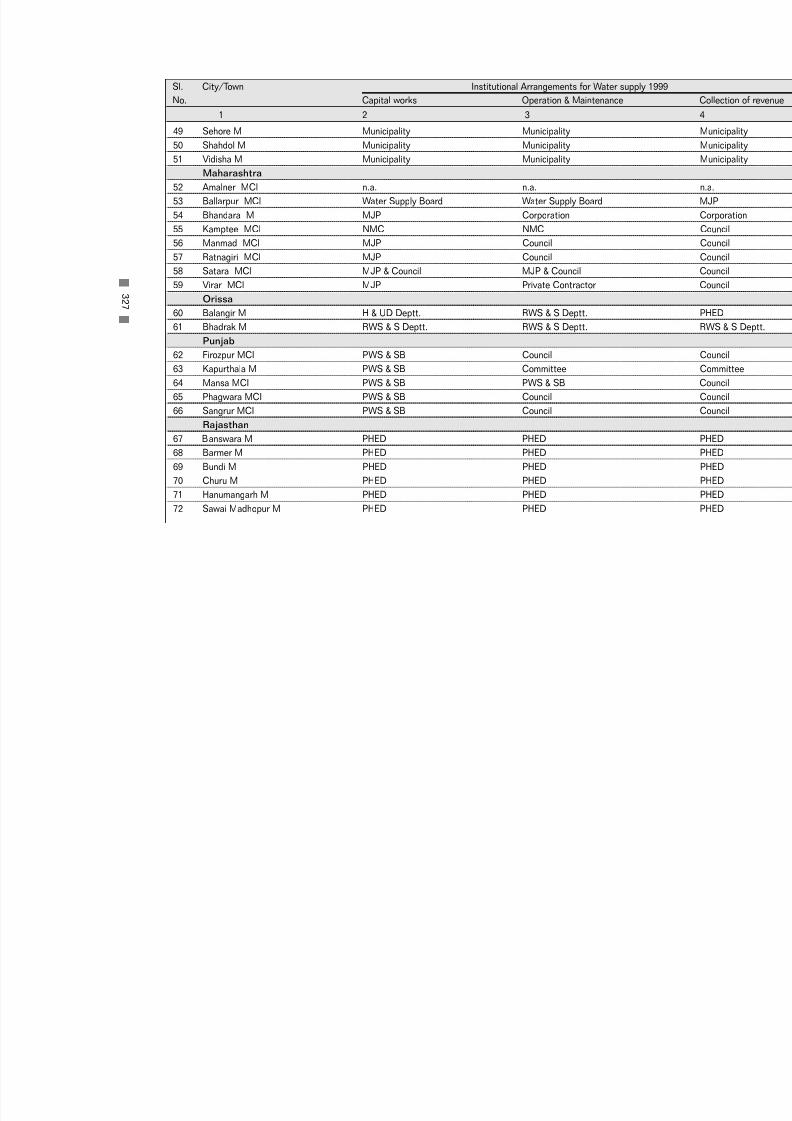
7/21/2019 Status Watersupply
http://slidepdf.com/reader/full/status-watersupply 347/869
49 Sehore M Municipality Municipality
50 Shahdol M Municipality Municipality51 Vidisha M Municipality Municipality
Maharashtra
52 Amalner MCl n.a. n.a.
53 Ballarpur MCl Water Supply Board Water Supply Board
54 Bhandara M MJP Corporation
55 Kamptee MCl NMC NMC
56 Manmad MCl MJP Council
57 Ratnagiri MCl MJP Council
58 Satara MCl MJP & Council MJP & Council
59 Virar MCl MJP Private Contractor
Orissa60 Balangir M H & UD Deptt. RWS & S Deptt.
61 Bhadrak M RWS & S Deptt. RWS & S Deptt.
Punjab
62 Firozpur MCI PWS & SB Council
63 Kapurthala M PWS & SB Committee
64 Mansa MCI PWS & SB PWS & SB
65 Phagwara MCI PWS & SB Council
66 Sangrur MCI PWS & SB Council
Rajasthan
67 Banswara M PHED PHED
68 Barmer M PHED PHED
69 Bundi M PHED PHED
70 Churu M PHED PHED
71 Hanumangarh M PHED PHED
72 Sawai Madhopur M PHED PHED
3 2 7
Sl. City/Town Institutional Arrangements for Water supply 199
No. Capital works Operation & Maintenance
1 2 3

7/21/2019 Status Watersupply
http://slidepdf.com/reader/full/status-watersupply 348/869
Tamil Nadu
73 Ambur M TWAD Board Municipality74 Arakkonam M TWAD Board Municipality
75 Attur M TWAD Board TWAD Board
76 Cumbum M TWAD Board TWAD Board & Municipality
77 Dharmapuri M TWAD Board Municipality
78 Guduivattam M TWAD Board Municipality
79 Nagapattinam M TWAD Board TWAD Board & Municipality
80 Pudukkottai M TWAD Board Municipality
81 Sivakasi M TWAD Board Municipality
82 Srivilliputtur M TWAD Board Municipality
83 Tindivanam MC M Council M Council
84 Udhagamandalam M TWAD Board MunicipalityUttar Pradesh
85 Auraiya MB Municipality Municipality
86 Balrampur MB Jal Nigam Municipality
87 Basti MB Jal Nigam Municipality
88 Bhadohi MB Jal Nigam Municipality
89 Chandpur MB Municipality Municipality
90 Etah MB Jal Nigam Jal Sansthan
91 Ghazipur MB Jal Nigam Municipality
92 Gonda MB Jal Nigam Municipality
93 Lakhimpur MB Jal Nigam Municipality
94 Lalitpur MB Jal Nigam Jal Sansthan
95 Mughalsarai MB Jal Nigam Municipality
96 Nawabganj-Barabanki MB Municipality Municipality
97 Orai MB Jal Nigam Jal Sansthan
98 Roorkee MB Jal Nigam Municipality
3 2 8
Sl. City/Town Institutional Arrangements for Water supply 199
No. Capital works Operation & Maintenance
1 2 3

7/21/2019 Status Watersupply
http://slidepdf.com/reader/full/status-watersupply 349/869
West Bengal
99 Bishnupur M PHED PHED & Corporation100 Chakdaha M PHED PHED
101 Contai M PHED PHED
102 Cooch Behar M PHED P
103 Darjeeling M Municipality Municipality
104 Jalpaiguri M PHED PHED & Corporation
105 Jangipur M PHED PHED
106 Katwa M PHED Municipality
107 Raniganj M PHED & Municipality PHED & Municipality
Small States
Himachal Pradesh
108 Shimla M.Corp. PHD & Irrigation Deptt. PHD, Irrigation Deptt. & CorporatioNagaland
109 Kohima TC PHED PHED
Union Teritories
110 Port Balir MCI APWD APWD & Council
Others (Smaller than Class II towns)
Small States
Arunachal Pradesh
111 Itanagar CT PHED PHED
Goa
112 Panaji MCI PWD PWD
Union Territories
113 Daman MCI PWD PWD
114 Kavarathi NMCT LPWD LPWD
115 Silvassa PWD PWD
Source: Respective urban local governments/relevant agencies, NIUA Survey,1999.
3 2 9
Sl. City/Town Institutional Arrangements for Water supply 199
No. Capital works Operation & Maintenance
1 2 3

7/21/2019 Status Watersupply
http://slidepdf.com/reader/full/status-watersupply 350/869

7/21/2019 Status Watersupply
http://slidepdf.com/reader/full/status-watersupply 351/869
A -1 1
S T A F F P O
S I T I O N ,1 9 9 9

7/21/2019 Status Watersupply
http://slidepdf.com/reader/full/status-watersupply 352/869

7/21/2019 Status Watersupply
http://slidepdf.com/reader/full/status-watersupply 353/869
Metropolitan Cities
1 Ahmedabad M.Corp. 270 n.a. 1080 1350 0.4
2 Bangalore M.Corp. Break-up not available 3096 0.6
3 Bhopal M.Corp. 6 42 422 470 0.3
4 Calcutta M.Corp. 5 292 4070 4367 0.7
5 Chennai M.Corp. 30 1325 4603 5958 1.4
6 Coimbatore M.Corp 0 22 181 203 0.2
7 Delhi M.Corp. 147 3610 18974 22731 1.9
8 Greater Mumbai M.Corp. 833 727 6738 8298 0.7
9 Hyderabad M.Corp. Break-up not available 5460 1.3
10 Indore M.Corp. 381 328 171 880 1.5
11 Jaipur M.Corp. 88 n.a. 2645 2733 1.4
12 Kanpur M.Corp. 27 123 2175 2325 0.9
13 Kochi M.Corp. 4 28 94 126 0.2
14 Lucknow M.Corp. 41 72 2487 2600 1.0
15 Ludhiana M.Corp. 5 33 487 525 0.3
16 Madurai M.Corp. 0 9 70 79 0.1
17 Nagpur M.Corp. 0 157 591 748 0.4
18 Pune M.Corp. 5 1671 110 1786 0.8
19 Surat M.Corp. 8 66 530 604 0.3
20 Vadodara M.Corp. 4 34 757 795 0.621 Varanasi M.Corp. 15 316 419 750 0.7
22 Visakhapatnam M.Corp. 4 25 495 524 0.4
# data of pipe length not available Source: Respective urban local governments/relevant agencies, NIUA Survey,1999.
3 3 3
Sl. City/Town Managerial Technical Operation and Total staff Staff per 100No. staff staff maintenance population
staff
1 2 3 4 5 6
A-11 : Staff Position, 1999
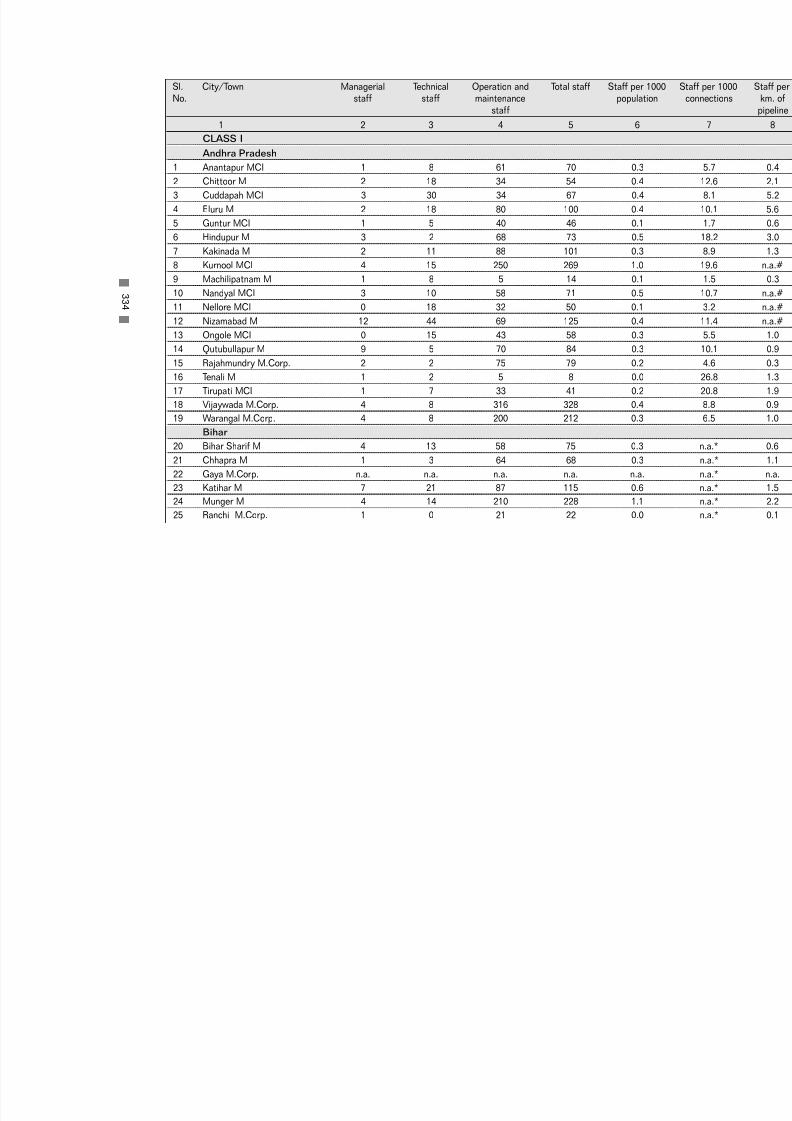
7/21/2019 Status Watersupply
http://slidepdf.com/reader/full/status-watersupply 354/869
CLASS I
Andhra Pradesh
1 Anantapur MCI 1 8 61 70 0.3
2 Chittoor M 2 18 34 54 0.4
3 Cuddapah MCI 3 30 34 67 0.4
4 Eluru M 2 18 80 100 0.4
5 Guntur MCI 1 5 40 46 0.1
6 Hindupur M 3 2 68 73 0.5
7 Kakinada M 2 11 88 101 0.3
8 Kurnool MCI 4 15 250 269 1.0
9 Machilipatnam M 1 8 5 14 0.1
10 Nandyal MCI 3 10 58 71 0.5
11 Nellore MCI 0 18 32 50 0.1
12 Nizamabad M 12 44 69 125 0.4
13 Ongole MCI 0 15 43 58 0.3
14 Qutubullapur M 9 5 70 84 0.3
15 Rajahmundry M.Corp. 2 2 75 79 0.2
16 Tenali M 1 2 5 8 0.0
17 Tirupati MCI 1 7 33 41 0.2
18 Vijaywada M.Corp. 4 8 316 328 0.4
19 Warangal M.Corp. 4 8 200 212 0.3
Bihar
20 Bihar Sharif M 4 13 58 75 0.321 Chhapra M 1 3 64 68 0.3
22 Gaya M.Corp. n.a. n.a. n.a. n.a. n.a.
23 Katihar M 7 21 87 115 0.6
24 Munger M 4 14 210 228 1.1
25 Ranchi M.Corp. 1 0 21 22 0.0
3 3 4
Sl. City/Town Managerial Technical Operation and Total staff Staff per 100No. staff staff maintenance population
staff
1 2 3 4 5 6

7/21/2019 Status Watersupply
http://slidepdf.com/reader/full/status-watersupply 355/869
Gujarat
26 Anand M 4 n.a. 34 38 0.2
27 Bharuch M 2 2 16 20 0.1
28 Bhavnagar M.Corp. 2 15 78 95 0.2
29 Bhuj M 1 55 60 116 1.0
30 Jamnagar M.Corp. 4 10 300 314 0.6
31 Junagadh M 1 6 133 140 0.8
32 Nadiad M 5 n.a. 150 155 0.5
33 Navsari M 13 7 80 100 0.7
34 Porbandar M 2 16 47 65 0.5
35 Rajkot M.Corp. Break-up not available 355 0.4
36 Surendranagar M 1 1 15 17 0.1
Haryana
37 Ambala MCI 2 2 117 121 0.9
38 Faridabad M.Corp. 5 66 675 746 0.6
39 Gurgaon MCI 4 85 122 211 1.2
40 Hisar MCI 5 12 70 87 0.3
41 Karnal MCI 4 24 148 176 0.8
42 Rohtak MCI 7 19 56 82 0.3
Jammu & Kashmir
43 Jammu M.Corp. n.a. n.a. n.a. n.a. n.a.
Karnataka
44 Belgaum M.Corp. 4 2 163 169 0.445 Bellary CMC 0 5 78 83 0.3
46 Davangere MCI 0 3 90 93 0.2
47 Gadag-Betigeri CMC 11 1 133 145 1.0
48 Gulbarga M.Corp. 1 4 151 156 0.3
49 Hubli-Dharwar M.Corp. 6 31 90 127 0.1
3 3 5
Sl. City/Town Managerial Technical Operation and Total staff Staff per 100No. staff staff maintenance population
staff
1 2 3 4 5 6

7/21/2019 Status Watersupply
http://slidepdf.com/reader/full/status-watersupply 356/869
50 Mandya M 1 2 6 9 0.1
51 Mangalore M.Corp. 13 8 97 118 0.3
52 Mysore M.Corp. 20 9 388 417 0.4
53 Shimoga CMC 0 2 91 93 0.4
54 Tumkur M 2 3 93 98 0.3
Kerala
55 Alappuzha MC 0 6 70 76 0.4
56 Kollam MC 0 15 30 45 0.3
57 Kozhikode M.Corp. 0 5 120 125 0.3
58 Thalaserry M 6 15 56 77 0.6
59 Thiruvananthapuram M.Corp. 17 42 213 272 0.5
Madhya Pradesh
60 Bhind M 144 3 22 169 1.0
61 Burhanpur M.Corp. 2 7 120 129 0.6
62 Dewas M.Corp. 1 1 n.a. 2 n.a.
63 Guna M 30 50 50 130 1.0
64 Gwalior M.Corp. 245 48 1511 1804 2.0
65 Jabalpur M.Corp. 26 279 565 870 0.9
66 Khandwa M 2 8 202 212 1.2
67 Morena M 2 3 75 80 0.6
68 Murwara (Katni) M.Corp. 4 30 97 131 0.7
69 Ratlam M.Corp. 6 7 59 72 0.3
70 Rewa M.Corp. 1 3 295 299 1.771 Satna M.Corp. 1 8 229 238 1.2
72 Shivpuri M 30 70 168 268 1.9
Maharashtra
73 Amravati M.Corp. 4 12 246 262 0.5
74 Aurangabad M.Corp. 3 25 390 418 0.5
3 3 6
Sl. City/Town Managerial Technical Operation and Total staff Staff per 100No. staff staff maintenance population
staff
1 2 3 4 5 6
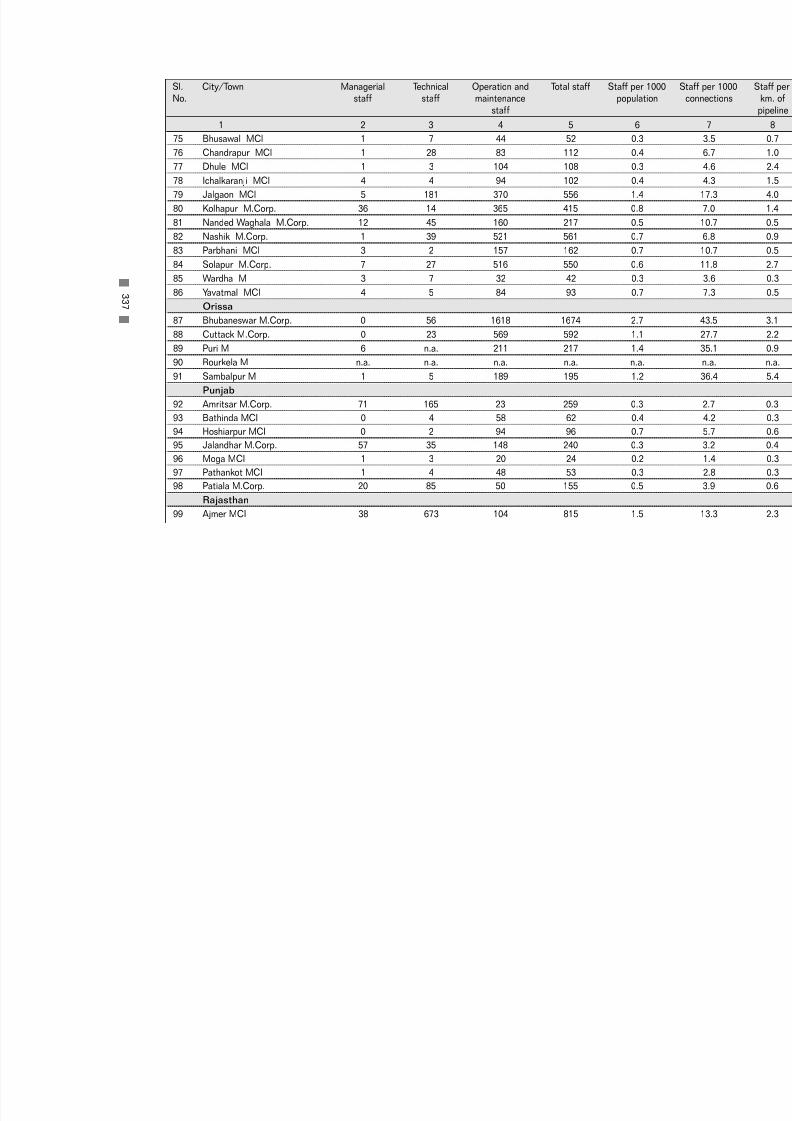
7/21/2019 Status Watersupply
http://slidepdf.com/reader/full/status-watersupply 357/869
75 Bhusawal MCl 1 7 44 52 0.3
76 Chandrapur MCl 1 28 83 112 0.4
77 Dhule MCl 1 3 104 108 0.3
78 Ichalkaranji MCl 4 4 94 102 0.4
79 Jalgaon MCl 5 181 370 556 1.4
80 Kolhapur M.Corp. 36 14 365 415 0.8
81 Nanded Waghala M.Corp. 12 45 160 217 0.5
82 Nashik M.Corp. 1 39 521 561 0.7
83 Parbhani MCl 3 2 157 162 0.7
84 Solapur M.Corp. 7 27 516 550 0.6
85 Wardha M 3 7 32 42 0.3
86 Yavatmal MCl 4 5 84 93 0.7
Orissa
87 Bhubaneswar M.Corp. 0 56 1618 1674 2.7
88 Cuttack M.Corp. 0 23 569 592 1.1
89 Puri M 6 n.a. 211 217 1.4
90 Rourkela M n.a. n.a. n.a. n.a. n.a.
91 Sambalpur M 1 5 189 195 1.2
Punjab
92 Amritsar M.Corp. 71 165 23 259 0.3
93 Bathinda MCI 0 4 58 62 0.4
94 Hoshiarpur MCI 0 2 94 96 0.7
95 Jalandhar M.Corp. 57 35 148 240 0.3
96 Moga MCI 1 3 20 24 0.2
97 Pathankot MCI 1 4 48 53 0.3
98 Patiala M.Corp. 20 85 50 155 0.5
Rajasthan
99 Ajmer MCI 38 673 104 815 1.5
3 3 7
Sl. City/Town Managerial Technical Operation and Total staff Staff per 100No. staff staff maintenance population
staff
1 2 3 4 5 6

7/21/2019 Status Watersupply
http://slidepdf.com/reader/full/status-watersupply 358/869
100 Alwar M 6 584 31 621 2.1
101 Beawar M 7 235 28 270 1.9
102 Bhilwara M 17 6 169 192 0.9
103 Bikaner M 30 543 76 649 1.1
104 Jodhpur M.Corp. 81 924 260 1265 1.3
105 Kota M.Corp. 7 442 57 506 0.7
106 Sriganganagar M 27 83 18 128 0.6
Tamil Nadu
107 Cuddalore M 0 4 6 10 0.1
108 Dindigul M 0 5 69 74 0.3
109 Erode M 0 8 26 34 0.2
110 Kanchipuram M 1 3 26 30 0.2
111 Kumbakonam M 0 7 27 34 0.2
112 Nagercoil M 0 6 18 24 0.1
113 Rajapalayam M 1 2 52 55 0.4
114 Salem M.Corp. 0 18 106 124 0.3
115 Thanjavur M 1 4 75 80 0.4
116 Tiruchirapalli M.Corp. 0 26 33 59 0.1
117 Tirunelveli M.Corp. 1 31 30 62 0.1
118 Tirunvannamalai M 0 15 51 66 0.5
119 Tiruppur M n.a. n.a. n.a. n.a. n.a.
120 Tuticorin M 1 9 55 65 0.3
121 Vellore M n.a. 160 160 0.9
Uttar Pradesh
122 Agra M.Corp. 3 37 701 741 0.6
123 Aligarh M.Corp. 6 10 150 166 0.3
124 Allahabad M.Corp. 22 40 827 889 0.9
125 Bareilly M.Corp. 7 123 187 317 0.4
3 3 8
Sl. City/Town Managerial Technical Operation and Total staff Staff per 100No. staff staff maintenance population
staff
1 2 3 4 5 6

7/21/2019 Status Watersupply
http://slidepdf.com/reader/full/status-watersupply 359/869
126 Etawah MB 2 2 140 144 1.0
127 Faizabad MB 2 102 3 107 0.6
128 Firozabad MB 4 50 26 80 0.3
129 Ghaziabad M.Corp. 8 17 218 243 0.3
130 Gorakhpur M.Corp. 1 56 103 160 0.3
131 Haldwani-cum-Kathgodam MB 24 47 18 89 0.6
132 Hapur MB 2 6 60 68 0.3
133 Hardwar MB 1 2 174 177 0.6
134 Jhansi MB 10 7 156 173 0.3
135 Mathura MB 1 3 89 93 0.8
136 Meerut M.Corp. 12 120 24 156 0.1
137 Mirzapur MB 1 2 54 57 0.5
138 Moradabad M.Corp. 3 37 67 107 0.2
139 Muzaffarnagar MB 2 3 73 78 0.2
140 Rae Bareli MB 1 60 18 79 0.5
141 Rampur MB 3 n.a. 49 52 0.2
142 Saharanpur MB 2 4 163 169 0.3
143 Sitapur MB 4 0 66 70 0.5
144 Unnao MB 2 2 58 62 0.5
West Bengal
145 Asansol M.Corp. 2 5 35 42 0.2
146 Baharampur M 1 0 44 45 0.3
147 Balurghat M 3 9 12 24 0.2148 Bankura M 9 18 50 77 0.5
149 Barasat M 0 1 13 14 0.1
150 Burdwan M 6 2 91 99 0.3
151 Halisahar M 1 2 13 16 0.1
152 Krishnagar M 1 5 75 81 0.6
3 3 9
Sl. City/Town Managerial Technical Operation and Total staff Staff per 100No. staff staff maintenance population
staff
1 2 3 4 5 6

7/21/2019 Status Watersupply
http://slidepdf.com/reader/full/status-watersupply 360/869
153 Midnapore M 2 6 47 55 0.3
154 North Barrackpore M n.a. n.a. n.a. n.a. n.a.
155 Santipur M 0 2 8 10 0.1
156 Silliguri M.Corp. n.a. n.a. n.a. n.a. n.a.
Small States
Assam
157 Guwahati M.Corp. 2 11 302 315 0.3
158 Jorhat MB n.a. n.a. n.a. n.a. n.a.
Manipur
159 Imphal MCI 4 54 408 466 1.9
Meghalaya
160 Shillong MB 5 4 61 70 0.3
Mizoram
161 Aizwal NM n.a. n.a. n.a. n.a. n.a.
Tripura
162 Agartala MCI 3 29 65 97 0.5
Union Territories
163 Chandigarh M.Corp. 184 0 680 864 1.0
164 Pondicherry M 0 11 598 609 2.1
* Data of Total Domestic Connections not available ( or only partial data available) ; # data of pipe length not available High figures of Managerial, Technical, O&M Staff in many cases could be inclusive of the staff for sewerage and drainage
Source: Respective urban local governments/relevant agencies, NIUA Survey,1999.
3 4 0
Sl. City/Town Managerial Technical Operation and Total staff Staff per 100No. staff staff maintenance population
staff
1 2 3 4 5 6

7/21/2019 Status Watersupply
http://slidepdf.com/reader/full/status-watersupply 361/869
CLASS II
Andhra Pradesh
1 Anakapalle M 2 2 22 26 0.2
2 Dharmavaram M 2 6 46 54 0.5
3 Gudur MCI 1 3 8 12 0.2
4 Kapra M 7 5 11 23 0.2
5 Kavali MCI 1 10 85 96 1.1
6 Madanapalle M 1 3 125 129 1.3
7 Narasaraopet M 1 1 23 25 0.3
8 Rajendra nagar MCI 1 9 26 36 0.3
9 Sangareddy MCI 2 2 29 33 0.6
10 Srikakulam MCI 3 4 20 27 0.311 Srikalahasti M 1 3 38 42 0.6
12 Suryapet MCI 4 2 81 87 2.6
Bihar
13 Buxar M 1 3 213 217 3.2
14 Deoghar M 2 9 13 24 0.4
15 Hajipur M 1 0 27 28 0.2
16 Hazaribagh M 6 47 39 92 0.8
17 Jehanabad M 5 19 63 87 1.5
18 Madhubani M 9 22 158 189 2.9
19 Mokama M n.a. n.a. n.a. n.a. n.a.
Gujarat
20 Amreli M 1 5 83 89 1.0
21 Ankleswar M 2 2 50 54 0.9
22 Dabhoi M 2 2 15 19 0.3
23 Dohad M 1 24 66 91 1.2
3 4 1
Sl. City/Town Managerial Technical Operation and Total staff Staff per 100No. staff staff maintenance population
staff
1 2 3 4 5 6

7/21/2019 Status Watersupply
http://slidepdf.com/reader/full/status-watersupply 362/869
24 Gondal M 1 2 58 61 0.6
25 Jetpur M 1 3 23 27 0.2
26 Mahesana M 1 0 22 23 0.2
27 Palanpur M 2 38 21 61 0.5
Haryana
28 Jind MCI 5 9 36 50 0.4
29 Kaithal MCI 3 15 50 68 0.7
30 Rewari MCI 3 3 124 130 1.2
31 Thanesar MCI 3 63 40 106 1.1
Karnataka
32 Bagalkot CMC 3 4 27 34 0.3
33 Chikmaglur CMC 0 2 28 30 0.334 Gokak CMC 0 2 32 34 0.5
35 Hospet CMC 0 2 24 26 0.2
36 Kolar CMC 3 3 53 59 0.5
37 Rabkavi-Banhatti CMC 1 3 15 19 0.3
38 Ramanagaram CMC 1 2 32 35 0.5
Kerala
39 Changanessary MC 0 3 14 17 0.3
40 Payyanur M 3 1 21 25 0.4
41 Taliparamba M 1 4 54 59 1.1
42 Thrissur MC 0 5 67 72 0.8
Madhya Pradesh
43 Hoshangabad M 7 16 85 108 1.1
44 Itarsi M 7 3 72 82 0.8
45 Khargone M 1 3 78 82 1.0
46 Mandsaur M 1 8 83 92 0.7
3 4 2
Sl. City/Town Managerial Technical Operation and Total staff Staff per 100No. staff staff maintenance population
staff
1 2 3 4 5 6

7/21/2019 Status Watersupply
http://slidepdf.com/reader/full/status-watersupply 363/869
47 Nagda M 1 2 39 42 0.4
48 Neemuch M 1 3 126 130 1.3
49 Sehore M 13 5 142 160 1.6
50 Shahdol M 3 3 38 44 0.6
51 Vidisha M 3 3 69 75 0.6
Maharashtra
52 Amalner MCl 2 17 57 76 0.6
53 Ballarpur MCl 0 30 44 74 0.7
54 Bhandara M 1 0 31 32 0.4
55 Kamptee MCl 0 1 17 18 0.2
56 Manmad MCl 1 2 33 36 0.4
57 Ratnagiri MCl 15 2 54 71 1.0
58 Satara MCl 2 13 3 18 0.2
59 Virar MCl 0 1 45 46 0.5
Orissa
60 Balangir M 6 7 114 127 1.5
61 Bhadrak M n.a. n.a. n.a. n.a. n.a.
Punjab
62 Firozpur MCI 4 3 33 40 0.4
63 Kapurthala M 1 2 21 24 0.3
64 Mansa MCI 3 2 25 30 0.5
65 Phagwara MCI 1 2 21 24 0.2
66 Sangrur MCI 1 3 35 39 0.7Rajasthan
67 Banswara M 8 128 5 141 1.3
68 Barmer M 6 0 78 84 1.0
69 Bundi M 6 121 27 154 1.9
3 4 3
Sl. City/Town Managerial Technical Operation and Total staff Staff per 100No. staff staff maintenance population
staff
1 2 3 4 5 6
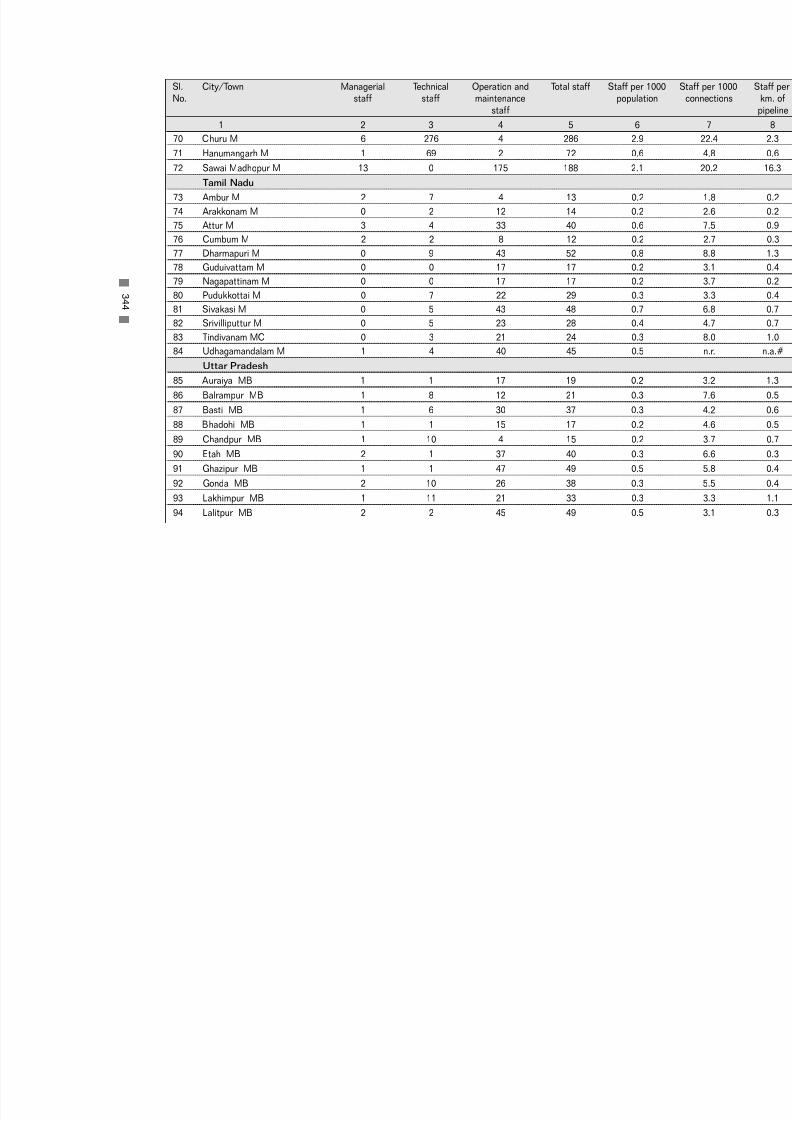
7/21/2019 Status Watersupply
http://slidepdf.com/reader/full/status-watersupply 364/869
70 Churu M 6 276 4 286 2.9
71 Hanumangarh M 1 69 2 72 0.6
72 Sawai Madhopur M 13 0 175 188 2.1
Tamil Nadu
73 Ambur M 2 7 4 13 0.2
74 Arakkonam M 0 2 12 14 0.2
75 Attur M 3 4 33 40 0.6
76 Cumbum M 2 2 8 12 0.2
77 Dharmapuri M 0 9 43 52 0.8
78 Guduivattam M 0 0 17 17 0.2
79 Nagapattinam M 0 0 17 17 0.2
80 Pudukkottai M 0 7 22 29 0.381 Sivakasi M 0 5 43 48 0.7
82 Srivilliputtur M 0 5 23 28 0.4
83 Tindivanam MC 0 3 21 24 0.3
84 Udhagamandalam M 1 4 40 45 0.5
Uttar Pradesh
85 Auraiya MB 1 1 17 19 0.2
86 Balrampur MB 1 8 12 21 0.3
87 Basti MB 1 6 30 37 0.3
88 Bhadohi MB 1 1 15 17 0.2
89 Chandpur MB 1 10 4 15 0.2
90 Etah MB 2 1 37 40 0.3
91 Ghazipur MB 1 1 47 49 0.5
92 Gonda MB 2 10 26 38 0.3
93 Lakhimpur MB 1 11 21 33 0.3
94 Lalitpur MB 2 2 45 49 0.5
3 4 4
Sl. City/Town Managerial Technical Operation and Total staff Staff per 100No. staff staff maintenance population
staff
1 2 3 4 5 6

7/21/2019 Status Watersupply
http://slidepdf.com/reader/full/status-watersupply 365/869
95 Mughalsarai MB 1 1 7 9 0.1
96 Nawabganj-Barabanki MB 2 40 17 59 0.7
97 Orai MB 1 3 69 73 0.4
98 Roorkee MB 0 1 32 33 0.5
West Bengal
99 Bishnupur M 5 1 21 27 0.4
100 Chakdaha M 2 0 3 5 0.1
101 Contai M 1 1 15 17 0.1
102 Cooch Behar M 1 5 35 41 0.4
103 Darjeeling M 4 8 25 37 0.7
104 Jalpaiguri M 2 7 49 58 0.6
105 Jangipur M n.a. n.a. n.a. n.a. n.a.
106 Katwa M 1 5 0 6 0.1
107 Raniganj M 2 18 39 59 0.5
Small States
Himachal Pradesh
108 Shimla M.Corp. 1 8 157 166 2.0
Nagaland
109 Kohima TC 0 8 225 233 2.3
Union Teritories
110 Port Balir MCI 0 5 265 270 2.6
Others (Smaller than Class II towns)
Small States
Arunachal Pradesh
111 Itanagar CT 22 Not available for the town alone n.a. n.a.
3 4 5
Sl. City/Town Managerial Technical Operation and Total staff Staff per 100No. staff staff maintenance population
staff
1 2 3 4 5 6

7/21/2019 Status Watersupply
http://slidepdf.com/reader/full/status-watersupply 366/869
Goa
112 Panaji MCI 4 Not available for the town alone n.a n.a.
Union Territories
113 Daman MCI 5 2 43 50 1.4
114 Kavarathi NMCT 1 2 4 7 0.6
115 Silvassa 10 9 19 38 1.9
* data of Total Domestic Connections not available (or only partial data available) ; # data of pipe length not available ; n.r. = data noHigh figures of Managerial, Technical, O&M Staff in many cases could be inclusive of the staff for sewerage and drainage
Source: Respective urban local governments/relevant agencies, NIUA Survey,1999.
3 4 6
Sl. City/Town Managerial Technical Operation and Total staff Staff per 100No. staff staff maintenance population
staff
1 2 3 4 5 6

7/21/2019 Status Watersupply
http://slidepdf.com/reader/full/status-watersupply 367/869
A -1 2
DE T AI L S OF P R I V
AT I S AT I ONI NW
AT E R
S UP P L Y ,1 9 9 9

7/21/2019 Status Watersupply
http://slidepdf.com/reader/full/status-watersupply 368/869

7/21/2019 Status Watersupply
http://slidepdf.com/reader/full/status-watersupply 369/869
Metropolitan cities
1 Jaipur M.Corp. O & M Pipe lines Contract 1 n.a.
O & M Pipe lines Contract 1 n.a.
2 Ludhiana M.Corp. O & M Tubewells Contract 10 1995
3 Nagpur M.Corp. O & M Pump station n.a. 1 1994
O & M Treatment plant n.a. 1 1994
O & M Pump station n.a. 1 1994
4 Visakhapatnam M.Corp. O & M Pump station, Treatmentplant & Pipe lines Contract n.a. 1995
Source: Respective urban local governments/relevant agencies, NIUA Survey, 1999 3 4 9
Sl. City/Town Activity Specific aspects/areas Privatisation No. of Year
No. mode contractors privatise
1 2 3 4 5 6
A-12 : Details of Privatisation in Water Supply, 1999
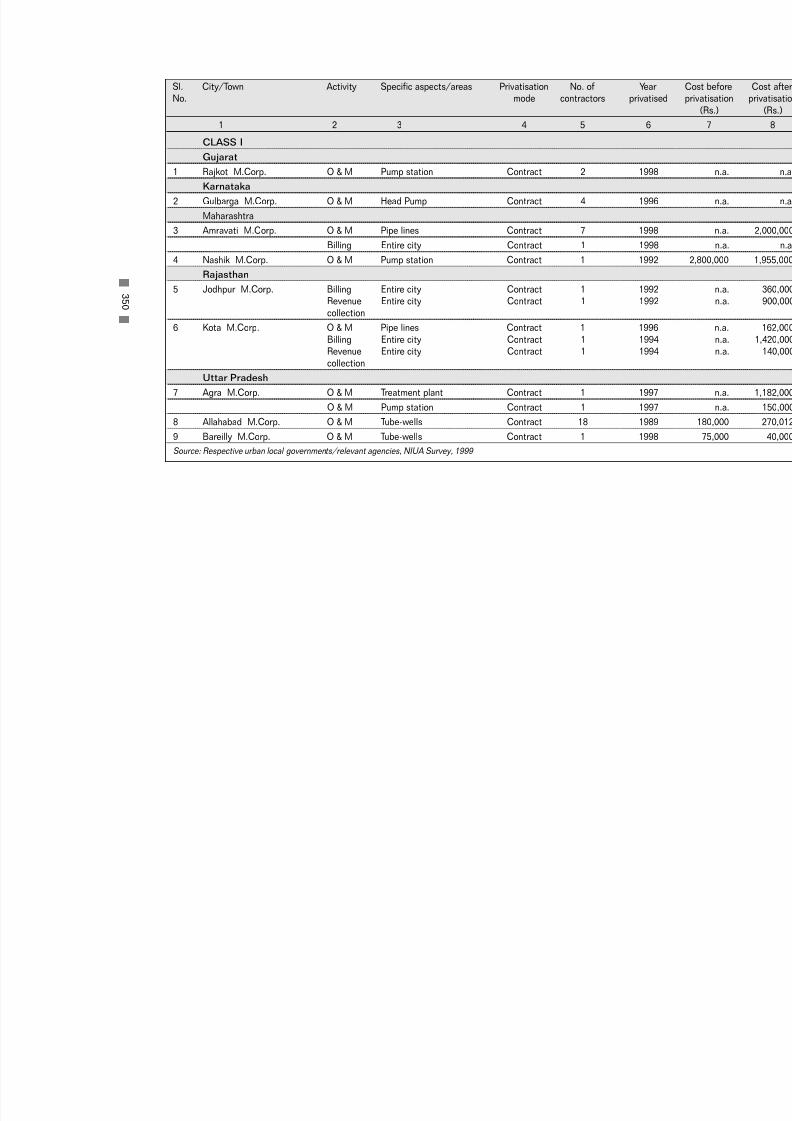
7/21/2019 Status Watersupply
http://slidepdf.com/reader/full/status-watersupply 370/869
3 5 0
CLASS I
Gujarat
1 Rajkot M.Corp. O & M Pump station Contract 2 1998
Karnataka
2 Gulbarga M.Corp. O & M Head Pump Contract 4 1996
Maharashtra
3 Amravati M.Corp. O & M Pipe lines Contract 7 1998
Billing Entire city Contract 1 1998
4 Nashik M.Corp. O & M Pump station Contract 1 1992
Rajasthan
5 Jodhpur M.Corp. Billing Entire city Contract 1 1992
Revenue Entire city Contract 1 1992collection
6 Kota M.Corp. O & M Pipe lines Contract 1 1996
Billing Entire city Contract 1 1994Revenue Entire city Contract 1 1994
collection
Uttar Pradesh
7 Agra M.Corp. O & M Treatment plant Contract 1 1997
O & M Pump station Contract 1 1997
8 Allahabad M.Corp. O & M Tube-wells Contract 18 1989
9 Bareilly M.Corp. O & M Tube-wells Contract 1 1998
Source: Respective urban local governments/relevant agencies, NIUA Survey, 1999
Sl. City/Town Activity Specific aspects/areas Privatisation No. of YearNo. mode contractors privatise
1 2 3 4 5 6

7/21/2019 Status Watersupply
http://slidepdf.com/reader/full/status-watersupply 371/869
3 5 1
CLASS II
Andhra Pradesh
1 Qutubullapur M O & M Pipe line & Bore wells Contract 1 1994
Gujarat
2 Mahesana M O & M Pump station Contract 1 1992
Karnataka
3 Hospet CMC Water n.a. n.a. 3 1996Distribution
Maharashtra
4 Bhandara M O & M Treatment plant Contract 1 1999
5 Bhusawal M.Cl. O & M Pipe lines Contract 1 1998
6 Virar MCl O & M Head work Contract 1 1997O & M Treatment plant Contract 1 1998
Rajasthan
7 Ajmer MCl O & M Pipe lines Contract 2 1996
O & M Pump station Contract 2 1996
8 Barmer M Revenue Entire city Contract 1 1996collection
Billing Entire city Contract 1 1996
9 Bhilwara M Billing Entire city Contract 1 n.a.
10 Bundi M Billing Entire city Contract 1 1994
11 Sriganganagar M Billing Entire city Contract 1 1995
O & M Pipe lines Contract 1 1996O & M Pump station Contract 2 1995
Source: Respective urban local governments/relevant agencies, NIUA Survey, 1999
Sl. City/Town Activity Specific aspects/areas Privatisation No. of YearNo. mode contractors privatise
1 2 3 4 5 6

7/21/2019 Status Watersupply
http://slidepdf.com/reader/full/status-watersupply 372/869

7/21/2019 Status Watersupply
http://slidepdf.com/reader/full/status-watersupply 373/869
A -1 3
R E
V E N UE R E C E I P T S F R O M WA T E R S
UP P L Y
1 9
9 7 - 9 8

7/21/2019 Status Watersupply
http://slidepdf.com/reader/full/status-watersupply 374/869

7/21/2019 Status Watersupply
http://slidepdf.com/reader/full/status-watersupply 375/869
Metropolitan Cities
1 Ahmedabad M.Corp. 219 81 0 0 0 0 46 17 0.4 0.2
2 Bangalore M.Corp. 0 0 0 0 14,329 93 0 0 0 0
3 Bhopal M.Corp. 0 0 0 0 499 100 0 0 0 0
4 Calcutta M.Corp. Break-up not available
5 Chennai M.Corp. 2,118 13 0 0 10,198 63 0 0 0 0
6 Coimbatore M.Corp 435 38 0 0 710 62 0 0 0 0
7 Delhi M.Corp. 0 0 77 1 3,342 44 164 2 3,965 53
8 Greater Mumbai M.Corp. 5,037 14 0 0 30,476 86 0 0 0 0
9 Hyderabad M.Corp. 9,438.24 89 848 8 0 0
10 Indore M.Corp. 239 31 0 0 526 67 13 1.7 0 0
11 Jaipur M.Corp. Break-up not available
12 Kanpur M.Corp. 481 44 597.79 55
13 Kochi M.Corp. 0 0 0 0 725 86 0 0 118 14
14 Lucknow M.Corp. 891 77 0 0 269 23 0 0 0 0
15 Ludhiana M.Corp. 0 0 0 0 335 100 0 0 0 0
16 Madurai M.Corp. 0 0 0 0 233 91 23 9 0 0
17 Nagpur M.Corp. 232 21 0 0 325 29 0 0 13 1.2
18 Pune M.Corp. 0 0 0 0 2,162 100 0 0 0 0
19 Surat M.Corp. 264 41 0 0 149 23 39 6 0 0
20 Vadodara M.Corp. 0 0 0 0 933 94 24 2 0 0
21 Varanasi M.Corp. 423 78 0 0 78 14 1 0.2 0 0
22 Visakhapatnam M.Corp. 140 5 0 0 190 7 423 15 2,121 74
Source: Respective urban local governments/relevant agencies, NIUA Survey, 1999
3 5 5
Sl. City/Town Water Tax Water Cess Water Charges Connection Bulk supply
No. Charges Charges
Rs. % Rs. % Rs. % Rs. % Rs. %
1 2 3 4 5 6 7 8 9 10 11
A-13 : Revenue Receipts from Water Supply, 1997 - 98

7/21/2019 Status Watersupply
http://slidepdf.com/reader/full/status-watersupply 376/869
CLASS I
Andhra Pradesh
1 Anantapur MCI 46 35 44 33 0.7 0.5 6 5 35 27
2 Chittoor M 16 55 0 0 0 0 2 5 12 40
3 Cuddapah MCI 0 0 0 0 13 36 23 64 0 0
4 Eluru M 35 40 0 0 39 45 10 11 0 0
5 Guntur MCI 34 10 0 0 230 67 79 23 0 0
6 Hindupur M 20 100 0 0 0 0 0 0 0 0
7 Kakinada M 45 31 0 0 71 49 28 19 0 0
8 Kurnool MCI 48 100 0 0 0 0 0 0 0 0
9 Machilipatnam M 0 0 0 0 0 0 4 100 0 0
10 Nandyal MCI 24 88 0 0 3 12 0 0 0 011 Nellore MCI 0 0 0 0 89 79.8 23 20 0 0
12 Nizamabad M n.a. n.a. n.a. n.a. n.a. n.a. n.a. n.a. n.a. n.a
13 Ongole MCI Break-up not available
14 Qutubullapur M 0 0 0 0 4 9 20 45 20 45
15 Rajahmundry M.Corp. 74 43 0 0 76 44 22 13 0 0
16 Tenali M 3 48 0 0 1 16 2 36 0 0
17 Tirupati MCI 11 10 0 0 11 10 88 80 0 0
18 Vijaywada M.Corp. 64 13 0 0 50 10 146 30 0 0
19 Warangal M.Corp. 148 28 0 0 310 58 80 15 0 0
Bihar
20 Bihar Sharif M n.a. n.a. n.a. n.a. n.a. n.a. n.a. n.a. n.a. n.a
21 Chhapra M 2 100 0 0 0 0 0 0 0 0
22 Gaya M.Corp. 25 71 0 0 0 0 0 0 10 29
23 Katihar M n.a. n.a. n.a. n.a. n.a. n.a. n.a. n.a. n.a. n.a
24 Munger M Break-up not available
3 5 6
Sl. City/Town Water Tax Water Cess Water Charges Connection Bulk supplyNo. Charges Charges
Rs. % Rs. % Rs. % Rs. % Rs. %
1 2 3 4 5 6 7 8 9 10 11

7/21/2019 Status Watersupply
http://slidepdf.com/reader/full/status-watersupply 377/869
25 Ranchi M.Corp. Break-up not available
Gujarat
26 Anand M n.a. n.a. n.a. n.a. n.a. n.a. n.a. n.a. n.a. n.a
27 Bharuch M 0 0 0 0 44 100 0 0 0 0
28 Bhavnagar M.Corp. 0 0 0 0 255 100 0 0 0 0
29 Bhuj M 0 0 0 0 85 98 2 2 0 0
30 Jamnagar M.Corp. 0 0 0 0 489 97 2 0.3 0 0
31 Junagadh M 0 0 0 0 13 95 0.6 5 0 0
32 Nadiad M 0 0 0 0 46 83 10 17 0 0
33 Navsari M 33 95 0 0 0 0 2 5 0 0
34 Porbandar M 0 0 0 0 12 90 0.4 3 0 0
35 Rajkot M.Corp. 0 0 0 0 258 98 0.4 0.1 0 036 Surendranagar M 9 88 0 0 0 0 0.1 1 0 0
Haryana
37 Ambala MCI 0 0 0 0 52 93 4 7 0 0
38 Faridabad M.Corp. 0 0 0 0 357 100 0 0 0 0
39 Gurgaon MCI 0 0 0 0 53 94 3 6 0 0
40 Hisar MCI 0 0 0 0 58 99 0.6 1 0 0
41 Karnal MCI 0 0 0 0 75 98 2 2 0 0
42 Rohtak MCI 0 0 0 0 62 89 7 11 0 0
Jammu & Kashmir
43 Jammu M.Corp. n.a. n.a. n.a. n.a. n.a. n.a. n.a. n.a. n.a. n.a
Karnataka44 Belgaum M.Corp. 0 0 0 0 132 55 13 6 60 25
45 Bellary CMC 32 22 3 2 100 71 0 0 0 0
46 Davangere MCI 0 0 1 3 40 97 0 0 0 0
47 Gadag-Betigeri CMC 0 0 2 5 38 94 0.5 1.2 0 0
3 5 7
Sl. City/Town Water Tax Water Cess Water Charges Connection Bulk supplyNo. Charges Charges
Rs. % Rs. % Rs. % Rs. % Rs. %
1 2 3 4 5 6 7 8 9 10 11
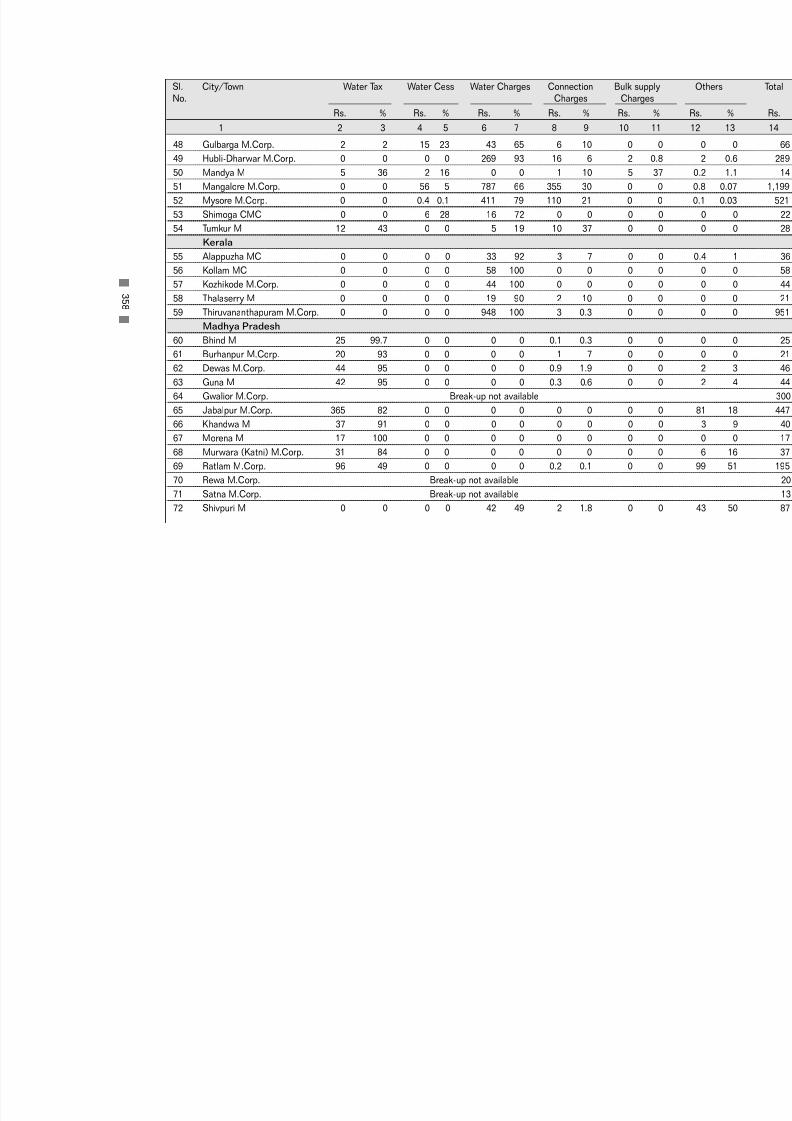
7/21/2019 Status Watersupply
http://slidepdf.com/reader/full/status-watersupply 378/869
48 Gulbarga M.Corp. 2 2 15 23 43 65 6 10 0 0
49 Hubli-Dharwar M.Corp. 0 0 0 0 269 93 16 6 2 0.8
50 Mandya M 5 36 2 16 0 0 1 10 5 37
51 Mangalore M.Corp. 0 0 56 5 787 66 355 30 0 0
52 Mysore M.Corp. 0 0 0.4 0.1 411 79 110 21 0 0
53 Shimoga CMC 0 0 6 28 16 72 0 0 0 0
54 Tumkur M 12 43 0 0 5 19 10 37 0 0
Kerala
55 Alappuzha MC 0 0 0 0 33 92 3 7 0 0
56 Kollam MC 0 0 0 0 58 100 0 0 0 0
57 Kozhikode M.Corp. 0 0 0 0 44 100 0 0 0 0
58 Thalaserry M 0 0 0 0 19 90 2 10 0 059 Thiruvananthapuram M.Corp. 0 0 0 0 948 100 3 0.3 0 0
Madhya Pradesh
60 Bhind M 25 99.7 0 0 0 0 0.1 0.3 0 0
61 Burhanpur M.Corp. 20 93 0 0 0 0 1 7 0 0
62 Dewas M.Corp. 44 95 0 0 0 0 0.9 1.9 0 0
63 Guna M 42 95 0 0 0 0 0.3 0.6 0 0
64 Gwalior M.Corp. Break-up not available
65 Jabalpur M.Corp. 365 82 0 0 0 0 0 0 0 0
66 Khandwa M 37 91 0 0 0 0 0 0 0 0
67 Morena M 17 100 0 0 0 0 0 0 0 0
68 Murwara (Katni) M.Corp. 31 84 0 0 0 0 0 0 0 069 Ratlam M.Corp. 96 49 0 0 0 0 0.2 0.1 0 0
70 Rewa M.Corp. Break-up not available
71 Satna M.Corp. Break-up not available
72 Shivpuri M 0 0 0 0 42 49 2 1.8 0 0
3 5 8
Sl. City/Town Water Tax Water Cess Water Charges Connection Bulk supplyNo. Charges Charges
Rs. % Rs. % Rs. % Rs. % Rs. %
1 2 3 4 5 6 7 8 9 10 11

7/21/2019 Status Watersupply
http://slidepdf.com/reader/full/status-watersupply 379/869
Maharashtra
73 Amravati M.Corp. 0 0 0 0 723 99.7 2 0.3 0 0
74 Aurangabad M.Corp. 358 89 14 4 23 6 0.4 0.1 1 0.3
75 Bhusawal MCl 67 100 0 0 0 0 0.1 0.2 0 0
76 Chandrapur MCl 54 100 0 0 0 0 0 0 0 0
77 Dhule MCl 66 97 0 0 2 3 0.1 0.2 0 0
78 Ichalkaranji MCl 85 99 0 0 0 0 0.3 0.3 0.6 0.7
79 Jalgaon MCl 28 75 0 0 0 0 9 25 0 0
80 Kolhapur M.Corp. 81 9 499 55 0 0 42 5 0 0
81 Nanded Waghala M.Corp. 73 97 0 0 0 0 0.2 0.3 2 2.7
82 Nashik M.Corp. 61 7 0 0 657 77 4 0.5 0.9 0.1
83 Parbhani MCl 43 89 0 0 0 0 2 3 1.0 2.084 Solapur M.Corp. 750 90 0 0 0 0 36 4 0 0
85 Wardha M 28 97 0 0 0 0 0.9 3 0 0
86 Yavatmal MCl 0 0 0 0 183 100 0 0 0 0
Orissa
87 Bhubaneswar M.Corp. 333 98 0 0 8 2 0 0 0 0
88 Cuttack M.Corp. 0 0 0 0 68 82 15 18 0 0
89 Puri M 29 87 0 0 0.3 0.8 4 13 0 0
90 Rourkela M 0 0 0 0 38 93 3 7 0 0
91 Sambalpur M 22 100 0 0 0 0 0 0 0 0
Punjab
92 Amritsar M.Corp. 0 0 0 0 493 100 0 0 0 0
93 Bathinda MCI 0 0 0 0 47 100 0 0 0 0
94 Hoshiarpur MCI 0 0 0 0 63 100 0 0 0 0
95 Jalandhar M.Corp. 0 0 0 0 280 70 0.2 0.1 0 0
96 Moga MCI 0 0 0 0 59 98 1 1.8 0 0
3 5 9
Sl. City/Town Water Tax Water Cess Water Charges Connection Bulk supplyNo. Charges Charges
Rs. % Rs. % Rs. % Rs. % Rs. %
1 2 3 4 5 6 7 8 9 10 11
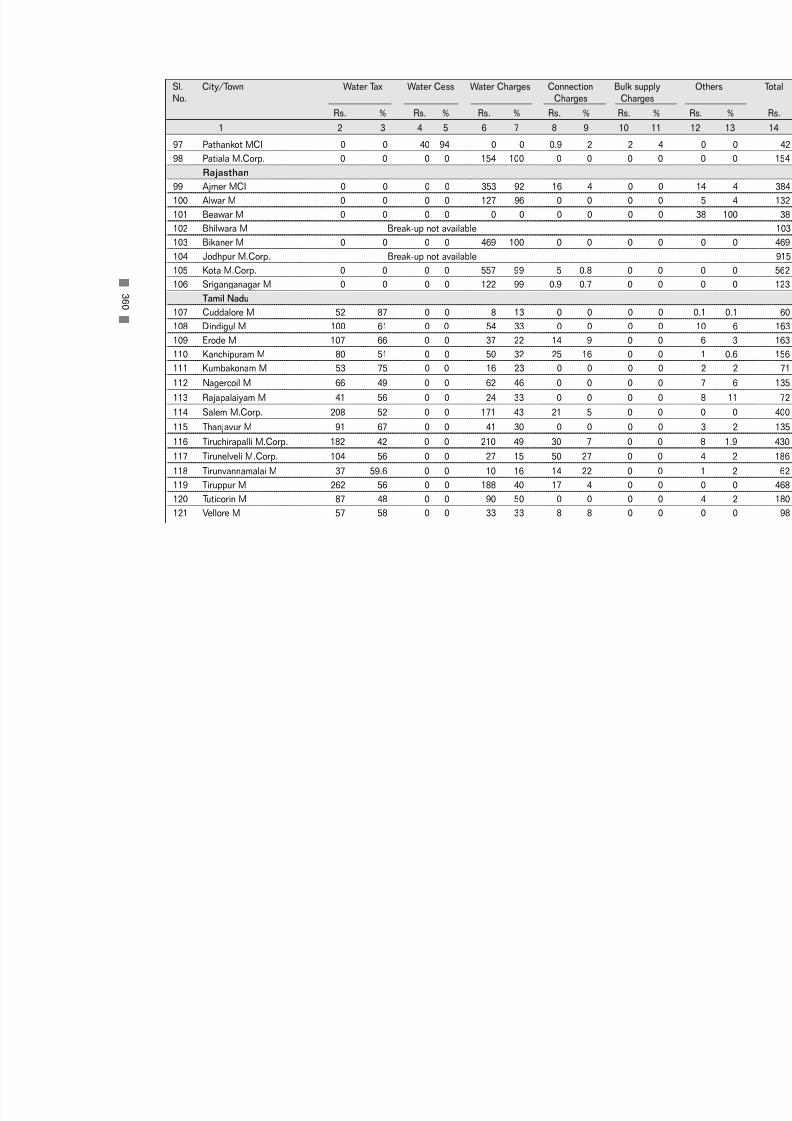
7/21/2019 Status Watersupply
http://slidepdf.com/reader/full/status-watersupply 380/869
97 Pathankot MCI 0 0 40 94 0 0 0.9 2 2 4
98 Patiala M.Corp. 0 0 0 0 154 100 0 0 0 0
Rajasthan
99 Ajmer MCI 0 0 0 0 353 92 16 4 0 0
100 Alwar M 0 0 0 0 127 96 0 0 0 0
101 Beawar M 0 0 0 0 0 0 0 0 0 0
102 Bhilwara M Break-up not available
103 Bikaner M 0 0 0 0 469 100 0 0 0 0
104 Jodhpur M.Corp. Break-up not available
105 Kota M.Corp. 0 0 0 0 557 99 5 0.8 0 0
106 Sriganganagar M 0 0 0 0 122 99 0.9 0.7 0 0
Tamil Nadu107 Cuddalore M 52 87 0 0 8 13 0 0 0 0
108 Dindigul M 100 61 0 0 54 33 0 0 0 0
109 Erode M 107 66 0 0 37 22 14 9 0 0
110 Kanchipuram M 80 51 0 0 50 32 25 16 0 0
111 Kumbakonam M 53 75 0 0 16 23 0 0 0 0
112 Nagercoil M 66 49 0 0 62 46 0 0 0 0
113 Rajapalaiyam M 41 56 0 0 24 33 0 0 0 0
114 Salem M.Corp. 208 52 0 0 171 43 21 5 0 0
115 Thanjavur M 91 67 0 0 41 30 0 0 0 0
116 Tiruchirapalli M.Corp. 182 42 0 0 210 49 30 7 0 0
117 Tirunelveli M.Corp. 104 56 0 0 27 15 50 27 0 0
118 Tirunvannamalai M 37 59.6 0 0 10 16 14 22 0 0
119 Tiruppur M 262 56 0 0 188 40 17 4 0 0
120 Tuticorin M 87 48 0 0 90 50 0 0 0 0
121 Vellore M 57 58 0 0 33 33 8 8 0 0
3 6 0
Sl. City/Town Water Tax Water Cess Water Charges Connection Bulk supplyNo. Charges Charges
Rs. % Rs. % Rs. % Rs. % Rs. %
1 2 3 4 5 6 7 8 9 10 11

7/21/2019 Status Watersupply
http://slidepdf.com/reader/full/status-watersupply 381/869
Uttar Pradesh
122 Agra M.Corp. 155 17 728 79 0 0 0 0 0 0
123 Aligarh M.Corp. 42 34 0 0 80 66 0 0 0 0
124 Allahabad M.Corp. 92 16 473.57 84 0 0 0 0
125 Bareilly M.Corp. 98 80 0 0 20 17 4 3 0 0
126 Etawah MB 17 96 0 0 0.3 2 0 0 0 0
127 Faizabad MB 19 38 0 0 6 12 0 0 0 0
128 Firozabad MB 13 93 0 0 0.7 5 0.01 0.05 0 0
129 Ghaziabad M.Corp. 224 89 0 0 19 8 0 0 0 0
130 Gorakhpur M.Corp. 105 99.8 0 0 0 0 0 0 0.2 0.2
131 Haldwani-cum-Kathgodam MB 44 47 0 0 41 44 0 0 0 0
132 Hapur MB 19 85 0 0 3 12 0.6 2 0 0
133 Hardwar MB 43 91 0 0 4 9 0 0 0 0
134 Jhansi MB 9 9 81 85 0 0 0 0 0.9 0.9
135 Mathura MB 45 98 0 0 0.4 0.8 0.4 0.9 0 0
136 Meerut M.Corp. 0 0 0 0 103 91 11 9 0 0
137 Mirzapur MB 14 80 2 10 0 0 0.01 0.03 0 0
138 Moradabad M.Corp. 0 0 0 0 18 88 2 12 0 0
139 Muzaffarnagar MB 54 62 0 0 22 26 1 1.6 0 0
140 Rae Bareli MB 17 97 0 0 0 0 0 0 0.3 2
141 Rampur MB 10 65 0 0 6 35 0 0 0 0
142 Saharanpur MB 76 96 0.04 0.1 2 2 2 2 0 0
143 Sitapur MB 8 95 0.4 5 0 0 0 0 0 0
144 Unnao MB 8 97 0 0 0 0 0 0 0 0
West Bengal
145 Asansol M.Corp. 0 0 0 0 0 0 15 90 0 0
146 Baharampur M 0 0 0 0 0 0 4 100 0 0
3 6 1
Sl. City/Town Water Tax Water Cess Water Charges Connection Bulk supplyNo. Charges Charges
Rs. % Rs. % Rs. % Rs. % Rs. %
1 2 3 4 5 6 7 8 9 10 11

7/21/2019 Status Watersupply
http://slidepdf.com/reader/full/status-watersupply 382/869
147 Balurghat M n.a. n.a. n.a. n.a. n.a. n.a. n.a. n.a. n.a. n.a
148 Bankura M 0 0 0 0 0 0 3 80 0.7 20
149 Barasat M 0 0 0 0 0 0 6 95 0.3 5
150 Burdwan M 0 0 0 0 0.3 6 5 94 0 0
151 Halisahar M n.a. n.a. n.a. n.a. n.a. n.a. n.a. n.a. n.a. n.a
152 Krishnagar M 0 0 0 0 0 0 3 76 0.5 15
153 Midnapore M 0 0 0 0 0 0 18 99 0.2 0.8
154 North Barrackpore M 0 0 0 0 0 0 2 76 0 0
155 Santipur M 0 0 0 0 0 0 0 0 0.2 100
156 Silliguri M.Corp. n.a. n.a. n.a. n.a. n.a. n.a. n.a. n.a. n.a. n.a
Small States
Assam157 Guwahati M.Corp. 25 59.8 0 0 0 0 10 25 6 15
158 Jorhat MB n.a. n.a. n.a. n.a. n.a. n.a. n.a. n.a. n.a. n.a
Manipur
159 Imphal MCI n.a. n.a. n.a. n.a. n.a. n.a. n.a. n.a. n.a. n.a
Meghalaya
160 Shillong MB 20 64 0 0 5 17 2 8 3 11
Mizoram
161 Aizwal NM 74 94 0 0 0 0 4 6 0 0
Tripura
162 Agartala MCI 20 86 0 0 0 0 1 6 2 8
Union Territories163 Chandigarh M.Corp. 0 0 0 0 1,322 70 79 4 0 0
164 Pondicherry M 0 0 0 0 123 100 0 0 0 0
Source: Respective urban local governments/relevant agencies, NIUA Survey, 1999
3 6 2
Sl. City/Town Water Tax Water Cess Water Charges Connection Bulk supplyNo. Charges Charges
Rs. % Rs. % Rs. % Rs. % Rs. %
1 2 3 4 5 6 7 8 9 10 11
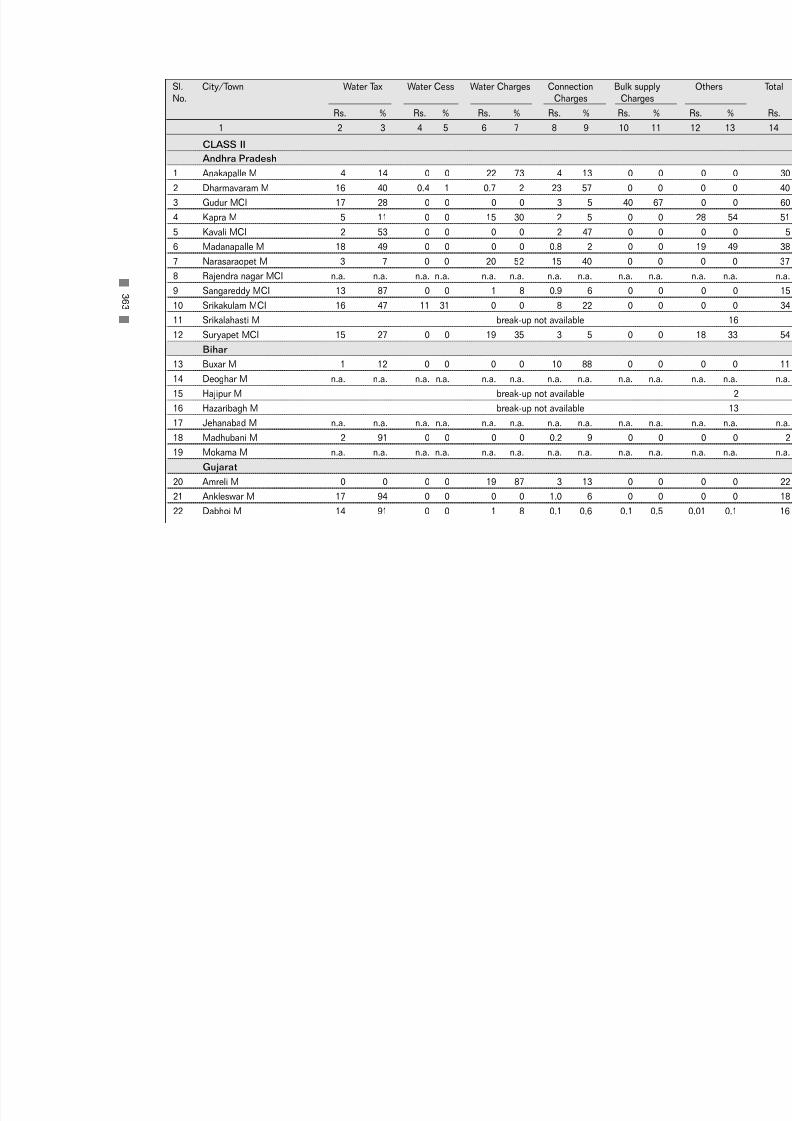
7/21/2019 Status Watersupply
http://slidepdf.com/reader/full/status-watersupply 383/869
CLASS II
Andhra Pradesh
1 Anakapalle M 4 14 0 0 22 73 4 13 0 0
2 Dharmavaram M 16 40 0.4 1 0.7 2 23 57 0 0
3 Gudur MCI 17 28 0 0 0 0 3 5 40 67
4 Kapra M 5 11 0 0 15 30 2 5 0 0
5 Kavali MCI 2 53 0 0 0 0 2 47 0 0
6 Madanapalle M 18 49 0 0 0 0 0.8 2 0 0
7 Narasaraopet M 3 7 0 0 20 52 15 40 0 0
8 Rajendra nagar MCI n.a. n.a. n.a. n.a. n.a. n.a. n.a. n.a. n.a. n.a
9 Sangareddy MCI 13 87 0 0 1 8 0.9 6 0 0
10 Srikakulam MCI 16 47 11 31 0 0 8 22 0 0
11 Srikalahasti M break-up not available
12 Suryapet MCI 15 27 0 0 19 35 3 5 0 0
Bihar
13 Buxar M 1 12 0 0 0 0 10 88 0 0
14 Deoghar M n.a. n.a. n.a. n.a. n.a. n.a. n.a. n.a. n.a. n.a
15 Hajipur M break-up not available
16 Hazaribagh M break-up not available
17 Jehanabad M n.a. n.a. n.a. n.a. n.a. n.a. n.a. n.a. n.a. n.a
18 Madhubani M 2 91 0 0 0 0 0.2 9 0 0
19 Mokama M n.a. n.a. n.a. n.a. n.a. n.a. n.a. n.a. n.a. n.a
Gujarat
20 Amreli M 0 0 0 0 19 87 3 13 0 0
21 Ankleswar M 17 94 0 0 0 0 1.0 6 0 0
22 Dabhoi M 14 91 0 0 1 8 0.1 0.6 0.1 0.5
3 6 3
Sl. City/Town Water Tax Water Cess Water Charges Connection Bulk supplyNo. Charges Charges
Rs. % Rs. % Rs. % Rs. % Rs. %
1 2 3 4 5 6 7 8 9 10 11
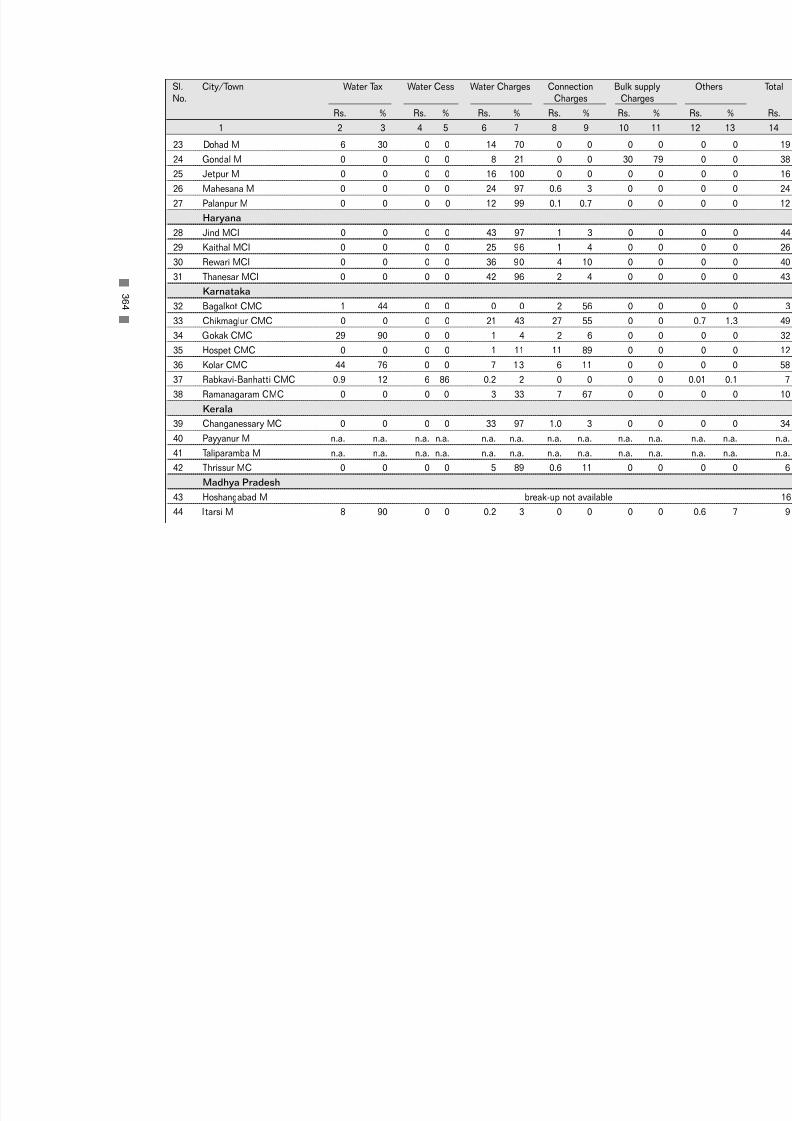
7/21/2019 Status Watersupply
http://slidepdf.com/reader/full/status-watersupply 384/869
23 Dohad M 6 30 0 0 14 70 0 0 0 0
24 Gondal M 0 0 0 0 8 21 0 0 30 79
25 Jetpur M 0 0 0 0 16 100 0 0 0 0
26 Mahesana M 0 0 0 0 24 97 0.6 3 0 0
27 Palanpur M 0 0 0 0 12 99 0.1 0.7 0 0
Haryana
28 Jind MCI 0 0 0 0 43 97 1 3 0 0
29 Kaithal MCI 0 0 0 0 25 96 1 4 0 0
30 Rewari MCI 0 0 0 0 36 90 4 10 0 0
31 Thanesar MCI 0 0 0 0 42 96 2 4 0 0
Karnataka
32 Bagalkot CMC 1 44 0 0 0 0 2 56 0 0
33 Chikmaglur CMC 0 0 0 0 21 43 27 55 0 0
34 Gokak CMC 29 90 0 0 1 4 2 6 0 0
35 Hospet CMC 0 0 0 0 1 11 11 89 0 0
36 Kolar CMC 44 76 0 0 7 13 6 11 0 0
37 Rabkavi-Banhatti CMC 0.9 12 6 86 0.2 2 0 0 0 0
38 Ramanagaram CMC 0 0 0 0 3 33 7 67 0 0
Kerala
39 Changanessary MC 0 0 0 0 33 97 1.0 3 0 0
40 Payyanur M n.a. n.a. n.a. n.a. n.a. n.a. n.a. n.a. n.a. n.a
41 Taliparamba M n.a. n.a. n.a. n.a. n.a. n.a. n.a. n.a. n.a. n.a
42 Thrissur MC 0 0 0 0 5 89 0.6 11 0 0
Madhya Pradesh
43 Hoshangabad M break-up not available
44 Itarsi M 8 90 0 0 0.2 3 0 0 0 0
3 6 4
Sl. City/Town Water Tax Water Cess Water Charges Connection Bulk supplyNo. Charges Charges
Rs. % Rs. % Rs. % Rs. % Rs. %
1 2 3 4 5 6 7 8 9 10 11

7/21/2019 Status Watersupply
http://slidepdf.com/reader/full/status-watersupply 385/869
45 Khargone M 14 92 0 0 1 8 0.03 0.2 0 0
46 Mandsaur M 28 100 0 0 0 0 0 0 0 0
47 Nagda M 13 100 0 0 0 0 0 0 0 0
48 Neemuch M 23 96 0.5 2 0 0 0.5 2 0 0
49 Sehore M break-up not available
50 Shahdol M 13 73 0 0 2 10 3 17 0 0
51 Vidisha M 20 95 0 0 0 0 0 0 0.3 1.5
Maharashtra
52 Amalner MCl 240 89 0 0 0 0 25 9 0 0
53 Ballarpur MCl n.a. n.a. n.a. n.a. n.a. n.a. n.a. n.a. n.a. n.a
54 Bhandara M n.a. n.a. n.a. n.a. n.a. n.a. n.a. n.a. n.a. n.a55 Kamptee MCl 17 90 0 0 0 0 0.8 4 0 0
56 Manmad MCl 0 0 0 0 12 99 0.2 1 0 0
57 Ratnagiri MCl 0 0 0 0 38 98 0 0 0.9 2
58 Satara MCl 33 100 0 0 0 0 0 0 0 0
59 Virar MCl 0 0 0 0 36 30 0 0 82 70
Orissa
60 Balangir M 3 44 0 0 0 0 4 56 0 0
61 Bhadrak M 3 93 0.2 7 0 0 0 0 0 0
Punjab
62 Firozpur MCI 0.5 1 0.9 2 2 3 20 43 24 5163 Kapurthala M break-up not available
64 Mansa MCI 0 0 0 0 14 100 0 0 0 0
65 Phagwara MCI 0 0 0 0 46 99.6 0.2 0.4 0 0
66 Sangrur MCI 0 0 0 0 29 98 0.3 0.9 0.2 0.6
3 6 5
Sl. City/Town Water Tax Water Cess Water Charges Connection Bulk supplyNo. Charges Charges
Rs. % Rs. % Rs. % Rs. % Rs. %
1 2 3 4 5 6 7 8 9 10 11

7/21/2019 Status Watersupply
http://slidepdf.com/reader/full/status-watersupply 386/869
Rajasthan
67 Banswara M 0 0 0 0 50 100 0 0 0 0
68 Barmer M 0 0 0 0 64 99 0.4 0.7 0 0
69 Bundi M break-up not available
70 Churu M n.a. n.a. n.a. n.a. n.a. n.a. n.a. n.a. n.a. n.a
71 Hanumangarh M 0 0 0 0 40 100 0 0 0 0
72 Sawai Madhopur M 0 0 0 0 30 98 0 0 0 0
Tamil Nadu
73 Ambur M 20 54 0 0 16 45 0.3 0.9 0 0
74 Arakkonam M 15 43 0 0 12 33 3 8 0 0
75 Attur M 16 38 0 0 24 56 0 0 0 0
76 Cambam M 9 41 0 0 12 54 0 0 0 0
77 Dharmapuri M 17 44 0 0 20 52 2 4 0 0
78 Guduivattam M 12 52 0 0 11 48 0 0 0 0
79 Nagapattinam M 24 65 0 0 9 26 0 0 0 0
80 Pudukkottai M 48 46 0 0 50 48 0 0 0 0
81 Sivakasi M 48 44 0 0 23 21 0 0 0 0
82 Srivilliputtur M 4 22 0 0 13 78 0 0 0 0
83 Tindivanam MC 14 65 0 0 5 25 0.8 4 0 0
84 Udhagamandalam M 100 73 0 0 33 24 0 0 0 0
Uttar Pradesh
85 Auraiya MB 7 87 0 0 1 12 0.1 1 0 0
86 Balrampur MB break-up not available
87 Basti MB 6 77 0 0 2 21 0.1 1 0 0
88 Bhadohi MB 7 83 0 0 0 0 0 0 0 0
89 Chandpur MB 7 76 0 0 2 21 0.2 2 0 0
3 6 6
Sl. City/Town Water Tax Water Cess Water Charges Connection Bulk supplyNo. Charges Charges
Rs. % Rs. % Rs. % Rs. % Rs. %
1 2 3 4 5 6 7 8 9 10 11

7/21/2019 Status Watersupply
http://slidepdf.com/reader/full/status-watersupply 387/869
90 Etah MB 5 70 1 20 0.7 10 0 0 0 0
91 Ghazipur MB 10 94 0.6 6 0.03 0.3 0 0 0 0
92 Gonda MB 13 82 0 0 0 0 3 18 0 0
93 Lakhimpur MB 18 84 0 0 3 15 0 0 0 0
94 Lalitpur MB 9 23 0 0 29 72 0 0 0 0
95 Mughalsarai MB 4 86 0 0 0.5 11 0.1 2 0 0
96 Nawabganj-Barabanki MB 5 56 0 0 4 44 0 0 0 0
97 Orai MB 2 8 0 0 24 89 0.6 2 0 0
98 Roorkee MB# 18 85 0 0 0 0 3 15 0 0
West Bengal
99 Bishnupur M 0 0 0 0 0 0 1 100 0 0
100 Chakdaha M 0 0 0 0 0 0 0 0 0.4 100
101 Contai M n.a. n.a. n.a. n.a. n.a. n.a. n.a. n.a. n.a. n.a
102 Cooch Behar M 0 0 0 0 0 0 0 0 4 100
103 Darjeeling M break-up not available
104 Jalpaiguri M 0 0 0 0 0 0 8 81 2 19
105 Jangipur M n.a. n.a. n.a. n.a. n.a. n.a. n.a. n.a. n.a. n.a
106 Katwa M n.a. n.a. n.a. n.a. n.a. n.a. n.a. n.a. n.a. n.a
107 Raniganj M break-up not available
Small States
Himachal Pradesh
108 Shimla M.Corp. 0 0 4 2 137 91 10 7 0 0
Nagaland
109 Kohima TC 5 100 0 0 0 0 0 0 0 0
Union Teritories
110 Port Balir MCI 0 0 0 0 39 37 0 0 66 63
3 6 7
Sl. City/Town Water Tax Water Cess Water Charges Connection Bulk supplyNo. Charges Charges
Rs. % Rs. % Rs. % Rs. % Rs. %
1 2 3 4 5 6 7 8 9 10 11

7/21/2019 Status Watersupply
http://slidepdf.com/reader/full/status-watersupply 388/869
Others (Smaller than Class II towns)
Small States
Arunachal Pradesh
111 Itanagar CT n.a. n.a. n.a. n.a. n.a. n.a. n.a. n.a. n.a. n.a
Goa
112 Panaji MCI Break-up not available
Union Territories
113 Daman MCI 0 0 0 0 9 90 1 10 0 0
114 Kavarathi NMCT n.a. n.a. n.a. n.a. n.a. n.a. n.a. n.a. n.a. n.a
115 Silvassa 0 0 0 0 1 100 0 0 0 0
Source: Respective urban local governments/relevant agencies, NIUA Survey, 1999 3 6 8
Sl. City/Town Water Tax Water Cess Water Charges Connection Bulk supplyNo. Charges Charges
Rs. % Rs. % Rs. % Rs. % Rs. %
1 2 3 4 5 6 7 8 9 10 11

7/21/2019 Status Watersupply
http://slidepdf.com/reader/full/status-watersupply 389/869
A -1 4
R E V
E N UE E X P E NDI T
UR E O N WA T E R
S UP P L Y ,
1 9
9 7 - 9 8

7/21/2019 Status Watersupply
http://slidepdf.com/reader/full/status-watersupply 390/869

7/21/2019 Status Watersupply
http://slidepdf.com/reader/full/status-watersupply 391/869
3 7 1
METROPOLITAN CITIES
1 Ahmedabad M.Corp. 831 21 2715 69 55 1 177 4 169 4 0 0
2 Bangalore M.Corp. 2455 16 7154 48 2367 (16) 0 0 0 2933
3 Bhopal M.Corp. 133 9 1069 75 29 2 18 1 179 13 0 0
4 Calcutta M.Corp. 2651 35 2297 30 592 8 1993 26 0 0 0 0
5 Chennai M.Corp.# 3961 33 1286 11 190 2 675 6 1316 11 0 2970
6 Coimbatore M.Corp 314 77 90.6 (22.3) 0 0 0 2
7 Delhi M.Corp. 9419 20 9172 20 1146 2 1150 2 1439 3 10880 13622
8 Greater Mumbai M.Corp. 8715 33 8712 33 281 1 1263 5 0 0 2608 958
9 Hyderabad M.Corp.# 3095 31 3789 38 125 1 1204 12 693 7 0 0
10 Indore M.Corp. 540 19 1500 54 85 3 640 23 8 0.3 0 0
11 Jaipur M.Corp. 1203 33 1963 53 27 0.7 493 (13) 0 0
12 Kanpur M.Corp. 655 71 143 15 55 6 64 7 9 1 0 0
13 Kochi M.Corp. 363 57 150 24 3 0.4 119 19 0 0 0 0
14 Lucknow M.Corp. 1134 54 800 38 103 5 82 4 0 0 0 0
15 Ludhiana M.Corp. 319 26 491 39 75.2 (6.0) 365 29 0 0
16 Madurai M.Corp. 33 16 175.1 (84.1) 0 0 0 0
17 Nagpur M.Corp. 295 9 1973 59 45 1 96 3 295 9 661 0
18 Pune M.Corp. 685 23 2092 71 148.2 (5.1) 0 0 0 0
19 Surat M.Corp. 323 19 1165 69 48 3 109 6 32 2 0 0
20 Vadodara M.Corp.# 480 23 1327 65 222.3 (10.9) 0 0 4 15 021 Varanasi M.Corp. 419 54 263 34 73 9 24 3 0 0 0 0
22 Visakhapatnam M.Corp. 252 24 621 59 37 3 140 13 0 0 0 0
# Expenditure figures include both water supply and sewereage Figures within brackets/paranthesis are the per centages for the combined items of expenditure
Source: Respective urban local governments/relevant agencies, NIUA Survey, 1999
Sl. City/Town Salary and Electricity Consumables Repairs & Others Interest Debit
No. wages replacements Servicin
Rs. % Rs. % Rs. % Rs. % Rs. % Rs. Rs.
1 2 3 4 5 6 7 8 9 10 11 12 13
A-14 : Revenue Expenditure on Water Supply, 1997-98

7/21/2019 Status Watersupply
http://slidepdf.com/reader/full/status-watersupply 392/869
CLASS I
Andhra Pradesh
1 Anantapur MCI 42 46 15 16 25 27 10 11 0 0 0 0
2 Chittoor M 19 15 84 66 12 9 12 10 0 0 0 0
3 Cuddapah MCI 43 29 82 56 9 6 12 8 0 0 0 0
4 Eluru M 49 52 13 14 14.9 (16.0) 15 16 0 0
5 Guntur MCI 100 17 200 34 3 0.5 50 9 233 40 0 0
6 Hindupur M 23 27 60 69 4.0 (4.6) 0 0 0 0
7 Kakinada M 51 32 43 27 9 6 24 15 25 16 6
8 Kurnool MCI 58 77 7 10 9 12 1 2 0 0 0 0
9 Machilipatnam M n.a. n.a. n.a. n.a. n.a. n.a. n.a. n.a. n.a. n.a. n.a. n.a
10 Nandyal MCI 25 33 42 56 2 3 6 8 0 0 0 0
11 Nellore MCI 25 24 57.1 (52.9) 25 24 0 0 0 0
12 Nizamabad M n.a. n.a. n.a. n.a. n.a. n.a. n.a. n.a. n.a. n.a. n.a. n.a
13 Ongole MCI 18 23 25 32 13 17 16 20 6 7 0 0
14 Qutubullapur M 102 49 18 9 24 12 27 13 37 18 0 0
15 Rajahmundry M.Corp. 41 20 152.3 (75.0) 8 4 0 0 2 0
16 Tenali M 0.6 11 2 28 1.2 21 2.2 40 0 0 0 0
17 Tirupati MCI 60 39 53 34 5 3 38 24 0 0 0 0
18 Vijaywada M.Corp. 120 22 400.0 (73.6) 13 2 11 2 0 0
19 Warangal M.Corp. 122 33 200 54 36 10 15 4 0 0 0 0
Bihar
20 Bihar Sharif M n.a. n.a. n.a. n.a. n.a. n.a. n.a. n.a. n.a. n.a. n.a. n.a21 Chhapra M break-up not available
22 Gaya M.Corp. break-up not available
23 Katihar M n.a. n.a. n.a. n.a. n.a. n.a. n.a. n.a. n.a. n.a. n.a. n.a
24 Munger M break-up not available
25 Ranchi M.Corp. break-up not available
3 7 2
Sl. City/Town Salary and Electricity Consumables Repairs & Others Interest Debit
No. wages replacements Servicin
Rs. % Rs. % Rs. % Rs. % Rs. % Rs. Rs.
1 2 3 4 5 6 7 8 9 10 11 12 13

7/21/2019 Status Watersupply
http://slidepdf.com/reader/full/status-watersupply 393/869
Gujarat
26 Anand M n.a. n.a. n.a. n.a. n.a. n.a. n.a. n.a. n.a. n.a. n.a. n.a
27 Bharuch M 24 17 81 59 32.0 (23.3) 0 0 0 0
28 Bhavnagar M.Corp. 138 9 594 41 35 2 606 42 0 0 0 84
29 Bhuj M 37 20 146.9 (79.2) 1 0.8 0 0
30 Jamnagar M.Corp. 59.1 15 310.9 80 0.3 0.1 18.7 5 2 0.5 0 0
31 Junagadh M 54.3 61 0.9 1 21.5 (24.1) 12.3 14 0 0
32 Nadiad M 29 45 17 27 6.2 10 11 18 0.3 0.5 0 0
33 Navsari M 39 23 131.2 (76.9) 0 0 0 0
34 Porbandar M 7 16 39.0 (84.2) 0 0 0 0
35 Rajkot M.Corp. 195 34 184 32 189.9 (32.2) 2 0.3 0 0
36 Surendranagar M 29.4 54 25.2 (46.0) 0.2 0.3 0 0
Haryana37 Ambala MCI 56 36 80 52 15 10 3 2 0 0 0 0
38 Faridabad M.Corp. 527 33 1062 66 13 0.8 7 0.5 0 0 9 0
39 Gurgaon MCI 93 37 99 39 3 1 7 3 16 7 0 33
40 Hisar MCI 45 21 138 66 8 4 6 3 14 7 0 0
41 Karnal MCI 117 43 122 44 12 4 7 3 17 6 0 0
42 Rohtak MCI 36 21 99 57 19 11 8 5 10 6 0 0
Jammu & Kashmir
43 Jammu M.Corp.break-up not available
Karnataka
44 Belgaum M.Corp. 64 44 2 1 63.4 (43.7) 17 11 0 0
45 Bellary CMC 46.4 44 58.0 (55.4) 0.2 0.2 0 046 Davangere MCI 50.4 44 0.1 0.04 10 8 39 34 15 13 0 0
47 Gadag-Betigeri CMC 47 67 5 8 17.2 (24.7) 0 0 0 0
48 Gulbarga M.Corp. 49 32 3 2 72.6 (47.4) 29 19 0 0
49 Hubli-Dharwar M.Corp. 132 45 150.6 (51.1) 12 4 0 0
50 Mandya M 12 45 14.1 (55.1) 0 0 0 0
3 7 3
Sl. City/Town Salary and Electricity Consumables Repairs & Others Interest Debit
No. wages replacements Servicin
Rs. % Rs. % Rs. % Rs. % Rs. % Rs. Rs.
1 2 3 4 5 6 7 8 9 10 11 12 13

7/21/2019 Status Watersupply
http://slidepdf.com/reader/full/status-watersupply 394/869
51 Mangalore M.Corp. 80 13 402.0 (67.8) 112 19 0 0 0
52 Mysore M.Corp. 173 30 211 37 11 2 98 17 76 13 8 0
53 Shimoga CMC 15 14 15 15 7 7 62 61 3 3 0 0
54 Tumkur M 72 21 109 32 114 33 47 14 0 0 0 0
Kerala
55 Alappuzha MC 120 71 33 19 16.6 (9.9) 0 0 0 0
56 Kollam MC 35 45 27 35 15.2 (19.8) 0 0 0 0 0
57 Kozhikode M.Corp. n.a. n.a. n.a. n.a. n.a. n.a. n.a. n.a. n.a. n.a. n.a. n.a
58 Thalaserry M 42 50 22 26 8 10 12 14 0 0 0 0
59 ThiruvananthapuramM.Corp. 331 62 70 13 7 1 122 23 0 0 0 0
Madhya Pradesh
60 Bhind M 52 78 14.2 (21.5) 0 0 0 061 Burhanpur M.Corp. 26 68 9 24 2.8 (7.5) 0 0 0 0
62 Dewas M.Corp. 69 46 8 6 28 18 12 8 33 22 0 0
63 Guna M 39 30 35 27 19 14 38 29 0 0 0 0
64 Gwalior M.Corp. 608 52 288 25 265.0 (22.8) 0 0 0 0
65 Jabalpur M.Corp. 264 45 35 6 7.3 (1.3) 280 48 0 0
66 Khandwa M 58 45 24 19 42.2 (33.2) 3 2 0 0
67 Morena M 17 62 7 25 3.5 (12.8) 0 0 0 0
68 Murwara (Katni) M.Corp. 51 53 28 29 5 5 8 8 5 5 0 0
69 Ratlam M.Corp. 42 47 35 39 2 2 9 10 2 2 0 0
70 Rewa M.Corp. 83 41 18 9 33.1 (16.5) 66 33 0 0
71 Satna M.Corp. 12 20 44 72 4.8 (7.9) 0 0 0 0
72 Shivpuri M 56 39 41 29 26 18 20 14 0 0 0 0
Maharashtra
73 Amravati M.Corp. 141 14 439 45 43 4 57 6 0.5 0.1 0 300
74 Aurangabad M.Corp. 112.43 13 615.6 74 3.18 0.4 103.2 12 0.01 0.001 0.18 0
75 Bhusawal MCl 36 19 110 59 20.3 (10.8) 3 1 0 8
3 7 4
Sl. City/Town Salary and Electricity Consumables Repairs & Others Interest Debit
No. wages replacements Servicin
Rs. % Rs. % Rs. % Rs. % Rs. % Rs. Rs.
1 2 3 4 5 6 7 8 9 10 11 12 13

7/21/2019 Status Watersupply
http://slidepdf.com/reader/full/status-watersupply 395/869
76 Chandrapur MCl 6 3 142 87 16.2 (9.8) 0 0 0 0
77 Dhule MCl 9 2 300 58 150.9 (29.3) 0 0 56 0 0
78 Ichalkaranji MCl 90 31 150 52 18 6 27 9 0 0 0 0
79 Jalgaon MCl 80 16 142 29 266.9 (54.6) 0 0 0 0 0
80 Kolhapur M.Corp. 202 24 525 62 29 3 48 6 48 6 0 0
81 Nanded Waghala M.Corp. 41.4 13 189 59 37.8 12 25.1 8 27.4 9 0 0
82 Nashik M.Corp. 359 18 959 49 81 4 105 5 438 23 0 0
83 Parbhani MCl 20 23 3(3) 4 5 3 4 51 4
84 Solapur M.Corp. 159 13 707 57 4 0.3 196 16 44 4 133 0
85 Wardha M 16 30 13 25 7.3 (13.6) 17 32 0 0
86 Yavatmal MCl 56 24 117 50 13.7 (5.9) 47 20 0 0
Orissa
87 Bhubaneswar M.Corp. 315 24 607 46 89 7 298 23 0 0 0 088 Cuttack M.Corp. 286 43 275 42 43 7 55 8 0 0 0 0
89 Puri M 59 43 56 40 2 2 20 15 0 0 0 0
90 Rourkela M n.a. n.a. n.a. n.a. n.a. n.a. n.a. n.a. n.a. n.a. n.a. n.a
91 Sambalpur M 47 32 70 47 12 8 20 13 0 0 0 0
Punjab
92 Amritsar M.Corp. 220 31 370 52 88.6 (12.6) 0 0 0 26
93 Bathinda MCI 50 42 48 40 12 10 9 7 0 0 0 0
94 Hoshiarpur MCI 50 39 65.7 (51.1) 0 0 13 0
95 Jalandhar M.Corp. 253 31 305 38 7 0.9 73 9 151 19 8 13
96 Moga MCI 28 30 40 43 5 6 16 17 0 0 0 4
97 Pathankot MCI 53 37 69 48 2 2 20 14 0 0 0 0
98 Patiala M.Corp. 83 41 85 42 36 (18) 0 0 0 0
Rajasthan
99 Ajmer MCI 382 26 1011 68 10 0.7 69 5 7 0.5 0 0
100 Alwar M 316 50 261 41 3 0.4 53 8 0 0 0 0
101 Beawar M 83 27 194 63 15 5 16 (5) 0 0
3 7 5
Sl. City/Town Salary and Electricity Consumables Repairs & Others Interest Debit
No. wages replacements Servicin
Rs. % Rs. % Rs. % Rs. % Rs. % Rs. Rs.
1 2 3 4 5 6 7 8 9 10 11 12 13
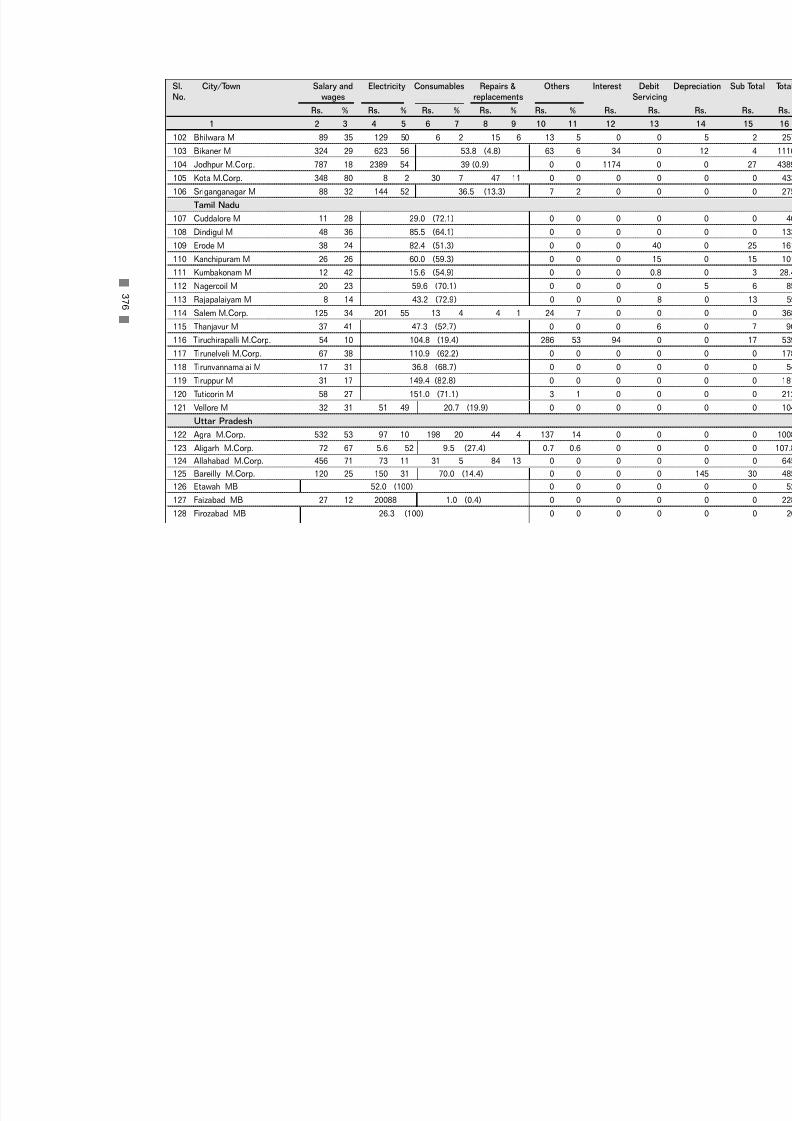
7/21/2019 Status Watersupply
http://slidepdf.com/reader/full/status-watersupply 396/869
102 Bhilwara M 89 35 129 50 6 2 15 6 13 5 0 0
103 Bikaner M 324 29 623 56 53.8 (4.8) 63 6 34 0
104 Jodhpur M.Corp. 787 18 2389 54 39 (0.9) 0 0 1174 0
105 Kota M.Corp. 348 80 8 2 30 7 47 11 0 0 0 0
106 Sriganganagar M 88 32 144 52 36.5 (13.3) 7 2 0 0
Tamil Nadu
107 Cuddalore M 11 28 29.0 (72.1) 0 0 0 0
108 Dindigul M 48 36 85.5 (64.1) 0 0 0 0
109 Erode M 38 24 82.4 (51.3) 0 0 0 40
110 Kanchipuram M 26 26 60.0 (59.3) 0 0 0 15
111 Kumbakonam M 12 42 15.6 (54.9) 0 0 0 0.8
112 Nagercoil M 20 23 59.6 (70.1) 0 0 0 0
113 Rajapalaiyam M 8 14 43.2 (72.9) 0 0 0 8114 Salem M.Corp. 125 34 201 55 13 4 4 1 24 7 0 0
115 Thanjavur M 37 41 47.3 (52.7) 0 0 0 6
116 Tiruchirapalli M.Corp. 54 10 104.8 (19.4) 286 53 94 0
117 Tirunelveli M.Corp. 67 38 110.9 (62.2) 0 0 0 0
118 Tirunvannamalai M 17 31 36.8 (68.7) 0 0 0 0
119 Tiruppur M 31 17 149.4 (82.8) 0 0 0 0
120 Tuticorin M 58 27 151.0 (71.1) 3 1 0 0
121 Vellore M 32 31 51 49 20.7 (19.9) 0 0 0 0
Uttar Pradesh
122 Agra M.Corp. 532 53 97 10 198 20 44 4 137 14 0 0
123 Aligarh M.Corp. 72 67 5.6 52 9.5 (27.4) 0.7 0.6 0 0124 Allahabad M.Corp. 456 71 73 11 31 5 84 13 0 0 0 0
125 Bareilly M.Corp. 120 25 150 31 70.0 (14.4) 0 0 0 0
126 Etawah MB 52.0 (100) 0 0 0 0
127 Faizabad MB 27 12 20088 1.0 (0.4) 0 0 0 0
128 Firozabad MB 26.3 (100) 0 0 0 0
3 7 6
Sl. City/Town Salary and Electricity Consumables Repairs & Others Interest Debit
No. wages replacements Servicin
Rs. % Rs. % Rs. % Rs. % Rs. % Rs. Rs.
1 2 3 4 5 6 7 8 9 10 11 12 13

7/21/2019 Status Watersupply
http://slidepdf.com/reader/full/status-watersupply 397/869
129 Ghaziabad M.Corp. 130 45 156.7 (54.6) 0 0 0 0
130 Gorakhpur M.Corp. 81 46 5 3 47 26 20 11 25 14 0 0
131 Haldwani-cum-
Kathgodam MB 49 59 9 11 11.1 14 12 15 0.9 1 0 0
132 Hapur MB 28 96 1.1 (3.7) 0 0 0 0
133 Hardwar MB 74.1 (100) 0 0 0 0
134 Jhansi MB 79 40 44 22 2 1 46 24 5 3 0 20
135 Mathura MB# 72 74 24.0 (24.9) 0 0 1 0
136 Meerut M.Corp. 201.0 (100) 0 0 0 0
137 Mirzapur MB 46.0 (100) 0 0 0 0
138 Moradabad M.Corp. 45 91 4.4 (8.8) 0 0 0 0
139 Muzaffarnagar MB 43 49 1 (1) 4 5 39 45 0 0
140 Rae Bareli MB 4192 3.1 (7.0) 0 0 0.4 0141 Rampur MB 17 74 5.9 (25.8) 0 0 0 0
142 Saharanpur MB 68 86 10.8 (13.7) 0 0 0 0
143 Sitapur MB 25.4 (100) 0 0 0 0
144 Unnao MB 28.9 (100) 0 0 0 0
West Bengal
145 Asansol M.Corp. 25 34 12 16 14 19 7 10 14 19 0 0
146 Baharampur M 15 62 1 6 8.0 (32.1) 0 0 0 0
147 Balurghat M 7.4 65 0.6 5 0.5 4 3 26 0 0 0 0
148 Bankura M 32 34 40 43 7 7 3 4 11 12 0 0
149 Barasat M 102 74 4 3 32 (23) 0 0 0 0
150 Burdwan M 34 45 11 14 2 2 18 24 0 0 0 0
151 Halisahar M 19.3 54 13 36 0.4 1 0.3 1 0 0 0 0
152 Krishnagar M 32 81 4 10 2.6 (6.4) 1 2 0 0
153 Midnapore M 33 35 41 44 10.2 (10.8) 0 0 10 0
154 North Barrackpore M 17 43 14 36 2.5 (6.5) 5 14 0 0
155 Santipur M n.a. n.a. n.a. n.a. n.a. n.a. n.a. n.a. n.a. n.a. n.a. n.a
3 7 7
Sl. City/Town Salary and Electricity Consumables Repairs & Others Interest Debit
No. wages replacements Servicin
Rs. % Rs. % Rs. % Rs. % Rs. % Rs. Rs.
1 2 3 4 5 6 7 8 9 10 11 12 13

7/21/2019 Status Watersupply
http://slidepdf.com/reader/full/status-watersupply 398/869
156 Silliguri M.Corp. n.a. n.a. n.a. n.a. n.a. n.a. n.a. n.a. n.a. n.a. n.a. n.a
Small States
Assam
157 Guwahati M.Corp. 156 29 300 56 36 7 43 8 0 0 0 0
158 Jorhat MB n.a. n.a. n.a. n.a. n.a. n.a. n.a. n.a. n.a. n.a. n.a. n.a
Manipur
159 Imphal MCI n.a. n.a. n.a. n.a. n.a. n.a. n.a. n.a. n.a. n.a. n.a. n.a
Meghalaya
160 Shillong MB Not available for the town separately
Mizoram
161 Aizwal NM Not available for the town separately
Tripura
162 Agartala MCINot available for the town separatelyUnion Territories
163 Chandigarh M.Corp. 1050 37 1639 57 53 2 118 4 0 0 0 0
164 Pondicherry M 152 76 47.1 (23.7) 0 0 0 0
# Expenditure figures include both water supply and sewereage ;
Figures within brackets/paranthesis are the per centages for the combined items of expenditure Source: Respective urban local governments/relevant agencies, NIUA Survey, 1999
3 7 8
Sl. City/Town Salary and Electricity Consumables Repairs & Others Interest Debit
No. wages replacements Servicin
Rs. % Rs. % Rs. % Rs. % Rs. % Rs. Rs.
1 2 3 4 5 6 7 8 9 10 11 12 13
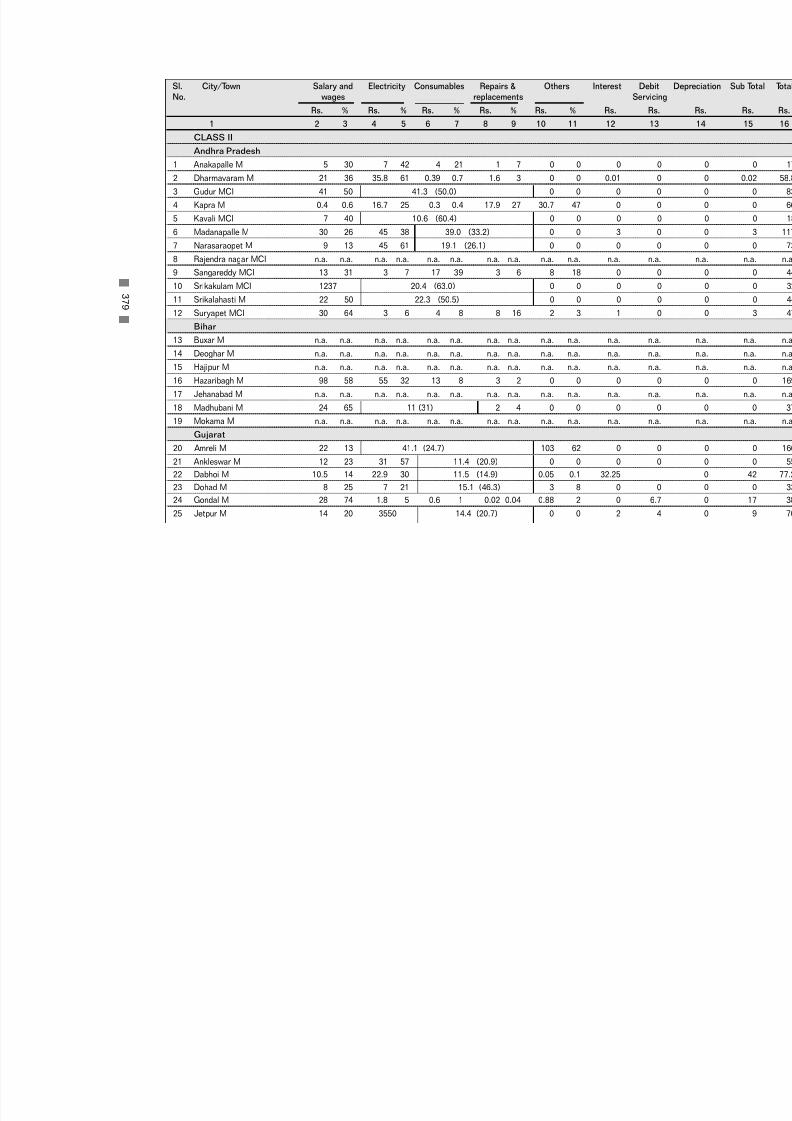
7/21/2019 Status Watersupply
http://slidepdf.com/reader/full/status-watersupply 399/869
CLASS II
Andhra Pradesh
1 Anakapalle M 5 30 7 42 4 21 1 7 0 0 0 0
2 Dharmavaram M 21 36 35.8 61 0.39 0.7 1.6 3 0 0 0.01 0
3 Gudur MCI 41 50 41.3 (50.0) 0 0 0 0
4 Kapra M 0.4 0.6 16.7 25 0.3 0.4 17.9 27 30.7 47 0 0
5 Kavali MCI 7 40 10.6 (60.4) 0 0 0 0
6 Madanapalle M 30 26 45 38 39.0 (33.2) 0 0 3 0
7 Narasaraopet M 9 13 45 61 19.1 (26.1) 0 0 0 0
8 Rajendra nagar MCI n.a. n.a. n.a. n.a. n.a. n.a. n.a. n.a. n.a. n.a. n.a. n.a
9 Sangareddy MCI 13 31 3 7 17 39 3 6 8 18 0 0
10 Srikakulam MCI 1237 20.4 (63.0) 0 0 0 0
11 Srikalahasti M 22 50 22.3 (50.5) 0 0 0 012 Suryapet MCI 30 64 3 6 4 8 8 16 2 3 1 0
Bihar
13 Buxar M n.a. n.a. n.a. n.a. n.a. n.a. n.a. n.a. n.a. n.a. n.a. n.a
14 Deoghar M n.a. n.a. n.a. n.a. n.a. n.a. n.a. n.a. n.a. n.a. n.a. n.a
15 Hajipur M n.a. n.a. n.a. n.a. n.a. n.a. n.a. n.a. n.a. n.a. n.a. n.a
16 Hazaribagh M 98 58 55 32 13 8 3 2 0 0 0 0
17 Jehanabad M n.a. n.a. n.a. n.a. n.a. n.a. n.a. n.a. n.a. n.a. n.a. n.a
18 Madhubani M 24 65 11 (31) 2 4 0 0 0 0
19 Mokama M n.a. n.a. n.a. n.a. n.a. n.a. n.a. n.a. n.a. n.a. n.a. n.a
Gujarat
20 Amreli M 22 13 41.1 (24.7) 103 62 0 021 Ankleswar M 12 23 31 57 11.4 (20.9) 0 0 0 0
22 Dabhoi M 10.5 14 22.9 30 11.5 (14.9) 0.05 0.1 32.25
23 Dohad M 8 25 7 21 15.1 (46.3) 3 8 0 0
24 Gondal M 28 74 1.8 5 0.6 1 0.02 0.04 0.88 2 0 6.7
25 Jetpur M 14 20 3550 14.4 (20.7) 0 0 2 4
3 7 9
Sl. City/Town Salary and Electricity Consumables Repairs & Others Interest Debit
No. wages replacements Servicin
Rs. % Rs. % Rs. % Rs. % Rs. % Rs. Rs.
1 2 3 4 5 6 7 8 9 10 11 12 13
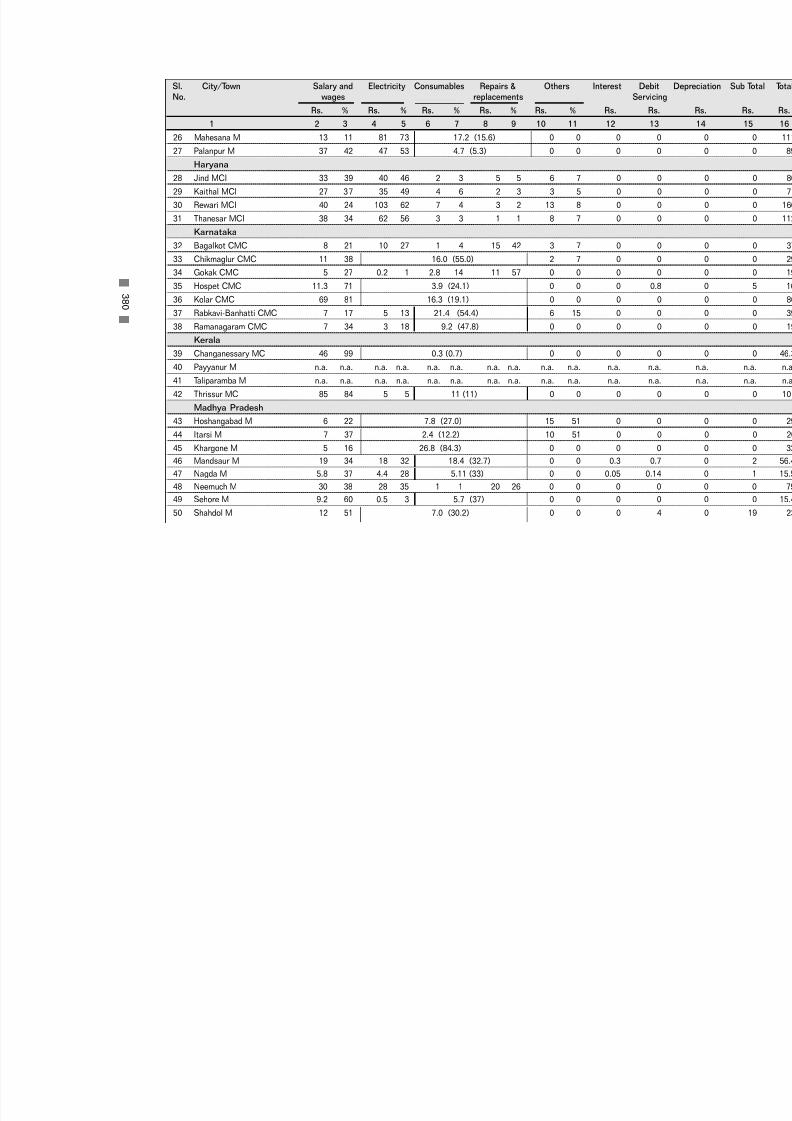
7/21/2019 Status Watersupply
http://slidepdf.com/reader/full/status-watersupply 400/869
26 Mahesana M 13 11 81 73 17.2 (15.6) 0 0 0 0
27 Palanpur M 37 42 47 53 4.7 (5.3) 0 0 0 0
Haryana
28 Jind MCI 33 39 40 46 2 3 5 5 6 7 0 0
29 Kaithal MCI 27 37 35 49 4 6 2 3 3 5 0 0
30 Rewari MCI 40 24 103 62 7 4 3 2 13 8 0 0
31 Thanesar MCI 38 34 62 56 3 3 1 1 8 7 0 0
Karnataka
32 Bagalkot CMC 8 21 10 27 1 4 15 42 3 7 0 0
33 Chikmaglur CMC 11 38 16.0 (55.0) 2 7 0 0
34 Gokak CMC 5 27 0.2 1 2.8 14 11 57 0 0 0 0
35 Hospet CMC 11.3 71 3.9 (24.1) 0 0 0 0.8
36 Kolar CMC 69 81 16.3 (19.1) 0 0 0 037 Rabkavi-Banhatti CMC 7 17 5 13 21.4 (54.4) 6 15 0 0
38 Ramanagaram CMC 7 34 3 18 9.2 (47.8) 0 0 0 0
Kerala
39 Changanessary MC 46 99 0.3 (0.7) 0 0 0 0
40 Payyanur M n.a. n.a. n.a. n.a. n.a. n.a. n.a. n.a. n.a. n.a. n.a. n.a
41 Taliparamba M n.a. n.a. n.a. n.a. n.a. n.a. n.a. n.a. n.a. n.a. n.a. n.a
42 Thrissur MC 85 84 5 5 11 (11) 0 0 0 0
Madhya Pradesh
43 Hoshangabad M 6 22 7.8 (27.0) 15 51 0 0
44 Itarsi M 7 37 2.4 (12.2) 10 51 0 0
45 Khargone M 5 16 26.8 (84.3) 0 0 0 046 Mandsaur M 19 34 18 32 18.4 (32.7) 0 0 0.3 0.7
47 Nagda M 5.8 37 4.4 28 5.11 (33) 0 0 0.05 0.14
48 Neemuch M 30 38 28 35 1 1 20 26 0 0 0 0
49 Sehore M 9.2 60 0.5 3 5.7 (37) 0 0 0 0
50 Shahdol M 12 51 7.0 (30.2) 0 0 0 4
3 8 0
Sl. City/Town Salary and Electricity Consumables Repairs & Others Interest Debit
No. wages replacements Servicin
Rs. % Rs. % Rs. % Rs. % Rs. % Rs. Rs.
1 2 3 4 5 6 7 8 9 10 11 12 13

7/21/2019 Status Watersupply
http://slidepdf.com/reader/full/status-watersupply 401/869
51 Vidisha M 41 50 18 22 22.0 (27.3) 0 0 0 0
Maharashtra
52 Amalner MCl 37 22 96 59 15.0 (9.2) 0 0 15 0
53 Ballarpur MCl 22 25 42 46 3 4 23 25 0 0 0 0
54 Bhandara M n.a. n.a. n.a. n.a. n.a. n.a. n.a. n.a. n.a. n.a. n.a. n.a
55 Kamptee MCl 18 89 2.2 (10.7) 0 0 0 0
56 Manmad MCl 24 3 5 0.6 10.0 (1.2) 10 1 33 782
57 Ratnagiri MCl 40 37 60.6 (56.5) 0 0 7 0
58 Satara MCl 26 17 1 0.7 81 54 38 25 5 3 0 0
59 Virar MCl n.a. n.a. n.a. n.a. n.a. n.a. n.a. n.a. n.a. n.a. n.a. n.a
Orissa
60 Balangir M 24 45 17 32 7 12 6 10 0 0 0 0
61 Bhadrak M n.a. n.a. n.a. n.a. n.a. n.a. n.a. n.a. n.a. n.a. n.a. n.aPunjab
62 Firozpur MCI 21.7 35 37 60 0.2 0.3 3.4 5 0 0 0 0
63 Kapurthala M 22 28 38 50 9 (11) 0 0 8 0
64 Mansa MCI 12 35 15 44 3.2 9 0.5 1 3.3 10 0 0
65 Phagwara MCI 24.8 29 38 44 0.3 0.4 6.6 8 17 20 0 0
66 Sangrur MCI 13 23 31 55 0.9 1 11 19 1.1 2 0 0
Rajasthan
67 Banswara M n.a. n.a. n.a. n.a. n.a. n.a. n.a. n.a. n.a. n.a. n.a. n.a
68 Barmer M 54.6 23 174 72 0.8 0.3 6.8 3 0 0 1.8 0
69 Bundi M 62.8 33 110 58 0.8 (0.4) 15.9 8 0 0
70 Churu M 96 45 100 47 2.7 1 1.8 0.8 5 2 8 0.571 Hanumangarh M 4 21 5 25 4 20 7 34 0 0 0 0
72 Sawai Madhopur M 31 20 77 49 1 0.8 14 9 28 18 4 0
Tamil Nadu
73 Ambur M 11 32 15 47 7.0 (21.2) 0 0 0 0
74 Arakkonam M 9 20 37.0 (80.0) 0 0 0 0
3 8 1
Sl. City/Town Salary and Electricity Consumables Repairs & Others Interest Debit
No. wages replacements Servicin
Rs. % Rs. % Rs. % Rs. % Rs. % Rs. Rs.
1 2 3 4 5 6 7 8 9 10 11 12 13
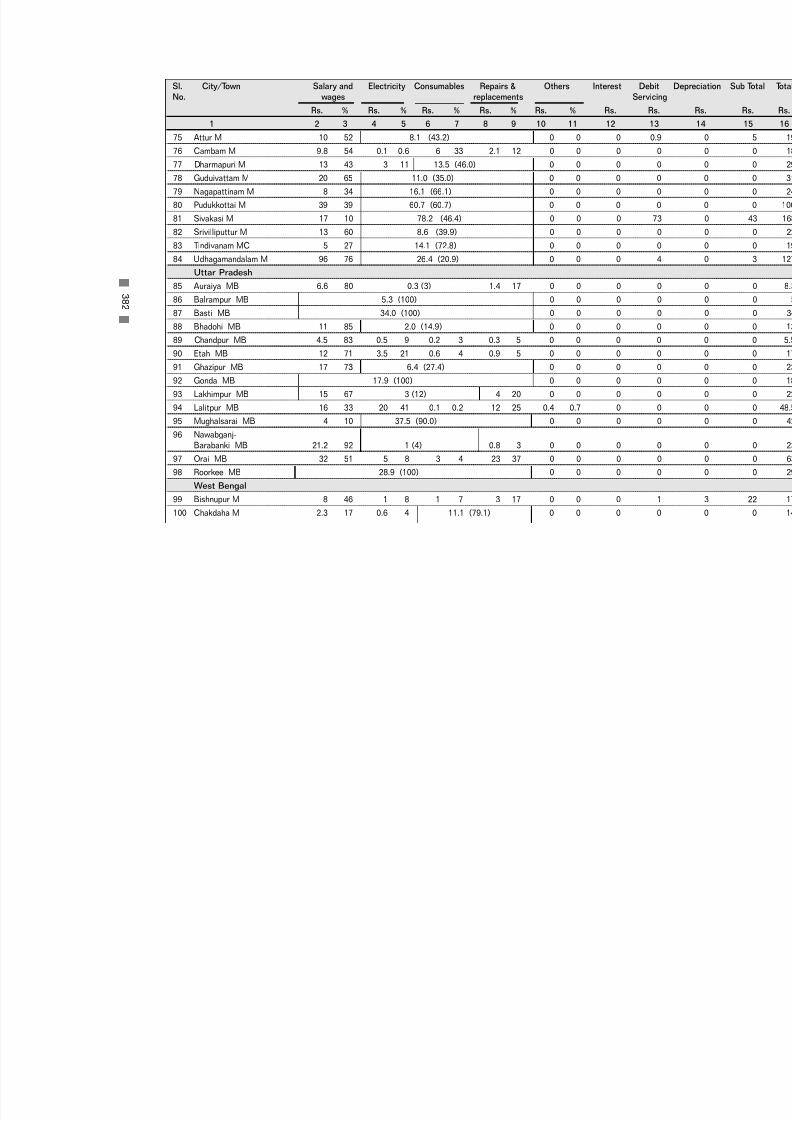
7/21/2019 Status Watersupply
http://slidepdf.com/reader/full/status-watersupply 402/869
75 Attur M 10 52 8.1 (43.2) 0 0 0 0.9
76 Cambam M 9.8 54 0.1 0.6 6 33 2.1 12 0 0 0 0
77 Dharmapuri M 13 43 3 11 13.5 (46.0) 0 0 0 0
78 Guduivattam M 20 65 11.0 (35.0) 0 0 0 0
79 Nagapattinam M 8 34 16.1 (66.1) 0 0 0 0
80 Pudukkottai M 39 39 60.7 (60.7) 0 0 0 0
81 Sivakasi M 17 10 78.2 (46.4) 0 0 0 73
82 Srivilliputtur M 13 60 8.6 (39.9) 0 0 0 0
83 Tindivanam MC 5 27 14.1 (72.8) 0 0 0 0
84 Udhagamandalam M 96 76 26.4 (20.9) 0 0 0 4
Uttar Pradesh
85 Auraiya MB 6.6 80 0.3 (3) 1.4 17 0 0 0 0
86 Balrampur MB 5.3 (100) 0 0 0 087 Basti MB 34.0 (100) 0 0 0 0
88 Bhadohi MB 11 85 2.0 (14.9) 0 0 0 0
89 Chandpur MB 4.5 83 0.5 9 0.2 3 0.3 5 0 0 0 0
90 Etah MB 12 71 3.5 21 0.6 4 0.9 5 0 0 0 0
91 Ghazipur MB 17 73 6.4 (27.4) 0 0 0 0
92 Gonda MB 17.9 (100) 0 0 0 0
93 Lakhimpur MB 15 67 3 (12) 4 20 0 0 0 0
94 Lalitpur MB 16 33 20 41 0.1 0.2 12 25 0.4 0.7 0 0
95 Mughalsarai MB 4 10 37.5 (90.0) 0 0 0 0
96 Nawabganj-
Barabanki MB 21.2 92 1 (4) 0.8 3 0 0 0 0
97 Orai MB 32 51 5 8 3 4 23 37 0 0 0 0
98 Roorkee MB 28.9 (100) 0 0 0 0
West Bengal
99 Bishnupur M 8 46 1 8 1 7 3 17 0 0 0 1
100 Chakdaha M 2.3 17 0.6 4 11.1 (79.1) 0 0 0 0
3 8 2
Sl. City/Town Salary and Electricity Consumables Repairs & Others Interest Debit
No. wages replacements Servicin
Rs. % Rs. % Rs. % Rs. % Rs. % Rs. Rs.
1 2 3 4 5 6 7 8 9 10 11 12 13

7/21/2019 Status Watersupply
http://slidepdf.com/reader/full/status-watersupply 403/869
101 Contai M 12 59 1 5 1.3 (5.9) 0 0 0 0
102 Cooch Behar M 29 89 2 8 1.0 (3.1) 0 0 0 n.a
103 Darjeeling M 26 36 21.6 (30.1) 25 34 0 0
104 Jalpaiguri M 30 75 3 9 2 4 5 13 0 0 0 0
105 Jangipur M 8 88 1.0 (11.8) 0 0 0 0
106 Katwa M 4 54 2 20 1.9 (26.1) 0 0 0 0
107 Raniganj M 19 38 21.7 43 0.9 2 0.6 1 0.5 1 2.9 2.7
Small States
Himachal Pradesh
108 Shimla M.Corp. 94 61 12 8 46.5 (30.4) 0 0 0 0
Nagaland
109 Kohima TC n.a. n.a. n.a. n.a. n.a. n.a. n.a. n.a. n.a. n.a. n.a. n.a
Union Teritories110 Port Balir MCI 78 26 185 (62) 35 12 0 0 0 0
Others (Smaller than Class II towns)
Small States
Arunachal Pradesh
111 Itanagar CT Not available for the town separately
Goa
112 Panaji MCI Not available for the town separately
Union Territories
113 Daman MCI 12 32 10 26 8 21 8 21 0 0 0 0
114 Kavarathi NMCT 5 26 13.6 (74.0) 0 0 0 0
115 Silvassa 20 80 3 122.0 (8.2) 0 0 0 0# Expenditure figures include both water supply and sewereageFigures within brackets/paranthesis are the per centages for the combined items of expenditure
Source: Respective urban local governments/relevant agencies, NIUA Survey, 1999.
3 8 3
Sl. City/Town Salary and Electricity Consumables Repairs & Others Interest Debit
No. wages replacements Servicin
Rs. % Rs. % Rs. % Rs. % Rs. % Rs. Rs.
1 2 3 4 5 6 7 8 9 10 11 12 13

7/21/2019 Status Watersupply
http://slidepdf.com/reader/full/status-watersupply 404/869

7/21/2019 Status Watersupply
http://slidepdf.com/reader/full/status-watersupply 405/869
A -1 5
C O S T R E C O V E R Y A ND
R E V E N UE -E X P E N
DI T UR E GA P ,1 9 9 7 - 9 8

7/21/2019 Status Watersupply
http://slidepdf.com/reader/full/status-watersupply 406/869

7/21/2019 Status Watersupply
http://slidepdf.com/reader/full/status-watersupply 407/869
Metropolitan Cities
1 Ahmedabad M.Corp. 486 270 3947 6.8 -3677 0.
2 Bangalore M.Corp. 706 15384 14909 103 475 6.
3 Bhopal M.Corp. 270 499 1427 35 -928 0.
4 Calcutta M.Corp. 1,035 947 7534 13 -6586 0.
5 Chennai M.Corp. 461 16258 11858 137 4400 9.
6 Coimbatore M.Corp 105 1145 407 282 738 3.
7 Delhi M.Corp. 2,620 7547 46829 16 -39282 0.
8 Greater Mumbai M.Corp. 2,978 35513 26275 135 9238 3.
9 Hyderabad M.Corp. 682 10623 10052 106 572 4.
10 Indore M.Corp. 238 780 2773 28 -1993 0.
11 Jaipur M.Corp. 340 1405 3686 38 -2280 1.
12 Kanpur M.Corp. 310 1090 926 118 164 0.
13 Kochi M.Corp. 84 844 635 133 208 2.
14 Lucknow M.Corp. 410 1159 2118 55 -959 0.
15 Ludhiana M.Corp. 234 335 1250 27 -915 0.
16 Madurai M.Corp. 90 257 208 123 49 0.
17 Nagpur M.Corp. 370 1108 3365 33 -2257 0.
18 Pune M.Corp. 650 2162 2928 74 -766 0.
19 Surat M.Corp. 320 635 1676 38 -1041 0.
20 Vadodara M.Corp. 237 987 2048 48 -1061 1.
21 Varanasi M.Corp. 220 540 779 69 -239 0.
22 Visakhapatnam M.Corp. 168 2875 1050 274 1825 4.
Total - Metropolitan Cities 10,315 102365 146,679 70 -44314 2.
Source: Respective urban local governments/relevant agencies, NIUA Survey, 1999
3 8 7
Sl. City/Town Water Revenue Revenue Cost Receipts- Revenu
No. supplied Receipts Expenditure Recovery Expenditure (in R(mld) (Rs. in lakhs) (Rs. in lakhs) (% Receipts Gap
to (Rs. in lakhs)
Expenditure)1 2 3 4 5 6 7
A-15 : Cost Recovery and Revenue - Expenditure Gap, 1997-98

7/21/2019 Status Watersupply
http://slidepdf.com/reader/full/status-watersupply 408/869
CLASS I
Andhra Pradesh
1 Anantapur MCI 14 131 92 143 39 2.
2 Chittoor M 16 30 127 23 -97 0.
3 Cuddapah MCI 17 36 148 25 -111 0.
4 Eluru M 24 87.3 93.1 94 -5.8 1.
5 Guntur MCI 75 343 586 59 -243 1.
6 Hindupur M 10 20 87 23 -67 0.
7 Kakinada M 21 144 159 90 -15 1.
8 Kurnool MCI 6.5 48 75 64 -27 2.
9 Machilipatnam M 21 4 n.a. n.a. n.a. 0.0
10 Nandyal MCI 10 27 74 37 -47 0.
11 Nellore MCI 43 111.9 108.0 104 4.0 0.7
12 Nizamabad M 15 n.a. n.a. n.a. n.a. n.a
13 Ongole MCI 16 68.5 78.3 87 -9.8 1.
14 Qutubullapur M 30 44 207 21 -163 0.
15 Rajahmundry M.Corp. 33 171 203 84 -32 1.
16 Tenali M 0.68 6.8 5.6 122 1.2 2.
17 Tirupati MCI 29 110 156 70 -46 1.
18 Vijaywada M.Corp. 146 480 544 88 -64 0.
19 Warangal M.Corp. 68 538 373 144 165 2.
Bihar
20 Bihar Sharif M 30 n.a. n.a. n.a. n.a. n.a
21 Chhapra M 14 2 59 4.1 -57 0.0
22 Gaya M.Corp. 36 35 19 188 16 0.
23 Katihar M 15 n.a. n.a. n.a. n.a. n.a
3 8 8
Sl. City/Town Water Revenue Revenue Cost Receipts- RevenuNo. supplied Receipts Expenditure Recovery Expenditure (in R
(mld) (Rs. in lakhs) (Rs. in lakhs) (% Receipts Gapto (Rs. in lakhs)
Expenditure)
1 2 3 4 5 6 7

7/21/2019 Status Watersupply
http://slidepdf.com/reader/full/status-watersupply 409/869
24 Munger M 10 8.6 14.6 59 -6.0 0.
25 Ranchi M.Corp. 91 2 44 4.0 -42 0.0
Gujarat
26 Anand M 11 n.a. n.a. n.a. n.a. n.a
27 Bharuch M 18 44 137 32 -93 0.
28 Bhavnagar M.Corp. 70 255 1456 17 -1202 1.
29 Bhuj M 16 87 186 47 -99 1.
30 Jamnagar M.Corp. 85 503 391 129 112 1.
31 Junagadh M 12 13 89 15 -76 0.
32 Nadiad M 21 56.1 63.5 88 -7.4 0.
33 Navsari M 16 34 171 20 -136 0.34 Porbandar M 10 13 46 28 -33 0.
35 Rajkot M.Corp. 107 264 571 46 -307 0.
36 Surendranagar M 5.6 11 55 20 -44 0.
Haryana
37 Ambala MCI 16 56 154 36 -98 0.
38 Faridabad M.Corp. 184 357 1618 22 -1261 0.
39 Gurgaon MCI 19 56 251 23 -194 0.
40 Hisar MCI 25 58 210 28 -152 0.
41 Karnal MCI 40 77 274 28 -197 0.
42 Rohtak MCI 32 69 172 40 -103 0.
Jammu & Kashmir
43 Jammu M.Corp. 58 n.a. 225 n.a. n.a. n.a
Karnataka
44 Belgaum M.Corp. 36 241 145 166 95 1.
45 Bellary CMC 31 141 105 134 36 1.
3 8 9
Sl. City/Town Water Revenue Revenue Cost Receipts- RevenuNo. supplied Receipts Expenditure Recovery Expenditure (in R
(mld) (Rs. in lakhs) (Rs. in lakhs) (% Receipts Gapto (Rs. in lakhs)
Expenditure)
1 2 3 4 5 6 7

7/21/2019 Status Watersupply
http://slidepdf.com/reader/full/status-watersupply 410/869
46 Davangere MCI 32 41 114 36 -74 0.
47 Gadag-Betigeri CMC 16 40 70 58 -29 0.
48 Gulbarga M.Corp. 32 66 153 43 -87 0.
49 Hubli-Dharwar M.Corp. 88 289.1 294.6 98 -5.6 0.9
50 Mandya M 13 14 26 53 -12 0.
51 Mangalore M.Corp. 85 1199 593 202 605 3.
52 Mysore M.Corp. 138 521 578 90 -57 1.
53 Shimoga CMC 34 22 102 21 -80 0.
54 Tumkur M 22 28 341 8.1 -313 0.
Kerala
55 Alappuzha MC 15 36 169 22 -132 0.56 Kollam MC 18 58 77 75 -19 0.
57 Kozhikode M.Corp. 72 44 n.a. n.a. n.a. 0.
58 Thalaserry M 27 21 84 24 -64 0.
59 Thiruvananthapuram M.Corp. 180 951 530 179 421 1.
Madhya Pradesh
60 Bhind M 19 25 66 38 -41 0.
61 Burhanpur M.Corp. 19 21 38 56 -17 0.
62 Dewas M.Corp. 9.0 46 150 31 -104 1.
63 Guna M 12 44 130 34 -86 1.
64 Gwalior M.Corp. 150 300 1161 26 -861 0.
65 Jabalpur M.Corp. 109 447 586 76 -140 1.
66 Khandwa M 16 40 127 32 -87 0.
67 Morena M 8.5 17 28 60 -11 0.
68 Murwara (Katni) M.Corp. 13 37 97 39 -60 0.
69 Ratlam M.Corp. 18 195 89 218 105 2.
3 9 0
Sl. City/Town Water Revenue Revenue Cost Receipts- RevenuNo. supplied Receipts Expenditure Recovery Expenditure (in R
(mld) (Rs. in lakhs) (Rs. in lakhs) (% Receipts Gapto (Rs. in lakhs)
Expenditure)
1 2 3 4 5 6 7

7/21/2019 Status Watersupply
http://slidepdf.com/reader/full/status-watersupply 411/869
70 Rewa M.Corp. 20 20 200 9.9 -181 0.
71 Satna M.Corp. 14 13 60 21 -48 0.
72 Shivpuri M 13 87 143 61 -56 1.
Maharashtra
73 Amravati M.Corp. 60 725 980 74 -256 3.
74 Aurangabad M.Corp. 168 402 835 48 -433 0.
75 Bhusawal MCl 22 67 187 36 -119 0.
76 Chandrapur MCl 30 54 164 33 -110 0.
77 Dhule MCl 31 68 516 13 -448 0.
78 Ichalkaranji MCl 32 86 289 30 -203 0.
79 Jalgaon MCl 56 38 489 7.8 -451 0.80 Kolhapur M.Corp. 85 911 852 107 59 2.
81 Nanded Waghala M.Corp. 39 75 321 23 -246 0.
82 Nashik M.Corp. 158 855 1941 44 -1086 1.
83 Parbhani MCl 15 48 85 56 -37 0.
84 Solapur M.Corp. 125 836 1241 67 -405 1.
85 Wardha M 12 29 54 54 -25 0.
86 Yavatmal MCl 13 183 234 78 -51 3.
Orissa
87 Bhubaneswar M.Corp. 150 341 1309 26 -968 0.
88 Cuttack M.Corp. 102 83 659 13 -576 0.
89 Puri M 24 34 137 24 -104 0.
90 Rourkela M 16 41 n.a. n.a. n.a. 0.
91 Sambalpur M 19 22 149 15 -127 0.
Punjab
92 Amritsar M.Corp. 127 493 704 70 -211 1.
3 9 1
Sl. City/Town Water Revenue Revenue Cost Receipts- RevenuNo. supplied Receipts Expenditure Recovery Expenditure (in R
(mld) (Rs. in lakhs) (Rs. in lakhs) (% Receipts Gapto (Rs. in lakhs)
Expenditure)
1 2 3 4 5 6 7

7/21/2019 Status Watersupply
http://slidepdf.com/reader/full/status-watersupply 412/869
93 Bathinda MCI 17 47 120 39 -73 0.
94 Hoshiarpur MCI 22 63 128 49 -65 0.
95 Jalandhar M.Corp. 175 399 810 49 -411 0.
96 Moga MCI 20 60 93 65 -33 0.
97 Pathankot MCI 17 42 144 29 -102 0.
98 Patiala M.Corp. 60 154 204 75 -50 0.
Rajasthan
99 Ajmer MCI 52 384 1479 26 -1096 2.
100 Alwar M 32 132 633 21 -501 1.
101 Beawar M 11 38 306 13 -268 0.
102 Bhilwara M 14 103 257 40 -154 2.103 Bikaner M 68 469 1110 42 -641 1.
104 Jodhpur M.Corp. 176 915 4389 21 -3474 1.
105 Kota M.Corp. 160 562 433 130 129 0.
106 Sriganganagar M 22 123 275 45 -152 1.
Tamil Nadu
107 Cuddalore M 4.3 60 40 150 20 3.
108 Dindigul M 12 163 133 122 30 3.
109 Erode M 22 163.3 160.8 102 2.6 2.0
110 Kanchipuram M 16 156 101 154 55 2.
111 Kumbakonam M 11 71 28 251 43 1.
112 Nagercoil M 9.0 135 85 158 50 4.
113 Rajapalaiyam M 8.8 72 59 122 13 2.
114 Salem M.Corp. 50 400 368 109 32 2.
115 Thanjavur M 24 135 90 150 45 1.
116 Tiruchirapalli M.Corp. 88 430 539 80 -109 1.
3 9 2
Sl. City/Town Water Revenue Revenue Cost Receipts- RevenuNo. supplied Receipts Expenditure Recovery Expenditure (in R
(mld) (Rs. in lakhs) (Rs. in lakhs) (% Receipts Gapto (Rs. in lakhs)
Expenditure)
1 2 3 4 5 6 7

7/21/2019 Status Watersupply
http://slidepdf.com/reader/full/status-watersupply 413/869
117 Tirunelveli M.Corp. 34 185.9 178.2 104 7.8 1.
118 Tirunvannamalai M 14 62 54 115 8.0 1.
119 Tiruppur M 29 468 181 259 287 4.
120 Tuticorin M 16 180 212 85 -32 3.
121 Vellore M 13 98.2 103.8 95 -5.6 2.
Uttar Pradesh
122 Agra M.Corp. 250 920 1008 91 -88 1.
123 Aligarh M.Corp. 47 122 108 113 14 0.
124 Allahabad M.Corp. 210 565 645 88 -79 0.
125 Bareilly M.Corp. 80 123 485 25 -362 0.126 Etawah MB 20 17 52 34 -35 0.
127 Faizabad MB 22 49 228 21 -179 0.
128 Firozabad MB 12 14 26 52 -13 0.
129 Ghaziabad M.Corp. 110 251 287 87 -36 0.
130 Gorakhpur M.Corp. 74 106 178 60 -72 0.
131 Haldwani-cum-Kathgodam MB 19 94 82 115 12 1.
132 Hapur MB 14 22.5 29.3 77 -6.9 0.
133 Hardwar MB 39 48 74 64 -26 0.
134 Jhansi MB 77 95 197 48 -101 0.
135 Mathura MB# 27 46 97 48 -50 0.
136 Meerut M.Corp. 132 113 201 56 -88 0.
137 Mirzapur MB 25 17 46 38 -29 0.
138 Moradabad M.Corp. 48 21 50 41 -29 0.
3 9 3
Sl. City/Town Water Revenue Revenue Cost Receipts- RevenuNo. supplied Receipts Expenditure Recovery Expenditure (in R
(mld) (Rs. in lakhs) (Rs. in lakhs) (% Receipts Gapto (Rs. in lakhs)
Expenditure)
1 2 3 4 5 6 7

7/21/2019 Status Watersupply
http://slidepdf.com/reader/full/status-watersupply 414/869
139 Muzaffarnagar MB 46 87.28 87.25 100 0.03 0.
140 Rae Bareli MB 13 17 45 39 -27 0.
141 Rampur MB 20 15.8 22.9 69 -7.1 0.
142 Saharanpur MB 49 79.7 78.3 102 1.4 0.4
143 Sitapur MB 17 8 25 33 -17 0.
144 Unnao MB 21 9 29 30 -20 0.
West Bengal
145 Asansol M.Corp. 52 17 74 23 -57 0.0
146 Baharampur M 15 4 25 17 -21 0.0
147 Balurghat M 0.86 n.a. 11 n.a. n.a. n.a148 Bankura M 11 3 93 3.6 -90 0.0
149 Barasat M 12 7 138 4.8 -131 0.
150 Burdwan M 24 5 76 6.7 -71 0.0
151 Halisahar M 20 n.a. 36 n.a. n.a. n.a
152 Krishnagar M 6.0 4 40 8.8 -37 0.
153 Midnapore M 15 18 95 19 -76 0.
154 North Barrackpore M 14 3 38 7.7 -35 0.0
155 Santipur M 0.91 0.2 n.a. n.a. n.a. 0.0
156 Silliguri M.Corp. 18 n.a. n.a. n.a. n.a. n.a
Small States
Assam
157 Guwahati M.Corp. 55 41 535 7.7 -494 0.
158 Jorhat MB n.a. n.a. n.a. n.a. n.a. n.a
3 9 4
Sl. City/Town Water Revenue Revenue Cost Receipts- RevenuNo. supplied Receipts Expenditure Recovery Expenditure (in R
(mld) (Rs. in lakhs) (Rs. in lakhs) (% Receipts Gapto (Rs. in lakhs)
Expenditure)
1 2 3 4 5 6 7

7/21/2019 Status Watersupply
http://slidepdf.com/reader/full/status-watersupply 415/869
3 9 5
Manipur
159 Imphal MCI 58 n.a. n.a. n.a. n.a. n.a
Meghalaya
160 Shillong MB 27 31 n.a. n.a. n.a. 0.
Mizoram
161 Aizwal NM 11 78 n.a. n.a. n.a. 2.
Tripura
162 Agartala MCI 22 23 n.a. n.a. n.a. 0.
Union Territories
163 Chandigarh M.Corp. 227 1885 2859 66 -974 2.164 Pondicherry M 33 123 199 62 -76 1.
Source: Respective urban local governments/relevant agencies, NIUA Survey, 1999
Sl. City/Town Water Revenue Revenue Cost Receipts- RevenuNo. supplied Receipts Expenditure Recovery Expenditure (in R
(mld) (Rs. in lakhs) (Rs. in lakhs) (% Receipts Gapto (Rs. in lakhs)
Expenditure)
1 2 3 4 5 6 7

7/21/2019 Status Watersupply
http://slidepdf.com/reader/full/status-watersupply 416/869
CLASS II
Andhra Pradesh
1 Anakapalle M 3.6 30 17 176 13 2.
2 Dharmavaram M 7.9 40 59 68 -19 1.
3 Gudur MCI 7.1 60 83 73 -23 2.
4 Kapra M 4.6 51 66 77 -15 3.
5 Kavali MCI 5.0 5 18 26 -13 0.
6 Madanapalle M 7.7 38 117 32 -80 1.
7 Narasaraopet M 4.5 37 73 51 -36 2.
8 Rajendra nagar MCI 5.1 n.a. n.a. n.a. n.a. n.a
9 Sangareddy MCI 3.9 15 44 35 -29 1.
10 Srikakulam MCI 6.8 34.2 32.4 106 1.8 1.
11 Srikalahasti M 6.8 16 44 36 -28 0.
12 Suryapet MCI 7.6 54.3 46.9 116 7.4 1.
Bihar
13 Buxar M 3.9 11 n.a. n.a. n.a. 0.
14 Deoghar M 3.0 n.a. n.a. n.a. n.a. n.a
15 Hajipur M 11 2 n.a. n.a. n.a. 0.0
16 Hazaribagh M 7.3 13 169 7.5 -156 0.
17 Jehanabad M 8.0 n.a. n.a. n.a. n.a. n.a
18 Madhubani M 8.0 2 37 5.2 -35 0.0
19 Mokama M 2.0 n.a. n.a. n.a. n.a. n.a
Gujarat
20 Amreli M 10 22 166 13 -144 0.
21 Ankleswar M 10 18 55 33 -37 0.
3 9 6
Sl. City/Town Water Revenue Revenue Cost Receipts- RevenuNo. supplied Receipts Expenditure Recovery Expenditure (in R
(mld) (Rs. in lakhs) (Rs. in lakhs) (% Receipts Gapto (Rs. in lakhs)
Expenditure)
1 2 3 4 5 6 7

7/21/2019 Status Watersupply
http://slidepdf.com/reader/full/status-watersupply 417/869
22 Dabhoi M 9.0 16 77 21 -61 0.
23 Dohad M 7.5 19 33 60 -13 0.
24 Gondal M 13 38.1 38.3 99 -0.2 0.80
25 Jetpur M 11 16 70 23 -54 0.
26 Mahesana M 15 24 111 22 -86 0.
27 Palanpur M 4.0 12 89 13 -77 0.
Haryana
28 Jind MCI 16 44 86 52 -42 0.
29 Kaithal MCI 11 26 71 37 -45 0.
30 Rewari MCI 11 40 166 24 -126 1.31 Thanesar MCI 13 43 112 39 -68 0.
Karnataka
32 Bagalkot CMC 12 3 37 7.6 -34 0.0
33 Chikmaglur CMC 15 49 29 167 20 0.
34 Gokak CMC 4.6 32 19 168 13 1.
35 Hospet CMC 16 12.3 16.0 76 -3.8 0.
36 Kolar CMC 8.0 58 86 67 -28 1.
37 Rabkavi-Banhatti CMC 4.5 7 39 19 -32 0.
38 Ramanagaram CMC 4.5 10 19 54 -9.0 0.
Kerala39 Changanessary MC 4.0 34 46 73 -13 2.
40 Payyanur M 1.5 n.a. n.a. n.a. n.a. n.a
41 Taliparamba M 0.39 n.a. n.a. n.a. n.a. n.a
42 Thrissur MC 18 6 101 6.0 -95 0.
3 9 7
Sl. City/Town Water Revenue Revenue Cost Receipts- RevenuNo. supplied Receipts Expenditure Recovery Expenditure (in R
(mld) (Rs. in lakhs) (Rs. in lakhs) (% Receipts Gapto (Rs. in lakhs)
Expenditure)
1 2 3 4 5 6 7

7/21/2019 Status Watersupply
http://slidepdf.com/reader/full/status-watersupply 418/869
Madhya Pradesh
43 Hoshangabad M 8.1 16 29 56 -13 0.
44 Itarsi M 5.9 9 20 44 -11 0.
45 Khargone M 13 16 32 49 -16 0.
46 Mandsaur M 9.0 28 56 50 -28 0.
47 Nagda M 3.0 13.1 15.6 84 -2.5 1.
48 Neemuch M 5.9 24 79 30 -56 1.
49 Sehore M 5.3 4 15 28 -11 0.
50 Shahdol M 4.7 17.6 23.3 76 -5.7 1.
51 Vidisha M 9.0 21 81 26 -60 0.
Maharashtra
52 Amalner MCl 15 269 163 166 107 4.
53 Ballarpur MCl 7.0 n.a. 90 n.a. n.a. n.a
54 Bhandara M 9.0 n.a. n.a. n.a. n.a. n.a
55 Kamptee MCl 3.6 19.0 20.3 93 -1.3 1.
56 Manmad MCl 7.2 12 864 1.4 -851 0.
57 Ratnagiri MCl 8.0 39 107 37 -68 1.
58 Satara MCl 11 33 151 22 -118 0.
59 Virar MCl 9.0 118 n.a. n.a. n.a. 3.
Orissa
60 Balangir M 7.2 8 54 15 -46 0.
61 Bhadrak M 3.0 4 n.a. n.a. n.a. 0.
Punjab
62 Firozpur MCI 20 47 62 75 -16 0.
63 Kapurthala M 14 62 77 81 -15 1.
3 9 8
Sl. City/Town Water Revenue Revenue Cost Receipts- RevenuNo. supplied Receipts Expenditure Recovery Expenditure (in R
(mld) (Rs. in lakhs) (Rs. in lakhs) (% Receipts Gapto (Rs. in lakhs)
Expenditure)
1 2 3 4 5 6 7

7/21/2019 Status Watersupply
http://slidepdf.com/reader/full/status-watersupply 419/869
64 Mansa MCI 8.0 14 34 41 -20 0.
65 Phagwara MCI 15 46 87 53 -41 0.
66 Sangrur MCI 13 29 57 51 -28 0.
Rajasthan
67 Banswara M 9.8 50 n.a. n.a. n.a. 1.
68 Barmer M 6.5 65 240 27 -176 2.
69 Bundi M 8.0 46 189 24 -144 1.
70 Churu M 7.7 n.a. 216 n.a. n.a. n.a
71 Hanumangarh M 7.2 40 19 207 21 1.
72 Sawai Madhopur M 7.8 31 156 20 -125 1.
Tamil Nadu
73 Ambur M 5.6 36.2 33.1 109 3.1 1.
74 Arakkonam M 4.0 35 46 75 -11 2.
75 Attur M 3.0 43 19 229 24 3.
76 Cambam M 2.7 21.8 17.9 122 3.9 2.
77 Dharmapuri M 3.0 39.3 29.4 133 9.9 3.
78 Guduivattam M 5.8 23.7 31.4 75 -7.8 1.
79 Nagapattinam M 7.8 36 24 148 12 1.
80 Pudukkottai M 7.9 104 100 104 4.0 3.
81 Sivakasi M 5.2 110 168 65 -59 5.
82 Srivilliputtur M 3.5 16.3 21.6 75 -5.3 1.
83 Tindivanam MC 1.9 21.0 19.4 108 1.6 3.
84 Udhagamandalam M 4.0 138 127 109 11 9.
Uttar Pradesh
85 Auraiya MB 4.5 8.6 8.3 105 0.3 0.5
3 9 9
Sl. City/Town Water Revenue Revenue Cost Receipts- RevenuNo. supplied Receipts Expenditure Recovery Expenditure (in R
(mld) (Rs. in lakhs) (Rs. in lakhs) (% Receipts Gapto (Rs. in lakhs)
Expenditure)
1 2 3 4 5 6 7

7/21/2019 Status Watersupply
http://slidepdf.com/reader/full/status-watersupply 420/869
86 Balrampur MB 2.8 1 5.3 19 -4.3 0.
87 Basti MB 10 8 34 22 -26 0.
88 Bhadohi MB 4.0 8.9 13.1 68 -4.2 0.
89 Chandpur MB 3.2 9.6 5.4 177 4.2 0.
90 Etah MB 4.0 7 17 38 -10 0.4
91 Ghazipur MB 16 10 23 44 -13 0.
92 Gonda MB 9.0 16.1 17.9 90 -1.8 0.4
93 Lakhimpur MB 13 21 22 95 -1.0 0.4
94 Lalitpur MB 8.5 39.7 48.8 81 -9.1 1.
95 Mughalsarai MB 4.0 5 42 11 -37 0.96 Nawabganj-
Barabanki MB 9.1 9 23 39 -14 0.
97 Orai MB 8.2 27 63 43 -36 0.
98 Roorkee MB 19 21.3 28.9 74 -7.6 0.
West Bengal
99 Bishnupur M 2.6 1 17 6.2 -16 0.
100 Chakdaha M 1.9 0.4 14.1 2.8 -13.7 0.0
101 Contai M 1.6 n.a. 21 n.a. n.a. n.a
102 Cooch Behar M 9.9 4 32 11 -28 0.
103 Darjeeling M 6.0 4 72 5.3 -68 0.104 Jalpaiguri M 4.9 9 39 24 -30 0.
105 Jangipur M 3.0 n.a. 8.50 n.a. n.a. n.a
106 Katwa M 1.5 n.a. 7.44 n.a. n.a. n.a
107 Raniganj M 5.1 1.5 50.3 3.0 -48.8 0.0
4 0 0
Sl. City/Town Water Revenue Revenue Cost Receipts- RevenuNo. supplied Receipts Expenditure Recovery Expenditure (in R
(mld) (Rs. in lakhs) (Rs. in lakhs) (% Receipts Gapto (Rs. in lakhs)
Expenditure)
1 2 3 4 5 6 7

7/21/2019 Status Watersupply
http://slidepdf.com/reader/full/status-watersupply 421/869
4 0 1
Small States
Himachal Pradesh
108 Shimla M.Corp. 28 150.6 152.9 98 -2.3 1.4
Nagaland
109 Kohima TC 2.9 5 n.a. n.a. n.a. 0.
Union Teritories
110 Port Balir MCI 15 105 298 35 -193 1.
Others (Smaller than Class II towns)
Small States
Arunachal Pradesh
111 Itanagar CT 5.5 n.a. n.a. n.a. n.a. n.a
Goa
112 Panaji MCI 12 479 n.a. n.a. n.a. 11.
Union Territories
113 Daman MCI 8.0 10 38 26 -28 0.
114 Kavarathi NMCT 0.04 0.04 18.31 0.2 -18.27 0.
115 Silvassa 1.4 1 24 4.3 -23 0.
Source: Respective urban local governments/relevant agencies, NIUA Survey, 1999
Sl. City/Town Water Revenue Revenue Cost Receipts- RevenNo. supplied Receipts Expenditure Recovery Expenditure (in R
(mld) (Rs. in lakhs) (Rs. in lakhs) (% Receipts Gapto (Rs. in lakhs)
Expenditure)
1 2 3 4 5 6 7

7/21/2019 Status Watersupply
http://slidepdf.com/reader/full/status-watersupply 422/869

7/21/2019 Status Watersupply
http://slidepdf.com/reader/full/status-watersupply 423/869
A -1 6
P E R C A P I T A R E V E N UE R E C E I P T S A
ND
E X P E NDI T
UR E ,1 9 9 7 - 9 8

7/21/2019 Status Watersupply
http://slidepdf.com/reader/full/status-watersupply 424/869
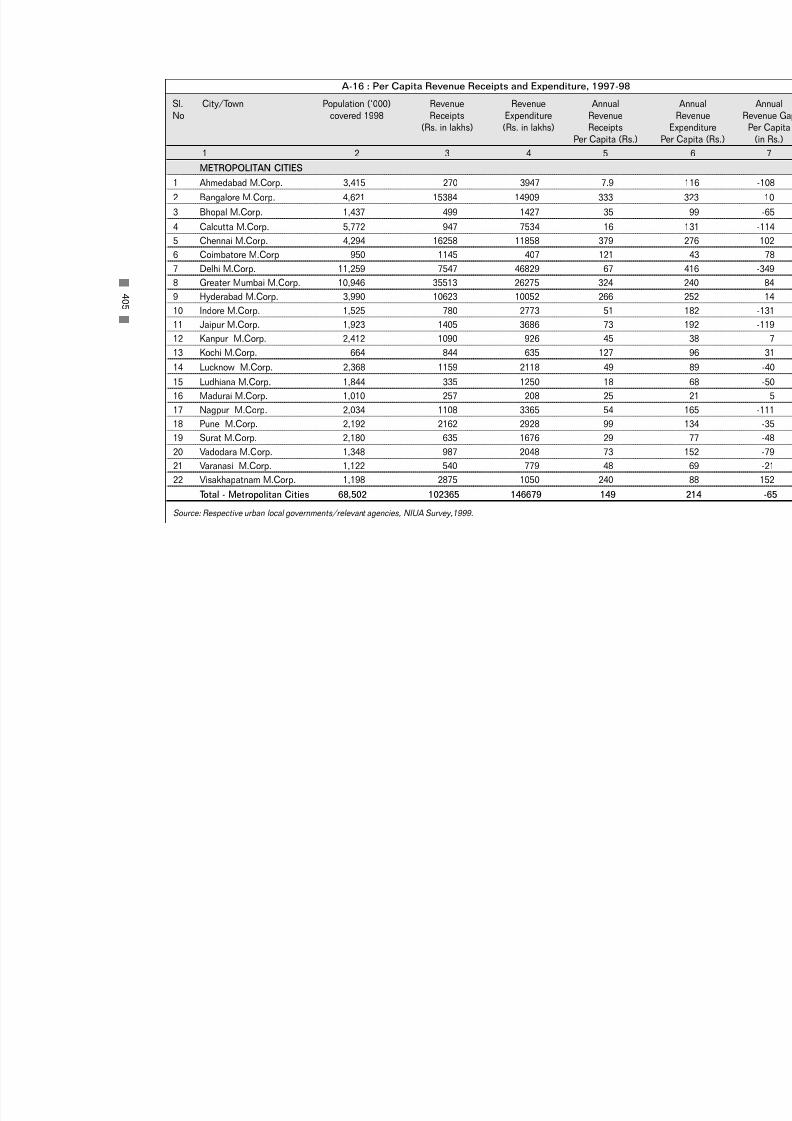
7/21/2019 Status Watersupply
http://slidepdf.com/reader/full/status-watersupply 425/869
METROPOLITAN CITIES
1 Ahmedabad M.Corp. 3,415 270 3947 7.9
2 Bangalore M.Corp. 4,621 15384 14909 333
3 Bhopal M.Corp. 1,437 499 1427 35
4 Calcutta M.Corp. 5,772 947 7534 16
5 Chennai M.Corp. 4,294 16258 11858 379
6 Coimbatore M.Corp 950 1145 407 121
7 Delhi M.Corp. 11,259 7547 46829 67
8 Greater Mumbai M.Corp. 10,946 35513 26275 324
9 Hyderabad M.Corp. 3,990 10623 10052 26610 Indore M.Corp. 1,525 780 2773 51
11 Jaipur M.Corp. 1,923 1405 3686 73
12 Kanpur M.Corp. 2,412 1090 926 45
13 Kochi M.Corp. 664 844 635 127
14 Lucknow M.Corp. 2,368 1159 2118 49
15 Ludhiana M.Corp. 1,844 335 1250 18
16 Madurai M.Corp. 1,010 257 208 25
17 Nagpur M.Corp. 2,034 1108 3365 54
18 Pune M.Corp. 2,192 2162 2928 99
19 Surat M.Corp. 2,180 635 1676 29
20 Vadodara M.Corp. 1,348 987 2048 7321 Varanasi M.Corp. 1,122 540 779 48
22 Visakhapatnam M.Corp. 1,198 2875 1050 240
Total - Metropolitan Cities 68,502 102365 146679 149
Source: Respective urban local governments/relevant agencies, NIUA Survey,1999.
4 0 5
Sl. City/Town Population (‘000) Revenue Revenue Annual
No covered 1998 Receipts Expenditure Revenue(Rs. in lakhs) (Rs. in lakhs) Receipts
Per Capita (Rs.)
1 2 3 4 5
A-16 : Per Capita Revenue Receipts and Expenditure, 1997-98

7/21/2019 Status Watersupply
http://slidepdf.com/reader/full/status-watersupply 426/869
CLASS IAndhra Pradesh
1 Anantapur MCI 239 131 92 55
2 Chittoor M 147 30 127 20
3 Cuddapah MCI 160 36 148 23
4 Eluru M 242 87 93 36
5 Guntur MCI 545 343 586 63
6 Hindupur M 135 20 87 15
7 Kakinada M 319 144 159 45
8 Kurnool MCI 275 48 75 17
9 Machilipatnam M 194 4 n.a. 1.8
10 Nandyal MCI 146 27 74 19
11 Nellore MCI 392 112 108 29
12 Nizamabad M 279 n.a. n.a. n.a.
13 Ongole MCI 167 69 78 41
14 Qutubullapur M 225 44 207 20
15 Rajahmundry M.Corp. 373 171 203 46
16 Tenali M 166 7 6 4.1
17 Tirupati MCI 205 110 156 53
18 Vijaywada M.Corp. 819 480 544 59
19 Warangal M.Corp. 645 538 373 83
Bihar
20 Bihar Sharif M 243 n.a. n.a. n.a.
21 Chhapra M 191 2 59 1.3
22 Gaya M.Corp. 385 35 19 9
23 Katihar M 190 n.a. n.a. n.a.
24 Munger M 201 9 15 4
4 0 6
Sl. City/Town Population (‘000) Revenue Revenue Annual No covered 1998 Receipts Expenditure Revenue
(Rs. in lakhs) (Rs. in lakhs) Receipts Per Capita (Rs.)
1 2 3 4 5

7/21/2019 Status Watersupply
http://slidepdf.com/reader/full/status-watersupply 427/869
25 Ranchi M.Corp. 687 2 44 0.3Gujarat
26 Anand M 165 n.a. n.a. n.a.
27 Bharuch M 156 44 137 28
28 Bhavnagar M.Corp. 529 255 1456 48
29 Bhuj M 116 87 186 75
30 Jamnagar M.Corp. 477 503 391 106
31 Junagadh M 160 13 89 8.2
32 Nadiad M 279 56 64 20
33 Navsari M 137 34 171 25
34 Porbandar M 139 13 46 9.4
35 Rajkot M.Corp. 930 264 571 28
36 Surendranagar M 144 11 55 7.4
Haryana
37 Ambala MCI 138 56 154 40
38 Faridabad M.Corp. 1,064 357 1618 34
39 Gurgaon MCI 167 56 251 34
40 Hisar MCI 239 58 210 24
41 Karnal MCI 214 77 274 36
42 Rohtak MCI 239 69 172 29
Jammu & Kashmir
43 Jammu M.Corp. 1,002 n.a. 225 n.a.
Karnataka
44 Belgaum M.Corp. 449 241 145 54
45 Bellary CMC 290 141 105 48
46 Davangere MCI 425 41 114 9.6
47 Gadag-Betigeri CMC 146 40 70 28
4 0 7
Sl. City/Town Population (‘000) Revenue Revenue Annual No covered 1998 Receipts Expenditure Revenue
(Rs. in lakhs) (Rs. in lakhs) Receipts Per Capita (Rs.)
1 2 3 4 5

7/21/2019 Status Watersupply
http://slidepdf.com/reader/full/status-watersupply 428/869
48 Gulbarga M.Corp. 428 66 153 1549 Hubli-Dharwar M.Corp. 822 289 295 35.2
50 Mandya M 137 14 26 10
51 Mangalore M.Corp. 390 1199 593 308
52 Mysore M.Corp. 952 521 578 55
53 Shimoga CMC 216 22 102 10
54 Tumkur M 272 28 341 10
Kerala
55 Alappuzha MC 197 36 169 19
56 Kollam MC 157 58 77 37
57 Kozhikode M.Corp. 483 44 n.a. 9.2
58 Thalaserry M 130 21 84 16
59 Thiruvananthapuram M.Corp. 577 951 530 165
Madhya Pradesh
60 Bhind M 165 25 66 15
61 Burhanpur M.Corp. 205 21 38 10
62 Dewas M.Corp. 195 46 150 24
63 Guna M 122 44 130 36
64 Gwalior M.Corp. 871 300 1161 34
65 Jabalpur M.Corp. 963 447 586 46
66 Khandwa M 171 40 127 23
67 Morena M 122 17 28 14
68 Murwara (Katni) M.Corp. 178 37 97 21
69 Ratlam M.Corp. 228 195 89 86
70 Rewa M.Corp. 173 20 200 11
71 Satna M.Corp. 194 13 60 6.6
72 Shivpuri M 136 87 143 64
4 0 8
Sl. City/Town Population (‘000) Revenue Revenue Annual No covered 1998 Receipts Expenditure Revenue
(Rs. in lakhs) (Rs. in lakhs) Receipts Per Capita (Rs.)
1 2 3 4 5

7/21/2019 Status Watersupply
http://slidepdf.com/reader/full/status-watersupply 429/869
Maharashtra73 Amravati M.Corp. 489 725 980 148
74 Aurangabad M.Corp. 824 402 835 49
75 Bhusawal MCl 192 67 187 35
76 Chandrapur MCl 285 54 164 19
77 Dhule MCl 323 68 516 21
78 Ichalkaranji MCl 245 86 289 35
79 Jalgaon MCl 376 38 489 10
80 Kolhapur M.Corp. 489 911 852 186
81 Nanded Waghala M.Corp. 390 75 321 19
82 Nashik M.Corp. 814 855 1941 105
83 Parbhani MCl 227 48 85 21
84 Solapur M.Corp. 856 836 1241 98
85 Wardha M 143 29 54 20
86 Yavatmal MCl 127 183 234 144
Orissa
87 Bhubaneswar M.Corp. 617 341 1309 55
88 Cuttack M.Corp. 540 83 659 15
89 Puri M 146 34 137 23
90 Rourkela M 191 41 n.a. 21
91 Sambalpur M 154 22 149 15
Punjab
92 Amritsar M.Corp. 825 493 704 60
93 Bathinda MCI 172 47 120 27
94 Hoshiarpur MCI 142 63 128 44
95 Jalandhar M.Corp. 705 399 810 57
96 Moga MCI 142 60 93 43
4 0 9
Sl. City/Town Population (‘000) Revenue Revenue Annual No covered 1998 Receipts Expenditure Revenue
(Rs. in lakhs) (Rs. in lakhs) Receipts Per Capita (Rs.)
1 2 3 4 5

7/21/2019 Status Watersupply
http://slidepdf.com/reader/full/status-watersupply 430/869
97 Pathankot MCI 184 42 144 2398 Patiala M.Corp. 315 154 204 49
Rajasthan
99 Ajmer MCI 529 384 1479 72
100 Alwar M 286 132 633 46
101 Beawar M 136 38 306 28
102 Bhilwara M 219 103 257 47
103 Bikaner M 573 469 1110 82
104 Jodhpur M.Corp. 951 915 4389 96
105 Kota M.Corp. 719 562 433 78
106 Sriganganagar M 216 123 275 57
Tamil Nadu
107 Cuddalore M 160 60 40 38
108 Dindigul M 210 163 133 78
109 Erode M 172 163 161 95
110 Kanchipuram M 155 156 101 101
111 Kumbakonam M 146 71 28 49
112 Nagercoil M 204 135 85 66
113 Rajapalaiyam M 122 72 59 59
114 Salem M.Corp. 436 400 368 91
115 Thanjavur M 215 135 90 63
116 Tiruchirapalli M.Corp. 782 430 539 55
117 Tirunelveli M.Corp. 409 186 178 45
118 Tirunvannamalai M 126 62 54 49
119 Tiruppur M 287 468 181 163
120 Tuticorin M 214 180 212 84
121 Vellore M 176 98 104 56
4 1 0
Sl. City/Town Population (‘000) Revenue Revenue Annual No covered 1998 Receipts Expenditure Revenue
(Rs. in lakhs) (Rs. in lakhs) Receipts Per Capita (Rs.)
1 2 3 4 5
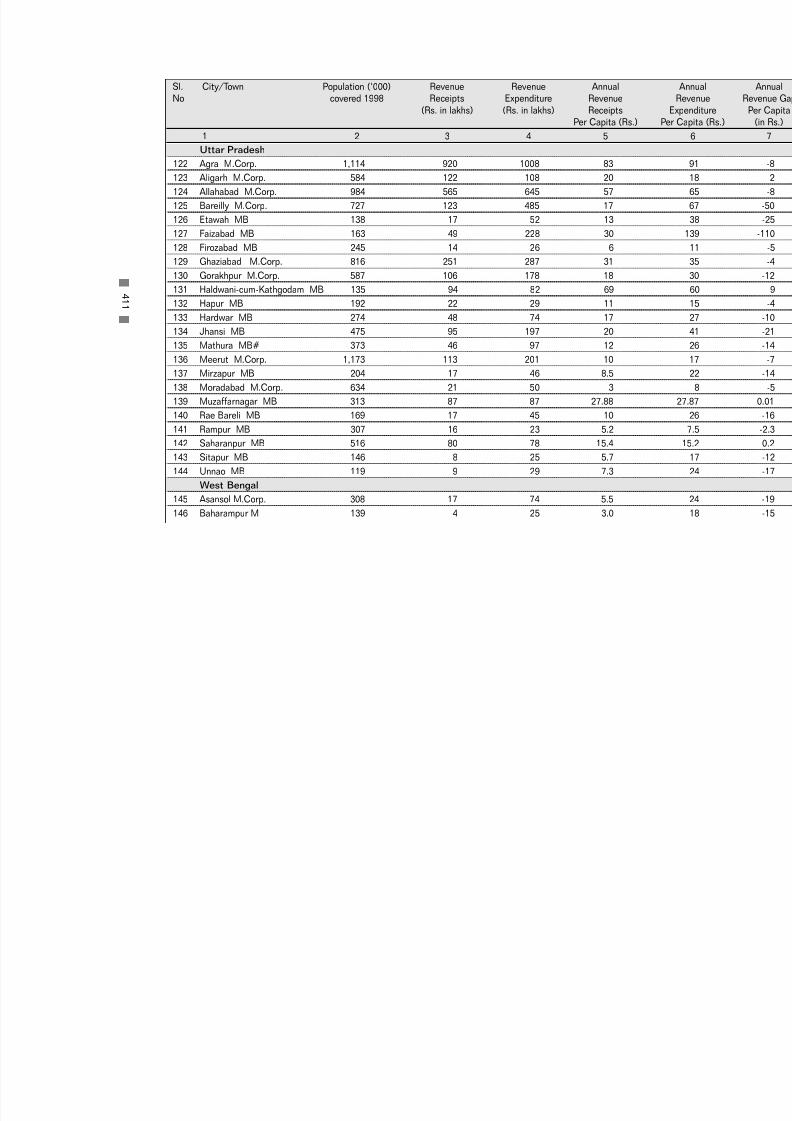
7/21/2019 Status Watersupply
http://slidepdf.com/reader/full/status-watersupply 431/869
Uttar Pradesh122 Agra M.Corp. 1,114 920 1008 83
123 Aligarh M.Corp. 584 122 108 20
124 Allahabad M.Corp. 984 565 645 57
125 Bareilly M.Corp. 727 123 485 17
126 Etawah MB 138 17 52 13
127 Faizabad MB 163 49 228 30
128 Firozabad MB 245 14 26 6
129 Ghaziabad M.Corp. 816 251 287 31
130 Gorakhpur M.Corp. 587 106 178 18
131 Haldwani-cum-Kathgodam MB 135 94 82 69
132 Hapur MB 192 22 29 11
133 Hardwar MB 274 48 74 17
134 Jhansi MB 475 95 197 20
135 Mathura MB# 373 46 97 12
136 Meerut M.Corp. 1,173 113 201 10
137 Mirzapur MB 204 17 46 8.5
138 Moradabad M.Corp. 634 21 50 3
139 Muzaffarnagar MB 313 87 87 27.88
140 Rae Bareli MB 169 17 45 10
141 Rampur MB 307 16 23 5.2
142 Saharanpur MB 516 80 78 15.4
143 Sitapur MB 146 8 25 5.7
144 Unnao MB 119 9 29 7.3
West Bengal
145 Asansol M.Corp. 308 17 74 5.5
146 Baharampur M 139 4 25 3.0
4 1 1
Sl. City/Town Population (‘000) Revenue Revenue Annual No covered 1998 Receipts Expenditure Revenue
(Rs. in lakhs) (Rs. in lakhs) Receipts Per Capita (Rs.)
1 2 3 4 5

7/21/2019 Status Watersupply
http://slidepdf.com/reader/full/status-watersupply 432/869
147 Balurghat M 130 n.a. 11 n.a.148 Bankura M 146 3 93 2.3
149 Barasat M 143 7 138 4.6
150 Burdwan M 312 5 76 1.6
151 Halisahar M 144 n.a. 36 n.a.
152 Krishnagar M 142 4 40 2.5
153 Midnapore M 154 18 95 12
154 North Barrackpore M 116 3 38 2.5
155 Santipur M 131 0.2 n.a. 0.2
156 Silliguri M.Corp. 476 n.a. n.a. n.a.
Small States
Assam
157 Guwahati M.Corp. 931 41 535 4.4
158 Jorhat MB 161 n.a. n.a. n.a.
Manipur
159 Imphal MCI 239 n.a. n.a. n.a.
Meghalaya
160 Shillong MB 204 31 n.a. 15
Mizoram
161 Aizwal NM 231 78 n.a. 34
Tripura
162 Agartala MCI 194 23 n.a. 12
Union Territories
163 Chandigarh M.Corp. 796 1885 2859 237
164 Pondicherry M 277 123 199 44
Source: Respective urban local governments/relevant agencies, NIUA Survey, 1999
4 1 2
Sl. City/Town Population (‘000) Revenue Revenue Annual No covered 1998 Receipts Expenditure Revenue
(Rs. in lakhs) (Rs. in lakhs) Receipts Per Capita (Rs.)
1 2 3 4 5

7/21/2019 Status Watersupply
http://slidepdf.com/reader/full/status-watersupply 433/869
CLASS II
Andhra Pradesh
1 Anakapalle M 111 30 17 27
2 Dharmavaram M 97 40 59 41
3 Gudur MCI 70 60 83 86
4 Kapra M 115 51 66 44
5 Kavali MCI 82 5 18 5.6
6 Madanapalle M 96 38 117 39
7 Narasaraopet M 94 37 73 40
8 Rajendra nagar MCI 115 n.a. n.a. n.a.
9 Sangareddy MCI 59 15 44 2610 Srikakulam MCI 99 34 32 35
11 Srikalahasti M 69 16 44 23
12 Suryapet MCI 85 54 47 64
Bihar
13 Buxar M 65 11 n.a. 17
14 Deoghar M 97 n.a. n.a. n.a.
15 Hajipur M 111 2 n.a. 1.5
16 Hazaribagh M 116 13 169 11
17 Jehanabad M 56 n.a. n.a. n.a.
18 Madhubani M 64 2 37 3.0
19 Mokama M 65 n.a. n.a. n.a.
Gujarat
20 Amreli M 83 22 166 27
21 Ankleswar M 59 18 55 30
4 1 3
Sl. City/Town Population (‘000) Revenue Revenue Annual No covered 1998 Receipts Expenditure Revenue
(Rs. in lakhs) (Rs. in lakhs) Receipts Per Capita (Rs.)
1 2 3 4 5

7/21/2019 Status Watersupply
http://slidepdf.com/reader/full/status-watersupply 434/869
22 Dabhoi M 63 16 77 2523 Dohad M 76 19 33 25
24 Gondal M 97 38 38 39.1
25 Jetpur M 117 16 70 14
26 Mahesana M 130 24 111 19
27 Palanpur M 112 12 89 10
Haryana
28 Jind MCI 110 44 86 40
29 Kaithal MCI 91 26 71 29
30 Rewari MCI 101 40 166 40
31 Thanesar MCI 97 43 112 45Karnataka
32 Bagalkot CMC 97 3 37 2.9
33 Chikmaglur CMC 94 49 29 52
34 Gokak CMC 66 32 19 49
35 Hospet CMC 112 12 16 11
36 Kolar CMC 108 58 86 53
37 Rabkavi-Banhatti CMC 70 7 39 11
38 Ramanagaram CMC 67 10 19 15
Kerala
39 Changanessary MC 61 34 46 56
40 Payyanur M 70 n.a. n.a. n.a.
41 Taliparamba M 53 n.a. n.a. n.a.
42 Thrissur MC 89 6 101 6.8
Madhya Pradesh
43 Hoshangabad M 96 16 29 17
4 1 4
Sl. City/Town Population (‘000) Revenue Revenue Annual No covered 1998 Receipts Expenditure Revenue
(Rs. in lakhs) (Rs. in lakhs) Receipts Per Capita (Rs.)
1 2 3 4 5

7/21/2019 Status Watersupply
http://slidepdf.com/reader/full/status-watersupply 435/869
44 Itarsi M 101 9 20 8.545 Khargone M 78 16 32 20
46 Mandsaur M 119 28 56 24
47 Nagda M 97 13 16 13
48 Neemuch M 98 24 79 24
49 Sehore M 96 4 15 4.5
50 Shahdol M 72 18 23 24
51 Vidisha M 120 21 81 17
Maharashtra
52 Amalner MCl 97 269 163 278
53 Ballarpur MCl 105 n.a. 90 n.a.54 Bhandara M 75 n.a. n.a. n.a.
55 Kamptee MCl 93 19 20 20
56 Manmad MCl 83 12 864 15
57 Ratnagiri MCl 68 39 107 58
58 Satara MCl 99 33 151 34
59 Virar MCl 93 118 n.a. 126
Orissa
60 Balangir M 81 8 54 9.8
61 Bhadrak M 91 4 n.a. 3.9
Punjab
62 Firozpur MCI 91 47 62 51
63 Kapurthala M 82 62 77 76
64 Mansa MCI 65 14 34 22
65 Phagwara MCI 105 46 87 44
66 Sangrur MCI 68 29 57 43
4 1 5
Sl. City/Town Population (‘000) Revenue Revenue Annual No covered 1998 Receipts Expenditure Revenue
(Rs. in lakhs) (Rs. in lakhs) Receipts Per Capita (Rs.)
1 2 3 4 5
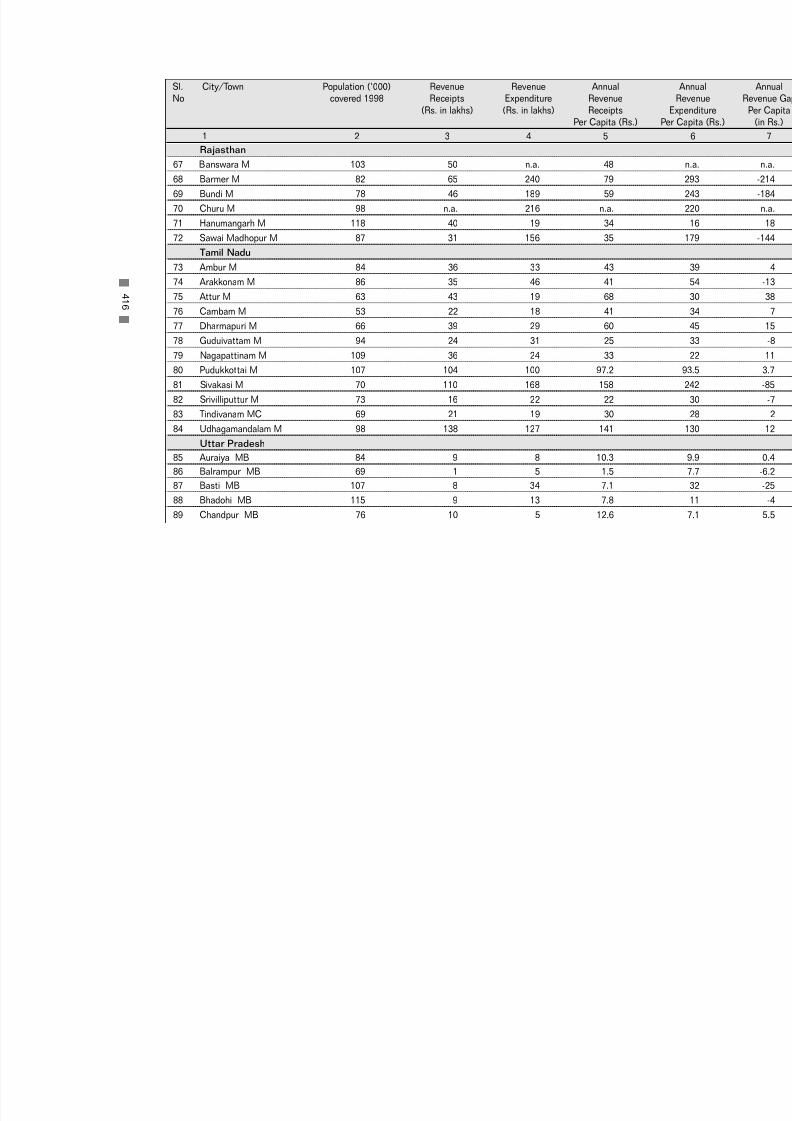
7/21/2019 Status Watersupply
http://slidepdf.com/reader/full/status-watersupply 436/869
Rajasthan67 Banswara M 103 50 n.a. 48
68 Barmer M 82 65 240 79
69 Bundi M 78 46 189 59
70 Churu M 98 n.a. 216 n.a.
71 Hanumangarh M 118 40 19 34
72 Sawai Madhopur M 87 31 156 35
Tamil Nadu
73 Ambur M 84 36 33 43
74 Arakkonam M 86 35 46 41
75 Attur M 63 43 19 6876 Cambam M 53 22 18 41
77 Dharmapuri M 66 39 29 60
78 Guduivattam M 94 24 31 25
79 Nagapattinam M 109 36 24 33
80 Pudukkottai M 107 104 100 97.2
81 Sivakasi M 70 110 168 158
82 Srivilliputtur M 73 16 22 22
83 Tindivanam MC 69 21 19 30
84 Udhagamandalam M 98 138 127 141
Uttar Pradesh
85 Auraiya MB 84 9 8 10.3
86 Balrampur MB 69 1 5 1.5
87 Basti MB 107 8 34 7.1
88 Bhadohi MB 115 9 13 7.8
89 Chandpur MB 76 10 5 12.6
4 1 6
Sl. City/Town Population (‘000) Revenue Revenue Annual No covered 1998 Receipts Expenditure Revenue
(Rs. in lakhs) (Rs. in lakhs) Receipts Per Capita (Rs.)
1 2 3 4 5

7/21/2019 Status Watersupply
http://slidepdf.com/reader/full/status-watersupply 437/869
90 Etah MB 126 7 17 591 Ghazipur MB 93 10 23 11
92 Gonda MB 112 16 18 14
93 Lakhimpur MB 97 21 22 22
94 Lalitpur MB 97 40 49 41
95 Mughalsarai MB 143 5 42 3.3
96 Nawabganj-Barabanki MB 87 9 23 10
97 Orai MB 159 27 63 17
98 Roorkee MB 97 21 29 22
West Bengal
99 Bishnupur M 66 1 17 1.6100 Chakdaha M 88 0.4 14 0.4
101 Contai M 104 n.a. 21 n.a.
102 Cooch Behar M 95 4 32 3.9
103 Darjeeling M 90 4 72 4.3
104 Jalpaiguri M 96 9 39 9.6
105 Jangipur M 75 n.a. 9 n.a.
106 Katwa M 66 n.a. 7 n.a.
107 Raniganj M 111 2 50 1.3
Small States
Himachal Pradesh108 Shimla M.Corp. 107 151 153 141
Nagaland
109 Kohima TC 94 5 n.a. 5.0
4 1 7
Sl. City/Town Population (‘000) Revenue Revenue Annual No covered 1998 Receipts Expenditure Revenue
(Rs. in lakhs) (Rs. in lakhs) Receipts Per Capita (Rs.)
1 2 3 4 5

7/21/2019 Status Watersupply
http://slidepdf.com/reader/full/status-watersupply 438/869
Union Teritories110 Port Balir MCI 101 105 298 104
Others (Smaller than Class II towns)
Small States
Arunachal Pradesh
111 Itanagar CT 31 n.a. n.a. n.a.
Goa
112 Panaji MCI 55 479 n.a. 867
Union Territories
113 Daman MCI 34 10 38 30
114 Kavarathi NMCT 11 0.04 18 0.4115 Silvassa 19 1 24 5.6
Source: Respective urban local governments/relevant agencies, NIUA Survey, 1999.
4 1 8
Sl. City/Town Population (‘000) Revenue Revenue Annual No covered 1998 Receipts Expenditure Revenue
(Rs. in lakhs) (Rs. in lakhs) Receipts Per Capita (Rs.)
1 2 3 4 5

7/21/2019 Status Watersupply
http://slidepdf.com/reader/full/status-watersupply 439/869
A -1 7
C A P I T A L W OR K S U
NDE R T A K E NB E T
WE E N
1 9 9 4 A ND1 9 9 9

7/21/2019 Status Watersupply
http://slidepdf.com/reader/full/status-watersupply 440/869

7/21/2019 Status Watersupply
http://slidepdf.com/reader/full/status-watersupply 441/869
4 2 1
Metropolitan Cities1 Calcutta M.Corp. 1 Augmentation Treatment plant 7,500,000 90.00 1996 1997
& Pumping station2 Augmentation Pipe lines & 8,000,000 270.00 1997 Ongoing
Treatment plant3 Improving Pipe lines & 8,000,000 176.00 1998 Ongoing
existing system Reservoirs4 Increasing Pipe lines 8,000,000 n.a. 1998 Ongoing
capacity of pipe line
2 Greater Bombay M.Corp. 1 Augmentation Pipe lines, 90,000,000 450.00 1999 OngoingTreatment plant, Pumping station& Reservoirs
3 Indore M.Corp. 1 Improving n.a. 400,000 n.a. 1998 Ongoingexisting system
4 Jaipur M.Corp. 1 Augmentation n.a. 1,250,000 n.a. 1999 Ongoing2 Augmentation n.a. 550,000 n.a. 1999 Ongoing3 Augmentation n.a. 200,000 n.a. 1999 Ongoing
5 Ludhiana M.Corp. 1 Augmentation Pipe lines & 300,000 60.00 1994 1999Tube wells
6 Nagpur M.Corp. 1 Augmentation Pipe lines & n.a. 21.00 1997 OngoingPumping station
2 Augmentation Pipe lines n.a. n.a. 1992 Ongoing3 Augmentation Pipe lines, 600,000 120.00 1999 Ongoing
Treatment plant &Reservoirs
7 Pune M.Corp. 1 Augmentation Pipe lines & 1,300,000 273.00 1993 1998Pumping station2 Augmentation Pipe lines 3,500,000 925.00 1997 Ongoing
8 Visakhapatnam M.Corp. 1 Augmentation Pipe lines, 1,300,000 68.00 1989 1994Treatment plant & Reservoirs
* Per Capita Cost as provided by the respective ULBs/relevant agencies Source: Respective urban local governments/relevant agencies, NIUA Survey, 1999.
Sl. City/Town No. of Purpose Components Designed Designed Year of Year of
No. Schemes population capacity starting completion
(mld)
1 2 3 4 5 6 7 8
A-17 : Capital Works undertaken between 1994 and 1999

7/21/2019 Status Watersupply
http://slidepdf.com/reader/full/status-watersupply 442/869
CLASS I
Andhra Pradesh1 Chittoor M 1 Augmentation n.a. 226,000 9.00 1999 Ongoing
2 Eluru M 1 Augmentation Pipe lines & 247,000 5.00 1999 Ongoing
Reservoirs
3 Guntur MCl 1 Augmentation Pipe lines, 556,820 1.00 1999 OngoingPumping station &
Reservoirs
4 Kakinada M 1 Augmentation Treatment plant 315,000 14.07 1998 Ongoing2 Augmentation Pipe lines, Pumping 315,000 0.05 1998 Ongoing
station & Reservoirs
5 Machilipatnam M 1 Improving Pipe lines & 300,000 33.00 1998 Ongoing
existing system Reservoirs
6 Qutubullapur M 1 Augmentation Pipe lines & 250,000 12.00 1998 1999Reservoirs
2 Augmentation Pipe lines 50,000 9.00 1998 1999
7 Rajahmundry M.Corp. 1 Improving Treatment plant 325,000 11.80 1998 Ongoingexisting system
8 Tenali M 1 Augmentation Pipe lines 10,000 0.50 1995 Ongoing
9 Vijaywada M.Corp. 1 Augmentation Pipe lines, Pumping 100,000 n.a. 1992 1998station & Reservoirs
Gujarat
10 Anand M 1 Augmentation Pipe lines, Tube wells 27,000 30.00 1995 1996
& Reservoirs
11 Bharuch M 1 Augmentation Reserviors 10,000 9.00 1996 1998
2 Augmentation Pumping station 20,000 15.00 1997 1999
12 Nadiad M 1 Augmentation Pipe lines & Tube wells 700,000 n.a. 1994 1996
13 Navsari M 1 Augmentation Pipe lines & Reservoirs 25,000 3.50 1994 1995
14 Porbandar M 1 Augmentation Reserviors 20,000 0.25 1994 1998
15 Surendranagar M 1 Augmentation Pipe line, Treatment 35,000 5.00 1999 Ongoingplant & Reservoirs
4 2 2
Sl. City/Town No. of Purpose Components Designed Designed Year of Year of
No. Schemes population capacity starting completion(mld)
1 2 3 4 5 6 7 8

7/21/2019 Status Watersupply
http://slidepdf.com/reader/full/status-watersupply 443/869
Haryana
16 Ambala MCl 1 Augmentation Pipe lines & 204,060 37.00 1999 OngoingPumping station
17 Gurgaon MCl 1 Augmentation Pipe lines & 193,160 23.40 1994 1999
Pumping station2 Augmentation Pipe lines & 221,940 30.00 1997 Ongoing
Pumping station3 Adding new Pipe lines 221,940 30.00 1997 Ongoing
pipe lines
18 Hissar MCl 1 Augmentation Pipe lines, Pumping 341,000 34.40 1994 Ongoingstation & Reservoirs
19 Karnal MCl 1 Augmentation Pipe lines, Pumping 216,975 39.50 1994 Ongoingstation & Tube wells
20 Rohtak MCl 1 Augmentation Treatment plant & 130,000 13.62 1997 1988Pumping station
2 Augmentation Pipe lines, Pumping 240,000 31.00 1998 Ongoing
station & Reservoirs
Karnataka
21 Tumkur M 1 Augmentation Source development 350,000 30.00 1993 Ongoing
Madhya Pradesh
22 Gwalior M.Corp. 1 Improving n.a. 900,000 136.20 1994 Ongoing
existing system
23 Murwara-Katni M.Corp. 1 Augmentation n.a. 2,200,000 22.00 1991 Ongoing
Maharashtra
24 Amravati M.Corp. 1 Augmentation Pipe lines & Reservoirs 860,000 156.00 1997 Ongoing
25 Ichalkaranji MCl 1 Augmentation Pipe lines & Purchase 850,000 45.00 1996 Ongoing
of machinery
2 Augmentation Pipe lines, Pumping 475,000 54.00 1995 Ongoingstation & Reservoirs
26 Kolhapur M.Corp. 1 Augmentation Pipe lines, Treatment 620,500 119.00 1996 Ongoingplant & Source
development
4 2 3
Sl. City/Town No. of Purpose Components Designed Designed Year of Year of
No. Schemes population capacity starting completion(mld)
1 2 3 4 5 6 7 8

7/21/2019 Status Watersupply
http://slidepdf.com/reader/full/status-watersupply 444/869
27 Nanded Waghala M.Corp. 1 Augmentation Treatment plant & 700,000 60.00 1991 1997
Head work
28 Nashik M.Corp. 1 Augmentation n.a. 1,677,000 312.00 1997 Ongoing
Orissa
29 Bhubaneswar M.Corp. 1 Augmentation Pipe lines & 1,200,000 115.00 1993 1998
Treatment plant
30 Puri M 1 Augmentation Pipe lines 800 0.36 1998 1998
2 Augmentation Pipe lines & Pumping 125,199 5.50 1996 1996station
Punjab
31 Bathinda MCl 1 Augmentation Installation of n.a. 16.70 1994 1999tube-wells
32 Jalandhar M. Corp. 1 Augmentation Pipe lines & Tube 100,000 20.00 1998 1999wells
33 Moga MCl 1 Augmentation Pipe lines n.a. n.a. 1994 1998
34 Patiala M.Corp. 1 Augmentation Pipe lines & 642,000 116.00 1994 1999Tube wells
Rajasthan
35 Bhilwara M 1 Augmentation Source development 337,000 40.00 1996 2000
36 Bikaner M 1 Augmentation n.a. 513,000 18.77 1995 1999
37 Jodhpur M.Corp. 1 Improving n.a. 900,000 60.00 1994 Ongoing
existing system2 Improving n.a. 900,000 n.a. 1994 Ongoing
existing system3 Improving n.a. 900,000 25.00 1999 Ongoing
existing system
38 Sriganganagar M 1 Improving Treatment plant, 16,100,000 23.00 1996 Ongoingexisting system Pumping station &
Reservoirs
Tamil Nadu
39 Kanchipuram M 1 Augmentation Pipe lines, 308,600 21.50 1994 1997Reservoires &
Infiltration Wells
4 2 4
Sl. City/Town No. of Purpose Components Designed Designed Year of Year of
No. Schemes population capacity starting completion(mld)
1 2 3 4 5 6 7 8

7/21/2019 Status Watersupply
http://slidepdf.com/reader/full/status-watersupply 445/869
Uttar Pradesh
40 Bareilly M.Corp. 1 Augmentation Installation of 150,000 35.00 1696 1998tube-wells
41 Haldwani-cum- 1 Augmentation Installation of 19,200 2.40 1995 1998Kathgodam MB tube-wells
2 Augmentation Installation of 24,700 3.00 1997 1999
Tube wells3 Augmentation Tube wells 60,000 7.50 1998 Ongoing
West Bengal
42 Bankura M 1 Augmentation Pipe lines, Pumping 134,000 16.00 n.a. Ongoing
station, Tube wells& Reservoirs
43 Barasat M 1 Augmentation Pumping station, n.a. n.a. 1995 1999Tube wells & Machinery
2 Augmentation Pipe lines n.a. n.a. 1995 1999
44 Siliguri M.Corp. 1 Augmentation Pipe lines, Treatment 366,939 55.02 1994 1999
plant & Reservoirs
Small States
Assam
45 Guwahati M.Corp. 1 Augmentation Pipe lines, Pumping 36,000 n.a. 1995 n.a.
station, Tube wells &reservoirs
Manipur
46 Imphal MCl 1 Augmentation Pumping station & 41,510 6.81 1994 Ongoing
reservoirs
2 Augmentation Treatment plant & 50,000 7.50 1994 OngoingReservoirs
3 Augmentation Treatment plant 238,000 9.08 1999 Ongoing
Meghalaya
47 Shillong MB 1 Augmentation Pipe lines, Pumping 300,000 51.30 n.a. Ongoing
station, & Reservoirs
* Per Capita Cost as provided by the respective ULBs/relevant agencies
Source: Respective urban local governments/relevant agencies, NIUA Survey, 1999.
4 2 5
Sl. City/Town No. of Purpose Components Designed Designed Year of Year of
No. Schemes population capacity starting completion(mld)
1 2 3 4 5 6 7 8

7/21/2019 Status Watersupply
http://slidepdf.com/reader/full/status-watersupply 446/869
CLASS II
Andhra Pradesh1 Kapra M 1 Augmentation Pipe lines & 155,000 6.50 1998 Ongoing
Reservoirs
2 Narasaraopet M 1 Augmentation Pipe lines & 125,000 7.00 1995 2000Reservoirs
Gujarat
3 Dabhoi M 1 Improving Installation of tube- 70,000 0.90 1997 1999existing system wells & Reservoir
development
4 Dohad M 1 Augmentation Reserviors 78,000 6.80 1989 n.a.
Haryana
5 Jind MCl 1 Improving Pipe lines & Pumping 20,000 0.36 1997 Ongoing
existing system station
6 Thanesar MCl 1 Improving Reserviors & Purchase 56,475 6.41 1995 Ongoing
existing system of machinery
Karnataka
7 Gokak CMC 1 Augmentation Source development 102,900 13.00 1998 Ongoing
Kerala
8 Payyanur M 1 Augmentation Installation of tube- 1,000 0.06 1997 1998
wells & Reservoir
Madhya Pradesh
9 Nagda M 1 Augmentation n.a. 132,000 16.00 1995 1999
Maharashtra
10 Bhandara M 1 Augmentation Pipe lines & Reservoirs 11,000 1.50 1998 Ongoing
11 Ratnagiri MCl 1 Augmentation Pumping station & 80,000 12.00 1988 Ongoing
Source development
12 Satara MCl 1 Augmentation Pipe lines 110,000 9.00 1998 Ongoing
4 2 6
Sl. City/Town No. of Purpose Components Designed Designed Year of Year of
No. Schemes population capacity starting completion(mld)
1 2 3 4 5 6 7 8

7/21/2019 Status Watersupply
http://slidepdf.com/reader/full/status-watersupply 447/869
Punjab
13 Ferozepur MCl 1 Augmentation Pipe lines & Tube wells n.a. n.a. 1994 199714 Sangrur MCl 1 Augmentation Pipe lines n.a. n.a. 1994 1996
Rajasthan
15 Barmer M 1 Augmentation Source development 79,000 8.14 1995 1998
16 Bundi M 1 Improving n.a. 120,000 12.00 1997 Ongoing
existing system
17 Churu M 1 Augmentation n.a. 82,852 16.00 1995 1999
18 Sawai Madhopur M 1 n.a. n.a. 1,373,845 13.74 1998 Ongoing
Uttar Pradesh
19 Lalitpur MB 1 Augmentation n.a. 11,000 0.64 1994 Ongoing
West Bengal
20 Jalpaiguri M 1 Augmentation Pipe lines, Treatment n.a. n.a. 1994 Ongoing
plant & Pumping station
21 Jangipur M 1 Improving Treatment plant 66,000 6.60 1984 Ongoingexisting system
Union Teritories
22 Port Blair MCl 1 Augmentation n.a. 169,943 20.00 1997 Ongoing
Others (Smaller than Class II towns)
Union Territories
22 Silvassa 1 Augmentation Intake well, sump, 40,000 1.70 1988 Ongoingfilteration plant,
overhead tank* Per Capita Cost as provided by the respective ULBs/relevant agencies Source: Respective urban local governments/relevant agencies, NIUA Survey, 1999.
4 2 7
Sl. City/Town No. of Purpose Components Designed Designed Year of Year of
No. Schemes population capacity starting completion(mld)
1 2 3 4 5 6 7 8

7/21/2019 Status Watersupply
http://slidepdf.com/reader/full/status-watersupply 448/869

7/21/2019 Status Watersupply
http://slidepdf.com/reader/full/status-watersupply 449/869
A -1 8
C A P I T A L W OR K S T OB E U NDE R T A K
E NI N
F U
T UR E

7/21/2019 Status Watersupply
http://slidepdf.com/reader/full/status-watersupply 450/869

7/21/2019 Status Watersupply
http://slidepdf.com/reader/full/status-watersupply 451/869
METROPOLITAN CITIES
1 Bhopal M.Corp. Y n.a. n.a. n.a. n.a. 355.00 n.a. n.a.
2 Coimbatore M.Corp. Y 1 Augmentation Reservoirs n.a. n.a. n.a. n.a.
3 Greater Bombay Y 1 Augmentation Pipe lines, 9,926,000 450.00 2000 2009
M.Corp. Treatment plant,Pumping station,
Reservoirs & Tunnel
2 Augmentation Pipe lines, Treatment 11,837,000 450.00 n.a. n.a.plant, Reservoirs,
Tunnel & Landacquisition
4 Indore M.Corp. Y 1 Augmentation n.a. 4,100,000 920.00 n.a. n.a.
5 Ludhiana M.Corp. Y 1 Augmentation Pipe lines, Tube 500,000 63.00 2000 2001
wells & Reservoirs
6 Nagpur M.Corp. Y 1 Augmentation Pipe lines, Treatment 3,500,000 213.00 n.a. n.a.
plant & Reservoirs
2 Augmentation 4,500,000 350.00 n.a. n.a.
7 Pune M.Corp. Y 1 Augmentation Pipe lines, Treatment 3,500,000 990.00 1999 2003plant & Reservoirs
8 Visakhapatnam M.Corp. Y 1 Augmentation Pipe lines & 1,400,000 68.00 2000 2005
Treatment plant
* Per Capita Cost as provided by the respective ULBs/relevant agencies
Source: Respective urban local governments/relevant agencies, NIUA Survey,1999.
4 3 1
Sl. City/Town Future No. of Purpose Components Designed Designed Year of Year of
No. Scheme Schemes population capacity starting completion
(mld)
1 2 3 4 5 6 7 8 9
A-18 : Capital Works to be undertaken in Future

7/21/2019 Status Watersupply
http://slidepdf.com/reader/full/status-watersupply 452/869
CLASS I
Andhra Pradesh1 Eluru M Y 1 Augmentation Pumping station & 80,000 1368.00 2000 2002
Reservoirs
2 Hindupur M Y 1 Augmentation Pipe lines 200,000 n.a. n.a. n.a.
3 Vijaywada M.Corp. Y 1 Augmentation Treatment plant & 20,000 36.32 2000 2001Pumping station
2 Improving Reservoirs 10,000 n.a. 2000 2001
existing system
3 Augmentation Pumping station & 25,000 45.40 2000 2003
Reservoirs
4 Augmentation Pipe lines 30,000 n.a. n.a. n.a.
Gujarat
4 Bharuch M Y 1 Augmentation Reserviors 210,000 23.00 n.a. n.a.
5 Bhuj M Y 1 Augmentation Pipe lines, Tube 118,000 5.00 2001 2004wells & Reservoirs
6 Porbandar M Y 1 Augmentation Pipe lines & 135,000 2.00 2000 2002
Reservoirs
Karnataka
7 Mangalore M.Corp. Y 1 Augmentation n.a. 804,000 190.00 2001 2005
8 Tumkur M Y 1 Augmentation Treatment plant 350,000 15.00 2006 n.a.
Madhya Pradesh
9 Guna M Y 1 Adding new n.a. 166,500 24.98 2004 n.a.
pipe lines
10 Rewa M.Corp. Y 1 Augmentation n.a. 60,000 4.50 2000 2005
11 Shivpuri M Y 1 Augmentation Source development 200,000 35.00 2005 n.a.
4 3 2
Sl. City/Town Future No. of Purpose Components Designed Designed Year of Year of
No. Scheme Schemes population capacity starting completion(mld)
1 2 3 4 5 6 7 8 9

7/21/2019 Status Watersupply
http://slidepdf.com/reader/full/status-watersupply 453/869
Maharashtra
12 Aurangabad M.Corp. Y 1 Augmentation Pipe lines, 1,630,000 208.00 1999 2001Treatment plant & Pumping station
13 Bhusawal M.Cl. Y 1 Augmentation Pipe lines, Treatment 24,100 15.00 2000 2002
plant & Pumping station
14 Kolhapur M.Corp. Y 1 Augmentation Pipe lines & 620,500 133.00 2000 2001
Treatment plant
2 Augmentation Pipe lines 735,000 190.00 2001 2005
15 Ichalkaranji MCl Y 1 Improving Pipe lines 475,000 54.00 n.a. n.a.existing system
16 Nanded Waghala Y 1 Augmentation Pipe lines, Pumping 800,000 120.00 1999 2001
M.Corp. station & Reservoirs
2 Augmentation Treatment plant, 104,000 13.20 1999 2001
Pumping station &
Reservoirs
17 Parbhani MCl Y 1 Augmentation Pipe lines, Treatment 720,000 115.00 1999 2002
plant & Pumping
station
18 Yavatmal MCl Y 1 Augmentation Source development 314,000 26.00 1999 2001
Orissa
19 Puri M Y 1 Augmentation Pipe lines & Tube wells 12,715 1.90 2000 2001
2 Augmentation Pipe lines 480 0.22 1999 1999
Punjab
20 Bathinda MCl Y 1 Augmentation Pipe lines & Reservoirs n.a. 36.32 2001 2006
21 Moga MCl Y 1 Augmentation Tube wells n.a. 0.90 1999 2000
22 Patiala M.Corp. Y 1 Augmentation Pipe lines & Tube wells 642,000 116.00 1999 2000
Rajasthan
23 Bikaner M Y 1 Augmentation n.a. 883,000 60.00 2000 2003
4 3 3
Sl. City/Town Future No. of Purpose Components Designed Designed Year of Year of
No. Scheme Schemes population capacity starting completion(mld)
1 2 3 4 5 6 7 8 9
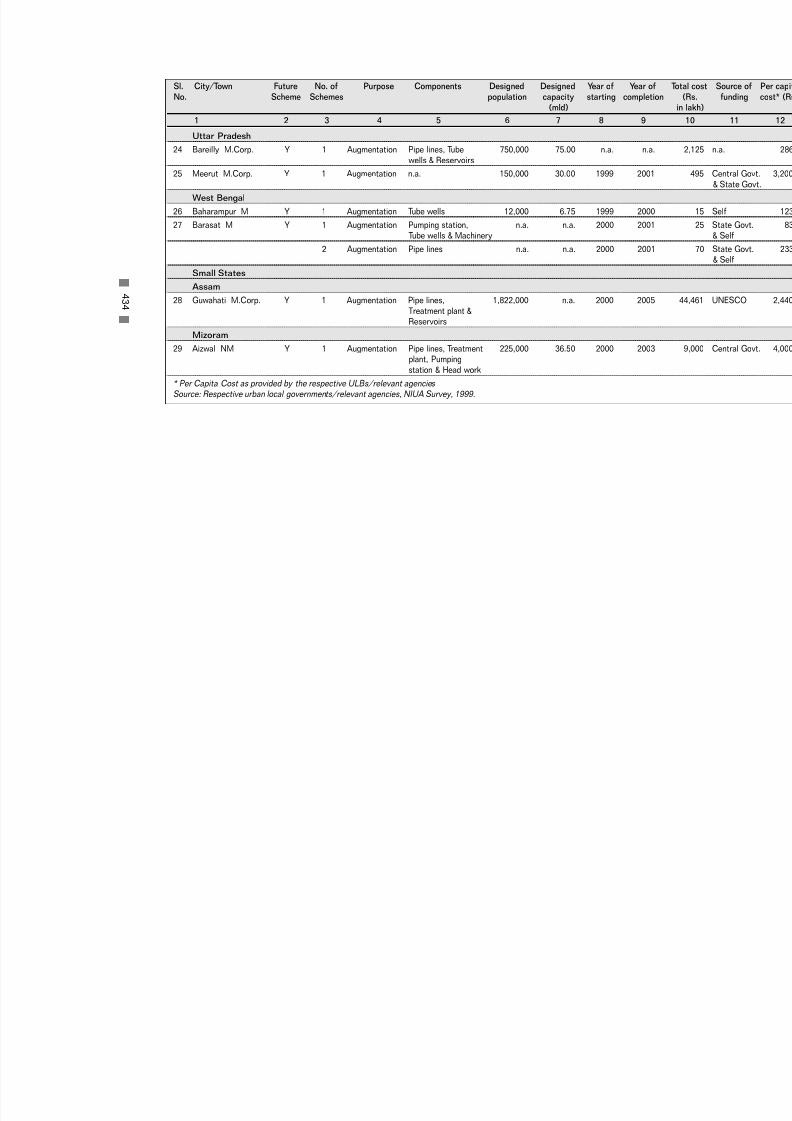
7/21/2019 Status Watersupply
http://slidepdf.com/reader/full/status-watersupply 454/869
Uttar Pradesh
24 Bareilly M.Corp. Y 1 Augmentation Pipe lines, Tube 750,000 75.00 n.a. n.a.wells & Reservoirs
25 Meerut M.Corp. Y 1 Augmentation n.a. 150,000 30.00 1999 2001
West Bengal
26 Baharampur M Y 1 Augmentation Tube wells 12,000 6.75 1999 2000
27 Barasat M Y 1 Augmentation Pumping station, n.a. n.a. 2000 2001Tube wells & Machinery
2 Augmentation Pipe lines n.a. n.a. 2000 2001
Small States
Assam
28 Guwahati M.Corp. Y 1 Augmentation Pipe lines, 1,822,000 n.a. 2000 2005Treatment plant &Reservoirs
Mizoram
29 Aizwal NM Y 1 Augmentation Pipe lines, Treatment 225,000 36.50 2000 2003plant, Pumping
station & Head work
* Per Capita Cost as provided by the respective ULBs/relevant agencies Source: Respective urban local governments/relevant agencies, NIUA Survey, 1999.
4 3 4
Sl. City/Town Future No. of Purpose Components Designed Designed Year of Year of
No. Scheme Schemes population capacity starting completio(mld)
1 2 3 4 5 6 7 8 9
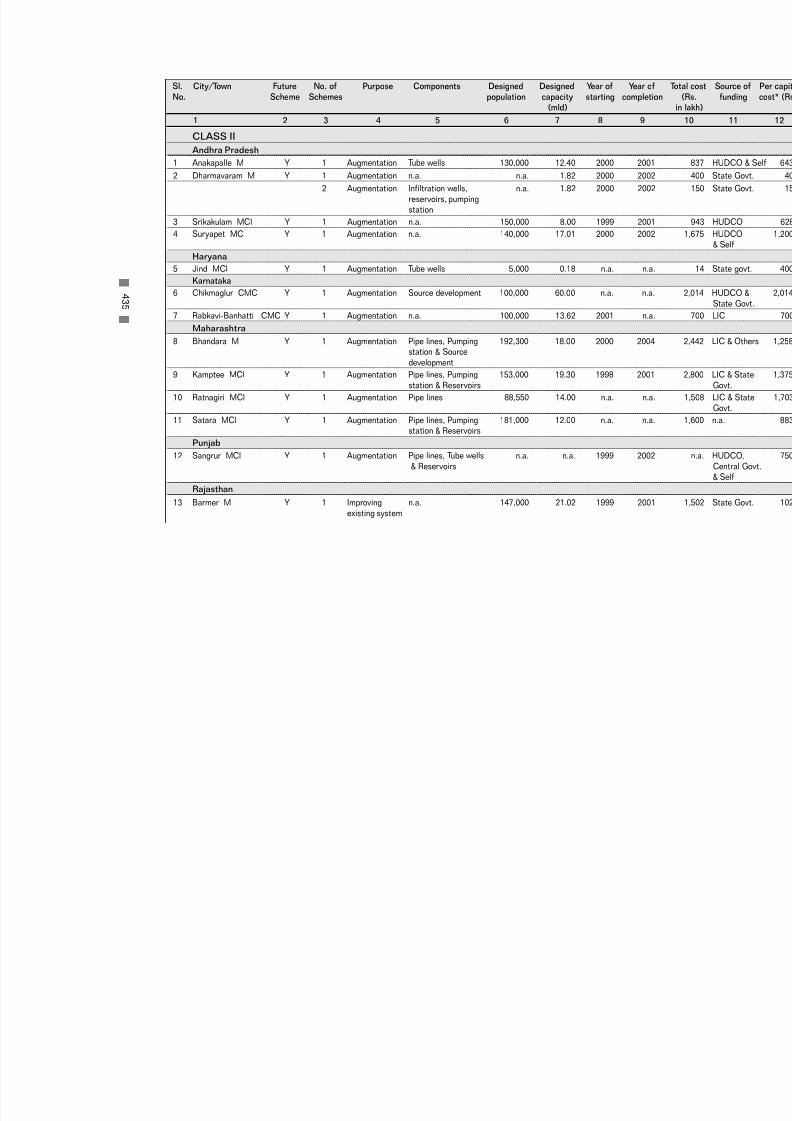
7/21/2019 Status Watersupply
http://slidepdf.com/reader/full/status-watersupply 455/869
CLASS II
Andhra Pradesh1 Anakapalle M Y 1 Augmentation Tube wells 130,000 12.40 2000 2001
2 Dharmavaram M Y 1 Augmentation n.a. n.a. 1.82 2000 2002
2 Augmentation Infiltration wells, n.a. 1.82 2000 2002
reservoirs, pumpingstation
3 Srikakulam MCl Y 1 Augmentation n.a. 150,000 8.00 1999 2001
4 Suryapet MCl Y 1 Augmentation n.a. 140,000 17.01 2000 2002
Haryana
5 Jind MCl Y 1 Augmentation Tube wells 5,000 0.18 n.a. n.a.
Karnataka
6 Chikmaglur CMC Y 1 Augmentation Source development 100,000 60.00 n.a. n.a.
7 Rabkavi-Banhatti CMC Y 1 Augmentation n.a. 100,000 13.62 2001 n.a.
Maharashtra
8 Bhandara M Y 1 Augmentation Pipe lines, Pumping 192,300 18.00 2000 2004station & Source
development
9 Kamptee MCl Y 1 Augmentation Pipe lines, Pumping 153,000 19.30 1998 2001
station & Reservoirs
10 Ratnagiri MCl Y 1 Augmentation Pipe lines 88,550 14.00 n.a. n.a.
11 Satara MCl Y 1 Augmentation Pipe lines, Pumping 181,000 12.00 n.a. n.a.station & Reservoirs
Punjab
12 Sangrur MCl Y 1 Augmentation Pipe lines, Tube wells n.a. n.a. 1999 2002
& Reservoirs
Rajasthan
13 Barmer M Y 1 Improving n.a. 147,000 21.02 1999 2001
existing system
4 3 5
Sl. City/Town Future No. of Purpose Components Designed Designed Year of Year of
No. Scheme Schemes population capacity starting completion(mld)
1 2 3 4 5 6 7 8 9

7/21/2019 Status Watersupply
http://slidepdf.com/reader/full/status-watersupply 456/869
Uttar Pradesh
14 Chandpur MB Y 1 Augmentation n.a. 60,000 3.60 n.a. n.a.15 Lalitpur MB Y 1 Augmentation n.a. 17,300 1.05 2000 2002
West Bengal
16 Bishnupur M Y 1 Augmentation Pumping station, 42,490 67.40 2000 2005
Tube wells &
Reservoirs
17 Chakdaha M Y 1 Improving Pumping station & 50,000 6.25 2003 2006
existing Reservoirs
system
* Per Capita Cost as provided by the respective ULBs / relevant agencies
Source: Respective urban local governments/relevant agencies, NIUA Survey,1999.
4 3 6
Sl. City/Town Future No. of Purpose Components Designed Designed Year of Year of
No. Scheme Schemes population capacity starting completio
(mld)
1 2 3 4 5 6 7 8 9

7/21/2019 Status Watersupply
http://slidepdf.com/reader/full/status-watersupply 457/869
WA T E R T
A R I F F S A ND
C O N NE C T
I O N C HA R GE S
1 9 9 9

7/21/2019 Status Watersupply
http://slidepdf.com/reader/full/status-watersupply 458/869

7/21/2019 Status Watersupply
http://slidepdf.com/reader/full/status-watersupply 459/869
WA T
E R T A R I F F A ND C O N NE C T I O N C
HA R GE S
A NDHR
A P R A DE S H

7/21/2019 Status Watersupply
http://slidepdf.com/reader/full/status-watersupply 460/869
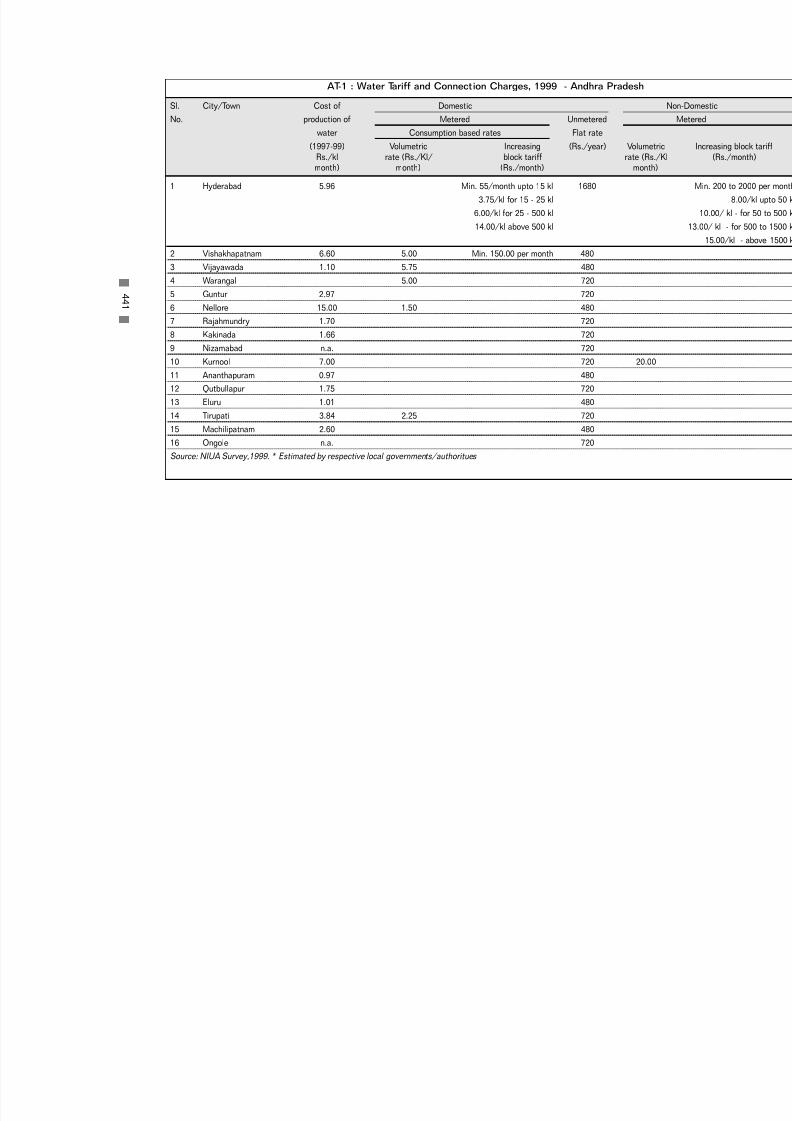
7/21/2019 Status Watersupply
http://slidepdf.com/reader/full/status-watersupply 461/869
1 Hyderabad 5.96 Min. 55/month upto 15 kl 1680
3.75/kl for 15 - 25 kl
6.00/kl for 25 - 500 kl
14.00/kl above 500 kl
2 Vishakhapatnam 6.60 5.00 Min. 150.00 per month 480
3 Vijayawada 1.10 5.75 480
4 Warangal 5.00 720
5 Guntur 2.97 720
6 Nellore 15.00 1.50 480
7 Rajahmundry 1.70 720
8 Kakinada 1.66 720
9 Nizamabad n.a. 720
10 Kurnool 7.00 720 20.00
11 Ananthapuram 0.97 480
12 Qutbullapur 1.75 720
13 Eluru 1.01 480
14 Tirupati 3.84 2.25 720
15 Machilipatnam 2.60 480
16 Ongole n.a. 720
Source: NIUA Survey,1999. * Estimated by respective local governments/authoritues
4
4 1
AT-1 : Water Tariff and Connection Charges, 1999 - Andhra Pradesh
Sl. City/Town Cost of Domestic
No. production of Metered Unmetered
water Consumption based rates Flat rate
(1997-99) Volumetric Increasing (Rs./year) VolumetriRs./kl rate (Rs./Kl/ block tariff rate (Rs./month) month) (Rs./month) month)

7/21/2019 Status Watersupply
http://slidepdf.com/reader/full/status-watersupply 462/869
1 Hyderabad
2 Vishakhapatnam 12.00 (treated) Min. 12000 10.00 Min. 12
5.00 (untreated)
3 Vijayawada - 10.50
4 Warangal 10.00 10.00
5 Guntur n.a. n.a.
6 Nellore 10.00 10.00
7 Rajahmundry n.a. n.a.
8 Kakinada 12.50 12.50
9 Nizamabad n.a. 1/2" 1524
3/4" 84201" 6084
2" 21420
10 Kurnool
11 Ananthapuram 10.00 10.00
12 Qutbullapur 10.00 4.00
13 Eluru - 10.00
14 Tirupati 15.00 15.00
15 Machilipatnam - 10.00
16 Ongole 15.00 15.00
Source: NIUA Survey,1999.
4
4 2
Sl. City/Town Industrial Commercial
No. Metered Unmetered Metered Unmetered Mete
Volumetric rate Flat rate Volumetric Ferrule based rates Others Volume
(Rs./Kl/month) (Rs./year) rate (Rs./Kl/ Ferrule size Rs./year Flat r
month) (Rs./y
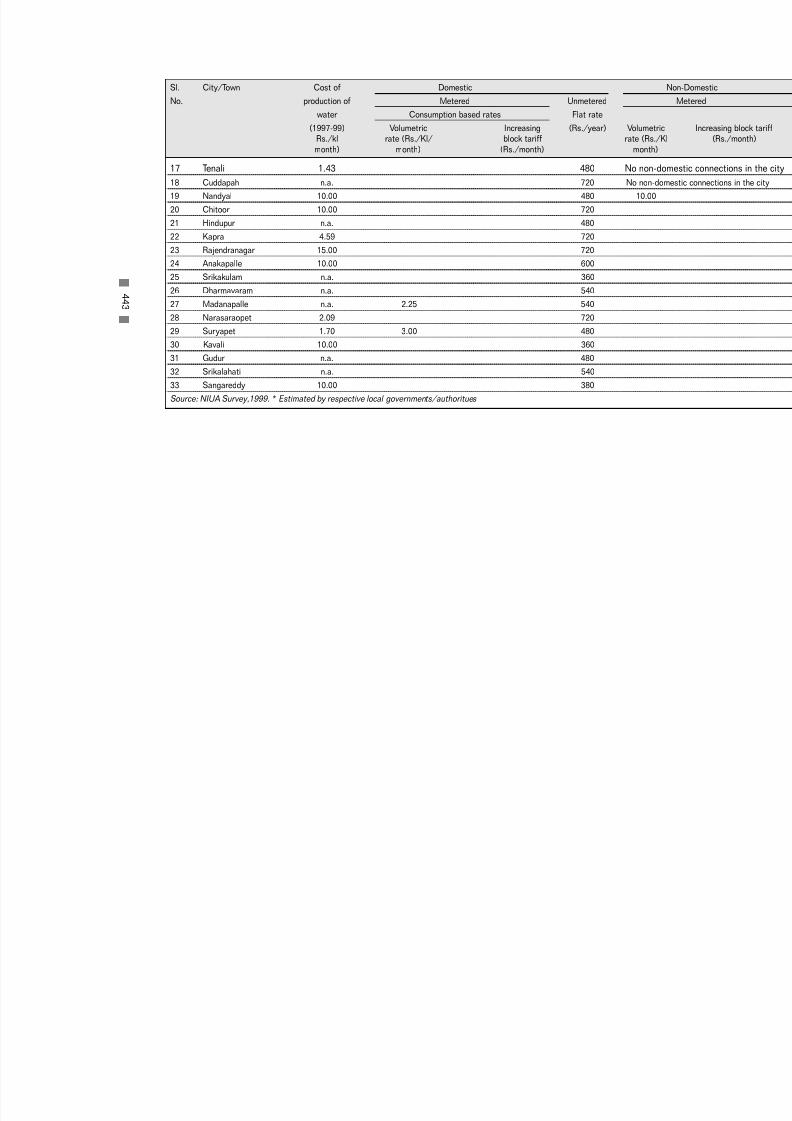
7/21/2019 Status Watersupply
http://slidepdf.com/reader/full/status-watersupply 463/869
4
4 3
17 Tenali 1.43 480 No non-d
18 Cuddapah n.a. 720 No non-do
19 Nandyal 10.00 480 10.00
20 Chitoor 10.00 720
21 Hindupur n.a. 480
22 Kapra 4.59 720
23 Rajendranagar 15.00 720
24 Anakapalle 10.00 600
25 Srikakulam n.a. 360
26 Dharmavaram n.a. 540
27 Madanapalle n.a. 2.25 540
28 Narasaraopet 2.09 720
29 Suryapet 1.70 3.00 480
30 Kavali 10.00 360
31 Gudur n.a. 480
32 Srikalahati n.a. 540
33 Sangareddy 10.00 380
Source: NIUA Survey,1999. * Estimated by respective local governments/authoritues
Sl. City/Town Cost of Domestic
No. production of Metered Unmetered
water Consumption based rates Flat rate
(1997-99) Volumetric Increasing (Rs./year) VolumetriRs./kl rate (Rs./Kl/ block tariff rate (Rs./
month) month) (Rs./month) month)

7/21/2019 Status Watersupply
http://slidepdf.com/reader/full/status-watersupply 464/869
17 Tenali
18 Cuddapah
19 Nandyal
20 Chitoor - 15.00
21 Hindupur 2.20
22 Kapra - -
23 Rajendranagar - 144
24 Anakapalle 15.00 15.00
25 Srikakulam - 10.00
26 Dharmavaram - 780
27 Madanapalle 12.00 12.00
28 Narasaraopet - 1.50
29 Suryapet 10.00 10.00
30 Kavali - -
31 Gudur - n.a.
32 Srikalahati - n.a.
33 Sangareddy - n.a.
Source: NIUA Survey,1999.
4
4 4
Sl. City/Town Cost of Domestic
No. production of Metered Unmetered
water Consumption based rates Flat rate
(1997-99) Volumetric Increasing (Rs./year) VolumetriRs./kl rate (Rs./Kl/ block tariff rate (Rs./
month) month) (Rs./month) month)

7/21/2019 Status Watersupply
http://slidepdf.com/reader/full/status-watersupply 465/869
WA T
E R T A R I F F A ND C O N NE C T I O N C
HA R GE S
G U
J A R A T

7/21/2019 Status Watersupply
http://slidepdf.com/reader/full/status-watersupply 466/869

7/21/2019 Status Watersupply
http://slidepdf.com/reader/full/status-watersupply 467/869
4
4 7
1 Ahmedabad 2.00 - 3.15 3.00
2 Surat 2.11 2.00 - inside 8.00 - insid
city limits Within city limits city limits
1/2" 120 28.00 - outs
city limits
12.00 - outside 3/4" 252
city limits 1" 648
1 1/2" 1296
Outside city limits
1/2" 1440
3/4" 3360
1" 6720
1 1/2" 14400
3 Vadodara 3.40 1.50 Minimum charges 10.80
1/2" 180
3/4" 720
1" 1440
1 1/2" 3000
4 Rajkot 3.30 - 240 480
5 Bhavnagar 7.00 n.a. 300 9.00
6 Jamnagar n.a. 240 600 25.00
7 Nadiad n.a. 1/2" 170
3/4" 600
1" 1000
8 Surendranagar n.a. 1/2" 60
3/4" 150
Sl. City/Town Cost of Domestic Non-Domestic
No. production of Metered Unmetered (Flat rate) Unmetered
water Volumetric Ferrule based rates Others (flat rate) Metered
(1998-99)* rate (Rs./Kl/ Ferrule Rs./year Flat Rate Others Volumetr
Rs./kl month) size (Rs./year) (Rs./year) Ferrule
rate (Rs./ Kl/month
AT-2 : Water Tariff and Connection Charges, 1999 - Gujarat

7/21/2019 Status Watersupply
http://slidepdf.com/reader/full/status-watersupply 468/869
1 Ahmedabad 8.00 - 20.00 25-30% of NRV or Min. 720
2 Surat 8.00 - insidecity limits
28.00 - outside
city limits
3 Vadodara 5.40 Minimum charges 3.60 Minimum cha
1/2" 1680 1/2"
3/4" 3684 3/4"
1" 6702 1"
1 1/2" 15084 1 1/2"
4 Rajkot
5 Bhavnagar 9.00 1200 n.a.
6 Jamnagar 25.00
7 Nadiad 1/2" 800
3/4" 1000
1" 1600
8 Surendranagar 1/2" 300
3/4" 600
1" 1200
1 1/4" 1800
1 1/2" 2400
2" 4800
3" 72009 Anand 1/2" 200
3/4" 400
10 Junagadh 240
11 Bharuch 384
4
4 8
Sl. City/Town Commercial Ins
No. Metered Unmetered (flat rate) Metered
Volumetric rate Ferrule based rates Others Volumetric rate Ferru
(Rs./Kl/month) Furrule size Rs./year Flat rate (Rs./Kl/month) Ferrule s
(Rs./year)

7/21/2019 Status Watersupply
http://slidepdf.com/reader/full/status-watersupply 469/869
1 Hyderabad 900 to 16000 for 5.00 per litre of 1.75 per litre of
1/2" dia depending upon agreed quantity agreed quantity
plot size of water of water11000 to 26000 for 3/4" dia
depending upon plot size
33000 to 40000 for 1" diadepending upon plot size
2 Vishakhapatnam 4000 n.a. 15000 15000 30000
(Semi-bulk)
3 Vijayawada 4000 - ordinary - 10000 - ordinary7000 - urgent - 17000 - urgent
4 Warangal 6000 n.a. n.a. n.a.
5 Guntur 7000 - ordinary 15000 - 26000 - ordinary10500 - urgent 26000 - 63000 - urgent
6 Nellore n.a. n.a. n.a. n.a.
7 Rajahmundry 6000 16000
8 Kakinada 4000 - ordinary 20000 - ordinary 10000 - ordinary7000 - urgent 200000 - urgent 24000 - urgent
9 Nizamabad n.a. n.a. n.a. n.a.
10 Kurnool 6000 20000 20000 20000
11 Ananthapuram 6000 15000 15000 15000
12 Qutbullapur 900 to 16000 for 1/2" dia 5.00 per litre of 1.75 per litre of
depending upon plot size agreed quantity agreed quantity
of water of water
11000 to 26000 for 3/4" dia
depending upon plot size
33000 to 40000 for 1" dia
depending upon plot size
13 Eluru 4000 - 10000 -
14 Tirupati 600 for metered - 5400 54004800 for unmetered
4
4 9
Sl. No. City/Town One time water connection charges (in Rs.)
Domestic Industrial Commercial Institutional Others
(specify)

7/21/2019 Status Watersupply
http://slidepdf.com/reader/full/status-watersupply 470/869
1 Ahmedabad Varies from 100 to 20000 for various sizes 1997
of pipe lines + road cutting charges
No
2 Surat n.a n.a n.a n.a 1999
3 Vadodara n.a. n.a. n.a. n.a. 1999
4 Rajkot 200 1000 1000 1000 1989
5 Bhavnagar 340 340 340 340 1994
6 Jamnagar 500-1000 1500 1500 1500 1995
7 Nadiad 600 for 1/2" dia, 700 for 3/4" dia, and 800 for 1" dia 1989
8 Surendranagar 450 - 650 - 1976
9 Anand 204 for 1/2" 960 for 1/2" 1992
720 for 3/4" 2160 for 3/4"
10 Junagadh 360 720 720 1987
11 Bharuch 677 1397 1992
12 Porbander 100 100 100 100 1998
13 Navsari 500 to 1000 n.a. 1997
14 Mehsana 360 720 720 1999
4
5 0
Sl. City/Town One time water connection charges (in Rs.)
No. Domestic Industrial Commercial Institutional Year of last
revision

7/21/2019 Status Watersupply
http://slidepdf.com/reader/full/status-watersupply 471/869
1" 300
1 1/4" 450
1 1/2" 600
2" 1200
3" 1800
9 Anand n.a. 1/2" 60
3/4" 90
10 Junagadh n.a. 120
11 Bharuch 7.60 5.00 1/2" 144
3/4" 216
1" 57612 Porbander 2.50 1/2" 180
3/4" 600
1" 1800
1 1/2" 3600
2" 4800
Outside municipal limits the
charges are 1.5 times the above
13 Navsari n.a. 1/2" 90 90 to 270based on
ARV
3/4" 135
1" 180
14 Mehsana n.a. 120
15 Jetpur n.a. 1/2" 240
3/4" ]480
* Estimated by respective local governments/authorities
4
5 1
Sl. City/Town Cost of Domestic Non-Domestic
No. production of Metered Unmetered (Flat rate) Unmetered
water Volumetric Ferrule based rates Others (flat rate) Metered
(1998-99)* rate (Rs./Kl/ Ferrule Rs./year Flat Rate Others Volumetr
Rs./kl month) size (Rs./year) (Rs./year) Ferrule
rate (Rs./ Kl/month

7/21/2019 Status Watersupply
http://slidepdf.com/reader/full/status-watersupply 472/869
16 Bhuj n.a. 15 mm 360
20 mm 720
17 Palanpur n.a. 1/2" 120
3/4" 360
1" 720
18 Gondal n.a. 1/2" 120
1" 180
19 Amreli n.a. 120
20 Dahod 3.50 1/2" 144
3/4" 180
1" 240
21 Dabhoi n.a. 120
22 Ankleswar 6.00 200
Source: NIUA Survey,1999. * Estimated by respective local governments/authorities
4
5 2
Sl. City/Town Cost of Domestic Non-Domestic
No. production of Metered Unmetered (Flat rate) Unmetered
water Volumetric Ferrule based rates Others (flat rate) Metered
(1998-99)* rate (Rs./Kl/ Ferrule Rs./year Flat Rate Others Volumetr
Rs./kl month) size (Rs./year) (Rs./year) Ferrule
rate (Rs./ Kl/month
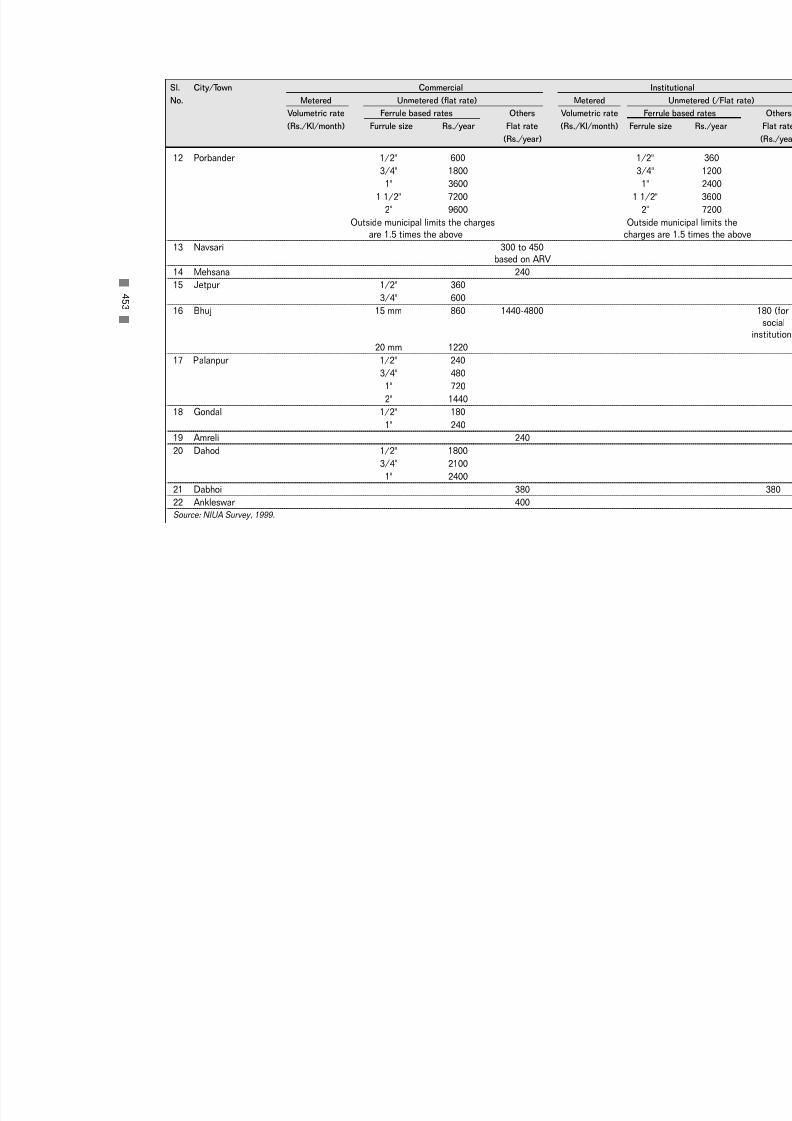
7/21/2019 Status Watersupply
http://slidepdf.com/reader/full/status-watersupply 473/869
12 Porbander 1/2" 600 1/2"
3/4" 1800 3/4"
1" 3600 1"
1 1/2" 7200 1 1/2"
2" 9600 2"
Outside municipal limits the charges Outside
are 1.5 times the above charges a
13 Navsari 300 to 450
based on ARV
14 Mehsana 240
15 Jetpur 1/2" 360
3/4" 60016 Bhuj 15 mm 860 1440-4800
20 mm 1220
17 Palanpur 1/2" 240
3/4" 480
1" 720
2" 1440
18 Gondal 1/2" 180
1" 240
19 Amreli 240
20 Dahod 1/2" 18003/4" 2100
1" 2400
21 Dabhoi 380
22 Ankleswar 400
Source: NIUA Survey, 1999.
4
5 3
Sl. City/Town Commercial Ins
No. Metered Unmetered (flat rate) Metered
Volumetric rate Ferrule based rates Others Volumetric rate Ferru
(Rs./Kl/month) Furrule size Rs./year Flat rate (Rs./Kl/month) Ferrule s
(Rs./year)

7/21/2019 Status Watersupply
http://slidepdf.com/reader/full/status-watersupply 474/869
15 Machilipatnam 6000 - 10000 -
16 Ongole 6000 10000 n.a.
17 Tenali 6000 - - -
18 Cuddapah 6000 - ordinary - - -12000 - urgent
19 Nandyal 4000 - ordinary 8000 - ordinary 8000 - ordinary
7000 - urgent 16000 - urgent 16000 - urgent
20 Chitoor 6000 - ordinary - - -
21 Hindupur 4000 - 7000 -
22 Kapra - - - -
23 Rajendranagar 4500 - 4500 -
24 Anakapalle 6000 - 10500 -
25 Srikakulam 6000 - - -
26 Dharmavaram 4500 - - -27 Madanapalle - - - -
28 Narasaraopet 6000 - ordinary - 17500 -12000 - urgent
29 Suryapet 4500 18000 - 135000 9000 to 22500
30 Kavali 4500 - - -
31 Gudur 4000 - 10000 -
32 Srikalahati 4500 - 7875 -
33 Sangareddy 2200 - 4200 -
Source: NIUA Survey, 1999.
4
5 4
Sl. No. City/Town One time water connection charges (in Rs.)
Domestic Industrial Commercial Institutional Others
(specify)

7/21/2019 Status Watersupply
http://slidepdf.com/reader/full/status-watersupply 475/869
15 Jetpur 150 1000 500 1998
16 Bhuj
17 Palanpur 25 to 400 for different sizes of connections 1985
18 Gondal 1000 1500 1500 1997
19 Amreli 360 720 720 1986
20 Dahod 1000 - 2700 1989
21 Dabhoi n.a. n.a. n.a. n.a. 1989
22 Ankleswar 800 - 1000 1999
Source: Respective urban local governments/relevant agencies, NIUA Survey, 1999
4
5 5
Sl. City/Town One time water connection charges (in Rs.)
No. Domestic Industrial Commercial Institutional Year of last
revision

7/21/2019 Status Watersupply
http://slidepdf.com/reader/full/status-watersupply 476/869

7/21/2019 Status Watersupply
http://slidepdf.com/reader/full/status-watersupply 477/869
WA T
E R T A R I F F A ND C O N NE C T I O N C
HA R GE S
HA
R Y A NA

7/21/2019 Status Watersupply
http://slidepdf.com/reader/full/status-watersupply 478/869

7/21/2019 Status Watersupply
http://slidepdf.com/reader/full/status-watersupply 479/869
1 Faridabad n.a. 1.00 10 mm (with one tap) 25
10 mm (with more 40
than one tap)
12 mm 100
15 mm 125
20 mm 150
Above 20 mm 200
2 Hissar 2.33 Same as above Same as above
3 Rohtak 1.91 Same as above Same as above
4 Karnal 1.87 Same as above Same as above
5 Gurgaon 3.71 Same as above Same as above
6 Ambala 2.68 Same as above Same as above
7 Jind 1.56 Same as above Same as above
8 Rewari 0.95 Same as above Same as above
9 Thanesar 2.30 Same as above Same as above
10 Kaithal 1.81 Same as above Same as above* Estimated by respective loval governments/authorities
4
5 9
AT-3 : Water Tariff and Connection Charges, 1999 - Haryana
Sl. City/Town Cost of Domestic
No. production of Metered Unmetered (Flat rate
water Based on ferrule size
(1997-99) Volumetric Ferrule size (Rs./month)
Rs./kl rate (Rs./Kl/ rate (Rs./Kl
month)
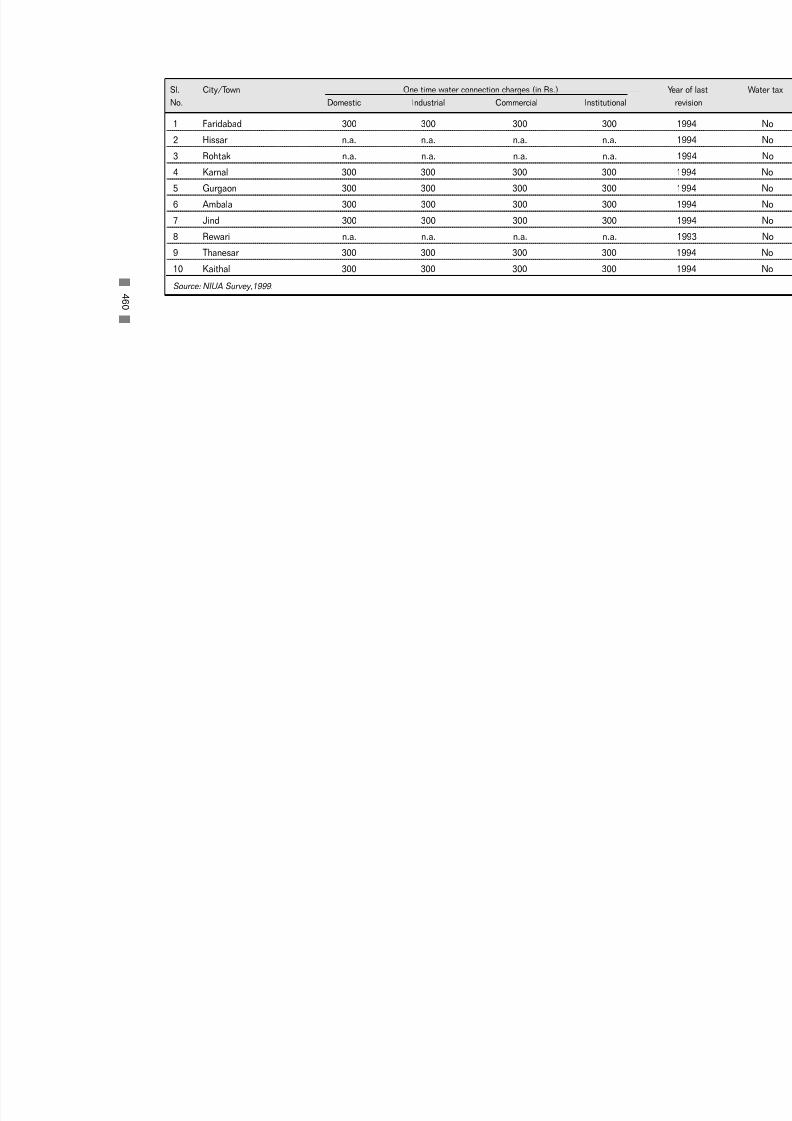
7/21/2019 Status Watersupply
http://slidepdf.com/reader/full/status-watersupply 480/869
1 Faridabad 300 300 300 300
2 Hissar n.a. n.a. n.a. n.a.
3 Rohtak n.a. n.a. n.a. n.a.
4 Karnal 300 300 300 300
5 Gurgaon 300 300 300 300
6 Ambala 300 300 300 300
7 Jind 300 300 300 300
8 Rewari n.a. n.a. n.a. n.a.
9 Thanesar 300 300 300 300
10 Kaithal 300 300 300 300
Source: NIUA Survey,1999.4
6 0
Sl. City/Town One time water connection charges (in Rs.)
No. Domestic Industrial Commercial Institutional

7/21/2019 Status Watersupply
http://slidepdf.com/reader/full/status-watersupply 481/869
WA T
E R T A R I F F A ND C O N NE C T I O N C
HA R GE S
K A R
NA T A K A

7/21/2019 Status Watersupply
http://slidepdf.com/reader/full/status-watersupply 482/869

7/21/2019 Status Watersupply
http://slidepdf.com/reader/full/status-watersupply 483/869
1 Bangalore n.a. Min. 65.00/month M
3.50/kl upto 25 kl 3
7.00/kl for 25 - 50 kl 39
19.00/kl for 50 - 75 kl 44
26.00/kl for 75 - 100 kl 51
33.00/kl above 100 kl 57
6
2 Mysore 2.87 1.25/kl upto 10 kl
1.65/kl for 10-25 kl 42.65/kl for 25-50 kl 5
3.65/kl for 50-75 kl 6
5.15/kl for 75-100 kl 7
6.15/kl above 100 kl
3 Hubli-Dharwad n.a. 1.25/kl upto 10 kl 540
1.65/kl for 10-25 kl 4
2.65/kl for 25-50 kl 5
3.65/kl for 50-75 kl 6
5.15/kl for 75-100 kl 7
6.15/kl above 100 kl
4 Belgaum n.a. 1/2" 4303/4" 1085
1" 1155
5 Davangere n.a. 540
6 Gulbarga n.a. 540
4
6 3
AT-4 : Water Tariff and Connection Charges, 1999 - Karnataka
Sl. City/Town Cost of Domestic
No. production of Metered Unmetered
water Consumption based Ferrule based rates Others
(1998-99)* rates Ferrule size Rs./year Flat rate
Rs./kl Increasing block (Rs./year)
tariff (Rs./month)

7/21/2019 Status Watersupply
http://slidepdf.com/reader/full/status-watersupply 484/869
1 Bangalore 60.00
2 Mysore 8.60 8.60
3 Hubli-Dharwad 2160
4 Belgaum 1/2" 5000 1
3/4" 9740 3
1" 10375
5 Davangere
6 Gulbarga
7 Mangalore 60.00 Min. 2000/month
9.20/klupto 80 kl
10.00/klabove 80 kl
8 Tumkur
9 Bellaray
10 Shimoga
11 Hospet 2160
12 Gadag
13 Mandya 2160
14 Kolar 2160
15 Bagalkot
16 Chikmagalur
17 Rabakavi-Banhatti 2160
18 Ramanagaram
19 Gokak 2160
4
6 4
Sl. City/Town Industrial Com
No. Metered Unmetered Metered
Volumetric Increasing Ferrule based rates Others Volumetric
rate (Rs./ block tariff Ferrule Re./year Flat rate rate (Rs./Kl. F
Kl/month) (Rs./month) size (Rs./year) month)

7/21/2019 Status Watersupply
http://slidepdf.com/reader/full/status-watersupply 485/869
7 Mangalore 2.13 Minimum 45.00/month
1.40/kl upto 10 kl
1.80/kl for 10-25 kl 8
2.80/kl for 25-50 kl
3.80/kl for 50-75 kl
5.30/kl for 75-100 kl
6.30/kl above 100 kl
8 Tumkur n.a. 120
9 Bellaray 540
10 Shimoga n.a. 36011 Hospet n.a. 540
12 Gadag 6.00 360
13 Mandya n.a. 540
14 Kolar n.a. 540
15 Bagalkot n.a. 540
16 Chikmagalur n.a. 360
17 Rabakavi-Banhatti 8.48 540
18 Ramanagaram n.a. 540
19 Gokak n.a. 540
Source: NIUA Survey,1999. * Estimated by respective local governments/authorities
4
6 5
Sl. City/Town Cost of Domestic
No. production of Metered Unmetered
water Consumption based Ferrule based rates Others
(1998-99)* rates Ferrule size Rs./year Flat rate
Rs./kl Increasing block (Rs./year)
tariff (Rs./month)
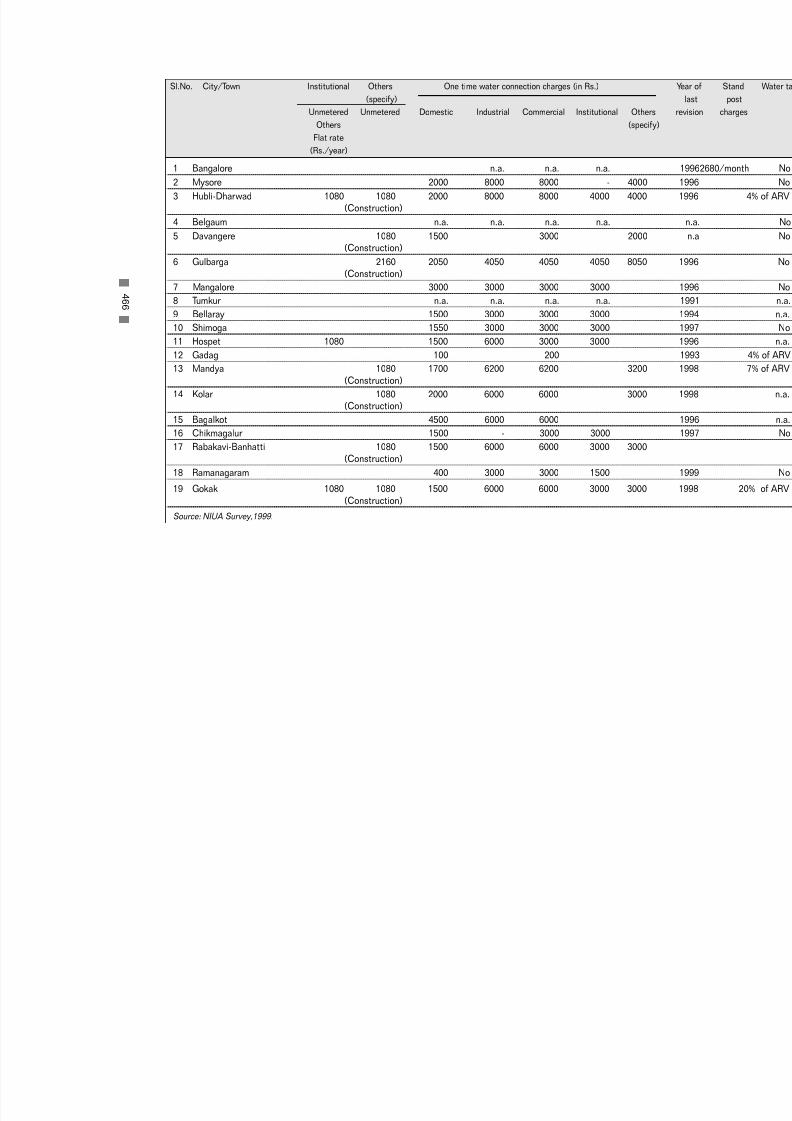
7/21/2019 Status Watersupply
http://slidepdf.com/reader/full/status-watersupply 486/869
1 Bangalore n.a. n.a. n.a.
2 Mysore 2000 8000 8000 - 4000
3 Hubli-Dharwad 1080 1080 2000 8000 8000 4000 4000
(Construction)
4 Belgaum n.a. n.a. n.a. n.a.
5 Davangere 1080 1500 3000 2000(Construction)
6 Gulbarga 2160 2050 4050 4050 4050 8050
(Construction)
7 Mangalore 3000 3000 3000 3000
8 Tumkur n.a. n.a. n.a. n.a.9 Bellaray 1500 3000 3000 3000
10 Shimoga 1550 3000 3000 3000
11 Hospet 1080 1500 6000 3000 3000
12 Gadag 100 200
13 Mandya 1080 1700 6200 6200 3200
(Construction)
14 Kolar 1080 2000 6000 6000 3000(Construction)
15 Bagalkot 4500 6000 6000
16 Chikmagalur 1500 - 3000 3000
17 Rabakavi-Banhatti 1080 1500 6000 6000 3000 3000(Construction)
18 Ramanagaram 400 3000 3000 1500
19 Gokak 1080 1080 1500 6000 6000 3000 3000
(Construction)
Source: NIUA Survey,1999.
4
6 6
Sl.No. City/Town Institutional Others One time water connection charges (in Rs.)
(specify)
Unmetered Unmetered Domestic Industrial Commercial Institutional Others
Others (specify)
Flat rate
(Rs./year)

7/21/2019 Status Watersupply
http://slidepdf.com/reader/full/status-watersupply 487/869
WA T
E R T A R I F F A ND C O N NE C T I O N C
HA R GE S
K E R A L A

7/21/2019 Status Watersupply
http://slidepdf.com/reader/full/status-watersupply 488/869

7/21/2019 Status Watersupply
http://slidepdf.com/reader/full/status-watersupply 489/869
Same for all the urbanareas of the state n.a. 22/month - upto 10 kl 102/month - upto 10 kl
25-52/month - for 11-20 kl 102-149/month - for 11-20
55-82/month - for 21-30 kl 156-223/month - for 21-30
87-132/month - for 31-40 kl 230-296/month - for 31-40
137-182/month - for 41-50 kl 303-370/month - for 41-50
189-550/month - for 51-100 kl 381-900/month - for 51-100
Source: NIUA Survey,1999. * Estimated by respective local governments/authorities
4
6 9
Sl. City/Town Cost of Domestic Non-Domestic
No. production of Metered Metered
water Consumption based rates Increasing block tariff
(1997-98)* Increasing block tariff (Rs./month)Rs./Kl (Rs./month)
AT-5 : Water Tariff and Connection Charges, 1999 - Kerala

7/21/2019 Status Watersupply
http://slidepdf.com/reader/full/status-watersupply 490/869
Same for all the urbanareas of the state 565 1065 1065
Source: NIUA Survey, 1999
4
7 0
Sl. City/Town One time water connection charges (in Rs.)
No. Domestic Industrial Commercial Year of

7/21/2019 Status Watersupply
http://slidepdf.com/reader/full/status-watersupply 491/869
WA T
E R T A R I F F A ND C O N NE C T I O N C
HA R GE S
MA DHY
A P R A DE S H

7/21/2019 Status Watersupply
http://slidepdf.com/reader/full/status-watersupply 492/869

7/21/2019 Status Watersupply
http://slidepdf.com/reader/full/status-watersupply 493/869
1 Bhopal n.a. 720 8.00
2 Indore 7 - 8 2.00 720 22.00 3600
3 Jabalpur n.a. 3.00 720 6.00 2160
4 Gwalior n.a All connections unmetered 720 1440
5 Ratlam n.a. 600 15.00
6 Burhanpur n.a. All connections unmetered 600 n.a.
7 Dewas n.a. All connections unmetered 600 -
8 Satna n.a. 0.33 2.20
9 Katni n.a. 1.50 600 3.50 90010 Rewa n.a. 1.30 144 2.20
11 Khandwa n.a. All connections unmetered 600 1200
12 Bhind n.a. All connections unmetered 480 600
13 Shivpuri 480 5.68
14 Morena 1.16 480 480
15 Guna n.a. 480 5.68
16 Vidisha n.a. All connections unmetered 480 1440
17 Mandsor n.a. All connections unmetered 480 - 720 720 - 1080
18 Itarsi n.a. All connections unmetered 480 480
19 Nagda n.a. 480 -
20 Sehore n.a. All connections unmetered 480 120021 Hoshangabad n.a. All connections unmetered 480 480
22 Neemuch 3.68 480 960
23 Khargaon n.a. All connections unmetered 480 n.a.
24 Shahdol n.a. All connections unmetered 480 -
* Estimated by respective local governments/authorities
4
7 3
AT-6 : Water Tariff and Connection Charges, 1999 - Madhya Pradesh
Sl. City/Town Cost of Domestic Industrial
No. production of Metered Unmetered Metered Unmetered
water Consumption based rates Others Volumetric Others
(1997-98)* Volumetric Increasing block tariff Flat rate rate Flat rate
Rs./Kl rate (Rs./month) (Rs./year) (Rs./Kl/month) (Rs./year)
(Rs./Kl/month)

7/21/2019 Status Watersupply
http://slidepdf.com/reader/full/status-watersupply 494/869
1 Bhopal 2100For 1/2" - 50000 For 1" - 100000 19
2 Indore 250 + Road repair charges
3 Jabalpur 6.00 2160 1356 1356 1356 1356 19
4 Gwalior 1280 1500 3000 3000 3000 19
5 Ratlam 600 1500-1800 2500-3000 1600-2200 1500-1800 19
6 Burhanpur n.a. 1500 - 2500 19
7 Dewas - 2000-3000 - - - 19
8 Satna 61 61 61 61 n
9 Katni 3.50 900 763 763 763 763 19
10 Rewa 1.75 n.a. 59 59 59 19
11 Khandwa 600 650 1300 1300 650 1912 Bhind n.a. 34 n.a. n.a. n.a. 19
13 Shivpuri 2.27 1600 2000 2000 2000 19
14 Morena 480 500 700 700 700 19
15 Guna 2.27 1600 2000 2000 2000 19
16 Vidisha - 850 1700 850 - 19
17 Mandsor 720 - 1080 1000 1250 1250 1250 19
18 Itarsi 480 900 900 900 900 19
19 Nagda - 1500 - - - 19
20 Sehore - 1885 3000 - - 19
21 Hoshangabad 480 1530 1530 1530 1530 19
22 Neemuch - 1200 1500 - 1200 19
23 Khargaon n.a. 1200 1500 1500 1200 19
24 Shahdol - n.a. n.a. n.a. n.a. 19
Source: NIUA Survey,1999.
4
7 4
Sl. City/Town Institutional One time water connection charges (in Rs.) Yea
No. Metered Unmetered Domestic Industrial Commercial Institutional la
Volumetric Others rev
rate (Rs./Kl Flat rate
month) (Rs./year)

7/21/2019 Status Watersupply
http://slidepdf.com/reader/full/status-watersupply 495/869

7/21/2019 Status Watersupply
http://slidepdf.com/reader/full/status-watersupply 496/869

7/21/2019 Status Watersupply
http://slidepdf.com/reader/full/status-watersupply 497/869
1 Mumbai 142 2.52 1.50 - 2.75 50% of 0.50 torateable 35.00
value of property
2 Pune n.a. 2.50 1/2 & 3/4" 750 & 250 for 12.00
1500 slums
1 & 2" 4000 &
100003" 15000
>3" 200003 Nagpur n.a. 1.00/kl - 15 mm 300
upto 10 kl
1.25/kl - for 20 mm 600
next 30 kl
1.50/kl
for above
4 Kolhapur 2.75 3.60
5 Nasik 4.75 2.25 720
6 Aurangabad 6.39 4.00 15 mm 1000 10.00
20 mm 2000
25 mm 30007 Dhule 4.56 4.00 1/2" 806 8.00
3/4" 1555
1" 3662
Source: NIUA Survey,1999. * Estimated by respective local governments/authorities
4
7 7
AT-7 : Water Tariff and Connection Charges, 1999 - Maharashtra
Sl. City/Town Cost of Domestic
No. production of Metered Unmetered Metered
water Consumption based rates Ferrule based rates Others Volumetric Increas
(1998-99)* Volumetric Increasing Ferrule Rs./year Flat rate rate (Rs./Kl/ block
Rs./Kl rate (Rs./ block tariff size (Rs./year) month) tariff
Kl/month) (Rs./month)

7/21/2019 Status Watersupply
http://slidepdf.com/reader/full/status-watersupply 498/869
1 Mumbai Combined in non-domestic
2 Pune
3 Nagpur 12.00 7.50 2.
4 Kolhapur 17.30 7.20 7.
5 Nasik 12.00 9.00 12.
6 Aurangabad
7 Dhule
8 Parbhani
9 Bhusawal 15 mm 358020 mm 1738
25 mm 16152
10 Yavatmal 23.00 543 9.
11 Kamptee 720 720
12 Virar
13 Ratanagiri 15.55 3576 7.90 3576
14 Ichalkaranji 8.00 1280 8.00 1280 8.
15 Ballarpur 28.00 28.00 5.
16 Chandrapur 153
17 Manmad18 Satara
19 Wardha
20 Jalgaon 12 mm 358018 mm 713825 mm 16152
4
7 8
Sl. City/Town Industrial Commercial
No. Metered Unmetered Metered Unmetered Me
Volumetric Furrule based Others Volumetric Ferrule based Others Volu
rate Ferrule Rs./year Flat rate rate Ferrule Rs./year Flat rate r
(Rs./Kl/ size (Rs./year) (Rs./Kl/ size Rs./year) (Rs./year) (Rs
month) month) mo

7/21/2019 Status Watersupply
http://slidepdf.com/reader/full/status-watersupply 499/869
1 Mumbai - - - - - - 1997 Re. 1.00/klfor metered stand posts
2 Pune 1999 No N. A.
3 Nagpur - - - - - 1989 No
4 Kolhapur 3450 for 5550 for 3650 for 3650 for 1998 418/month
15mm 15mm 15mm 15mm
5 Nasik n.a. n.a. n.a. n.a. n.a. 1998 No
6 Aurangabad n.a. n.a. n.a. n.a. n.a. 1998 No
7 Dhule n.a. 1999
8 Parbhani Road cutting charges levied bet. Rs. 30 and 1500 1999 No
depending upon type of road + boring charges levied by size of connectionvarying bet.
Rs. 100 and Rs. 2000
9 Bhusawal 1998 No
10 Yavatmal n.a. n.a. 1998 550/yr.
11 Kamptee 75 Nil Nil Nil Nil 1991 No
12 Virar n.a. 1998 No
13 Ratanagiri 1997 No
4
7 9
Sl. City/Town Others One time water connection charges (in Rs.) Year of Stand post
No. (specify) last revision charges
Metered Domestic Industrial Commercial Institutional Others
Volumetric (specify)
rate (Rs./Kl/
month)

7/21/2019 Status Watersupply
http://slidepdf.com/reader/full/status-watersupply 500/869
8 Parbhani 0.32p 1/2" 8043/4" 1560
1" 3660
9 Bhusawal 2.58 15 mm 80620 mm 1555
25 mm 3662
10 Yavatmal 20.20 4.75 106
11 Kamptee n.a 240
12 Virar 3.70 1/2" 842
3/4" 2400
13 Ratanagiri 2.44 3.45 804
14 Ichalkaranji n.a. 2.00 480
15 Ballarpur n.a. 5.75 -
16 Chandrapur n.a. 1/2" 8063/4" 1555
1" 3662
17 Manmad 10.00 1/2" 8063/4" 1555
1" 3662
18 Satara 3.76 450
19 Wardha n.a. No water charges are levied in the town
20 Jalgaon n.a. n.a 12 mm 80618 mm 1555
25 mm 4662
21 Nanded 0.82 2.00 1/2" 720
3/4" 3240
1" 4320
4
8 0
Sl. City/Town Cost of Domestic
No. production of Metered Unmetered Metered
water Consumption based rates Ferrule based rates Others Volumetric Increas
(1998-99)* Volumetric Increasing Ferrule Rs./year Flat rate rate (Rs./Kl/ block
Rs./Kl rate (Rs./ block tariff size (Rs./year) month) tariff
Kl/month) (Rs./month)

7/21/2019 Status Watersupply
http://slidepdf.com/reader/full/status-watersupply 501/869
21 Nanded 15.55 1/2" 4370 15.55 1/2" 4370 9.
3/4" 19440 3/4" 19440
1" 25920 1" 25920
22 Solapur 12.00 12.00 12.
23 Bhandara 9.55 213 23.00 543 23.
24 Amalner
25 Amravati
Source: NIUA Survey,1999.
4
8 1
Sl. City/Town Industrial Commercial
No. Metered Unmetered Metered Unmetered Me
Volumetric Furrule based Others Volumetric Ferrule based Others Volu
rate Ferrule Rs./year Flat rate rate Ferrule Rs./year Flat rate r
(Rs./Kl/ size (Rs./year) (Rs./Kl/ size Rs./year) (Rs./year) (Rs
month) month) mo

7/21/2019 Status Watersupply
http://slidepdf.com/reader/full/status-watersupply 502/869
14 Ichalkaranji 50 200 200 200 1998 No
15 Ballarpur 5600 401 for 401 for 401 for 401 for 1998 660/yr.
1/2" 1/2" 1/2" 1/2"
16 Chandrapur 21 21 21 21 1997 No
17 Manmad 15 - 40 50 -120 1999
18 Satara 400 400 400 400 1997
19 Wardha 150 1999 No
20 Jalgaon n.a. 1998
21 Nanded Road cutting charges levied bet. 1999 No
Rs. 100 - 750 depending upon type of road
22 Solapur 1/2" - 1000 1/2" - 3000, 3/4" - 4500, above 1998-99 No1" - 3 month's average bill is
taken as deposit
3/4" - 1500
23 Bhandara 163 253 955 955 955 1997
24 Amalner 162 n.a. n.a.
25 Amravati
Source: Respective urban local government/relevant agencies, NIUA Survey,1999.
4
8 2
Sl. City/Town Others One time water connection charges (in Rs.) Year of Stand post
No. (specify) last revision charges
Metered Domestic Industrial Commercial Institutional Others
Volumetric (specify)
rate (Rs./Kl/
month)

7/21/2019 Status Watersupply
http://slidepdf.com/reader/full/status-watersupply 503/869
22 Solapur 3.24 2.50/klupto 20 kl. 1/2" 980 12.00
3.50/kl for
20-40 kl. 3/4" 2350
4.20/kl for
>40 kl.
23 Bhandara n.a. 4.75 15 mm min. 15mm 1272 106 15 mm mi552/year 2736 /ye
20 mm min. 20mm 2556 20 mm mi1116/year 5484 /ye
25 mm min. 25mm 5124 25 mm mi2196/year 10968 /ye
24 Amalner 1.00 806 4.00
25 Amravati 0.90 5.75 15 mm min. 15 mm min. 28.00 15 mm mi672/year 1536 3288/ye
20 mm min. 20 mm min. 20 mm mi1344/year 3000 6588/ye
25 mm min. 25 mm min. 25 mm mi
2640/year 6156 13164/ye
Source: NIUA Survey,1999. * Estimated by respective local governments/authorities
4
8 3
Sl. City/Town Cost of Domestic
No. production of Metered Unmetered Metered
water Consumption based rates Ferrule based rates Others Volumetric Increas
(1998-99)* Volumetric Increasing Ferrule Rs./year Flat rate rate (Rs./Kl/ block
Rs./Kl rate (Rs./ block tariff size (Rs./year) month) tariff
Kl/month) (Rs./month)

7/21/2019 Status Watersupply
http://slidepdf.com/reader/full/status-watersupply 504/869

7/21/2019 Status Watersupply
http://slidepdf.com/reader/full/status-watersupply 505/869
WA T
E R T A R I F F A ND C O N NE C T I O N C
HA R GE S
O
R I S S A

7/21/2019 Status Watersupply
http://slidepdf.com/reader/full/status-watersupply 506/869
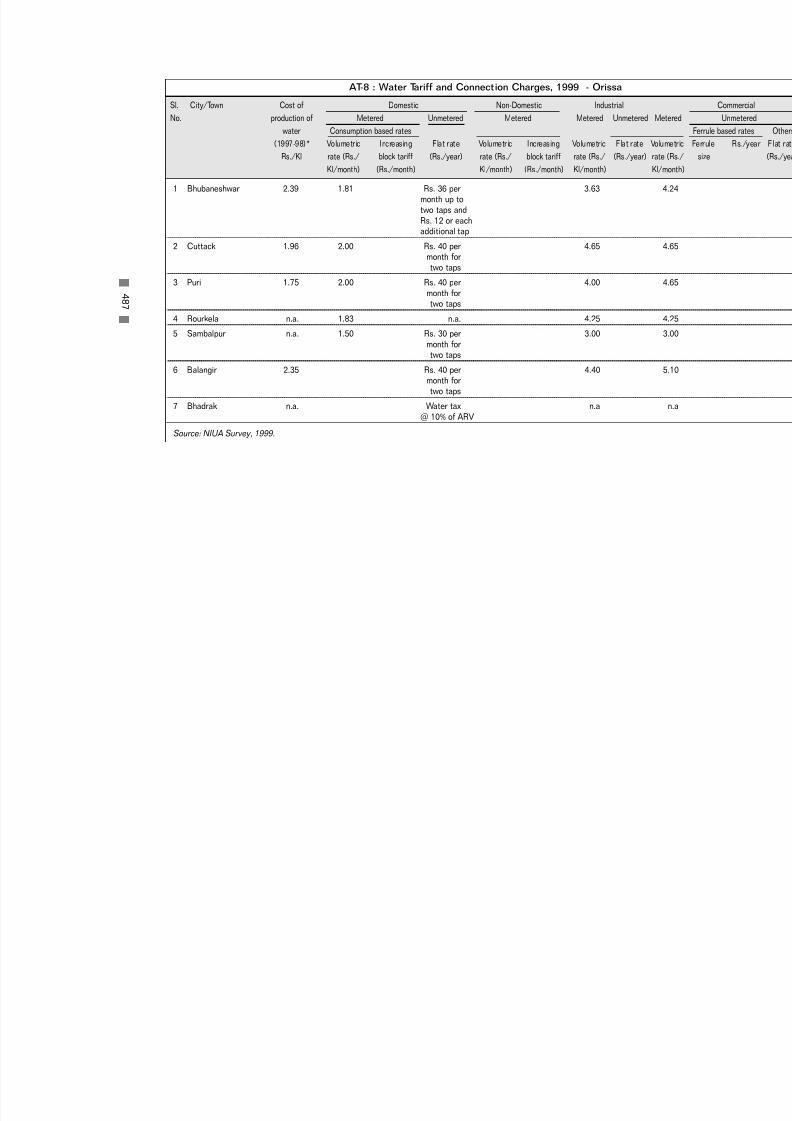
7/21/2019 Status Watersupply
http://slidepdf.com/reader/full/status-watersupply 507/869
1 Bhubaneshwar 2.39 1.81 Rs. 36 per 3.63month up to
two taps and
Rs. 12 or eachadditional tap
2 Cuttack 1.96 2.00 Rs. 40 per 4.65month for
two taps
3 Puri 1.75 2.00 Rs. 40 per 4.00
month for
two taps
4 Rourkela n.a. 1.83 n.a. 4.25
5 Sambalpur n.a. 1.50 Rs. 30 per 3.00
month fortwo taps
6 Balangir 2.35 Rs. 40 per 4.40month for
two taps
7 Bhadrak n.a. Water tax n.a
@ 10% of ARV
Source: NIUA Survey, 1999.
4
8 7
AT-8 : Water Tariff and Connection Charges, 1999 - Orissa
Sl. City/Town Cost of Domestic Non-Domestic Industrial
No. production of Metered Unmetered Metered Metered Unmetered M
water Consumption based rates
(1997-98)* Volumetric Increasing Flat rate Volumetric Increasing Volumetric Flat rate Vo
Rs./Kl rate (Rs./ block tariff (Rs./year) rate (Rs./ block tariff rate (Rs./ (Rs./year) rat
Kl/month) (Rs./month) Kl/month) (Rs./month) Kl/month) Kl/

7/21/2019 Status Watersupply
http://slidepdf.com/reader/full/status-watersupply 508/869
1 Bhubaneshwar 4.24 3000 5000 5000 4000
2 Cuttack 4.65 3000 5000 5000 4000
3 Puri 4.65 3000 5000 5000 4000
4 Rourkela 4.25 3000 5000 5000 4000
5 Sambalpur 3.50 3000 5000 5000 4000
6 Balangir 5.10 3000 5000 5000 4000
7 Bhadrak n.a n.a n.a n.a n.a
Source: NIUA Survey,1999.
4
8 8
Sl. City/Town Institutional One time water connection charges (in Rs.)
No. Metered Unmetered Domestic Industrial Commercial Institutional Oth
Volumetric Others (spe
rate (Rs./Kl/ Flat rate
month) (Rs./year)

7/21/2019 Status Watersupply
http://slidepdf.com/reader/full/status-watersupply 509/869
WA T
E R T A R I F F A ND C O N NE C T I O N C
HA R GE S
P U
N J A B

7/21/2019 Status Watersupply
http://slidepdf.com/reader/full/status-watersupply 510/869

7/21/2019 Status Watersupply
http://slidepdf.com/reader/full/status-watersupply 511/869
1 Ludhiana 3.60 600 120
2 Amritsar 2.50 1.20 360 or Rs. 20.00 per month 2.50
for first tap and Rs. 7.50 foradditional tap
3 Jalandhar 0.46 90 180
4 Patiala n.a. 1.20 Rs. 20.00 per month Rs. 60 2.50 Rs. 6
for first tap and Rs. 7.50 per tap per tafor 2nd tap, 4.00 for
additional tap
5 Pathankot 5.00 1.20 240 2.50 36
6 Bathinda 1.96 1.20 2.50
7 Moga 1.20 1.20 Rs. 20.00 per tap/ month 2.50 Rs. 150tap/mon
8 Hoshiarpur 1.62 1.20 240 2.40 48
9 Phagwara 4.73 1.20 Rs. 20.00 per month for 2.50
first tap and Rs. 7.50 for eachsubsequent tap
10 Ferozpur 0.90 n.a. Rs. 20.00 per tap/ monthtap/month
11 Kapurthala 1.00 1.20 Rs. 20.00 per month for 2.50
first tap and Rs. 7.50 for eachsubsequent tap
12 Sangrur 0.68 1.20 360 2.50 72
13 Mansa n.a. 240 n.a.
Source: NIUA Survey,1999.* Estimated by respective local governments/authorities
4
9 1
AT-9 : Water Tariff and Connection Charges, 1999 - Punjab
Sl. City/Town Cost of Domestic Non-Domestic Industrial
No. production of Metered Unmetered Unmetered Metered Unmete
water Volumetric Others Others Volumetric Othe
(1997-98)* rate (Rs./Kl Flat rate Flat rate rate (Rs./Kl Flat ra
Rs./Kl month) (Rs./year) (Rs./year) month) (Rs./ye

7/21/2019 Status Watersupply
http://slidepdf.com/reader/full/status-watersupply 512/869
1 Ludhiana
2 Amritsar 21 21 21
3 Jalandhar 15 15 15
4 Patiala 175 175 175 175
5 Pathankot n.a. n.a. n.a. n.a.
6 Bathinda n.a. n.a. n.a. n.a.
7 Moga 100 100 100
8 Hoshiarpur 2.40 480 100 100 100 100
9 Phagwara 34 34 34
10 Ferozpur n.a. n.a. n.a. n.a.
11 Kapurthala 50 50 50 50
12 Sangrur 400 800 800
13 Mansa n.a. n.a. n.a. n.a.
Source: Respective urban local governments/relevant agencies, NIUA Survey,1999.
4
9 2
Sl. City/Town Institutional One time water connection charges (in Rs.)
No. Metered Unmetered Domestic Industrial Commercial Institutional Othe
Volumetric rate Others (speci
(Rs./Kl/month) Flat rate
(Rs./year)

7/21/2019 Status Watersupply
http://slidepdf.com/reader/full/status-watersupply 513/869
WA T
E R T A R I F F A ND C O N NE C T I O N C
HA R GE S
R A J A S T HA N

7/21/2019 Status Watersupply
http://slidepdf.com/reader/full/status-watersupply 514/869

7/21/2019 Status Watersupply
http://slidepdf.com/reader/full/status-watersupply 515/869
For all urban areas
of the state n.a. 1.56/kl - upto 15 kl 15 mm min. 240 300 for 2 taps 4(for 15 mm up
connection)
3.00/kl - for 15 - 40 kl 20 mm min. 1440 8.251
4.00/kl - above 40 kl 25 mm min. 4440 1
abo
40 mm min. 1044050 mm min. 13440
80 mm min. 26940
100 mm min. 53940
150 mm min. 134940
Source: NIUA Survey,1999. * Estimated by respective local governments/authorities
4
9 5
Sl. City/Town Cost of Domestic
No. Production Metered Unmetered (Flat rate) Me
of water Consumption based Based on ferrule size Others Increas
(1997-98)* rates Ferrule Rs./year Flat rate tariff (R
Rs./Kl Increasing block size (Rs./year)
tariff (Rs./month)
AT-10 : Water Tariff and Connection Charges, 1999 - Rajasthan
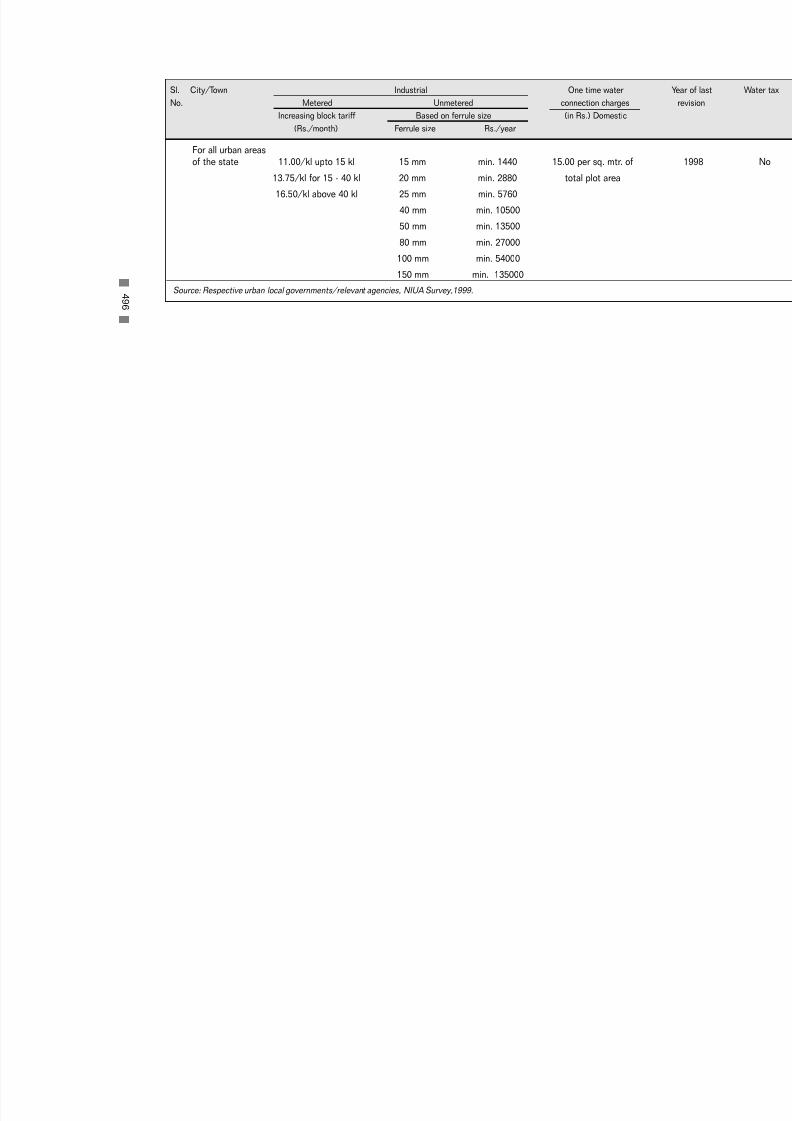
7/21/2019 Status Watersupply
http://slidepdf.com/reader/full/status-watersupply 516/869
For all urban areasof the state 11.00/kl upto 15 kl 15 mm min. 1440 15.00 per sq. mtr. of
13.75/kl for 15 - 40 kl 20 mm min. 2880 total plot area
16.50/kl above 40 kl 25 mm min. 5760
40 mm min. 10500
50 mm min. 13500
80 mm min. 27000
100 mm min. 54000
150 mm min. 135000
Source: Respective urban local governments/relevant agencies, NIUA Survey,1999.4
9 6
Sl. City/Town Industrial One time water
No. Metered Unmetered connection charges
Increasing block tariff Based on ferrule size (in Rs.) Domestic
(Rs./month) Ferrule size Rs./year

7/21/2019 Status Watersupply
http://slidepdf.com/reader/full/status-watersupply 517/869
WA T
E R T A R I F F A ND C O N NE C T I O N C
HA R GE S
T A M
I L NA D U

7/21/2019 Status Watersupply
http://slidepdf.com/reader/full/status-watersupply 518/869

7/21/2019 Status Watersupply
http://slidepdf.com/reader/full/status-watersupply 519/869
1 Chennai n.a. 2.50/kl upto 10 kl 600
10.00/kl for 10-15 kl
15.00/kl for 15-25 kl
25.00/kl above 25 kl
2 Madurai n.a. 5.00 240
3 Coimbatore n.a. Free - upto 100 litres/day Min. 300
2.50/kl upto 50 kl 6
3.00/kl for 50-100 kl 7.
3.50/kl for 100-200 kl 8
4.00/kl above 200 kl
4 Tiruchirapalli 67.00 5.00 420 15.00
5 Salem n.a. 3.00 6.00
6 Tirunelveli n.a. 2.00 240
7 Tirupur 1.74 2.00 240
8 Thanjavur n.a. 3.00 6.00
9 Tuticorin n.a. 3.50
10 Dindigul n.a. 3.00
11 Nagercoil n.a. 2.00
12 Vellore 0.86 24013 Erode n.a. 2.00 240
14 Cuddalore n.a. 240
15 Kanchipuram n.a. 3.00 360
Source: NIUA Survey,1999. * Estimated by respective local governments/authorities
4
9 9
Sl. City/Town Cost of Domestic
No. Production Metered Unmetered Mete
of water Consumption based rates Flat rate Volumetric
(1997-98)* Volumetric Increasing block (Rs./year) rate (Rs./Kl/
Rs./Kl rate (Rs./Kl tariff (Rs./month) month)
month)
AT-11 : Water Tariff and Connection Charges, 1999 - Tamil Nadu

7/21/2019 Status Watersupply
http://slidepdf.com/reader/full/status-watersupply 520/869
1 Chennai 25.00/kl upto 500 kl 4800 5.00/kl upto 10 kl 1800 20
40.00/kl above 500 kl 15.00/kl for 10-15 kl
25.00/kl above 15 kl
2 Madurai 20.00 3360 20.00 3360 14
3 Coimbatore Free - upto 100 litres/day
5.00/kl upto 50 kl
6.00/kl for 50-100 kl
7.00/kl for 100-200 kl
8.00/kl above 200 kl
4 Tiruchirapalli 20.00
5 Salem
6 Tirunelveli 4.00 480 6.00 720
7 Tirupur 4.00 6.00 480 2
8 Thanjavur
9 Tuticorin 7.00 7.00 10
10 Dindigul 6.00 6.00 6
11 Nagercoil 6.00 4.00
12 Vellore 48013 Erode 6.00 6.00
14 Cuddalore
15 Kanchipuram 6.00 9.00
Source: NIUA Survey,1999.
5
0 0
Sl. City/Town Industrial Commercial
No. Metered Unmetered Metered Unmetered
Volumetric Increasing block Others Volumetric Increasing block Others Volum
rate (Rs./Kl/ tariff (Rs./month) Flat rate rate (Rs./kl/ tariff (Rs./month) Flat rate rate (Rs
month) (Rs./year) month) (Rs./year) mon

7/21/2019 Status Watersupply
http://slidepdf.com/reader/full/status-watersupply 521/869
16 Kumbakonam n.a. 2.00 240 4.00
17 Thiruvannamalai n.a. 1.25 300
18 Rajapalayam n.a. 2.00 240
19 Nagapatinam n.a. 240
20 Puddukottai n.a. 816
21 Udhagamandalam n.a. 2.00 6.00
22 Gudiyatham 240
23 Arrakonam 2.00 480 4.00
24 Ambur 1.00
25 Srivilliputtur 2.00 240
26 Sivakasi 4.10 2.00 240
27 Tindivanam 2.00 300
28 Dharmapuri 2.00
29 Attur 504
30 Cumbum 3.00 360
Source: NIUA Survey,1999. * Estimated by respective local governments/authorities
5
0 1
Sl. City/Town Cost of Domestic
No. Production Metered Unmetered Mete
of water Consumption based rates Flat rate Volumetric
(1997-98)* Volumetric Increasing block (Rs./year) rate (Rs./Kl/
Rs./Kl rate (Rs./Kl tariff (Rs./month) month)
month)

7/21/2019 Status Watersupply
http://slidepdf.com/reader/full/status-watersupply 522/869
16 Kumbakonam
17 Thiruvannamalai 3.75 600 2.50 600
18 Rajapalayam 4.00 480 6.00 720
19 Nagapatinam
20 Puddukottai 1608 2400
21 Udhagamandalam
22 Gudiyatham 480 720
23 Arrakonam
24 Ambur 4.00 6.00
25 Srivilliputtur 4.00 480 6.00 720
26 Sivakasi 4.00 480 6.00 720
27 Tindivanam 4.00 6.00
28 Dharmapuri 4.00 6.00
29 Attur 1008 1008
30 Cumbum 9.00
Source: NIUA Survey,1999.
5
0 2
Sl. City/Town Industrial Commercial
No. Metered Unmetered Metered Unmetered
Volumetric Increasing block Others Volumetric Increasing block Others Volum
rate (Rs./Kl/ tariff (Rs./month) Flat rate rate (Rs./kl/ tariff (Rs./month) Flat rate rate (Rs
month) (Rs./year) month) (Rs./year) mon

7/21/2019 Status Watersupply
http://slidepdf.com/reader/full/status-watersupply 523/869
WA T
E R T A R I F F A ND C O N NE C T I O N C
HA R GE S
UT T A R
P R A DE S H

7/21/2019 Status Watersupply
http://slidepdf.com/reader/full/status-watersupply 524/869

7/21/2019 Status Watersupply
http://slidepdf.com/reader/full/status-watersupply 525/869
For asses
1 Kanpur 3.48 2.00 A
15mm
20 mm
25 mm
For unasses
15 mm
20 mm
25 mm2 Lucknow 4.00 2.00
3 Varanasi 1.58 2.00
4 Meerut n.a. 2.20
5 Agra 1.10 3.00
6 Allahabad 3.00 2.50
7 Ghaziabad n.a. 0.60 Only water tax charged from all connect
8 Bareilly 1.70 0.75
9 Moradabad n.a.
10 Gorakhpur 1.70 0.75 Only water tax charged from all connect
11 Aligarh 4.95 1.75
12 Saharanpur n.a. 0.6013 Jhansi 9.00 2.00
14 Mathura n.a 1.00
ARV based slabs(within city limits)
Source: NIUA Survey,1999. * Estimated by respective local governments/authorities.
5
0 5
Sl. City/Town Cost of Domestic
No. Production Metered
of water Consumption based rates Ferrule based
(1997-98)* Volumetric Increasing block Ferrule size
Rs./Kl rate (Rs./Kl tariff (Rs./month)
month)
AT-12 : Water Tariff and Connection Charges, 1999 - Uttar Pradesh

7/21/2019 Status Watersupply
http://slidepdf.com/reader/full/status-watersupply 526/869
1 Kanpur 10.00 15 mm20 mm
25 mm
2 Lucknow
3 Varanasi 6.00 650
4 Meerut 10.00 Min. 1200
5 Agra 22.80
6 Allahabad 12.50
7 Ghaziabad 1.10
8 Bareilly 2.50
9 Moradabad
10 Gorakhpur 2.00
11 Aligarh 3.00
12 Saharanpur 1.10
13 Jhansi 4.00
14 Mathura 2.00
Within city limits
15 Muzzafarnagar 1.10 within city limits 12 mm 420 - 54002.00 outside ciy limits 20 mm 480 - 6600
25 mm 720 - 7200Outside city limits
Twice the domestic rate
16 Rampur 1.50 600
17 Haridwar 240 - 3600
18 Firozabad n.a.
19 Mirzapur 1.10 50
5
0 6
Sl. City/Town Non-Domestic
No. Metered Unmetered Metered
Volumetric rate Ferrule based rates Others Volumetric Ferr
(Rs.Kl/month) Ferrule Rs./year Flat rate rate (Rs./Kl/ Ferru
size (Rs./year) month) size

7/21/2019 Status Watersupply
http://slidepdf.com/reader/full/status-watersupply 527/869
1 Kanpur 6.00 15 mm min. 3600 4.00 15 mm
20 mm min. 5400 20 mm
25 mm min. 9000 25 mm
2 Lucknow 6.00 4.00
3 Varanasi
4 Meerut
5 Agra 22.80
6 Allahabad 7.50 5.00
7 Ghaziabad 1.10 0.60
8 Bareilly 2.00 360 0.75
9 Moradabad 360
10 Gorakhpur 2.00 2.00
11 Aligarh 3.00 3.00
12 Saharanpur
13 Jhansi
14 Mathura 2.00 1.00
15 Muzzafarnagar
16 Rampur
17 Haridwar
18 Firozabad
19 Mirzapur
20 Hapur
21 Rae Bareli
22 Faizabad
23 Orai
5
0 7
Sl. City/Town Commercial
No. Metered Unmetered Metered
Volumetric rate Ferrule based rates Others Volumetric Ferr
(Rs.Kl/month) Ferrule Rs./year Flat rate rate (Rs./Kl/ Ferru
size (Rs./year) month) size

7/21/2019 Status Watersupply
http://slidepdf.com/reader/full/status-watersupply 528/869
1 Chennai n.a. n.a. No
2 Madurai 1000 3000 3000 2000 1994 No
3 Coimbatore 3000 7500 7500 n.a. No
4 Tiruchirapalli 2000 5000 5000 1995 No
5 Salem 5000 25000 10000 1998 No
6 Tirunelveli 3000 5000 5000 1993 No
7 Tirupur 2000 5000 5000 5000 1997 No
8 Thanjavur 1350 3350 3350 1994 No
9 Tuticorin 1996 No10 Dindigul 1000 3000 3000 1996 No
11 Nagercoil 2000 6000 4000 n.a. No
12 Vellore 1993 No
13 Erode 2000 3000 5000 1994 No
14 Cuddalore 2000 4000 4000 1994 No
15 Kanchipuram 3000 5000 8000 1995 No
Source: NIUA Survey,1999.
5
0 8
Sl. City/Town One time water connection charges (in Rs.) Year of last Stand post
No. Domestic Industrial Commercial Institutional Others revision charges
(specify)

7/21/2019 Status Watersupply
http://slidepdf.com/reader/full/status-watersupply 529/869
15 Muzzafarnagar n.a. 0.60 within city limits 12 mm
1.10 outside ciy limits 20 mm
25 mm
Ou
12 mm
20 mm
25 mm
16 Rampur n.a. 0.80 Min. 25.00 per month
17 Haridwar 0.74 Monthly rate by size of plot
Rs. 15 upto 50 sq.m.
Rs. 20 for 50 - 100 sq.m.
Rs. 25 for 100-200 sq.m.
Rs. 50 for 200 - 300 sq.m.
Rs. 65 for 300 - 500 sq.m.
Rs. 100 above 500 sq.m.
18 Firozabad 0.60 0.22
19 Mirzapur n.a.. 0.22
20 Hapur n.a. 0.30
21 Rae Bareli 1.07 Meters not read, so unmetered rates applied
22 Faizabad n.a. 0.50
23 Orai 2.07 2.0024 Mughalsarai n.a. Meters not read
25 Sitapur n.a. 0.22
26 Haldwani 1.15 Meters not read
27 Etawah 0.41 0.60
5
0 9
Sl. City/Town Cost of Domestic
No. Production Metered
of water Consumption based rates Ferrule based
(1997-98)* Volumetric Increasing block Ferrule size
Rs./Kl rate (Rs./Kl tariff (Rs./month)
month)

7/21/2019 Status Watersupply
http://slidepdf.com/reader/full/status-watersupply 530/869
1 Kanpur 1000 1000 1000(revi
2 Lucknow n.a. n.a. n.a.
3 Varanasi 1560 1560 1560(revi
4 Meerut Avg. 500 Avg. 500 Avg. 500
5 Agra 275 275 275 275
6 Allahabad 5000
7 Ghaziabad 500 - 700
8 Bareilly 120 120 120 120
9 Moradabad 300 450
10 Gorakhpur About 500 About 1000 About 1000 About 100011 Aligarh 135 + road cutting charges
12 Saharanpur 500 1250 500
13 Jhansi About 650 About 650 About 650 About 650
14 Mathura About 250 About 250 About 250 About 250
15 Muzzafarnagar 500 for 15 mm 1000 for 15 mm 1000 for 15 mm 1000 for 15 mm
800 for 20 mm 1500 for 20 mm 1500 for 20 mm 1500 for 20 mm
16 Rampur About 250 About 250 About 250 About 250
17 Haridwar 300 800 800
18 Firozabad About 300 About 300 About 300 About 300
19 Mirzapur 750 - - -
20 Hapur 500 500 500
21 Rae Bareli 500 1000 1000
22 Faizabad - - - - L
5
1 0
Sl. City/Town One time water connection charges (in Rs.)
No. Domestic Industrial Commercial Institutional Others
(specify)

7/21/2019 Status Watersupply
http://slidepdf.com/reader/full/status-watersupply 531/869
16 Kumbakonam 1000 2000 2000 1992 No
17 Thiruvannamalai 2000 3000 5000 1991 No18 Rajapalayam 1000 3000 3000 1994 No
19 Nagapatinam 2000 4000 4000 1994 No
20 Puddukottai 2000 3000 5000 1994
21 Udhagamandalam 1000 2000 2000 1993
22 Gudiyatham 1000 2000 3000 1994
23 Arrakonam 1000 2000 1999
24 Ambur 1000 2000 3000 1994
25 Srivilliputtur 1000 2000 2000 1994
26 Sivakasi 1000 3000 3000 1994
27 Tindivanam 1000 2000 3000 1994
28 Dharmapuri 1000 2000 2000 1996
29 Attur 1000 3000 3000 1996
30 Cumbum n.a. 1999
Source: NIUA Survey,1999.
5
1 1
Sl. City/Town One time water connection charges (in Rs.) Year of last Stand post
No. Domestic Industrial Commercial Institutional Others revision charges
(specify)

7/21/2019 Status Watersupply
http://slidepdf.com/reader/full/status-watersupply 532/869
28 Etah 2.61 1.00
29 Bhadohi n.a. Meters not read
30 Unnao 0.50 n.a.
31 Gonda n.a. Only water tax charged from all consumers
32 Basti 0.40 0.50
33 Roorkee n.a. 0.60 (Meters generally not read)
34 Lalitpur 6.00
35 Lakhimpur n.a. 2.00
36 Ghazipur n.a. 0.18
37 Barabanki n.a. 1.50
38 Auraiya 0.49 Meters not read
39 Chandpur 0.82 0.25
40 Balrampur n.a.
Source: NIUA Survey,1999. * Estimated by respective local governments/authorities
5
1 2
Sl. City/Town Cost of Domestic
No. Production Metered
of water Consumption based rates Ferrule based
(1997-98)* Volumetric Increasing block Ferrule size
Rs./Kl rate (Rs./Kl tariff (Rs./month)
month)

7/21/2019 Status Watersupply
http://slidepdf.com/reader/full/status-watersupply 533/869
20 Hapur 0.40 180
21 Rae Bareli 600
22 Faizabad 1.00 36
23 Orai 4.00 744
24 Mughalsarai 180
25 Sitapur 0.22 36
26 Haldwani
27 Etawah
28 Etah
29 Bhadohi n.a.
30 Unnao 36
31 Gonda
32 Basti 1.00
33 Roorkee 1.10
34 Lalitpur
35 Lakhimpur 4.00 240
36 Ghazipur
37 Barabanki 2.00
38 Auraiya39 Chandpur 0.35 180
40 Balrampur 54
Source: NIUA Survey,1999.
5
1 3
Sl. City/Town Non-Domestic
No. Metered Unmetered Metered
Volumetric rate Ferrule based rates Others Volumetric Ferr
(Rs.Kl/month) Ferrule Rs./year Flat rate rate (Rs./Kl/ Ferru
size (Rs./year) month) size

7/21/2019 Status Watersupply
http://slidepdf.com/reader/full/status-watersupply 534/869
24 Mughalsarai
25 Sitapur
26 Haldwani 720
27 Etawah 1.10 1.10
28 Etah 1.50
29 Bhadohi
30 Unnao
31 Gonda
32 Basti 1.00 0.50
33 Roorkee 1.10
34 Lalitpur 240
35 Lakhimpur
36 Ghazipur 0.27
37 Barabanki
38 Auraiya
39 Chandpur
40 Balrampur
Source: NIUA Survey,1999.
5
1 4
Sl. City/Town Commercial
No. Metered Unmetered Metered
Volumetric rate Ferrule based rates Others Volumetric Ferr
(Rs.Kl/month) Ferrule Rs./year Flat rate rate (Rs./Kl/ Ferru
size (Rs./year) month) size

7/21/2019 Status Watersupply
http://slidepdf.com/reader/full/status-watersupply 535/869
23 Orai 450 550 550
24 Mughalsarai 250 250 250 25025 Sitapur - - - - L
26 Haldwani 2000 2500 - -
27 Etawah n.a. n.a. n.a. n.a.
28 Etah 1000 1000 1000 1000 L
29 Bhadohi 500 500 500 500
30 Unnao - - - - L
31 Gonda 300 500 500
32 Basti About 150 About 150 About 150 About 150
33 Roorkee 500 500 500
34 Lalitpur Min. 500 Min. 500 Min. 500
35 Lakhimpur n.a. n.a. n.a. n.a.
36 Ghazipur 1500 - 200 -
37 Barabanki n.a. n.a. n.a. n.a. L
38 Auraiya Avg. 300 Avg. 300 Avg. 300
39 Chandpur Approx. 200 Approx. 200
40 Balrampur Avg. 250 Avg. 250 Avg. 250 Avg. 250 L
Source: NIUA Survey,1999.
5
1 5
Sl. City/Town One time water connection charges (in Rs.)
No. Domestic Industrial Commercial Institutional Others
(specify)

7/21/2019 Status Watersupply
http://slidepdf.com/reader/full/status-watersupply 536/869

7/21/2019 Status Watersupply
http://slidepdf.com/reader/full/status-watersupply 537/869
WA T
E R T A R I F F A ND C O N NE C T I O N C
HA R GE S
WE S T
B E N GA L

7/21/2019 Status Watersupply
http://slidepdf.com/reader/full/status-watersupply 538/869

7/21/2019 Status Watersupply
http://slidepdf.com/reader/full/status-watersupply 539/869
1 Calcutta 1.64 10 mm Free 1/ 8" 1560
15 mm 120 3/ 16" 2280
20 mm 480 1/ 4" 3120
25 mm 780 3/ 8" 5280
7/ 16" 6000
1/ 2" 7200
> 1/2" 10800
3/ 4" 18000
1" 288002 Asansol n.a. Nil Nil
3 Siliguri n.a. Nil
4 Burdwan n.a. Nil
5 Barasat 1.12 Nil
6 Midnapore n.a. Nil
7 Bankura 2.33 Nil
8 Darjeeling n.a. 3/8" 240
1/2" 360
3/4" 480
9 Halisahar 0.91 Nil
10 Krishnagar n.a. Nil
11 Berhampur 2.21 Nil
12 Santipur n.a. Nil
13 Balurghat 2.59 Nil
* Estimated by respective local governments/authorities
5
1 9
Sl. City/Town Cost of Domestic Non-domestic
No. Production Unmetered (Flat rate) Unmetered
of water Ferrule based rates Others Ferrule based rates Ot
(1997-98)* Ferrule size Rs./year Flat rate Ferrule size Rs./year FlaRs./Kl (Rs./year) (Rs.
AT-13 : Water Tariff and Connection Charges, 1999 - West Bengal

7/21/2019 Status Watersupply
http://slidepdf.com/reader/full/status-watersupply 540/869
1 Calcutta 10 mm - 10000 Very elaborate structure - Ranges from 275 to 10500
15 mm - 15000 (schedule attached)
20 mm - 20000
25 mm - 25000
2 Asansol 5000 - 10000 -
3 Siliguri
4 Burdwan 1000 1000 1000 1000
5 Barasat 1340 - - 2500
6 Midnapore Min. 5590 n.a. n.a. n.a.
7 Bankura 1100 - 2100 2600
8 Darjeeling 6750 26750
9 Halisahar 500 500 500 50010 Krishnagar 910 910 910 910
11 Berhampur 4000
12 Santipur n.a. n.a. n.a. n.a.
13 Balurghat n.a. n.a. n.a. n.a.
5
2 0
Sl. City/Town One time water connection charges (in Rs.) Yea
No. Domestic Industrial Commercial Institutional re

7/21/2019 Status Watersupply
http://slidepdf.com/reader/full/status-watersupply 541/869
14 Raniganj 2.89 Nil
15 North Barrackpur 0.76 Nil
16 Contai Nil
17 Jalpaiguri 2.15 Nil
18 Cooch Behar n.a. Nil
19 Chakdaha 0.87 Nil
20 Jangipur 360 3
21 Katwa 316
22 Bishnupur Nil
Source: NIUA Survey,1999. * Estimated by respective local governments/authorities 5
2 1
Sl. City/Town Cost of Domestic Non-domestic
No. Production Unmetered (Flat rate) Unmetered
of water Ferrule based rates Others Ferrule based rates Ot
(1997-98)* Ferrule size Rs./year Flat rate Ferrule size Rs./year Fla
Rs./Kl (Rs./year) (Rs.

7/21/2019 Status Watersupply
http://slidepdf.com/reader/full/status-watersupply 542/869
14 Raniganj 5000 5000 5000 5000
15 North Barrackpur 900 -1300 1200 - 2000 900 - 1300
16 Contai n.a. n.a. n.a. n.a.
17 Jalpaiguri 3000 10000 3000
18 Cooch Behar 1000 1000 1000 1000
19 Chakdaha n.a. n.a. n.a. n.a.
20 Jangipur n.a. n.a. n.a. n.a.
21 Katwa 3000 - 3500
22 Bishnupur 1500 2000
Source: Respective urban local governments/relevant agencies, NIUA Survey,1999.
5
2 2
Sl. City/Town One time water connection charges (in Rs.) Yea
No. Domestic Industrial Commercial Institutional re

7/21/2019 Status Watersupply
http://slidepdf.com/reader/full/status-watersupply 543/869
5
2 3
WA T
E R T A R I F F A ND C O N NE C T I O N C
HA R GE S
S M
A L L S T A T E S A ND U NI O NT E R R I T
OR I E S

7/21/2019 Status Watersupply
http://slidepdf.com/reader/full/status-watersupply 544/869

7/21/2019 Status Watersupply
http://slidepdf.com/reader/full/status-watersupply 545/869
Chandigarh
1 Chandigarh n.a. 0.70/kl - upto 15 kl
1.30/kl - for 15 - 30 kl
1.80/kl - above 30 kl
Delhi
2 MCD & NDMC 2.33 Min.20.00/month
0.35p/kl upto 10 kl
1.00/kl for 10 - 20 kl
1.50/kl for 20 - 30 kl
3.00/kl above 30 kl
In addition to above a surcharge
of 50% of the rate is levied per klper month for all consumers.
NDMC levies an additional surcharge
of 0.02% to the above
J&K
3 Jammu
Arunachal Pradesh
4 Itanagar
Assam
5 Guwahati 2.97
Goa
6 Panjim Minimum charge - 20.00
2.00/kl - upto 30 kl
4.00/kl - above 30 kl
Source: NIUA Survey, 1999 . * Estimated by respective local governments/authorities
5
2 5
AT-14 : Water Tariff and Connection Charges, 1999 - Small States and Union Terr
Sl. City/Town Cost of Domestic
No. Production Metered
of water Consumption based rates Ferrule based
(1997-98)* Volumetric Increasing block Ferrule size (R
Rs./Kl rate (Rs./Kl tariff (Rs./month)
month)

7/21/2019 Status Watersupply
http://slidepdf.com/reader/full/status-watersupply 546/869
Chandigarh
1 Chandigarh
2 Delhi
MCD & NDMC Min. 100 - 300/month
5.00-8.00/kl - upto 50 kl
10.00-12.00/kl for 50-100 kl
16.00/kl above 100 kl
In addition to above a
surcharge of
50% of the rate is levied per
kl per month for all
consumers
J&K
3 Jammu n.a.
Arunachal Pradesh
4 Itanagar
Assam
5 Guwahati
Goa
6 Panjim For small hotels For defence
Min. 150/ month 7.00/kl - upto 100 kl
10.00/kl 9.00/kl - above 100 kl
5
2 6
Sl. City/Town Non-Domestic
No. Metered Unmetered
Volumetric Increasing block Ferrule based rates Others
rate (Rs./Kl tariff (Rs./month) Ferrule size Rs./year Flat rate
month) (Rs./year
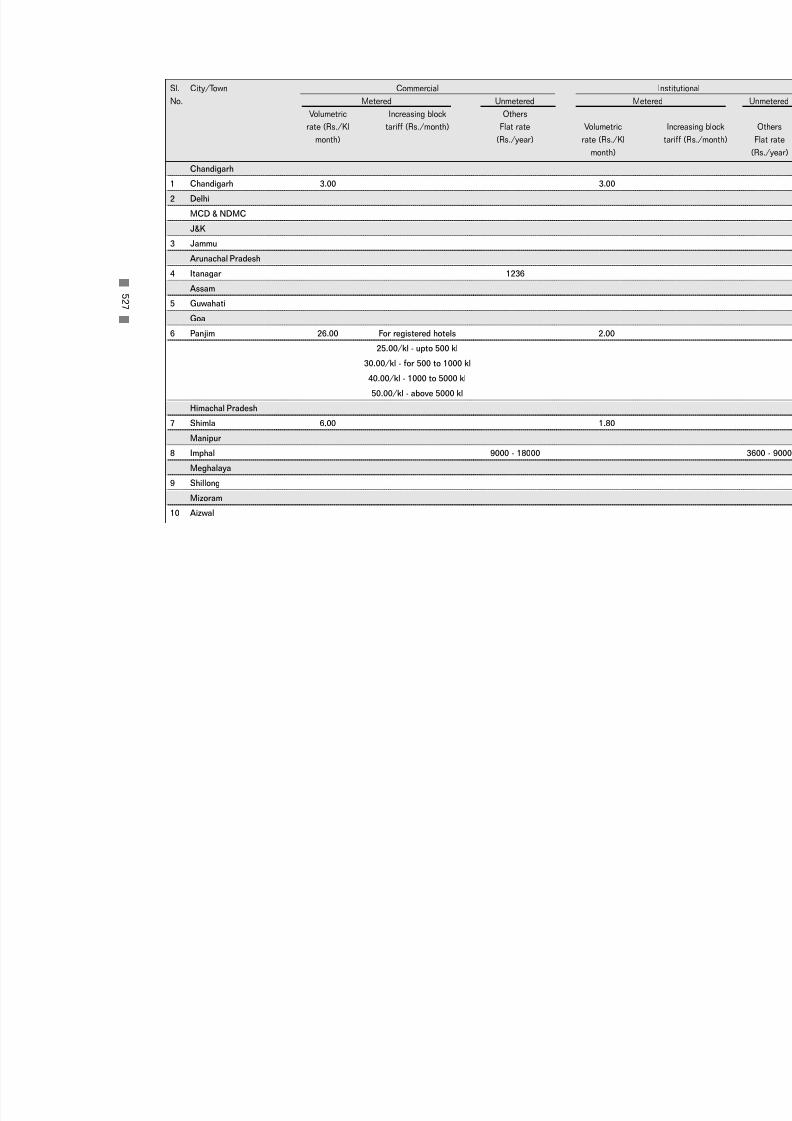
7/21/2019 Status Watersupply
http://slidepdf.com/reader/full/status-watersupply 547/869
5
2 7
Chandigarh
1 Chandigarh 3.00 3.00
2 Delhi
MCD & NDMC
J&K
3 Jammu
Arunachal Pradesh
4 Itanagar 1236
Assam
5 Guwahati
Goa
6 Panjim 26.00 For registered hotels 2.00
25.00/kl - upto 500 kl
30.00/kl - for 500 to 1000 kl
40.00/kl - 1000 to 5000 kl
50.00/kl - above 5000 kl
Himachal Pradesh
7 Shimla 6.00 1.80
Manipur
8 Imphal 9000 - 18000
Meghalaya
9 Shillong
Mizoram
10 Aizwal
Sl. City/Town Commercial I
No. Metered Unmetered Metered
Volumetric Increasing block Others
rate (Rs./Kl tariff (Rs./month) Flat rate Volumetric
month) (Rs./year) rate (Rs./Kl
month)

7/21/2019 Status Watersupply
http://slidepdf.com/reader/full/status-watersupply 548/869
Chandigarh
1 Chandigarh n.a. n.a. n.a. n.a.2 Delhi
MCD & NDMC n.a. n.a. n.a.
J&K
3 Jammu 630 n.a. n.a. n.a.
Arunachal Pradesh
4 Itanagar n.a. n.a. n.a. n.a.
Assam
5 Guwahati n.a. n.a. n.a. n.a.
Goa
6 Panjim 400 n.a. n.a. n.a.Himachal Pradesh
7 Shimla 500 500 500
Manipur
8 Imphal n.a. n.a. n.a. n.a.
Meghalaya
9 Shillong 1000 1000 1000 1000
Mizoram
10 Aizwal 500
Nagaland
11 Kohima n.a. n.a. n.a. n.a.Tripura
12 Agartala 500 500 500 500
5
2 8
Sl. City/Town One time water connection charges (in Rs.)
No. Domestic Industrial Commercial Institutional

7/21/2019 Status Watersupply
http://slidepdf.com/reader/full/status-watersupply 549/869
Himachal Pradesh
7 Shimla n.a. 1.80
Manipur
8 Imphal 2.43
Meghalaya
9 Shillong n.a.
Mizoram
10 Aizwal n.a.
Nagaland
11 Kohima n.a.
Tripura
12 Agartala 20.00
Andaman & Nicobar Islands
13 Port Blair 5.43
Dadra & Nagar Haveli
14 Silvassa 1.72 1/2"
3/4"
1"
Daman & Diu
15 Daman 2.20 0.70/kl - upto 10 kl
1.50/kl - above 10 kl
Lakshadweep
16 Kavaratti Island There are no water charges in this town
Pondicherry
17 Pondicherry n.a. 0.50
Source: NIUA Survey,1999. * Estimated by respective local governments/authorities
5
2 9
Sl. City/Town Cost of Domestic
No. Production Metered
of water Consumption based rates Ferrule based
(1997-98)* Volumetric Increasing block Ferrule size (R
Rs./Kl rate (Rs./Kl tariff (Rs./month)
month)

7/21/2019 Status Watersupply
http://slidepdf.com/reader/full/status-watersupply 550/869
Himachal Pradesh
7 Shimla
Manipur
8 Imphal
Meghalaya
9 Shillong 1440
Mizoram
10 Aizwal
Nagaland
11 Kohima n.a.
Tripura
12 Agartala
Andaman & Nicobar Islands
13 Port Blair
Dadra & Nagar Haveli
14 Silvassa 1/2" 1800
3/4" 3360
1" 5160
Daman & Diu
15 Daman
Lakshadweep
16 Kavaratti Island
Pondicherry
17 Pondicherry 1.00
5
3 0
Sl. City/Town Non-Domestic
No. Metered Unmetered
Volumetric Increasing block Ferrule based rates Others
rate (Rs./Kl tariff (Rs./month) Ferrule size Rs./year Flat rate
month) (Rs./year

7/21/2019 Status Watersupply
http://slidepdf.com/reader/full/status-watersupply 551/869
Nagaland
11 Kohima
Tripura
12 Agartala
Andaman & Nicobar Islands
13 Port Blair 816
Dadra & Nagar Haveli
14 Silvassa
Daman & Diu
15 Daman Min. charge Rs. 100 0.
1.00/kl - upto 10 kl 1.5
2.00/kl - above 10 kl
Lakshadweep
16 Kavaratti Island
Pondicherry
17 Pondicherry
5
3 1
Sl. City/Town Commercial I
No. Metered Unmetered Metered
Volumetric Increasing block Others
rate (Rs./Kl tariff (Rs./month) Flat rate Volumetric
month) (Rs./year) rate (Rs./Kl
month)
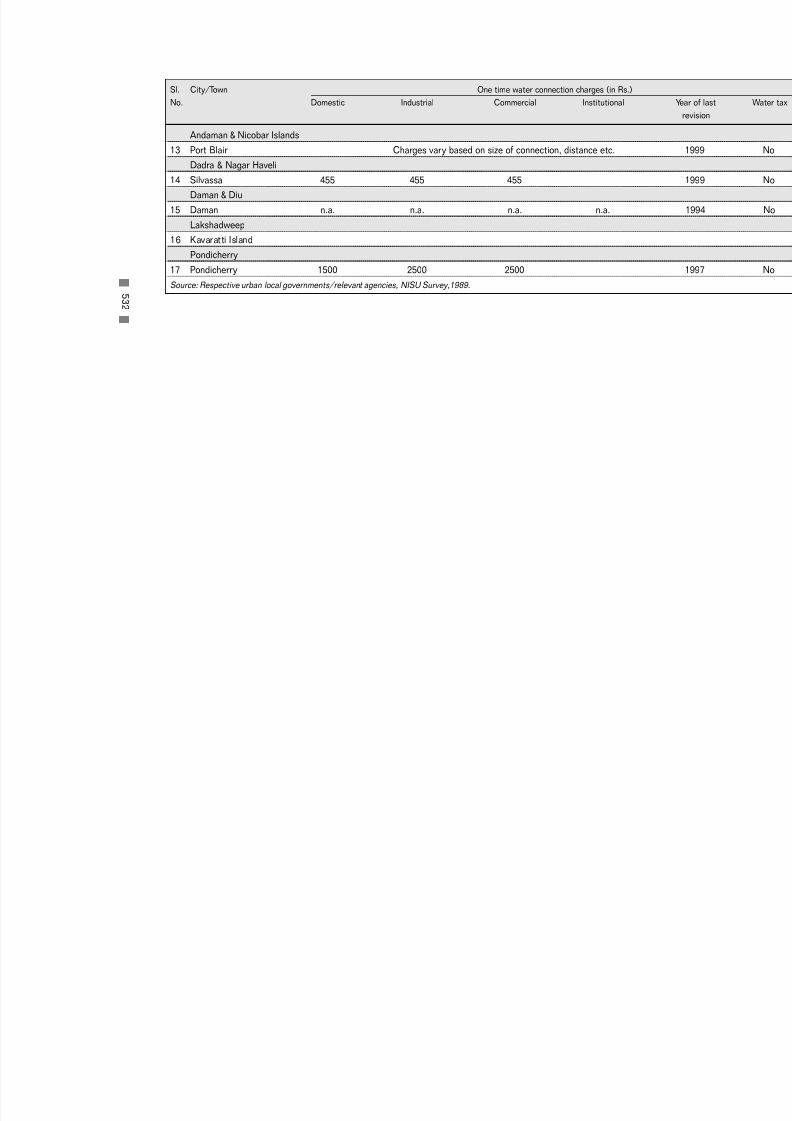
7/21/2019 Status Watersupply
http://slidepdf.com/reader/full/status-watersupply 552/869
Andaman & Nicobar Islands
13 Port Blair Charges vary based on size of connection, distance etc.Dadra & Nagar Haveli
14 Silvassa 455 455 455
Daman & Diu
15 Daman n.a. n.a. n.a. n.a.
Lakshadweep
16 Kavaratti Island
Pondicherry
17 Pondicherry 1500 2500 2500
Source: Respective urban local governments/relevant agencies, NISU Survey,1989. 5
3 2
Sl. City/Town One time water connection charges (in Rs.)
No. Domestic Industrial Commercial Institutional

7/21/2019 Status Watersupply
http://slidepdf.com/reader/full/status-watersupply 553/869
A P P E NDI X I I
WA S T E WA T E R MA NA GE ME NT
A ND
L O W
C O S T S A NI T A T I O N ,1 9 9
9

7/21/2019 Status Watersupply
http://slidepdf.com/reader/full/status-watersupply 554/869

7/21/2019 Status Watersupply
http://slidepdf.com/reader/full/status-watersupply 555/869
Cl a s sI Ci t i e s
5 4 8
Cl a s sI I T own s
5 5 1
B- 3
S
ew a g eT r e a t m en t P r o c e s s an d S ew a g eT r e a t m en t P l an t s ,1 9 9 9
5 5 3
M e t r o p ol i t an Ci t i e s
5 5 5
Cl a s sI Ci t i e s
5 5 6
Cl a s sI I T own s
5 5 9
B-4
W
a s t eW a t er R e c y cl e an d R e u s e ,1 9 9 9
5 6 1
M e t r o p ol i t an Ci t i e s
5 6 3
Cl a s sI Ci t i e s
5 6 4
Cl a s sI I T own s
5 6 6
B- 5
I n s t i t u t i on al Ar r an g em en t s an d
S t af f P o si t i on ,1 9 9 9
5 6 7
M e t r o p ol i t an Ci t i e s
5 6 9
Cl a s sI Ci t i e s
5 7 0
Cl a s sI I T own s
5 7 3
B- 6
D
e t ai l s of P r i v a t i s a t i oni nW a s t eW a t er T r e a t m en t ,1 9 9 9
5 7 5
M e t r o p ol i t an Ci t i e s
5 7 7
Cl a s sI Ci t i e s
5 7 7
B-7
C
a pi t al W or k s Un d er t ak en si n c
e ,1 9 9 4
5 7 9
M e t r o p ol i t an Ci t i e s
5 8 1
Cl a s sI Ci t i e s
5 8 3
Cl a s sI I T own s
5 8 6
B- 8
C
a pi t al W or k sP r o p o s e d t o b e
Un d er t ak eni nF u t ur e
5 8 7
M e t r o p ol i t an Ci t i e s
5 8 9
Cl a s sI Ci t i e s
5 9 0
Cl a s sI I T own s
5 9 1

7/21/2019 Status Watersupply
http://slidepdf.com/reader/full/status-watersupply 556/869
B-11
C
o s t R e c ov er y ,1 9 97- 9 8
6 0 9
M e t r o p ol i t an Ci t i e s
6 1 1
Cl a s sI Ci t i e s
6 1 2
Cl a s sI I T own s
6 1 5
B-1 2
P
o p ul a t i on c ov er e d b y S af e S a
ni t a t i on
6 1 7
M e t r o p ol i t an Ci t i e s
6 1 9
Cl a s sI Ci t i e s
6 2 0
Cl a s sI I T own s
6 2 6
B-1 3
N
o. of I n d i vi d u al an d C omm uni t yT oi l e t s
6 3 1
M e t r o p ol i t an Ci t i e s
6 3 3
Cl a s sI Ci t i e s
6 3 4
Cl a s sI I T own s
6 3 9
7/21/2019 Status Watersupply
http://slidepdf.com/reader/full/status-watersupply 557/869
B -1
P
OP UL A T I O NA N
DA R E A C O V E R E
DB Y
S E WE R A GE
S Y S T E M ,1 9 9 9

7/21/2019 Status Watersupply
http://slidepdf.com/reader/full/status-watersupply 558/869

7/21/2019 Status Watersupply
http://slidepdf.com/reader/full/status-watersupply 559/869
5 3 9
METROPOLITAN CITIES
1 Ahmedabad M.Corp. 3,500 2,800 80 190.84
2 Bangalore M.Corp. 5,000 3,900 78 482.00
3 Bhopal M.Corp. 1,500 200 13 256.00
4 Calcutta M.Corp. 4,870 2,200 45 187.33
5 Chennai M.Corp. 4,363 4,100 94 172.00
6 Coimbatore M.Corp. 971 270 28 105.60
7 Delhi M.Corp. 12,000 8,500 71 1485.00
8 Greater Mumbai M.Corp. 11,100 8,400 76 437.71
9 Hyderabad M.Corp. 4,163 2,350 56 172.00
10 Indore M.Corp. 1,600 640 40 137.17
11 Jaipur M.Corp. 2,000 1,000 50 200.40
12 Kanpur M.Corp. 2,500 1,500 60 227.67
13 Kochi M.Corp. 680 20 3 94.88
14 Lucknow M.Corp. 2,500 800 32 310.00
15 Ludhiana M.Corp. 2,000 1,200 60 165.00
16 Madurai M.Corp. 1,020 350 34 51.96
17 Nagpur M.Corp. 2,100 1,260 60 217.56
18 Pune M.Corp. 2,300 1,732 75 416.00
19 Surat M.Corp. 2,300 1,200 52 112.28
20 Vadodara M.Corp. 1,400 875 63 108.2621 Varanasi M.Corp. 1,150 700 61 73.89
22 Visakhapatnam M.Corp. 1,280 90 7 107.00
Total - Metropolitan Cities 70,297 44,087 63 5,711
Source: Respective urban local governments/relevant agencies, NIUA Survey,1999.
B-1 : Population and Area covered by Sewerage System - 1999
Sl. City/Town Population ('000) % Population Area (Sq.kNo 1999 Covered by covered 1999 C
service by service
1 2 3 4 5

7/21/2019 Status Watersupply
http://slidepdf.com/reader/full/status-watersupply 560/869
CLASS I
Andhra Pradesh
1 Eluru M 247 100 40 14.55
2 Guntur MCl 557 100 18 45.79
3 Vijaywada M.Corp. 837 293 35 58.00
Gujarat
4 Anand M 175 105 60 23.14
5 Bhavnagar M.Corp. 550 300 55 53.40
6 Bhuj M 118 106 90 9.49
7 Nadiad M 300 140 47 36.87
8 Navsari M 139 118 85 8.55
9 Rajkot M.Corp. 1,000 550 55 104.86Haryana
10 Ambala MCl 141 18 13 16.94
11 Faridabad M.Corp. 1,150 633 55 208.00
12 Gurgaon MCl 175 109 62 16.57
13 Hissar MCl 250 130 52 45.42
14 Rohtak MCl 243 183 75 28.38
Karnataka
15 Bellary CMC 297 129 43 81.95
16 Mangalore M.Corp. 410 250 61 116.77
17 Mysore M.Corp. 1,050 400 38 100.00
18 Shimoga CMC 222 81 36 50.00
Madhya Pradesh
19 Gwalior M.Corp. 900 516 57 166.83
20 Morena M 125 16 13 12.00
21 Shivpuri M 140 5 4 81.10
5 4 0
Sl. City/Town Population ('000) % Population Area (Sq.kNo 1999 Covered by covered 1999 C
service by service
1 2 3 4 5

7/21/2019 Status Watersupply
http://slidepdf.com/reader/full/status-watersupply 561/869
Maharashtra
22 Aurangabad M.Corp. 868 684 79 138.00
23 Dhule MCl 330 150 45 46.46
24 Ichalkaranji MCl 250 198 79 29.91
25 Kolhapur M.Corp. 502 200 40 66.00
26 Nanded Waghala M.Corp. 410 250 61 46.00
27 Nashik M.Corp. 839 500 60 259.13
28 Solapur M.Corp. 900 810 90 233.00
Orissa
29 Bhubaneswar M.Corp. 654 200 31 231.24
Punjab
30 Amritsar M.Corp. 843 506 60 133.0031 Bathinda MCl 174 69 40 99.00
32 Hoshiarpur MCl 145 87 60 35.00
33 Jalandhar M. Corp. 738 440 60 110.00
34 Moga MCl 148 100 67 18.50
35 Pathankot MCl 195 80 41 22.10
36 Patiala M.Corp. 328 200 61 41.00
Rajasthan
37 Ajmer MCl 550 58 11 220.00
38 Bikaner M 600 126 21 175.76
39 Jodhpur M.Corp. 1,000 327 33 78.57
Tamil Nadu40 Kanchipuram M 157 116 74 11.60
41 Kumbakonam M 147 38 26 12.58
42 Tiruchirapalli M.Corp. 800 80 10 146.90
43 Tirunelveli M.Corp. 414 70 17 108.65
5 4 1
Sl. City/Town Population ('000) % Population Area (Sq.kNo 1999 Covered by covered 1999 C
service by service
1 2 3 4 5

7/21/2019 Status Watersupply
http://slidepdf.com/reader/full/status-watersupply 562/869
44 Tuticorin M 217 40 18 13.47
Uttar Pradesh
45 Aligarh M.Corp. 600 120 20 62.00
46 Allahabad M.Corp. 1,015 600 59 70.05
47 Bareilly M.Corp. 750 300 40 106.43
48 Ghaziabad M.Corp. 887 762 86 200.00
49 Gorakhpur M.Corp. 600 300 50 143.00
50 Hapur MB 200 75 38 14.20
51 Hardwar MB 300 184 61 4.70
52 Mathura MB 400 50 13 25.23
53 Meerut M.Corp. 1,250 315 25 141.94
54 Mirzapur MB 210 153 73 30.59
West Bengal
55 Asansol M.Corp. 315 36 11 127.24
Union Territories
56 Chandigarh M.Corp. 850 850 100 114.00
57 Pondicherry M 290 83 29 20.00
Total - Class I Cities 27,900 13,437 48 4,614
Source: Respective urban local governments/relevant agencies, NIUA Survey,1999.
5 4 2
Sl. City/Town Population ('000) % Population Area (Sq.kNo 1999 Covered by covered 1999 C
service by service
1 2 3 4 5

7/21/2019 Status Watersupply
http://slidepdf.com/reader/full/status-watersupply 563/869
CLASS II
Gujarat
1 Ankleswar M 60 40 67 11.05
2 Dabhoi M 65 7 11 23.82
3 Mahesana M 138 100 72 12.87
Haryana
4 Jind MCl 114 72 63 21.00
5 Kaithal MCl 95 51 54 5.05
6 Rewari MCl 105 65 62 18.43
7 Thanesar MCl 100 65 65 32.25
Karnataka
8 Chikmaglur CMC 100 60 60 27.509 Kolar CMC 112 8 7 21.47
Punjab
10 Ferozepur MCl 93 67 72 11.33
11 Kapurthala M 85 53 63 16.00
12 Mansa MCl 67 33 50 23.47
13 Phagwara MCl 108 49 45 16.00
14 Sangrur MCl 70 49 70 18.00
Tamil Nadu
15 Nagapattinam M 112 28 25 14.90
16 Udhagamandalam M 100 51 51 30.67
Uttar Pradesh17 Etah MB 135 40 30 27.00
18 Roorkee MB 100 60 60 8.12
West Bengal
19 Darjeeling M 93 30 32 10.60
5 4 3
Sl. City/Town Population ('000) % Population Area (Sq.kNo 1999 Covered by covered 1999 C
service by service
1 2 3 4 5

7/21/2019 Status Watersupply
http://slidepdf.com/reader/full/status-watersupply 564/869
Small States
Himachal Pradesh
20 Shimla M.Corp. 111 72 65 28.53
Others (Smaller than Class II towns)
Small States
Goa
21 Panaji MCl 57 30 52 3.70
Total - Class II Towns 2,020 1,029 51 382
Grand Total 100,217 58,553 58 10,706
Source: Respective urban local governments/relevant agencies, NIUA Survey, 1999.
5 4 4
Sl. City/Town Population ('000) % Population Area (Sq.kNo 1999 Covered by covered 1999
service by service
1 2 3 4 5

7/21/2019 Status Watersupply
http://slidepdf.com/reader/full/status-watersupply 565/869
B -2
WA S
T E WA T E R MA NA GE ME NT DE T A I L S ,1 9 9 9

7/21/2019 Status Watersupply
http://slidepdf.com/reader/full/status-watersupply 566/869
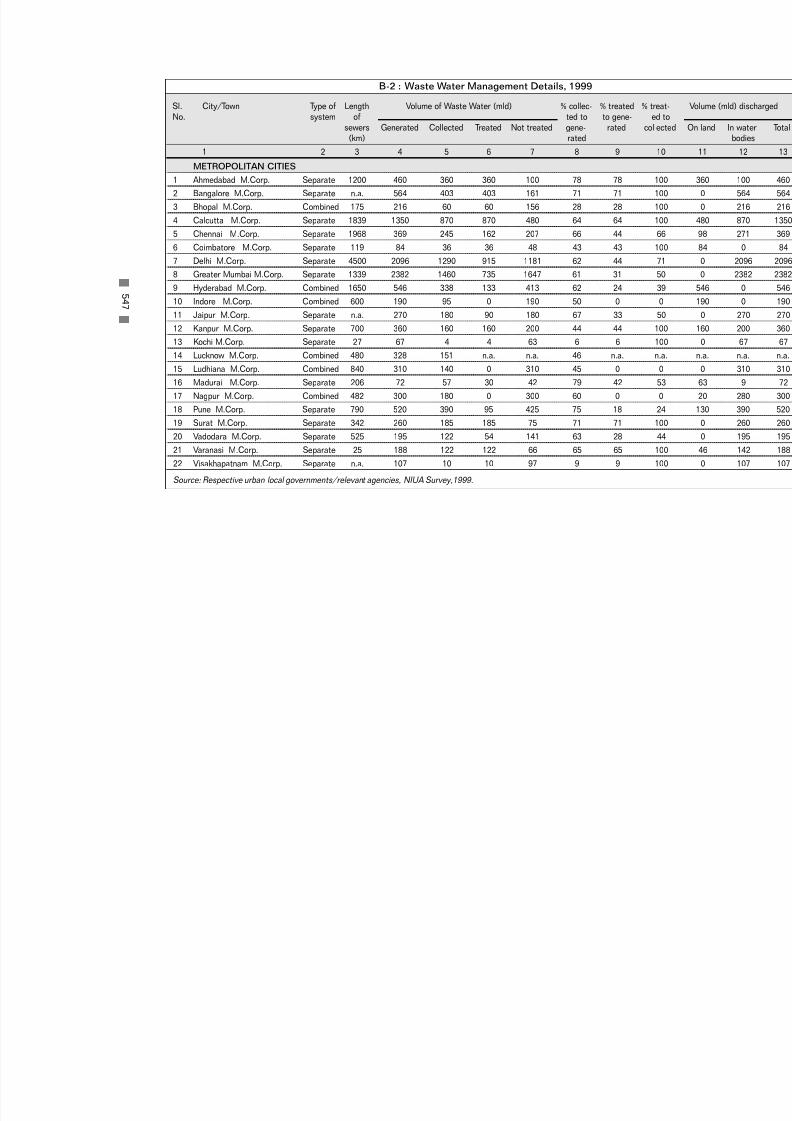
7/21/2019 Status Watersupply
http://slidepdf.com/reader/full/status-watersupply 567/869
METROPOLITAN CITIES
1 Ahmedabad M.Corp. Separate 1200 460 360 360 100 78 78 10
2 Bangalore M.Corp. Separate n.a. 564 403 403 161 71 71 10
3 Bhopal M.Corp. Combined 175 216 60 60 156 28 28 10
4 Calcutta M.Corp. Separate 1839 1350 870 870 480 64 64 10
5 Chennai M.Corp. Separate 1968 369 245 162 207 66 44 6
6 Coimbatore M.Corp. Separate 119 84 36 36 48 43 43 10
7 Delhi M.Corp. Separate 4500 2096 1290 915 1181 62 44 7
8 Greater Mumbai M.Corp. Separate 1339 2382 1460 735 1647 61 31 5
9 Hyderabad M.Corp. Combined 1650 546 338 133 413 62 24 3
10 Indore M.Corp. Combined 600 190 95 0 190 50 0 0
11 Jaipur M.Corp. Separate n.a. 270 180 90 180 67 33 5
12 Kanpur M.Corp. Separate 700 360 160 160 200 44 44 10
13 Kochi M.Corp. Separate 27 67 4 4 63 6 6 10
14 Lucknow M.Corp. Combined 480 328 151 n.a. n.a. 46 n.a. n
15 Ludhiana M.Corp. Combined 840 310 140 0 310 45 0 0
16 Madurai M.Corp. Separate 206 72 57 30 42 79 42 5
17 Nagpur M.Corp. Combined 482 300 180 0 300 60 0 0
18 Pune M.Corp. Separate 790 520 390 95 425 75 18 2
19 Surat M.Corp. Separate 342 260 185 185 75 71 71 10
20 Vadodara M.Corp. Separate 525 195 122 54 141 63 28 4
21 Varanasi M.Corp. Separate 25 188 122 122 66 65 65 1022 Visakhapatnam M.Corp. Separate n.a. 107 10 10 97 9 9 10
Source: Respective urban local governments/relevant agencies, NIUA Survey,1999.
5 4 7
Sl. City/Town Type of Length Volume of Waste Water (mld) % collec- % treated % tre
No. system of ted to to gene- ed
sewers Generated Collected Treated Not treated gene- rated colle(km) rated
1 2 3 4 5 6 7 8 9 1
B-2 : Waste Water Management Details, 1999

7/21/2019 Status Watersupply
http://slidepdf.com/reader/full/status-watersupply 568/869
CLASS IAndhra Pradesh
1 Eluru M Separate 25 19 6 6 13 32 32 10
2 Guntur MCl Combined 95 60 11 4 56 18 7 3
3 Vijaywada M.Corp. Combined 80 117 26 21 96 22 18 7
Gujarat
4 Anand M Combined 750 16 9 9 6 60 60 10
5 Bhavnagar M.Corp. Separate 83 56 31 0 56 55 0 0
6 Bhuj M Separate 12 15 13 13 2 90 90 10
7 Nadiad M Combined 10 17 8 0 17 47 0 0
8 Navsari M Combined 1200 13 11 0 13 85 0 0
9 Rajkot M.Corp. Separate 600 85 47 25 60 55 29 5
Haryana10 Ambala MCl Combined 11 13 11 0 13 88 0 0
11 Faridabad M.Corp. Separate 618 147 112 80 67 76 54 7
12 Gurgaon MCl Separate 102 17 11 11 6 62 62 10
13 Hissar MCl Separate 203 22 13 0 22 59 0 0
14 Rohtak MCl Separate 120 26 19 0 26 75 0 0
Karnataka
15 Bellary CMC Separate 110 24 11 5 19 43 21 4
16 Mangalore M.Corp. Combined 235 68 41 18 50 61 27 4
17 Mysore M.Corp. Separate 41 111 25 4 107 23 3 1
18 Shimoga CMC Separate 220 27 7 0 27 25 0 0
Madhya Pradesh
19 Gwalior M.Corp. Separate 120 120 62 16 104 52 13 2
20 Morena M Separate 5 7 1 0 7 14 0 0
21 Shivpuri M Combined 17 10 3 0 10 30 0 0
Maharashtra
22 Aurangabad M.Corp. Separate 500 134 106 106 28 79 79 10
5 4 8
Sl. City/Town Type of Length Volume of Waste Water (mld) % collec- % treated % tre
No. system of ted to to gene- edsewers Generated Collected Treated Not treated gene- rated colle
(km) rated
1 2 3 4 5 6 7 8 9 1

7/21/2019 Status Watersupply
http://slidepdf.com/reader/full/status-watersupply 569/869
23 Dhule MCl Combined 10 25 12 0 25 48 0 024 Ichalkaranji MCl Combined 71 26 20 20 6 78 78 10
25 Kolhapur M.Corp. Combined 40 80 32 29 51 40 36 9
26 Nanded Waghala M.Corp. Combined 160 31 2 0 31 6 0 0
27 Nashik M.Corp. Combined n.a. 126 75 19 108 60 15 2
28 Solapur M.Corp. Combined 215 100 80 54 46 80 54 6
Orissa
29 Bhubaneswar M.Corp. n.a. 448 92 34 9 83 37 9 2
Punjab
30 Amritsar M.Corp. Combined 416 102 71 0 102 70 0 0
31 Bathinda MCl Separate 101 49 19 0 49 40 0 0
32 Hoshiarpur MCl Separate 113 28 17 0 28 60 0 0
33 Jalandhar M. Corp. Separate 470 140 67 0 140 48 0 0
34 Moga MCl Separate 13 16 11 0 16 67 0 0
35 Pathankot MCl Combined 120 14 6 0 14 41 0 0
36 Patiala M.Corp. Separate 199 48 29 0 48 60 0 0
Rajasthan
37 Ajmer MCl Separate 9 42 4 0 42 11 0 0
38 Bikaner M Combined 72 54 11 0 54 21 0 0
39 Jodhpur M.Corp. Separate 229 141 46 0 141 33 0 0
Tamil Nadu
40 Kanchipuram M Combined 79 13 10 0 13 74 0 0
41 Kumbakonam M Combined 23 8 4 4 5 41 41 10
42 Tiruchirapalli M.Corp. Combined 147 70 4 4 66 6 6 10
43 Tirunelveli M.Corp. Separate 32 27 0.5 0 27 2 0 0
44 Tuticorin M Separate 16 13 3 1.5 11 24 12 5
Uttar Pradesh
45 Aligarh M.Corp. Combined 35 37 7 0 37 20 0 0
5 4 9
Sl. City/Town Type of Length Volume of Waste Water (mld) % collec- % treated % tre
No. system of ted to to gene- edsewers Generated Collected Treated Not treated gene- rated colle
(km) rated
1 2 3 4 5 6 7 8 9 1

7/21/2019 Status Watersupply
http://slidepdf.com/reader/full/status-watersupply 570/869
46 Allahabad M.Corp. Combined 450 168 99 60 108 59 36 647 Bareilly M.Corp. Separate 149 64 26 0 64 40 0 0
48 Ghaziabad M.Corp. Separate 500 129 126 111 18 98 86 8
49 Gorakhpur M.Corp. Separate 20 59 30 0 59 50 0 0
50 Hapur MB Separate 16 11 5 0 11 49 0 0
51 Hardwar MB Separate 92 39 24 18 21 61 46 7
52 Mathura MB Combined 6 21 20 20 1 94 94 10
53 Meerut M.Corp. Combined 155 106 40 0 106 38 0 0
54 Mirzapur MB Combined 15 20 14 14 6 70 70 10
West Bengal
55 Asansol M.Corp. Separate 5 42 5 0 42 11 0 0
Union Territories
56 Chandigarh M.Corp. Separate 890 207 157 136 71 76 66 8
57 Pondicherry M Separate 15 27 10 10 17 37 37 10
Source: Respective urban local governments/relevant agencies, NIUA Survey,1999.
5 5 0
Sl. City/Town Type of Length Volume of Waste Water (mld) % collec- % treated % tre
No. system of ted to to gene- edsewers Generated Collected Treated Not treated gene- rated colle
(km) rated
1 2 3 4 5 6 7 8 9 1

7/21/2019 Status Watersupply
http://slidepdf.com/reader/full/status-watersupply 571/869
CLASS IIGujarat
1 Ankleswar M Combined 28 8 4 0 8 53 0 0
2 Dabhoi M Combined 17 7 6 0 7 83 0 0
3 Mahesana M Combined 40 12 9 0 12 72 0 0
Haryana
4 Jind MCl Separate 65 13 8 0 13 63 0 0
5 Kaithal MCl Separate 40 9 5 0 9 54 0 0
6 Rewari MCl Separate 20 10 6 0 10 62 0 0
7 Thanesar MCl Separate 37 11 7 0 11 65 0 0
Karnataka
8 Chikmaglur CMC Separate 40 12 7 0 12 60 0 0
9 Kolar CMC Separate 10 6 4 4 2 63 63 10
Punjab
10 Ferozepur MCl Combined 78 16 13 0 16 81 0 0
11 Kapurthala M Combined 59 11 7 0 11 63 0 0
12 Mansa MCl n.a. 34 6 5 0 6 80 0 0
13 Phagwara MCl Separate 74 12 5 0 12 45 0 0
14 Sangrur MCl Separate 57 10 7 0 10 70 0 0
Tamil Nadu
15 Nagapattinam M Separate 108 6 1.6 1.6 5 25 25 10
16 Udhagamandalam M Separate 17 5 4 4 1 81 81 10
Uttar Pradesh
17 Etah MB Combined 5 3 0.8 0 3 24 0 0
18 Roorkee MB Combined 15 15 9 9 6 60 60 10
5 5 1
Sl. City/Town Type of Length Volume of Waste Water (mld) % collec- % treated % tre
No. system of ted to to gene- edsewers Generated Collected Treated Not treated gene- rated colle
(km) rated
1 2 3 4 5 6 7 8 9 1

7/21/2019 Status Watersupply
http://slidepdf.com/reader/full/status-watersupply 572/869
West Bengal19 Darjeeling M Separate 90 5 1.5 0 5 32 0.3
Small States
Himachal Pradesh
20 Shimla M.Corp. Separate 65 22 21 0 22 95 0 0
Others (Smaller than Class II towns)
Small States
Goa
21 Panaji MCl Separate 25 9 5 5 4 52 52 10
Source: Respective urban local governments/relevant agencies, NIUA Survey, 1999.
5 5 2
Sl. City/Town Type of Length Volume of Waste Water (mld) % collec- % treated % tre
No. system of ted to to gene- edsewers Generated Collected Treated Not treated gene- rated colle
(km) rated
1 2 3 4 5 6 7 8 9 1

7/21/2019 Status Watersupply
http://slidepdf.com/reader/full/status-watersupply 573/869
B - 3
S E W
A GE T R E A T ME NT
P R O C E S S A ND
S E WA GE
T R E A T ME NT P L A NT S ,1 9 9 9

7/21/2019 Status Watersupply
http://slidepdf.com/reader/full/status-watersupply 574/869
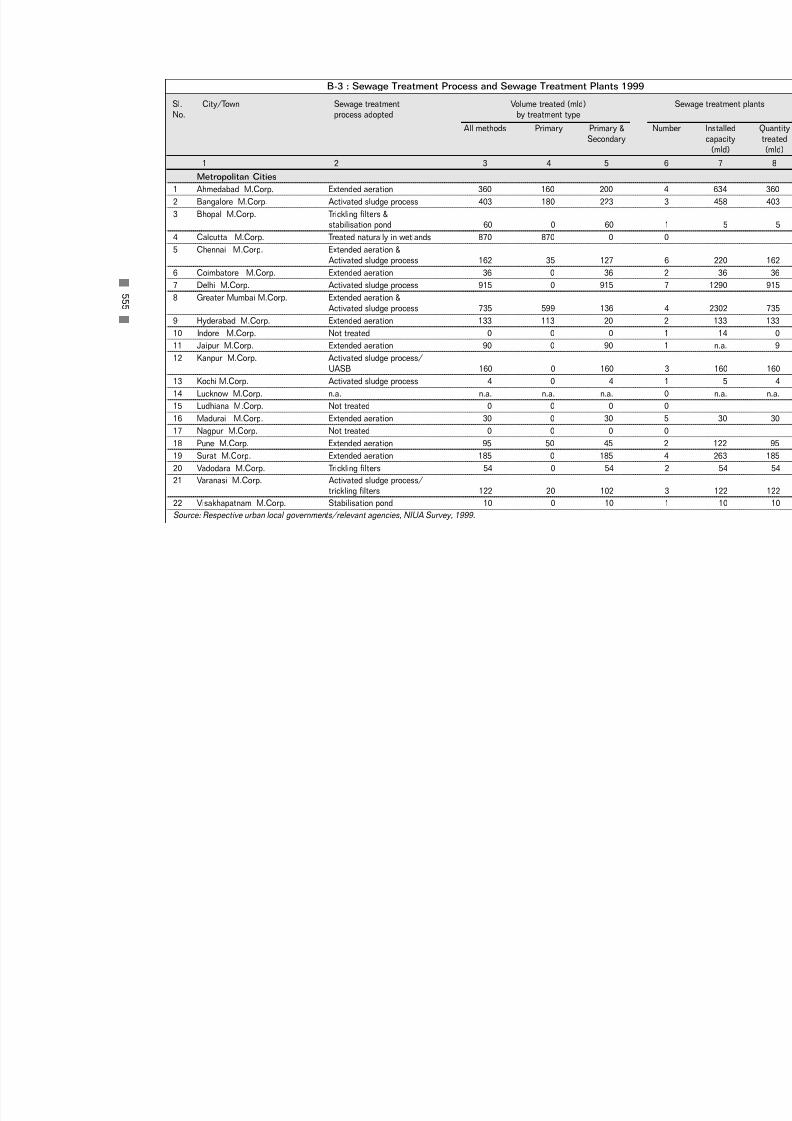
7/21/2019 Status Watersupply
http://slidepdf.com/reader/full/status-watersupply 575/869
Metropolitan Cities
1 Ahmedabad M.Corp. Extended aeration 360 160 200
2 Bangalore M.Corp. Activated sludge process 403 180 223
3 Bhopal M.Corp. Trickling filters &stabilisation pond 60 0 60
4 Calcutta M.Corp. Treated naturally in wetlands 870 870 0
5 Chennai M.Corp. Extended aeration &
Activated sludge process 162 35 127
6 Coimbatore M.Corp. Extended aeration 36 0 36
7 Delhi M.Corp. Activated sludge process 915 0 915
8 Greater Mumbai M.Corp. Extended aeration &Activated sludge process 735 599 136
9 Hyderabad M.Corp. Extended aeration 133 113 20
10 Indore M.Corp. Not treated 0 0 0
11 Jaipur M.Corp. Extended aeration 90 0 90
12 Kanpur M.Corp. Activated sludge process/
UASB 160 0 160
13 Kochi M.Corp. Activated sludge process 4 0 4
14 Lucknow M.Corp. n.a. n.a. n.a. n.a.
15 Ludhiana M.Corp. Not treated 0 0 0
16 Madurai M.Corp. Extended aeration 30 0 30
17 Nagpur M.Corp. Not treated 0 0 0
18 Pune M.Corp. Extended aeration 95 50 45
19 Surat M.Corp. Extended aeration 185 0 185
20 Vadodara M.Corp. Trickling filters 54 0 54
21 Varanasi M.Corp. Activated sludge process/trickling filters 122 20 102
22 Visakhapatnam M.Corp. Stabilisation pond 10 0 10
Source: Respective urban local governments/relevant agencies, NIUA Survey, 1999.
5 5 5
Sl. City/Town Sewage treatment Volume treated (mld)No. process adopted by treatment type
All methods Primary Primary & Nu
Secondary
1 2 3 4 5
B-3 : Sewage Treatment Process and Sewage Treatment Plants 1999

7/21/2019 Status Watersupply
http://slidepdf.com/reader/full/status-watersupply 576/869
CLASS I
Andhra Pradesh
1 Eluru M Stabilisation pond 6 0 6
2 Guntur MCl Extended aeration 4 0 4
3 Vijaywada M.Corp. Extended aeration &Activated sludge process 21 0 21
Gujarat
4 Anand M Extended aeration 9 0 9
5 Bhavnagar M.Corp. Not treated 0 0 0
6 Bhuj M Extended aeration 13 0 13
7 Nadiad M Not treated 0 0 0
8 Navsari M Not treated 0 0 0
9 Rajkot M.Corp. Extended aeration 25 0 25
Haryana
10 Ambala MCl Not treated 0 0 0
11 Faridabad M.Corp. Up-flow anaerobic
sludge blanket 80 0 80
12 Gurgaon MCl Up-flow anaerobicsludge blanket 11 0 11
13 Hissar MCl Not treated 0 0 0
14 Rohtak MCl Not treated 0 0 0
Karnataka
15 Bellary CMC Extended aeration 5 0 516 Mangalore M.Corp. n.a. 18 18 0
17 Mysore M.Corp. Stabilisation pond 4 0 4
18 Shimoga CMC Not treated 0 0 0
Madhya Pradesh
19 Gwalior M.Corp. Extended aeration 16 0 16
5 5 6
Sl. City/Town Sewage treatment Volume treated (mld)
No. process adopted by treatment type
All methods Primary Primary & NuSecondary
1 2 3 4 5

7/21/2019 Status Watersupply
http://slidepdf.com/reader/full/status-watersupply 577/869
20 Morena M Not treated 0 0 0
21 Shivpuri M Not treated 0 0 0
Maharashtra
22 Aurangabad M.Corp. Extended aeration 106 0 106
23 Dhule MCl Not treated 0 0 0
24 Ichalkaranji MCl Extended aeration 20 0 20
25 Kolhapur M.Corp. Activated sludge process 29 0 29
26 Nanded Waghala M.Corp. Not treated 0 0 0
27 Nashik M.Corp. Extended aeration 19 0 19
28 Solapur M.Corp. Activated sludge process 54 0 54
Orissa
29 Bhubaneswar M.Corp. Extended aeration 9 5 4
Punjab
30 Amritsar M.Corp. Not treated 0 0 0
31 Bathinda MCl Not treated 0 0 0
32 Hoshiarpur MCl Not treated 0 0 0
33 Jalandhar M. Corp. Not treated 0 0 0
34 Moga MCl Not treated 0 0 0
35 Pathankot MCl Not treated 0 0 0
36 Patiala M.Corp. Not treated 0 0 0
Rajasthan
37 Ajmer MCl Not treated 0 0 0
38 Bikaner M Not treated 0 0 0
39 Jodhpur M.Corp. Not treated 0 0 0
Tamil Nadu
40 Kanchipuram M Not treated 4 0 0
41 Kumbakonam M Extended aeration 4 0 4
5 5 7
Sl. City/Town Sewage treatment Volume treated (mld)
No. process adopted by treatment type
All methods Primary Primary & NuSecondary
1 2 3 4 5
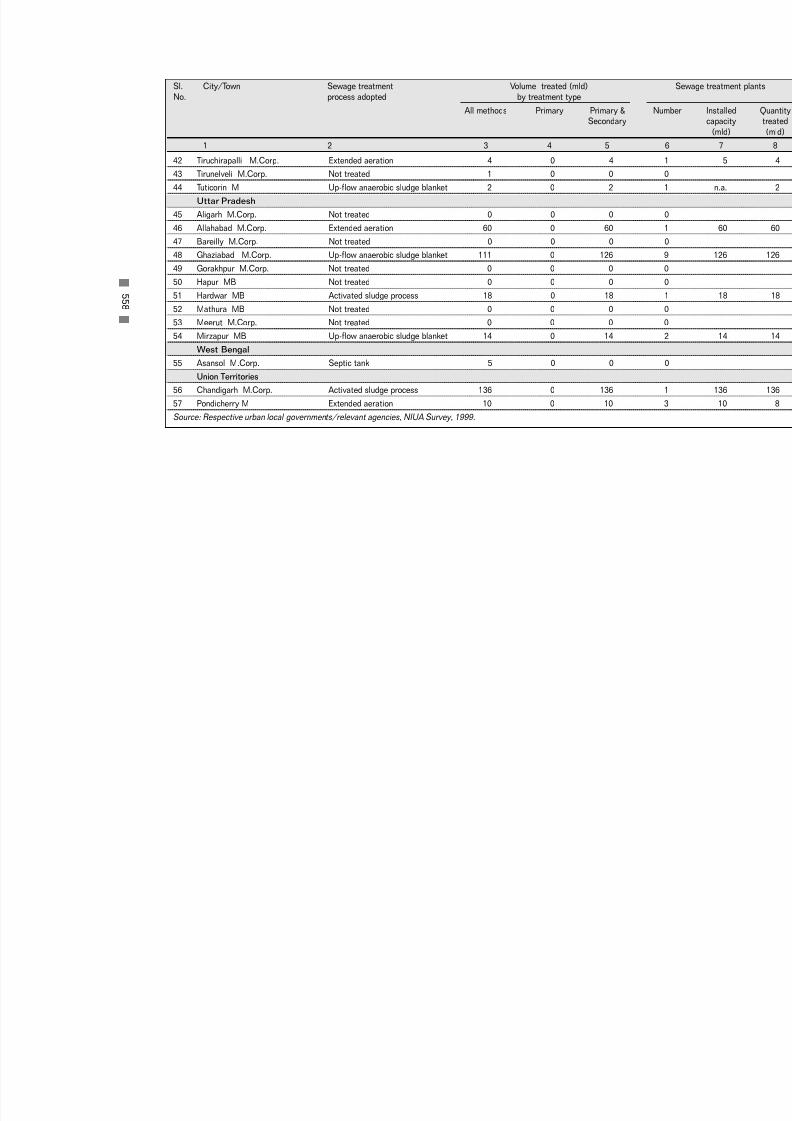
7/21/2019 Status Watersupply
http://slidepdf.com/reader/full/status-watersupply 578/869
42 Tiruchirapalli M.Corp. Extended aeration 4 0 4
43 Tirunelveli M.Corp. Not treated 1 0 0
44 Tuticorin M Up-flow anaerobic sludge blanket 2 0 2
Uttar Pradesh
45 Aligarh M.Corp. Not treated 0 0 0
46 Allahabad M.Corp. Extended aeration 60 0 60
47 Bareilly M.Corp. Not treated 0 0 0
48 Ghaziabad M.Corp. Up-flow anaerobic sludge blanket 111 0 126
49 Gorakhpur M.Corp. Not treated 0 0 0
50 Hapur MB Not treated 0 0 0
51 Hardwar MB Activated sludge process 18 0 18
52 Mathura MB Not treated 0 0 0
53 Meerut M.Corp. Not treated 0 0 0
54 Mirzapur MB Up-flow anaerobic sludge blanket 14 0 14
West Bengal
55 Asansol M.Corp. Septic tank 5 0 0
Union Territories
56 Chandigarh M.Corp. Activated sludge process 136 0 136
57 Pondicherry M Extended aeration 10 0 10
Source: Respective urban local governments/relevant agencies, NIUA Survey, 1999.
5 5 8
Sl. City/Town Sewage treatment Volume treated (mld)
No. process adopted by treatment type
All methods Primary Primary & NuSecondary
1 2 3 4 5

7/21/2019 Status Watersupply
http://slidepdf.com/reader/full/status-watersupply 579/869
CLASS II
Gujarat
1 Ankleswar M Not treated 4 0 0
2 Dabhoi M Not treated 0 0 0
3 Mahesana M Not treated 0 0 0
Haryana
4 Jind MCl Not treated 0 0 0
5 Kaithal MCl Not treated 0 0 0
6 Rewari MCl Not treated 0 0 0
7 Thanesar MCl Not treated 0 0 0
Karnataka
8 Chikmaglur CMC Not treated 0 0 0
9 Kolar CMC Not treated 4 0 0
Punjab
10 Ferozepur MCl Not treated 0 0 0
11 Kapurthala M Not treated 0 0 0
12 Mansa MCl Not treated 0 0 0
13 Phagwara MCl Not treated 0 0 0
5 5 9
Sl. City/Town Sewage treatment Volume treated (mld)
No. process adopted by treatment type
All methods Primary Primary & NuSecondary
1 2 3 4 5

7/21/2019 Status Watersupply
http://slidepdf.com/reader/full/status-watersupply 580/869
14 Sangrur MCl Not treated 0 0 0
Tamil Nadu
15 Nagapattinam M Extended aeration 2 0 2
16 Udhagamandalam M Activated sludge process 4 0 4
Uttar Pradesh
17 Etah MB Not treated 0 0 0
18 Roorkee MB Extended aeration 9 0 9
West Bengal
19 Darjeeling M Septic tank 0 0 0
Small States
Himachal Pradesh
20 Shimla M.Corp. Not treated 0 0 0
Others (Smaller than Class II towns)
Small States
Goa
21 Panaji MCl Trickling filters 5 0 5
Source: Respective urban local governments/relevant agencies, NIUA Survey, 1999.
5 6 0
Sl. City/Town Sewage treatment Volume treated (mld)
No. process adopted by treatment type
All methods Primary Primary & NuSecondary
1 2 3 4 5
7/21/2019 Status Watersupply
http://slidepdf.com/reader/full/status-watersupply 581/869
B -4
WA
S T E WA T E R R E C Y C L E A NDR E U S E ,1 9 9 9

7/21/2019 Status Watersupply
http://slidepdf.com/reader/full/status-watersupply 582/869
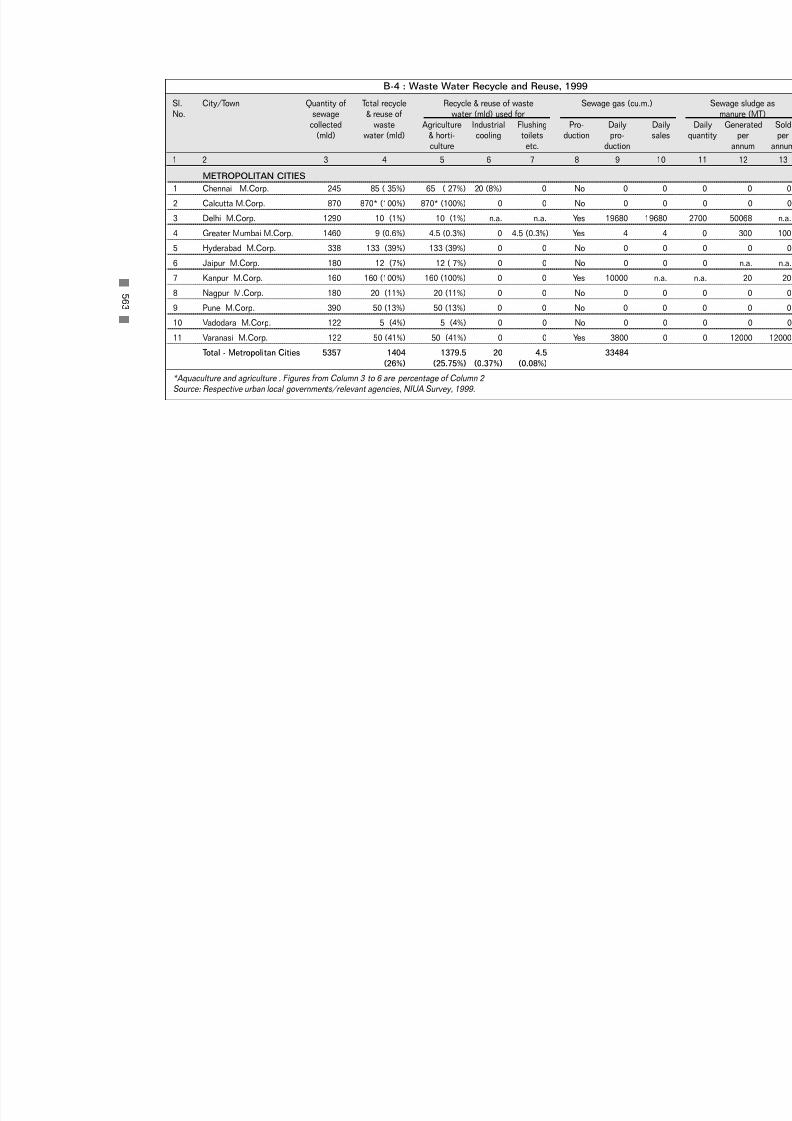
7/21/2019 Status Watersupply
http://slidepdf.com/reader/full/status-watersupply 583/869
METROPOLITAN CITIES
1 Chennai M.Corp. 245 85 ( 35%) 65 ( 27%) 20 (8%) 0 No 0
2 Calcutta M.Corp. 870 870* (100%) 870* (100%) 0 0 No 0
3 Delhi M.Corp. 1290 10 (1%) 10 (1%) n.a. n.a. Yes 19680 1968
4 Greater Mumbai M.Corp. 1460 9 (0.6%) 4.5 (0.3%) 0 4.5 (0.3%) Yes 4
5 Hyderabad M.Corp. 338 133 (39%) 133 (39%) 0 0 No 0
6 Jaipur M.Corp. 180 12 (7%) 12 ( 7%) 0 0 No 0
7 Kanpur M.Corp. 160 160 (100%) 160 (100%) 0 0 Yes 10000 n.
8 Nagpur M.Corp. 180 20 (11%) 20 (11%) 0 0 No 0
9 Pune M.Corp. 390 50 (13%) 50 (13%) 0 0 No 0
10 Vadodara M.Corp. 122 5 (4%) 5 (4%) 0 0 No 0
11 Varanasi M.Corp. 122 50 (41%) 50 (41%) 0 0 Yes 3800
Total - Metropolitan Cities 5357 1404 1379.5 20 4.5 33484
(26%) (25.75%) (0.37%) (0.08%)
*Aquaculture and agriculture . Figures from Column 3 to 6 are percentage of Column 2
Source: Respective urban local governments/relevant agencies, NIUA Survey, 1999.
5 6 3
Sl. City/Town Quantity of Total recycle Recycle & reuse of waste Sewage gas (cu.m.)
No. sewage & reuse of water (mld) used for
collected waste Agriculture Industrial Flushing Pro- Daily Da(mld) water (mld) & horti- cooling toilets duction pro- sa
culture etc. duction1 2 3 4 5 6 7 8 9 1
B-4 : Waste Water Recycle and Reuse, 1999

7/21/2019 Status Watersupply
http://slidepdf.com/reader/full/status-watersupply 584/869
CLASS I
Andhra Pradesh
1 Guntur MCl 10.8 10.8 (100%) 10.8 (100%) 0 0 No 0
2 Vijaywada M.Corp. 26.0 26.0 (100%) 26.0 (100%) 0 0 No 0
Gujarat
3 Bhuj M 13.5 13.5 (100%) 13.5 (100%) 0 0 No 0
4 Nadiad M 7.8 4.0 ( 51%) 4.0 ( 51%) 0 0 No 0
5 Rajkot M.Corp. 46.9 25.0 ( 53%) 25.0 ( 53%) 0 0 No 0
Haryana
6 Gurgaon MCl 10.6 10.6 (100%) 10.6 (100%) 0 0 No 0
Madhya Pradesh
7 Gwalior M.Corp. 61.8 2.3 ( 4%) 2.3 ( 4%) 0 0 No 0
8 Shivpuri M 3.1 3.1 (100%) 3.1 (100%) 0 0 No 0
Maharashtra
9 Dhule MCl 12.0 9.0 ( 75%) 9.0 ( 75%) 0 0 No 0
10 Kolhapur M.Corp. 31.9 29.0 ( 91%) 29.0 ( 91%) 0 0 No 0
Punjab
11 Hoshiarpur MCl 16.5 2.5 ( 15%) 2.5 ( 15%) 0 0 No 0
12 Moga MCl 10.8 3.6 ( 33%) 3.6 ( 33%) 0 0 No 0
13 Pathankot MCl 5.6 5.0 ( 90%) 5.0 ( 90%) 0 0 No 0
Rajasthan
14 Jodhpur M.Corp. 46.1 17.0 ( 37%) 17.0 ( 37%) 0 0 No 0
Tamil Nadu
15 Kanchipuram 9.7 4.4* ( 45%) 4.4* ( 45%) 0 0 No 0
16 Tiruchirapalli M.Corp. 4.0 4.0 (100%) 4.0 (100%) 0 0 No 0
Uttar Pradesh
17 Allahabad M.Corp. 99.3 60.0 ( 60%) 60.0 ( 60%) 0 0 No 0
5 6 4
Sl. City/Town Quantity of Total recycle Recycle & reuse of waste Sewage gas (cu.m.)
No. sewage & reuse of water (mld) used forcollected waste Agriculture Industrial Flushing Pro- Daily Da
(mld) water (mld) & horti- cooling toilets duction pro- saculture etc. duction
1 2 3 4 5 6 7 8 9 1

7/21/2019 Status Watersupply
http://slidepdf.com/reader/full/status-watersupply 585/869
18 Bareilly M.Corp. 25.6 15.0 ( 59%) 15.0 ( 59%) 0 0 No 0
19 Ghaziabad M.Corp. 126.0 3.0 ( 2%) 3.0 ( 2%) 0 0 No 0
20 Hapur MB 5.4 3.4 ( 62%) 3.4 ( 62%) 0 0 No 0
21 Hardwar MB 23.9 9.0 ( 38%) 9.0 ( 38%) 0 0 Yes 600
22 Mathura MB 20.0 7.0 ( 35%) 7.0 ( 35%) 0 0 No 0
23 Mirzapur MB 14.0 4.2 ( 30%) 4.2 ( 30%) 0 0 Yes 200
Union Territories
24 Chandigarh M.Corp. 156.6 156.6 (100%) 156.6 (100%) 0 0 No 0
25 Pondicherry M 10.0 8.3 ( 83%) 8.3 ( 83%) 0 0 No 0
Total - Class I Cities 797.9 436.0 ( 55%) 436.0 ( 55%) 0 10 800
*Aquaculture and agriculture . Figures from Column 3 to 6 are percentage of Column 2 Source: Respective urban local governments/relevant agencies, NIUA Survey, 1999.
5 6 5
Sl. City/Town Quantity of Total recycle Recycle & reuse of waste Sewage gas (cu.m.)
No. sewage & reuse of water (mld) used forcollected waste Agriculture Industrial Flushing Pro- Daily Da
(mld) water (mld) & horti- cooling toilets duction pro- saculture etc. duction
1 2 3 4 5 6 7 8 9 1
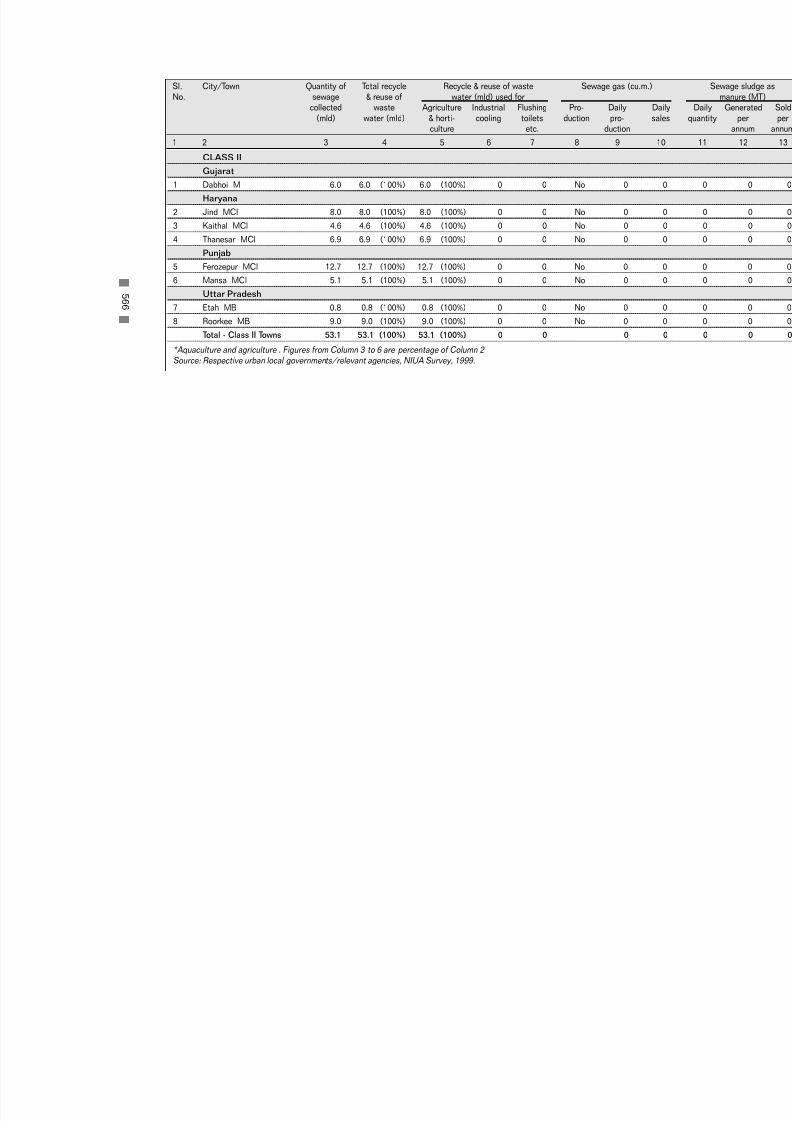
7/21/2019 Status Watersupply
http://slidepdf.com/reader/full/status-watersupply 586/869
CLASS II
Gujarat
1 Dabhoi M 6.0 6.0 (100%) 6.0 (100%) 0 0 No 0
Haryana
2 Jind MCl 8.0 8.0 (100%) 8.0 (100%) 0 0 No 0
3 Kaithal MCl 4.6 4.6 (100%) 4.6 (100%) 0 0 No 0
4 Thanesar MCl 6.9 6.9 (100%) 6.9 (100%) 0 0 No 0
Punjab
5 Ferozepur MCl 12.7 12.7 (100%) 12.7 (100%) 0 0 No 0
6 Mansa MCl 5.1 5.1 (100%) 5.1 (100%) 0 0 No 0
Uttar Pradesh
7 Etah MB 0.8 0.8 (100%) 0.8 (100%) 0 0 No 0
8 Roorkee MB 9.0 9.0 (100%) 9.0 (100%) 0 0 No 0
Total - Class II Towns 53.1 53.1 (100%) 53.1 (100%) 0 0 0
*Aquaculture and agriculture . Figures from Column 3 to 6 are percentage of Column 2
Source: Respective urban local governments/relevant agencies, NIUA Survey, 1999.
5 6 6
Sl. City/Town Quantity of Total recycle Recycle & reuse of waste Sewage gas (cu.m.)
No. sewage & reuse of water (mld) used forcollected waste Agriculture Industrial Flushing Pro- Daily Da
(mld) water (mld) & horti- cooling toilets duction pro- saculture etc. duction
1 2 3 4 5 6 7 8 9 1

7/21/2019 Status Watersupply
http://slidepdf.com/reader/full/status-watersupply 587/869
B - 5
I N S
T I T UT I O NA L A R R
A N GE ME NT A ND S T A F F
P O S I T I O N ,1 9 9 9

7/21/2019 Status Watersupply
http://slidepdf.com/reader/full/status-watersupply 588/869

7/21/2019 Status Watersupply
http://slidepdf.com/reader/full/status-watersupply 589/869
METROPOLITAN CITIES1 Ahmedabad M.Corp. M.Corp. 200
2 Bangalore M.Corp. BWS&SB Combined wit
3 Bhopal M.Corp. PHED, Madhya Pradesh 5 28
4 Calcutta M.Corp. C.M.C 32 173
5 Chennai M.Corp. CMWSSB Combined wit
6 Coimbatore M.Corp. M.Corp. Combined wit
7 Delhi M.Corp. DJB Combined wit
8 Greater Mumbai M.Corp. M.Corp. 249 447
9 Hyderabad M.Corp. HMWSSB Combined wit
10 Indore M.Corp. M.Corp. 60 22
11 Jaipur M.Corp. PHED, Rajasthan 7 4
12 Kanpur M.Corp. Jal Sansthan, Kanpur Combined wit
13 Kochi M.Corp. KWA 7 21
14 Lucknow M.Corp. Jal Sansthan, Lucknow 25 100
15 Ludhiana M.Corp. M.Corp.
16 Madurai M.Corp. M.Corp. 49
17 Nagpur M.Corp. M.Corp. 11 15
18 Pune M.Corp. M.Corp. 83 58
19 Surat M.Corp. M.Corp. 6 60
20 Vadodara M.Corp. M.Corp. 9 7
21 Varanasi M.Corp. M.Corp. Jal Nigam &Jal Sansthan, Varanasi Combined w
22 Visakhapatnam M.Corp. M.Corp. Combined w
Source: Respective urban local governments/relevant agencies, NIUA Survey, 1999.
5 6 9
Sl. City/Town Agency responsible for Operation Staff Pos
No. & Maintenance Managerial Technical
1 2 3 4
B-5 : Institutional Arrangement and Staff Position - 1999
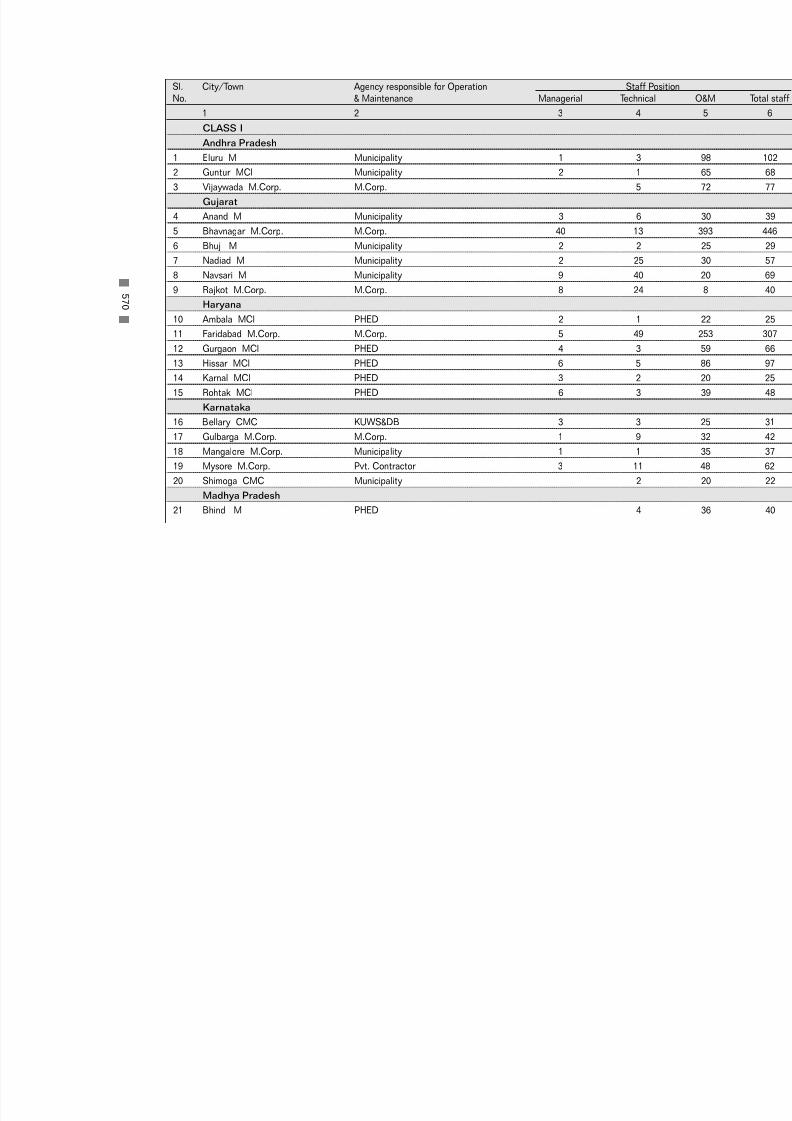
7/21/2019 Status Watersupply
http://slidepdf.com/reader/full/status-watersupply 590/869
CLASS I
Andhra Pradesh
1 Eluru M Municipality 1 3
2 Guntur MCl Municipality 2 1
3 Vijaywada M.Corp. M.Corp. 5
Gujarat
4 Anand M Municipality 3 6
5 Bhavnagar M.Corp. M.Corp. 40 13
6 Bhuj M Municipality 2 2
7 Nadiad M Municipality 2 25
8 Navsari M Municipality 9 40
9 Rajkot M.Corp. M.Corp. 8 24
Haryana
10 Ambala MCl PHED 2 1
11 Faridabad M.Corp. M.Corp. 5 49
12 Gurgaon MCl PHED 4 3
13 Hissar MCl PHED 6 5
14 Karnal MCl PHED 3 2
15 Rohtak MCl PHED 6 3
Karnataka
16 Bellary CMC KUWS&DB 3 3
17 Gulbarga M.Corp. M.Corp. 1 9
18 Mangalore M.Corp. Municipality 1 119 Mysore M.Corp. Pvt. Contractor 3 11
20 Shimoga CMC Municipality 2
Madhya Pradesh
21 Bhind M PHED 4
5 7 0
Sl. City/Town Agency responsible for Operation Staff PosNo. & Maintenance Managerial Technical
1 2 3 4

7/21/2019 Status Watersupply
http://slidepdf.com/reader/full/status-watersupply 591/869
22 Gwalior M.Corp. PHED 1 44
23 Morena M PHED/ Municipality 1
24 Shivpuri M PHED 18 1
Maharashtra
25 Aurangabad M.Corp. Municipality 3 17
26 Dhule MCl MJP 2 2
27 Ichalkaranji MCl Pvt. Contractor Not applicable
28 Kolhapur M.Corp. Municipality 1 3
29 Nanded Waghala M.Corp. Municipality 10 5
30 Nashik M.Corp. Municipality 1 20
31 Solapur M.Corp. PHED 9 9
Orissa
32 Bhubaneswar M.Corp. PHED 56
Punjab
33 Amritsar M.Corp. M.Corp. 71 83
34 Bathinda MCl PWSSB 8
35 Hoshiarpur MCl Municipality 1 1
36 Jalandhar M. Corp. Municipality 35 34
37 Moga MCl Municipality 1 3
38 Pathankot MCl MC 1 2
39 Patiala M.Corp. Municipality 20 10
Rajasthan
40 Ajmer MCl PHED n.a. n.a.41 Bikaner M PHED
42 Jodhpur M.Corp. PHED 12 0
Tamil Nadu
43 Kanchipuram M Municipality 4
5 7 1
Sl. City/Town Agency responsible for Operation Staff PosNo. & Maintenance Managerial Technical
1 2 3 4

7/21/2019 Status Watersupply
http://slidepdf.com/reader/full/status-watersupply 592/869
44 Kumbakonam M Municipality 3
45 Tiruchirapalli M.Corp. Pvt. Contractor Not app
46 Tirunelveli M.Corp. M.Corp. 2
47 Tuticorin M Municipality 4
Uttar Pradesh
48 Aligarh M.Corp. M. Corp. 4 4
49 Allahabad M.Corp. Jal Sansthan, Allahabad 3 0
50 Bareilly M.Corp. M.Corp. 2 2
51 Ghaziabad M.Corp. Yamuna Pollution Control Unit& U.P. Jal Nigam n.a. n.a.
52 Gorakhpur M.Corp. M. Corp. 1 3
53 Hapur MB Municipality 1 2
54 Hardwar MB Ganga Pollution Control Unit &U.P., Jal Nigam Break-up no
55 Mathura MB Municipality 5 6
56 Meerut M.Corp. M.Corp. 4 6
57 Mirzapur MB Ganga Poll. Control Unit &
UP Jal Nigam 6
58 Orai Water works/ Jhansi 2
59 Rae Bareli MB Municipality 3 13
60 Unnao MB Municipality 2 2
West Bengal
61 Asansol M.Corp. M. Corp. 2 2
Union Territories
62 Chandigarh M.Corp. M.Corp. 53 n.a.
63 Pondicherry M PWD 6
Source: Respective urban local governments/relevant agencies, NIUA Survey, 1999.
5 7 2
Sl. City/Town Agency responsible for Operation Staff PosNo. & Maintenance Managerial Technical
1 2 3 4
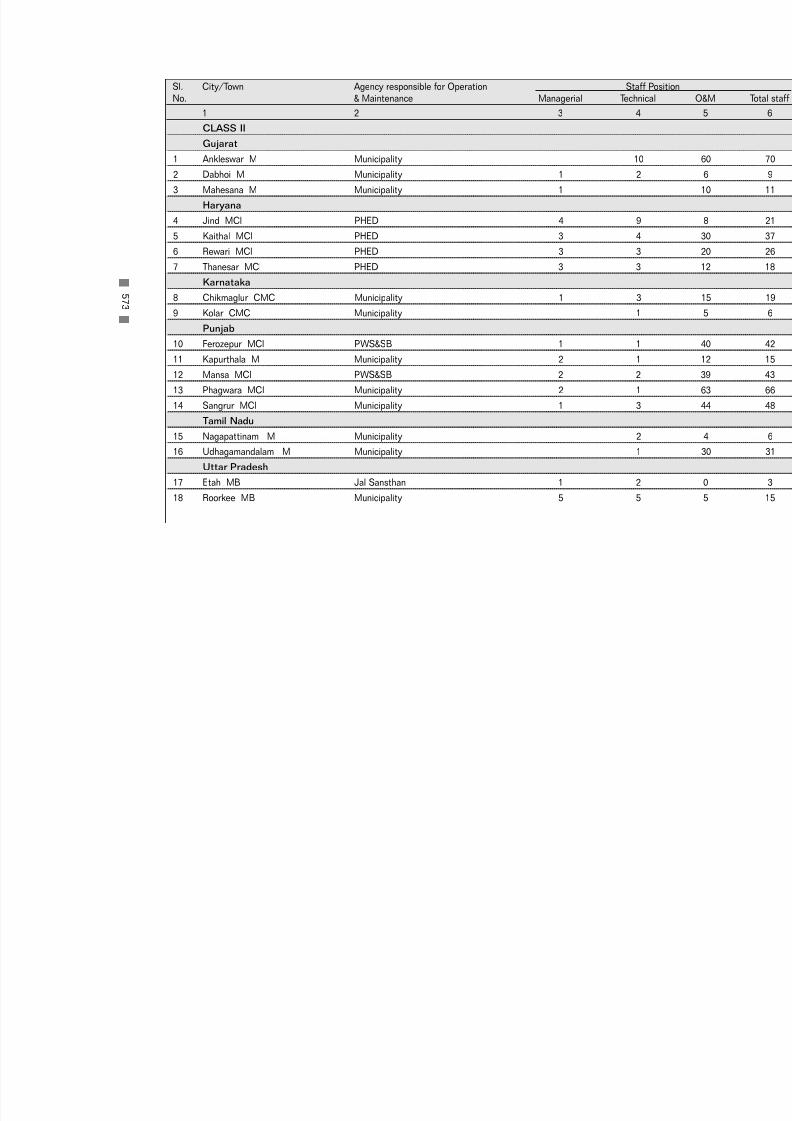
7/21/2019 Status Watersupply
http://slidepdf.com/reader/full/status-watersupply 593/869
CLASS II
Gujarat
1 Ankleswar M Municipality 10
2 Dabhoi M Municipality 1 2
3 Mahesana M Municipality 1
Haryana
4 Jind MCl PHED 4 9
5 Kaithal MCl PHED 3 4
6 Rewari MCl PHED 3 3
7 Thanesar MCl PHED 3 3
Karnataka
8 Chikmaglur CMC Municipality 1 39 Kolar CMC Municipality 1
Punjab
10 Ferozepur MCl PWS&SB 1 1
11 Kapurthala M Municipality 2 1
12 Mansa MCl PWS&SB 2 2
13 Phagwara MCl Municipality 2 1
14 Sangrur MCl Municipality 1 3
Tamil Nadu
15 Nagapattinam M Municipality 2
16 Udhagamandalam M Municipality 1
Uttar Pradesh
17 Etah MB Jal Sansthan 1 2
18 Roorkee MB Municipality 5 5
5 7 3
Sl. City/Town Agency responsible for Operation Staff PosNo. & Maintenance Managerial Technical
1 2 3 4
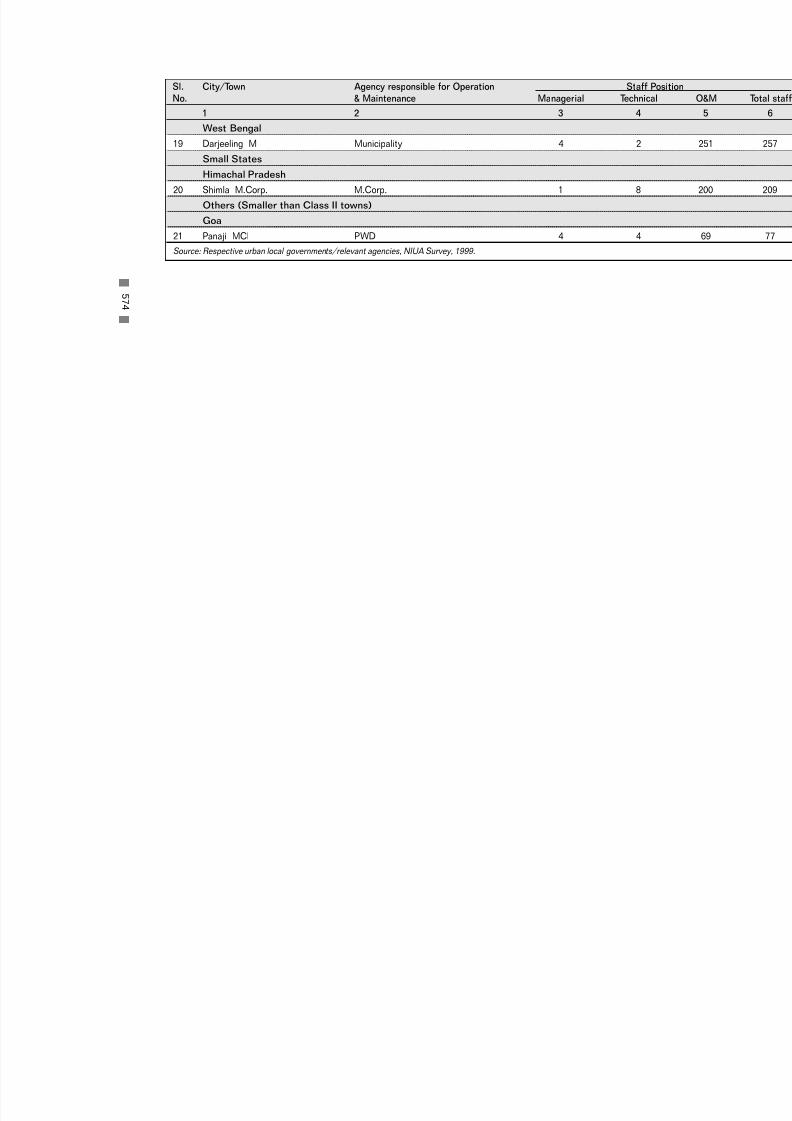
7/21/2019 Status Watersupply
http://slidepdf.com/reader/full/status-watersupply 594/869
5 7 4
West Bengal
19 Darjeeling M Municipality 4 2
Small States
Himachal Pradesh
20 Shimla M.Corp. M.Corp. 1 8
Others (Smaller than Class II towns)
Goa
21 Panaji MCl PWD 4 4
Source: Respective urban local governments/relevant agencies, NIUA Survey, 1999.
Sl. City/Town Agency responsible for Operation Staff PoNo. & Maintenance Managerial Technical
1 2 3 4

7/21/2019 Status Watersupply
http://slidepdf.com/reader/full/status-watersupply 595/869
B - 6
DE T A I L S OF P R I V A T I S
A T I O NI N WA S T E WA T E R
T R E A T M
E NT ,1 9 9 9

7/21/2019 Status Watersupply
http://slidepdf.com/reader/full/status-watersupply 596/869

7/21/2019 Status Watersupply
http://slidepdf.com/reader/full/status-watersupply 597/869
METROPOLITAN CITIES
1 Chennai O&M Pumping stations Contract 1996 3
2 Hyderabad O&M STPs Contract 1997-1999 2
CLASS I
Gujarat
1 Rajkot O&M Pumping stations Contract 1998 3
2 Bhavnagar O&M Contract 1994 1
Maharashtra
3 Nashik O&M STPs Contract 1995 1
Union Territories
4 Chandigarh O&M Pumping stations n.a. 1999 1
Source: Respective urban local governments/relevant agencies, NIUA Survey, 1999.
5 7 7
Sl. City/Town Privatisation DetailsNo. Function Activity Mode used Year No. of
privatised contractors
1 2 3 4 5 6
B-6 : Details of Privatisation in Waste Water Treatment - 1999

7/21/2019 Status Watersupply
http://slidepdf.com/reader/full/status-watersupply 598/869

7/21/2019 Status Watersupply
http://slidepdf.com/reader/full/status-watersupply 599/869
B - 7
C A P I T A L W OR K S U N
DE R T A K E N S I N C
E 1 9 9 4

7/21/2019 Status Watersupply
http://slidepdf.com/reader/full/status-watersupply 600/869

7/21/2019 Status Watersupply
http://slidepdf.com/reader/full/status-watersupply 601/869
Metropolitan Cities1 Ahmedabad 3 1 Sabarmati river Laying of new 1996 Ongoing
cleaning trunk sewers,
desilting,renovation of
STPs etc.
2 East Ahmedabad Sewers, pumping n.a. OngoingSewerage stations etc.
Project -II
3 Effluent disposal Sewers, pumping n.a. Ongoingstations etc.
2 Bangalore 1 1 Sewage treatment Tertiary treatment 140 1998 2000
3 Bhopal 1 1 Environmental Wetland project 500 100 Work in progress6,000Lconservation
4 Calcutta 3 1 Pollution control n.a. 1999 Ongoing
under GAP II
2 Mega city Rehab. of existing 1999 Ongoingsewers
3 10th Finance Imprv. & dev. of 1998 Ongoing
Commission existing system
5 Coimbatore 1 1 Augmentation Sewer lines 737 142 1999 2002 1
6 Greater Mumbai 1 Discharge sewage Worli & Bandra 4800 & 726 1995 1999, 2000 3into sea Outfall 5240 & 785
2 Discharge sewage Pumping station, 5,240 785.00 1996 2001 2into sea repairs
3 Provide biological Ghatkopar & 1900 285 1995 1999 1
trtmt. for sewage Bhandup lagoons & 1860 & 280
4 Stabilise the Pumping stations 1996 1998structures from
uplift forces
5 8 1
Sl. City/Town No. of Scheme Purpose Components Designed Year of ToNo. Schemes No. population capacity Starting Completion
(‘000) (mld) in
1 2 3 4 5 6 7 8 9
B-7 : Capital Works Undertaken since 1994

7/21/2019 Status Watersupply
http://slidepdf.com/reader/full/status-watersupply 602/869

7/21/2019 Status Watersupply
http://slidepdf.com/reader/full/status-watersupply 603/869
CLASS I
Andhra Pradesh1 Guntur 1 1 Treatment plant Treatment 350 35 1992 2002
plant/ sewer
lines
2 Tirupati 1 1 Augmentation Pipe lines 4,100 25 1994 1999
3 Vijaywada 1 1 Augmentation Pipe lines 200 32 1998 Ongoing
Gujarat
4 Bhavnagar 3 1 Improving Pipe lines 75 21 1995 Ongoingexisting system
2 Augmentation Pipe lines 75 21 1994 Ongoing
3 Improving Pipe lines 1996 1998
existing system
5 Navsari 1 1 Augmentation Pipe lines 1995 1998
6 Rajkot 2 1 Improving Pipe lines 550 n.a. 1978 1994
existing system
2 Adding new Pipe lines 450 n.a. 1997 2001
pipe lines
Haryana
7 Gurgaon 1 1 Adding new Pipe lines 20 n.a. 1999 Ongoingpipe lines
8 Hissar 4 1 Improving Pumping station 215 3 1998 Ongoingexisting system
2 Adding new Pipe lines 1 0 1995 Ongoingpipe lines
3 Adding new Pipe lines 2 0 1995 Ongoing
pipe lines4 Adding new Pipe lines 0.7 0 1997 1999
pipe lines
9 Karnal 4 1 Adding new Pipe lines 54 7 1995 Ongoing
pipe lines
2 Adding new Pipe lines 31 6 1985 Ongoing
pipe lines
5 8 3
Sl. City/Town No. of Scheme Purpose Components Designed Year of To
No. Schemes No. population capacity Starting Completion(‘000) (mld) in
1 2 3 4 5 6 7 8 9

7/21/2019 Status Watersupply
http://slidepdf.com/reader/full/status-watersupply 604/869
3 Adding new Pipe lines 160 23 1980 Ongoing
pipe lines
4 Improving Treatment plant 218 0 1995 Ongoing
existing system
10 Rohtak 2 1 Adding new Pipe lines 357 202 1994 1999pipe lines
2 Adding new Pipe lines 76 8 1994 Ongoingpipe lines
Karnataka
11 Davangere 1 1 n.a. Pipe lines 1996 Ongoing
Maharashtra
12 Kolhapur 2 1 Divert sullage Weir, sump, pump, 1999 Ongoingto drainage mech. Works
schemes
2 Divert sullage Treatment plant 621 75 1999 Ongoingto drainage, (pr. & sec. trt.),treatment sump, pump
13 Nashik 1 1 Augmentation Pipe lines 1,677 200 1998 Ongoing
Orissa
14 Bhubaneswar 1 1 Collection of Sump, sewer 150 24 1997 Ongoingsewage lines, pumping
station
15 Puri 1 1 Treat west water Screens, 142 10 1995 1996catchment basin,
facullative ponds
Punjab
16 Amritsar 4 1 Augmentation Pipe lines 1994 Ongoing2 Augmentation Pipe lines 1994 Ongoing
3 Extension/ Sewer lines 1999 2002
augmentation govt./ self
4 Extension of Sewer lines 1999 2001
network
5 8 4
Sl. City/Town No. of Scheme Purpose Components Designed Year of To
No. Schemes No. population capacity Starting Completion(‘000) (mld) in
1 2 3 4 5 6 7 8 9
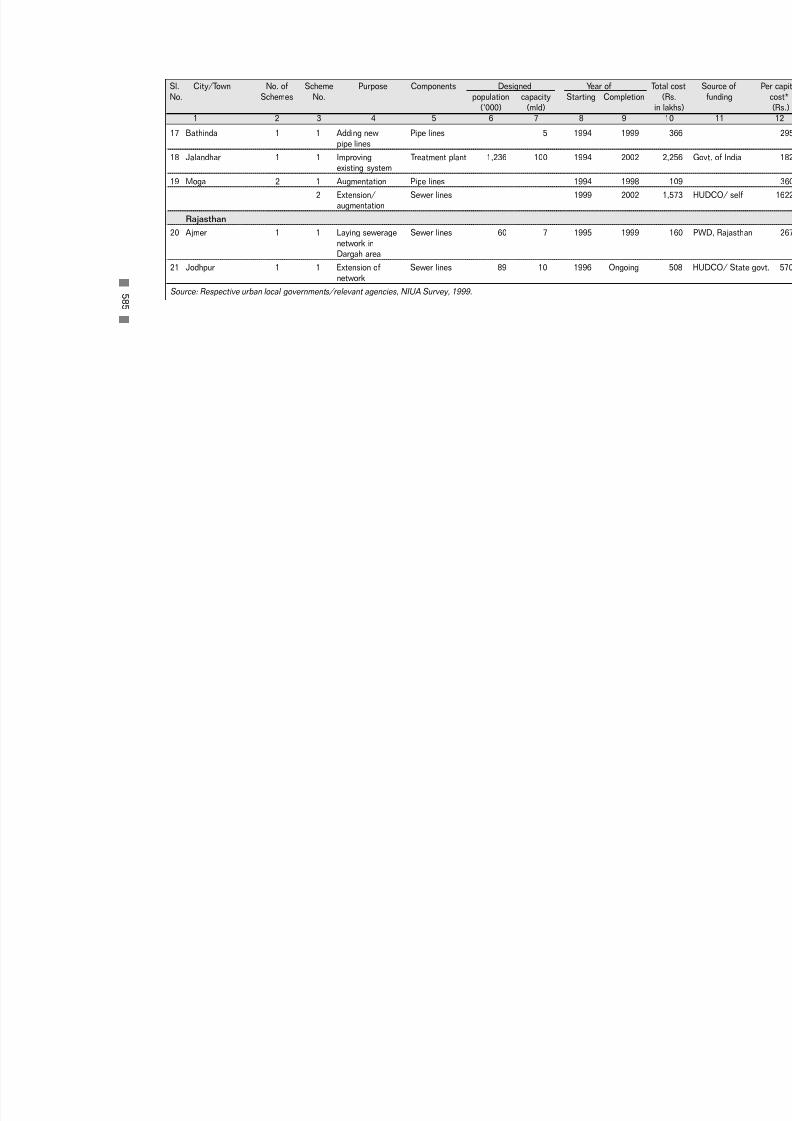
7/21/2019 Status Watersupply
http://slidepdf.com/reader/full/status-watersupply 605/869
17 Bathinda 1 1 Adding new Pipe lines 5 1994 1999
pipe lines
18 Jalandhar 1 1 Improving Treatment plant 1,236 100 1994 2002existing system
19 Moga 2 1 Augmentation Pipe lines 1994 1998
2 Extension/ Sewer lines 1999 2002augmentation
Rajasthan
20 Ajmer 1 1 Laying sewerage Sewer lines 60 7 1995 1999
network inDargah area
21 Jodhpur 1 1 Extension of Sewer lines 89 10 1996 Ongoing
network
Source: Respective urban local governments/relevant agencies, NIUA Survey, 1999. 5 8 5
Sl. City/Town No. of Scheme Purpose Components Designed Year of To
No. Schemes No. population capacity Starting Completion(‘000) (mld) in
1 2 3 4 5 6 7 8 9

7/21/2019 Status Watersupply
http://slidepdf.com/reader/full/status-watersupply 606/869
CLASS II
Gujarat1 Mahesana 2 1 Improving Pumping station 1998 1999
existing system
2 Augmentation Pipe lines 3 1995 Ongoing
Haryana
2 Jind 3 1 Adding new Pipe lines 135 51 1995 Ongoingpipe lines
2 Adding new Pipe lines 32 36 1984 Ongoing
pipe lines
3 Adding new Pipe lines 1,120 6 1996 Ongoing
pipe lines
3 Thanesar 1 1 Augmentation T,Pipe lines, 56 1 1984 OngoingPumping Mach.
Karnataka
4 Gokak 1 1 n.a. Pipe lines 350 0 1997 Ongoing
Punjab
5 Firozpur 1 1 Augmentation Pipe lines 1994 1997
6 Mansa 1 1 Adding new Pipe lines 1999 n.a.
pipe lines
7 Phagwara 2 1 Augmentation Pipe lines 1997 Ongoing
2 Improvement Treatment plant & 16 1999 2001 525pumping station
8 Sangrur 2 1 Augmentation Pipe lines 1994 1996
2 Augmentation Pipe lines 1996 Ongoing
Rajasthan
9 Banswara 1 1 Sewerage scheme n.a. 110 n.a. n.a. n.a.
Source: Respective urban local governments/relevant agencies, NIUA Survey, 1999.
5 8 6
Sl. City/Town No. of Scheme Purpose Components Designed Year of To
No. Schemes No. population capacity Starting Completion(‘000) (mld) in
1 2 3 4 5 6 7 8 9

7/21/2019 Status Watersupply
http://slidepdf.com/reader/full/status-watersupply 607/869
B - 8
C A P I T A L W OR K S P R OP O S E DT O
B E
U NDE R T A K
E NI NF UT UR E

7/21/2019 Status Watersupply
http://slidepdf.com/reader/full/status-watersupply 608/869

7/21/2019 Status Watersupply
http://slidepdf.com/reader/full/status-watersupply 609/869
5 8 9
Metropolitan Cities1 Coimbatore Augmentation Sewer lines 737 142 1999 2002 1
2 Greater Mumbai 8 Augmentation Sewer lines, Combined Combined 2000 n.a.
treatmentplant
3 Hyderabad 1 1 Extension of Sewer lines 2,021 1242 2001 2006 3
network
4 Ludhiana 1 1 Extension of Sewer lines 425 70 2000 2002
network
5 Pune 1 Augmentation/ Sewer lines n.a. n.a. n.a. n.a. 1improvement
6 Surat 1 1 Extention of Sewer lines, 1,615 341 2000 2005 1
sewerage pumping station,rising main lines,
STP, treated
effluent disposalline
7 Vadodara 1 Sewage STP 340 52 1999 2000
treatment
2 Sewage STP 440 66 2000 2001
treatment
3 Sewage STP 186 43 2000 2002treatment
Sl. City/Town No. of Scheme Purpose Components Designed Expected year of To
No. Schemes No. Population Capacity Starting Completion
clubed (‘000) (mld) in
1 2 3 4 5 6 7 8 9
B-8 : Capital Works Proposed to be Undertaken in Future
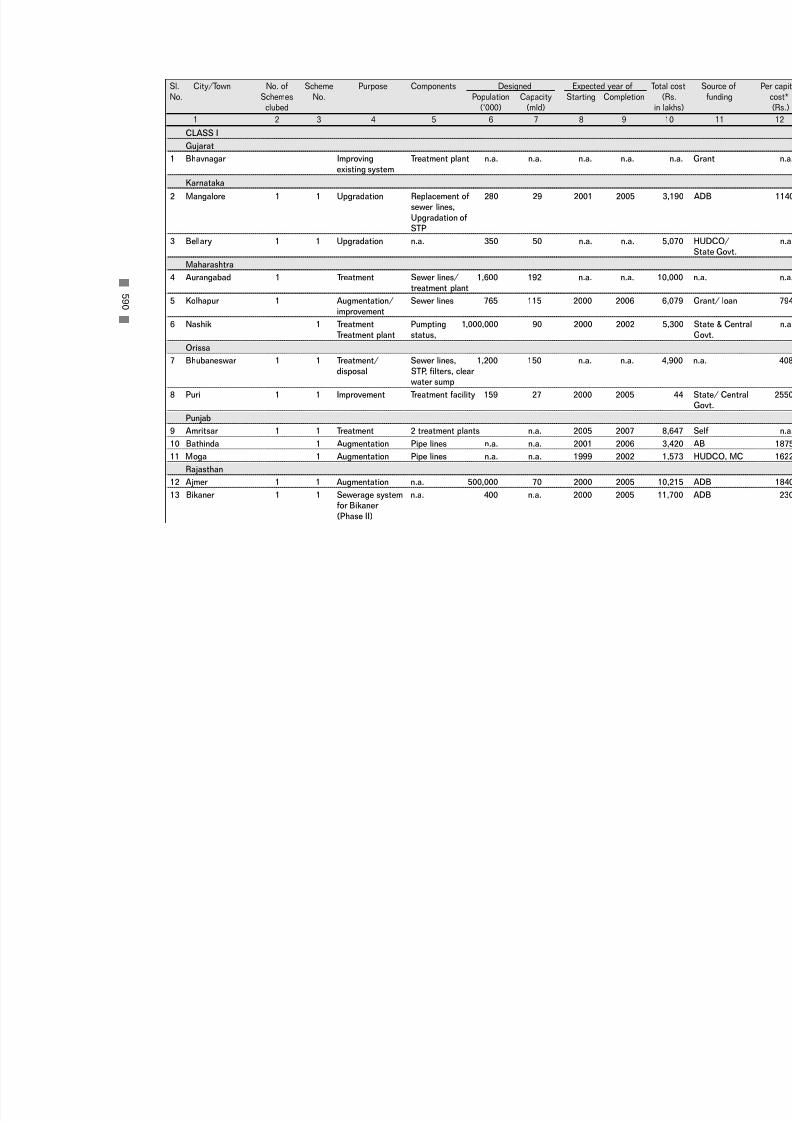
7/21/2019 Status Watersupply
http://slidepdf.com/reader/full/status-watersupply 610/869
CLASS I
Gujarat1 Bhavnagar Improving Treatment plant n.a. n.a. n.a. n.a.
existing system
Karnataka
2 Mangalore 1 1 Upgradation Replacement of 280 29 2001 2005
sewer lines,
Upgradation ofSTP
3 Bellary 1 1 Upgradation n.a. 350 50 n.a. n.a.
Maharashtra
4 Aurangabad 1 Treatment Sewer lines/ 1,600 192 n.a. n.a. 1
treatment plant
5 Kolhapur 1 Augmentation/ Sewer lines 765 115 2000 2006improvement
6 Nashik 1 Treatment Pumpting 1,000,000 90 2000 2002
Treatment plant status,
Orissa
7 Bhubaneswar 1 1 Treatment/ Sewer lines, 1,200 150 n.a. n.a.
disposal STP, filters, clearwater sump
8 Puri 1 1 Improvement Treatment facility 159 27 2000 2005
Punjab
9 Amritsar 1 1 Treatment 2 treatment plants n.a. 2005 2007
10 Bathinda 1 Augmentation Pipe lines n.a. n.a. 2001 2006
11 Moga 1 Augmentation Pipe lines n.a. n.a. 1999 2002
Rajasthan
12 Ajmer 1 1 Augmentation n.a. 500,000 70 2000 2005 1
13 Bikaner 1 1 Sewerage system n.a. 400 n.a. 2000 2005 1for Bikaner
(Phase II)
5 9 0
Sl. City/Town No. of Scheme Purpose Components Designed Expected year of To
No. Schemes No. Population Capacity Starting Completionclubed (‘000) (mld) in
1 2 3 4 5 6 7 8 9

7/21/2019 Status Watersupply
http://slidepdf.com/reader/full/status-watersupply 611/869
Tamil Nadu
14 Salem MCorp Sewage Disposal n.a. 400,000 n.a. n.a. 200515 Tirunelveli Augmentation Pipe line, n.a. n.a. n.a. n.a.
Treatment plant
& Pumphouse
16 Vellore M Sewage Disposal n.a. 200,000 20 n.a. n.a.
Uttar Pradesh
17 Agra 1 New sewerage n.a. 159 20 2000 2004
system
18 Bareilly 1 Sewage n.a. 100 n.a. n.a. n.a.treatment
19 Hapur 1 Sewage Disposal Pumping station na n.a. 1999 n.a.
20 Meerut 1 Sewage Pipe line Machinery n.a. 1999 2001
Rehabilitation
21 Mirzapur 1 Sewerage scheme n.a. 57 n.a. n.a. n.a.
Union Territories
22 Pondicherry 1 To upgrade the n.a. 50 5 2000 2001
UGD of Pondichery
CLASS II
Gujarat
1 Dabhoi 1 1 Extention of Civil, electrical, 15 n.a. 2000 n.a.sewerage mechanical
Goa
2 Panaji 1 Augmentation Sewage Treatment 75 13 2000 2002plant
Source: Respective urban local governments/relevant agencies, NIUA Survey, 1999.
5 9 1
Sl. City/Town No. of Scheme Purpose Components Designed Expected year of To
No. Schemes No. Population Capacity Starting Completionclubed (‘000) (mld) in
1 2 3 4 5 6 7 8 9

7/21/2019 Status Watersupply
http://slidepdf.com/reader/full/status-watersupply 612/869

7/21/2019 Status Watersupply
http://slidepdf.com/reader/full/status-watersupply 613/869
B - 9
R E V E N UE R E
C E I P T S ,1 9 9 7 - 9 8

7/21/2019 Status Watersupply
http://slidepdf.com/reader/full/status-watersupply 614/869

7/21/2019 Status Watersupply
http://slidepdf.com/reader/full/status-watersupply 615/869
Metropolitan Cities
1 Ahmedabad M.Corp. 0 0 86 6181 8715
2 Bangalore M.Corp. These figures are combined with water supply revenue income fi
3 Bhopal M.Corp. n.a.
4 Calcutta M.Corp. 0 0 0 50000 0
5 Chennai M.Corp. These figures are combined with water supply revenue income fi
6 Coimbatore M.Corp. 0 0 0 0 21737
7 Delhi M.Corp. n.a. 0 1536 9 0
8 Greater Mumbai M.Corp. 0 0 0 0 2899525*
9 Hyderabad M.Corp. These figures are combined with water supply revenue income fi
10 Indore M.Corp. 0 0 0 237 011 Jaipur M.Corp. n.a.
12 Kanpur M.Corp. 0 0 22 0 130
13 Kochi M.Corp. 0 0 0 977 0
14 Lucknow M.Corp. 0 0 0 0 13766
15 Ludhiana M.Corp. These figures are combined with water supply revenue income fi
16 Madurai M.Corp. 0 0 0 8689 0
17 Nagpur M.Corp. 0 0 0 0 0
18 Pune M.Corp. 0 0 0 100336 39300**
19 Surat M.Corp. 0 0 169 0 0
20 Vadodara M.Corp. 357 0 0 305 96312
21 Varanasi M.Corp. 1706 0 5508
22 Visakhapatnam M.Corp. These figures are combined with water supply revenue income fi
* Revenue charged by measurement , Sewerage Tax , Sewerage Benefit Tax ; ** Sewerage Benefit Tax
Source: Respective urban local governments/relevant agencies, NIUA Survey, 1999.
5 9 5
Sl. City/Town Revenue Receipts (Rs. in ‘000)
No. Recycled Sewage gas Manure Connection Sewage/
charges Drainage tax
1 2 3 4 5 6
B-9 : Revenue Receipts, 1997-98

7/21/2019 Status Watersupply
http://slidepdf.com/reader/full/status-watersupply 616/869
CLASS I
Andhra Pradesh
1 Eluru M 0 0 0 0 111
2 Guntur MCl 100 0 0 1000 0
3 Vijaywada M.Corp. 1526 0 18 3200 6000
Gujarat
4 Anand M n.a.
5 Bhavnagar M.Corp. 0 0 0 1500 157
6 Bhuj M 0 0 0 32 4348
7 Nadiad M 0 0 0 584 4689
8 Navsari M 0 0 0 22 2849
9 Rajkot M.Corp. 71 0 0 44 0Haryana
10 Ambala MCl 0 0 0 2 80
11 Faridabad M.Corp. 0 0 0 3190 0
12 Gurgaon MCl 0 0 0 746 753
13 Hissar MCl 0 0 0 52 922
14 Rohtak MCl 0 0 0 284 0
Karnataka
15 Bellary CMC 0 0 0 0 0
16 Mangalore M.Corp. 0 0 0 25 11021
17 Mysore M.Corp. 0 0 88 1983 0
18 Shimoga CMC 0 0 0 n.a. 0
Madhya Pradesh
19 Gwalior M.Corp. 0 0 0 0 0
20 Morena M 0 0 0 0 0
21 Shivpuri M 0 0 0 0 0
5 9 6
Sl. City/Town Revenue Receipts (Rs. in ‘000)
No. Recycled Sewage gas Manure Connection Sewage/charges Drainage tax
1 2 3 4 5 6
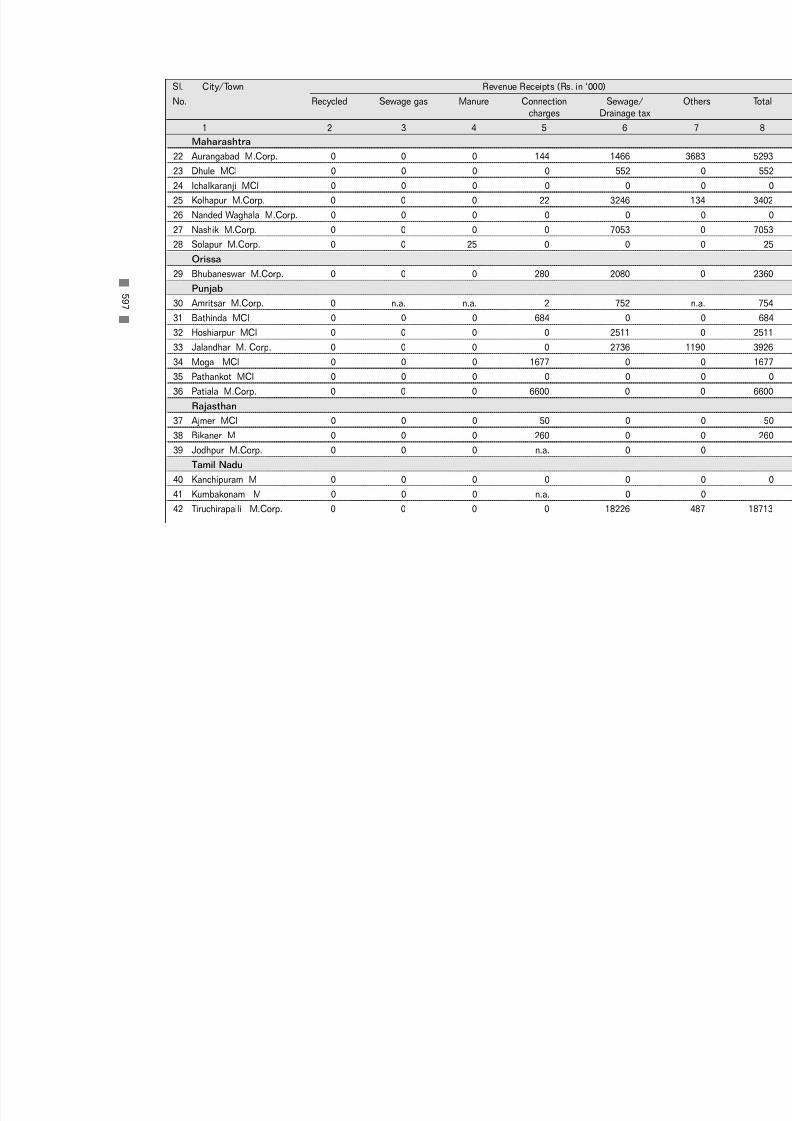
7/21/2019 Status Watersupply
http://slidepdf.com/reader/full/status-watersupply 617/869
Maharashtra
22 Aurangabad M.Corp. 0 0 0 144 1466
23 Dhule MCl 0 0 0 0 552
24 Ichalkaranji MCl 0 0 0 0 0
25 Kolhapur M.Corp. 0 0 0 22 3246
26 Nanded Waghala M.Corp. 0 0 0 0 0
27 Nashik M.Corp. 0 0 0 0 7053
28 Solapur M.Corp. 0 0 25 0 0
Orissa
29 Bhubaneswar M.Corp. 0 0 0 280 2080
Punjab
30 Amritsar M.Corp. 0 n.a. n.a. 2 752
31 Bathinda MCl 0 0 0 684 0
32 Hoshiarpur MCl 0 0 0 0 2511
33 Jalandhar M. Corp. 0 0 0 0 2736
34 Moga MCl 0 0 0 1677 0
35 Pathankot MCl 0 0 0 0 0
36 Patiala M.Corp. 0 0 0 6600 0
Rajasthan
37 Ajmer MCl 0 0 0 50 0
38 Bikaner M 0 0 0 260 0
39 Jodhpur M.Corp. 0 0 0 n.a. 0Tamil Nadu
40 Kanchipuram M 0 0 0 0 0
41 Kumbakonam M 0 0 0 n.a. 0
42 Tiruchirapalli M.Corp. 0 0 0 0 18226
5 9 7
Sl. City/Town Revenue Receipts (Rs. in ‘000)
No. Recycled Sewage gas Manure Connection Sewage/charges Drainage tax
1 2 3 4 5 6

7/21/2019 Status Watersupply
http://slidepdf.com/reader/full/status-watersupply 618/869
043 Tirunelveli M.Corp. 0 0 0 0 0
44 Tuticorin M 0 0 0 0 0
Uttar Pradesh
45 Aligarh M.Corp. 0 0 0 0 146
46 Allahabad M.Corp. 3450 0 0 0 n.a.
47 Bareilly M.Corp. 0 0 0 216 2148
48 Ghaziabad M.Corp. 0 0 0 0 10646
49 Gorakhpur M.Corp. 0 0 0 0 0
50 Hapur MB 0 0 0 0 145
51 Hardwar MB 0 0 44 0 0
52 Mathura MB These figures are combined with water supply revenue income f
53 Meerut M.Corp. 0 0 0 0 631
54 Mirzapur MB 0 0 156 2 0
West Bengal
55 Asansol M.Corp. 0 0 0 0 0
Union Territories
56 Chandigarh M.Corp. 1480 0 40 0 0
57 Pondicherry M 200 0 0 0 0
Source: Respective urban local governments/relevant agencies, NIUA Survey, 1999.
5 9 8
Sl. City/Town Revenue Receipts (Rs. in ‘000)
No. Recycled Sewage gas Manure Connection Sewage/charges Drainage tax
1 2 3 4 5 6

7/21/2019 Status Watersupply
http://slidepdf.com/reader/full/status-watersupply 619/869
CLASS II
Gujarat
1 Ankleswar M 0 0 0 105 0
2 Dabhoi M 1 0 0 5 1077
3 Mahesana M 0 0 0 61 2805
Haryana
4 Jind MCl 0 0 0 27 352
5 Kaithal MCl 0 0 0 119 35
6 Rewari MCl 0 0 0 n.a. 0
7 Thanesar MCl 0 0 0 22 0
Karnataka
8 Chikmaglur CMC 0 0 0 50 0
9 Kolar CMC These figures are combined with water supply revenue income f
Punjab
10 Ferozepur MCl 0 0 0 1242 0
11 Kapurthala M 0 0 0 2915 n.a.
12 Mansa MCl 0 0 0 800 0
13 Phagwara MCl 0 0 0 9 0
14 Sangrur MCl 0 0 0 1062 0
Tamil Nadu
15 Nagapattinam M 0 0 0 0 016 Udhagamandalam M 0 0 0 0 0
Uttar Pradesh
17 Etah MB 0 0 0 0 0
18 Roorkee MB 0 0 0 45 0
5 9 9
Sl. City/Town Revenue Receipts (Rs. in ‘000)
No. Recycled Sewage gas Manure Connection Sewage/charges Drainage tax
1 2 3 4 5 6

7/21/2019 Status Watersupply
http://slidepdf.com/reader/full/status-watersupply 620/869
West Bengal
19 Darjeeling M 0 0 0 10 0
Small States
Himachal Pradesh
20 Shimla M.Corp. 0 0 0 0 0
Others (Smaller than Class II towns)
Small States
Goa
21 Panaji MCl 0 0 0.7 0.5 0
Source: Respective urban local governments/relevant agencies, NIUA Survey, 1999.
6 0 0
Sl. City/Town Revenue Receipts (Rs. in ‘000)
No. Recycled Sewage gas Manure Connection Sewage/charges Drainage tax
1 2 3 4 5 6

7/21/2019 Status Watersupply
http://slidepdf.com/reader/full/status-watersupply 621/869
B -1 0
R E V E N UE E X P E
NDI T UR E ,1 9 9 7 -
9 8

7/21/2019 Status Watersupply
http://slidepdf.com/reader/full/status-watersupply 622/869

7/21/2019 Status Watersupply
http://slidepdf.com/reader/full/status-watersupply 623/869
METROPOLITAN CITIES
1 Ahmedabad M.Corp. 104,446 69,122 17,176 0 0
2 Bangalore M.Corp. These figures are combined with water supply revenue expenditure figur
3 Bhopal M.Corp. 12,872 2,006 6,466 0 0
4 Calcutta M.Corp. 61,400 30,300 33,817 0 0
5 Chennai M.Corp. These figures are combined with water supply revenue expenditure figur
6 Coimbatore M.Corp. 5,636 51,660.0 0 0
7 Delhi M.Corp. 161,415 35,907 6,619 17,340 0 0
8 Greater Mumbai M.Corp. 288,724 148,228 151,361 96,964 440,657 107,494
9 Hyderabad M.Corp. These figures are combined with water supply revenue expenditure figur
10 Indore M.Corp. 10,056 397 4,100 0 011 Jaipur M.Corp. n.a.
12 Kanpur M.Corp. 27,675 0 3,920 1,594 0 0
13 Kochi M.Corp. 795 255 156 0 0
14 Lucknow M.Corp. 15,729 0 0
15 Ludhiana M.Corp. These figures are combined with water supply revenue expenditure figur
16 Madurai M.Corp. 4,971 1,341 0 0
17 Nagpur M.Corp. 1,169 1,810 131 0 0
18 Pune M.Corp. 74,060 7,818 50 1,811 0 0
19 Surat M.Corp. 32,405 32,296 148 6,884 0 0
20 Vadodara M.Corp. 20,774 18,361 0 10,092 0 0
21 Varanasi M.Corp. 14,331 7,633 5,728 9,368 0 0
22 Visakhapatnam M.Corp. These figures are combined with water supply revenue expenditure figur
Source: Respective urban local governments/relevant agencies, NIUA Survey, 1999.
6 0 3
Sl. City/ town Revenue Expenditure (Rs. in '000)
No. Salary & Wages Electricity Consumables Repairs/ Interest Debt servicing
replacements
1 2 3 4 5 6 7
B-10 : Revenue Expenditure, 1997-98

7/21/2019 Status Watersupply
http://slidepdf.com/reader/full/status-watersupply 624/869
CLASS I
Andhra Pradesh
1 Eluru M 3,620 0 150 12 0
2 Guntur MCl 115 500 3,500 0 0
3 Vijaywada M.Corp. 8,976 2,500 89 380 0 0
Gujarat
4 Anand M n.a.
5 Bhavnagar M.Corp. 14,004 1,500 3,010 0 0
6 Bhuj M 1,275 0 1,249 0 0
7 Nadiad M 4,233 1,785 76 1,107 0 0
8 Navsari M 2,463 0 1,242 0 0
9 Rajkot M.Corp. 5,039 6,280 10,109 0 2,113
Haryana10 Ambala MCl 582 361 93 6 0 0
11 Faridabad M.Corp. 11,048 0 5,155 371 394 0
12 Gurgaon MCl 1,386 52 196 320 0 0
13 Hissar MCl 4,177 5,659 941 1,562 0 0
14 Rohtak MCl 3,737 2,903 293 0 0 0
Karnataka
15 Bellary CMC Break-up not available
16 Mangalore M.Corp. 2,164 500 6,160 0 0
17 Mysore M.Corp. 6,088 0 0 350 0 0
18 Shimoga CMC n.a.
Madhya Pradesh19 Gwalior M.Corp. 5,675 360 389 2,449 0 0
20 Morena M 203 0 0 175 0 0
21 Shivpuri M 539 0 0 315 0 0
Maharashtra
22 Aurangabad M.Corp. 1,769 0 0 8,924 0 0
6 0 4
Sl. City/ town Revenue Expenditure (Rs. in '000)
No. Salary & Wages Electricity Consumables Repairs/ Interest Debt servicing
replacements
1 2 3 4 5 6 7

7/21/2019 Status Watersupply
http://slidepdf.com/reader/full/status-watersupply 625/869
23 Dhule MCl 528 0 0 0 0 0
24 Ichalkaranji MCl n.a. 7,190 1,003 0 0 0
25 Kolhapur M.Corp. 3,100 2,303 0 1,754 0 0
26 Nanded Waghala M.Corp. 2,056 118 0 1,544 0 0
27 Nashik M.Corp. 452 4,822 805 1,987 0 0
28 Solapur M.Corp. 8,987 29 0 129 0 0
Orissa
29 Bhubaneswar M.Corp. 10,537 70 950 295 0 0
* Probably unusual year - Repairs to UGD is Rs.3,528,000/-
Punjab
30 Amritsar M.Corp. 24,428 10,945 0 12,377 0 6,062
31 Bathinda MCl 8,100 5,000 3,700 0 0 0
32 Hoshiarpur MCl 470 0 0 110 3,758 033 Jalandhar M. Corp. 15,607 9,445 663 7,553 0 0
34 Moga MCl 2,171 1,030 322 830 0 574
35 Pathankot MCl 400 600 50 100 0 0
36 Patiala M.Corp. 5,500 5,800 2,400 0 0 0
Rajasthan
37 Ajmer MCl n.a.
38 Bikaner M 1,126 1,760 0 378 0 0
39 Jodhpur M.Corp. 10,781 0 0 1,300 0 0
Tamil Nadu
40 Kanchipuram M 1,591 0 50 0 0 0
41 Kumbakonam M n.a.
42 Tiruchirapalli M.Corp. 2,885
43 Tirunelveli M.Corp. 3,110 14,944 0 0
44 Tuticorin M 2,085 0 238 0 0 0
Uttar Pradesh
45 Aligarh M.Corp. 1,440 2,400 0 280 0 0
6 0 5
Sl. City/ town Revenue Expenditure (Rs. in '000)
No. Salary & Wages Electricity Consumables Repairs/ Interest Debt servicing
replacements
1 2 3 4 5 6 7

7/21/2019 Status Watersupply
http://slidepdf.com/reader/full/status-watersupply 626/869
46 Allahabad M.Corp. 5,270 0 1,000 0 0 0
47 Bareilly M.Corp. 8,294 300 0 3,000 0 0
48 Ghaziabad M.Corp. n.a. n.a. n.a. n.a. n.a. n.a.
49 Gorakhpur M.Corp. 2,372 0 406 27 0 0
50 Hapur MB 1,501 0 0 0 0 0
51 Hardwar MB 4,554 5,927 0 4,937 0 0
52 Mathura MB These figures are combined with water supply revenue expenditure figur
53 Meerut M.Corp. n.a.
54 Mirzapur MB 13,053 887 0 2,040 0 0
West Bengal
55 Asansol M.Corp. 2,039 0 0 0 0 0
Union Territories
56 Chandigarh M.Corp. 7,467 5,500 1,800 300 0 057 Pondicherry M 9,781 0 0 0 0 0
Source: Respective urban local governments/relevant agencies, NIUA Survey, 1999.
6 0 6
Sl. City/ town Revenue Expenditure (Rs. in '000)
No. Salary & Wages Electricity Consumables Repairs/ Interest Debt servicing
replacements
1 2 3 4 5 6 7

7/21/2019 Status Watersupply
http://slidepdf.com/reader/full/status-watersupply 627/869
CLASS II
Gujarat
1 Ankleswar M 1,399 453 878 84 145
2 Dabhoi M 801 636 590 0 0
3 Mahesana M 126 256 748 0 0
Haryana
4 Jind MCl 1,218 610 131 244 0 0
5 Kaithal MCl 1,518 390 311 322 0 0
6 Rewari MCl 747 626 122 37 0 0
7 Thanesar MCl 455 772 18 21 0 0
Karnataka
8 Chikmaglur CMC 850 0 250 500 0 0
9 Kolar CMC These figures are combined with water supply revenue expenditure figur
Punjab
10 Ferozepur MCl 1,272 1,907 44 192 0 0
11 Kapurthala M 460 n.a. n.a. 100 n.a. n.a.
12 Mansa MCl 1,050 900 50 50 0 0
13 Phagwara MCl 676 1,500 0 317 0 0
14 Sangrur MCl 602 375 68 64 0 0
Tamil Nadu
15 Nagapattinam M 496 0 0 0 0 0
16 Udhagamandalam M 2,503 0 0 183 0 0
Uttar Pradesh
17 Etah MB 96 12 30 8 0 0
18 Roorkee MB n.a.
West Bengal
19 Darjeeling M 165 n.a. n.a. n.a. n.a. n.a.
6 0 7
Sl. City/ town Revenue Expenditure (Rs. in '000)
No. Salary & Wages Electricity Consumables Repairs/ Interest Debt servicing
replacements
1 2 3 4 5 6 7
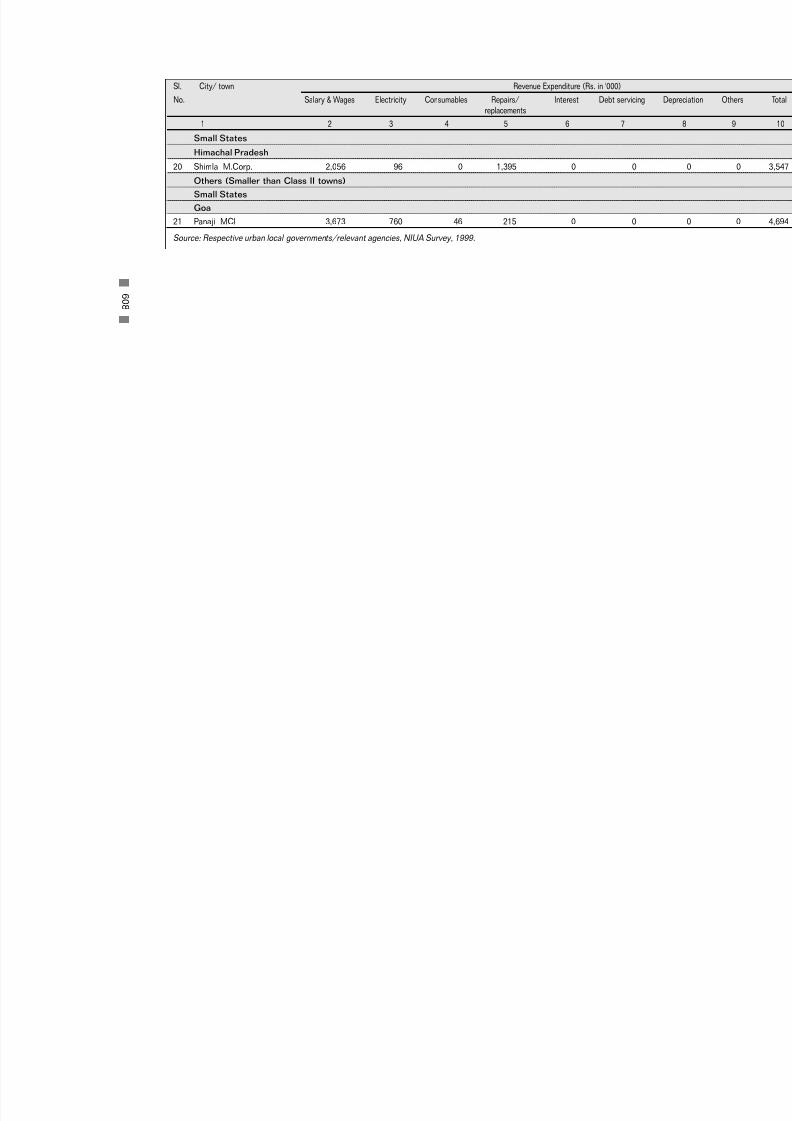
7/21/2019 Status Watersupply
http://slidepdf.com/reader/full/status-watersupply 628/869
Small States
Himachal Pradesh
20 Shimla M.Corp. 2,056 96 0 1,395 0 0
Others (Smaller than Class II towns)
Small States
Goa
21 Panaji MCl 3,673 760 46 215 0 0
Source: Respective urban local governments/relevant agencies, NIUA Survey, 1999.
6 0 8
Sl. City/ town Revenue Expenditure (Rs. in '000)
No. Salary & Wages Electricity Consumables Repairs/ Interest Debt servicing
replacements
1 2 3 4 5 6 7
7/21/2019 Status Watersupply
http://slidepdf.com/reader/full/status-watersupply 629/869
B -1 1
C O S T R E C O
V E R Y 1 9 9 7 - 9 8

7/21/2019 Status Watersupply
http://slidepdf.com/reader/full/status-watersupply 630/869
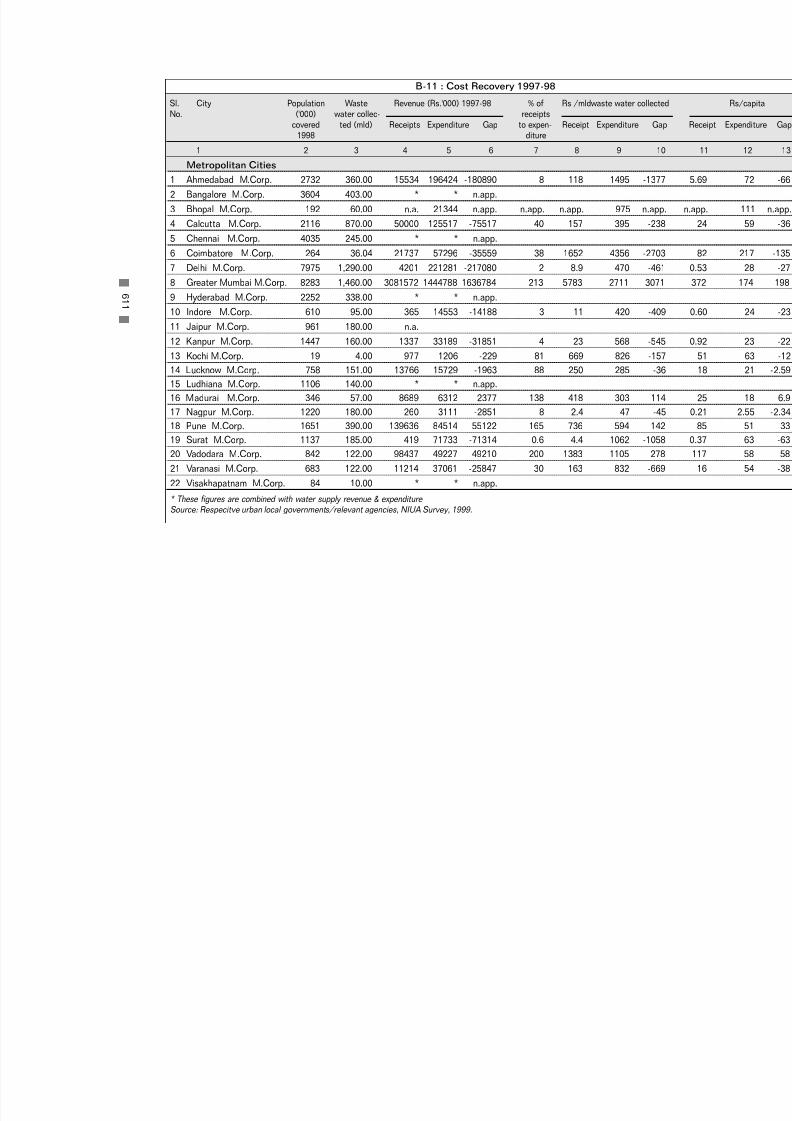
7/21/2019 Status Watersupply
http://slidepdf.com/reader/full/status-watersupply 631/869
Metropolitan Cities
1 Ahmedabad M.Corp. 2732 360.00 15534 196424 -180890 8 118 1495 -137
2 Bangalore M.Corp. 3604 403.00 * * n.app.
3 Bhopal M.Corp. 192 60.00 n.a. 21344 n.app. n.app. n.app. 975 n.ap
4 Calcutta M.Corp. 2116 870.00 50000 125517 -75517 40 157 395 -23
5 Chennai M.Corp. 4035 245.00 * * n.app.
6 Coimbatore M.Corp. 264 36.04 21737 57296 -35559 38 1652 4356 -270
7 Delhi M.Corp. 7975 1,290.00 4201 221281 -217080 2 8.9 470 -46
8 Greater Mumbai M.Corp. 8283 1,460.00 3081572 1444788 1636784 213 5783 2711 307
9 Hyderabad M.Corp. 2252 338.00 * * n.app.10 Indore M.Corp. 610 95.00 365 14553 -14188 3 11 420 -40
11 Jaipur M.Corp. 961 180.00 n.a.
12 Kanpur M.Corp. 1447 160.00 1337 33189 -31851 4 23 568 -54
13 Kochi M.Corp. 19 4.00 977 1206 -229 81 669 826 -15
14 Lucknow M.Corp. 758 151.00 13766 15729 -1963 88 250 285 -3
15 Ludhiana M.Corp. 1106 140.00 * * n.app.
16 Madurai M.Corp. 346 57.00 8689 6312 2377 138 418 303 11
17 Nagpur M.Corp. 1220 180.00 260 3111 -2851 8 2.4 47 -4
18 Pune M.Corp. 1651 390.00 139636 84514 55122 165 736 594 14
19 Surat M.Corp. 1137 185.00 419 71733 -71314 0.6 4.4 1062 -105
20 Vadodara M.Corp. 842 122.00 98437 49227 49210 200 1383 1105 27
21 Varanasi M.Corp. 683 122.00 11214 37061 -25847 30 163 832 -66
22 Visakhapatnam M.Corp. 84 10.00 * * n.app.
* These figures are combined with water supply revenue & expenditure Source: Respecitve urban local governments/relevant agencies, NIUA Survey, 1999.
6 1 1
Sl. City Population Waste Revenue (Rs.'000) 1997-98 % of Rs /mldwaste water collect
No. ('000) water collec- receipts
covered ted (mld) Receipts Expenditure Gap to expen- Receipt Expenditure G1998 diture
1 2 3 4 5 6 7 8 9 1
B-11 : Cost Recovery 1997-98

7/21/2019 Status Watersupply
http://slidepdf.com/reader/full/status-watersupply 632/869
CLASS IAndhra Pradesh
1 Eluru M 98 6.00 2111 5198 -3087 41 964 2374 -141
2 Guntur MCl 98 10.76 13100 4315 8785 304 3335 1099 223
3 Vijaywada M.Corp. 287 25.99 11969 11945 25 100 1262 1259
Gujarat
4 Anand M 99 9.30 n.a.
5 Bhavnagar M.Corp. 289 30.55 1814 18514 -16700 10 163 1661 -149
6 Bhuj M 104 13.47 4380 2524 1856 174 891 513 37
7 Nadiad M 130 7.84 5273 7230 -1958 73 1843 2527 -68
8 Navsari M 117 11.07 3966 3705 262 107 982 917 6
9 Rajkot M.Corp. 511 46.90 115 23633 -23518 0.5 6.7 1380 -137
Haryana
10 Ambala MCl 18 11.34 82 1042 -960 8 20 252 -23
11 Faridabad M.Corp. 585 111.88 3190 16968 -13778 19 78 416 -33
12 Gurgaon MCl 104 10.59 1499 2091 -592 72 388 541 -15
13 Hissar MCl 124 11.44 974 12981 -12007 8 233 3109 -287
14 Rohtak MCl 180 19.28 284 7161 -6877 4 40 1018 -97
Karnataka
15 Bellary CMC 126 10.60 0 1200 -1200 0 0 310 -31
16 Mangalore M.Corp. 238 41.46 11046 8824 2222 125 730 583 14
17 Mysore M.Corp. 363 25.00 2071 10015 -7944 21 227 1098 -87
18 Shimoga CMC 78 6.75 n.a.
Madhya Pradesh
19 Gwalior M.Corp. 449 61.85 0 8873 -8873 0 0 393 -39
20 Morena M 16 0.96 0 378 -378 0 0 1079 -107
6 1 2
Sl. City Population Waste Revenue (Rs.'000) 1997-98 % of Rs /mldwaste water collect
No. ('000) water collec- receiptscovered ted (mld) Receipts Expenditure Gap to expen- Receipt Expenditure G
1998 diture
1 2 3 4 5 6 7 8 9 1

7/21/2019 Status Watersupply
http://slidepdf.com/reader/full/status-watersupply 633/869
21 Shivpuri M 5 3.12 7 854 -847 0.8 6.1 750 -74Maharashtra
22 Aurangabad M.Corp. 649 105.91 5293 16731 -11438 32 137 433 -29
23 Dhule MCl 147 12.00 552 528 24 104 126 121
24 Ichalkaranji MCl 194 20.00 0 9873 -9873 0 0 1352 -135
25 Kolhapur M.Corp. 195 31.87 3402 7677 -4275 44 292 660 -36
26 Nanded Waghala M.Corp. 238 2.00 0 3906 -3906 0 0 5351 -535
27 Nashik M.Corp. 485 75.35 7053 8066 -1013 87 256 293 -3
28 Solapur M.Corp. 771 80.00 25 10741 -10716 0.2 0.9 368 -36
Orissa
29 Bhubaneswar M.Corp. 189 34.00 2360 11852 -9492 20 190 955 -76
Punjab
30 Amritsar M.Corp. 495 71.43 754 53812 -53058 1 29 2064 -203
31 Bathinda MCl 68 19.31 684 16800 -16116 4 97 2384 -228
32 Hoshiarpur MCl 85 16.50 2511 4338 -1827 58 417 720 -30
33 Jalandhar M. Corp. 420 67.00 3926 41176 -37250 10 161 1684 -152
34 Moga MCl 96 10.77 1677 4927 -3250 34 427 1254 -82
35 Pathankot MCl 76 5.58 0 1150 -1150 0 0 565 -56
36 Patiala M.Corp. 192 29.00 6600 13700 -7100 48 624 1294 -67
Rajasthan
37 Ajmer MCl 56 4.39 50 n.a. n.app. n.app. 31 n.app. n.ap
38 Bikaner M 120 11.42 260 3264 -3004 8 62 783 -72
39 Jodhpur M.Corp. 311 46.08 n.a. 12648 n.a. n.a. n.a. 752 n.
Tamil Nadu
40 Kanchipuram M 115 9.68 0 3624 -3624 0 0 1025 -102
41 Kumbakonam M 38 3.50 n.a.
6 1 3
Sl. City Population Waste Revenue (Rs.'000) 1997-98 % of Rs /mldwaste water collect
No. ('000) water collec- receiptscovered ted (mld) Receipts Expenditure Gap to expen- Receipt Expenditure G
1998 diture
1 2 3 4 5 6 7 8 9 1
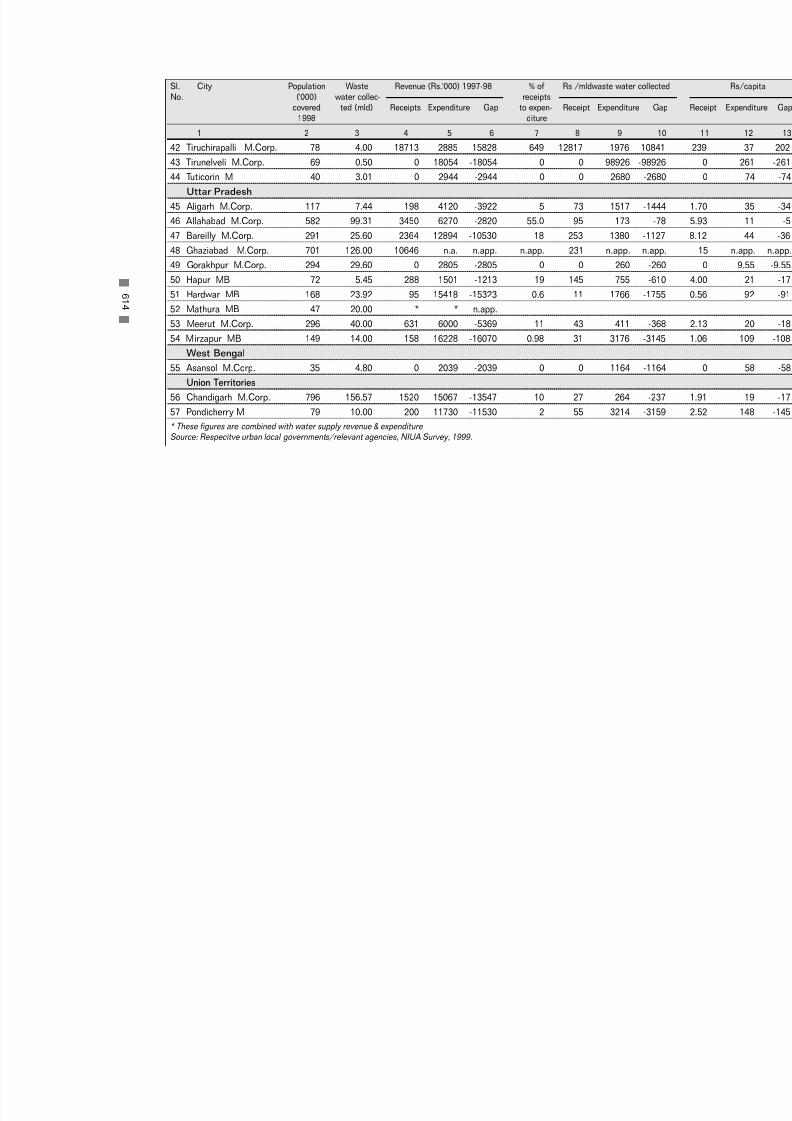
7/21/2019 Status Watersupply
http://slidepdf.com/reader/full/status-watersupply 634/869
42 Tiruchirapalli M.Corp. 78 4.00 18713 2885 15828 649 12817 1976 108443 Tirunelveli M.Corp. 69 0.50 0 18054 -18054 0 0 98926 -9892
44 Tuticorin M 40 3.01 0 2944 -2944 0 0 2680 -268
Uttar Pradesh
45 Aligarh M.Corp. 117 7.44 198 4120 -3922 5 73 1517 -144
46 Allahabad M.Corp. 582 99.31 3450 6270 -2820 55.0 95 173 -7
47 Bareilly M.Corp. 291 25.60 2364 12894 -10530 18 253 1380 -112
48 Ghaziabad M.Corp. 701 126.00 10646 n.a. n.app. n.app. 231 n.app. n.ap
49 Gorakhpur M.Corp. 294 29.60 0 2805 -2805 0 0 260 -26
50 Hapur MB 72 5.45 288 1501 -1213 19 145 755 -61
51 Hardwar MB 168 23.92 95 15418 -15323 0.6 11 1766 -175
52 Mathura MB 47 20.00 * * n.app.
53 Meerut M.Corp. 296 40.00 631 6000 -5369 11 43 411 -36
54 Mirzapur MB 149 14.00 158 16228 -16070 0.98 31 3176 -314
West Bengal
55 Asansol M.Corp. 35 4.80 0 2039 -2039 0 0 1164 -116
Union Territories
56 Chandigarh M.Corp. 796 156.57 1520 15067 -13547 10 27 264 -23
57 Pondicherry M 79 10.00 200 11730 -11530 2 55 3214 -315
* These figures are combined with water supply revenue & expenditure Source: Respecitve urban local governments/relevant agencies, NIUA Survey, 1999.
6 1 4
Sl. City Population Waste Revenue (Rs.'000) 1997-98 % of Rs /mldwaste water collect
No. ('000) water collec- receiptscovered ted (mld) Receipts Expenditure Gap to expen- Receipt Expenditure G
1998 diture
1 2 3 4 5 6 7 8 9 1
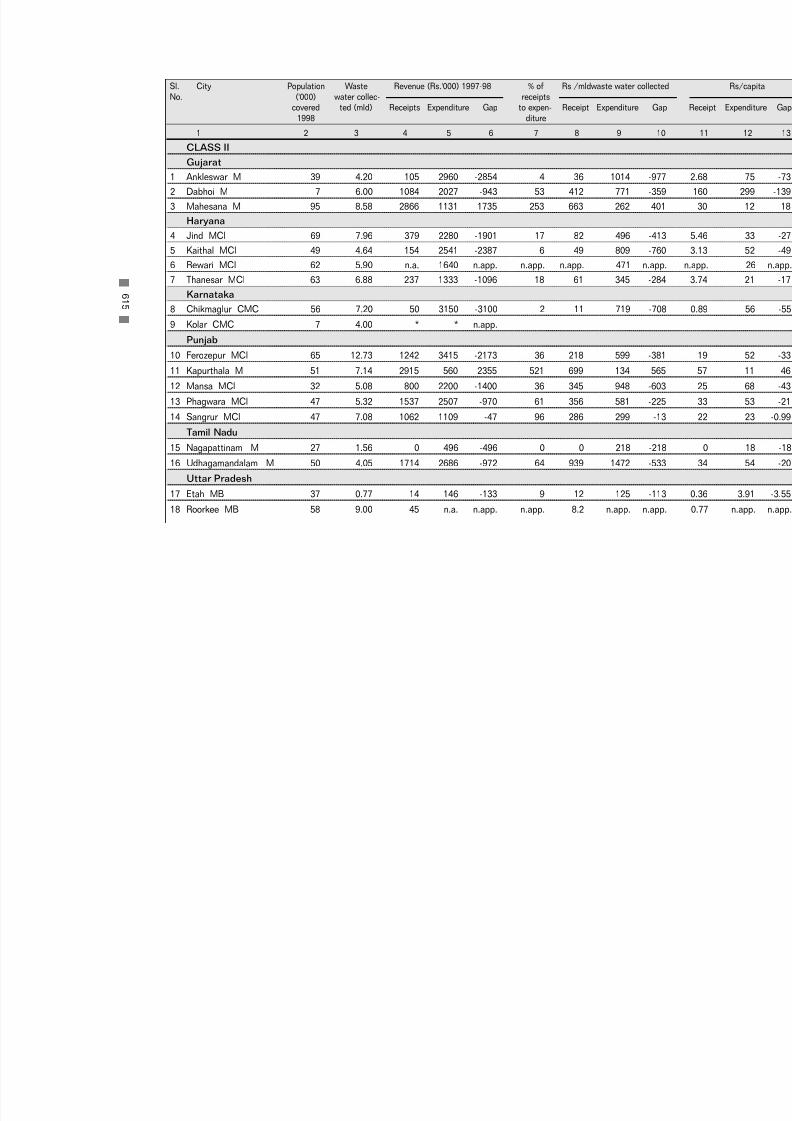
7/21/2019 Status Watersupply
http://slidepdf.com/reader/full/status-watersupply 635/869
CLASS IIGujarat
1 Ankleswar M 39 4.20 105 2960 -2854 4 36 1014 -97
2 Dabhoi M 7 6.00 1084 2027 -943 53 412 771 -35
3 Mahesana M 95 8.58 2866 1131 1735 253 663 262 40
Haryana
4 Jind MCl 69 7.96 379 2280 -1901 17 82 496 -41
5 Kaithal MCl 49 4.64 154 2541 -2387 6 49 809 -76
6 Rewari MCl 62 5.90 n.a. 1640 n.app. n.app. n.app. 471 n.ap
7 Thanesar MCl 63 6.88 237 1333 -1096 18 61 345 -28
Karnataka
8 Chikmaglur CMC 56 7.20 50 3150 -3100 2 11 719 -70
9 Kolar CMC 7 4.00 * * n.app.
Punjab
10 Ferozepur MCl 65 12.73 1242 3415 -2173 36 218 599 -38
11 Kapurthala M 51 7.14 2915 560 2355 521 699 134 56
12 Mansa MCl 32 5.08 800 2200 -1400 36 345 948 -60
13 Phagwara MCl 47 5.32 1537 2507 -970 61 356 581 -22
14 Sangrur MCl 47 7.08 1062 1109 -47 96 286 299 -1
Tamil Nadu
15 Nagapattinam M 27 1.56 0 496 -496 0 0 218 -2116 Udhagamandalam M 50 4.05 1714 2686 -972 64 939 1472 -53
Uttar Pradesh
17 Etah MB 37 0.77 14 146 -133 9 12 125 -11
18 Roorkee MB 58 9.00 45 n.a. n.app. n.app. 8.2 n.app. n.ap
6 1 5
Sl. City Population Waste Revenue (Rs.'000) 1997-98 % of Rs /mldwaste water collect
No. ('000) water collec- receiptscovered ted (mld) Receipts Expenditure Gap to expen- Receipt Expenditure G
1998 diture
1 2 3 4 5 6 7 8 9 1

7/21/2019 Status Watersupply
http://slidepdf.com/reader/full/status-watersupply 636/869
West Bengal19 Darjeeling M 29 1.55 10 165 -155 6 5.5 n.a. n.
Small States
Himachal Pradesh
20 Shimla M.Corp. 69 21.25 0 3547 -3547 0 0 434 -43
Others (Smaller than Class II towns)
Small States
Goa
21 Panaji MCl 29 4.95 1.2 4694 -4693 0.03 0.3 1362 -136
* These figures are combined with water supply revenue & expenditure Source: Respecitve urban local governments/relevant agencies, NIUA Survey, 1999.
6 1 6
Sl. City Population Waste Revenue (Rs.'000) 1997-98 % of Rs /mldwaste water collect
No. ('000) water collec- receiptscovered ted (mld) Receipts Expenditure Gap to expen- Receipt Expenditure G
1998 diture
1 2 3 4 5 6 7 8 9 1

7/21/2019 Status Watersupply
http://slidepdf.com/reader/full/status-watersupply 637/869
B -1 2
P OP UL A T I O N C O V E R
E DB Y S A F E S A N
I T A T I O N

7/21/2019 Status Watersupply
http://slidepdf.com/reader/full/status-watersupply 638/869

7/21/2019 Status Watersupply
http://slidepdf.com/reader/full/status-watersupply 639/869
6 1 9
METROPOLITAN CITIES
1 Ahmedabad M.Corp. 3500 2800 80 700 20
2 Bangalore M.Corp. 5000 3900 78 1100 22
3 Bhopal M.Corp. 1500 200 13 300 20
4 Calcutta M.Corp. 4870 2200 45 1300 27
5 Chennai M.Corp. 4363 4100 94 - -
6 Coimbatore M.Corp. 971 270 28 388 40
7 Delhi M.Corp. 12000 8500 71 - -
8 Greater Mumbai M.Corp. 11100 8400 76 2000 18
9 Hyderabad M.Corp. 4163 2350 56 - -
10 Indore M.Corp. 1600 640 40 480 30
11 Jaipur M.Corp. 2000 1000 50 860 43
12 Kanpur M.Corp. 2500 1500 60 1000 40
13 Kochi M.Corp. 680 20 3 - -
14 Lucknow M.Corp. 2500 800 32 950 38
15 Ludhiana M.Corp. 2000 1200 60 38 2
16 Madurai M.Corp. 1020 350 34 27 3
17 Nagpur M.Corp. 2100 1260 60 112 5
18 Pune M.Corp. 2300 1732 75 500 22
19 Surat M.Corp. 2300 1200 52 1000 43
20 Vadodara M.Corp. 1400 875 63 375 27
21 Varanasi M.Corp. 1150 700 61 449 3922 Visakhapatnam M.Corp. 1280 90 7 578 45
Source: Respective urban local governments/relevant agencies, NIUA Survey, 1999.
Sl. No. City/town Population 1999 Population covered by Population covered by Septic
('000) Sewerage System Tanks and Low Cost Sanitation (LCS)
Number ('000) % Number ('000) %
1 2 3 4 5 6
B-12 : Population Covered by Safe Sanitation

7/21/2019 Status Watersupply
http://slidepdf.com/reader/full/status-watersupply 640/869
CLASS IAndhra Pradesh
1 Anantapur MCl 250 - - 175 70
2 Chittoor M 149 - - 125 84
3 Cuddapah MCl 166 - - 141 85
4 Eluru M 247 100 40 147 60
5 Guntur MCl 557 100 18 - -
6 Hindupur M 140 - - 29 21
7 Kakinada M 325 - - 233 72
8 Kurnool MCl 282 - - 24 9
9 Machilipatnam M 200 - - 170 85
10 Nandyal MCl 150 - - 43 2911 Nellore MCl 404 - - 183 45
12 Nizamabad M 285 - - 27 9
13 Qutubullapur M 250 - - 110 44
14 Tenali M 170 - - 16 9
15 Tirupati MCl 210 - - 170 81
16 Vijaywada M.Corp. 837 292.9 35 544 65
17 Warangal M.Corp. 680 - - 188 28
Bihar
18 Bihar Sharif M 250 - - 22 9
19 Gaya M.Corp. 400 - - 300 75
20 Katihar M 200 - - 20 1021 Munger M 210 - - 52 25
Gujarat
22 Anand M 175 105 60 60 34
23 Bharuch M 159 - - 30 19
24 Bhavnagar M.Corp. 550 300 55 125 23
6 2 0
Sl. No. City/town Population 1999 Population covered by Population covered by Septic
('000) Sewerage System Tanks and Low Cost Sanitation (LCS)
Number ('000) % Number ('000) %
1 2 3 4 5 6

7/21/2019 Status Watersupply
http://slidepdf.com/reader/full/status-watersupply 641/869
25 Bhuj M 118 106 90 11 926 Jamnagar M.Corp. 500 - - 250 50
27 Junagadh M 165 - - 8 5
28 Nadiad M 300 140 47 60 20
29 Navsari M 139 118 85 - -
30 Porbandar M 142 - - 90 63
31 Rajkot M.Corp. 1000 550 55 64 6
32 Surendranagar M 150 - - 150 100
Haryana
33 Ambala MCl 141 18.16 13 122 87
34 Faridabad M.Corp. 1150 632.5 55 - -
35 Gurgaon MCl 175 109 62 29 1736 Hissar MCl 250 130 52 25 10
37 Karnal MCl 220 - - 31 14
38 Rohtak MCl 243 183 75 50 21
Karnataka
39 Bellary CMC 297 129 43 30 10
40 Davangere MCl 455 - - 46 10
41 Gadag-Betigeri CMC 148 - - 65 44
42 Gulbarga M.Corp. 450 - - 75 17
43 Hubli-Dharwad M.Corp. 850 - - 102 12
44 Mandya M 140 - - 56 40
45 Mangalore M.Corp. 410 250 61 10 2
46 Mysore M.Corp. 1050 400 38 150 14
47 Shimoga CMC 222 80.6 36 - -
48 Tumkur M 300 - - 50 17
Kerala
49 Alappuzha MC 200 - - 150 75
6 2 1
Sl. City/town Population 1999 Population covered by Population covered by Septic
No. ('000) Sewerage System Tanks and Low Cost Sanitation (LCS)
Number ('000) % Number ('000) %
1 2 3 4 5 6

7/21/2019 Status Watersupply
http://slidepdf.com/reader/full/status-watersupply 642/869
50 Kollam MC 160 - - 112 7051 Kozhikode M.Corp. 493 - - 450 91
52 Thalaserry M 134 - - 29 21
53 Thiruvananthapuram M.Corp. 585 - - 585 100
Madhya Pradesh
54 Guna M 125 - - 75 60
55 Gwalior M.Corp. 900 516 57 200 22
56 Jabalpur M.Corp. 1000 - - 900 90
57 Morena M 125 16 13 106 85
58 Ratlam M.Corp. 235 - - 189 80
59 Rewa M.Corp. 180 - - 103 57
60 Satna M.Corp. 200 - - 172 8661 Shivpuri M 140 5 4 100 71
Maharashtra
62 Amravati M.Corp. 500 - - 350 70
63 Aurangabad M.Corp. 868 684 79 155 18
64 Bhusawal M.Cl. 200 - - 113 57
65 Chandrapur MCl 295 n.a. n.a. n.a. n.a.
66 Dhule MCl 330 150 45 105 32
67 Ichalkaranji MCl 250 197.5 79 53 21
68 Jalgaon MCl 400 - - 217 54
69 Kolhapur M.Corp. 502 200 40 - -
70 Nanded Waghala M.Corp. 410 250 61 150 37
71 Nashik M.Corp. 839 500 60 336 40
72 Parbhani MCl 233 - - 28 12
73 Solapur M.Corp. 900 810 90 - -
74 Wardha M 150 - - 10 7
75 Yavatmal MCl 130 - - 43 33
6 2 2
Sl. City/town Population 1999 Population covered by Population covered by Septic
No. ('000) Sewerage System Tanks and Low Cost Sanitation (LCS)
Number ('000) % Number ('000) %
1 2 3 4 5 6

7/21/2019 Status Watersupply
http://slidepdf.com/reader/full/status-watersupply 643/869

7/21/2019 Status Watersupply
http://slidepdf.com/reader/full/status-watersupply 644/869
100 Thanjavur M 217 - - 19 9101 Tiruchirapalli M.Corp. 800 80 10 280 35
102 Tirunelveli M.Corp. 414 70 17 - -
103 Tirunvannamalai M 129 - - 7 5
104 Tiruppur M 295 - - 229 78
105 Tuticorin M 217 40 18 - -
106 Vellore M 176 - - 175 99
Uttar Pradesh
107 Aligarh M.Corp. 600 120 20 350 58
108 Allahabad M.Corp. 1015 600 59 415 41
109 Bareilly M.Corp. 750 300 40 150 20
110 Etawah MB 140 - - 70 50111 Firozabad MB 250 - - 100 40
112 Ghaziabad M.Corp. 887 762 86 125 14
113 Gorakhpur M.Corp. 600 300 50 75 13
114 Haldwani-cum-Kathgodam MB 141 - - 28 20
115 Hapur MB 200 75 38 19 9
116 Hardwar MB 300 184 61 - -
117 Jhansi MB 507 - - 230 45
118 Mathura MB 400 50 13 - -
119 Meerut M.Corp. 1250 315 25 650 52
120 Mirzapur MB 210 153.168 73 57 27
121 Muzaffarnagar MB 325 - - 241 74
122 Rae Bareli MB 175 - - 105 60
123 Saharanpur MB 540 - - 178 33
124 Sitapur MB 150 - - 150 100
125 Unnao MB 121 - - 33 27
6 2 4
Sl. City/town Population 1999 Population covered by Population covered by Septic
No. ('000) Sewerage System Tanks and Low Cost Sanitation (LCS)
Number ('000) % Number ('000) %
1 2 3 4 5 6

7/21/2019 Status Watersupply
http://slidepdf.com/reader/full/status-watersupply 645/869
West Bengal126 Asansol M.Corp. 315 36 11 183 58
127 Berhampore M 143 n.a. n.a. n.a. n.a.
128 Balurghat M 132 - - 130 98
129 Bankura M 151 - - 126 83
130 Barasat M 150 - - 120 80
131 Burdwan M 323 - - 240 74
132 Halisahar M 149 - - 16 11
133 Krishna Nagar M 145 - - 116 80
134 Midnapur M 158 - - 125 79
135 North Barrackpur M 118 - - 20 17
136 Santipur M 134 - - 65 49137 Siliguri M.Corp. 500 - - 341 68
Small States
Manipur
138 Imphal MCl 245 - - 177 72
Meghalaya
139 Shillong MB 217 - - 209 96
Tripura
140 Agartala MCl 200 - - 176 88
Union Territories
141 Chandigarh M.Corp. 850 850 100 - -
142 Pondicherry 290 83 29 103 35
Source: Respective urban local governments/relevant agencies, NIUA Survey, 1999.
6 2 5
Sl. City/town Population 1999 Population covered by Population covered by Septic
No. ('000) Sewerage System Tanks and Low Cost Sanitation (LCS)
Number ('000) % Number ('000) %
1 2 3 4 5 6

7/21/2019 Status Watersupply
http://slidepdf.com/reader/full/status-watersupply 646/869
CLASS IIAndhra Pradesh
1 Anakapalle M 115 - - 25 22
2 Dharmavaram M 100 - - 10 10
3 Gudur MCl 72 - - 39 54
4 Kapra M 120 - - 98 82
5 Kavali MCl 85 - - 31 36
6 Madanapalle M 100 - - 94 94
7 Rajendra Nagar MCl 120 - - 20 16
8 Sangareddy MCl 60 - - 22 37
9 Srikakulam MCl 100 - - 100 100
10 Srikalahasti M 70 - - 70 10011 Suryapet MCl 89 - - 46 51
Bihar
12 Buxar M 67 - - 56 83
13 Deoghar M 100 - - 40 40
14 Hajipur M 115 - - 2 2
15 Jehanabad M 57 - - 30 53
16 Madhubani M 65 - - 35 54
Gujarat
17 Amreli M 85 - - 64 75
18 Ankleswar M 60 40 67 - -
19 Dabhoi M 65 7 11 33 50
20 Dohad M 78 - - 70 90
21 Gondal M 100 - - 80 80
22 Jetpur M 125 - - 125 100
23 Mahesana M 138 100 72 20 14
24 Palanpur M 117 - - 100 85
6 2 6
Sl. City/town Population 1999 Population covered by Population covered by Septic
No. ('000) Sewerage System Tanks and Low Cost Sanitation (LCS)
Number ('000) % Number ('000) %
1 2 3 4 5 6

7/21/2019 Status Watersupply
http://slidepdf.com/reader/full/status-watersupply 647/869
Haryana25 Jind MCl 114 72 63 42 37
26 Kaithal MCl 95 51 54 13 14
27 Rewari MCl 105 65 62 40 38
28 Thanesar MCl 100 65 65 21 21
Karnataka
29 Bagalkot CMC 100 - - 32 32
30 Chikmaglur CMC 100 60 60 40 40
31 Gokak CMC 68 - - 25 37
32 Kolar CMC 112 7.5 7 - -
33 Rabkavi-Banhatti CMC 72 - - 72 100
34 Ramanagaram CMC 70 - - 40 57Kerala
35 Changanessary MC 62 - - 7 10
36 Payyanur M 71 - - 9 12
37 Taliparamba M 52 - - 9 17
38 Thrissur MC 91 - - 55 60
Madhya Pradesh
39 Mandsaur M 123 - - 62 50
40 Nagda M 100 n.a. n.a. n.a. n.a.
41 Sehore M 100 - - 80 80
42 Shahdol M 75 - - 56 75
43 Vidisha M 125 - - 57 46
Maharashtra
44 Amalner MCl 100 - - 76 76
45 Ballarpur MCl 109 - - 74 67
46 Bhandara M 76 - - 45 59
47 Kamptee MCl 95 - - 12 12
6 2 7
Sl. City/town Population 1999 Population covered by Population covered by Septic
No. ('000) Sewerage System Tanks and Low Cost Sanitation (LCS)
Number ('000) % Number ('000) %
1 2 3 4 5 6

7/21/2019 Status Watersupply
http://slidepdf.com/reader/full/status-watersupply 648/869
48 Manmad MCl 87 - - 50 5749 Ratnagiri MCl 70 - - 28 40
50 Satara MCl 100 - - 95 95
51 Virar MCl 100 - - 100 100
Punjab
52 Ferozepur MCl 93 67 72 26 28
53 Kapurthala M 85 53 63 32 37
54 Mansa MCl 67 33 50 - -
55 Phagwara MCl 108 49 45 43 40
56 Sangrur MCl 70 49 70 21 30
Rajasthan
57 Barmer M 84 - - 60 7158 Bundi M 80 - - 25 31
59 Hanumangarh M 125 - - 50 40
60 Sawai Madhopur M 89 - - 44 49
Tamil Nadu
61 Ambur M 86 - - 43 50
62 Arakkonam M 88 - - 10 11
63 Attur M 64 - - 56 88
64 Cumbum M 54 - - 34 63
65 Dharmapuri M 67 - - 34 51
66 Gudiyatham M 95 - - 91 95
67 Nagapattinam M 112 28 25 80 71
68 Pudukkottai M 108 - - 75 69
69 Sivakasi M 70 - - 35 50
70 Srivilliputtur M 74 n.a. n.a. n.a. n.a.
71 Tindivanam M 70 - - 70 100
72 Udhagamandalam M 100 51 51 49 49
6 2 8
Sl. City/town Population 1999 Population covered by Population covered by Septic
No. ('000) Sewerage System Tanks and Low Cost Sanitation (LCS)
Number ('000) % Number ('000) %
1 2 3 4 5 6

7/21/2019 Status Watersupply
http://slidepdf.com/reader/full/status-watersupply 649/869
Uttar Pradesh73 Auraiya MB 90 - - 46 51
74 Balrampur MB 110 - - 18 16
75 Basti MB 110 - - 65 59
76 Bhadohi MB 125 - - 75 60
77 Chandpur MB 80 - - 36 45
78 Etah MB 135 40 30 95 70
79 Ghazipur MB 96 - - 38 40
80 Gonda MB 114 - - 48 42
81 Lakhimpur MB 100 - - 70 70
82 Lalitpur MB 100 - - 89 89
83 Mughalsarai MB 160 - - 136 8584 Nawabganj-Barabanki MB 90 - - 60 67
85 Orai MB 170 - - 150 88
86 Roorkee MB 100 60 60 34 34
West Bengal
87 Bishnupur M 67 - - 49 72
88 Chakdaha M 90 - - 59 66
89 Contai M 114 - - 90 79
90 Cooch Behar M 99 - - 60 60
91 Darjeeling M 93 30 32 63 68
92 Jalpaiguri M 101 - - 30 29
93 Jangipur M 78 - - 36 46
94 Katwa M 68 - - 50 74
95 Raniganj M 121 - - 87 72
Small States
Himachal Pradesh
96 Shimla M.Corp. 111 72 65 39 35
6 2 9
Sl. City/town Population 1999 Population covered by Population covered by Septic
No. ('000) Sewerage System Tanks and Low Cost Sanitation (LCS)
Number ('000) % Number ('000) %
1 2 3 4 5 6

7/21/2019 Status Watersupply
http://slidepdf.com/reader/full/status-watersupply 650/869
Nagaland97 Kohima TC 103 - - 10 10
Others (Smaller than Class II towns)
Small States
Arunachal Pradesh
98 Itanagar NTAC 34 - - 28 84
Goa
99 Panaji MCl 57 30 52 14 25
Union Territories
100 Silvassa 20 - - 20 100
Source: Respective urban local governments/relevant agencies, NIUA Survey, 1999.
6 3 0
Sl. City/town Population 1999 Population covered by Population covered by Septic
No. ('000) Sewerage System Tanks and Low Cost Sanitation (LCS)
Number ('000) % Number ('000) %
1 2 3 4 5 6

7/21/2019 Status Watersupply
http://slidepdf.com/reader/full/status-watersupply 651/869
B -1 3
N U M
B E R OF I NDI V I D
UA L A ND C O M
M U NI T Y
T O
I L E T S

7/21/2019 Status Watersupply
http://slidepdf.com/reader/full/status-watersupply 652/869

7/21/2019 Status Watersupply
http://slidepdf.com/reader/full/status-watersupply 653/869
METROPOLITAN CITIES
1 Ahmedabad M.Corp. 35000 - 18000 - -
2 Bangalore M.Corp. - - 500 15 -
3 Bhopal M.Corp. 210000 - 725 - 6500
4 Calcutta M.Corp. 50000 - 5000 - -
5 Chennai M.Corp. - - 757 793 -
6 Coimbatore M.Corp. 892 - 135 - -
7 Delhi M.Corp. - - 16200 - -
8 Greater Mumbai M.Corp. - - 27000 1200 -
9 Hyderabad M.Corp. 21311 n.a. n.a. n.a. n.a.
10 Indore M.Corp. 26992 - 1440 25 20000
11 Jaipur M.Corp. 215000 4816 70 - 10000
12 Kanpur M.Corp. 37222 - - - -
13 Kochi M.Corp. - - 70 - -
14 Lucknow M.Corp. 81250 - 263 - 13500
15 Ludhiana M.Corp. 6310 - 314 - -
16 Madurai M.Corp. 46297 - 501 - -
17 Surat M.Corp. - - 3150 - -
18 Varanasi M.Corp. - - 811 - -
19 Visakhapatnam M.Corp. 12863 348 123 74 -
Source: Respective urban local governments/relevant agencies, NIUA Survey, 1999.
6 3 3
Sl. City/ town No. of individual pour No. of community latrines No. of dry lat
No. flush latrines
Existing Under Existing Under Existingconstruction construction co
1 2 3 4 5 6
B-13 : Number of Individual and Community Toilets

7/21/2019 Status Watersupply
http://slidepdf.com/reader/full/status-watersupply 654/869
CLASS IAndhra Pradesh
1 Anantapur MCl 3737 100 10 - -
2 Chittoor M 630 1749 39 - 380
3 Cuddapah MCl 6500 1000 35 - -
4 Eluru M - - 58 16 -
5 Kakinada M - - 107 - -
6 Kurnool MCl 5668 1395 40 2 -
7 Machilipatnam M - - 16 - -
8 Nandyal MCl 6978 - 68 - -
9 Nellore MCl 2100 400 18 - -
10 Nizamabad M 5371 2496 14 3 -11 Qutubullapur M 2000 - 19 1 -
12 Tirupati MCl 18319 - 16 - 3500
13 Warangal M.Corp. 9975 - 54 - -
Bihar
14 Bihar Sharif M 100 - 12 - 200
15 Chhapra M - - 14 - -
16 Gaya M.Corp. - - 12 - -
17 Katihar M 100 - - - -
18 Munger M - - 120 - -
19 Ranchi M.Corp. - - 29 2 -
Gujarat20 Anand M - - 112 - -
21 Bharuch M - - 111 - -
22 Bhavnagar M.Corp. 80000 - 500 - -
23 Bhuj M 15000 - 100 - -
24 Jamnagar M.Corp. - - 779 - -
6 3 4
Sl. City/ town No. of individual pour No. of community latrines No. of dry lat
No. flush latrines
Existing Under Existing Under Existingconstruction construction co
1 2 3 4 5 6
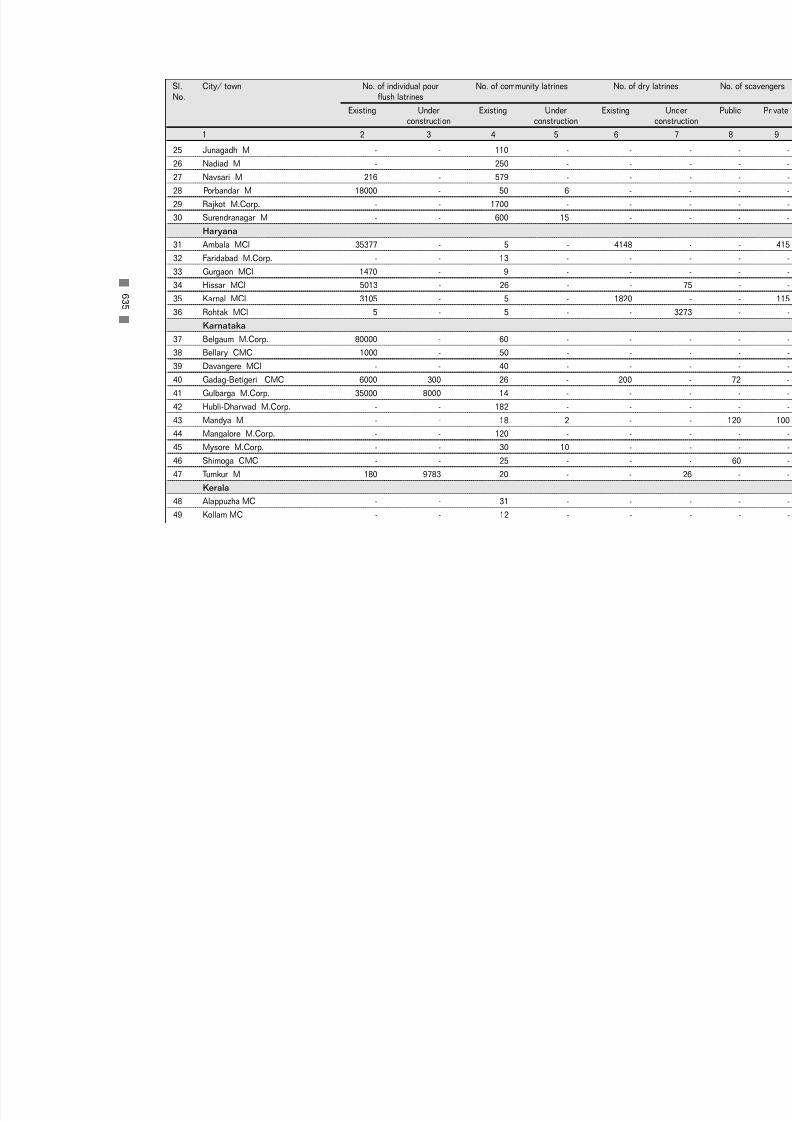
7/21/2019 Status Watersupply
http://slidepdf.com/reader/full/status-watersupply 655/869
25 Junagadh M - - 110 - -26 Nadiad M - - 250 - -
27 Navsari M 216 - 579 - -
28 Porbandar M 18000 - 50 6 -
29 Rajkot M.Corp. - - 1700 - -
30 Surendranagar M - - 600 15 -
Haryana
31 Ambala MCl 35377 - 5 - 4148
32 Faridabad M.Corp. - - 13 - -
33 Gurgaon MCl 1470 - 9 - -
34 Hissar MCl 5013 - 26 - -
35 Karnal MCl 3105 - 5 - 182036 Rohtak MCl 5 - 5 - -
Karnataka
37 Belgaum M.Corp. 80000 - 60 - -
38 Bellary CMC 1000 - 50 - -
39 Davangere MCl - - 40 - -
40 Gadag-Betigeri CMC 6000 300 26 - 200
41 Gulbarga M.Corp. 35000 8000 14 - -
42 Hubli-Dharwad M.Corp. - - 182 - -
43 Mandya M - - 18 2 -
44 Mangalore M.Corp. - - 120 - -
45 Mysore M.Corp. - - 30 10 -46 Shimoga CMC - - 25 - -
47 Tumkur M 180 9783 20 - -
Kerala
48 Alappuzha MC - - 31 - -
49 Kollam MC - - 12 - -
6 3 5
Sl. City/ town No. of individual pour No. of community latrines No. of dry lat
No. flush latrines
Existing Under Existing Under Existingconstruction construction co
1 2 3 4 5 6

7/21/2019 Status Watersupply
http://slidepdf.com/reader/full/status-watersupply 656/869
50 Kozhikode M.Corp. - - 60 - -51 Thalaserry M - - 8 - -
52 Thiruvananthapuram M.Corp. - - 1135 - -
Madhya Pradesh
53 Bhind M - - 3 - 1497
54 Dewas M.Corp. - - 36 - -
55 Guna M 1500 - 18 - 1435
56 Gwalior M.Corp. 17027 - 10 61 24361
57 Jabalpur M.Corp. - - 117 - 3000
58 Khandwa M 12000 - 24 1 -
59 Morena M 1550 72 10 - 5000
60 Murwara-Katni M.Corp. - - 7 0 19961 Ratlam M.Corp. 17271 - 3 - -
62 Rewa M.Corp. 4688 - 4 3 2761
63 Satna M.Corp. 2540 - 20 - 2400
64 Shivpuri M 1500 - 30 - 1500
Maharashtra
65 Nanded Waghala M.Corp. 6000 500 45 - -
Orissa
66 Cuttack M.Corp. 0 - 35 - -
67 Puri M 2941 - 19 - -
Punjab
68 Amritsar M.Corp. 78879 8433 33 - -69 Bathinda MCl 500 - 10 - 300
70 Hoshiarpur MCl 13487 - 5 - -
71 Jalandhar M. Corp. 59968 1000 16 2 -
72 Moga MCl 273 - 40 - -
73 Patiala M.Corp. 10000 - 16 - 8000
6 3 6
Sl. City/ town No. of individual pour No. of community latrines No. of dry lat
No. flush latrines
Existing Under Existing Under Existingconstruction construction co
1 2 3 4 5 6

7/21/2019 Status Watersupply
http://slidepdf.com/reader/full/status-watersupply 657/869
Rajasthan74 Ajmer MCl 16000 6000 7 6 -
75 Alwar M 6000 - 10 1 536
76 Bhilwara M 20000 450 8 - 95
77 Bikaner M 800 700 4 4 -
78 Jodhpur M.Corp. - - 24 - 3411
79 Kota M.Corp. - - 20 6 6123
80 Sriganganagar M 13495 - 1 - -
Tamil Nadu
81 Cuddalore M 140 - 12 - -
82 Dindigul M n.a. - 68 - -
83 Erode M - - 35 - -84 Kanchipuram M 12703 - 35 - -
85 Kumbakonam M - - 74 - -
86 Nagercoil M - - 48 - -
87 Rajapalaiyam M 1451 - 0 - -
88 Salem M.Corp. - - 138 - -
89 Thanjavur M - - 32 - -
90 Tiruchirapalli M.Corp. 8487 5648 0 - 8487
91 Tirunelveli M.Corp. - - 105 9 2164
92 Tirunvannamalai M - - 8 3 -
93 Tiruppur M 3602 - 39 - 323
94 Tuticorin M - - 22 - -95 Vellore M 12990 - 29 - 1904
Uttar Pradesh
96 Aligarh M.Corp. 40 - 3 2 -
97 Allahabad M.Corp. 87 - 29 - -
98 Bareilly M.Corp. 15000 - 15 - -
6 3 7
Sl. City/ town No. of individual pour No. of community latrines No. of dry lat
No. flush latrines
Existing Under Existing Under Existingconstruction construction co
1 2 3 4 5 6
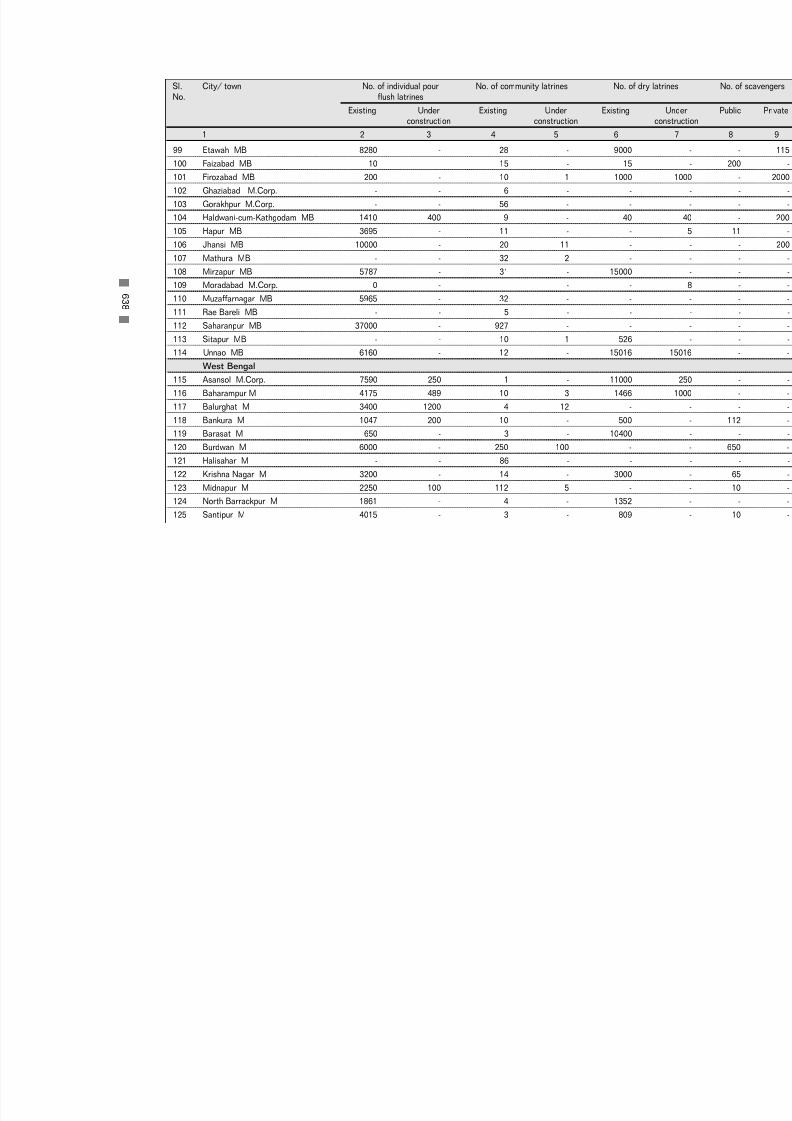
7/21/2019 Status Watersupply
http://slidepdf.com/reader/full/status-watersupply 658/869
99 Etawah MB 8280 - 28 - 9000100 Faizabad MB 10 - 15 - 15
101 Firozabad MB 200 - 10 1 1000
102 Ghaziabad M.Corp. - - 6 - -
103 Gorakhpur M.Corp. - - 56 - -
104 Haldwani-cum-Kathgodam MB 1410 400 9 - 40
105 Hapur MB 3695 - 11 - -
106 Jhansi MB 10000 - 20 11 -
107 Mathura MB - - 32 2 -
108 Mirzapur MB 5787 - 31 - 15000
109 Moradabad M.Corp. 0 - - -
110 Muzaffarnagar MB 5965 - 32 - -111 Rae Bareli MB - - 5 - -
112 Saharanpur MB 37000 - 927 - -
113 Sitapur MB - - 10 1 526
114 Unnao MB 6160 - 12 - 15016
West Bengal
115 Asansol M.Corp. 7590 250 1 - 11000
116 Baharampur M 4175 489 10 3 1466
117 Balurghat M 3400 1200 4 12 -
118 Bankura M 1047 200 10 - 500
119 Barasat M 650 - 3 - 10400
120 Burdwan M 6000 - 250 100 -121 Halisahar M - - 86 - -
122 Krishna Nagar M 3200 - 14 - 3000
123 Midnapur M 2250 100 112 5 -
124 North Barrackpur M 1861 - 4 - 1352
125 Santipur M 4015 - 3 - 809
6 3 8
Sl. City/ town No. of individual pour No. of community latrines No. of dry lat
No. flush latrines
Existing Under Existing Under Existingconstruction construction co
1 2 3 4 5 6

7/21/2019 Status Watersupply
http://slidepdf.com/reader/full/status-watersupply 659/869

7/21/2019 Status Watersupply
http://slidepdf.com/reader/full/status-watersupply 660/869
Bihar11 Buxar M 143 - 4 - -
12 Deoghar M - - 2 - -
13 Hajipur M - - 12 - -
14 Hazaribagh M - - 4 - -
15 Jehanabad M - - 5 - -
16 Madhubani M - - 9 - -
17 Mokama M - - 5 - -
Gujarat
18 Amreli M - - 119 - -
19 Ankleswar M - - 354 - -
20 Dabhoi M 12000 - 80 - -21 Dohad M - - 90 - -
22 Gondal M - - 105 - -
23 Jetpur M - - 240 - -
24 Palanpur M - - 120 - -
Haryana
25 Jind MCl 1126 - 1 1 1270
26 Kaithal MCl - - 6 - -
27 Rewari MCl - - 4 1 -
28 Thanesar MCl 785 100 3 - 1021
Karnataka
29 Bagalkot CMC 400 - 15 - -
30 Gokak CMC 10000 - 299 - -
31 Hospet CMC - - - - -
32 Rabkavi-Banhatti CMC - - - 2 -
33 Ramanagaram CMC - - 1 - -
6 4 0
Sl. City/ town No. of individual pour No. of community latrines No. of dry lat
No. flush latrines
Existing Under Existing Under Existingconstruction construction co
1 2 3 4 5 6

7/21/2019 Status Watersupply
http://slidepdf.com/reader/full/status-watersupply 661/869
Kerala34 Changanessary MC 2500 - 22 - -
35 Payyanur M 1000 25 6 - -
36 Taliparamba M 5000 - - - -
37 Thrissur MC - - 18 - -
Madhya Pradesh
38 Hoshangabad M - - 2 - 1000
39 Itarsi M 327 - 2 - 1000
40 Khargone M 5000 - 31 - 1090
41 Mandsaur M 5417 - 60 - 634
42 Nagda M 532 - - 1 505
43 Neemuch M - - 32 2 -
44 Sehore M 9000 - 6 - 550
45 Shahdol M 4600 200 8 - -
46 Vidisha M - - 7 6 400
Maharashtra
47 Amalner MCl - - 407 - -
48 Ballarpur MCl 6393 20 1152 6 -
49 Bhandara M 9800 - 208 - -
50 Kamptee MCl 407 - 32 - -
51 Manmad MCl 500 2000 6 7 -
52 Ratnagiri MCl 4282 41 284 - -
Punjab
53 Ferozepur MCl 13250 200 4 - 206
54 Kapurthala M 7422 - 2 - -
55 Phagwara MCl 7174 - 17 1 13800
56 Sangrur MCl 10519 - 3 - -
6 4 1
Sl. City/ town No. of individual pour No. of community latrines No. of dry lat
No. flush latrines
Existing Under Existing Under Existingconstruction construction co
1 2 3 4 5 6

7/21/2019 Status Watersupply
http://slidepdf.com/reader/full/status-watersupply 662/869
Rajasthan57 Banswara M 322 - - - -
58 Barmer M - - 6 1 -
59 Bundi M 1205 - 2 - 1651
60 Hanumangarh M 5000 3000 6 - 6000
61 Sawai Madhopur M 1475 1000 2625 1775 3399
Tamil Nadu
62 Ambur M 6872 - 9 - -
63 Arakkonam M - - 9 - -
64 Attur M - - 32 - -
65 Cumbum M - - 21 - -
66 Dharmapuri M 6806 - 18 2 -67 Gudiyatham M - - 19 - -
68 Sivakasi M 4948 - 32 - -
69 Srivilliputtur M - 1739 6 - -
70 Tindivanam M - - 13 - -
71 Udhagamandalam M 34 - 37 - -
Uttar Pradesh
72 Auraiya MB 2000 - 5 - 2000
73 Basti MB 5000 - 8 2 5000
74 Bhadohi MB 1500 - - - -
75 Chandpur MB 4300 200 4 - -
76 Etah MB - - 6 - -77 Ghazipur MB 7561 - 8 - -
78 Gonda MB - - 6 - -
79 Lakhimpur MB 6000 - 6 2000
80 Lalitpur MB 196 - 14 - -
81 Mughalsarai MB - - 15 - -
6 4 2
Sl. City/ town No. of individual pour No. of community latrines No. of dry lat
No. flush latrines
Existing Under Existing Under Existingconstruction construction co
1 2 3 4 5 6

7/21/2019 Status Watersupply
http://slidepdf.com/reader/full/status-watersupply 663/869
82 Nawabganj-Barabanki MB 3949 - 8 1 5083 Orai MB - - - - 200
84 Roorkee MB 30 - - - -
West Bengal
85 Bishnupur M 861 - - - 350
86 Chakdaha M 4390 220 15 - 6016
87 Contai M 1700 250 7 - -
88 Cooch Behar M 1500 41 5 - -
89 Darjeeling M 117 - 117 - -
90 Jalpaiguri M 3000 - 7 - 4000
91 Jangipur M 2721 - 22 - 1621
92 Katwa M 3669 - 18 - 3793 Raniganj M 1212 300 21 - 100
Small States
Himachal Pradesh
94 Shimla M.Corp. 8140 - 86 - 97
Nagaland
95 Kohima TC 2000 100 10 40 50
Union Teritories
96 Port Blair MCl - - 51 - -
Others (Smaller than Class II towns)
Small States
Goa97 Panaji MCl 9950 35 21 - -
Union Teritories
98 Silvassa - - 120 20 -
Source: Respective urban local governments/relevant agencies, NIUA Survey, 1999.
6 4 3
Sl. City/ town No. of individual pour No. of community latrines No. of dry lat
No. flush latrines
Existing Under Existing Under Existingconstruction construction co
1 2 3 4 5 6

7/21/2019 Status Watersupply
http://slidepdf.com/reader/full/status-watersupply 664/869

7/21/2019 Status Watersupply
http://slidepdf.com/reader/full/status-watersupply 665/869
A P P E NDI X I I I
M U
NI C I P A L
S OL I D WA S T E M
A NA GE ME NT ,1 9 9 9

7/21/2019 Status Watersupply
http://slidepdf.com/reader/full/status-watersupply 666/869

7/21/2019 Status Watersupply
http://slidepdf.com/reader/full/status-watersupply 667/869
Cl a s sI Ci t i e s
6 6 8
C
l a s sI I T own s
6 7 6
C- 3
T
r an s p or t a t i on of S ol i d W a s t e ,
1 9 9 9
6 8 3
M e t r o p ol i t an Ci t i e s
6 8 5
Cl a s sI Ci t i e s
6 8 6
Cl a s sI I T own s
6 9 3
C-4
T
r an s p or t a t i on V eh i cl e s an d t h ei r D e t ai l s
6 9 9
M e t r o p ol i t an Ci t i e s
7 0 1
Cl a s sI Ci t i e s
7 0 5
Cl a s sI I T own s
7 2 6
C- 5
D
i s p o s al of S ol i d W a s t e ,1 9 9 9
7 3 9
M e t r o p ol i t an Ci t i e s
7 4 1
Cl a s sI Ci t i e s
7 4 2
Cl a s sI I T own s
7 4 9
C- 6
C
om p o s t i n gD e t ai l s ,1 9 9 9
7 5 5
M e t r o p ol i t an Ci t i e s
7 5 7
Cl a s sI Ci t i e s
7 5 7
Cl a s sI I T own s
7 5 9
C-7
L
an d f i l l D e t ai l s ,1 9 9 9
7 6 1
M e t r o p ol i t an Ci t i e s
7 6 3
Cl a s sI Ci t i e s
7 6 3
Cl a s sI I T own s
7 6 6
C- 8
S
t af f P o si t i on ,1 9 9 9
7 6 9
M e t r o p ol i t an Ci t i e s
7 7 1
Cl a s sI Ci t i e s
7 7 2
Cl a s sI I T own s
7 7 9
C- 9
P
r i v a t i s a t i on ,1 9 9 9
7 8 5
M e t r o p ol i t an Ci t i e s
7 8 7
Cl a s sI Ci t i e s
7 8 7
Cl a s sI I T own s
7 9 0
7/21/2019 Status Watersupply
http://slidepdf.com/reader/full/status-watersupply 668/869
p
Cl a s sI Ci t i e s
8 1 7
Cl a s sI I T own s
8 1 9
C-1 3
C
a pi t al W or k s t o b e Un d er t ak e
ni nF u t ur e
8 2 3
M e t r o p ol i t an Ci t i e s
8 2 5
Cl a s sI Ci t i e s
8 2 5
Cl a s sI I T own s
8 2 7

7/21/2019 Status Watersupply
http://slidepdf.com/reader/full/status-watersupply 669/869
C -1
P OP UL A T I O N ,A R E A
A ND C O V E R A G
E ,1 9 9 9

7/21/2019 Status Watersupply
http://slidepdf.com/reader/full/status-watersupply 670/869

7/21/2019 Status Watersupply
http://slidepdf.com/reader/full/status-watersupply 671/869
Metropolitan Cities
1 Ahmedabad M.Corp. 2,877 3,500 100 186.78 190.84 10
2 Bangalore M.Corp. 2,660 5,000 100 125.90 227.00 10
3 Bhopal M.Corp. 1,063 1,500 100 284.09 284.09 10
4 Calcutta M.Corp. 4,400 4,870 100 187.33 187.33 10
5 Chennai M.Corp. 3,841 4,363 100 174.00 174.00 10
6 Coimbatore M.Corp. 816 971 100 105.60 105.60 10
7 Delhi M.Corp. 7,207 12,000 63 1399.26 1484.46 n.
8 Greater Mumbai M.Corp. 9,926 11,100 100 437.71 437.71 10
9 Hyderabad M.Corp. 2,965 4,163 100 172.68 172.68 10
10 Indore M.Corp. 1,092 1,600 75 137.17 137.17 7
11 Jaipur M.Corp. 1,458 2,000 100 200.40 200.40 10
12 Kanpur M.Corp. 1,874 2,500 86 106.00 227.67 n.
13 Kochi M.Corp. 565 680 100 94.88 94.88 10
14 Lucknow M.Corp. 1,619 2,500 70 310.10 310.00 9
15 Ludhiana M.Corp. 1,043 2,000 40** 134.67 165.00 4
16 Madurai M.Corp. 941 1,020 100 46.99 51.96 10
17 Nagpur M.Corp. 1,625 2,100 100 217.17 217.56 10
18 Pune M.Corp. 1,567 2,300 100 146.11 416.11 10
19 Surat M.Corp. 1,499 2,300 100 111.16 111.16 10
20 Vadodara M.Corp. 1,031 1,400 100 108.26 108.26 10
21 Varanasi M.Corp. 929 1,152 81 73.89 73.89 8
22 Visakhapatnam M.Corp. 752 1,280 100 78.33 107.00 10
Total-Metropolitan Cities 51,749 70,299 90 4838.48 5484.77
* Estimated by respective local governments/relevant agencies . ** Remaining population of Ludhiana is covered by CBOs Source: Respective urban local governments/relevant agencies, NIUA Survey, 1999.
6 5 1
Sl. City/Town Population ('000) % Population Area (Sq.km.) % a
No 1991 1999 covered 1991 1999 cove(Census) (Estimated)* by service (Census) (Estimated)* by se
1999 19
1 2 3 4 5 6 7
C-1 : Population, Area and Coverage, 1999

7/21/2019 Status Watersupply
http://slidepdf.com/reader/full/status-watersupply 672/869
CLASS I
Andhra Pradesh
1 Anantapur MCl 175 250 100 16.35 16.35 10
2 Chittoor M 133 149 100 33.57 33.57 10
3 Cuddapah MCl 121 166 100 7.50 7.50 10
4 Eluru M 213 247 100 14.55 14.55 10
5 Guntur MCl 471 557 100 30.01 45.79 10
6 Hindupur M 105 140 100 38.16 38.16 10
7 Kakinada M 280 325 85 30.51 30.51 8
8 Kurnool MCl 237 282 100 15.01 15.01 10
9 Machilipatnam M 159 200 100 26.67 26.67 10
10 Nandyal MCl 120 150 100 15.42 15.42 10
11 Nellore MCl 317 404 100 48.39 48.39 10
12 Nizamabad M 241 285 100 36.86 36.86 10
13 Ongole MCl 101 180 100 8.24 8.24 10
14 Qutubullapur M 107 250 100 46.87 46.87 10
15 Rajahmundry M.Corp. 325 380 100 38.90 44.50 10
16 Tenali M 144 170 100 15.11 15.11 10
17 Tirupati MCl 174 210 100 16.07 24.00 10
18 Vijaywada M.Corp. 702 837 100 57.33 57.33 10
19 Warangal M.Corp. 448 680 100 54.98 68.50 10
Bihar20 Bihar Sharif M 201 250 100 23.50 23.50 10
21 Chhapra M 137 200 95 16.96 16.96 n.
22 Gaya M.Corp. 292 400 100 28.62 28.62 10
23 Katihar M 135 200 100 12.00 12.00 10
24 Munger M 150 210 67 17.50 19.00 8
6 5 2
Sl. City/Town Population ('000) % Population Area (Sq.km.) % arNo 1991 1999 covered 1991 1999 cove
(Census) (Estimated)* by service (Census) (Estimated)* by ser1999 199
1 2 3 4 5 6 7
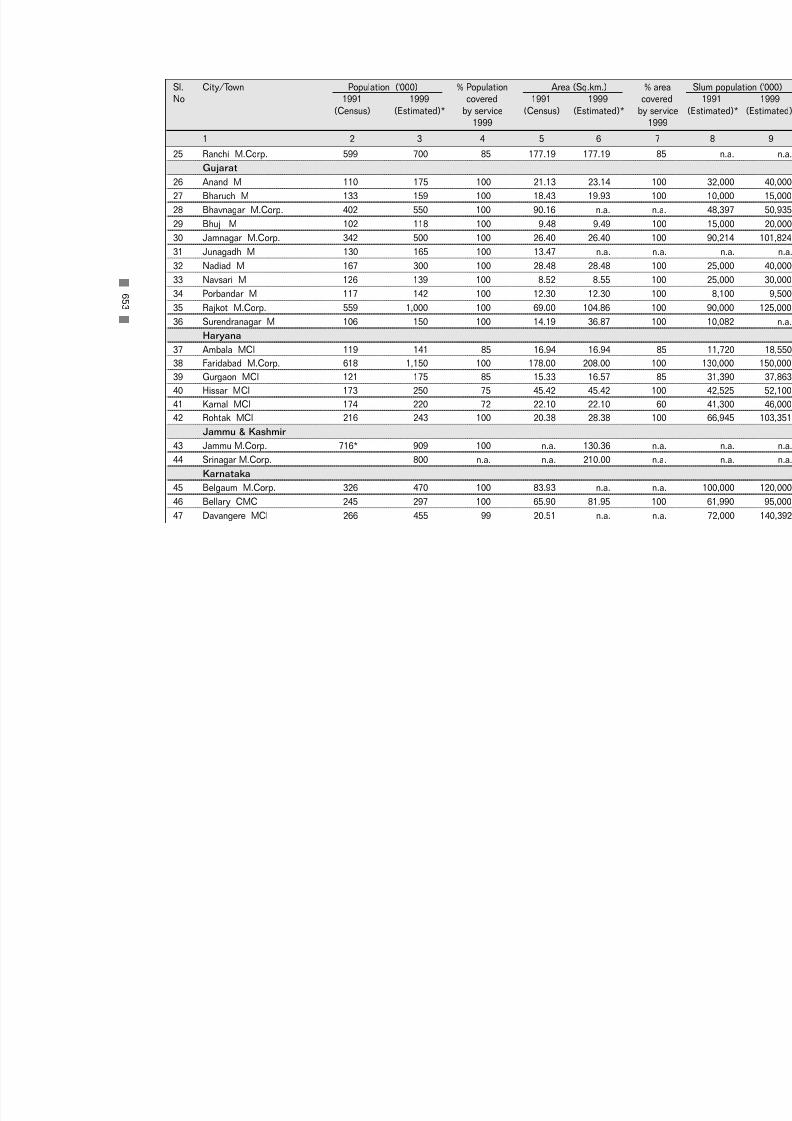
7/21/2019 Status Watersupply
http://slidepdf.com/reader/full/status-watersupply 673/869
25 Ranchi M.Corp. 599 700 85 177.19 177.19 8
Gujarat
26 Anand M 110 175 100 21.13 23.14 10
27 Bharuch M 133 159 100 18.43 19.93 10
28 Bhavnagar M.Corp. 402 550 100 90.16 n.a. n.
29 Bhuj M 102 118 100 9.48 9.49 10
30 Jamnagar M.Corp. 342 500 100 26.40 26.40 10
31 Junagadh M 130 165 100 13.47 n.a. n.
32 Nadiad M 167 300 100 28.48 28.48 10
33 Navsari M 126 139 100 8.52 8.55 10
34 Porbandar M 117 142 100 12.30 12.30 10
35 Rajkot M.Corp. 559 1,000 100 69.00 104.86 10
36 Surendranagar M 106 150 100 14.19 36.87 10
Haryana
37 Ambala MCl 119 141 85 16.94 16.94 8
38 Faridabad M.Corp. 618 1,150 100 178.00 208.00 10
39 Gurgaon MCl 121 175 85 15.33 16.57 8
40 Hissar MCl 173 250 75 45.42 45.42 10
41 Karnal MCl 174 220 72 22.10 22.10 6
42 Rohtak MCl 216 243 100 20.38 28.38 10
Jammu & Kashmir
43 Jammu M.Corp. 716* 909 100 n.a. 130.36 n.44 Srinagar M.Corp. 800 n.a. n.a. 210.00 n.
Karnataka
45 Belgaum M.Corp. 326 470 100 83.93 n.a. n.
46 Bellary CMC 245 297 100 65.90 81.95 10
47 Davangere MCl 266 455 99 20.51 n.a. n.
6 5 3
Sl. City/Town Population ('000) % Population Area (Sq.km.) % arNo 1991 1999 covered 1991 1999 cove
(Census) (Estimated)* by service (Census) (Estimated)* by ser1999 199
1 2 3 4 5 6 7

7/21/2019 Status Watersupply
http://slidepdf.com/reader/full/status-watersupply 674/869
48 Gadag-Betigeri CMC 134 148 100 34.75 n.a. n.
49 Gulbarga M.Corp. 304 450 100 32.14 55.00 10
50 Hubli-Dharwad M.Corp. 648 850 100 190.94 190.94 10
51 Mandya M 120 140 100 17.03 17.03 10
52 Mangalore M.Corp. 273 410 100 73.71 116.77 10
53 Mysore M.Corp. 481 1,050 100 36.69 n.a. n.
54 Shimoga CMC 179 222 100 16.26 n.a. n.
55 Tumkur M 139 300 60 15.32 45.90 n.
Kerala
56 Alappuzha MC 175 200 100 46.77 46.77 10
57 Kollam MC 140 160 100 18.48 18.48 10
58 Kozhikode M.Corp. 420 493 100 82.68 84.23 10
59 Thalaserry M 104 134 100 23.96 n.a. n.
60 Thiruvananthapuram M.Corp. 524 585 100 74.93 78.40 10
Madhya Pradesh
61 Bhind M 110 175 44 17.18 17.18 4
62 Burhanpur M.Corp. 173 210 100 24.00 24.00 10
63 Dewas M.Corp. 164 200 100 100.22 100.22 10
64 Guna M 100 125 100 45.75 45.75 10
65 Gwalior M.Corp. 691 900 100 289.85 n.a. n.
66 Jabalpur M.Corp. 742 1,000 100 133.97 133.97 10
67 Khandwa M 145 175 100 35.77 35.77 1068 Morena M 105* 125 100 12.00* 12.00 10
69 Murwara-Katni M.Corp. 163 180 100 107.10 107.10 10
70 Ratlam M.Corp. 183 235 85 39.19 39.19 8
71 Rewa M.Corp. 129 180 100 54.99 54.99 10
72 Satna M.Corp. 157 200 100 86.77 n.a. n.
6 5 4
Sl. City/Town Population ('000) % Population Area (Sq.km.) % arNo 1991 1999 covered 1991 1999 cove
(Census) (Estimated)* by service (Census) (Estimated)* by ser1999 199
1 2 3 4 5 6 7

7/21/2019 Status Watersupply
http://slidepdf.com/reader/full/status-watersupply 675/869
73 Shivpuri M 108 140 100 81.10 81.10 10Maharashtra
74 Amravati M.Corp. 422 500 100 121.65 121.65 10
75 Aurangabad M.Corp. 573 868 100 138.50 138.50 10
76 Bhusawal M.Cl. 145 200 85 13.38 13.38 7
77 Chandrapur MCl 226 295 100 56.28 56.28 10
78 Dhule MCl 278 330 100 46.46 46.46 10
79 Ichalkaranji MCl 215 250 100 29.89 29.89 10
80 Jalgaon MCl 242 400 100 62.29 65.64 10
81 Kolhapur M.Corp. 406 502 100 66.82 66.82 10
82 Nanded Waghala M.Corp. 275 410 100 20.62 46.00 10
83 Nashik M.Corp. 657 839 100 259.13 259.13 10
84 Parbhani MCl 190 233 100 n.a. 57.60 10
85 Solapur M.Corp. 604 900 100 33.11 n.a. n.
86 Wardha M 103 150 100 7.77 9.04 10
87 Yavatmal MCl 109 130 100 10.17 10.69 10
Orissa
88 Bhubaneswar M.Corp. 412 654 100 124.74 n.a. n.
89 Cuttack M.Corp. 403 563 100 121.91 121.91 n.
90 Puri M 125 150 100 16.84 n.a. n.
91 Rourkela M 140 200 100 33.00 n.a. n.
92 Sambalpur M 131 157 100 46.48 n.a. n.
Punjab
93 Amritsar M.Corp. 709 843 95 114.95 133.00 8
94 Bathinda MCl 159 174 40 97.00 99.00 n.
95 Hoshiarpur MCl 123 145 76 28.21 35.00 7
96 Jalandhar M. Corp. 510 738 91 80.41 110.00 9
6 5 5
Sl. City/Town Population ('000) % Population Area (Sq.km.) % arNo 1991 1999 covered 1991 1999 cove
(Census) (Estimated)* by service (Census) (Estimated)* by ser1999 199
1 2 3 4 5 6 7

7/21/2019 Status Watersupply
http://slidepdf.com/reader/full/status-watersupply 676/869
97 Moga MCl 108 148 80 16.10 18.50 8
98 Pathankot MCl 124 195 100 22.10 22.10 10
99 Patiala M.Corp. 238 328 100 31.20 41.00 10
Rajasthan
100 Ajmer MCl 403 550 100 241.58 n.a. n.
101 Alwar M 205 300 90 48.40 58.15 9
102 Beawar M 105 141 100 17.69 17.69 10
103 Bhilwara M 184 225 100 118.49 n.a. n.
104 Bikaner M 416 600 100 165.75 175.76 10
105 Jodhpur M.Corp. 666 1,000 100 78.60 n.a. n.
106 Kota M.Corp. 537 750 100 221.36 221.36 10
107 Sriganganagar M 161 225 100 20.87 20.87 10
Tamil Nadu
108 Cuddalore M 145 162 100 27.71 27.71 10
109 Dindigul M 182 214 100 14.01 14.01 10
110 Erode M 159 174 100 8.44 8.44 10
111 Kanchipuram M 145 157 100 11.60 11.60 10
112 Kumbakonam M 139 147 100 12.58 12.58 10
113 Nagercoil M 190 206 100 24.27 24.27 10
114 Rajapalaiyam M 114 123 100 11.36 11.36 10
115 Salem M.Corp. 367 447 100 19.94 19.94 10
116 Thanjavur M 202 217 100 15.36 n.a. n.
117 Tiruchirapalli M.Corp. 669* 800 100 23.00 n.a. n.
118 Tirunelveli M.Corp. 374* 414 100 15.15 n.a. n.
119 Tirunvannamalai M 109 129 100 13.64 13.64 10
120 Tiruppur M 236 295 100 43.52 n.a. n.
121 Tuticorin M 200 217 100 13.47 13.47 10
6 5 6
Sl. City/Town Population ('000) % Population Area (Sq.km.) % arNo 1991 1999 covered 1991 1999 cove
(Census) (Estimated)* by service (Census) (Estimated)* by ser1999 199
1 2 3 4 5 6 7

7/21/2019 Status Watersupply
http://slidepdf.com/reader/full/status-watersupply 677/869
6 5 7
122 Vellore M 175 176 100 11.65 11.65 10Uttar Pradesh
123 Agra M.Corp. 892 1,150 75 120.57 120.57 n.
124 Aligarh M.Corp. 481 600 75 34.05 n.a. n.
125 Allahabad M.Corp. 793 1,015 90 62.94 70.05 9
126 Bareilly M.Corp. 587 750 100 106.43 106.43 10
127 Etawah MB 124 140 100 9.35 n.a. n.
128 Faizabad MB 124 170 70 33.47 33.47 n.
129 Firozabad MB 215 250 60 9.17 n.a. n.
130 Ghaziabad M.Corp. 454 887 100 63.79 n.a. n.
131 Gorakhpur M.Corp. 506 600 80 136.58 143.00 8
132 Haldwani-cum-Kathgodam MB 104 141 100 10.62 10.62 10
133 Hapur MB 146 200 75 14.20 14.20 7
134 Hardwar MB 147 300 100 11.91 11.91 10
135 Jhansi MB 301 507 75 46.32 46.32 n.
136 Mathura MB 227 400 67 9.37 n.a. n.
137 Meerut M.Corp. 754 1,250 100 141.94 141.94 10
138 Mirzapur MB 169 210 81 38.85 38.85 6
139 Moradabad M.Corp. 429 670 72 34.19 50.48 8
140 Muzaffarnagar MB 241 325 80 12.04 12.04 8
141 Rae Bareli MB 130 175 75 50.12 n.a. n.
142 Rampur MB 244 317 100 20.20 n.a. n.
143 Saharanpur MB 375 540 50 25.36 25.36 5
144 Sitapur MB 122 150 100 25.90 35.00 10
145 Unnao MB 107 121 100 15.54 21.50 10
West Bengal
146 Asansol M.Corp. 262 315 100 25.12 n.a. n.
Sl. City/Town Population ('000) % Population Area (Sq.km.) % arNo 1991 1999 covered 1991 1999 cove
(Census) (Estimated)* by service (Census) (Estimated)* by ser1999 199
1 2 3 4 5 6 7

7/21/2019 Status Watersupply
http://slidepdf.com/reader/full/status-watersupply 678/869
147 Baharampur M 115 143 100 16.19 16.19 10
148 Balurghat M 120 132 100 6.37 8.50 10
149 Bankura M 115 151 95 19.06 19.06 10
150 Barasat M 103 150 67 20.25 34.50 7
151 Burdwan M 245 323 84 23.04 34.18 8
152 Halisahar M 114 149 n.a. 8.28 n.a. n.
153 Krishna Nagar M 121 145 100 15.96 15.96 10
154 Midnapur M 125 158 100 14.78 18.85 10
155 North Barrackpur M 101 118 100 8.42 12.22 10
156 Santipur M 110 134 100 24.60 25.88 10
157 Siliguri M.Corp. 338* 500 64 15.54 41.90 6
Small States
Assam
158 Guwahati M.Corp. 584 1,400 100 216.79 216.79 10
159 Jorhat MB 112 170 100 9.20 n.a. n.
Manipur
160 Imphal MCl 199 245 100 33.30 33.30 10
Meghalaya
161 Shillong MB 132 217 100 10.36 10.36 10
Tripura
162 Agartala MCl 157 200 100 15.80 16.01 10
Union Territories163 Chandigarh M.Corp. 504 850 94 69.52 n.a. n.
164 Pondicherry M 203 290 100 19.54 19.54 10
* Estimated by respective local governments/relevant agencies
Source: Respective urban local governments/relevant agencies, NIUA Survey, 1999.
6 5 8
Sl. City/Town Population ('000) % Population Area (Sq.km.) % arNo 1991 1999 covered 1991 1999 cove
(Census) (Estimated)* by service (Census) (Estimated)* by ser1999 199
1 2 3 4 5 6 7

7/21/2019 Status Watersupply
http://slidepdf.com/reader/full/status-watersupply 679/869
CLASS II
Andhra Pradesh
1 Anakapalle M 84 115 100 23.28 23.28 10
2 Dharmavaram M 79 100 100 40.45 40.45 10
3 Gudur MCl 56 72 100 9.42 9.42 10
4 Kapra M 88 120 80 43.90 65.00 8
5 Kavali MCl 66 85 100 22.95 22.95 10
6 Madanapalle M 74 100 100 7.74 14.20 10
7 Narasaraopet M 89 95 93 7.65 7.65 9
8 Rajendra Nagar MCl 85 120 100 52.25 52.25 10
9 Sangareddy MCl 50 60 100 13.60 13.69 1010 Srikakulam MCl 89 100 100 14.12 14.12 10
11 Srikalahasti M 62 70 100 24.50 n.a. n.
12 Suryapet MCl 61 89 100 23.54 11.50 10
Bihar
13 Buxar M 56 67 82 5.16 8.50 8
14 Deoghar M 76 100 100 n.a. n.a. n.
15 Hajipur M 88 115 100 19.64 19.64 10
16 Hazaribagh M 98 119 100 26.35 n.a. n.
17 Jehanabad M 52 57 88 8.00 7.00 8
18 Madhubani M 54 65 77 19.00 19.00 7
19 Mokama M 60 66 n.a. 14.18 n.a. n.
Gujarat
20 Amreli M 68 85 100 11.44 13.59 10
21 Ankleswar M 52 60 100 11.05 11.05 10
22 Dabhoi M 51 65 100 23.82 23.82 10
6 5 9
Sl. City/Town Population ('000) % Population Area (Sq.km.) % arNo 1991 1999 covered 1991 1999 cove
(Census) (Estimated)* by service (Census) (Estimated)* by ser1999 199
1 2 3 4 5 6 7

7/21/2019 Status Watersupply
http://slidepdf.com/reader/full/status-watersupply 680/869
23 Dohad M 67 78 100 6.54 7.00 10
24 Gondal M 81 100 100 7.29 11.00 10
25 Jetpur M 74 125 100 10.36 36.00 10
26 Mahesana M 88 138 100 12.87 12.87 10
27 Palanpur M 81 117 100 14.92 23.48 10
Haryana
28 Jind MCl 85 114 70 15.30 15.00 7
29 Kaithal MCl 71 95 81 7.90 n.a. n.
30 Rewari MCl 75 105 100 18.43 n.a. n.
31 Thanesar MCl 81 100 72 32.25 32.25 7
Karnataka32 Bagalkot CMC 77 100 85 33.59 42.00 8
33 Chikmagalur CMC 61 100 100 9.32 n.a. n.
34 Gokak CMC 52 68 100 7.22 n.a. n.
35 Hospet CMC 96 114 100 7.66 n.a. n.
36 Kolar CMC 83 112 100 7.91 n.a. n.
37 Rabkavi-Banhatti CMC 61 72 100 3.62 n.a. n.
38 Ramanagaram CMC 50 70 100 4.96 n.a. n.
Kerala
39 Changanessary MC 52 62 100 13.50 13.50 10
40 Payyanur M 64 71 100 54.63 54.63 10
41 Taliparamba M 60 52 100 43.08 18.21 10
42 Thrissur MC 75 91 100 12.65 16.65 10
Madhya Pradesh
43 Hoshangabad M 71 100 100 24.27 24.27 10
44 Itarsi M 77 105 100 14.07 14.07 10
6 6 0
Sl. City/Town Population ('000) % Population Area (Sq.km.) % arNo 1991 1999 covered 1991 1999 cove
(Census) (Estimated)* by service (Census) (Estimated)* by ser1999 199
1 2 3 4 5 6 7

7/21/2019 Status Watersupply
http://slidepdf.com/reader/full/status-watersupply 681/869
45 Khargone M 67 80 100 10.00 10.00 10
46 Mandsaur M 96 123 100 10.32 10.32 10
47 Nagda M 80 100 80 23.83 18.00 10
48 Neemuch M 86 100 100 13.42 13.42 10
49 Sehore M 71 100 100 16.42 18.00 10
50 Shahdol M 56 75 100 19.92 19.92 10
51 Vidisha M 93 125 100 5.83 5.83 10
Maharashtra
52 Amalner MCl 76 100 100 9.71 9.71 10
53 Ballarpur MCl 84 109 100 16.51 n.a. n.
54 Bhandara M 72 76 100 16.84 16.84 1055 Kamptee MCl 79 95 100 4.27 4.27 10
56 Manmad MCl 61 87 100 28.70 28.70 10
57 Ratnagiri MCl 57 70 100 10.49 10.19 10
58 Satara MCl 95 100 100 7.69 8.16 10
59 Virar MCl 58 100 100 19.52 19.52 10
Punjab
60 Ferozepur MCl 79 93 80 11.33 9.00 8
61 Kapurthala M 65 85 63 56.00 56.00 6
62 Mansa MCl 55 67 100 20.00 23.47 10
63 Phagwara MCl 83 108 80 16.00 12.80 8
64 Sangrur MCl 56 70 75 13.90 18.00 7
Rajasthan
65 Banswara M 67 110 100 16.01 16.01 10
66 Barmer M 69 84 100 10.29 10.29 10
67 Bundi M 65 80 100 22.76 30.00 10
6 6 1
Sl. City/Town Population ('000) % Population Area (Sq.km.) % arNo 1991 1999 covered 1991 1999 cove
(Census) (Estimated)* by service (Census) (Estimated)* by ser1999 199
1 2 3 4 5 6 7

7/21/2019 Status Watersupply
http://slidepdf.com/reader/full/status-watersupply 682/869
68 Churu M 82 100 100 28.00 35.00 10
69 Hanumangarh M 79 125 100 13.42 13.42 10
70 Sawai Madhopur M 72 89 100 59.00 59.00 10
Tamil Nadu
71 Ambur M 76 86 100 18.05 18.05 10
72 Arakkonam M 72 88 100 9.06 9.06 10
73 Attur M 56 64 100 27.62 27.62 10
74 Cumbum M 52 54 100 6.48 6.58 10
75 Dharmapuri M 59 67 100 11.65 11.65 10
76 Gudiyatham M 83 95 100 4.71 4.71 10
77 Nagapattinam M 86 112 100 14.80 14.80 1078 Pudukkottai M 99 108 100 12.95 12.95 10
79 Sivakasi M 66 70 100 6.89 6.89 10
80 Srivilliputtur M 69 74 100 5.72 5.72 10
81 Tindivanam M 62 70 100 22.37 22.37 10
82 Udhagamandalam M 82 100 100 30.67 30.67 10
Uttar Pradesh
83 Auraiya MB 51 90 100 4.24 9.00 10
84 Balrampur MB 60 70 86 14.25 n.a. n.
85 Basti MB 87 110 91 19.43 19.43 9
86 Bhadohi MB 64 125 40 10.36 n.a. n.
87 Chandpur MB 56 80 50 1.53 n.a. n.
88 Etah MB 78 135 65 5.18 n.a. n.
89 Ghazipur MB 77 96 70 13.73 9.45 7
90 Gonda MB 96 114 100 12.67 12.67 10
91 Lakhimpur MB 80 100 100 6.99 9.00 10
6 6 2
Sl. City/Town Population ('000) % Population Area (Sq.km.) % arNo 1991 1999 covered 1991 1999 cove
(Census) (Estimated)* by service (Census) (Estimated)* by ser1999 199
1 2 3 4 5 6 7

7/21/2019 Status Watersupply
http://slidepdf.com/reader/full/status-watersupply 683/869
92 Lalitpur MB 80 100 90 17.35 10.84 10
93 Mughalsarai MB 67 160 75 3.89 n.a. n.
94 Nawabganj-Barabanki MB 65 90 100 3.63 n.a. n.
95 Orai MB 99 170 75 20.29 15.00 10
96 Roorkee MB 80 100 85 n.a. n.a. n.
West Bengal
97 Bishnupur M 56 67 100 22.02 22.02 10
98 Chakdaha M 75 90 50 15.54 7.68 10
99 Contai M 53 114 66 14.25 9.50 10
100 Cooch Behar M 71 99 100 8.29 8.29 10
101 Darjeeling M 73 93 100 10.57 10.57 10
102 Jalpaiguri M 69 101 100 10.08 12.98 10
103 Jangipur M 56 78 87 7.77 8.20 10
104 Katwa M 56 68 100 8.53 8.53 10
105 Raniganj M 62 121 63 4.79 n.a. n.
Small States
Himachal Pradesh
106 Shimla M.Corp. 82 111 100 19.55 28.53 10
Nagaland
107 Kohima TC 51 103 100 23.00 36.00 10
Union Territories
108 Port Blair MCl 75 105 100 14.14 16.64 10
6 6 3
Sl. City/Town Population ('000) % Population Area (Sq.km.) % arNo 1991 1999 covered 1991 1999 cove
(Census) (Estimated)* by service (Census) (Estimated)* by ser1999 199
1 2 3 4 5 6 7

7/21/2019 Status Watersupply
http://slidepdf.com/reader/full/status-watersupply 684/869
Others(Smaller than Class II towns)
Small States
Goa
109 Panaji MCl 43 57 100 22.63 22.63 10
Sikkim
110 Gangtok (Greater Gangtok) NTAC 25 106 75 7.25 7.25 7
Union Territories
111 Daman MCl 27 35 100 5.60 5.60 10
112 Silvassa CT 12 20 100 6.65 6.65 10
* Estimated by respective local governments/relevant agencies
Source: Respective urban local governments/relevant agencies, NIUA Survey, 1999. 6 6 4
Sl. City/Town Population ('000) % Population Area (Sq.km.) % arNo 1991 1999 covered 1991 1999 cove
(Census) (Estimated)* by service (Census) (Estimated)* by ser1999 199
1 2 3 4 5 6 7

7/21/2019 Status Watersupply
http://slidepdf.com/reader/full/status-watersupply 685/869
C -2
S OL I D WA S T E
GE NE R A T I O NA N
D
C OL L E C
T I O N ,1 9 9 9

7/21/2019 Status Watersupply
http://slidepdf.com/reader/full/status-watersupply 686/869

7/21/2019 Status Watersupply
http://slidepdf.com/reader/full/status-watersupply 687/869
6 6 7
Metropolitan Cities
1 Ahmedabad M.Corp. 364 1273 703 570 1273 100 once da
2 Bangalore M.Corp. 500 2500 1500 1000 2200 88 once da
3 Bhopal M.Corp. 320 480 384 96 360 75 once da
4 Calcutta M.Corp. 513 2500 1375 1125 2100 84 once da
5 Chennai M.Corp. 573 2500 1700 800 2500 100 once da
6 Coimbatore M.Corp. 690 670 n.a. n.a. 670 100 once da
7 Delhi M.Corp. 500 6000 4800 1200 5500 92 once da
8 Greater Mumbai M.Corp. 541 6000 3600 2400 6000 100 once da
9 Hyderabad M.Corp. 504 2100 n.a. n.a. 1900 90 once da10 Indore M.Corp. 375 600 240 360 600 100 twice da
11 Jaipur M.Corp. 742 1483 n.a. n.a. 1483 100 once da
12 Kanpur M.Corp. 520 1300 910 390 1100 85 once da
13 Kochi M.Corp. 368 250 n.a. n.a. 240 96 once da
14 Lucknow M.Corp. 500 1250 800 450 875 70 once da
15 Ludhiana M.Corp. 600 1200 800 400 875 73 n.a.
16 Madurai M.Corp. 471 480 335 145 450 94 once da
17 Nagpur M.Corp. 286 600 400 200 500 83 once da
18 Pune M.Corp. 522 1200 900 300 900 75 once da
19 Surat M.Corp. 414 1035 466 569 960 93 twice da
20 Vadodara M.Corp. 400 560 n.a. n.a. 440 79 twice da21 Varanasi M.Corp. 500 576 432 144 461 80 twice da
22 Visakhapatnam M.Corp. 469 600 300 300 600 100 once da
Total-Metropolitan Cities 500 35157 19645 10449 31987 91
* Estimated by respective local governments/relevant agencies Source: Respective urban local governments/relevant agencies, NIUA Survey, 1999.
C-2 : Solid Waste Generation and Collection, 1999
Sl. City/Town Solid waste Solid Waste by Waste % waste Frequen
No. generated source (MT/day) collected collected of soli
gms pc/day MT/day* Domestic Non- (MT/day) to gene- waste
domestic rated collecti
1 2 3 4 5 6 7 8

7/21/2019 Status Watersupply
http://slidepdf.com/reader/full/status-watersupply 688/869
CLASS I
Andhra Pradesh
1 Anantapur MCl 440 110 60 50 110 100 once da
2 Chittoor M 502 75 54 21 70 100 once da
3 Cuddapah MCl 506 84 39 45 84 100 once da
4 Eluru M 591 146 90 56 146 100 n.a.
5 Guntur MCl 449 250 190 60 250 100 once da
6 Hindupur M 500 70 n.a. n.a. 70 100 once da
7 Kakinada M 492 160 90 70 145 91 twice da
8 Kurnool MCl 355 100 56 44 90 90 once da
9 Machilipatnam M 350 70 28 42 50 71 once da
10 Nandyal MCl 400 60 36 24 60 100 once da
11 Nellore MCl 413 167 120 47 167 100 once da
12 Nizamabad M 498 142 85 57 88 62 twice da
13 Ongole MCl 500 90 57 33 90 100 once da
14 Qutubullapur M 280 70 60 10 70 100 once da
15 Rajahmundry M.Corp. 508 193 31 162 193 100 twice da
16 Tenali M 529 90 11 79 80 89 twice da
17 Tirupati MCl 619 130 85 45 130 100 once da
18 Vijaywada M.Corp. 568 475 250 225 465 98 twice da
19 Warangal M.Corp. 412 280 140 140 230 82 once daBihar
20 Bihar Sharif M 200 50 22 29 50 100 once da
21 Chhapra M 480 96 n.a. n.a. 66 69 twice da
22 Gaya M.Corp. 200 80 60 20 80 100 twice da
6 6 8
Sl. City/Town Solid waste Solid Waste by Waste % waste Frequen
No. generated source (MT/day) collected collected of solid
gms pc/day MT/day* Domestic Non- (MT/day) to gene- waste
domestic rated collectio
1 2 3 4 5 6 7 8

7/21/2019 Status Watersupply
http://slidepdf.com/reader/full/status-watersupply 689/869
23 Katihar M 400 80 n.a. n.a. 45 56 once da
24 Munger M 333 70 n.a. n.a. 50 71 twice da
25 Ranchi M.Corp. 146 102 n.a. n.a. 34 33 once da
Gujarat
26 Anand M 57 10 4.0 6 10 100 twice da
27 Bharuch M 535 85 44 41 85 100 once da
28 Bhavnagar M.Corp. 300 165 95 70 115 70 n.a.
29 Bhuj M 339 40 28 12 40 100 once da
30 Jamnagar M.Corp. 600 300 150 150 300 100 once da
31 Junagadh M 515 85 45 40 75 88 twice da
32 Nadiad M 200 60 30 30 60 100 twice da
33 Navsari M 288 40 30 10 31 78 twice da
34 Porbandar M 204 29 n.a. n.a. 22 76 once da
35 Rajkot M.Corp. 450 450 450 n.a. 425 94 once da
36 Surendranagar M 207 31 n.a. n.a. 31 100 once da
Haryana
37 Ambala MCl 248 35 25 10 30 86 once da
38 Faridabad M.Corp. 478 550 492 58 480 87 once da
39 Gurgaon MCl 514 90 70 20 80 89 twice da
40 Hissar MCl 200 50 32 18 32 64 once da
41 Karnal MCl 341 75 50 25 52 69 twice da42 Rohtak MCl 210 51 30 21 28 55 once da
Jammu & Kashmir
43 Jammu M.Corp. 468 425 n.a. n.a. 300 71 twice da
44 Srinagar M.Corp. 375 300 200 100 200 67 once da
6 6 9
Sl. City/Town Solid waste Solid Waste by Waste % waste Frequen
No. generated source (MT/day) collected collected of solid
gms pc/day MT/day* Domestic Non- (MT/day) to gene- waste
domestic rated collectio
1 2 3 4 5 6 7 8

7/21/2019 Status Watersupply
http://slidepdf.com/reader/full/status-watersupply 690/869
Karnataka
45 Belgaum M.Corp. 266 125 75 50 100 80 once da
46 Bellary CMC 202 60 36 24 50 83 once da
47 Davangere MCl 198 90 36 54 78 87 twice da
48 Gadag-Betigeri CMC 506 75 20 55 60 80 twice da
49 Gulbarga M.Corp. 200 90 60 30 76 84 once da
50 Hubli-Dharwad M.Corp. 376 320 100 220 220 69 once da
51 Mandya M 179 25 18 7.0 25 100 twice da
52 Mangalore M.Corp. 190 78 46 32 70 90 twice da
53 Mysore M.Corp. 195 205 138 67 205 100 twice da
54 Shimoga CMC 361 80 35 45 72 89 once da
55 Tumkur M 290 87 26 61 84 97 once da
Kerala
56 Alappuzha MC 125 25 19 6.3 20 80 once da
57 Kollam MC 375 60 19 41 58 97 twice da
58 Kozhikode M.Corp. 446 220 145 75 154 70 twice da
59 Thalaserry M 299 40 20 20 30 75 once da
60 Thiruvananthapuram M.Corp. 513 300 n.a. n.a. 250 83 once da
Madhya Pradesh
61 Bhind M 160 28 21 7.3 24 86 twice da
62 Burhanpur M.Corp. 286 60 n.a. n.a. 60 100 twice da63 Dewas M.Corp. 250 50 n.a. n.a. 40 80 once da
64 Guna M 144 18 12 6.0 18 100 twice da
65 Gwalior M.Corp. 400 360 n.a. n.a. 280 78 once da
66 Jabalpur M.Corp. 300 300 145 155 298 99 once da
6 7 0
Sl. City/Town Solid waste Solid Waste by Waste % waste Frequen
No. generated source (MT/day) collected collected of solid
gms pc/day MT/day* Domestic Non- (MT/day) to gene- waste
domestic rated collectio
1 2 3 4 5 6 7 8
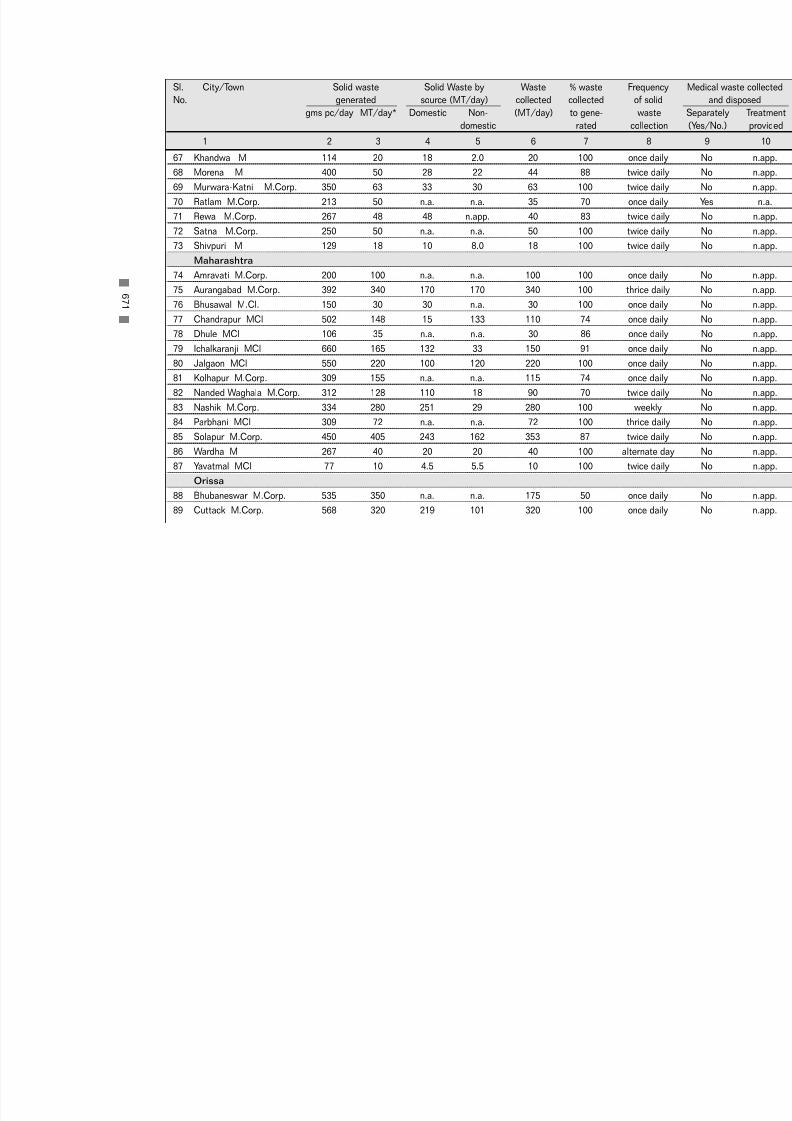
7/21/2019 Status Watersupply
http://slidepdf.com/reader/full/status-watersupply 691/869
67 Khandwa M 114 20 18 2.0 20 100 once da
68 Morena M 400 50 28 22 44 88 twice da
69 Murwara-Katni M.Corp. 350 63 33 30 63 100 twice da
70 Ratlam M.Corp. 213 50 n.a. n.a. 35 70 once da
71 Rewa M.Corp. 267 48 48 n.app. 40 83 twice da
72 Satna M.Corp. 250 50 n.a. n.a. 50 100 twice da
73 Shivpuri M 129 18 10 8.0 18 100 twice da
Maharashtra
74 Amravati M.Corp. 200 100 n.a. n.a. 100 100 once da
75 Aurangabad M.Corp. 392 340 170 170 340 100 thrice da
76 Bhusawal M.Cl. 150 30 30 n.a. 30 100 once da
77 Chandrapur MCl 502 148 15 133 110 74 once da
78 Dhule MCl 106 35 n.a. n.a. 30 86 once da
79 Ichalkaranji MCl 660 165 132 33 150 91 once da
80 Jalgaon MCl 550 220 100 120 220 100 once da
81 Kolhapur M.Corp. 309 155 n.a. n.a. 115 74 once da
82 Nanded Waghala M.Corp. 312 128 110 18 90 70 twice da
83 Nashik M.Corp. 334 280 251 29 280 100 weekly
84 Parbhani MCl 309 72 n.a. n.a. 72 100 thrice da
85 Solapur M.Corp. 450 405 243 162 353 87 twice da
86 Wardha M 267 40 20 20 40 100 alternate87 Yavatmal MCl 77 10 4.5 5.5 10 100 twice da
Orissa
88 Bhubaneswar M.Corp. 535 350 n.a. n.a. 175 50 once da
89 Cuttack M.Corp. 568 320 219 101 320 100 once da
6 7 1
Sl. City/Town Solid waste Solid Waste by Waste % waste Frequen
No. generated source (MT/day) collected collected of solid
gms pc/day MT/day* Domestic Non- (MT/day) to gene- waste
domestic rated collectio
1 2 3 4 5 6 7 8

7/21/2019 Status Watersupply
http://slidepdf.com/reader/full/status-watersupply 692/869
90 Puri M 401 60 33 27 53 88 once da
91 Rourkela M 300 60 28 32 40 67 once da
92 Sambalpur M 465 73 n.a. n.a. 32 44 once da
Punjab
93 Amritsar M.Corp. 711 600 375 225 510 85 once da
94 Bathinda MCl 603 105 60 45 95 90 once da
95 Hoshiarpur MCl 228 33 26 6.6 33 100 once da
96 Jalandhar M. Corp. 339 250 185 65 236 94 once da
97 Moga MCl 243 36 25 11 36 100 once da
98 Pathankot MCl 128 25 20 5.3 23 92 once da
99 Patiala M.Corp. 244 80 50 30 80 100 once da
Rajasthan
100 Ajmer MCl 545 300 250 50 250 83 twice da
101 Alwar M 333 100 n.a. n.a. 100 100 once da
102 Beawar M 298 42 n.a. n.a. 42 100 twice da
103 Bhilwara M 324 73 29 44 58 79 twice da
104 Bikaner M 300 180 126 54 180 100 twice da
105 Jodhpur M.Corp. 308 308 240 69 308 100 twice da
106 Kota M.Corp. 280 210 n.a. n.a. 120 57 once da
107 Sriganganagar M 116 26 26 0.1 24 92 twice da
Tamil Nadu108 Cuddalore M 401 65 45 20 60 92 once da
109 Dindigul M 178 38 17 21 17 43 once da
110 Erode M 518 90 30 60 85 94 once da
111 Kanchipuram M 210 33 26 7.0 19 58 twice da
6 7 2
Sl. City/Town Solid waste Solid Waste by Waste % waste Frequen
No. generated source (MT/day) collected collected of solid
gms pc/day MT/day* Domestic Non- (MT/day) to gene- waste
domestic rated collectio
1 2 3 4 5 6 7 8
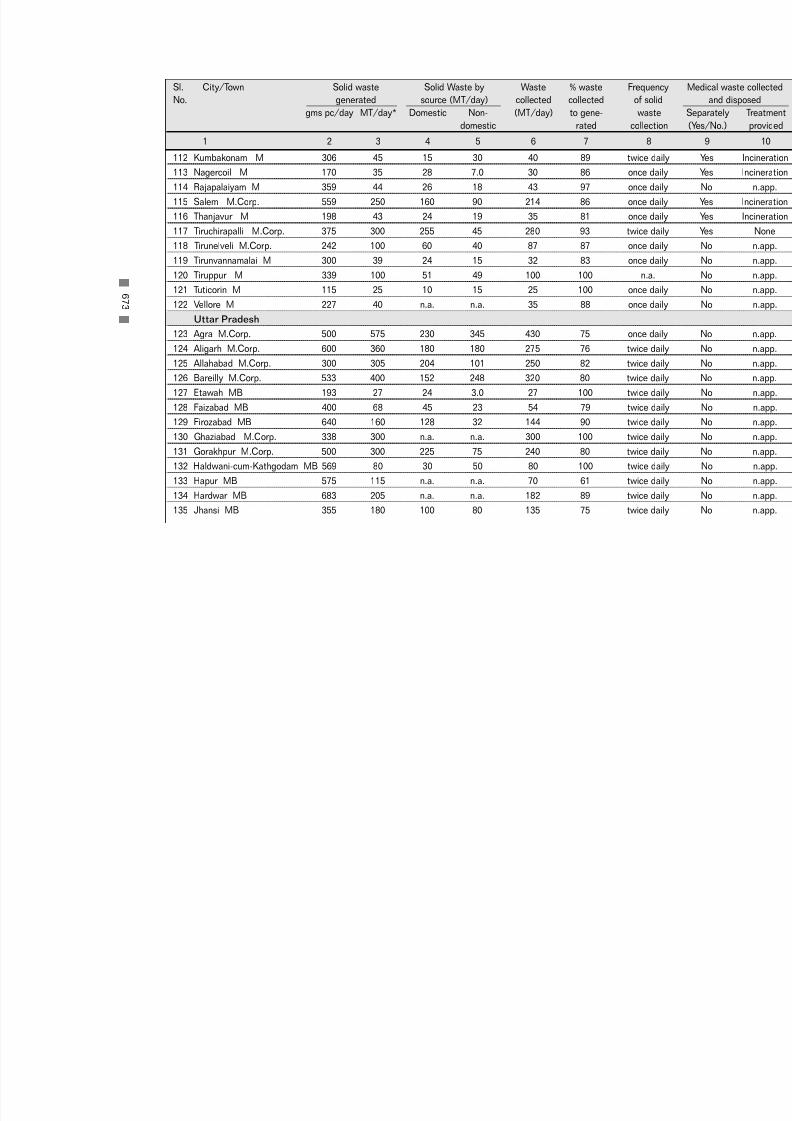
7/21/2019 Status Watersupply
http://slidepdf.com/reader/full/status-watersupply 693/869
112 Kumbakonam M 306 45 15 30 40 89 twice da
113 Nagercoil M 170 35 28 7.0 30 86 once da
114 Rajapalaiyam M 359 44 26 18 43 97 once da
115 Salem M.Corp. 559 250 160 90 214 86 once da
116 Thanjavur M 198 43 24 19 35 81 once da
117 Tiruchirapalli M.Corp. 375 300 255 45 280 93 twice da
118 Tirunelveli M.Corp. 242 100 60 40 87 87 once da
119 Tirunvannamalai M 300 39 24 15 32 83 once da
120 Tiruppur M 339 100 51 49 100 100 n.a.
121 Tuticorin M 115 25 10 15 25 100 once da
122 Vellore M 227 40 n.a. n.a. 35 88 once da
Uttar Pradesh
123 Agra M.Corp. 500 575 230 345 430 75 once da
124 Aligarh M.Corp. 600 360 180 180 275 76 twice da
125 Allahabad M.Corp. 300 305 204 101 250 82 twice da
126 Bareilly M.Corp. 533 400 152 248 320 80 twice da
127 Etawah MB 193 27 24 3.0 27 100 twice da
128 Faizabad MB 400 68 45 23 54 79 twice da
129 Firozabad MB 640 160 128 32 144 90 twice da
130 Ghaziabad M.Corp. 338 300 n.a. n.a. 300 100 twice da
131 Gorakhpur M.Corp. 500 300 225 75 240 80 twice da132 Haldwani-cum-Kathgodam MB 569 80 30 50 80 100 twice da
133 Hapur MB 575 115 n.a. n.a. 70 61 twice da
134 Hardwar MB 683 205 n.a. n.a. 182 89 twice da
135 Jhansi MB 355 180 100 80 135 75 twice da
6 7 3
Sl. City/Town Solid waste Solid Waste by Waste % waste Frequen
No. generated source (MT/day) collected collected of solid
gms pc/day MT/day* Domestic Non- (MT/day) to gene- waste
domestic rated collectio
1 2 3 4 5 6 7 8

7/21/2019 Status Watersupply
http://slidepdf.com/reader/full/status-watersupply 694/869
136 Mathura MB 425 170 n.a. n.a. 150 88 once da
137 Meerut M.Corp. 500 625 n.a. n.a. 500 80 twice da
138 Mirzapur MB 500 105 75 30 86 81 twice da
139 Moradabad M.Corp. 448 300 200 100 300 100 thrice da
140 Muzaffarnagar MB 498 162 100 62 130 80 twice da
141 Rae Bareli MB 500 88 53 35 66 75 twice da
142 Rampur MB 505 160 n.a. n.a. 120 75 twice da
143 Saharanpur MB 500 270 130 140 200 74 twice da
144 Sitapur MB 500 75 n.a. n.a. 70 93 once da
145 Unnao MB 99 12 n.a. n.a. 8 67 once daWest Bengal
146 Asansol M.Corp. 248 78 52 26 60 77 once da
147 Baharampur M 566 81 59 22 81 100 once da
148 Balurghat M 250 33 18 15 33 100 once da
149 Bankura M 183 28 10 18 26 94 once da
150 Barasat M 353 53 45 8.0 24 45 thrice da
151 Burdwan M 310 100 55 45 75 75 twice da
152 Halisahar M 134 20 8.0 12 17 85 once da
153 Krishna Nagar M 342 50 25 25 38 76 once da
154 Midnapur M 400 63 33 30 53 84 twice da155 North Barrackpur M 338 40 30 10 40 100 once da
156 Santipur M 250 33 20 13 33 100 twice wee
157 Siliguri M.Corp. 480 240 202 38 150 63 once da
6 7 4
Sl. City/Town Solid waste Solid Waste by Waste % waste Frequen
No. generated source (MT/day) collected collected of solid
gms pc/day MT/day* Domestic Non- (MT/day) to gene- waste
domestic rated collectio
1 2 3 4 5 6 7 8

7/21/2019 Status Watersupply
http://slidepdf.com/reader/full/status-watersupply 695/869
Small States
Assam
158 Guwahati M.Corp. 214 300 180 120 240 80 once da
159 Jorhat MB 118 20 11 9.0 14 70 once da
Manipur
160 Imphal MCl 249 61 20 41 38 62 once da
Meghalaya
161 Shillong MB 360 78 51 27 78 100 once da
Tripura
162 Agartala MCl 400 80 47 33 60 75 twice da
Union Territories
163 Chandigarh M.Corp. 382 325 n.a. n.a. 280 86 once da
164 Pondicherry M 517 150 112 38 120 80 twice da
* Estimated by respective local governments/relevant agencies Source: Respective urban local governments/relevant agencies, NIUA Survey, 1999.
Sl. City/Town Solid waste Solid Waste by Waste % waste Frequen
No. generated source (MT/day) collected collected of solid
gms pc/day MT/day* Domestic Non- (MT/day) to gene- waste
domestic rated collectio
1 2 3 4 5 6 7 8
6 7 5
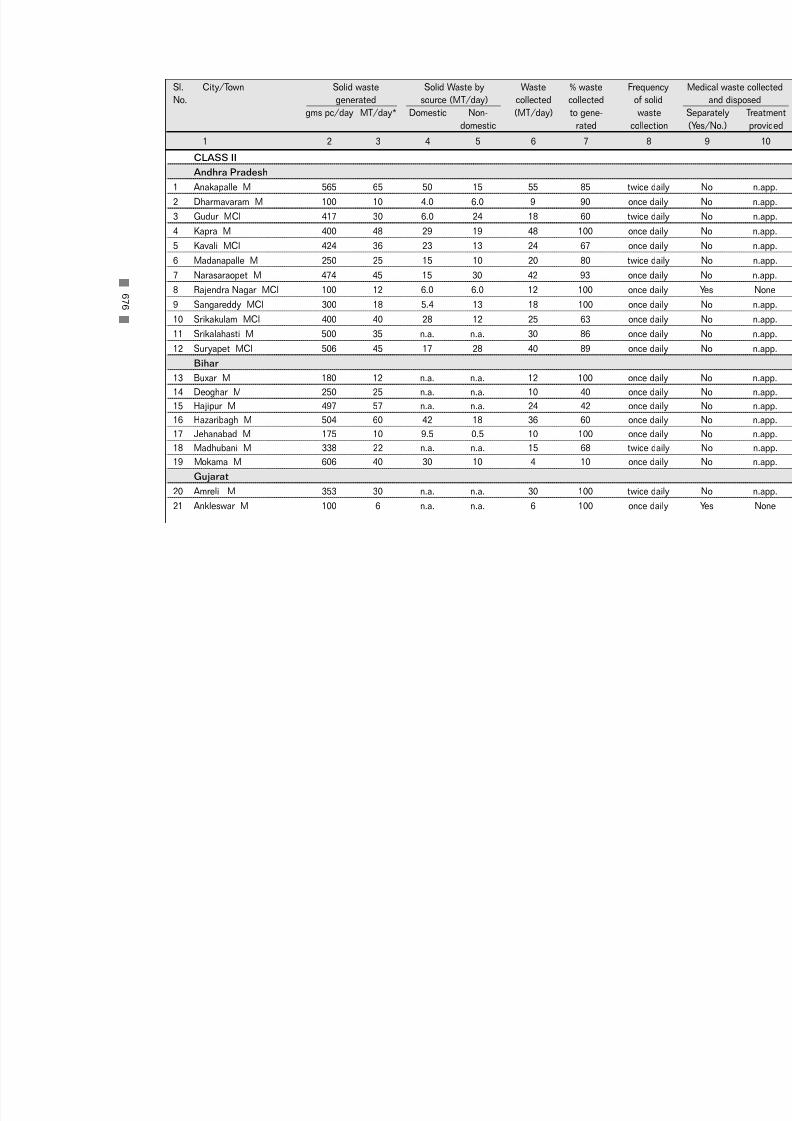
7/21/2019 Status Watersupply
http://slidepdf.com/reader/full/status-watersupply 696/869
CLASS II
Andhra Pradesh
1 Anakapalle M 565 65 50 15 55 85 twice da
2 Dharmavaram M 100 10 4.0 6.0 9 90 once da
3 Gudur MCl 417 30 6.0 24 18 60 twice da
4 Kapra M 400 48 29 19 48 100 once da
5 Kavali MCl 424 36 23 13 24 67 once da
6 Madanapalle M 250 25 15 10 20 80 twice da
7 Narasaraopet M 474 45 15 30 42 93 once da
8 Rajendra Nagar MCl 100 12 6.0 6.0 12 100 once da
9 Sangareddy MCl 300 18 5.4 13 18 100 once da
10 Srikakulam MCl 400 40 28 12 25 63 once da
11 Srikalahasti M 500 35 n.a. n.a. 30 86 once da
12 Suryapet MCl 506 45 17 28 40 89 once da
Bihar
13 Buxar M 180 12 n.a. n.a. 12 100 once da
14 Deoghar M 250 25 n.a. n.a. 10 40 once da
15 Hajipur M 497 57 n.a. n.a. 24 42 once da
16 Hazaribagh M 504 60 42 18 36 60 once da
17 Jehanabad M 175 10 9.5 0.5 10 100 once da
18 Madhubani M 338 22 n.a. n.a. 15 68 twice da19 Mokama M 606 40 30 10 4 10 once da
Gujarat
20 Amreli M 353 30 n.a. n.a. 30 100 twice da
21 Ankleswar M 100 6 n.a. n.a. 6 100 once da
6 7 6
Sl. City/Town Solid waste Solid Waste by Waste % waste Frequen
No. generated source (MT/day) collected collected of solid
gms pc/day MT/day* Domestic Non- (MT/day) to gene- waste
domestic rated collectio
1 2 3 4 5 6 7 8
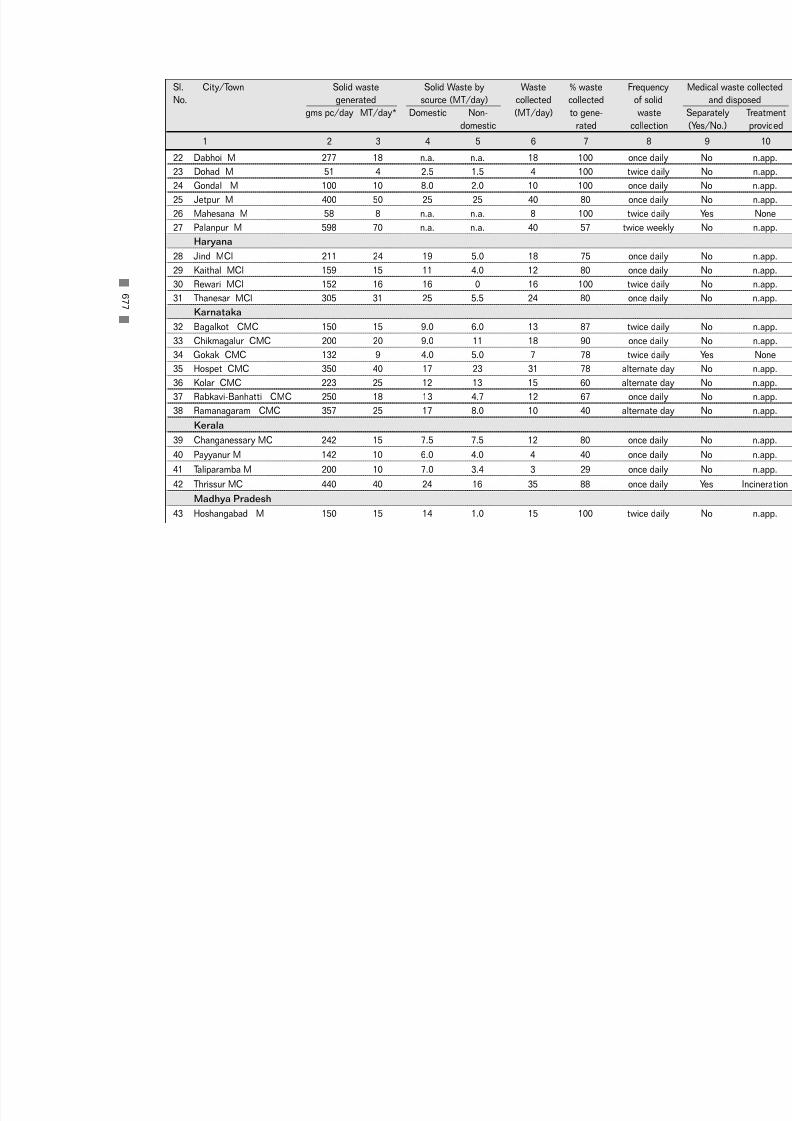
7/21/2019 Status Watersupply
http://slidepdf.com/reader/full/status-watersupply 697/869
22 Dabhoi M 277 18 n.a. n.a. 18 100 once da
23 Dohad M 51 4 2.5 1.5 4 100 twice da
24 Gondal M 100 10 8.0 2.0 10 100 once da
25 Jetpur M 400 50 25 25 40 80 once da
26 Mahesana M 58 8 n.a. n.a. 8 100 twice da
27 Palanpur M 598 70 n.a. n.a. 40 57 twice wee
Haryana
28 Jind MCl 211 24 19 5.0 18 75 once da
29 Kaithal MCl 159 15 11 4.0 12 80 once da
30 Rewari MCl 152 16 16 0 16 100 twice da
31 Thanesar MCl 305 31 25 5.5 24 80 once daKarnataka
32 Bagalkot CMC 150 15 9.0 6.0 13 87 twice da
33 Chikmagalur CMC 200 20 9.0 11 18 90 once da
34 Gokak CMC 132 9 4.0 5.0 7 78 twice da
35 Hospet CMC 350 40 17 23 31 78 alternate
36 Kolar CMC 223 25 12 13 15 60 alternate
37 Rabkavi-Banhatti CMC 250 18 13 4.7 12 67 once da
38 Ramanagaram CMC 357 25 17 8.0 10 40 alternate
Kerala
39 Changanessary MC 242 15 7.5 7.5 12 80 once da
40 Payyanur M 142 10 6.0 4.0 4 40 once da
41 Taliparamba M 200 10 7.0 3.4 3 29 once da
42 Thrissur MC 440 40 24 16 35 88 once da
Madhya Pradesh
43 Hoshangabad M 150 15 14 1.0 15 100 twice da
6 7 7
Sl. City/Town Solid waste Solid Waste by Waste % waste Frequen
No. generated source (MT/day) collected collected of solid
gms pc/day MT/day* Domestic Non- (MT/day) to gene- waste
domestic rated collectio
1 2 3 4 5 6 7 8

7/21/2019 Status Watersupply
http://slidepdf.com/reader/full/status-watersupply 698/869
44 Itarsi M 143 15 12 3.0 15 100 once da
45 Khargone M 75 6 n.a. n.a. 6 100 twice da
46 Mandsaur M 325 40 30 10 26 65 twice da
47 Nagda M 200 20 n.a. n.a. 10 50 twice da
48 Neemuch M 80 8 5.0 3.0 8 100 twice da
49 Sehore M 300 30 n.a. n.a. 30 100 once da
50 Shahdol M 150 11 5.3 6.0 9 80 once da
51 Vidisha M 100 13 9.0 3.5 10 80 twice da
Maharashtra
52 Amalner MCl 60 6 n.a. n.a. 6 100 once da
53 Ballarpur MCl 165 18 10 8.0 18 100 once da54 Bhandara M 158 12 n.a. n.a. 12 100 twice da
55 Kamptee MCl 584 55 35 20 40 72 once da
56 Manmad MCl 98 8.5 5.4 3.1 5.4 64 twice da
57 Ratnagiri MCl 429 30 22 8.0 22 73 once da
58 Satara MCl 300 30 n.a. n.a. 17 55 once da
59 Virar MCl 500 50 40 10 50 100 twice da
Punjab
60 Ferozepur MCl 543 50 38 12 40 80 twice da
61 Kapurthala M 118 10 8.0 2.0 10 100 twice da
62 Mansa MCl 406 27 27 0 27 100 once da
63 Phagwara MCl 148 16 13 3.0 14 88 twice da
64 Sangrur MCl 285 20 15 5.0 15 75 twice da
Rajasthan
65 Banswara M 227 25 n.a. n.a. 25 100 twice da
6 7 8
Sl. City/Town Solid waste Solid Waste by Waste % waste Frequen
No. generated source (MT/day) collected collected of solid
gms pc/day MT/day* Domestic Non- (MT/day) to gene- waste
domestic rated collectio
1 2 3 4 5 6 7 8

7/21/2019 Status Watersupply
http://slidepdf.com/reader/full/status-watersupply 699/869
66 Barmer M 298 25 23 2.0 18 72 twice da
67 Bundi M 375 30 24 6.0 24 80 once da
68 Churu M 343 34 25 9.2 30 87 twice da
69 Hanumangarh M 344 43 39 4.0 43 100 once da
70 Sawai Madhopur M 45 4 3.0 1.0 4 100 once da
Tamil Nadu
71 Ambur M 187 16 8.0 8.0 13 81 once da
72 Arakkonam M 205 18 n.a. n.a. 11 61 once da
73 Attur M 203 13 8.0 5.0 10 77 once da
74 Cumbum M 76 4 n.a. n.a. 4 100 once da
75 Dharmapuri M 250 17 10 6.7 11 66 twice da
76 Gudiyatham M 179 17 8.5 8.5 16 94 once da
77 Nagapattinam M 267 30 n.a. n.a. 25 83 once da
78 Pudukkottai M 204 22 n.a. n.a. 20 91 once da
79 Sivakasi M 100 7 4.0 3.0 5 71 once da
80 Srivilliputtur M 298 22 13 9.0 20 91 once da
81 Tindivanam M 214 15 n.a. n.a. 12 80 once da
82 Udhagamandalam M 74 7.4 2.3 5.1 7.4 100 once da
Uttar Pradesh
83 Auraiya MB 244 22 19 3.3 21 95 twice da
84 Balrampur MB 371 26 n.a. n.a. 20 77 once da85 Basti MB 364 40 n.a. n.a. 35 88 once da
86 Bhadohi MB 600 75 30 45 40 53 twice da
87 Chandpur MB 61 4.9 4.8 0.1 4.9 100 twice da
88 Etah MB 450 61 43 18 40 66 twice da
6 7 9
Sl. City/Town Solid waste Solid Waste by Waste % waste Frequen
No. generated source (MT/day) collected collected of solid
gms pc/day MT/day* Domestic Non- (MT/day) to gene- waste
domestic rated collectio
1 2 3 4 5 6 7 8
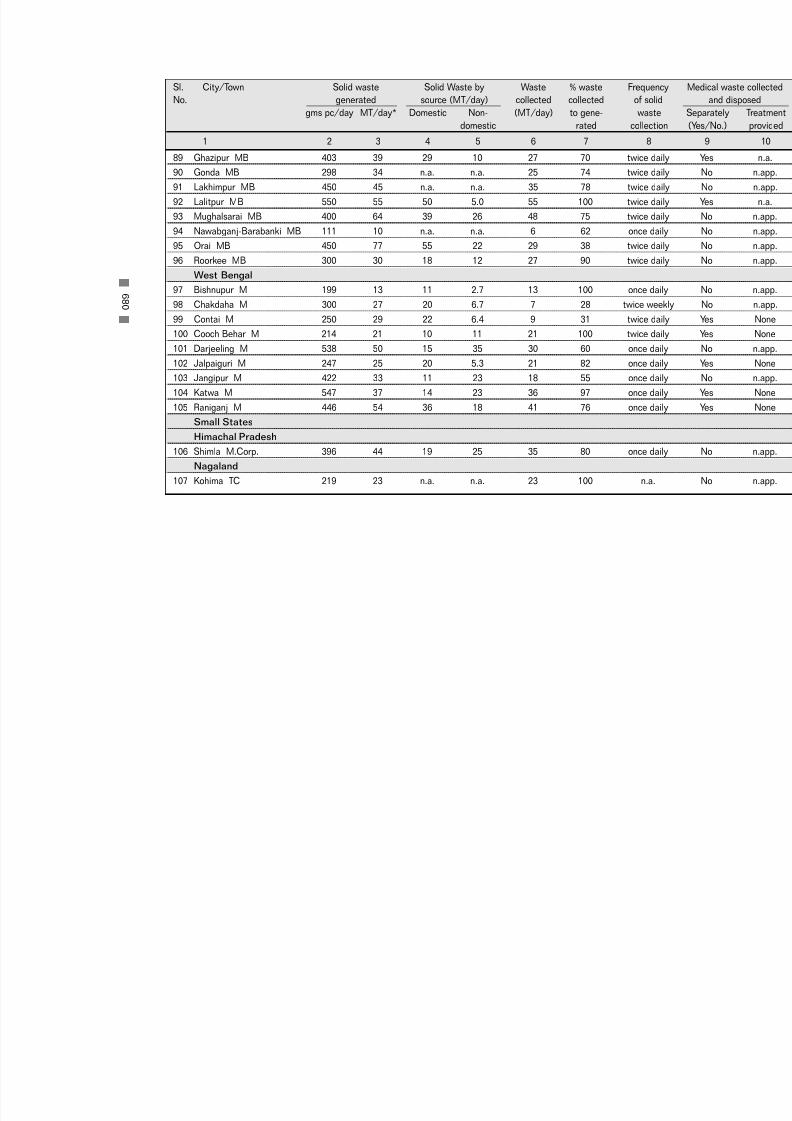
7/21/2019 Status Watersupply
http://slidepdf.com/reader/full/status-watersupply 700/869
89 Ghazipur MB 403 39 29 10 27 70 twice da
90 Gonda MB 298 34 n.a. n.a. 25 74 twice da
91 Lakhimpur MB 450 45 n.a. n.a. 35 78 twice da
92 Lalitpur MB 550 55 50 5.0 55 100 twice da
93 Mughalsarai MB 400 64 39 26 48 75 twice da
94 Nawabganj-Barabanki MB 111 10 n.a. n.a. 6 62 once da
95 Orai MB 450 77 55 22 29 38 twice da
96 Roorkee MB 300 30 18 12 27 90 twice da
West Bengal
97 Bishnupur M 199 13 11 2.7 13 100 once da
98 Chakdaha M 300 27 20 6.7 7 28 twice wee
99 Contai M 250 29 22 6.4 9 31 twice da
100 Cooch Behar M 214 21 10 11 21 100 twice da
101 Darjeeling M 538 50 15 35 30 60 once da
102 Jalpaiguri M 247 25 20 5.3 21 82 once da
103 Jangipur M 422 33 11 23 18 55 once da
104 Katwa M 547 37 14 23 36 97 once da
105 Raniganj M 446 54 36 18 41 76 once da
Small States
Himachal Pradesh
106 Shimla M.Corp. 396 44 19 25 35 80 once daNagaland
107 Kohima TC 219 23 n.a. n.a. 23 100 n.a.
6 8 0
Sl. City/Town Solid waste Solid Waste by Waste % waste Frequen
No. generated source (MT/day) collected collected of solid
gms pc/day MT/day* Domestic Non- (MT/day) to gene- waste
domestic rated collectio
1 2 3 4 5 6 7 8

7/21/2019 Status Watersupply
http://slidepdf.com/reader/full/status-watersupply 701/869
Union Territories
108 Port Blair MCl 476 50 45 5.0 44 88 once da
Others (Smaller than Class II towns)
Small States
Goa
109 Panaji MCl 385 22 9.0 13 11 51 twice da
Sikkim
110 Gangtok
(Greater Gangtok) NTAC 660 70 30 40 35 50 once da
Union Territories
111 Daman MCl 314 11 n.a. n.a. 11 100 twice da
112 Silvassa CT 200 4 3.5 0.5 4 100 once da
Total-Class II Towns 297 3079 1520 869 2314 75
Grand Total 433 60823 32003 18130 53505 88
* Estimated by respective local governments /relevant agencies Source: Respective urban local governments/relevant agencies, NIUA Survey, 1999.
6 8 1
Sl. City/Town Solid waste Solid Waste by Waste % waste Frequen
No. generated source (MT/day) collected collected of solid
gms pc/day MT/day* Domestic Non- (MT/day) to gene- waste
domestic rated collectio
1 2 3 4 5 6 7 8

7/21/2019 Status Watersupply
http://slidepdf.com/reader/full/status-watersupply 702/869

7/21/2019 Status Watersupply
http://slidepdf.com/reader/full/status-watersupply 703/869
C - 3
T R A
N S P OR T A T I O N OF S OL I D WA S T E ,1 9 9 9

7/21/2019 Status Watersupply
http://slidepdf.com/reader/full/status-watersupply 704/869

7/21/2019 Status Watersupply
http://slidepdf.com/reader/full/status-watersupply 705/869
Metropolitan Cities
1 Ahmedabad M.Corp. 92 - 1-5 - 867 10
2 Bangalore M.Corp. 316 - 1-2 - 2200 15
3 Bhopal M.Corp. 51 - 2 - 360 15
4 Calcutta M.Corp. 225 - 2-3 - 2100 5
5 Chennai M.Corp. 425 - 2-4 - 2500 5
6 Coimbatore M.Corp. 68 - 3 - 563 15
7 Delhi M.Corp. 560 - 3 - 5500 20
8 Greater Mumbai M.Corp. 1173 - 1-2 - 6000 15
9 Hyderabad M.Corp. 175 - 2-4 - 1885 510 Indore M.Corp. n.a. - n.a. - 600 5
11 Jaipur M.Corp. 64 - 3 - 1483 10
12 Kanpur M.Corp. 103 - 4-5 - 1100 30
13 Kochi M.Corp. 43 - 2 - 240 n.a.
14 Lucknow M.Corp. 47 - 4-8 - 875 20
15 Ludhiana M.Corp. 66 - 2-15 - 875 n.a.
16 Madurai M.Corp. 64 - 3 - 450 10
17 Nagpur M.Corp. 74 - 2-5 - 500 10
18 Pune M.Corp. 123 - 2-5 - 900 n.a.
19 Surat M.Corp. 124 - 2-4 - 960 20
20 Vadodara M.Corp. 47 - 2-7 - 440 10
21 Varanasi M.Corp. 40 - 2-5 - 456 5
22 Visakhapatnam M.Corp. 91 - 2 - 600 20
Source: Respective urban local governments/relevant agencies, NIUA Survey, 1999.
6 8 5
Sl. City/Town No. of vehicles used Average trips per Approx. % of vehicle
No. for transportation vehicle per day waste (MT) usually
Motorized Non- Motorized Non- transported under repa
motor ized mototized daily
1 2 3 4 5 6 7
C-3 : Transportation of Solid Waste, 1999
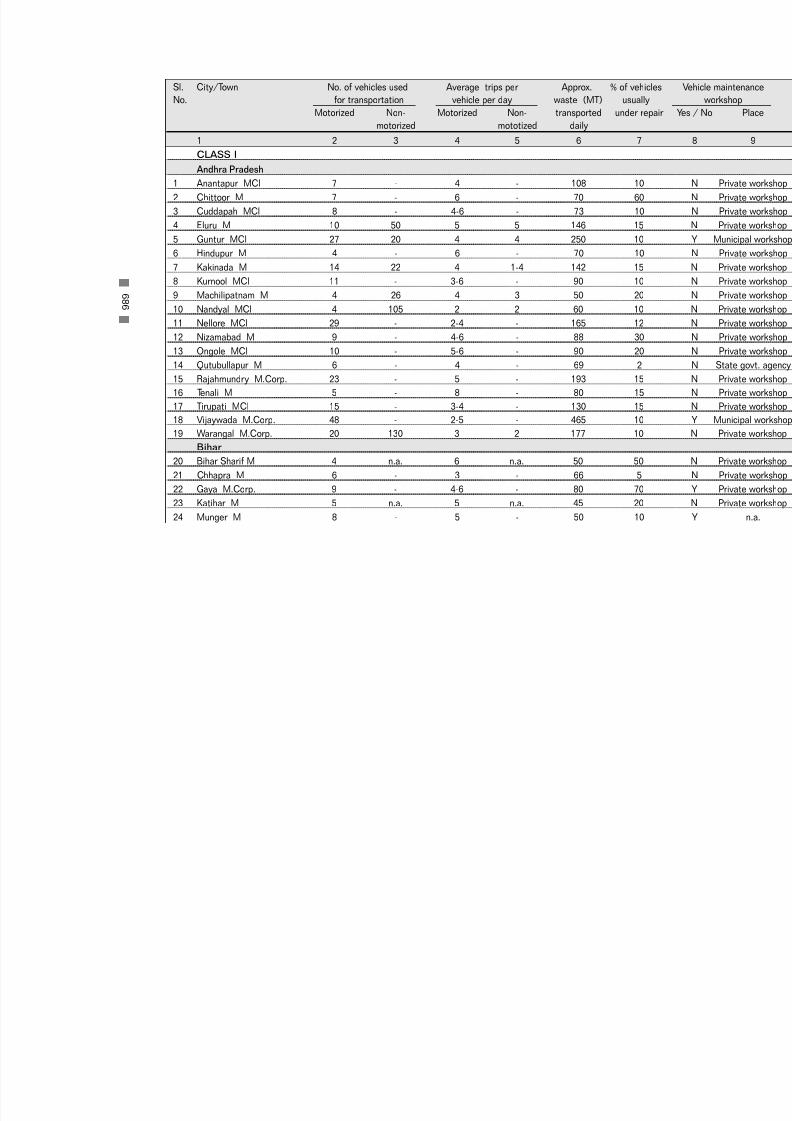
7/21/2019 Status Watersupply
http://slidepdf.com/reader/full/status-watersupply 706/869
CLASS I
Andhra Pradesh
1 Anantapur MCl 7 - 4 - 108 10
2 Chittoor M 7 - 6 - 70 60
3 Cuddapah MCl 8 - 4-6 - 73 10
4 Eluru M 10 50 5 5 146 15
5 Guntur MCl 27 20 4 4 250 10
6 Hindupur M 4 - 6 - 70 10
7 Kakinada M 14 22 4 1-4 142 15
8 Kurnool MCl 11 - 3-6 - 90 10
9 Machilipatnam M 4 26 4 3 50 2010 Nandyal MCl 4 105 2 2 60 10
11 Nellore MCl 29 - 2-4 - 165 12
12 Nizamabad M 9 - 4-6 - 88 30
13 Ongole MCl 10 - 5-6 - 90 20
14 Qutubullapur M 6 - 4 - 69 2
15 Rajahmundry M.Corp. 23 - 5 - 193 15
16 Tenali M 5 - 8 - 80 15
17 Tirupati MCl 15 - 3-4 - 130 15
18 Vijaywada M.Corp. 48 - 2-5 - 465 10
19 Warangal M.Corp. 20 130 3 2 177 10
Bihar20 Bihar Sharif M 4 n.a. 6 n.a. 50 50
21 Chhapra M 6 - 3 - 66 5
22 Gaya M.Corp. 9 - 4-6 - 80 70
23 Katihar M 5 n.a. 5 n.a. 45 20
24 Munger M 8 - 5 - 50 10
6 8 6
Sl. City/Town No. of vehicles used Average trips per Approx. % of vehicles
No. for transportation vehicle per day waste (MT) usually
Motorized Non- Motorized Non- transported under repai
motorized mototized daily
1 2 3 4 5 6 7

7/21/2019 Status Watersupply
http://slidepdf.com/reader/full/status-watersupply 707/869
25 Ranchi M.Corp. 12 - 6-10 - 34 5
Gujarat
26 Anand M 10 - 4 - 10 10
27 Bharuch M 16 - 4-10 - 84 20
28 Bhavnagar M.Corp. 38 - 1-2 - 115 10
29 Bhuj M 8 16 4 4 40 10
30 Jamnagar M.Corp. 23 14 3-5 7 300 10
31 Junagadh M 6 - 15 - 75 10
32 Nadiad M 9 - 2-4 - 60 15
33 Navsari M 6 - 4-7 - 31 20
34 Porbandar M 10 - 4 - 22 3035 Rajkot M.Corp. 35 - 4-6 - 425 20
36 Surendranagar M 5 - 4 - 30 10
Haryana
37 Ambala MCl 5 5 5 4 30 20
38 Faridabad M.Corp. 39 - 3 - 480 30
39 Gurgaon MCl 4 - 3 - 80 10
40 Hissar MCl 8 - 4 - 32 50
41 Karnal MCl 8 20 4 2 52 25
42 Rohtak MCl 10 - 1-3 - 28 10
Jammu & Kashmir
43 Jammu M.Corp. 21 - 5-6 - 288 10
44 Srinagar M.Corp. 33 1500 2-8 200 10
Karnataka
45 Belgaum M.Corp. 14 - 2 - 100 n.a.
46 Bellary CMC 5 - 4 - 50 n.a.
6 8 7
Sl. City/Town No. of vehicles used Average trips per Approx. % of vehicles
No. for transportation vehicle per day waste (MT) usually
Motorized Non- Motorized Non- transported under repai
motorized mototized daily
1 2 3 4 5 6 7

7/21/2019 Status Watersupply
http://slidepdf.com/reader/full/status-watersupply 708/869
47 Davangere MCl 12 - 3 - 77 n.a.
48 Gadag-Betigeri CMC 6 - 5 - 60 0
49 Gulbarga M.Corp. 11 - 3 - 76 n.a.
50 Hubli-Dharwad M.Corp. 27 - 3-5 - 220 10
51 Mandya M 5 - 2-3 - 25 n.a.
52 Mangalore M.Corp. 10 - 3 - 69 0
53 Mysore M.Corp. 28 8 3 4 202 5
54 Shimoga CMC 18 - 2-3 - 72 0
55 Tumkur M 8 150 4 n.a. 84 10
Kerala
56 Alappuzha MC 4 - 1-2 - 20 057 Kollam MC 12 - 1-2 - 58 10
58 Kozhikode M.Corp. 22 - 4 - 152 10
59 Thalaserry M 5 - 2-3 - 30 20
60 Thiruvananthapuram M.Corp. 44 - 1-3 - 250 15
Madhya Pradesh
61 Bhind M 22 - 2-3 - 24 n.a.
62 Burhanpur M.Corp. 8 - 2-5 - 60 10
63 Dewas M.Corp. 10 - 1-3 - 39 10
64 Guna M 7 - 2 - 18 20
65 Gwalior M.Corp. 32 - 2-4 - 280 5
66 Jabalpur M.Corp. 25 - 5-8 - 298 30
67 Khandwa M 5 - 1-2 - 20 n.a.
68 Morena M 6 - 2-3 - 44 10
69 Murwara-Katni M.Corp. 5 - 3-5 - 63 20
70 Ratlam M.Corp. 4 - 3-6 - 35 n.a.
6 8 8
Sl. City/Town No. of vehicles used Average trips per Approx. % of vehicles
No. for transportation vehicle per day waste (MT) usually
Motorized Non- Motorized Non- transported under repai
motorized mototized daily
1 2 3 4 5 6 7
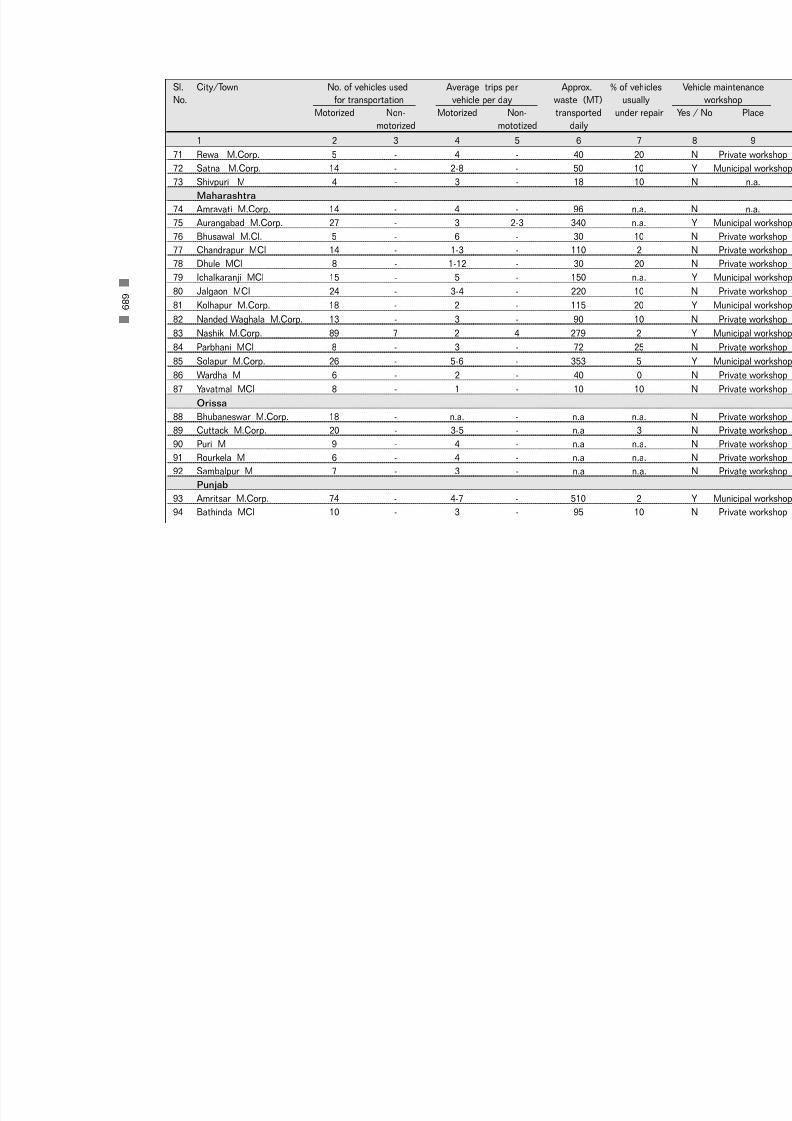
7/21/2019 Status Watersupply
http://slidepdf.com/reader/full/status-watersupply 709/869
71 Rewa M.Corp. 5 - 4 - 40 20
72 Satna M.Corp. 14 - 2-8 - 50 10
73 Shivpuri M 4 - 3 - 18 10
Maharashtra
74 Amravati M.Corp. 14 - 4 - 96 n.a.
75 Aurangabad M.Corp. 27 - 3 2-3 340 n.a.
76 Bhusawal M.Cl. 5 - 6 - 30 10
77 Chandrapur MCl 14 - 1-3 - 110 2
78 Dhule MCl 8 - 1-12 - 30 20
79 Ichalkaranji MCl 15 - 5 - 150 n.a.
80 Jalgaon MCl 24 - 3-4 - 220 10
81 Kolhapur M.Corp. 18 - 2 - 115 20
82 Nanded Waghala M.Corp. 13 - 3 - 90 10
83 Nashik M.Corp. 89 7 2 4 279 2
84 Parbhani MCl 8 - 3 - 72 25
85 Solapur M.Corp. 26 - 5-6 - 353 5
86 Wardha M 6 - 2 - 40 0
87 Yavatmal MCl 8 - 1 - 10 10
Orissa
88 Bhubaneswar M.Corp. 18 - n.a. - n.a n.a.
89 Cuttack M.Corp. 20 - 3-5 - n.a 3
90 Puri M 9 - 4 - n.a n.a.
91 Rourkela M 6 - 4 - n.a n.a.
92 Sambalpur M 7 - 3 - n.a n.a.
Punjab
93 Amritsar M.Corp. 74 - 4-7 - 510 2
94 Bathinda MCl 10 - 3 - 95 10
6 8 9
Sl. City/Town No. of vehicles used Average trips per Approx. % of vehicles
No. for transportation vehicle per day waste (MT) usually
Motorized Non- Motorized Non- transported under repai
motorized mototized daily
1 2 3 4 5 6 7

7/21/2019 Status Watersupply
http://slidepdf.com/reader/full/status-watersupply 710/869
95 Hoshiarpur MCl 4 - 2-10 - 33 0
96 Jalandhar M. Corp. 54 - 2-5 - 236 5
97 Moga MCl 7 - 2 - 36 20
98 Pathankot MCl 38 - 1-2 - 23 8
99 Patiala M.Corp. 36 - 1-2 - 80 0
Rajasthan
100 Ajmer MCl 28 - 6 - 250 10
101 Alwar M 22 - 1-5 - 100 10
102 Beawar M 3 - 8 - 42 n.a.
103 Bhilwara M 10 - 3 - 58 10
104 Bikaner M 13 - 6 - 180 10105 Jodhpur M.Corp. 57 - 2-3 - 308 12
106 Kota M.Corp. 30 - 3 - 120 20
107 Sriganganagar M 9 - 1-2 - 24 5
Tamil Nadu
108 Cuddalore M 9 - 3 - 59 0
109 Dindigul M 11 - 1-2 - 17 10
110 Erode M 10 25 3-4 2 85 10
111 Kanchipuram M 8 10 3 1 19 15
112 Kumbakonam M 13 10 3-4 4 40 n.a.
113 Nagercoil M 9 - 2 - 30 0
114 Rajapalaiyam M 11 - 2 - 43 20
115 Salem M.Corp. 68 - 3 - 214 n.a.
116 Thanjavur M 14 - 2 - 34 15
117 Tiruchirapalli M.Corp. 46 - 2-4 - 280 10
118 Tirunelveli M.Corp. 26 - 3 - 87 20
6 9 0
Sl. City/Town No. of vehicles used Average trips per Approx. % of vehicles
No. for transportation vehicle per day waste (MT) usually
Motorized Non- Motorized Non- transported under repai
motorized mototized daily
1 2 3 4 5 6 7

7/21/2019 Status Watersupply
http://slidepdf.com/reader/full/status-watersupply 711/869
119 Tirunvannamalai M 10 - 2-3 - 32 30
120 Tiruppur M 20 - 2-3 - 100 n.a.
121 Tuticorin M 14 - 1-2 - 25 20
122 Vellore M 12 - 1-2 - 35 25
Uttar Pradesh
123 Agra M.Corp. 36 - 5-7 - 430 n.a.
124 Aligarh M.Corp. 33 - 2-3 - 275 22
125 Allahabad M.Corp. 22 - 2-4 - 250 30
126 Bareilly M.Corp. 33 - 1-5 - 320 1
127 Etawah MB 5 - 4 - 27 28
128 Faizabad MB 4 - 5 - 54 50
129 Firozabad MB 11 - 3-6 - 144 15130 Ghaziabad M.Corp. 31 - 3-6 - 300 25
131 Gorakhpur M.Corp. 29 - 2-4 - 238 10
132 Haldwani-cum-Kathgodam MB 4 - 10 - 38 25
133 Hapur MB 4 - 5 - 70 10
134 Hardwar MB 35 - 1-6 - 182 8
135 Jhansi MB 14 - 4-5 - 134 30
136 Mathura MB 10 25 2-6 2 150 5
137 Meerut M.Corp. 35 - 4-5 - 500 10
138 Mirzapur MB 18 105 2-5 n.a 85 10
139 Moradabad M.Corp. 17 - 6-7 - 300 1
140 Muzaffarnagar MB 10 - 3-6 - 130 5141 Rae Bareli MB 4 - 6 - 66 5
142 Rampur MB 20 - 6 - 120 2
143 Saharanpur MB 27 - 2 - 200 30
144 Sitapur MB 17 - 2-4 - 70 10
145 Unnao MB 2 - 4 - 8 50
6 9 1
Sl. City/Town No. of vehicles used Average trips per Approx. % of vehicles
No. for transportation vehicle per day waste (MT) usually
Motorized Non- Motorized Non- transported under repai
motorized mototized daily
1 2 3 4 5 6 7

7/21/2019 Status Watersupply
http://slidepdf.com/reader/full/status-watersupply 712/869
West Bengal
146 Asansol M.Corp. 23 - 3 - 60 n.a.
147 Baharampur M 13 - 3 - 81 2
148 Balurghat M 3 - 3-5 - 33 10
149 Bankura M 6 20 1 1 26 n.a.
150 Barasat M 5 - 3 - 24 30
151 Burdwan M 8 - 2-4 - 75 15
152 Halisahar M 3 - 3 - 17 n.a.
153 Krishna Nagar M 5 - 3-4 - 37 30
154 Midnapur M 5 - 2-5 - 53 15
155 North Barrackpur M 6 - 3 - 40 n.a.
156 Santipur M 6 - 2-4 - 33 1157 Siliguri M.Corp. 26 - 3 - 150 n.a.
Small States
Assam
158 Guwahati M.Corp. Privatised - - - 240 n.app
159 Jorhat MB 5 - 3 - 14 n.a.
Manipur
160 Imphal MCl 10 - 2-4 - 38 70
Meghalaya
161 Shillong MB 10 - 1 - 78 20
Tripura
162 Agartala MCl 12 - 2-4 - 60 20Union Territories
163 Chandigarh M.Corp. 45 - 2-4 - 280 5
164 Pondicherry M 18 - 2-4 - 114 20
Source: Respective urban local governments/relevant agencies, NIUA Survey, 1999.
6 9 2
Sl. City/Town No. of vehicles used Average trips per Approx. % of vehicles
No. for transportation vehicle per day waste (MT) usually
Motorized Non- Motorized Non- transported under repai
motorized mototized daily
1 2 3 4 5 6 7

7/21/2019 Status Watersupply
http://slidepdf.com/reader/full/status-watersupply 713/869
CLASS II
Andhra Pradesh
1 Anakapalle M 13 - 1-3 - 55 25
2 Dharmavaram M 2 - 3 - 9 0
3 Gudur MCl 3 - 5 - 18 30
4 Kapra M 9 - 4-6 - 45 2
5 Kavali MCl 3 - 4 - 24 30
6 Madanapalle M 6 - 1-2 - 20 n.a.
7 Narasaraopet M 7 9 1-3 5 42 15
8 Rajendra Nagar MCl 3 - 2-3 - 9 20
9 Sangareddy MCl 5 - 2-3 - 14 2010 Srikakulam MCl 5 16 4 3 25 n.a.
11 Srikalahasti M 3 - 6 - 24 0
12 Suryapet MCl 4 - 5 - 30 25
Bihar
13 Buxar M 2 - 2 - 12 25
14 Deoghar M 1 n.a. 6 n.a. 10 10
15 Hajipur M 3 - 2 - 24 5
16 Hazaribagh M 6 - 3 - 36 25
17 Jehanabad M 1 - 4 - 10 30
18 Madhubani M 4 - 4 - 15 10
19 Mokama M 1 - 4 - 4 n.a.
Gujarat
20 Amreli M 4 - 7 - 30 15
21 Ankleswar M 3 - 2 - 6 5
22 Dabhoi M 1 - 6 - 18 0
6 9 3
Sl. City/Town No. of vehicles used Average trips per Approx. % of vehicles
No. for transportation vehicle per day waste (MT) usually
Motorized Non- Motorized Non- transported under repai
motorized mototized daily
1 2 3 4 5 6 7

7/21/2019 Status Watersupply
http://slidepdf.com/reader/full/status-watersupply 714/869
23 Dohad M 4 - 1-2 - 4 10
24 Gondal M 9 27 2 2 10 0
25 Jetpur M 3 24 8 7 40 0
26 Mahesana M 5 - 1-2 - 8 10
27 Palanpur M 5 - 3 - 40 10
Haryana
28 Jind MCl 3 na 4 - 18 10
29 Kaithal MCl 4 - 3 - 12 20
30 Rewari MCl 4 - 12 - 16 10
31 Thanesar MCl 5 3 1-3 3 24 10
Karnataka32 Bagalkot CMC 4 - 2 - 13 n.a.
33 Chikmagalur CMC 4 - 2 - 18 0
34 Gokak CMC 4 - 1-2 - 7 0
35 Hospet CMC 5 - 5 - 31 n.a.
36 Kolar CMC 5 - 3-4 - 15 30
37 Rabkavi-Banhatti CMC Privatised - - - Auctioned n.app
38 Ramanagaram CMC 4 - 2-3 - 10 50
Kerala
39 Changanessary MC n.a. n.a. n.a. n.a. 12 n.a.
40 Payyanur M 1 - 2 - 4 0
41 Taliparamba M 1 - 1 - 3 0
42 Thrissur MC 15 - 1-2 - 35 0
Madhya Pradesh
43 Hoshangabad M 2 - 5 - 15 50
44 Itarsi M 6 - 1-2 - 15 30
6 9 4
Sl. City/Town No. of vehicles used Average trips per Approx. % of vehicle
No. for transportation vehicle per day waste (MT) usually
Motorized Non- Motorized Non- transported under repa
motorized mototized daily
1 2 3 4 5 6 7

7/21/2019 Status Watersupply
http://slidepdf.com/reader/full/status-watersupply 715/869
45 Khargone M 3 - 2 - 6 n.a.
46 Mandsaur M 4 - 2 - 26 25
47 Nagda M 2 - 1-3 - 10 n.a.
48 Neemuch M 6 - 2 - 8 n.a.
49 Sehore M 4 - 4 - 30 25
50 Shahdol M 4 - 3 - 9 20
51 Vidisha M 5 - 4 - 10 10
Maharashtra
52 Amalner MCl 4 - 2-3 - 6 n.a.
53 Ballarpur MCl 5 - 1-2 - 18 10
54 Bhandara M 5 - 1-2 - 12 1055 Kamptee MCl 3 - 10 - 40 25
56 Manmad MCl 3 - 2-10 - 5 2
57 Ratnagiri MCl 4 - 2 - 22 10
58 Satara MCl 3 - 3 - 17 0
59 Virar MCl 9 - 2 - 50 0
Punjab
60 Ferozepur MCl 5 - 4 - 40 20
61 Kapurthala M 4 - 3 - 10 n.a.
62 Mansa MCl 3 - 6 - 27 n.a.
63 Phagwara MCl 5 - 2 - 14 0
64 Sangrur MCl 3 - 2 - 15 25
Rajasthan
65 Banswara M 5 - n.a. - 25 n.a.
66 Barmer M 6 - 1-3 - 18 30
67 Bundi M 3 - 4 - 24 0
6 9 5
Sl. City/Town No. of vehicles used Average trips per Approx. % of vehicles
No. for transportation vehicle per day waste (MT) usually
Motorized Non- Motorized Non- transported under repai
motorized mototized daily
1 2 3 4 5 6 7
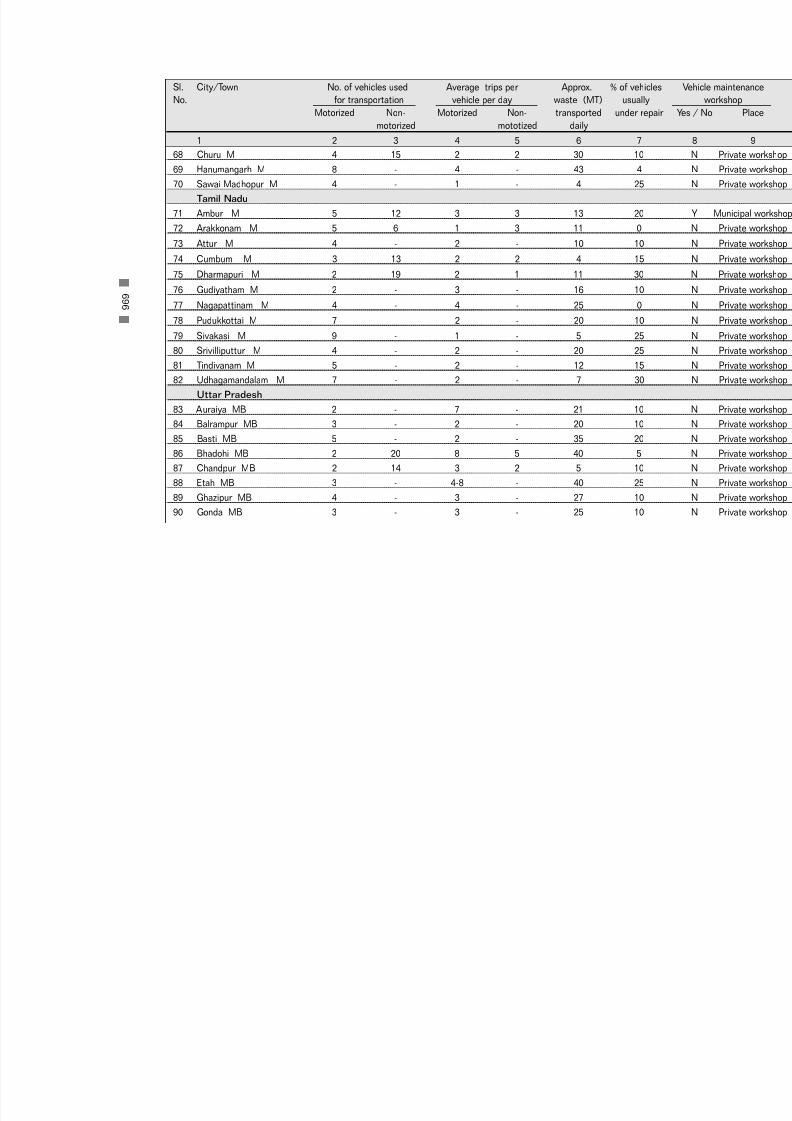
7/21/2019 Status Watersupply
http://slidepdf.com/reader/full/status-watersupply 716/869
68 Churu M 4 15 2 2 30 10
69 Hanumangarh M 8 - 4 - 43 4
70 Sawai Madhopur M 4 - 1 - 4 25
Tamil Nadu
71 Ambur M 5 12 3 3 13 20
72 Arakkonam M 5 6 1 3 11 0
73 Attur M 4 - 2 - 10 10
74 Cumbum M 3 13 2 2 4 15
75 Dharmapuri M 2 19 2 1 11 30
76 Gudiyatham M 2 - 3 - 16 10
77 Nagapattinam M 4 - 4 - 25 0
78 Pudukkottai M 7 - 2 - 20 10
79 Sivakasi M 9 - 1 - 5 25
80 Srivilliputtur M 4 - 2 - 20 25
81 Tindivanam M 5 - 2 - 12 15
82 Udhagamandalam M 7 - 2 - 7 30
Uttar Pradesh
83 Auraiya MB 2 - 7 - 21 10
84 Balrampur MB 3 - 2 - 20 10
85 Basti MB 5 - 2 - 35 20
86 Bhadohi MB 2 20 8 5 40 5
87 Chandpur MB 2 14 3 2 5 10
88 Etah MB 3 - 4-8 - 40 25
89 Ghazipur MB 4 - 3 - 27 10
90 Gonda MB 3 - 3 - 25 10
6 9 6
Sl. City/Town No. of vehicles used Average trips per Approx. % of vehicles
No. for transportation vehicle per day waste (MT) usually
Motorized Non- Motorized Non- transported under repai
motorized mototized daily
1 2 3 4 5 6 7

7/21/2019 Status Watersupply
http://slidepdf.com/reader/full/status-watersupply 717/869
91 Lakhimpur MB 3 - 2-6 - 35 10
92 Lalitpur MB 5 - 2-3 - 54 5
93 Mughalsarai MB 5 - 2-3 - 48 5
94 Nawabganj-Barabanki MB 3 - 2 - 6 35
95 Orai MB 3 50 5 8 29 30
96 Roorkee MB 3 - 3 - 27 20
West Bengal
97 Bishnupur M 2 30 2 1 13 25
98 Chakdaha M 1 8 2 4 7 3
99 Contai M 9 - 1-2 - 9 22
100 Cooch Behar M 7 20 2-3 2 21 60
101 Darjeeling M n.a. - 3 - 30 25
102 Jalpaiguri M 5 - 1-3 - 20 20
103 Jangipur M 2 - 3 - 18 n.a.
104 Katwa M 6 - 3 - 36 n.a.
105 Raniganj M 7 - 3 - 41 33
Small States
Himachal Pradesh
106 Shimla M.Corp. 8 - 3 - 35 2
Nagaland
107 Kohima TC 4 - 2-4 - 22 n.a.
Union Territories
108 Port Blair MCl 8 - 2-3 - 44 15
6 9 7
Sl. City/Town No. of vehicles used Average trips per Approx. % of vehicles
No. for transportation vehicle per day waste (MT) usually
Motorized Non- Motorized Non- transported under repai
motorized mototized daily
1 2 3 4 5 6 7

7/21/2019 Status Watersupply
http://slidepdf.com/reader/full/status-watersupply 718/869
Others(Smaller than Class II towns)
Small States
Goa
109 Panaji MCl 8 - 2 - 11 10
Sikkim
110 Gangtok (Greater Gangtok)NTAC 7 - 1 - 35 n.a.
Union Territories
111 Daman MCl 5 - 1-2 - 11 10
112 Silvassa CT 2 - 2 - 4 0
Source: Respective urban local governments/relevant agencies, NIUA Survey, 1999. 6 9 8
Sl. City/Town No. of vehicles used Average trips per Approx. % of vehicles
No. for transportation vehicle per day waste (MT) usually
Motorized Non- Motorized Non- transported under repai
motorized mototized daily
1 2 3 4 5 6 7

7/21/2019 Status Watersupply
http://slidepdf.com/reader/full/status-watersupply 719/869
C -4
T R
A N S P OR T A T I O N
V E HI C L E S A ND
T HE I R
DE T A I L S

7/21/2019 Status Watersupply
http://slidepdf.com/reader/full/status-watersupply 720/869

7/21/2019 Status Watersupply
http://slidepdf.com/reader/full/status-watersupply 721/869
Metropolitan Cities
1 Ahmedabad M.Corp. JCB 41 n.a.
Truck 3
Tipper 20
Dumper 27
Compact Machine 1
Total
2 Bangalore M.Corp. Tippers 90 5
Truck 226 4
Total
3 Bhopal M.Corp. Truck 23 4Compactor 4 5
Dumper 9 3
Tractor Trolley 11 3
Tipper 4 4
Others* 10
Total
4 Calcutta M.Corp. Truck 163 n.a.
Dumper 52
Tractor Trolley/Trailer 10
Total
5 Chennai M.Corp. Truck 230 n.a.Truck 120
Autos 75
Total
6 Coimbatore M.Corp. Truck 24 n.a.
Tractor Trolley 2
7 0 1
Sl. City/Town Type Number Approx. Avg
No. Capacity (MT)
1 2 3 4
C-4 : Transportation Vehicles and their Details

7/21/2019 Status Watersupply
http://slidepdf.com/reader/full/status-watersupply 722/869
Tippers 26
JCB 16
Dumper 16
Total
7 Delhi M.Corp. Tractor Trolley 2 3
Tipper truck 558 4
Total
8 Greater Mumbai M.Corp. Mobile compactors 146 8
Skip vehicles 123 3
Dumpers 82 4
Dumpers (private) 606 4
Others * 216 n.a.
Total
9 Hyderabad M.Corp. Dumper 45 3
Tipper 90 4
Large compactors 12 8
Small compactors 12 3
Power tiller 16 1
Total
10 Indore M.Corp. Tippers n.a. n.a.
Dumper
Total
11 Jaipur M.Corp. Dumpers 12 4
Canters 52 4
JCB 4 n.a.
Total
12 Kanpur M.Corp. Tippers 40 5
Truck 28 3
7 0 2
Sl. City/Town Type Number Approx. AvgNo. Capacity (MT)
1 2 3 4

7/21/2019 Status Watersupply
http://slidepdf.com/reader/full/status-watersupply 723/869
Tractor Trolley 35 2
Total
13 Kochi M.Corp. Tractor Trolley 11 4
Truck 6 6
Tippers 2 7
Dumper 12 1
Auto-trailler 9 0.5
Side load lorry & JCB 3 5
Total
14 Lucknow M.Corp. Tippers 30 4
Refuse Collector 5 5
Refuse collector 1 5
Total 15 Ludhiana M.Corp. Tippers 27 5
Dumper placer 25 1.5
Tractor Trolley 9 1.5
H. Tugger 4 1.5
Total
16 Madurai M.Corp. Truck 11 3
Tractor Trolley/Trailer 4 3
Tippers 13 n.a.
Mini-Truck 4 1.5
Truck (hired) 27 3
Total 17 Nagpur M.Corp. Truck 30 5
Tippers 6 3
Truck (hired) 20 3
Tractor Trolley 2 0.5
Total
7 0 3
Sl. City/Town Type Number Approx. AvgNo. Capacity (MT)
1 2 3 4

7/21/2019 Status Watersupply
http://slidepdf.com/reader/full/status-watersupply 724/869
18 Pune M.Corp. Dumper placer 70 1.5
Tippers 52 3Compactor 1 10
Total
19 Surat M.Corp. Dumper trucks 38 6
Dumper placer 57 2
Tractor Trailer 28 3
Tipper 1 6
Total
20 Vadodara M.Corp. Dumper placer 22 1.5
Tippers 15 5
Pick-up van 10 3
Total 21 Varanasi M.Corp. Tipper truck 12 5
Tractor Trolley 16 3
Dumper placer 4 1.5
JCB 3 2
Total
22 Visakhapatnam M.Corp. Van 33 3
Tractors 27 3
Tipper 15 6
Mini-Truck 2 4
Truck 1 6
Dumper 12 2
Compactor 1 6
Total
Note : Data for average waste transported was furnished by the respective urban local bodies. The number of vehicles, multiplied by the
may not addup to the waste transported.
"Others" include stationary compactors, tempo private, dumpers private, bulk refuse carrierSource: Respective urban local governments/relevant agencies, NIUA Survey, 1999.
7 0 4
Sl. City/Town Type Number Approx. AvgNo. Capacity (MT)
1 2 3 4

7/21/2019 Status Watersupply
http://slidepdf.com/reader/full/status-watersupply 725/869
CLASS I
Andhra Pradesh
1 Anantapur MCl Tractor 4 3
Tipper 3 5
Total
2 Chittoor M Tractor 2 4
Truck (privatised service) 2 3
Total
3 Cuddapah MCl Tractor (private) 7 1.5
Tractor (own) 1 3
Total
4 Eluru M Tractor 10 2
Bullock Carts 50 0.2Total
5 Guntur MCl Truck 3 4
Tractor 24 2
Rickshaw 20 0.1
Total
6 Hindupur M Tractor 4 3
Total
7 Kakinada M Tractor 14 2
Others 12 3
Total
8 Kurnool MCl Tipper 1 2Tractor 10 1.5
Total
9 Machilipatnam M Tractor 4 2
Bullock Carts 26 0.3
Total
7 0 5
Sl. City/Town Type Number Approx. AvgNo. Capacity (MT)
1 2 3 4

7/21/2019 Status Watersupply
http://slidepdf.com/reader/full/status-watersupply 726/869
10 Nandyal MCl Wheel barrow 104 0.3
Tractor 4 1Total
11 Nellore MCl Truck 1 5
Tractor 26 1.5
Total
12 Nizamabad M Tractor 4 3
Truck 1 7
Total
13 Ongole MCl Tractor 5 3
Total
14 Qutubullapur M Truck 5 3
Tractor Trolley 1 3Total
15 Rajahmundry M.Corp. Tractor 19 2
Total
16 Tenali M Tractor 5 2
Total
17 Tirupati MCl Truck 1 4
Tractor 6 2
Tractor (hired) 8 2
Total
18 Vijaywada M.Corp. Van 13 3
Tipper 20 3
Tractor 15 2Total
19 Warangal M.Corp. Tractor 19 3
JCB 1 3
Total
7 0 6
Sl. City/Town Type Number Approx. AvgNo. Capacity (MT)
1 2 3 4

7/21/2019 Status Watersupply
http://slidepdf.com/reader/full/status-watersupply 727/869
Bihar
20 Bihar Sharif M Tractor 4 1
Handcarts n.a. n.a.
Total
21 Chhapra M Tractor 6 4
Total
22 Gaya M.Corp. Loader 1 2
Dumper 2 1.5
Tractor 7 2
Total
23 Katihar M Tractor 5 1.5
Handcarts n.a. n.a.
Total 24 Munger M Tractor 7 1.5
Total
25 Ranchi M.Corp. Tractor 11 n.a.
Dumper placer 1
Total
Gujarat
26 Anand M Wheel barrow 13 n.a.
Truck 2 n.a.
Tractor Trolley 1 1.5
Total
27 Bharuch M Tractor 1 1
Truck 1 5
Dumper 3 3
Tempo 6 0.5
Total
7 0 7
Sl. City/Town Type Number Approx. AvgNo. Capacity (MT)
1 2 3 4
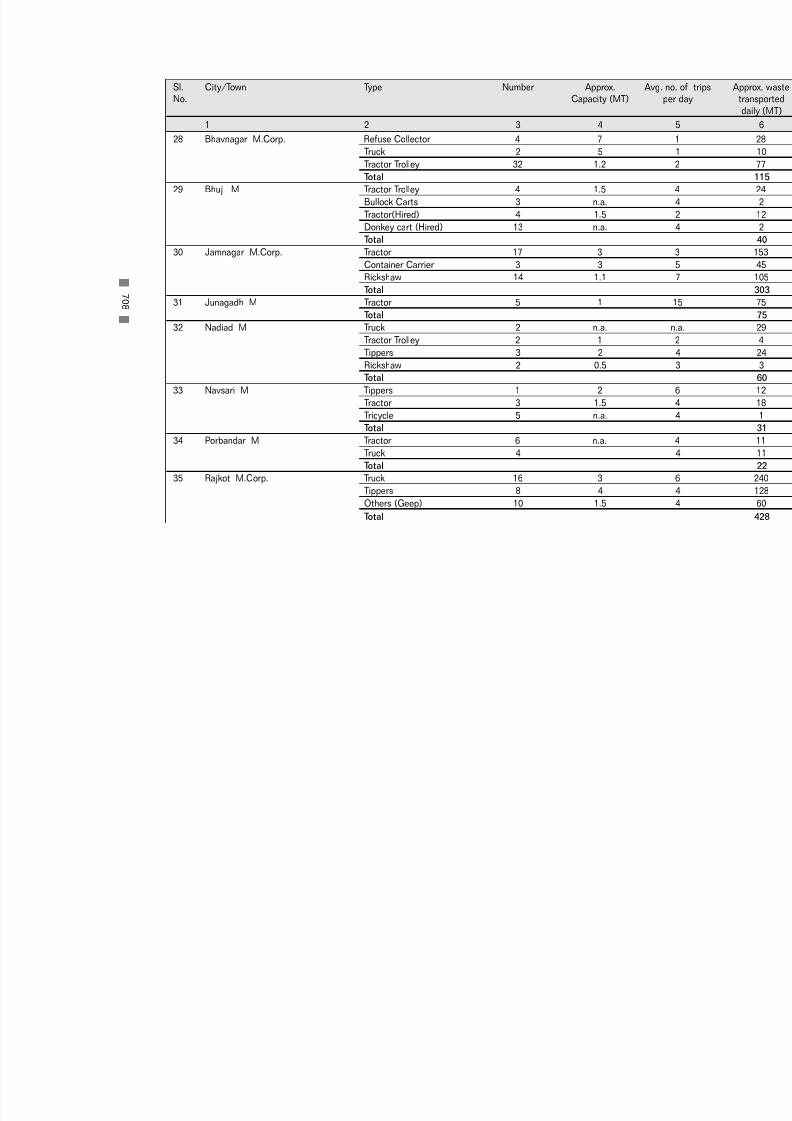
7/21/2019 Status Watersupply
http://slidepdf.com/reader/full/status-watersupply 728/869
28 Bhavnagar M.Corp. Refuse Collector 4 7
Truck 2 5Tractor Trolley 32 1.2
Total
29 Bhuj M Tractor Trolley 4 1.5
Bullock Carts 3 n.a.
Tractor(Hired) 4 1.5
Donkey cart (Hired) 13 n.a.
Total
30 Jamnagar M.Corp. Tractor 17 3
Container Carrier 3 3
Rickshaw 14 1.1
Total
31 Junagadh M Tractor 5 1Total
32 Nadiad M Truck 2 n.a.
Tractor Trolley 2 1
Tippers 3 2
Rickshaw 2 0.5
Total
33 Navsari M Tippers 1 2
Tractor 3 1.5
Tricycle 5 n.a.
Total
34 Porbandar M Tractor 6 n.a.
Truck 4Total
35 Rajkot M.Corp. Truck 16 3
Tippers 8 4
Others (Geep) 10 1.5
Total
7 0 8
Sl. City/Town Type Number Approx. AvgNo. Capacity (MT)
1 2 3 4

7/21/2019 Status Watersupply
http://slidepdf.com/reader/full/status-watersupply 729/869
36 Surendranagar M Tractor 5 1.5
Total Haryana
37 Ambala MCl Tractor Trolley 5 1
Carts 5 0.05
Total
38 Faridabad M.Corp. Refuse Collector 3 7
Truck 3 3
Dumper 3 2
Tractor Trolley 30 n.a.
Total
39 Gurgaon MCl Refuse Collector 1 15
Tractor Trolley 3 2Loader 2 n.a.
Total
40 Hissar MCl Tractor Trolley 8 1
Total
41 Karnal MCl Tractor 8 1
Rickshaw 20 0.1
Total
42 Rohtak MCl Truck 2 2
Tractor Trolley 8 2
Total
Jammu & Kashmir
43 Jammu M.Corp. Tractor 12 3
Trolley 9 2
Total
44 Srinagar M.Corp Trippers/Trucks 18 0.5
Dumper Placer 12 1.5
7 0 9
Sl. City/Town Type Number Approx. AvgNo. Capacity (MT)
1 2 3 4

7/21/2019 Status Watersupply
http://slidepdf.com/reader/full/status-watersupply 730/869
Tractor Trolley 2 6
Compacter 1 16Total
Karnataka
45 Belgaum M.Corp. Tipper (Big) 4 6
Truck 10 3
Total
46 Bellary CMC Truck 5 3
Total
47 Davangere MCl Tractor 7 1.5
Truck 5 3
Total
48 Gadag-Betigeri CMC Tractor Trolley 6 2Total
49 Gulbarga M.Corp. Truck 7 3
Tractor 4 2
Total
50 Hubli-Dharwad M.Corp. Truck 19 3
Tractor Trolley 8 1.3
Total
51 Mandya M Tractor 3 2
Truck 2 2
Total
52 Mangalore M.Corp. Truck 6 3Tractor 3 2
Mini-Truck 1 2
Total
53 Mysore M.Corp. Truck 16 3
Tractor 7 2
7 1 0
Sl. City/Town Type Number Approx. AvgNo. Capacity (MT)
1 2 3 4

7/21/2019 Status Watersupply
http://slidepdf.com/reader/full/status-watersupply 731/869
Mini-Truck 5 2
Carts 8 0.3Total
54 Shimoga CMC Tractor 11 n.a.
Truck 3 3
Power tiller 4 1.5
Total
55 Tumkur M Tractor 7 3
Total
Kerala
56 Alappuzha MC Tippers 2 2
Truck 2 4
Total 57 Kollam MC Truck 3 5
Tractor 9 3
Total
58 Kozhikode M.Corp. Truck 2 3
Excavator 2 2
Tractor 14 2
Total
5 Thalaserry M Tractor 2 3
Tiller 2 1.5
Truck 1 3
Total
60 Thiruvananthapuram M.Corp. Truck 16 5
Tractor 8 3
Truck 20 1.5
Total
7 1 1
Sl. City/Town Type Number Approx. AvgNo. Capacity (MT)
1 2 3 4
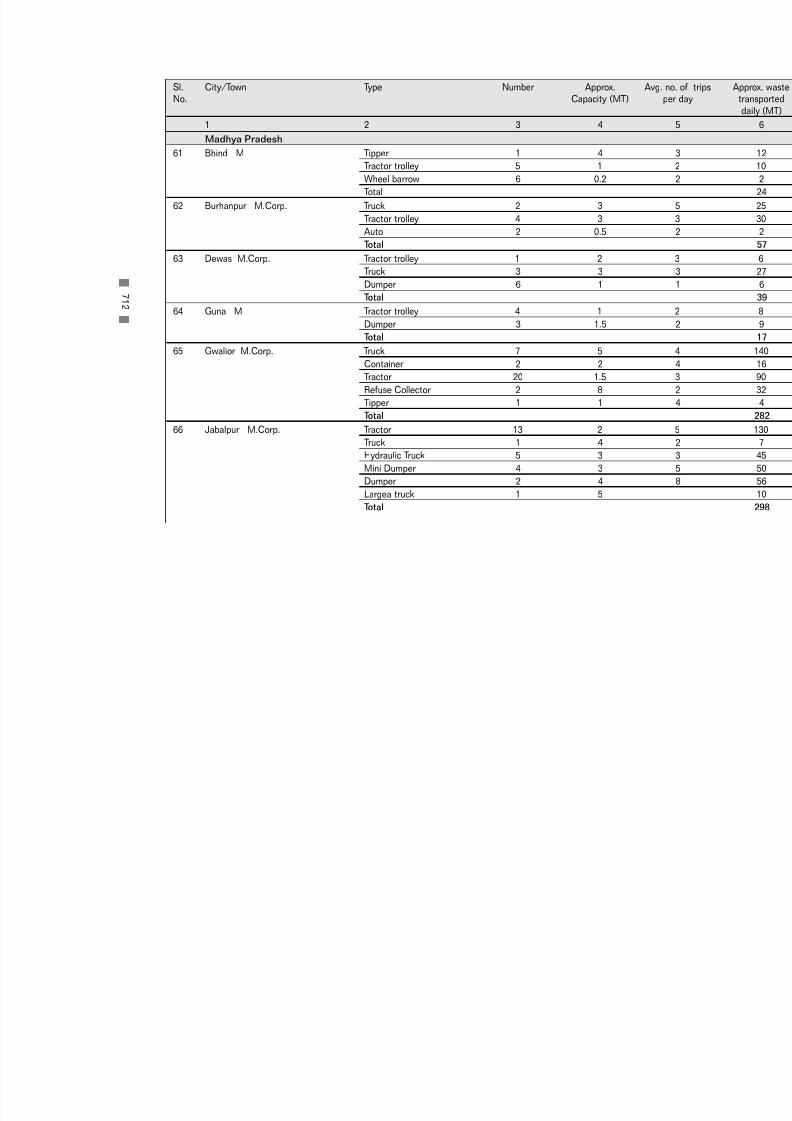
7/21/2019 Status Watersupply
http://slidepdf.com/reader/full/status-watersupply 732/869
Madhya Pradesh
61 Bhind M Tipper 1 4Tractor trolley 5 1
Wheel barrow 6 0.2
Total
62 Burhanpur M.Corp. Truck 2 3
Tractor trolley 4 3
Auto 2 0.5
Total
63 Dewas M.Corp. Tractor trolley 1 2
Truck 3 3
Dumper 6 1
Total 64 Guna M Tractor trolley 4 1
Dumper 3 1.5
Total
65 Gwalior M.Corp. Truck 7 5
Container 2 2
Tractor 20 1.5
Refuse Collector 2 8
Tipper 1 1
Total
66 Jabalpur M.Corp. Tractor 13 2
Truck 1 4
Hydraulic Truck 5 3
Mini Dumper 4 3
Dumper 2 4
Largea truck 1 5
Total
7 1 2
Sl. City/Town Type Number Approx. AvgNo. Capacity (MT)
1 2 3 4

7/21/2019 Status Watersupply
http://slidepdf.com/reader/full/status-watersupply 733/869
67 Khandwa M Tractor 3 2
Truck 1 3Dumper 1 4
Total
68 Morena M Dumper 2 5
Tractor trolley 4 2
Total
69 Murwara-Katni M.Corp. Truck 3 3
Dumper 1 4
Tractor 1 3
Total
70 Ratlam M.Corp. Truck 2 n.a.
Tractor trolley 2Total
71 Rewa M.Corp. Tractor trolley 5 2
Total
72 Satna M.Corp. Dumper 2 8
Tractor 11 n.a.
Truck 1
Total
73 Shivpuri M Tractor trolley 3 1.2
Dumper 1 2
Total
Maharashtra
74 Amravati M.Corp. Truck 12 2
Total
75 Aurangabad M.Corp. Truck 14 5
Tippers 10 3
Rickshaw 4 0.05
7 1 3
Sl. City/Town Type Number Approx. AvgNo. Capacity (MT)
1 2 3 4

7/21/2019 Status Watersupply
http://slidepdf.com/reader/full/status-watersupply 734/869
Matador 3 3
Total 76 Bhusawal M.Cl. Tractor Trolley 5 1
Total
77 Chandrapur MCl Truck 6 3
Tractor 3 3
Truck (large) 1 4
Truck (hired) 4 4
Total
78 Dhule MCl Truck 5 2
Hydraulic truck 1 1
Tractor 1 2
Dumper 1 3Total
79 Ichalkaranji MCl Tractor Trolley 15 2
Total
80 Jalgaon MCl Tractor 16 3
Dumper 6 3
Total
81 Kolhapur M.Corp. Truck 14 3
Refuse Collector 2 8
Total
82 Nanded Waghala M.Corp. Truck 1 3
Mini-truck 6 2
Tipper 1 3
Tempo 1 1
Tractor Trolley 4 2
Total
7 1 4
Sl. City/Town Type Number Approx. AvgNo. Capacity (MT)
1 2 3 4
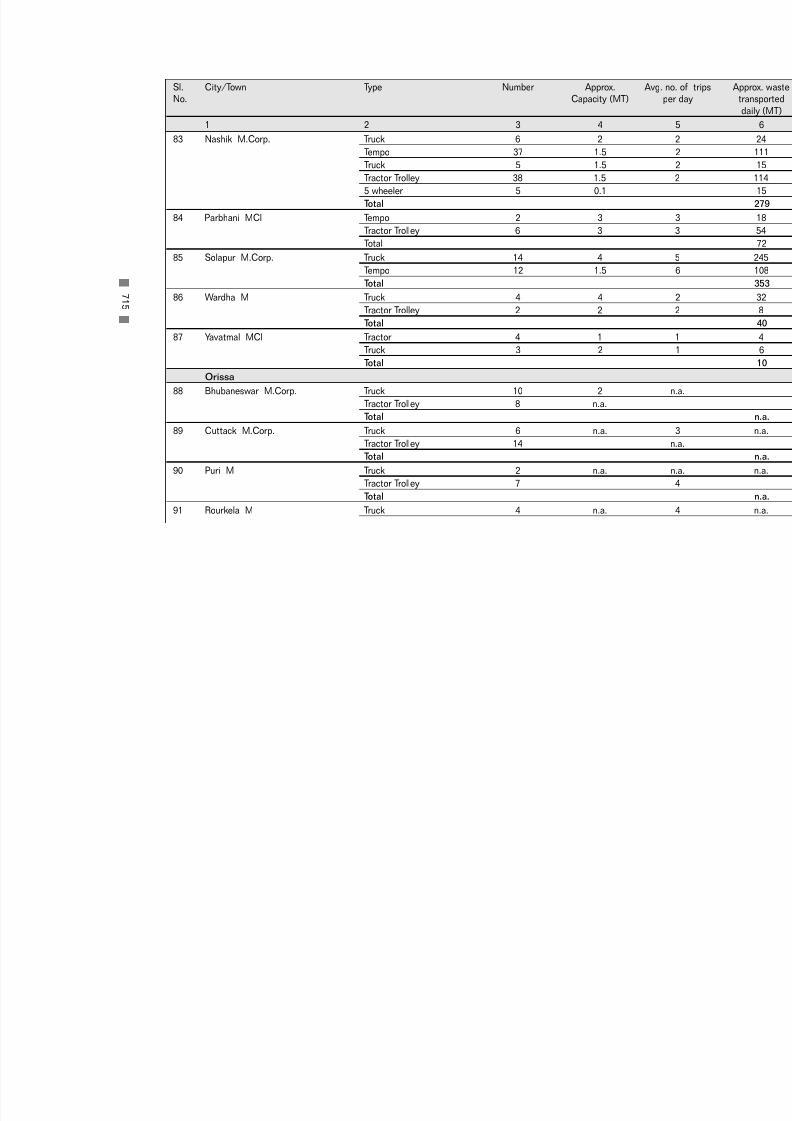
7/21/2019 Status Watersupply
http://slidepdf.com/reader/full/status-watersupply 735/869
83 Nashik M.Corp. Truck 6 2
Tempo 37 1.5Truck 5 1.5
Tractor Trolley 38 1.5
5 wheeler 5 0.1
Total
84 Parbhani MCl Tempo 2 3
Tractor Trolley 6 3
Total
85 Solapur M.Corp. Truck 14 4
Tempo 12 1.5
Total
86 Wardha M Truck 4 4Tractor Trolley 2 2
Total
87 Yavatmal MCl Tractor 4 1
Truck 3 2
Total
Orissa
88 Bhubaneswar M.Corp. Truck 10 2
Tractor Trolley 8 n.a.
Total
89 Cuttack M.Corp. Truck 6 n.a.
Tractor Trolley 14
Total
90 Puri M Truck 2 n.a.
Tractor Trolley 7
Total
91 Rourkela M Truck 4 n.a.
7 1 5
Sl. City/Town Type Number Approx. AvgNo. Capacity (MT)
1 2 3 4

7/21/2019 Status Watersupply
http://slidepdf.com/reader/full/status-watersupply 736/869
Tractor Trolley 2
Total 92 Sambalpur M Truck 2 1.3
Tractor Trolley 4 n.a.
Dumper 1
Total
Punjab
93 Amritsar M.Corp. Tractor Trolley 56 3
Dumper 15 4
Tippers 3 10
Total
94 Bathinda MCl Tractor Trolley 8 3
Dumper 2 5Total
95 Hoshiarpur MCl Truck 1 5
Tractor Trolley 1 1
Dumper 2 1
Total
96 Jalandhar M. Corp. Tippers 11 4
Tractor 2 2
Dumper 8 1
Three wheeler 30 0.2
Refuse Collector 3 5
Total
97 Moga MCl Truck 2 4
Tractor Trolley 5 2
Total
98 Pathankot MCl Auto rickshaw 6 0.4
Tractor Trolley 2 1.2
7 1 6
Sl. City/Town Type Number Approx. AvgNo. Capacity (MT)
1 2 3 4

7/21/2019 Status Watersupply
http://slidepdf.com/reader/full/status-watersupply 737/869
Dumper 30 0.5
Total 99 Patiala M.Corp. Tractor Trolley 13 1
Truck 3 4
Container 20 1.5
Total
Rajasthan
100 Ajmer MCl Tractor Trolley 17 3
Total
101 Alwar M Tractor Trolley 18 1
Tempo 2 0.3
Dumper 2 5
Total
102 Beawar M Tractor Trolley 3 1.8
Total
103 Bhilwara M Dumper 5 3
Tractor Trolley 5 1
Total
104 Bikaner M Tractor 9 1.1
Dumper 4 5
Total
105 Jodhpur M.Corp. Dumper 17 2
Tractor 40 2
Total
106 Kota M.Corp. Dumper 8 1.5Tractor Trolley 19 1.5
Total
107 Sriganganagar M Tractor Trolley 6 2
Truck 3 2
Total
7 1 7
Sl. City/Town Type Number Approx. AvgNo. Capacity (MT)
1 2 3 4
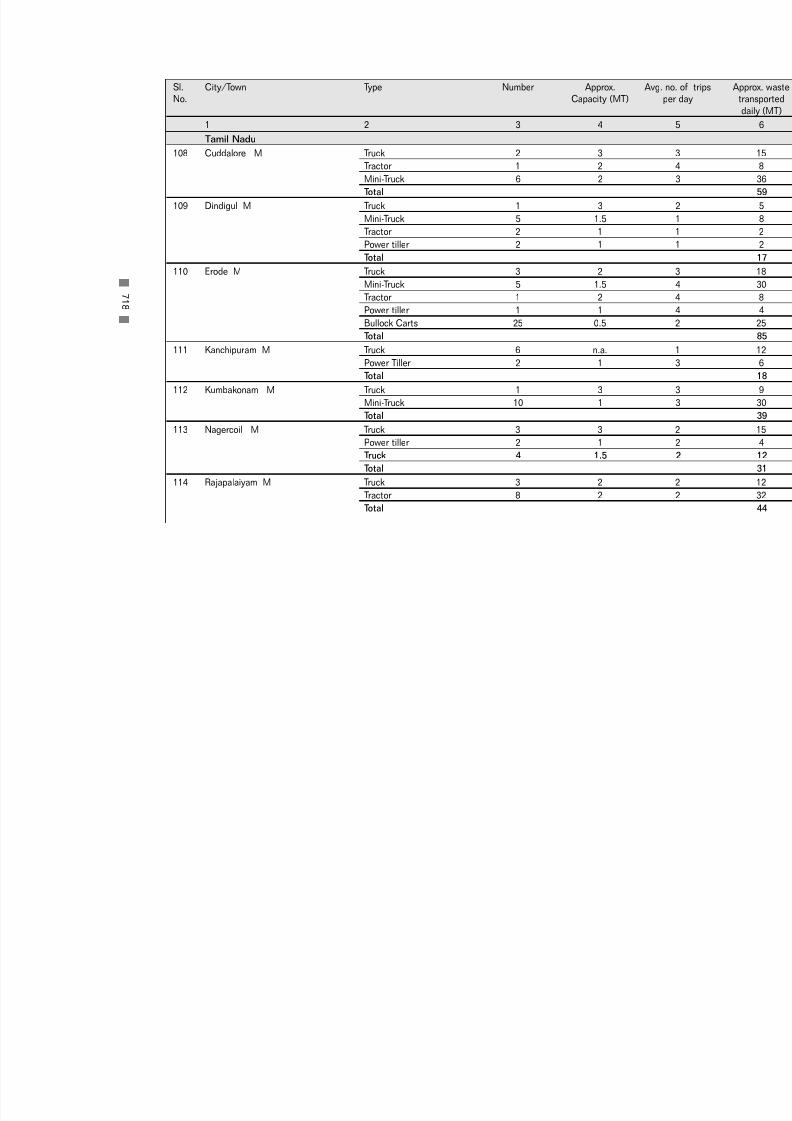
7/21/2019 Status Watersupply
http://slidepdf.com/reader/full/status-watersupply 738/869
Tamil Nadu
108 Cuddalore M Truck 2 3Tractor 1 2
Mini-Truck 6 2
Total
109 Dindigul M Truck 1 3
Mini-Truck 5 1.5
Tractor 2 1
Power tiller 2 1
Total
110 Erode M Truck 3 2
Mini-Truck 5 1.5
Tractor 1 2Power tiller 1 1
Bullock Carts 25 0.5
Total
111 Kanchipuram M Truck 6 n.a.
Power Tiller 2 1
Total
112 Kumbakonam M Truck 1 3
Mini-Truck 10 1
Total
113 Nagercoil M Truck 3 3
Power tiller 2 1
Truck 4 1.5
Total
114 Rajapalaiyam M Truck 3 2
Tractor 8 2
Total
7 1 8
Sl. City/Town Type Number Approx. AvgNo. Capacity (MT)
1 2 3 4

7/21/2019 Status Watersupply
http://slidepdf.com/reader/full/status-watersupply 739/869
115 Salem M.Corp. Tractor 40 1.5
Truck 6 4Mini-Truck 4 2
Swaraj Mazda truck 7 2
Van 2 1.5
Total
116 Thanjavur M Truck 11 1
Tippers 2 2
Tractor 1 2
Total
117 Tiruchirapalli M.Corp. Truck 31 n.a.
Tractor 4
Pick up van 11Total
118 Tirunelveli M.Corp. Truck 4 2
Mini-Truck 14 1
Tractor 4 1
Tippers 2 1
Container 2 0.5
Total
119 Tirunvannamalai M Tippers 3 3
Tippers (small) 2 1
Truck 1 1.5
DCM truck 4 1
Total 120 Tiruppur M Truck 7 3
Mini-Truck 7 2
Tractor 4 1
Tippers 2 1
Total
7 1 9
Sl. City/Town Type Number Approx. AvgNo. Capacity (MT)
1 2 3 4

7/21/2019 Status Watersupply
http://slidepdf.com/reader/full/status-watersupply 740/869
121 Tuticorin M Tiller 2 3
Truck 3 1Tractor 4 2
Mini van 5 1
Total
122 Vellore M Truck 8 2
Power tiller 4 1
Total
Uttar Pradesh
123 Agra M.Corp. Tippers 24 n.a.
Tractor 6
D.P. 3
Total 124 Aligarh M.Corp. Tractor Trolley 16 1.8
Truck 12 5
Tippers 2 2
Refuse Collector 2 10
Total
125 Allahabad M.Corp. Tippers 15 3
Refuse Collector 4 8
Tractor Trolley 3 1.5
Total
126 Bareilly M.Corp. Refuse Collector 3 15
Dumper placer 3 1Tractor Trolley 21 2
Tippers 6 4
Total
127 Etawah MB Tractor 5 n.a.
Total
7 2 0
Sl. City/Town Type Number Approx. AvgNo. Capacity (MT)
1 2 3 4

7/21/2019 Status Watersupply
http://slidepdf.com/reader/full/status-watersupply 741/869
128 Faizabad MB Dumper 2 n.a.
Tractor Trolley 2Total
129 Firozabad MB Tractor 6 2
Truck 4 4
DCM Truck 1 4
Total
130 Ghaziabad M.Corp. Tippers 6 n.a.
Tractor Trolley 24
Carrier 1
Total
131 Gorakhpur M.Corp. Tractor Trolley 18 2
Truck 6 3Refuse Collector 3 4
Dumper 2 4
Total
132 Haldwani-cum-Kathgodam MB Truck 1 2
Tractor Trolley 3 2
Total
133 Hapur MB Tractor 4 4
Total
134 Hardwar MB Tractor 7 2
Gas mover 1 1
Truck 5 3Carrier bin 22 1.5
Total
135 Jhansi MB Tractor Trolley 13 1.5
Dumper 1 9
Total
7 2 1
Sl. City/Town Type Number Approx. AvgNo. Capacity (MT)
1 2 3 4

7/21/2019 Status Watersupply
http://slidepdf.com/reader/full/status-watersupply 742/869

7/21/2019 Status Watersupply
http://slidepdf.com/reader/full/status-watersupply 743/869
Tractor Trolley 10 4
Mini-Truck 8 3Gas mover 1 4
Total
144 Sitapur MB Tractor Trolley 8 1
Tippers 7 1
Tempo 2 3
Total
145 Unnao MB Tractor 2 1
Total
West Bengal
146 Asansol M.Corp. Truck 23 2
Total 147 Baharampur M Truck 1 3
Tractor 12 2
Total
148 Balurghat M Truck 1 3
Tractor 2 3
Total
149 Bankura M Tractor 6 4
Handcarts 20 0.3
Total
150 Barasat M Tractor 3 2
Truck 1 3Total
151 Burdwan M Truck 6 n.a.
Tractor Trolley 2 2
Total
7 2 3
Sl. City/Town Type Number Approx. AvgNo. Capacity (MT)
1 2 3 4

7/21/2019 Status Watersupply
http://slidepdf.com/reader/full/status-watersupply 744/869
152 Halisahar M Tractor 3 2
Total 153 Krishna Nagar M Truck 1 4
Tractor Trolley 4 2
Total
154 Midnapur M Truck 3 3
Tractor Trailer 2 2
Total
155 North Barrackpur M Tractor 5 2
Truck 1 3
Total
156 Santipur M Truck 1 2
Tractor 5 1.5Total
157 Siliguri M.Corp. Tractor 4 n.a.
Truck 6
Total
Small States
Assam
158 Guwahati M.Corp. Truck (large) 25 3
Truck (small) 3 1
Total
159 Jorhat MB Truck 2 1.5
Tractor Trolley 3 n.a.
Total
Manipur
160 Imphal MCl Truck 2 1
Dumper 4 1.5
Tractor Trolley 4 1
7 2 4
Sl. City/Town Type Number Approx. AvgNo. Capacity (MT)
1 2 3 4

7/21/2019 Status Watersupply
http://slidepdf.com/reader/full/status-watersupply 745/869
Total
Meghalaya
161 Shillong MB Tipper 4 n.a.
Truck 6
Total
Tripura
162 Agartala MCl Truck 9 3
Tractor Trolley 1 2
Tipper 2 1.8
Total
Union Territories
163 Chandigarh M.Corp. Dumper 16 1
Compactors 5 3
Tractor Trolley 20 1.5
Truck 1 1
Total
164 Pondicherry M Tipper 7 4
Truck 6 3
Power tiller 2 0.5
Tractor 3 2
Total
Note : Data for average waste transported was furnished by the respective urban local bodies. The number of vehicles, multiplied by themay not addup to the waste transported.
Source: Respective urban local governments/relevant agencies, NIUA Survey, 1999.
7 2 5
Sl. City/Town Type Number Approx. AvgNo. Capacity (MT)
1 2 3 4

7/21/2019 Status Watersupply
http://slidepdf.com/reader/full/status-watersupply 746/869
CLASS II
Andhra Pradesh
1 Anakapalle M Tractor 4 2
Tractor (hired) 2 2
Tipper 1 3
Tiller 6 0.9
Total
2 Dharmavaram M Tractor 2 1.5
Total
3 Gudur MCl Tractor 3 2
Total
4 Kapra M Tractor 6 1.5
Total
5 Kavali MCl Tractor 3 2
Total
6 Madanapalle M Tractor 4 3
Tractor (hired) 2 2
Total
7 Narasaraopet M Tractor 3 3
Bullock Carts 9 0.3
Tipper 4 2
Total
7 2 6
Sl. City/Town Type Number Approx. AvgNo. Capacity (MT)
1 2 3 4

7/21/2019 Status Watersupply
http://slidepdf.com/reader/full/status-watersupply 747/869
8 Rajendra Nagar MCl Tractor 1 1.5
Truck 1 2
Total
9 Sangareddy MCl Tractor 1 1.5
Tractor (hired) 3 1.5
Total
10 Srikakulam MCl Tractor 3 2
Tractor (hired) 2 2
Total
11 Srikalahasti M Tractor trailor 2 2
Total
12 Suryapet MCl Tractor 3 2
Total
Bihar
13 Buxar M Tractor 2 3
Total
14 Deoghar M Tractor 1 1.5
Handcarts n.a. n.a.
Total
15 Hajipur M Tractor 3 n.a.
Total
16 Hazaribagh M Tractor 3 1
Truck 3 3Total
17 Jehanabad M Tractor 1 3
Total
18 Madhubani M Tractor 4 1
Total
7 2 7
Sl. City/Town Type Number Approx. AvgNo. Capacity (MT)
1 2 3 4

7/21/2019 Status Watersupply
http://slidepdf.com/reader/full/status-watersupply 748/869
19 Mokama M Tractor (hired) 1 4
Total Gujarat
20 Amreli M Tractor 4 1
Total
21 Ankleswar M Tractor Trolley 3 1
Total
22 Dabhoi M Truck 1 3
Total
23 Dohad M Truck 1 1
Tractor 3 0.5
Total
24 Gondal M Two wheeler 25 n.a.
Tractor 7
Total
25 Jetpur M Tractor 3 1.5
Handcarts 24 n.a.
Total
26 Mahesana M Tractor 4 1
Total
27 Palanpur M Tractor 3 4
Auto 2 n.a.
Total
Haryana
28 Jind MCl Tractor Trolley 3 1.5
Total
29 Kaithal MCl Tractor Trolley 4 1
Total
7 2 8
Sl. City/Town Type Number Approx. AvgNo. Capacity (MT)
1 2 3 4

7/21/2019 Status Watersupply
http://slidepdf.com/reader/full/status-watersupply 749/869
30 Rewari MCl Tractor Trolley 3 1.3
31 Thanesar MCl Tractor Trolley 4 1
Refuse Collector 1 10
Thela 3 0.3
Total
Karnataka
32 Bagalkot CMC Tractor 3 1.5
Truck 1 2
Total
33 Chikmagalur CMC Truck 2 3
Tractor 2 1.5
Total
34 Gokak CMC Tractor 2 1.5
Tempo 2 1.5
Total
35 Hospet CMC Tractor 3 1.5
Tippers 1 3
Total
36 Kolar CMC Tractor 4 2
Tippers 1 3
Total
37 Rabkavi-Banhatti CMC Municipality sells waste by auctionnot applicableTotal
38 Ramanagaram CMC Truck 2 1.5
Tractor 1 1
Total
7 2 9
Sl. City/Town Type Number Approx. AvgNo. Capacity (MT)
1 2 3 4
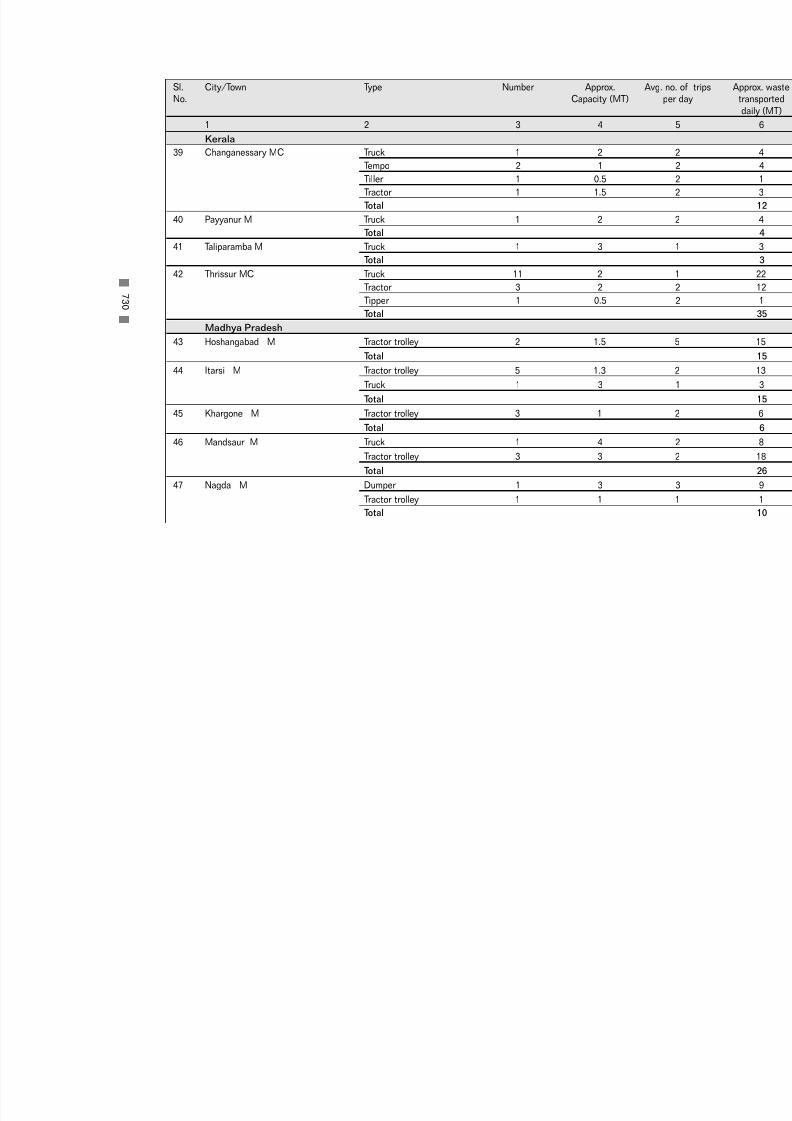
7/21/2019 Status Watersupply
http://slidepdf.com/reader/full/status-watersupply 750/869
Kerala
39 Changanessary MC Truck 1 2Tempo 2 1
Tiller 1 0.5
Tractor 1 1.5
Total
40 Payyanur M Truck 1 2
Total
41 Taliparamba M Truck 1 3
Total
42 Thrissur MC Truck 11 2
Tractor 3 2
Tipper 1 0.5Total
Madhya Pradesh
43 Hoshangabad M Tractor trolley 2 1.5
Total
44 Itarsi M Tractor trolley 5 1.3
Truck 1 3
Total
45 Khargone M Tractor trolley 3 1
Total
46 Mandsaur M Truck 1 4
Tractor trolley 3 3
Total
47 Nagda M Dumper 1 3
Tractor trolley 1 1
Total
7 3 0
Sl. City/Town Type Number Approx. AvgNo. Capacity (MT)
1 2 3 4
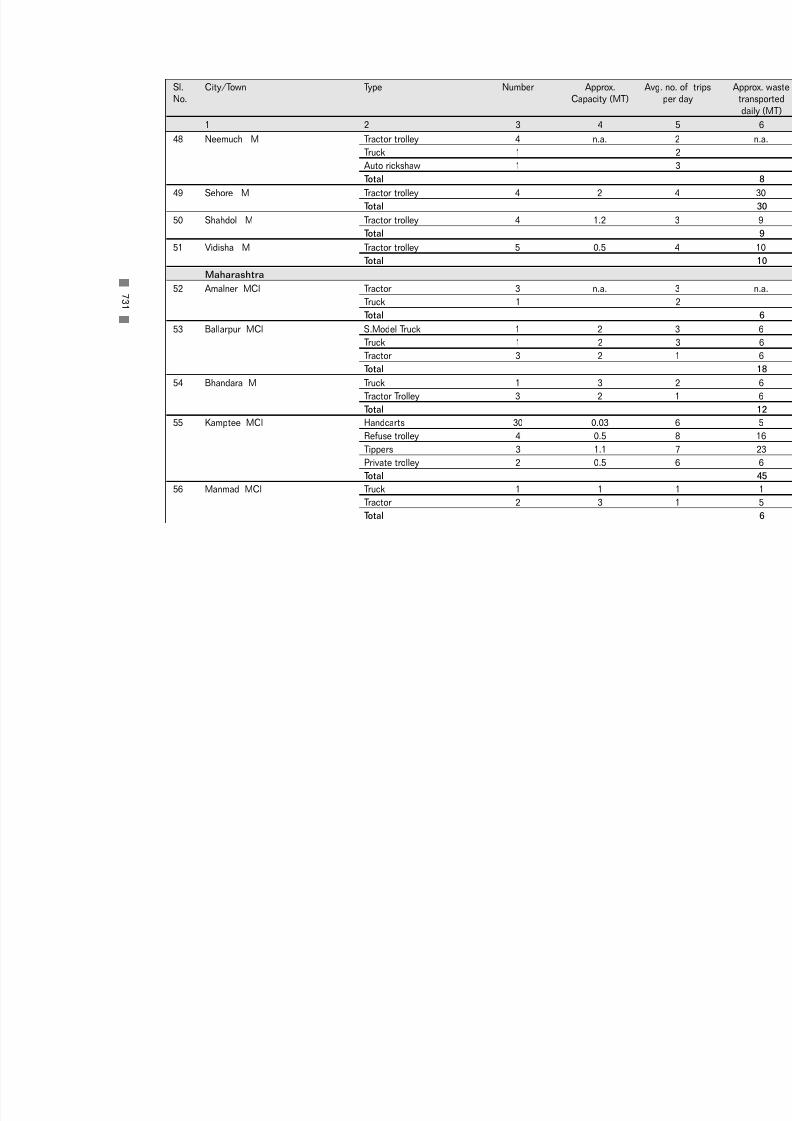
7/21/2019 Status Watersupply
http://slidepdf.com/reader/full/status-watersupply 751/869
48 Neemuch M Tractor trolley 4 n.a.
Truck 1Auto rickshaw 1
Total
49 Sehore M Tractor trolley 4 2
Total
50 Shahdol M Tractor trolley 4 1.2
Total
51 Vidisha M Tractor trolley 5 0.5
Total
Maharashtra
52 Amalner MCl Tractor 3 n.a.
Truck 1Total
53 Ballarpur MCl S.Model Truck 1 2
Truck 1 2
Tractor 3 2
Total
54 Bhandara M Truck 1 3
Tractor Trolley 3 2
Total
55 Kamptee MCl Handcarts 30 0.03
Refuse trolley 4 0.5
Tippers 3 1.1Private trolley 2 0.5
Total
56 Manmad MCl Truck 1 1
Tractor 2 3
Total
7 3 1
Sl. City/Town Type Number Approx. AvgNo. Capacity (MT)
1 2 3 4

7/21/2019 Status Watersupply
http://slidepdf.com/reader/full/status-watersupply 752/869
57 Ratnagiri MCl Truck 3 3
Tippers 1 4Total
58 Satara MCl Truck (large) 2 2
Truck (small) 1 1.5
Total
59 Virar MCl Tractor 4 2
Dumper 2 5
Tipper 2 2
Truck 1 3
Total
Punjab
60 Ferozepur MCl Tractor Trolley 5 2Total
61 Kapurthala M Tractor Trolley 4 1
Dumper placer 40 n.a.
Total
62 Mansa MCl Tractor Trolley 3 1.5
Total
63 Phagwara MCl Tractor Trolley 4 1.3
Truck 1 2
Total
64 Sangrur MCl Tractor Trolley 3 3
Total Rajasthan
65 Banswara M Tractor Trolley 2 n.a.
Dumper 2
Loader 1
Total
7 3 2
Sl. City/Town Type Number Approx. AvgNo. Capacity (MT)
1 2 3 4

7/21/2019 Status Watersupply
http://slidepdf.com/reader/full/status-watersupply 753/869
66 Barmer M Tractor 4 3
Truck 2 1Total
67 Bundi M Tractor Trolley 3 2
Total
68 Churu M Tractor Trolley 4 3
Donkey cart 15 0.2
Total
69 Hanumangarh M Tractor 7 1.5
Total
70 Sawai Madhopur M Tractor Trolley 4 1
Total
Tamil Nadu71 Ambur M Truck 1 2
Mini-Truck 1 1
Tractor 2 1
Total
72 Arakkonam M Bullock Cart 6 0.3
Truck 4 2
Total
73 Attur M Truck 1 2
Mini-Truck 3 1
Total
74 Cumbum M Mini-Truck 2 0.6Tractor 1 0.5
Total
75 Dharmapuri M Truck 2 1.8
Bullock Carts 16 0.3
Total
7 3 3
Sl. City/Town Type Number Approx. AvgNo. Capacity (MT)
1 2 3 4

7/21/2019 Status Watersupply
http://slidepdf.com/reader/full/status-watersupply 754/869
76 Gudiyatham M Truck 2 3
Total 77 Nagapattinam M Truck 4 1.5
Total
78 Pudukkottai M Truck 2 2
Mini-Truck 3 1
Tractor 2 1.5
Total
79 Sivakasi M Truck 1 1
Mini-Truck 3 1
Tractor 3 0.5
Total
80 Srivilliputtur M Mini-Truck 4 3Total
81 Tindivanam M Truck 1 2
Mini-Truck 2 1
Tractor 2 1
Total
82 Udhagamandalam M Truck 3 1.5
Mini-Truck 3 1
Total
Uttar Pradesh
83 Auraiya MB Tractor Trolley 2 1.5
Total 84 Balrampur MB Tractor 2 2
Dumper 1 4
Total
85 Basti MB Tractor 5 4
Total
7 3 4
Sl. City/Town Type Number Approx. AvgNo. Capacity (MT)
1 2 3 4

7/21/2019 Status Watersupply
http://slidepdf.com/reader/full/status-watersupply 755/869
86 Bhadohi MB Tractor Trolley 2 2
Handcarts 20 0.08Total
87 Chandpur MB Tractor Trolley 2 0.5
Bullock Carts 8 0.1
Handcarts 6 0.02
Total
88 Etah MB Tractor Trolley 2 2
Tippers 1 3
Total
89 Ghazipur MB Tractor Trolley 3 3
Dumper 1 3
Total 90 Gonda MB Tractor Trolley 3 3
Total
91 Lakhimpur MB Tractor Trolley 2 n.a.
Dumper 1 1.5
Total
92 Lalitpur MB Tractor 4 4
Dumper 1 2
Total
93 Mughalsarai MB Tractor Trolley 3 4
Power tiller 2 n.a.
Handcarts 183 0.03
Total
94 Nawabganj-Barabanki MB Tractor 3 1
Total
95 Orai MB Tractor Trolley 3 1
7 3 5
Sl. City/Town Type Number Approx. AvgNo. Capacity (MT)
1 2 3 4

7/21/2019 Status Watersupply
http://slidepdf.com/reader/full/status-watersupply 756/869
Handcarts 50 0.04
Total
96 Roorkee MB Tractor Trolley 3 3
Total
West Bengal
97 Bishnupur M Tractor Trailer 2 2
Handcarts 30 0.2
Total
98 Chakdaha M Handcarts 8 0.1
Tractor Trailer 1 2
Total
99 Contai M Tractor Trolley 6 0.8
Truck 3 1.3
Total
100 Cooch Behar M Wheel barrow 20 0.01
Three wheeler 20 0.05
Tractor Trolley 3 1
Truck 2 3
Auto van 2 0.5
Total
101 Darjeeling M Mini-Truck 4 1.3
Truck n.a. n.a.
Total
102 Jalpaiguri M Truck 3 2
Tractor 2 1
Total
103 Jangipur M Trazctor & Trailer 2 3
Total
7 3 6
Sl. City/Town Type Number Approx. AvgNo. Capacity (MT)
1 2 3 4

7/21/2019 Status Watersupply
http://slidepdf.com/reader/full/status-watersupply 757/869
104 Katwa M Tractor Trailer 6 2
Total
105 Raniganj M Tractor Trailer 6 2
Total
Small States
Himachal Pradesh
106 Shimla M.Corp. Dumper placer 5 n.a.
Tipper 3
Total
Nagaland
107 Kohima TC Truck 2 2
Tractor Trailor 2 1.1Total
Union Territories
108 Port Blair MCl Tipper 7 2
Tractor Trolley 1 1
Total
Others(Smaller than Class II towns)
Small States
Goa
109 Panaji MCl Compactor 6 n.a.
Dumper Truck 7
Truck 1
Total
Sikkim
110 Gangtok (Greater Gangtok) NTAC Truck 7 5
Total
7 3 7
Sl. City/Town Type Number Approx. AvgNo. Capacity (MT)
1 2 3 4

7/21/2019 Status Watersupply
http://slidepdf.com/reader/full/status-watersupply 758/869
Union Territories
111 Daman MCl Truck 2 3
Tempo 2 1
Tractor 1 1.5
Others 1 0.5
Total
112 Silvassa CT Dumper 1 2
Hydraulic Dumper 1 2
Total
Note : Data for average waste transported was furnished by the respective urban local bodies. The number of vehicles, multiplied by themay not addup to the waste transported.
Source: Respective urban local governments/relevant agencies, NIUA Survey, 1999.
7 3 8
Sl. City/Town Type Number Approx. AvgNo. Capacity (MT)
1 2 3 4

7/21/2019 Status Watersupply
http://slidepdf.com/reader/full/status-watersupply 759/869
C - 5
DI S P O S A L OF S
OL I D WA S T E ,1 9 9 9

7/21/2019 Status Watersupply
http://slidepdf.com/reader/full/status-watersupply 760/869
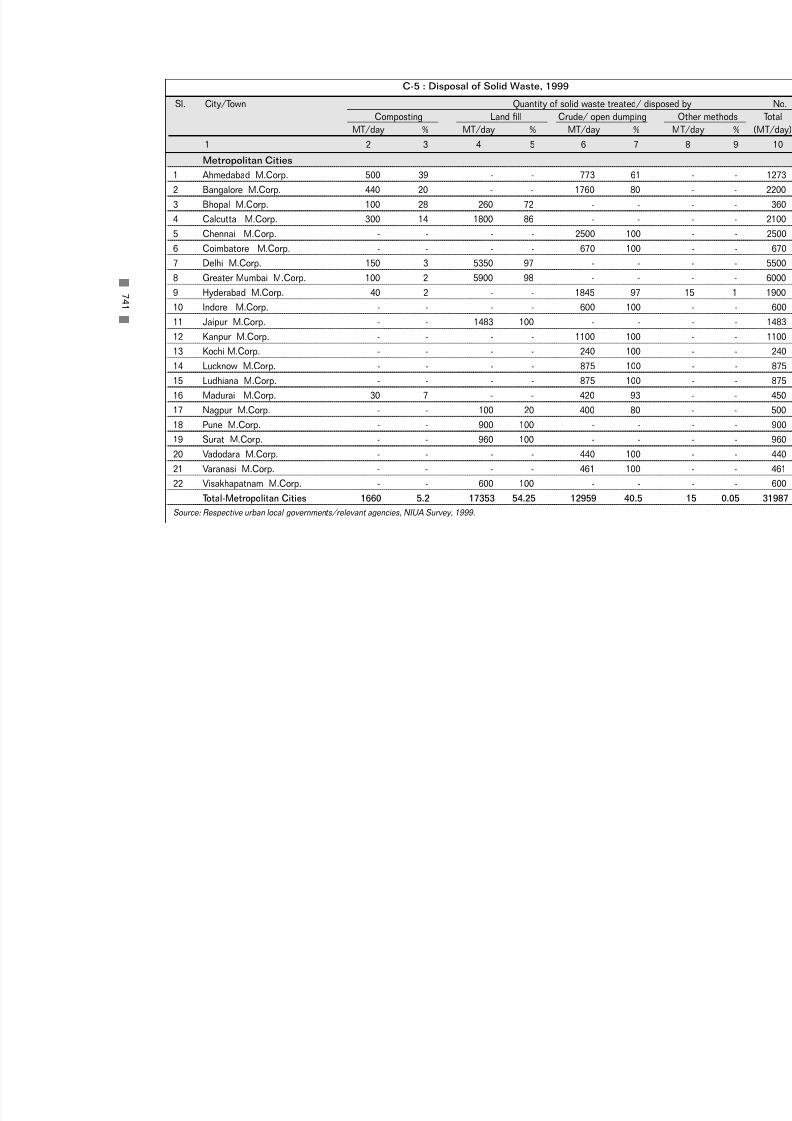
7/21/2019 Status Watersupply
http://slidepdf.com/reader/full/status-watersupply 761/869
Metropolitan Cities
1 Ahmedabad M.Corp. 500 39 - - 773 61
2 Bangalore M.Corp. 440 20 - - 1760 80
3 Bhopal M.Corp. 100 28 260 72 - -
4 Calcutta M.Corp. 300 14 1800 86 - -
5 Chennai M.Corp. - - - - 2500 100
6 Coimbatore M.Corp. - - - - 670 100
7 Delhi M.Corp. 150 3 5350 97 - -
8 Greater Mumbai M.Corp. 100 2 5900 98 - -
9 Hyderabad M.Corp. 40 2 - - 1845 97
10 Indore M.Corp. - - - - 600 100
11 Jaipur M.Corp. - - 1483 100 - -
12 Kanpur M.Corp. - - - - 1100 100
13 Kochi M.Corp. - - - - 240 100
14 Lucknow M.Corp. - - - - 875 100
15 Ludhiana M.Corp. - - - - 875 100
16 Madurai M.Corp. 30 7 - - 420 93
17 Nagpur M.Corp. - - 100 20 400 80
18 Pune M.Corp. - - 900 100 - -
19 Surat M.Corp. - - 960 100 - -
20 Vadodara M.Corp. - - - - 440 100
21 Varanasi M.Corp. - - - - 461 100
22 Visakhapatnam M.Corp. - - 600 100 - -
Total-Metropolitan Cities 1660 5.2 17353 54.25 12959 40.5
Source: Respective urban local governments/relevant agencies, NIUA Survey, 1999.
7 4 1
Sl. City/Town Quantity of solid waste treated/ disp
Composting Land fill Crude/ open dumping
MT/day % MT/day % MT/day %
1 2 3 4 5 6 7
C-5 : Disposal of Solid Waste, 1999

7/21/2019 Status Watersupply
http://slidepdf.com/reader/full/status-watersupply 762/869
CLASS I
Andhra Pradesh
1 Anantapur MCl 60 55 - - 50 45
2 Chittoor M 35 50 12 17 23 33
3 Cuddapah MCl - - - - 84 100
4 Eluru M 6 4 - - 140 96
5 Guntur MCl 250 100 - - - -
6 Hindupur M - - - - 70 100
7 Kakinada M - - - - 145 100
8 Kurnool MCl - - 90 100 - -
9 Machilipatnam M 45 90 - - 5 10
10 Nandyal MCl 36 60 - - 24 4011 Nellore MCl - - - - 167 100
12 Nizamabad M - - - - 88 100
13 Ongole MCl - - - - 90 100
14 Qutubullapur M - - - - 70 100
15 Rajahmundry M.Corp. - - - - 193 100
16 Tenali M 64 80 - - 16 20
17 Tirupati MCl - - - - 130 100
18 Vijaywada M.Corp. - - 300 65 - -
19 Warangal M.Corp. - - - - 230 100
Bihar
20 Bihar Sharif M - - - - 50 100
21 Chhapra M - - - - 66 100
22 Gaya M.Corp. - - - - 80 100
23 Katihar M - - - - 45 100
24 Munger M - - - - 50 100
7 4 2
Sl. City/Town Quantity of solid waste treated/ dispo
No. Composting Land fill Crude/ open dumping
MT/day % MT/day % MT/day %
1 2 3 4 5 6 7

7/21/2019 Status Watersupply
http://slidepdf.com/reader/full/status-watersupply 763/869
25 Ranchi M.Corp. - - - - 34 100
Gujarat
26 Anand M - - - - 10 100
27 Bharuch M - - - - 85 100
28 Bhavnagar M.Corp. - - - - 115 100
29 Bhuj M - - - - 40 100
30 Jamnagar M.Corp. - - - - 300 100
31 Junagadh M - - - - 75 100
32 Nadiad M - - - - 60 100
33 Navsari M - - - - 31 100
34 Porbandar M - - - - 22 100
35 Rajkot M.Corp. - - - - 425 100
36 Surendranagar M - - - - 31 100
Haryana
37 Ambala MCl - - - - 30 100
38 Faridabad M.Corp. - - - - 480 100
39 Gurgaon MCl - - - - 80 100
40 Hissar MCl - - - - 32 100
41 Karnal MCl - - - - 52 100
42 Rohtak MCl - - - - 28 100
Jammu & Kashmir
43 Jammu M.Corp. - - - - 300 10044 Srinagar M.Corp. - - - - 200 100
Karnataka
45 Belgaum M.Corp. - - 100 100 - -
46 Bellary CMC - - - - 50 100
47 Davangere MCl 78 100 - - - -
7 4 3
Sl. City/Town Quantity of solid waste treated/ dispo
No. Composting Land fill Crude/ open dumping
MT/day % MT/day % MT/day %
1 2 3 4 5 6 7

7/21/2019 Status Watersupply
http://slidepdf.com/reader/full/status-watersupply 764/869
48 Gadag-Betigeri CMC 10 17 - - 50 83
49 Gulbarga M.Corp. - - - - 76 100
50 Hubli-Dharwad M.Corp. - - - - 220 100
51 Mandya M - - - - 25 100
52 Mangalore M.Corp. - - - - 70 100
53 Mysore M.Corp. - - - - 205 100
54 Shimoga CMC - - - - 72 100
55 Tumkur M - - - - 84 100
Kerala
56 Alappuzha MC - - - - 20 100
57 Kollam MC - - - - 58 100
58 Kozhikode M.Corp. - - - - 154 100
59 Thalaserry M 30 100 - - - -
60 Thiruvananthapuram M.Corp. - - - - 250 100
Madhya Pradesh
61 Bhind M - - - - 24 100
62 Burhanpur M.Corp. 21 35 - - 39 65
63 Dewas M.Corp. - - 20 50 20 50
64 Guna M - - - - 18 100
65 Gwalior M.Corp. 100 36 - - 180 64
66 Jabalpur M.Corp. - - - - 298 100
67 Khandwa M 10 50 5 25 5 2568 Morena M - - - - 44 100
69 Murwara-Katni M.Corp. - - - - 63 100
70 Ratlam M.Corp. - - - - 35 100
71 Rewa M.Corp. - - - - 40 100
72 Satna M.Corp. - - - - 50 100
7 4 4
Sl. City/Town Quantity of solid waste treated/ dispo
No. Composting Land fill Crude/ open dumping
MT/day % MT/day % MT/day %
1 2 3 4 5 6 7

7/21/2019 Status Watersupply
http://slidepdf.com/reader/full/status-watersupply 765/869
73 Shivpuri M - - - - 18 100
Maharashtra
74 Amravati M.Corp. - - - - 100 100
75 Aurangabad M.Corp. 10 3 - - 330 97
76 Bhusawal M.Cl. - - - - 30 100
77 Chandrapur MCl - - 70 64 40 36
78 Dhule MCl - - - - 30 100
79 Ichalkaranji MCl 150 100 - - - -
80 Jalgaon MCl - - 220 100 - -
81 Kolhapur M.Corp. - - - - 115 100
82 Nanded Waghala M.Corp. - - - - 90 100
83 Nashik M.Corp. - - - - 280 10084 Parbhani MCl - - - - 72 100
85 Solapur M.Corp. 353 100 - - - -
86 Wardha M - - 10 25 30 75
87 Yavatmal MCl - - - - 10 100
Orissa
88 Bhubaneswar M.Corp. - - - - 175 100
89 Cuttack M.Corp. - - - - 320 100
90 Puri M - - - - 53 100
91 Rourkela M - - - - 40 100
92 Sambalpur M - - - - 32 100
Punjab
93 Amritsar M.Corp. - - 200 39 310 61
94 Bathinda MCl - - - - 95 100
95 Hoshiarpur MCl - - - - 33 100
96 Jalandhar M. Corp. - - - - 236 100
7 4 5
Sl. City/Town Quantity of solid waste treated/ dispo
No. Composting Land fill Crude/ open dumping
MT/day % MT/day % MT/day %
1 2 3 4 5 6 7
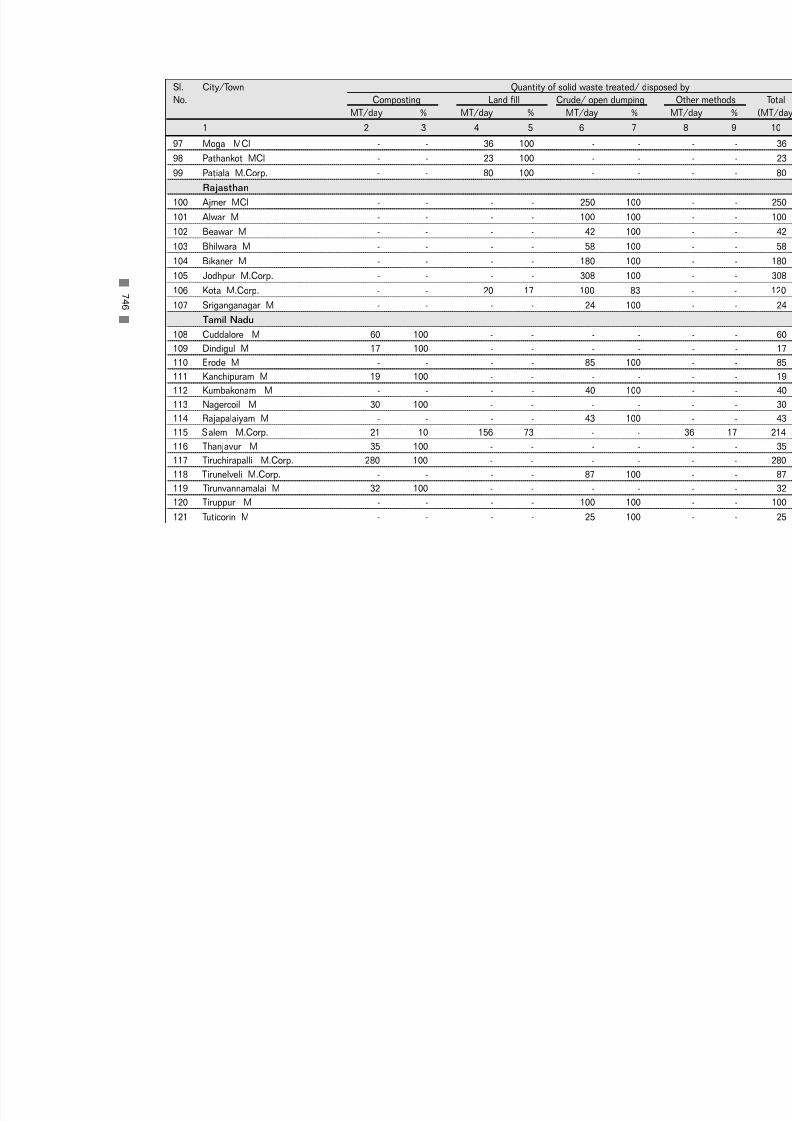
7/21/2019 Status Watersupply
http://slidepdf.com/reader/full/status-watersupply 766/869
97 Moga MCl - - 36 100 - -
98 Pathankot MCl - - 23 100 - -
99 Patiala M.Corp. - - 80 100 - -
Rajasthan
100 Ajmer MCl - - - - 250 100
101 Alwar M - - - - 100 100
102 Beawar M - - - - 42 100
103 Bhilwara M - - - - 58 100
104 Bikaner M - - - - 180 100
105 Jodhpur M.Corp. - - - - 308 100
106 Kota M.Corp. - - 20 17 100 83
107 Sriganganagar M - - - - 24 100
Tamil Nadu
108 Cuddalore M 60 100 - - - -
109 Dindigul M 17 100 - - - -
110 Erode M - - - - 85 100
111 Kanchipuram M 19 100 - - - -
112 Kumbakonam M - - - - 40 100
113 Nagercoil M 30 100 - - - -
114 Rajapalaiyam M - - - - 43 100
115 Salem M.Corp. 21 10 156 73 - -
116 Thanjavur M 35 100 - - - -117 Tiruchirapalli M.Corp. 280 100 - - - -
118 Tirunelveli M.Corp. - - - - 87 100
119 Tirunvannamalai M 32 100 - - - -
120 Tiruppur M - - - - 100 100
121 Tuticorin M - - - - 25 100
7 4 6
Sl. City/Town Quantity of solid waste treated/ dispo
No. Composting Land fill Crude/ open dumping
MT/day % MT/day % MT/day %
1 2 3 4 5 6 7

7/21/2019 Status Watersupply
http://slidepdf.com/reader/full/status-watersupply 767/869
122 Vellore M 24 69 10 29 - -
Uttar Pradesh
123 Agra M.Corp. 30 7 400 93 - -
124 Aligarh M.Corp. - - - - 275 100
125 Allahabad M.Corp. - - - - 250 100
126 Bareilly M.Corp. - - - - 320 100
127 Etawah MB - - - - 27 100
128 Faizabad MB - - - - 54 100
129 Firozabad MB - - - - 144 100
130 Ghaziabad M.Corp. - - - - 300 100
131 Gorakhpur M.Corp. - - - - 240 100
132 Haldwani-cum-Kathgodam MB - - - - 80 100133 Hapur MB 20 29 - - 50 71
134 Hardwar MB - - - - 182 100
135 Jhansi MB - - 89 66 35 26
136 Mathura MB 40 27 - - 110 73
137 Meerut M.Corp. - - - - 500 100
138 Mirzapur MB - - - - 86 100
139 Moradabad M.Corp. - - - - 300 100
140 Muzaffarnagar MB - - - - 130 100
141 Rae Bareli MB - - - - 66 100
142 Rampur MB 120 100 - - - -
143 Saharanpur MB - - - - 200 100
144 Sitapur MB - - - - 70 100
145 Unnao MB - - - - 8 100
West Bengal
146 Asansol M.Corp. - - - - 60 100
7 4 7
Sl. City/Town Quantity of solid waste treated/ dispo
No. Composting Land fill Crude/ open dumping
MT/day % MT/day % MT/day %
1 2 3 4 5 6 7

7/21/2019 Status Watersupply
http://slidepdf.com/reader/full/status-watersupply 768/869
147 Baharampur M 2 2 49 60 25 31
148 Balurghat M 33 100 - - - -
149 Bankura M - - - - 26 100
150 Barasat M - - - - 24 100
151 Burdwan M - - 75 100 - -
152 Halisahar M - - - - 17 100
153 Krishna Nagar M - - - - 38 100
154 Midnapur M 49 91 5 9 - -
155 North Barrackpur M - - 10 25 30 75
156 Santipur M - - - - 33 100
157 Siliguri M.Corp. - - - - 150 100
Small States
Assam
158 Guwahati M.Corp. - - - - 240 100
159 Jorhat MB - - 14 100 - -
Manipur
160 Imphal MCl - - - - 38 100
Meghalaya
161 Shillong MB - - - - 78 100
Tripura
162 Agartala MCl - - - - 60 100
Union Territories
163 Chandigarh M.Corp. - - 280 100 - -
164 Pondicherry M 120 100 - - - -
Total-Class I Cities 2189 11 2274 12 14522 76
Source: Respective urban local governments/relevant agencies, NIUA Survey, 1999.
7 4 8
Sl. City/Town Quantity of solid waste treated/ dispo
No. Composting Land fill Crude/ open dumping
MT/day % MT/day % MT/day %
1 2 3 4 5 6 7

7/21/2019 Status Watersupply
http://slidepdf.com/reader/full/status-watersupply 769/869
CLASS II
Andhra Pradesh
1 Anakapalle M 50 91 - - 5 9
2 Dharmavaram M 9 100 - - - -
3 Gudur MCl - - 18 100 - -
4 Kapra M - - - - 48 100
5 Kavali MCl - - 24 100 - -
6 Madanapalle M 20 100 - - - -
7 Narasaraopet M - - - - 42 100
8 Rajendra Nagar MCl - - 12 100 - -
9 Sangareddy MCl - - 18 100 - -
10 Srikakulam MCl - - - - 25 100
11 Srikalahasti M - - - - 30 100
12 Suryapet MCl - - 30 75 10 25
Bihar
13 Buxar M - - - - 12 100
14 Deoghar M - - - - 10 100
15 Hajipur M - - - - 24 100
16 Hazaribagh M - - - - 36 100
17 Jehanabad M - - - - 10 100
18 Madhubani M - - - - 15 100
19 Mokama M - - - - 4 100Gujarat
20 Amreli M 30 100 - - - -
21 Ankleswar M - - - - 6 100
22 Dabhoi M - - - - 18 100
23 Dohad M - - - - 4 100
7 4 9
Sl. City/Town Quantity of solid waste treated/ dispo
No. Composting Land fill Crude/ open dumping
MT/day % MT/day % MT/day %
1 2 3 4 5 6 7

7/21/2019 Status Watersupply
http://slidepdf.com/reader/full/status-watersupply 770/869
24 Gondal M - - - - 10 100
25 Jetpur M - - - - 40 100
26 Mahesana M - - - - 8 100
27 Palanpur M - - - - 40 100
Haryana
28 Jind MCl - - - - 18 100
29 Kaithal MCl - - - - 12 100
30 Rewari MCl - - - - 16 100
31 Thanesar MCl - - - - 24 100
Karnataka
32 Bagalkot CMC - - - - 13 100
33 Chikmagalur CMC - - - - 18 10034 Gokak CMC 7 100 - - - -
35 Hospet CMC - - - - 31 100
36 Kolar CMC - - - - 15 100
37 Rabkavi-Banhatti CMC - - - - 12 100
38 Ramanagaram CMC - - - - 10 100
Kerala
39 Changanessary MC - - - - 12 100
40 Payyanur M - - - - 4 100
41 Taliparamba M 3 100 - - - -
42 Thrissur MC - - - - 35 100
Madhya Pradesh43 Hoshangabad M - - - - 15 100
44 Itarsi M - - - - 15 100
45 Khargone M 6 100 - - - -
46 Mandsaur M - - - - 26 100
47 Nagda M - - - - 10 100
7 5 0
Sl. City/Town Quantity of solid waste treated/ dispo
No. Composting Land fill Crude/ open dumping
MT/day % MT/day % MT/day %
1 2 3 4 5 6 7

7/21/2019 Status Watersupply
http://slidepdf.com/reader/full/status-watersupply 771/869
48 Neemuch M - - - - 8 100
49 Sehore M - - - - 30 100
50 Shahdol M - - - - 9 100
51 Vidisha M - - 10 100 - -
Maharashtra
52 Amalner MCl 5 83 - - 1 17
53 Ballarpur MCl - - - - 18 100
54 Bhandara M - - - - 12 100
55 Kamptee MCl - - 40 100 - -
56 Manmad MCl 4 80 - - 1 20
57 Ratnagiri MCl - - - - 22 100
58 Satara MCl - - - - 17 10059 Virar MCl - - - - 50 100
Punjab
60 Ferozepur MCl - - 16 40 24 60
61 Kapurthala M - - 5 50 5 50
62 Mansa MCl - - - - 27 100
63 Phagwara MCl - - - - 14 100
64 Sangrur MCl - - - - 15 100
Rajasthan
65 Banswara M - - - - 25 100
66 Barmer M - - - - 18 100
67 Bundi M - - - - 24 10068 Churu M - - - - 30 100
69 Hanumangarh M - - - - 43 100
70 Sawai Madhopur M - - - - 4 100
Tamil Nadu
71 Ambur M 13 100 - - - -
7 5 1
Sl. City/Town Quantity of solid waste treated/ dispo
No. Composting Land fill Crude/ open dumping
MT/day % MT/day % MT/day %
1 2 3 4 5 6 7

7/21/2019 Status Watersupply
http://slidepdf.com/reader/full/status-watersupply 772/869
72 Arakkonam M - - - - 11 100
73 Attur M - - - - 10 100
74 Cumbum M 4 100 - - - -
75 Dharmapuri M - - - - 11 100
76 Gudiyatham M - - - - 16 100
77 Nagapattinam M - - - - 25 100
78 Pudukkottai M 20 100 - - - -
79 Sivakasi M - - - - 5 100
80 Srivilliputtur M - - - - 20 100
81 Tindivanam M - - - - 12 100
82 Udhagamandalam M 7 100 - - - -
Uttar Pradesh83 Auraiya MB - - - - 21 100
84 Balrampur MB - - - - 20 100
85 Basti MB - - - - 35 100
86 Bhadohi MB - - - - 40 100
87 Chandpur MB - - - - 5 100
88 Etah MB - - - - 40 100
89 Ghazipur MB - - - - 27 100
90 Gonda MB - - - - 25 100
91 Lakhimpur MB - - - - 35 100
92 Lalitpur MB 25 45 - - 30 55
93 Mughalsarai MB - - - - 48 10094 Nawabganj-Barabanki MB - - - - 6 100
95 Orai MB - - - - 29 100
96 Roorkee MB 12 44 - - 15 56
West Bengal
97 Bishnupur M - - - - 13 100
7 5 2
Sl. City/Town Quantity of solid waste treated/ dispo
No. Composting Land fill Crude/ open dumping
MT/day % MT/day % MT/day %
1 2 3 4 5 6 7

7/21/2019 Status Watersupply
http://slidepdf.com/reader/full/status-watersupply 773/869
98 Chakdaha M - - - - 7 100
99 Contai M - - - - 9 100
100 Cooch Behar M - - - - 21 100
101 Darjeeling M - - - - 30 100
102 Jalpaiguri M - - - - 21 100
103 Jangipur M - - 18 100 - -
104 Katwa M - - - - 36 100
105 Raniganj M - - - - - -
Small States
Himachal Pradesh
106 Shimla M.Corp. - - - - 35 100
Nagaland107 Kohima TC - - - - 23 100
Union Territories
108 Port Blair MCl - - - - 44 100
Others(Smaller than Class II towns)
Small States
Goa
109 Panaji MCl - - 11 100 - -
Sikkim
110 Gangtok (Greater Gangtok) NTAC - - - - 35 100
Union Territories
111 Daman MCl - - - - 11 100
112 Silvassa CT - - - - 4 100
Total-Class II Towns 216 9 202 9 1855 80
Grand Total 4065 7.6 19829 37.1 29336 54.8
Source: Respective urban local governments/relevant agencies, NIUA Survey, 1999.
7 5 3
Sl. City/Town Quantity of solid waste treated/ dispo
No. Composting Land fill Crude/ open dumping
MT/day % MT/day % MT/day %
1 2 3 4 5 6 7

7/21/2019 Status Watersupply
http://slidepdf.com/reader/full/status-watersupply 774/869

7/21/2019 Status Watersupply
http://slidepdf.com/reader/full/status-watersupply 775/869
C - 6
C O MP O S
T I N GDE T A I L S

7/21/2019 Status Watersupply
http://slidepdf.com/reader/full/status-watersupply 776/869

7/21/2019 Status Watersupply
http://slidepdf.com/reader/full/status-watersupply 777/869
METROPOLITAN CITIES
1 Ahmedabad M.Corp. 500 Mecha2 Bangalore M.Corp. 500 Pit
3 Bhopal M.Corp. 100 Mecha
4 Calcutta M.Corp. 300
5 Delhi M.Corp. 650 Mecha
6 Greater Mumbai M.Corp. 50 W
7 Hyderabad M.Corp. 40 Verm
8 Madurai M.Corp. 30 Pit
Total-Metropolitan Cities 2170
CLASS I
Andhra Pradesh
1 Anantapur MCl 60 Pit
2 Chittoor M 35 Pit
3 Cuddapah MCl - Pit
4 Eluru M 6 Pit
5 Guntur MCl 250 Verm
6 Hindupur M 45 Pit
7 Kakinada M 36 Pit
8 Tenali M 64
Karnataka
9 Davangere MCl 78 Pit
10 Gadag-Betigeri CMC 10 Pit
Kerala
11 Thalaserry M 30 Pit
7 5 7
Sl. No. City/Town Quantity composted (MT) Metho
1 2
C-6 : Composting Details

7/21/2019 Status Watersupply
http://slidepdf.com/reader/full/status-watersupply 778/869
Madhya Pradesh
12 Burhanpur M.Corp. 21 Pit
13 Gwalior M.Corp. 100 Verm14 Khandwa M 10 Pit
Maharashtra
15 Aurangabad M.Corp. 10 Exc
16 Ichalkaranji MCl 150 Pit
17 Solapur M.Corp. 353 Ban
Tamil Nadu
18 Cuddalore M 60 Pit
19 Dindigul M 17 Pit
20 Kanchipuram M 19 Pit
21 Nagercoil M 30 Pit
22 Salem M.Corp. 21 Pit
23 Thanjavur M 35 Pit
24 Tiruchirapalli M.Corp. 280 Pit
25 Tirunvannamalai M 32 Hea
26 Vellore M 24 Pit
Uttar Pradesh
27 Agra M.Corp. 30
28 Hapur MB 20 Pit
29 Mathura MB 40
30 Rampur MB 120 Pit
West Bengal
31 Balurghat M 33 Pit
32 Baharampur M 2 Pit
33 Midnapur M 49 Pit
7 5 8
Sl. No. City/Town Quantity composted (MT) Method
1 2

7/21/2019 Status Watersupply
http://slidepdf.com/reader/full/status-watersupply 779/869
Small States
Tripura
34 Agartala MCl 31 MechaUnion Territories
35 Pondicherry M 120 Pit
Total-Class I Cities 2220
CLASS II
Andhra Pradesh
1 Anakapalle M 50 Pit
2 Dharmavaram M 9 Pit
3 Madanapalle M 20
Gujarat
4 Amreli M 30
Karnataka
5 Gokak CMC 7 Pit
Kerala
6 Taliparamba M 3 Pit
Madhya Pradesh
7 Khargone M 6 Pit
Maharashtra
8 Amalner MCl 5 Pit
9 Manmad MCl 4 Pit
Tamil Nadu
10 Cumbum M 4 Hea
11 Pudukkottai M 20 Pit
12 Udhagamandalam M 7 Pit
7 5 9
Sl. No. City/Town Quantity composted (MT) Method
1 2

7/21/2019 Status Watersupply
http://slidepdf.com/reader/full/status-watersupply 780/869
Uttar Pradesh
13 Lalitpur MB 25 Pit & V
14 Roorkee MB 12 PitTotal-Class II Towns 203
Grand Total 4593
Source: Respective urban local governments/relevant agencies, NIUA Survey, 1999.
7 6 0
Sl. No. City/Town Quantity composted (MT) Method
1 2

7/21/2019 Status Watersupply
http://slidepdf.com/reader/full/status-watersupply 781/869
C - 7
L A NDF I L L
DE T A I L S ,1 9 9 9

7/21/2019 Status Watersupply
http://slidepdf.com/reader/full/status-watersupply 782/869

7/21/2019 Status Watersupply
http://slidepdf.com/reader/full/status-watersupply 783/869
Metropolitan Cities
1 Bangalore M.Corp. n.a n.a n.a 2
2 Bhopal M.Corp. 2 6 n.a 1
3 Calcutta M.Corp. 5 8 n.a n.a
4 Chennai M.Corp. n.a n.a n.a 1
5 Delhi M.Corp. 4 60 3 1
6 Greater Mumbai M.Corp. 4 173 2 n.a
7 Indore M.Corp. 1 59 n.a 1
8 Jaipur M.Corp. 1 30 7 n.a
9 Kochi M.Corp. n.a n.a n.a 1
10 Nagpur M.Corp. 1 16 n.a n.a11 Pune M.Corp. 2 29 10 n.a
12 Surat M.Corp. 2 7 1 1
13 Vadodara M.Corp. n.a n.a n.a 1
14 Visakhapatnam M.Corp. 2 42 n.a n.a
CLASS I
Andhra Pradesh
1 Chittoor M 1 2 2 -
2 Cuddapah MCl - - - 1
3 Hindupur M - - - 1
4 Kurnool MCl 1 11 20 -
5 Nizamabad M - - - 1
6 Ongole MCl - - - 1
7 Vijaywada M.Corp. 3 10 n.a. -
7 6 3
Sl. City/Town Existing Landfill site(s) Future
No. No. Area (ha) Future life (yrs) No.
1 2 3 4 5
C-7 : Landfill Details, 1999
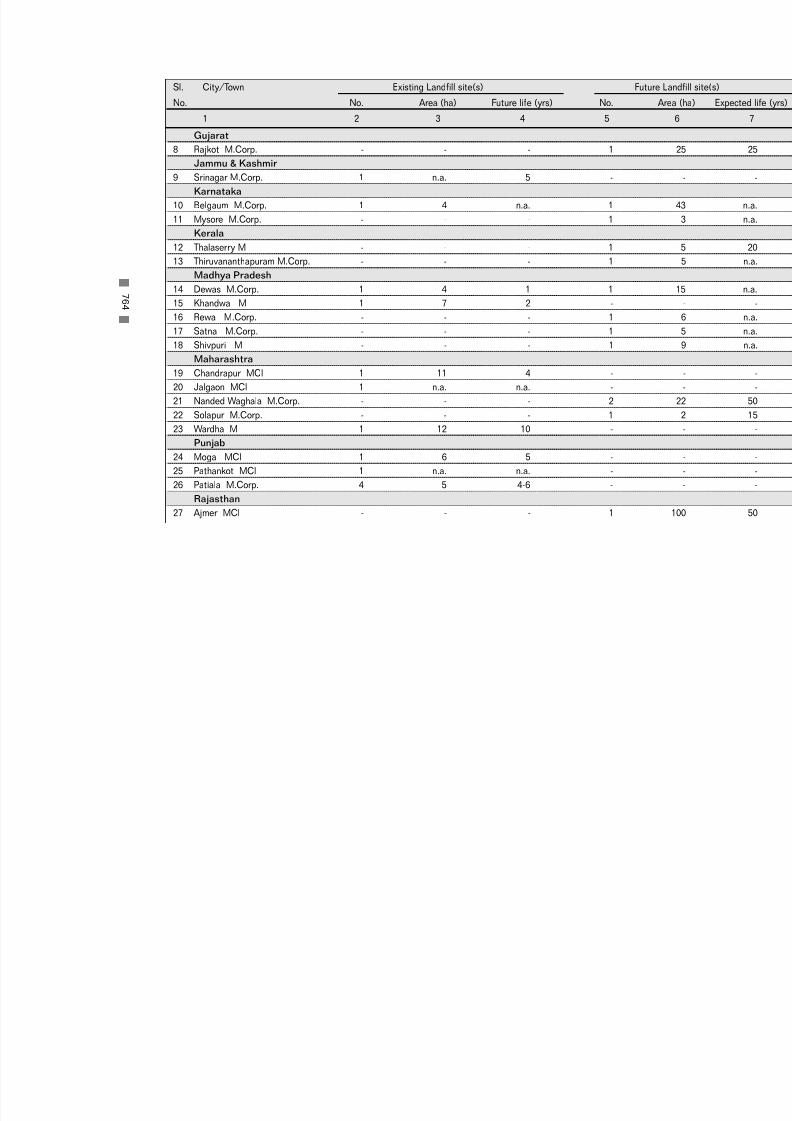
7/21/2019 Status Watersupply
http://slidepdf.com/reader/full/status-watersupply 784/869
Gujarat
8 Rajkot M.Corp. - - - 1Jammu & Kashmir
9 Srinagar M.Corp. 1 n.a. 5 -
Karnataka
10 Belgaum M.Corp. 1 4 n.a. 1
11 Mysore M.Corp. - - - 1
Kerala
12 Thalaserry M - - - 1
13 Thiruvananthapuram M.Corp. - - - 1
Madhya Pradesh
14 Dewas M.Corp. 1 4 1 1
15 Khandwa M 1 7 2 -
16 Rewa M.Corp. - - - 1
17 Satna M.Corp. - - - 1
18 Shivpuri M - - - 1
Maharashtra
19 Chandrapur MCl 1 11 4 -
20 Jalgaon MCl 1 n.a. n.a. -
21 Nanded Waghala M.Corp. - - - 2
22 Solapur M.Corp. - - - 1
23 Wardha M 1 12 10 -
Punjab
24 Moga MCl 1 6 5 -
25 Pathankot MCl 1 n.a. n.a. -
26 Patiala M.Corp. 4 5 4-6 -
Rajasthan
27 Ajmer MCl - - - 1
7 6 4
Sl. City/Town Existing Landfill site(s) Future
No. No. Area (ha) Future life (yrs) No. A
1 2 3 4 5

7/21/2019 Status Watersupply
http://slidepdf.com/reader/full/status-watersupply 785/869
28 Bhilwara M - - - 1
29 Bikaner M - - - 130 Kota M.Corp. 5 n.a. 1 -
31 Sriganganagar M - - - 1
Tamil Nadu
32 Kanchipuram M - - - 1
33 Salem M.Corp. 4 19 n.a. -
34 Vellore M 1 5 n.a. 1
Uttar Pradesh
35 Agra M.Corp. 1 n.a. 1 1
36 Jhansi MB 5 15 20 -
West Bengal
37 Baharampur M 4 73 5-6 -
38 Burdwan M 1 2 - 1
39 Midnapur M 1 2 15 2
40 North Barrackpur M 1 1 2 -
Small States
Assam
41 Guwahati M.Corp. - - - 1
42 Jorhat MB 1 3 6 -
Manipur
43 Imphal MCl - - - 1
Tripura
44 Agartala MCl - - - 1
Union Territories
45 Chandigarh M.Corp. 1 45 15 -
46 Pondicherry M - - - 1
Source: Respective urban local governments/relevant agencies, NIUA Survey, 1999.
7 6 5
Sl. City/Town Existing Landfill site(s) Future
No. No. Area (ha) Future life (yrs) No. A
1 2 3 4 5

7/21/2019 Status Watersupply
http://slidepdf.com/reader/full/status-watersupply 786/869
CLASS II
Andhra Pradesh1 Gudur MCl 1 1 - 1
2 Kavali MCl 2 3 10 1
3 Rajendra Nagar MCl 3 3 6 1
4 Sangareddy MCl 1 2 25 -
5 Suryapet MCl 2 20 - 1
Karnataka
6 Kolar CMC - - - 1
Kerala
7 Changanessary MC - - - 1
8 Payyanur M - - - 19 Taliparamba M - - - 1
Madhya Pradesh
10 Mandsaur M - - - 1
11 Vidisha M 1 5 5 -
Maharashtra
12 Kamptee MCl 4 1 2 2
Punjab
13 Ferozepur MCl 1 - 3 -
14 Kapurthala M 1 1 5 -
Rajasthan
15 Barmer M - - - 1
West Bengal
16 Bishnupur M - - - 1
17 Chakdaha M - - - 1
18 Jangipur M 2 10 50 2
7 6 6
Sl. City/Town Existing Landfill site(s) Future
No. No. Area (ha) Future life (yrs) No. A
1 2 3 4 5

7/21/2019 Status Watersupply
http://slidepdf.com/reader/full/status-watersupply 787/869
Small States
Nagaland19 Kohima TC - - - 2
Others(Smaller than Class II towns)
Small States
Goa
20 Panaji MCl 1 1 10 -
Source: Respective urban local governments/relevant agencies, NIUA Survey, 1999.
7 6 7
Sl. City/Town Existing Landfill site(s) Future
No. No. Area (ha) Future life (yrs) No. A
1 2 3 4 5

7/21/2019 Status Watersupply
http://slidepdf.com/reader/full/status-watersupply 788/869

7/21/2019 Status Watersupply
http://slidepdf.com/reader/full/status-watersupply 789/869
C - 8
S T A F F P O
S I T I O N ,1 9 9 9

7/21/2019 Status Watersupply
http://slidepdf.com/reader/full/status-watersupply 790/869

7/21/2019 Status Watersupply
http://slidepdf.com/reader/full/status-watersupply 791/869
Metropolitan Cities1 Ahmedabad M.Corp. 400 8,500 8,900
2 Bangalore M.Corp. 326 5,700 6,026
3 Bhopal M.Corp. 21 1,000 1,021
4 Calcutta M.Corp. 1,560 13,500 15,060
5 Chennai M.Corp. 300 10,130 10,430
6 Coimbatore M.Corp. 126 2,483 2,609
7 Delhi M.Corp. 1,647 42,317 43,964
8 Greater Mumbai M.Corp. 1,200 35,526 36,726
9 Hyderabad M.Corp. 460 9,500 9,960
10 Indore M.Corp. 135 2,700 2,83511 Jaipur M.Corp. 419 7,016 7,435
12 Kanpur M.Corp. 232 4,626 4,858
13 Kochi M.Corp. 102 847 949
14 Lucknow M.Corp. 120 3,940 4,060
15 Ludhiana M.Corp. 102 2,100 2,202
16 Madurai M.Corp. 202 2,534 2,736
17 Nagpur M.Corp. 70 3,629 3,699
18 Pune M.Corp. 9 1,867 1,876
19 Surat M.Corp. 24 675 699
20 Vadodara M.Corp. 61 2,660 2,721
21 Varanasi M.Corp. 120 2,665 2,785
22 Visakhapatnam M.Corp. 188 1,587 1,775
Total-Metropolitan Cities 7,824 165,502 173,326
Source: Respective urban local governments/relevant agencies, NIUA Survey, 1999.
7 7 1
Sl. City/Town No. of staff
No. Supervisory Subordinate Total
1 2 3 4
C-8 : Staff Position, 1999

7/21/2019 Status Watersupply
http://slidepdf.com/reader/full/status-watersupply 792/869
CLASS I
Andhra Pradesh1 Anantapur MCl 19 278 297
2 Chittoor M 7 238 245
3 Cuddapah MCl 26 292 318
4 Eluru M 30 384 414
5 Guntur MCl 73 863 936
6 Hindupur M 5 142 147
7 Kakinada M 15 378 393
8 Kurnool MCl 27 502 529
9 Machilipatnam M 9 300 309
10 Nandyal MCl 5 196 20111 Nellore MCl 50 527 577
12 Nizamabad M 38 366 404
13 Ongole MCl 15 207 222
14 Qutubullapur M 5 45 50
15 Rajahmundry M.Corp. 18 820 838
16 Tenali M 21 249 270
17 Tirupati MCl 22 321 343
18 Vijaywada M.Corp. 43 2,696 2,739
19 Warangal M.Corp. 57 671 728
Bihar
20 Bihar Sharif M 7 280 287
21 Chhapra M 16 213 229
22 Gaya M.Corp. 5 n.a. n.a.
23 Katihar M 4 23 27
24 Munger M 4 18 22
7 7 2
Sl. City/Town No. of staff
No. Supervisory Subordinate Total
1 2 3 4

7/21/2019 Status Watersupply
http://slidepdf.com/reader/full/status-watersupply 793/869
25 Ranchi M.Corp. 45 770 815
Gujarat26 Anand M 4 169 173
27 Bharuch M 22 698 720
28 Bhavnagar M.Corp. 4 1,400 1,404
29 Bhuj M 16 150 166
30 Jamnagar M.Corp. 40 1,260 1,300
31 Junagadh M 23 369 392
32 Nadiad M 11 278 289
33 Navsari M 14 220 234
34 Porbandar M 10 486 496
35 Rajkot M.Corp. 26 3,024 3,05036 Surendranagar M 4 475 479
Haryana
37 Ambala MCl 18 355 373
38 Faridabad M.Corp. 46 2,614 2,660
39 Gurgaon MCl 5 467 472
40 Hissar MCl 18 573 591
41 Karnal MCl 5 518 523
42 Rohtak MCl 4 578 582
Jammu & Kashmir
43 Jammu M.Corp. 11 218 229
44 Srinagar M.Corp. n.a. 1,700 1,700
Karnataka
45 Belgaum M.Corp. 15 589 604
46 Bellary CMC 7 225 232
* population covered by the service is not available
7 7 3
Sl. City/Town No. of staff
No. Supervisory Subordinate Total
1 2 3 4

7/21/2019 Status Watersupply
http://slidepdf.com/reader/full/status-watersupply 794/869
47 Davangere MCl 10 463 473
48 Gadag-Betigeri CMC 5 286 29149 Gulbarga M.Corp. 14 349 363
50 Hubli-Dharwad M.Corp. 7 1,163 1,170
51 Mandya M 4 8 12
52 Mangalore M.Corp. 18 380 398
53 Mysore M.Corp. 30 873 903
54 Shimoga CMC 11 573 584
55 Tumkur M 20 228 248
Kerala
56 Alappuzha MC 5 165 170
57 Kollam MC 26 186 21258 Kozhikode M.Corp. 33 670 703
59 Thalaserry M 8 139 147
60 Thiruvananthapuram M.Corp. 76 966 1,042
Madhya Pradesh
61 Bhind M 10 147 157
62 Burhanpur M.Corp. 16 382 398
63 Dewas M.Corp. n.a. 674 674
64 Guna M 9 140 149
65 Gwalior M.Corp. 158 1,364 1,522
66 Jabalpur M.Corp. 144 2,064 2,208
67 Khandwa M 24 584 608
68 Morena M 3 229 232
69 Murwara-Katni M.Corp. 54 356 410
70 Ratlam M.Corp. 38 295 333
71 Rewa M.Corp. 54 354 408
7 7 4
Sl. City/Town No. of staff
No. Supervisory Subordinate Total
1 2 3 4
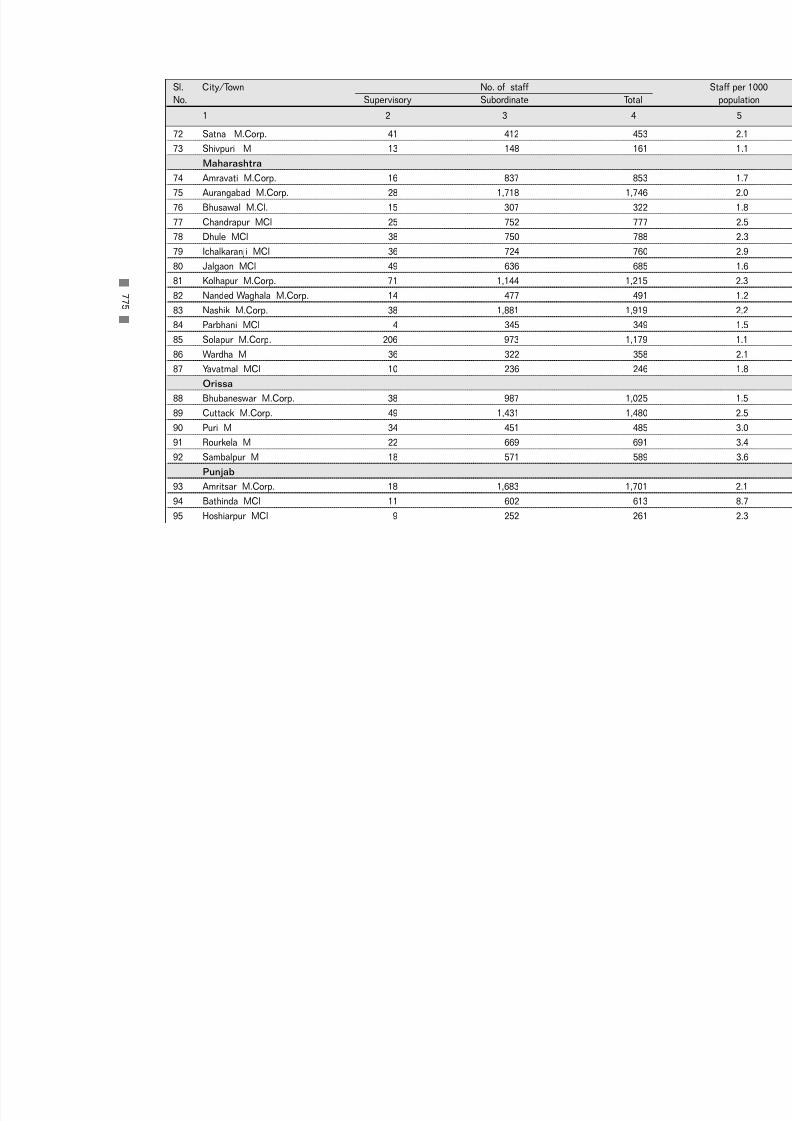
7/21/2019 Status Watersupply
http://slidepdf.com/reader/full/status-watersupply 795/869
72 Satna M.Corp. 41 412 453
73 Shivpuri M 13 148 161Maharashtra
74 Amravati M.Corp. 16 837 853
75 Aurangabad M.Corp. 28 1,718 1,746
76 Bhusawal M.Cl. 15 307 322
77 Chandrapur MCl 25 752 777
78 Dhule MCl 38 750 788
79 Ichalkaranji MCl 36 724 760
80 Jalgaon MCl 49 636 685
81 Kolhapur M.Corp. 71 1,144 1,215
82 Nanded Waghala M.Corp. 14 477 49183 Nashik M.Corp. 38 1,881 1,919
84 Parbhani MCl 4 345 349
85 Solapur M.Corp. 206 973 1,179
86 Wardha M 36 322 358
87 Yavatmal MCl 10 236 246
Orissa
88 Bhubaneswar M.Corp. 38 987 1,025
89 Cuttack M.Corp. 49 1,431 1,480
90 Puri M 34 451 485
91 Rourkela M 22 669 691
92 Sambalpur M 18 571 589
Punjab
93 Amritsar M.Corp. 18 1,683 1,701
94 Bathinda MCl 11 602 613
95 Hoshiarpur MCl 9 252 261
7 7 5
Sl. City/Town No. of staff
No. Supervisory Subordinate Total
1 2 3 4

7/21/2019 Status Watersupply
http://slidepdf.com/reader/full/status-watersupply 796/869
96 Jalandhar M. Corp. 50 1,490 1,540
97 Moga MCl 10 546 55698 Pathankot MCl 1 230 231
99 Patiala M.Corp. 15 596 611
Rajasthan
100 Ajmer MCl 8 1,469 1,477
101 Alwar M 5 350 355
102 Beawar M 4 314 318
103 Bhilwara M 31 645 676
104 Bikaner M 9 869 878
105 Jodhpur M.Corp. 60 2,525 2,585
106 Kota M.Corp. 18 n.a. n.a.
107 Sriganganagar M 14 961 975
Tamil Nadu
108 Cuddalore M 31 444 475
109 Dindigul M 18 451 469
110 Erode M 35 594 629
111 Kanchipuram M 24 70 94
112 Kumbakonam M 20 383 403
113 Nagercoil M 31 383 414
114 Rajapalaiyam M 19 287 306
115 Salem M.Corp. 75 1,638 1,713
116 Thanjavur M 27 542 569
117 Tiruchirapalli M.Corp. 90 1,959 2,049
118 Tirunelveli M.Corp. 15 176 191
119 Tirunvannamalai M 15 144 159
120 Tiruppur M n.a. 819 819
121 Tuticorin M 36 417 453
7 7 6
Sl. City/Town No. of staff
No. Supervisory Subordinate Total
1 2 3 4

7/21/2019 Status Watersupply
http://slidepdf.com/reader/full/status-watersupply 797/869
122 Vellore M 31 430 461
Uttar Pradesh123 Agra M.Corp. 109 2,622 2,731
124 Aligarh M.Corp. 11 n.a. n.a.
125 Allahabad M.Corp. 153 2,345 2,498
126 Bareilly M.Corp. 16 1,518 1,534
127 Etawah MB 15 289 304
128 Faizabad MB 17 400 417
129 Firozabad MB 10 44 54
130 Ghaziabad M.Corp. 8 1,147 1,155
131 Gorakhpur M.Corp. 28 774 802
132 Haldwani-cum-Kathgodam MB 28 378 406133 Hapur MB 17 399 416
134 Hardwar MB 20 512 532
135 Jhansi MB 34 700 734
136 Mathura MB 30 825 855
137 Meerut M.Corp. 11 1,854 1,865
138 Mirzapur MB 34 500 534
139 Moradabad M.Corp. 63 1,001 1,064
140 Muzaffarnagar MB 20 667 687
141 Rae Bareli MB 20 531 551
142 Rampur MB 32 485 517
143 Saharanpur MB 51 985 1,036
144 Sitapur MB 10 295 305
145 Unnao MB 11 170 181
West Bengal
146 Asansol M.Corp. 20 487 507
7 7 7
Sl. City/Town No. of staff
No. Supervisory Subordinate Total
1 2 3 4

7/21/2019 Status Watersupply
http://slidepdf.com/reader/full/status-watersupply 798/869
147 Baharampur M 24 356 380
148 Balurghat M 2 67 69149 Bankura M 23 450 473
150 Barasat M 6 115 121
151 Burdwan M 45 650 695
152 Halisahar M 4 21 25
153 Krishna Nagar M 18 214 232
154 Midnapur M 34 425 459
155 North Barrackpur M n.a. n.a. n.a.
156 Santipur M 6 170 176
157 Siliguri M.Corp. 63 140 203
Small StatesAssam
158 Guwahati M.Corp. n.a. 492 492
159 Jorhat MB 6 48 54
Manipur
160 Imphal MCl 18 200 218
Meghalaya
161 Shillong MB 11 375 386
Tripura
162 Agartala MCl 3 85 88
Union Territories
163 Chandigarh M.Corp. 141 1,638 1,779
164 Pondicherry M 38 677 715
* population covered by the service is not available
Source: Respective urban local governments/relevant agencies, NIUA Survey, 1999.
7 7 8
Sl. City/Town No. of staff
No. Supervisory Subordinate Total
1 2 3 4

7/21/2019 Status Watersupply
http://slidepdf.com/reader/full/status-watersupply 799/869
CLASS II
Andhra Pradesh1 Anakapalle M 8 40 48
2 Dharmavaram M 2 72 74
3 Gudur MCl 1 87 88
4 Kapra M 8 167 175
5 Kavali MCl 3 89 92
6 Madanapalle M 10 131 141
7 Narasaraopet M 6 138 144
8 Rajendra Nagar MCl 1 70 71
9 Sangareddy MCl 1 65 66
10 Srikakulam MCl 15 165 18011 Srikalahasti M 3 110 113
12 Suryapet MCl 1 100 101
Bihar
13 Buxar M 6 n.a. n.a.
14 Deoghar M 2 27 29
15 Hajipur M 22 159 181
16 Hazaribagh M 22 292 314
17 Jehanabad M 7 68 75
18 Madhubani M 9 59 68
19 Mokama M 1 92 93
Gujarat
20 Amreli M 18 265 283
21 Ankleswar M 5 92 97
22 Dabhoi M 1 62 63
23 Dohad M 10 118 128
7 7 9
Sl. City/Town No. of staff
No. Supervisory Subordinate Total
1 2 3 4

7/21/2019 Status Watersupply
http://slidepdf.com/reader/full/status-watersupply 800/869
24 Gondal M 6 185 191
25 Jetpur M 3 167 17026 Mahesana M 4 205 209
27 Palanpur M 2 307 309
Haryana
28 Jind MCl 7 246 253
29 Kaithal MCl 9 290 299
30 Rewari MCl 8 243 251
31 Thanesar MCl 12 192 204
Karnataka
32 Bagalkot CMC 4 102 106
33 Chikmagalur CMC 5 109 114
34 Gokak CMC 6 56 6235 Hospet CMC 3 173 176
36 Kolar CMC 11 112 123
37 Rabkavi-Banhatti CMC 3 56 59
38 Ramanagaram CMC 6 74 80
Kerala
39 Changanessary MC 3 125 128
40 Payyanur M 4 16 20
41 Taliparamba M 5 15 20
42 Thrissur MC 21 180 201
Madhya Pradesh
43 Hoshangabad M 13 230 243
44 Itarsi M 12 203 215
45 Khargone M 26 220 246
46 Mandsaur M 4 325 329
47 Nagda M 2 164 166
7 8 0
Sl. City/Town No. of staff
No. Supervisory Subordinate Total
1 2 3 4

7/21/2019 Status Watersupply
http://slidepdf.com/reader/full/status-watersupply 801/869
48 Neemuch M 11 288 299
49 Sehore M 6 139 14550 Shahdol M 6 107 113
51 Vidisha M 15 254 269
Maharashtra
52 Amalner MCl 17 385 402
53 Ballarpur MCl 22 338 360
54 Bhandara M 9 176 185
55 Kamptee MCl 16 207 223
56 Manmad MCl 3 210 213
57 Ratnagiri MCl 5 76 81
58 Satara MCl 15 95 110
59 Virar MCl 2 n.a. n.a.Punjab
60 Ferozepur MCl 8 119 127
61 Kapurthala M 2 200 202
62 Mansa MCl 2 106 108
63 Phagwara MCl 4 223 227
64 Sangrur MCl 2 128 130
Rajasthan
65 Banswara M 18 350 368
66 Barmer M 6 201 207
67 Bundi M 7 220 227
68 Churu M 2 138 140
69 Hanumangarh M 7 271 278
70 Sawai Madhopur M 2 184 186
Tamil Nadu
71 Ambur M 14 152 166
7 8 1
Sl. City/Town No. of staff
No. Supervisory Subordinate Total
1 2 3 4

7/21/2019 Status Watersupply
http://slidepdf.com/reader/full/status-watersupply 802/869
72 Arakkonam M 6 144 150
73 Attur M 2 84 8674 Cumbum M n.a. n.a. n.a.
75 Dharmapuri M 9 202 211
76 Gudiyatham M 4 153 157
77 Nagapattinam M 16 197 213
78 Pudukkottai M 10 368 378
79 Sivakasi M 14 195 209
80 Srivilliputtur M 4 149 153
81 Tindivanam M 9 113 122
82 Udhagamandalam M 11 282 293
Uttar Pradesh
83 Auraiya MB 5 82 8784 Balrampur MB 13 150 163
85 Basti MB 8 165 173
86 Bhadohi MB 4 77 81
87 Chandpur MB 5 96 101
88 Etah MB 7 199 206
89 Ghazipur MB 7 174 181
90 Gonda MB 2 216 218
91 Lakhimpur MB 22 229 251
92 Lalitpur MB 10 146 156
93 Mughalsarai MB 12 335 347
94 Nawabganj-Barabanki MB 9 165 174
95 Orai MB 8 285 293
96 Roorkee MB 2 15 17
West Bengal
97 Bishnupur M 8 300 308
7 8 2
Sl. City/Town No. of staff
No. Supervisory Subordinate Total
1 2 3 4

7/21/2019 Status Watersupply
http://slidepdf.com/reader/full/status-watersupply 803/869
98 Chakdaha M 5 27 32
99 Contai M 18 98 116100 Cooch Behar M 30 150 180
101 Darjeeling M 16 163 179
102 Jalpaiguri M 38 286 324
103 Jangipur M 3 10 13
104 Katwa M 5 212 217
105 Raniganj M 8 161 169
Small States
Himachal Pradesh
106 Shimla M.Corp. 40 490 530
Nagaland107 Kohima TC 6 80 86
Union Territories
108 Port Blair MCl 12 764 776
Others(Smaller than Class II towns)
Small States
Goa
109 Panaji MCl 15 125 140
Sikkim
110 Gangtok (Greater Gangtok) NTAC 2 100 102
Union Territories
111 Daman MCl 10 105 115
112 Silvassa CT 1 35 36
* population covered by the service is not available
Source: Respective urban local governments/relevant agencies, NIUA Survey, 1999.
7 8 3
Sl. City/Town No. of staff
No. Supervisory Subordinate Total
1 2 3 4

7/21/2019 Status Watersupply
http://slidepdf.com/reader/full/status-watersupply 804/869

7/21/2019 Status Watersupply
http://slidepdf.com/reader/full/status-watersupply 805/869
C - 9
P R I V A T I S A T I O N ,1 9 9 9

7/21/2019 Status Watersupply
http://slidepdf.com/reader/full/status-watersupply 806/869

7/21/2019 Status Watersupply
http://slidepdf.com/reader/full/status-watersupply 807/869
Metropolitan Cities
1 Bangalore M.Corp. Sweeping n.a. Contract 1989 120
2 Calcutta M.Corp. Transportation - n.a. n.a. n.a.
3 Chennai M.Corp. Collection 3 Zones BOO Starting 2000 1
4 Delhi M.Corp. Composting n.a. Contract 1999 1
5 Greater Mumbai M.Corp. Transportation n.a. Contract n.a. n.a.
6 Hyderabad M.Corp. Sweeping n.a. n.a. 1998 122
7 Jaipur M.Corp. Transportation n.a. n.a. 1990 18
8 Ludhiana M.Corp. Sweeping & collection n.a. CBO n.a. 1149 Madurai M.Corp. Transportation Commercial Contract 1998 2
10 Nagpur M.Corp. Collection n.a. Contract 1997 2
11 Surat M.Corp. Collection & transportation n.a. n.a. n.a. 2
12 Visakhapatnam M.Corp. Sweeping & collection n.a. n.a. 1994 5
CLASS I
Andhra Pradesh
1 Anantapur MCl Sweeping n.a. Contract 1997 1
2 Chittoor M Sweeping & collection n.a. Contract 1999 1
3 Eluru M Collection & disposal n.a. Contract 1998 2
4 Guntur MCl Collection & disposal n.a. Contract 1996 3
5 Hindupur M Sweeping & collection n.a. Contract 1996 1
6 Nandyal MCl Sweeping n.a. NGO 1998 1
7 Nellore MCl Sweeping n.a. Contract 1998 5
7 8 7
Sl. City/Town Aspect privatised Details of privatisation
No. Specific Mode used Year of No. of
area covered privatisation contractors
1 2 3 4 5 6
C-9 : Privatisation, 1999

7/21/2019 Status Watersupply
http://slidepdf.com/reader/full/status-watersupply 808/869
8 Qutubullapur M Sweeping n.a. Contract 1997 5
9 Tenali M Collection & disposal n.a. Contract 1998 1
10 Tirupati MCl Sweeping & collection n.a. Contract 1997 4
11 Vijaywada M.Corp. Disposal & treatment n.a. n.a. n.a. 3
Bihar
12 Gaya M.Corp. Drain cleaning n.a. Contract 1999 4
Gujarat
13 Bhuj M Collection & transportation - - - -
14 Jamnagar M.Corp. Primary collection n.a. Contract 1987 6
15 Rajkot M.Corp. Collection & transportation n.a. Contract 1990 9
Jammu & Kashmir
16 Srinagar M.Corp. Collection New colonies Contract 1999 3
Karnataka
17 Belgaum M.Corp. Transportation n.a. Contract 1994 2
18 Bellary CMC Sweeping & transportation n.a. Contract 1998 2
19 Davangere MCl Composting n.a. Auction 1996 55
20 Hubli-Dharwad M.Corp. Vermi-composting n.a. Contract 1998 1
21 Mysore M.Corp. Sweeping & transportation n.a. Contract 1998 7
22 Shimoga CMC Disposal 12 wards Contract 1994 6
Kerala
23 Alappuzha MC Disposal n.a. Contract 1999 1
Madhya Pradesh
24 Jabalpur M.Corp. Sweeping n.a. Contract 1998 1
Maharashtra
25 Amravati M.Corp. Sweeping n.a. Contract 1985 2
26 Aurangabad M.Corp. Composting entire town Contract 1997 1
7 8 8
Sl. City/Town Aspect privatised Details of privatisation
No. Specific Mode used Year of No. of
area covered privatisation contractors
1 2 3 4 5 6

7/21/2019 Status Watersupply
http://slidepdf.com/reader/full/status-watersupply 809/869
27 Nanded Waghala M.Corp. Sweeping entire city Contract 1997 1
28 Nashik M.Corp. Transportation n.a. Contract 1997 77
29 Parbhani MCl Transportation n.a. Contract 1999 2
Orissa
30 Bhubaneswar M.Corp. Collection n.a. Contract n.a. n.a.
Rajasthan
31 Ajmer MCl Transportation entire town n.a. 1998 2
32 Sriganganagar M Sweeping entire town Contract 1994 3
Tamil Nadu
33 Tiruppur M Secondary collection Major roads Contract 1997 1
West Bengal34 Asansol M.Corp. Primary collection &
transportation n.a. Contract n.a. 7
Small States
Assam
35 Guwahati M.Corp. Transportation entire city Contract 1988 13
Tripura
36 Agartala MCl Composting n.a. n.a. 1999 n.a.
Union Territories
37 Chandigarh M.Corp. Sweeping & collection n.a. Contract 1996 3
38 Pondicherry M Sweeping & collection n.a. Contract 1997 1
Source: Respective urban local governments/relevant agencies, NIUA Survey, 1999.
7 8 9
Sl. City/Town Aspect privatised Details of privatisation
No. Specific Mode used Year of No. of
area covered privatisation contractors
1 2 3 4 5 6

7/21/2019 Status Watersupply
http://slidepdf.com/reader/full/status-watersupply 810/869
CLASS II
Andhra Pradesh
1 Kapra M Sweeping n.a. n.a. 1999 3
2 Madanapalle M Sweeping & collection n.a. Contract n.a. 2
3 Narasaraopet M Collection & disposal n.a. Contract 1998 1
4 Rajendra Nagar MCl Sweeping & collection n.a. NGO 1997 1
5 Srikalahasti M Sweeping & collection n.a. Contract 1998 n.a.
6 Suryapet MCl Sweeping & collection n.a. Contract 1997 2
Karnataka
7 Bagalkot CMC Sweeping n.a. Contract 1999 2
8 Chikmagalur CMC Collection &
transportation entire town Contract 1997 1
9 Gokak CMC Sweeping & transportation n.a. n.a. 1999 1
10 Rabkavi-Banhatti CMC Transportation n.a. Auction n.a. n.a.
Maharashtra
11 Bhandara M Nala cleaning n.a. n.a. 1999 1
12 Kamptee MCl Sweeping & collection commercial Contract 1999 1
13 Manmad MCl Transportation n.a. Contract 1999 1
14 Virar MCl Sweeping & collection entire town Contract 1999 1
Others(Smaller than Class II towns)
Small StatesGoa
15 Panaji MCl Collection, transportation &disposal Restaurants Contract 1995 2
Source: Respective urban local governments/relevant agencies, NIUA Survey, 1999.
7 9 0
Sl. City/Town Aspect privatised Details of privatisation
No. Specific Mode used Year of No. of
area covered privatisation contractors
1 2 3 4 5 6

7/21/2019 Status Watersupply
http://slidepdf.com/reader/full/status-watersupply 811/869
C -1 0
R
E V E N UE R E C E I P T S F OR S OL I D W
A S T E
MA NA GE M
E NT ,1 9 9 7 - 9 8

7/21/2019 Status Watersupply
http://slidepdf.com/reader/full/status-watersupply 812/869

7/21/2019 Status Watersupply
http://slidepdf.com/reader/full/status-watersupply 813/869
Metropolitan Cities
1 Ahmedabad M.Corp. - - - 91
2 Bhopal M.Corp. - - - 80
3 Delhi M.Corp. - - - n.a.
4 Chennai M.Corp.
5 Greater Mumbai M.Corp. - - - -
6 Lucknow M.Corp. - - - - 1
7 Nagpur M.Corp. n.a. n.a. 48,300 -
8 Pune M.Corp. % of arv 13 116,600 -
9 Surat M.Corp.^ % of arv 6, 12, 24 12,622
* Private removal charges (54 lakh) and Other receipts (15 lakh) ; ** Administration Charges ; arv = Annual rateable valueare for residential, non-residential and commercial respectively in Surat M.Corp
Source: Respective urban local governments/relevant agencies, NIUA Survey, 1999.
CLASS I
Andhra Pradesh
1 Eluru M n.a. n.a. 1,522 5
2 Vijaywada M.Corp. - - - -
Bihar
3 Bihar Sharif M % of arv 8 1,480 -
Gujarat4 Bhavnagar M.Corp. % of arv 9 14,916 -
5 Jamnagar M.Corp. n.a. n.a. 5,529 -
6 Navsari M % of arv 4 2,056 -
7 Porbandar M - - - 39
8 Rajkot M.Corp. % of arv 4-10 26,451 -
7 9 3
Sl. City/Town Rates of sanitation Revenue Receip
No. Unit Rate (%) Sanitation Sale of Sa
tax/ cess compost rub
1 2 3 4 5
C-10: Revenue Receipts for Solid Waste Management, 1997-98

7/21/2019 Status Watersupply
http://slidepdf.com/reader/full/status-watersupply 814/869
9 Surendranagar M - - - -
Karnataka
10 Gadag-Betigeri CMC - - - 2
11 Gulbarga M.Corp. n.a. n.a. 121 -
12 Mysore M.Corp. - - - - 1
13 Shimoga CMC n.a. n.a. 2,080 -
14 Tumkur M n.a. n.a. 693 -
Madhya Pradesh
15 Burhanpur M.Corp. - - - 103
16 Guna M - - - 5
17 Jabalpur M.Corp. Rs./year 180 1,489 -
18 Khandwa M 0 0 - 4819 Morena M Rs./year 150 384 -
20 Murwara-Katni M.Corp. n.a. n.a. 70 -
21 Satna M.Corp. - - - -
Maharashtra
22 Amravati M.Corp. % of arv 24 36 7
23 Aurangabad M.Corp. % of arv 1 6,481 -
24 Bhusawal M.Cl. n.a. n.a. 2,366 -
25 Ichalkaranji MCl - - - 18
26 Kolhapur M.Corp. % of arv 30 16,507 -
27 Nanded Waghala M.Corp. n.a. n.a. 845 -
28 Nashik M.Corp. % of arv 5 7,049 -
29 Parbhani MCl - - - -
30 Solapur M.Corp. n.a. n.a. 14,662 204
Tamil Nadu
31 Dindigul M - - - - 1
7 9 4
Sl. City/Town Rates of sanitation Revenue Receip
No. Unit Rate (%) Sanitation Sale of Sal
tax/ cess compost rub
1 2 3 4 5 6

7/21/2019 Status Watersupply
http://slidepdf.com/reader/full/status-watersupply 815/869
32 Kanchipuram M n.a. n.a. 1,657 -
33 Salem M.Corp. % of arv 1 4,126 -
34 Thanjavur M - - - 146
35 Tiruchirapalli M.Corp. % of arv 2 7,811 -
36 Tirunelveli M.Corp. - - - -
37 Tirunvannamalai M - - - 2
38 Tiruppur M % of arv 2 2,737 -
39 Tuticorin M - - - -
Uttar Pradesh
40 Agra M.Corp. - - - -
41 Bareilly M.Corp. - - - - 3
42 Etawah MB - - - 21
43 Haldwani-cum-Kathgodam MB % of arv 10 3,000 - n
44 Jhansi MB - - - 11
45 Rampur MB - - - 21
46 Saharanpur MB n.a. n.a. 1,005 -
West Bengal
47 Balurghat M - - - 4
48 Baharampur M - - - 5
49 Krishna Nagar M - - - -
50 Midnapur M - - - 38
51 North Barrackpur M - - - -
52 Santipur M - - - 12
Small States
Assam
53 Guwahati M.Corp. *% of arv 3 4,962 -
7 9 5
Sl. City/Town Rates of sanitation Revenue Receip
No. Unit Rate (%) Sanitation Sale of Sal
tax/ cess compost rub
1 2 3 4 5 6

7/21/2019 Status Watersupply
http://slidepdf.com/reader/full/status-watersupply 816/869
Meghalaya
54 Shillong MB % of arv variable 1,674 -
Tripura
55 Agartala MCl % of arv 3 90 -
Union Territories
56 Pondicherry M - - - 20
arv = Annual rateable value
Source: Respective urban local governments/relevant agencies, NIUA Survey, 1999.
CLASS II
Andhra Pradesh
1 Dharmavaram M - - 0 57
2 Gudur MCl - - 0 0
3 Kapra M *% of arv 2 548 0
4 Kavali MCl - - 0 27
5 Suryapet MCl % of arv 2 493 0
Karnataka
6 Chikmagalur CMC n.a. n.a. 1,050 0
7 Rabkavi-Banhatti CMC % of arv 10 130 166
8 Ramanagaram CMC n.a. n.a. 173 0
Kerala
9 Payyanur M n.a. n.a. 745 0
10 Taliparamba M % of arv 3 110 0
Madhya Pradesh
11 Hoshangabad M Rs./year 150 97 0
12 Itarsi M Rs./year 150 331 0
13 Khargone M 0 0 0 17
7 9 6
Sl. City/Town Rates of sanitation Revenue Receip
No. Unit Rate (%) Sanitation Sale of Sal
tax/ cess compost rub
1 2 3 4 5 6
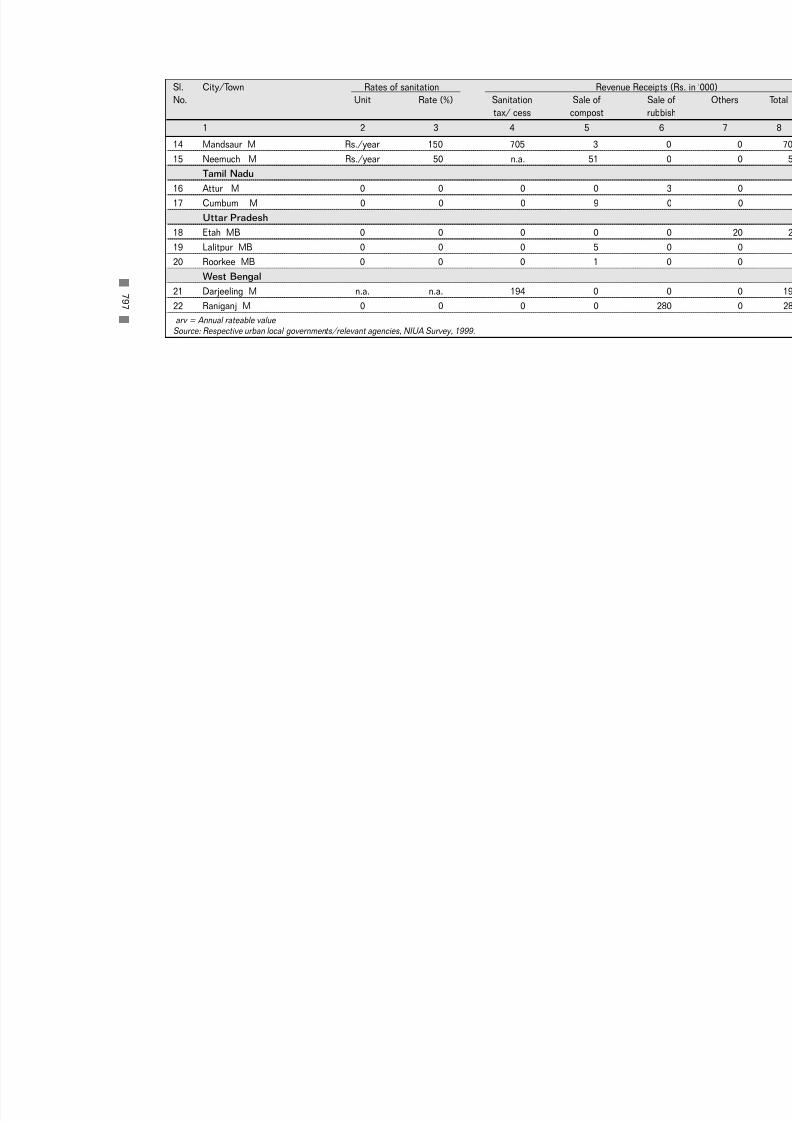
7/21/2019 Status Watersupply
http://slidepdf.com/reader/full/status-watersupply 817/869
14 Mandsaur M Rs./year 150 705 3
15 Neemuch M Rs./year 50 n.a. 51
Tamil Nadu
16 Attur M 0 0 0 0
17 Cumbum M 0 0 0 9
Uttar Pradesh
18 Etah MB 0 0 0 0
19 Lalitpur MB 0 0 0 5
20 Roorkee MB 0 0 0 1
West Bengal
21 Darjeeling M n.a. n.a. 194 0
22 Raniganj M 0 0 0 0 2
arv = Annual rateable value
Source: Respective urban local governments/relevant agencies, NIUA Survey, 1999.
7 9 7
Sl. City/Town Rates of sanitation Revenue Receip
No. Unit Rate (%) Sanitation Sale of Sal
tax/ cess compost rub
1 2 3 4 5 6

7/21/2019 Status Watersupply
http://slidepdf.com/reader/full/status-watersupply 818/869

7/21/2019 Status Watersupply
http://slidepdf.com/reader/full/status-watersupply 819/869
C -1 1
R E
V E N UE E X P E NDI T UR E O N S OL I D
WA S T E
MA NA GE M
E NT ,1 9 9 7 - 9 8

7/21/2019 Status Watersupply
http://slidepdf.com/reader/full/status-watersupply 820/869

7/21/2019 Status Watersupply
http://slidepdf.com/reader/full/status-watersupply 821/869
Metropolitan Cities
1 Ahmedabad M.Corp. 316,242 10,707 17
2 Bangalore M.Corp. 279,700 8,778 124,112
3 Bhopal M.Corp. 13,005 n.a. 0
4 Calcutta M.Corp. Break-up not available
5 Chennai M.Corp. 455,467 37,270 39,071 28,9
6 Coimbatore M.Corp. 168,515 4,606 0
7 Delhi M.Corp. 1,392,200 0 0 11,9
8 Greater Mumbai M.Corp. 2,750,000 50,000 200,000 750,0
9 Hyderabad M.Corp. 250,000 0 0 25,0
10 Indore M.Corp. n.a
11 Jaipur M.Corp. 257,241 25,782 0
12 Kanpur M.Corp. 227,326 43,515 0
13 Kochi M.Corp. 18,770 2,420 0
14 Lucknow M.Corp. 21,000 12,000 4,000
15 Ludhiana M.Corp. 132,773 380 0
16 Madurai M.Corp. 101,751 14 378 10,0
17 Nagpur M.Corp. 158,755 8,755 3,266
18 Pune M.Corp. 233,314 n.a. 0 2
19 Surat M.Corp. 11,855 55,617 0
20 Vadodara M.Corp. 4,112 718 1,35421 Varanasi M.Corp. 234,293 10,463 6,126
22 Visakhapatnam M.Corp. 144,370 0 0
Source: Respective urban local governments/relevant agencies, NIUA Survey, 1999.
8 0 1
Sl. City/Town Revenue Expenditure (Rs. in '000)
No. Salary and wages Consumables Vehicle repair Continge
1 2 3 4 5
C-11 : Revenue Expenditure on Solid Waste Management, 1997-98

7/21/2019 Status Watersupply
http://slidepdf.com/reader/full/status-watersupply 822/869
CLASS I
Andhra Pradesh1 Anantapur MCl 8,998 950 230 1,0
2 Chittoor M 950 500 39
3 Cuddapah MCl 9,000 300 384 1
4 Eluru M 11,853 260 300 2,0
5 Guntur MCl 30,100 0 0
6 Hindupur M 5,224 200 150
7 Kakinada M 9,443 600 300
8 Kurnool MCl 9,256 0 0
9 Machilipatnam M 14,400 250 0
10 Nandyal MCl 700 325 100 4
11 Nellore MCl 24,868 1,311 471 1,912 Nizamabad M 20,400 0 0
13 Ongole MCl 8,697 200 169 2,1
14 Qutubullapur M 150 50 30 5
15 Rajahmundry M.Corp. 20,897 514 130
16 Tenali M 3,671 0 90 1,5
17 Tirupati MCl 9,333 3,806 0
18 Vijaywada M.Corp. 62,147 6,500 1,300 1,3
19 Warangal M.Corp. 2,073 0 182 3,2
Bihar
20 Bihar Sharif M 6,121 136 150
21 Chhapra M Break-up not available
22 Gaya M.Corp. 150 0 0
23 Katihar M 8,113 109 121
24 Munger M n.a.
25 Ranchi M.Corp. 30,000 800 200
8 0 2
Sl. City/Town Revenue Expenditure (Rs. in '000)
No. Salary and wages Consumables Vehicle repair Continge
1 2 3 4 5

7/21/2019 Status Watersupply
http://slidepdf.com/reader/full/status-watersupply 823/869
Gujarat
26 Anand M n.a.27 Bharuch M 23,346 1,410 875 4
28 Bhavnagar M.Corp. 60,000 500 200
29 Bhuj M 7,426 0 372
30 Jamnagar M.Corp. 45,421 0 0 3
31 Junagadh M 11,888 0 0
32 Nadiad M 13,780 413 187
33 Navsari M 6,636 4,244 0
34 Porbandar M 11,503 0 0 4
35 Rajkot M.Corp. 81,376 9,201 0
36 Surendranagar M 11,506 0 10Haryana
37 Ambala MCl 12,741 199 53
38 Faridabad M.Corp. 249,890 4,574 2,243
39 Gurgaon MCl 17,815 552 0
40 Hissar MCl 1,239 247 493
41 Karnal MCl 20,380 612 0
42 Rohtak MCl 18,926 411 298 4
Jammu & Kashmir
43 Jammu M.Corp. n.a.
44 Srinagar M.Corp. 14,500 130 2,000 2,0
Karnataka
45 Belgaum M.Corp. 30,483 1,237 437 1,1
46 Bellary CMC 14,721 1,486 559 2,7
47 Davangere MCl 20,478 1,010 260 2
48 Gadag-Betigeri CMC 10,733 344 40
8 0 3
Sl. City/Town Revenue Expenditure (Rs. in '000)
No. Salary and wages Consumables Vehicle repair Continge
1 2 3 4 5

7/21/2019 Status Watersupply
http://slidepdf.com/reader/full/status-watersupply 824/869
49 Gulbarga M.Corp. 16,188 703 124 2,2
50 Hubli-Dharwad M.Corp. 55,776 1,945 876 2,151 Mandya M 12,417 261 56
52 Mangalore M.Corp. 12,246 1,787 1,538
53 Mysore M.Corp. 42,729 3,468 1,064 2,2
54 Shimoga CMC 30,240 1,262 868
55 Tumkur M 3,547 57 40
Kerala
56 Alappuzha MC 11,761 265 0 1,0
57 Kollam MC 15,655 0 0 1
58 Kozhikode M.Corp. 34,737 1,530 0 2,5
59 Thalaserry M 8,841 419 768
60 Thiruvananthapuram M.Corp. 47,198 8,313 0 6
Madhya Pradesh
61 Bhind M* 5,612 202 168
62 Burhanpur M.Corp. 14,062 1,224 0
63 Dewas M.Corp. 16,390 449 0 1
64 Guna M 4,800 3,300 125 4
65 Gwalior M.Corp. 5,984 1,899 625
66 Jabalpur M.Corp. 75,716 0 257 6
67 Khandwa M 16,938 256 96
68 Morena M n.a.
69 Murwara-Katni M.Corp. 14,954 327 220 170 Ratlam M.Corp. 14,750 203 0
71 Rewa M.Corp. 12,700 420 50
72 Satna M.Corp. 7,112 706 210
73 Shivpuri M 5,700 360 312 1
8 0 4
Sl. City/Town Revenue Expenditure (Rs. in '000)
No. Salary and wages Consumables Vehicle repair Continge
1 2 3 4 5
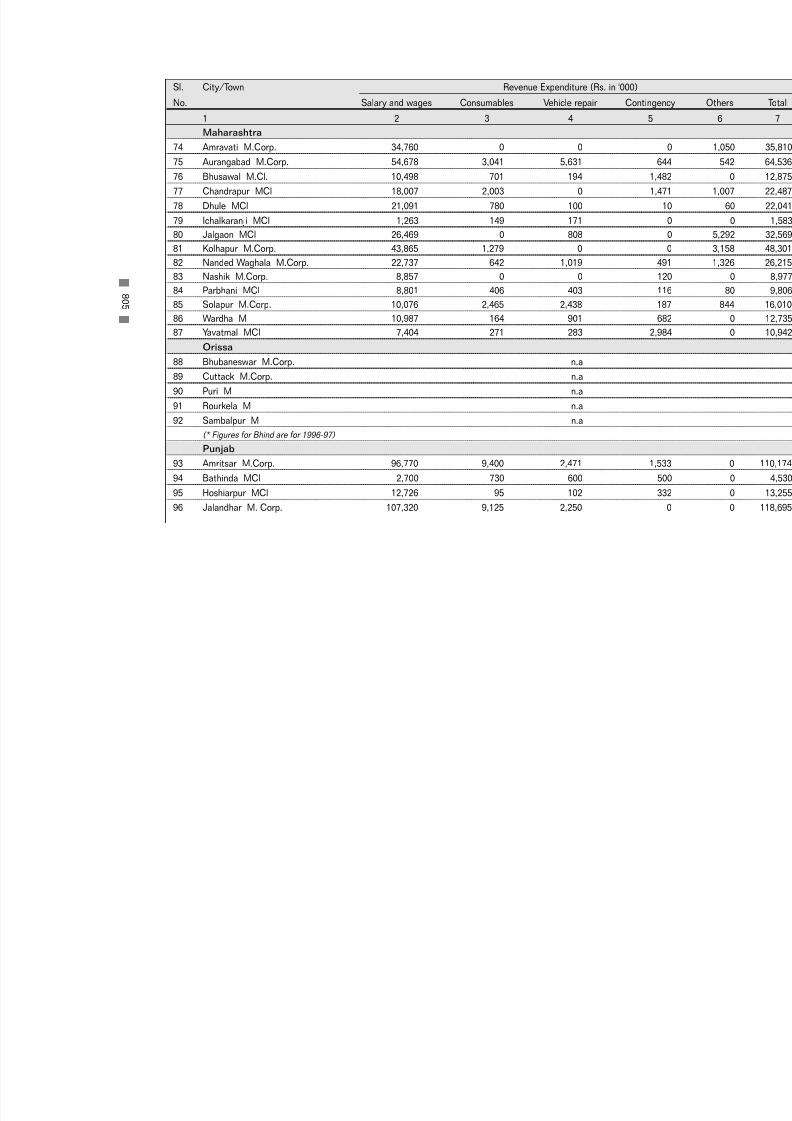
7/21/2019 Status Watersupply
http://slidepdf.com/reader/full/status-watersupply 825/869
Maharashtra
74 Amravati M.Corp. 34,760 0 075 Aurangabad M.Corp. 54,678 3,041 5,631 6
76 Bhusawal M.Cl. 10,498 701 194 1,4
77 Chandrapur MCl 18,007 2,003 0 1,4
78 Dhule MCl 21,091 780 100
79 Ichalkaranji MCl 1,263 149 171
80 Jalgaon MCl 26,469 0 808
81 Kolhapur M.Corp. 43,865 1,279 0
82 Nanded Waghala M.Corp. 22,737 642 1,019 4
83 Nashik M.Corp. 8,857 0 0 1
84 Parbhani MCl 8,801 406 403 1
85 Solapur M.Corp. 10,076 2,465 2,438 1
86 Wardha M 10,987 164 901 6
87 Yavatmal MCl 7,404 271 283 2,9
Orissa
88 Bhubaneswar M.Corp. n.a
89 Cuttack M.Corp. n.a
90 Puri M n.a
91 Rourkela M n.a
92 Sambalpur M n.a
(* Figures for Bhind are for 1996-97)
Punjab93 Amritsar M.Corp. 96,770 9,400 2,471 1,5
94 Bathinda MCl 2,700 730 600 5
95 Hoshiarpur MCl 12,726 95 102 3
96 Jalandhar M. Corp. 107,320 9,125 2,250
8 0 5
Sl. City/Town Revenue Expenditure (Rs. in '000)
No. Salary and wages Consumables Vehicle repair Continge
1 2 3 4 5

7/21/2019 Status Watersupply
http://slidepdf.com/reader/full/status-watersupply 826/869
97 Moga MCl 4,500 600 100 2
98 Pathankot MCl 12,157 350 35099 Patiala M.Corp. 22,500 1,650 0
Rajasthan
100 Ajmer MCl 127,000 140,000 0
101 Alwar M 16,652 0 0 5,5
102 Beawar M 13,230 285 325 2
103 Bhilwara M 47,595 5,041 0
104 Bikaner M 48,607 761 407 6,6
105 Jodhpur M.Corp. 118,046 3,755 0
106 Kota M.Corp. n.a.
107 Sriganganagar M 18,793 12 796
Tamil Nadu108 Cuddalore M 10,577 0 0 7
109 Dindigul M 16,053 0 0 6
110 Erode M 18,464 0 0 3,0
111 Kanchipuram M 965 0 0 1,7
112 Kumbakonam M 12,635 0 1,594
113 Nagercoil M 14,592 0 0
114 Rajapalaiyam M 11,670 1,016 0
115 Salem M.Corp. 49,690 10,993 7,207 3,4
116 Thanjavur M 17,298 0 0
117 Tiruchirapalli M.Corp. 64,792 4,721 0
118 Tirunelveli M.Corp. 28,905 0 0 2
119 Tirunvannamalai M 9,972 1,184 0 8
120 Tiruppur M 26,901 4,890 0
121 Tuticorin M 21,952 0 0 1,1
122 Vellore M 13,576 0 0 8
8 0 6
Sl. City/Town Revenue Expenditure (Rs. in '000)
No. Salary and wages Consumables Vehicle repair Continge
1 2 3 4 5

7/21/2019 Status Watersupply
http://slidepdf.com/reader/full/status-watersupply 827/869
Uttar Pradesh
123 Agra M.Corp. 120,368 9,966 0124 Aligarh M.Corp. 7,000 600 400
125 Allahabad M.Corp. 119,651 16,643 0
126 Bareilly M.Corp. 60,000 2,448 830
127 Etawah MB 2,200 2,400 25
128 Faizabad MB 20,400 240 50
129 Firozabad MB 21,869 7,150 0
130 Ghaziabad M.Corp. 61,511 0 0
131 Gorakhpur M.Corp. 34,658 4,517 0
132 Haldwani-cum-Kathgodam MB 25,200 0 100
133 Hapur MB 11,869 0 548
134 Hardwar MB 36,408 1,572 0
135 Jhansi MB 22,567 1,081 287
136 Mathura MB 28,174 641 29 1
137 Meerut M.Corp. 81,029 12,150 0
138 Mirzapur MB 36,473 Expenditure on other heads not availab
139 Moradabad M.Corp. n.a.
140 Muzaffarnagar MB 36,631 688 252 1,7
141 Rae Bareli MB Break-up not available
142 Rampur MB 16,707 3,098 0
143 Saharanpur MB 40,355 6,748 0
144 Sitapur MB 596 0 0145 Unnao MB Break-up not available
West Bengal
146 Asansol M.Corp. 7,192 0 0
147 Baharampur M 14,236 174 120
8 0 7
Sl. City/Town Revenue Expenditure (Rs. in '000)
No. Salary and wages Consumables Vehicle repair Continge
1 2 3 4 5

7/21/2019 Status Watersupply
http://slidepdf.com/reader/full/status-watersupply 828/869
148 Balurghat M 1,620 565 100
149 Bankura M 12,927 232 105146 Barasat M 3,893 0 435
150 Burdwan M n.a.
151 Halisahar M n.a.
152 Krishna Nagar M 11,613 329 0 3
153 Midnapur M 11,000 250 80 2,0
154 North Barrackpur M 3,955 155 58
155 Santipur M 4,337 144 141
156 Siliguri M.Corp. 20,417 0 0
Small States
Assam
157 Guwahati M.Corp. 15,600 3,600 4,320 1,2
158 Jorhat MB n.a.
Manipur
159 Imphal MCl 4,662 378 631
160 Meghalaya
161 Shillong MB 7,780 467 99 1
Tripura
162 Agartala MCl 7,875 1,150 1,100 3
Union Territories
163 Chandigarh M.Corp. 97,004 4,007 2,410 9,5
164 Pondicherry M 22,469 238 694
Source: Respective urban local governments/relevant agencies, NIUA Survey, 1999.
8 0 8
Sl. City/Town Revenue Expenditure (Rs. in '000)
No. Salary and wages Consumables Vehicle repair Continge
1 2 3 4 5

7/21/2019 Status Watersupply
http://slidepdf.com/reader/full/status-watersupply 829/869
CLASS II
Andhra Pradesh1 Anakapalle M 300 120 60
2 Dharmavaram M n.a.
3 Gudur MCl 3,000 96 90
4 Kapra M 5,577 89 131
5 Kavali MCl 3,943 165 135
6 Madanapalle M 5,199 450 0 8
7 Narasaraopet M 2,722 90 50
8 Rajendra Nagar MCl n.a.
9 Sangareddy MCl 2,686 112 54
10 Srikakulam MCl n.a.
11 Srikalahasti M Break-up not available12 Suryapet MCl 3,844 166 53 3
Bihar
13 Buxar M n.a.
14 Deoghar M 88 94 14
15 Hajipur M 3,153 45 20
16 Hazaribagh M n.a.
17 Jehanabad M 1,771 30 25
18 Madhubani M 1,721 19 20
19 Mokama M n.a.
Gujarat
20 Amreli M 714 87 299
21 Ankleswar M 3,575 87 443
22 Dabhoi M 2,854 0 0
23 Dohad M n.a.
24 Gondal M 8,581 290 0
8 0 9
Sl. City/Town Revenue Expenditure (Rs. in '000)
No. Salary and wages Consumables Vehicle repair Continge
1 2 3 4 5

7/21/2019 Status Watersupply
http://slidepdf.com/reader/full/status-watersupply 830/869
25 Jetpur M 7,118 153 822
26 Mahesana M 4,743 345 656 327 Palanpur M 10,363 564 124
Haryana
28 Jind MCl 8,176 63 109
29 Kaithal MCl 8,352 85 50
30 Rewari MCl 12,199 99 25 1
31 Thanesar MCl 7,973 81 74 3
Karnataka
32 Bagalkot CMC 4,473 258 97 4
33 Chikmagalur CMC 4,685 0 0
34 Gokak CMC 1,973 89 133
35 Hospet CMC n.a36 Kolar CMC 4,284 2,275 1,806
37 Rabkavi-Banhatti CMC 2,629 308 8
38 Ramanagaram CMC 2,199 0 0
Kerala
39 Changanessary MC 5,948 268 0
40 Payyanur M 1,070 12 40
41 Taliparamba M 428 0 100
42 Thrissur MC 13,356 1,133 0
Madhya Pradesh
43 Hoshangabad M 1,528 311 197 2
44 Itarsi M 5,147 576 46
45 Khargone M 4,468 0 1,429
46 Mandsaur M 8,826 532 164 2,5
47 Nagda M 4,290 154 491
48 Neemuch M 7,945 848 0 2
8 1 0
Sl. City/Town Revenue Expenditure (Rs. in '000)
No. Salary and wages Consumables Vehicle repair Continge
1 2 3 4 5
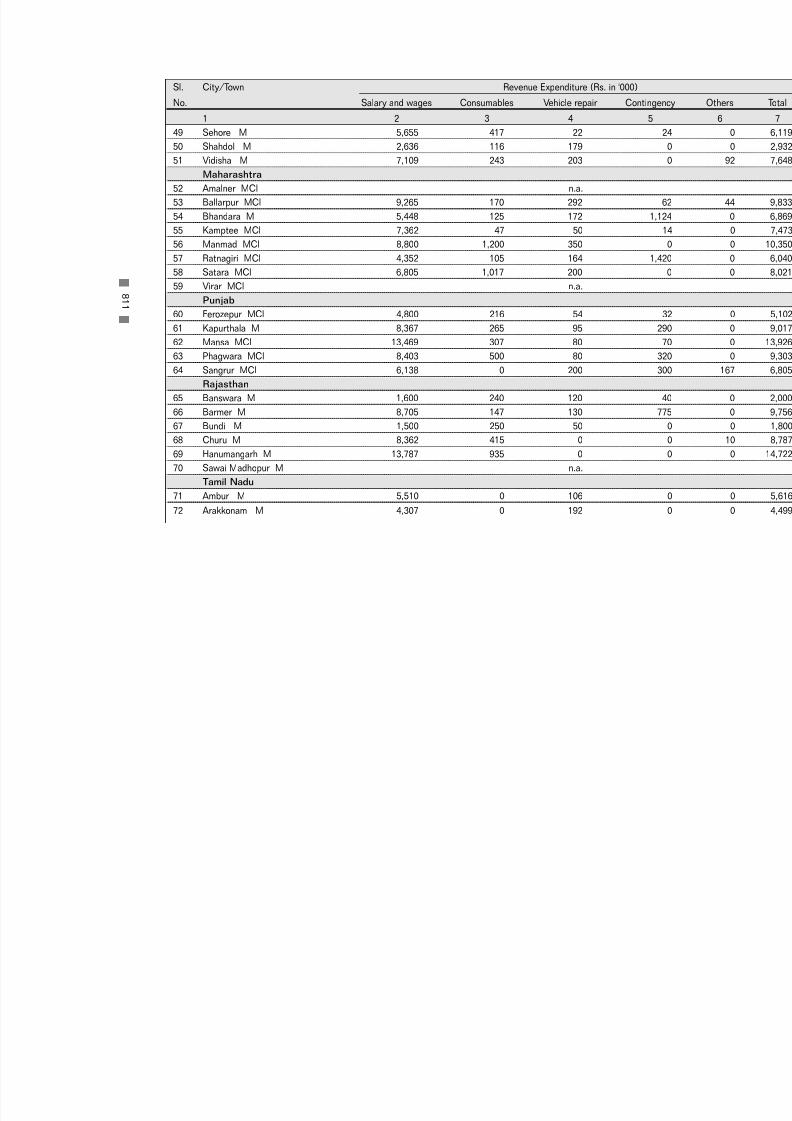
7/21/2019 Status Watersupply
http://slidepdf.com/reader/full/status-watersupply 831/869
49 Sehore M 5,655 417 22
50 Shahdol M 2,636 116 17951 Vidisha M 7,109 243 203
Maharashtra
52 Amalner MCl n.a.
53 Ballarpur MCl 9,265 170 292
54 Bhandara M 5,448 125 172 1,1
55 Kamptee MCl 7,362 47 50
56 Manmad MCl 8,800 1,200 350
57 Ratnagiri MCl 4,352 105 164 1,4
58 Satara MCl 6,805 1,017 200
59 Virar MCl n.a.
Punjab60 Ferozepur MCl 4,800 216 54
61 Kapurthala M 8,367 265 95 2
62 Mansa MCl 13,469 307 80
63 Phagwara MCl 8,403 500 80 3
64 Sangrur MCl 6,138 0 200 3
Rajasthan
65 Banswara M 1,600 240 120
66 Barmer M 8,705 147 130 7
67 Bundi M 1,500 250 50
68 Churu M 8,362 415 0
69 Hanumangarh M 13,787 935 0
70 Sawai Madhopur M n.a.
Tamil Nadu
71 Ambur M 5,510 0 106
72 Arakkonam M 4,307 0 192
8 1 1
Sl. City/Town Revenue Expenditure (Rs. in '000)
No. Salary and wages Consumables Vehicle repair Continge
1 2 3 4 5

7/21/2019 Status Watersupply
http://slidepdf.com/reader/full/status-watersupply 832/869
73 Attur M 4,952 0 0 1
74 Cumbum M Break-up not available75 Dharmapuri M 7,471 211 0 1,0
76 Gudiyatham M 4,907 0 0
77 Nagapattinam M 7,501 0 0 1
78 Pudukkottai M 12,888 0 1,447
79 Sivakasi M 7,996 n.a. n.a.
80 Srivilliputtur M 6,122 86 0
81 Tindivanam M 5,913 0 0 4
82 Udhagamandalam M 10,956 0 0
Uttar Pradesh
83 Auraiya MB 4,145 37 59
84 Balrampur MB Break-up not available85 Basti MB 5,686 767 0
86 Bhadohi MB 6,742 64 39
87 Chandpur MB 7,437 52 19
88 Etah MB 10,033 2,372 0 5,5
89 Ghazipur MB 8,960 2,660 0
90 Gonda MB 1,010 432 98
91 Lakhimpur MB 9,398 29 110
92 Lalitpur MB 5,948 71 21
93 Mughalsarai MB 13,756 40,946 0
94 Nawabganj-Barabanki MB 8,350 200 495
95 Orai MB 8,926 171 0
96 Roorkee MB 498 254 51
8 1 2
Sl. City/Town Revenue Expenditure (Rs. in '000)
No. Salary and wages Consumables Vehicle repair Continge
1 2 3 4 5
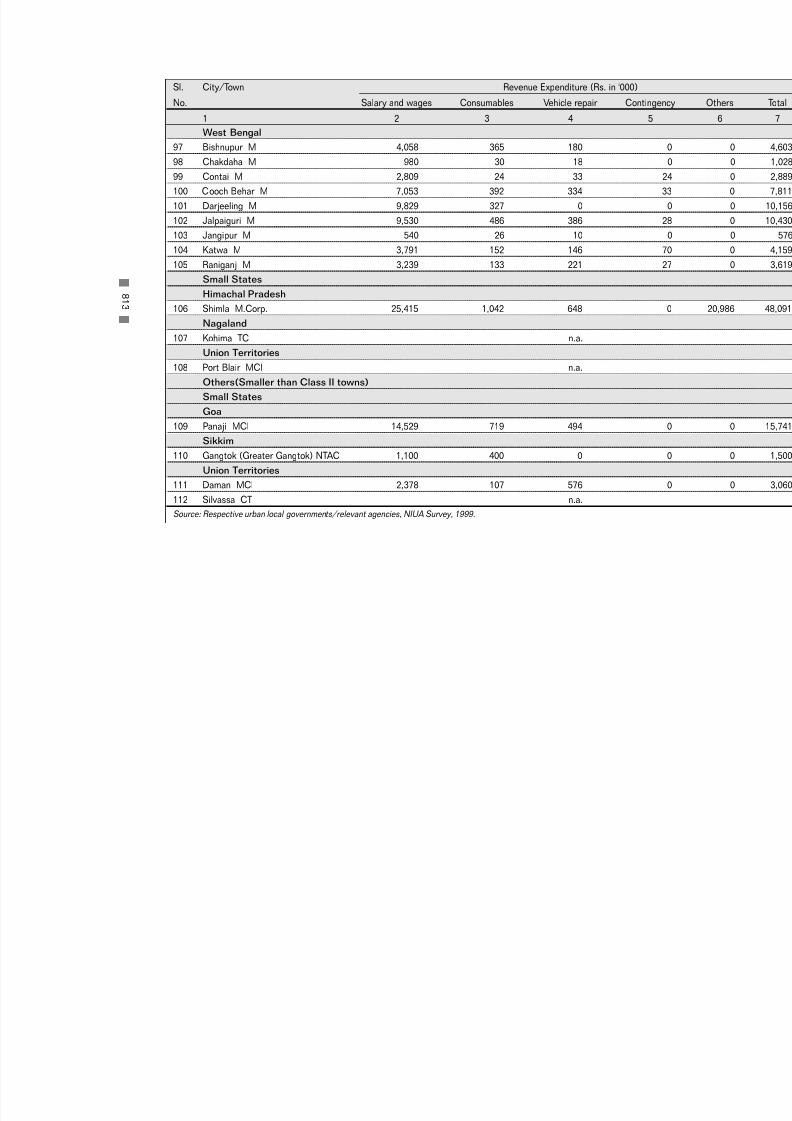
7/21/2019 Status Watersupply
http://slidepdf.com/reader/full/status-watersupply 833/869
West Bengal
97 Bishnupur M 4,058 365 18098 Chakdaha M 980 30 18
99 Contai M 2,809 24 33
100 Cooch Behar M 7,053 392 334
101 Darjeeling M 9,829 327 0
102 Jalpaiguri M 9,530 486 386
103 Jangipur M 540 26 10
104 Katwa M 3,791 152 146
105 Raniganj M 3,239 133 221
Small States
Himachal Pradesh
106 Shimla M.Corp. 25,415 1,042 648
Nagaland
107 Kohima TC n.a.
Union Territories
108 Port Blair MCl n.a.
Others(Smaller than Class II towns)
Small States
Goa
109 Panaji MCl 14,529 719 494
Sikkim
110 Gangtok (Greater Gangtok) NTAC 1,100 400 0
Union Territories
111 Daman MCl 2,378 107 576
112 Silvassa CT n.a.
Source: Respective urban local governments/relevant agencies, NIUA Survey, 1999.
8 1 3
Sl. City/Town Revenue Expenditure (Rs. in '000)
No. Salary and wages Consumables Vehicle repair Continge
1 2 3 4 5

7/21/2019 Status Watersupply
http://slidepdf.com/reader/full/status-watersupply 834/869

7/21/2019 Status Watersupply
http://slidepdf.com/reader/full/status-watersupply 835/869
C -1 2
C A P I T A L W OR K S U ND
E R T A K E NB E T WE E N1 9 9 4
A N
D1 9 9 9

7/21/2019 Status Watersupply
http://slidepdf.com/reader/full/status-watersupply 836/869

7/21/2019 Status Watersupply
http://slidepdf.com/reader/full/status-watersupply 837/869
Metropolitan Cities
1 Ahmedabad M.Corp. Purchase of equipment Waste collection 1996 1998
2 Delhi M.Corp. Purchase of vehicles/ Improving transportation 1994 1999
equipment
3 Greater Mumbai M.Corp. Purchase of vehicles/ Waste collection 1997 1999equipment
4 Kochi M.Corp. Acquiring land Treatment of waste 1998 -Purchase of vehicles Waste disposal 1995 1995
5 Ludhiana M.Corp. n.a. - - -
6 Nagpur M.Corp. Purchase of equipment Waste collection 1997 ongoing
7 Pune M.Corp. Purchase of equipment Waste collection n.a. -
CLASS I
Gujarat
1 Anand M Purchase of vehicles Improving transportation 1996 -Purchase of vehicles Improving transportation 1996 1996
2 Bharuch M Purchase of vehicles Improving transportation 1996 1998Purchase of equipment Waste collection 1996 1998
3 Bhuj M Purchase of vehicles Improving transportation 1998 -Purchase of vehicles Improving transportation 1998 1999
4 Jamnagar M.Corp. Purchase of vehicles Improving transportation 1997 -Purchase of vehicles Improving transportation 1997 1999
5 Junagadh M Purchase of vehicles Improving transportation 1994 1995
6 Nadiad M Purchase of vehicles Improving transportation 1996 -Purchase of vehicles Improving transportation 1997 1997
8 1 7
Sl. City/Town Component Purpose Year
No. started completed
1 2 3 4 5
C-12 : Capital Works Undertaken between 1994 and 1999

7/21/2019 Status Watersupply
http://slidepdf.com/reader/full/status-watersupply 838/869
7 Navsari M Purchase of vehicles Improving transportation 1995 ongoing
8 Porbandar M Purchase of vehicles Improving transportation 1995 -Purchase of vehicles Improving transportation 1996 1996
9 Rajkot M.Corp. Purchase of vehicles Improving transportation 1993 -
10 Surendranagar M Purchase of vehicles Improving transportation 1994 -
Haryana
11 Ambala MCl Purchase of vehicles Improving transportation 1994 -
Purchase of vehicles Improving transportation 1995 1999
12 Karnal MCl Purchase of vehicles Improving transportation n.a. n.a.
Jammu & Kashmir
13 Srinagar M.Corp. Earth filling / fencing Landfill 1997 ongoing
Karnataka
14 Tumkur M n.a. Waste disposal 1998 ongoing
Kerala
15 Kozhikode M.Corp. Compost plant Treatment of waste 1998 2000
16 Thalaserry M Compost plant Treatment of waste 1998 1998
Purchase of vehicles Improving transportation 1996 1997
Maharashtra
17 Nashik M.Corp. Compost plant Treatment of waste 1999 2000
Punjab
18 Moga MCl Purchase of vehicles Improving transportation 1996 -Purchase of vehicles Improving transportation 1997 1997
Rajasthan
19 Ajmer MCl n.a. Improving transportation 1998 -
n.a. Improving transportation 1998 -
20 Beawar M Purchase of equipment Waste collection 1997 -
Purchase of vehicles Improving transportation 1996 -
8 1 8
Sl. City/Town Component Purpose Year
No. started completed
1 2 3 4 5

7/21/2019 Status Watersupply
http://slidepdf.com/reader/full/status-watersupply 839/869
21 Sriganganagar M Purchase of vehicles Improving transportation 1996 -
Tamil Nadu22 Rajapalaiyam M Purchase of vehicles Improving transportation 1995 1995
23 Salem M.Corp. Acquiring land Waste disposal 1996 1997
24 Tirunvannamalai M Purchase of vehicles Improving transportation 1997 -
West Bengal
25 Santipur M Purchase of vehicles Improving transportation n.a. n.a.
Small States
Tripura
26 Agartala MCl Purchase of vehicles Improving transportation 1997 -
Compost plant Treatment of waste n.a. n.a.
CLASS II
Gujarat
1 Amreli M Purchase of vehicles Improving transportation n.a. n.a.
2 Dohad M Purchase of vehicles Improving transportation 1994 -
Purchase of vehicles Improving transportation 1996 1996
3 Gondal M Purchase of vehicles Improving transportation 1997 -
Purchase of vehicles Improving transportation 1997 1997
4 Jetpur M Purchase of vehicles Improving transportation 1994 -
Purchase of vehicles Improving transportation 1997 1998
Haryana5 Kaithal MCl n.a. Waste collection 1998 1998
Karnataka
6 Ramanagaram CMC Purchase of vehicles Improving transportation 1999 -
8 1 9
Sl. City/Town Component Purpose Year
No. started completed
1 2 3 4 5

7/21/2019 Status Watersupply
http://slidepdf.com/reader/full/status-watersupply 840/869
Kerala
7 Changanessary MC Compost plant n.a. n.a. n.a.8 Taliparamba M Acquiring land Waste disposal 1998 1998
Purchase of vehicles Improving transportation 1997 1997
Madhya Pradesh
9 Neemuch M Purchase of vehicles Improving transportation 1994 -
10 Vidisha M Purchase of equipment Waste collection 1995 1996
Trenching ground devt. Waste treatment 1995 n.a.
Tamil Nadu
11 Arakkonam M Purchase of vehicles Improving transportation 1996 -12 Sivakasi M Purchase of vehicles
13 Srivilliputtur M Purchase of vehicles Improving transportation 1998 -
14 Tindivanam M Purchase of vehicles Improving transportation 1995 -
West Bengal
15 Chakdaha M Acquiring land Develop land fill 1997 1998
Small States
Himachal Pradesh
16 Shimla M.Corp. Purchase of vehicles Improving transportation 1999 -
Nagaland17 Kohima TC Purchase of equipment Waste disposal 1994 -
Union Territories
18 Port Blair MCl
8 2 0
Sl. City/Town Component Purpose Year
No. started completed
1 2 3 4 5

7/21/2019 Status Watersupply
http://slidepdf.com/reader/full/status-watersupply 841/869
Others(Smaller than Class II towns)
Small StatesGoa
19 Panaji MCl n.a. n.a. 1994 n.a.
Sikkim
20 Gangtok (Greater Gangtok) Compost plant Acquiring land 1997 1999NTAC Compost plant Treatment of waste 1999 1999
Union Territories
21 Daman MCl Purchase of vehicles Improving transportation 1996 -
22 Silvassa CT
Source: Respective urban local governments/relevant agencies, NIUA Survey, 1999.
8 2 1
Sl. City/Town Component Purpose Year
No. started completed
1 2 3 4 5

7/21/2019 Status Watersupply
http://slidepdf.com/reader/full/status-watersupply 842/869

7/21/2019 Status Watersupply
http://slidepdf.com/reader/full/status-watersupply 843/869

7/21/2019 Status Watersupply
http://slidepdf.com/reader/full/status-watersupply 844/869

7/21/2019 Status Watersupply
http://slidepdf.com/reader/full/status-watersupply 845/869
Metropolitan Cities1 Bangalore M.Corp. Purchase of vehicles Improving transportation 2000 2001 250000
2 Delhi M.Corp. Purchase of vehicles/ Improving collection 2000 2005 600000
Land fill Disposal/ treatment of waste2000 2010 580000
3 Surat M.Corp. Compost plant Treatment of waste 2000 2002 118550
4 Vadodara M.Corp. Purchase of vehicles Improving transportation 1999 2001 1500
CLASS I
Andhra Pradesh
1 Guntur MCl Pelletisation plant Treatment of waste 1999 1999 n.a.
2 Rajahmundry M.Corp. Bio fertilizer plant Treatment of waste 1999 2000 4000003 Tirupati MCl Compost plant Treatment of waste 1999 n.a. 10000
Gujarat
5 Anand M Purchase of vehicles Improving transportation 1998 1999 200
Purchase of vehicles Improving transportation 1998 1999 300
6 Bhuj M Purchase of vehicles Improving transportation 1998 1999 2000
7 Jamnagar M.Corp. Purchase of vehicles Improving transportation 1999 1999 1463
Purchase of vehicles Waste collection 1999 1999 1220
8 Junagadh M Purchase of vehicles Improving transportation 1999 2000 800
9 Porbandar M Purchase of vehicles Improving transportation 2000 1706
Haryana
10 Karnal MCl Purchase of vehicles Improving transportation 2000 2000 n.a.
Jammu & Kashmir
11 Srinagar M.Corp. Compost plant Treatment of waste in pipeline
Plastic Recycling Unit in pipeline
Kerala
12 Kollam MC Compost plant Treatment of waste 1999 2001 35000
13 Thalaserry M Compost plant Treatment of waste 2000 - n.a.
8 2 5
Sl. City/Town Component Purpose Year Total Co
No. started completed (Rs. in '0
1 2 3 4 5 6
C-13 : Capital Works to be Undertaken in Future

7/21/2019 Status Watersupply
http://slidepdf.com/reader/full/status-watersupply 846/869
Madhya Pradesh
14 Guna M Compost plant Treatment of waste n.a. n.a. n.a.15 Murwara-Katni M.Corp. Compost plant Treatment of waste n.a. n.a. n.a.
16 Satna M.Corp. Purchase of vehicles Improving transportation 2000 n.a. n.a.
Maharashtra
17 Wardha M Compost plant Treatment of waste n.a. n.a.
Punjab
18 Jalandhar M. Corp. Compost plant Treatment of waste 1999 2000 n.a.
19 Moga MCl Acquiring land Develop land fill 2000 2001 1600
Purchase of vehicles/ Improving collection 1999 2000 1000equipment
Rajasthan
20 Ajmer MCl n.a. Improving transportation 1999 2000 379
n.a. Improving transportation 1999 2000 15121 Bhilwara M n.a. Waste disposal 2000 2001 50000
22 Bikaner M Compost plant Treatment of waste 2001 n.a. 12000
23 Sriganganagar M Purchase of vehicles Improving transportation 2001 n.a. 240
Tamil Nadu
24 Tirunelveli M.Corp. Compost plant Treatment of waste n.a. n.a. n.a.Purchase of vehicles/ Improving collection 1999 n.a. 41400
equipment
25 Tirunvannamalai M Compost plant equipment Treatment of waste 2000 2000 54
Uttar Pradesh
26 Hardwar MB n.a. Waste disposal n.a. n.a. 77700
Small States
Assam
27 Guwahati M.Corp. Dumping ground devt. Waste disposal n.a. n.a. n.a.
Tripura
28 Agartala MCl Compost plant Treatment of waste 2000 2002 235
Source: Respective urban local governments/relevant agencies, NIUA Survey, 1999.
8 2 6
Sl. City/Town Component Purpose Year Total Cos
No. started completed (Rs. in '00
1 2 3 4 5 6

7/21/2019 Status Watersupply
http://slidepdf.com/reader/full/status-watersupply 847/869
CLASS II
Gujarat1 Gondal M Purchase of vehicles Improving transportation 1999 2000 500
2 Jetpur M Purchase of vehicles Improving transportation 1997 1999 400
3 Palanpur M Purchase of vehicles Improving transportation 1999 2000 300
Karnataka
4 Gokak CMC Compost yard Treatment of waste 2000 2001 300
5 Rabkavi-Banhatti CMC Purchase of vehicles Improving transportation n.a. n.a. n.a.
6 Ramanagaram CMC Treatment facility Treatment of waste 1999 9980
Kerala
7 Changanessary MC Compost plant Treatment of waste n.a. n.a. n.a.
8 Payyanur M Acquiring land Treatment of waste 2004 2005 16000
9 Taliparamba M Compost plant Treatment of waste 2000 2000 1000
Madhya Pradesh
10 Shahdol M Acquiring land Treatment facility n.a. n.a. n.a.
Tamil Nadu
11 Sivakasi M Purchase of vehicles Waste disposal 1999 2000 1200
12 Srivilliputtur M Acquiring land Treatment of waste 2000 2001 25
West Bengal
13 Jalpaiguri M Compost plant Treatment of waste 2000 2000 1500
Small States
Himachal Pradesh
14 Shimla M.Corp. Waste recycling plant Waste treatment n.a. n.a. n.a.Nagaland
15 Kohima TC Purchase of equipment Waste disposal 2000 2001 20000
8 2 7
Sl. City/Town Component Purpose Year Total Cos
No. started completed (Rs. in '00
1 2 3 4 5 6
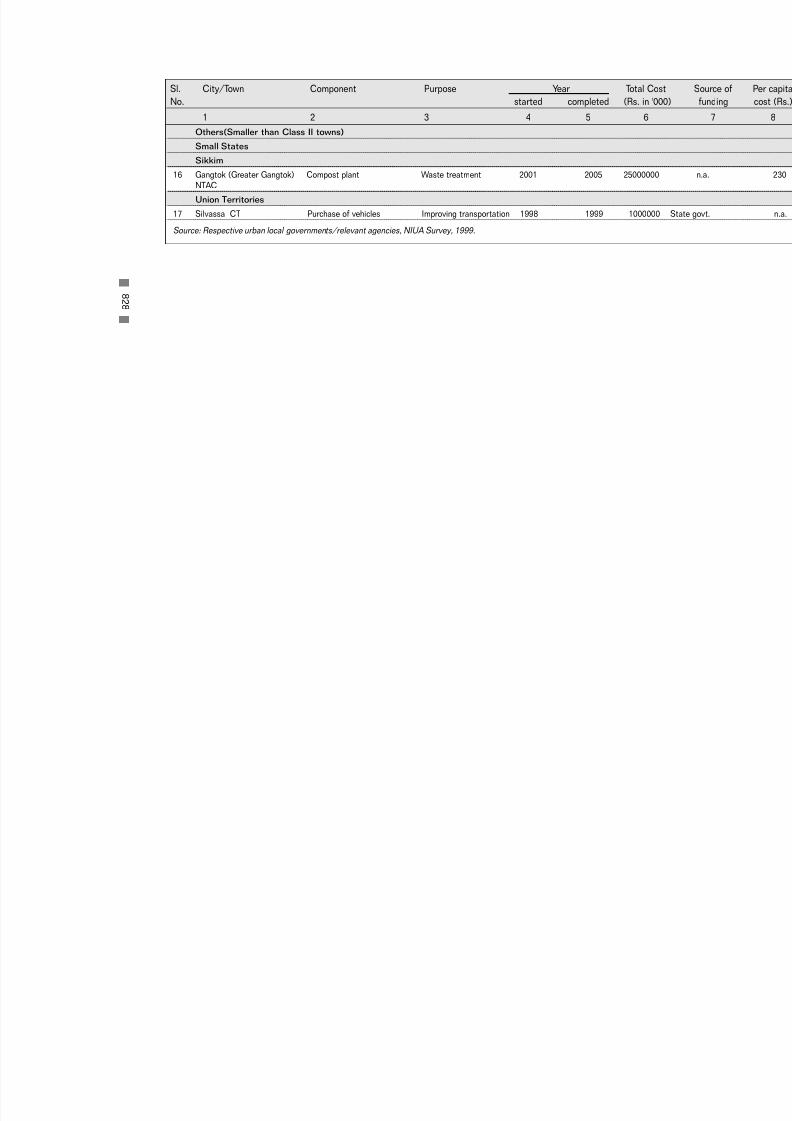
7/21/2019 Status Watersupply
http://slidepdf.com/reader/full/status-watersupply 848/869
Others(Smaller than Class II towns)
Small StatesSikkim
16 Gangtok (Greater Gangtok) Compost plant Waste treatment 2001 2005 25000000
NTAC
Union Territories
17 Silvassa CT Purchase of vehicles Improving transportation 1998 1999 1000000
Source: Respective urban local governments/relevant agencies, NIUA Survey, 1999.
8 2 8
Sl. City/Town Component Purpose Year Total Cos
No. started completed (Rs. in '00
1 2 3 4 5 6

7/21/2019 Status Watersupply
http://slidepdf.com/reader/full/status-watersupply 849/869
ANNEX 1
QUESTIONNAIRE

7/21/2019 Status Watersupply
http://slidepdf.com/reader/full/status-watersupply 850/869

7/21/2019 Status Watersupply
http://slidepdf.com/reader/full/status-watersupply 851/869
A SURVEY OF STATUS OF WATER SUPPLY AND SANITATION
IN SELECTED URBAN AREAS OF INDIA
Sponsored by
The Ministry of Urban Development
Government of India
WATER SUPPLY & SEWERAGE
Name and Designation of respondent(s) ____________________________________________________
________________________________________________________________________________________
__________________________________________________________________________________________
Name of the responding agency ____________________________________________________________
__________________________________________________________________________________________
Address of the agency ____________________________________________________________________
_________________________________________________________________________________________
__________________________________________________________________________________________
Phone nos.________________________________________________________________________________
Fax. No___________________________________________________________________________________
Stamp of the responding agency Date: ___________________________
Signature _______________________________
NATIONAL INSTITUTE OF URBAN AFFAIRS
Core 4 B, India Habitat Centre, Lodhi Road, New Delhi

7/21/2019 Status Watersupply
http://slidepdf.com/reader/full/status-watersupply 852/869

7/21/2019 Status Watersupply
http://slidepdf.com/reader/full/status-watersupply 853/869
833
4. No. of Connections
As in 1997-98 As in 1998-99
Metered Unmetered Total Metered Unmetered Total
a) Domestic _________ _________ _________ _________ _________ _________
b) Industrial & _________ _________ _________ _________ _________ _________Commercial
c) Others _________ _________ _________ _________ _________ _________
(specify)
d) Total _________ _________ _________ _________ _________ _________
e) Standpost _________ _________ _________ _________ _________ _________
5. Source Conveying main and Distribution network 1998-99
(i) (ii) (iii)
a) No. of head works ____________ ____________ ____________
b) Total raw water pumping head (m) ____________ ____________ ____________
c) Length of raw water conveying main (km.) ____________ ____________ ____________
1997-98 1998-99
d) Length of distribution network (km.) _____________ _____________
e) No. of reservoirs _____________ _____________
f) Storage capacity of reservoirs (ml) _____________ _____________
6. Source of Water
a) Present
Source of water supply Type of Designed/ Present Distance tosource: Installed quantity source
Surface/ capacity obtained (km)
ground (mld) (mld)
i) _______________ ____________ ___________ __________ __________
ii) _______________ ____________ ___________ __________ __________
iii) _______________ ____________ ___________ __________ __________
iv) _______________ ____________ ___________ __________ __________
b) Future
Are there any proposals for obtaining water from new sources? Yes/No _________If yes,
Name of source Quantity to be Distance to Anticipated year of
obtained (mld) source (km) obtaining water
i) ____________________ ______________ _______________ _________________
ii) ____________________ ______________ _______________ _________________
iii) ____________________ ______________ _______________ _________________

7/21/2019 Status Watersupply
http://slidepdf.com/reader/full/status-watersupply 854/869
834
7. Quality of Water
a) Type of treatment provided i) Alum ii) Chlorine iii) Others (specify): ______________________
b) Agency responsible for water quality monitoring: _______________________________________
i) Whether laboratory facilities are adequate? Yes/No
ii) If no, future plans for improving such facilities: _____________________________________
c) Periodicity of monitoring water quality:
i) Raw_____________________________________________________________________________
ii) Treated - At treatment plant _______________ At distribution network __________________
8. Treatment plants
a) No. of treatment plants: _____________________________________________________________
b) Total installed capacity (mld): ________________________________________________________
c) Total present production (mld): _______________________________________________________
9. Water Tariff ( Rs./ kl ) (Please also attach the latest schedule of tariff)
Domestic Industrial Commercial Institutional Others
(specify)
a) Metered ___________ __________ ____________ ___________ ________
b) Unmetered ___________ __________ ____________ ___________ ________
c) One-time water ___________ __________ ____________ ___________ ________
connection charge
d) In which year was water tariff last revised : ____________________________________________
e) Are stand posts charged for? Yes/No If yes, what is the charge (Rs.): ____________________f) Is water tax levied? Yes/ No If yes, rate of water tax ____________________________________
g) Rate of bulk water purchase: ________________________________________________________
10. Revenue Income and Expenditure on Water Supply (Actuals)
(Attach separate sheet if necessary) (Rs. in ________)
a) Heads of Revenue 1996 - 97 1997 - 98
i) Water tax __________________ __________________
ii) Water cess __________________ __________________
iii) Water charges __________________ __________________iv) Connection charges __________________ __________________
v) Bulk supply charges __________________ __________________
vi) …………………………………… __________________ __________________
vii) …………………………………… __________________ __________________
Total __________________ __________________
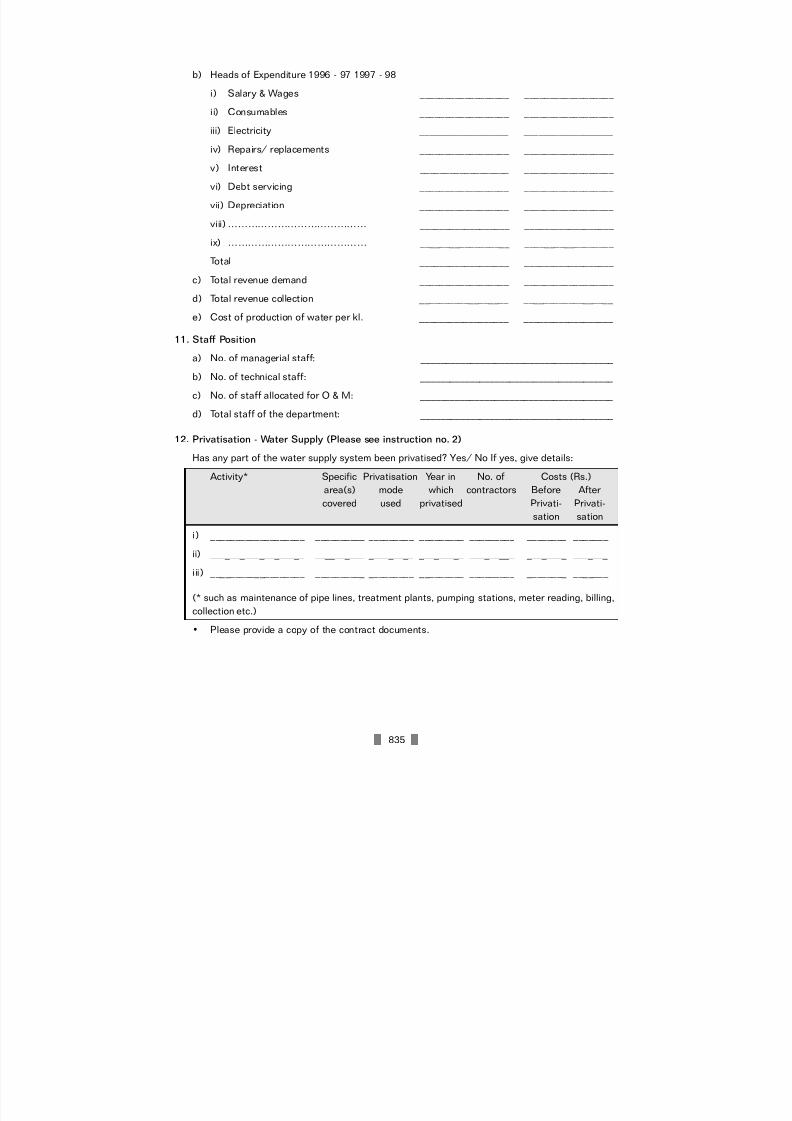
7/21/2019 Status Watersupply
http://slidepdf.com/reader/full/status-watersupply 855/869
835
b) Heads of Expenditure 1996 - 97 1997 - 98
i) Salary & Wages __________________ __________________
ii) Consumables __________________ __________________
iii) Electricity __________________ __________________
iv) Repairs/ replacements __________________ __________________
v) Interest __________________ __________________
vi) Debt servicing __________________ __________________
vii) Depreciation __________________ __________________
viii) …………………………………… __________________ __________________
ix) …………………………………… __________________ __________________
Total __________________ __________________
c) Total revenue demand __________________ __________________
d) Total revenue collection __________________ __________________e) Cost of production of water per kl. __________________ __________________
11. Staff Position
a) No. of managerial staff: _______________________________________
b) No. of technical staff: _______________________________________
c) No. of staff allocated for O & M: _______________________________________
d) Total staff of the department: _______________________________________
12. Privatisation - Water Supply (Please see instruction no. 2)
Has any part of the water supply system been privatised? Yes/ No If yes, give details:
Activity* Specific Privatisation Year in No. of Costs (Rs.)
area(s) mode which contractors Before After
covered used privatised Privati- Privati-
sation sation
i) ___________________ __________ _________ _________ _________ ________ _______
ii) ___________________ __________ _________ _________ _________ ________ _______
iii) ___________________ __________ _________ _________ _________ ________ _______
(* such as maintenance of pipe lines, treatment plants, pumping stations, meter reading, billing,collection etc.)
• Please provide a copy of the contract documents.

7/21/2019 Status Watersupply
http://slidepdf.com/reader/full/status-watersupply 856/869
836
13. Capital Works (including treatment) related to Water Supply undertaken since 1994
(Attach separate sheet if necessary)
(i) (ii) (iii)
Name of the scheme
Purpose
Components
Designed pop. ('000)
Designed capacity (mld)
Year: Started
Completed/ ongoing
Total Cost (Rs. in lakh)
Source of funding
Per capita cost (Rs.)
14. Future Schemes for Water Supply (Attach separate sheet if necessary)
(i) (ii) iii)
Name of the scheme
Purpose
Components
Designed pop. ('000)
Designed capacity (mld)
Expected year of:
StartingCompletion
Total Cost (Rs. in lakh)
Source of funding
Per capita cost (Rs.)
15. Per capita cost of schemes
a) Per capita cost of water supply scheme (including water treatment) executed in the recent
past (prior to 1999) Rs. ___________________________________
b) Per capita cost of water supply scheme (including water treatment) to be executed in the
future Rs. ___________________________________
Stamp of the Agency

7/21/2019 Status Watersupply
http://slidepdf.com/reader/full/status-watersupply 857/869
837
STATUS OF SEWERAGE AND SEWAGE TREATMENT
Name of city/ town: __________________ District: ________________ State/ U.T.: _________________
1. Sewerage
a) Does the city/ town have a sewerage system? Yes/No If yes, type of system -
i) Separate
ii) Combined with drainage
1998 - 99
b) Population covered by sewer system ('000) _______________________
c) Area covered with sewer system (sq. km.) _______________________
d) Total length of sewer lines (km.) _______________________
2. Sewage 1997-98 1998-99
a) Total installed capacity (mld) ______________ ______________
b) Total quantity of sewage generated (mld) ______________ ______________
c) Total quantity of sewage collected (mld) ______________ ______________
d) Quantity of sewage (mld) treated through:
Primary Secondary Primary & Secondary Tertiary Total
____________ ___________ ___________ ___________ ___________
e) Sewage treatment process adopted:
i) Extended aeration (oxidation ditch, aerated lagoon etc.)
ii) Trickling filters
iii) Activated sludge process iv) Up-flow anaerobic sludge blanket (UASB)
v) Others like stabilisation pond, duckweed pond etc.
f) Disposal of sewage (mld):
Land Water body Sea Total
i) Treated sewage ______________ ______________ ______________ ____________
ii) Untreated sewage ______________ ______________ ______________ ____________
Total ______________ ______________ ______________ ____________
3. Sewage Treatment Plants
a) No. of treatment plants: _____________________________________________________________
b) Total installed capacity (mld): ________________________________________________________
c) Total sewage treated (mld): __________________________________________________________

7/21/2019 Status Watersupply
http://slidepdf.com/reader/full/status-watersupply 858/869
838
4. Recycle & Reuse
Quantity of sewage (mld) used for: a) Agriculture and horticulture: _________________
b) Industrial cooling: __________________ c) Air conditioning cooling etc. :_________________
d) Flushing toilets etc._________________ e) Others (specify):____________________________
5. Sewage gas & manure
Is gas produced from sewage: Yes/No If yes,
a) Total quantity of sewage gas (cu.m) produced per day : _________________________________
b) Total quantity of sewage gas (cu.m) sold to consumers : ________________________________
c) Total quantity of sewage gas (cu.m) flared up :_________________________________________
d) Quantity of manure generated from sewage sludge (MT) :_______________________________
e) Quantity of sewage sludge sold as manure (MT) : ______________________________________
6. Sewer Connection Charge
One-time sewer connection charge for different type of connections (in Rs.):
a) Domestic: __________________________ b) Industrial: _________________________________
c) Commercial: ________________________ d) Others: ___________________________________
7. Sewage Cess/ Sewer Charges
a) Is sewage cess levied? Yes / No
b) If yes, rate at what levied: ___________________________________________________________
8. Revenue Income and Expenditure related to Sewerage & Sewage (Actuals)
(Attach separate sheet if necessary) (Rs. in …………)
a) Heads of Revenue 1996 - 97 1997 - 98
i) Recycled effluent _____________________ _____________________
ii) ewage gas _____________________ _____________________
iii) Manure _____________________ _____________________
iv) Connection charge _____________________ _____________________
v) Sewage cess _____________________ _____________________
vi) ____________________________ _____________________ _____________________
vii) ____________________________ _____________________ _____________________
Total _____________________ _____________________

7/21/2019 Status Watersupply
http://slidepdf.com/reader/full/status-watersupply 859/869
839
b) Heads of Expenditure 1996 - 97 1997 - 98
i) Salary & Wages _____________________ _____________________
ii) Consumables _____________________ _____________________
iii) lectricity _____________________ _____________________
iv) Repairs/ replacements _____________________ _____________________
v) Interest _____________________ _____________________
vi) Debt servicing _____________________ _____________________
vii) Depreciation _____________________ _____________________
viii)___________________________ _____________________ _____________________
ix) ___________________________ _____________________ _____________________
Total _____________________ _____________________
9. Staff Position
a) Agency responsible for O&M of sewer system: _________________________________________
b) No. of managerial staff: _____________________________________________________________
c) No. of technical staff: _______________________________________________________________
d) No. of staff allocated for maintenance of sewerlines: ____________________________________
e) Staff allocated for overall O&M of the system and treatment plants: _______________________
f) Total staff of the department: ________________________________________________________
10. Privatisation - Sewerage system (Please see instruction no. 2)
Has any part of the sewerage system/ treatment been privatised? If yes, give details:
Activity* Specific Privatisation Year in No. of Costs (Rs.)
area(s) mode which contractors Before After
covered used privatised Privati- Privati-
sation sation
i) ___________________ __________ _________ _________ _________ ________ _______
ii) ___________________ __________ _________ _________ _________ ________ _______
iii) ___________________ __________ _________ _________ _________ ________ _______
iv) ___________________ __________ _________ _________ _________ ________ _______
(* such as maintenance of pipelines, pumping stations, treatment plants, etc.)
• Please provide a copy of the contract documents.

7/21/2019 Status Watersupply
http://slidepdf.com/reader/full/status-watersupply 860/869
840
11. Capital Works related to Sewerage schemes (including treatment & disposal)
undertaken since 1994 (Attach separate sheet if necessary)
(i) (ii) (iii)
Name of the scheme
Purpose
Components
Designed pop. ('000)
Designed capacity (mld)
Year: Started
Completed/ ongoing
Total Cost (Rs. in lakh)
Source of funding
Per capita cost (Rs.)
12. Future Schemes for Improving Sewerage Facilities:
(i) (ii) iii)
Name of the scheme
Purpose
Components
Designed pop. ('000)
Designed capacity (mld)
Expected year of:
Starting
Completion
Total Cost (Rs. in lakh)
Source of funding
Per capita cost (Rs.)
13. Per capita cost of schemes
c) Per capita cost of sewerage scheme (including treatment & disposal) executed in the recent
past (prior to 1999) Rs. ___________________________________
d) Per capita cost of sewerage scheme (including treatment & disposal) to be executed in the
future Rs. ____________________________________________
Please provide the following:
13. Map of the city.
14. Latest Annual Report.
15. Annual Budget (should have actuals for 1997-98) of the local body.
Stamp & Signature of the Agency

7/21/2019 Status Watersupply
http://slidepdf.com/reader/full/status-watersupply 861/869
7/21/2019 Status Watersupply
http://slidepdf.com/reader/full/status-watersupply 862/869
842
A SURVEY OF STATUS OF WATER SUPPLY AND SANITATION
IN SELECTED URBAN AREAS OF INDIA
Sponsored by
The Ministry of Urban Development
Government of India
STATUS OF SOLID WASTE MANAGEMENT
Name and Designation of respondent(s) ____________________________________________________
________________________________________________________________________________________
__________________________________________________________________________________________
Name of the responding agency ____________________________________________________________
__________________________________________________________________________________________
Address of the agency ____________________________________________________________________
_________________________________________________________________________________________
__________________________________________________________________________________________
Phone nos.________________________________________________________________________________
Fax. No___________________________________________________________________________________
Stamp of the responding agency Date: ___________________________
Signature _______________________________
NATIONAL INSTITUTE OF URBAN AFFAIRS
Core 4 B, India Habitat Centre, Lodhi Road, New Delhi

7/21/2019 Status Watersupply
http://slidepdf.com/reader/full/status-watersupply 863/869
843
STATUS OF SOLID WASTE MANAGEMENT
Name of city/ town _______________ District _______________ State/ U.T _______________________
1. General
For the city/ town Within agency's jurisdiction
(as on 31-3-99)1991 1999
Census Projected Total Served
(as on 31-3-99)
a) Population ('000) _____________ _____________ _____________ _____________
b) Area (in sq. km.) _____________ _____________ _____________ _____________
c) No. of wards/zones _____________ _____________ _____________ _____________
d) Total no. of households _____________ _____________ _____________ _____________
e) Slum population ('000) _____________ _____________ _____________ _____________
2. Quantity of waste generated and collected
a) Quantity of solid waste generated per capita/day (gm) : ……………………………
b) Quantity of solid waste generated per day (MT): ……………………………………
c) Solid waste generation by source (MT per day):
Domestic Commercial Industrial Institutional Medical Others Total
________ _________ _________ _________ _________ _________ _________
d) Quantity of solid waste collected per day (MT) : _______________________________________
e) Frequency of solid waste collection per day: ___________________________________________
f) Total no. of dustbins : _______________________________________________________________
g) No. of intermediate collection centres: ________________________________________________
h) Frequency of waste collection in slums: ________________________________________________
3. Transportation of waste
a) Details of vehicles used for transportation of waste:
Type* Number Capacity Avg. no. of Total waste
(MT) trips per day transported
daily (MT)
i) ________________ __________ ___________ ___________ ________________ii) ________________ __________ ___________ ___________ ________________
iii) ________________ __________ ___________ ___________ ________________
iv) ________________ __________ ___________ ___________ ________________
v) ________________ __________ ___________ ___________ ________________
(* such as handcarts, trucks, tractors-trolleys, tippers etc.)
b) Percentage of vehicles going out of order at any point of time: ________________________________

7/21/2019 Status Watersupply
http://slidepdf.com/reader/full/status-watersupply 864/869
844
c) Does the local govt. have a vehicle maintenance workshop: Yes / No
If no, how are the vehicles repaired: ___________________________________________________
4. Disposal of waste
Quantity of solid waste (MT- average per day) treated/ disposed by:
a) Composting: _______________________ b) Controlled tipping: __________________________
c) Sanitary land fill: ___________________ d) Crude/ open dumping: ______________________
e) Incineration: _______________________ f) Other methods (specify): ____________________
______________________________________________________________________________________
5. Hospital/ medical waste
a) How is hospital/ medical waste collected: Separate / Combined with other waste
b) Is hospital/ medical waste treated: Yes / No
If yes, treatment process used : _________________________________________________________
6. Land fill
a) Existing
Name of site Area Capacity of site In use since Future life
(hectares) (tonnes per day) (year) (years)
i) ____________ ____________ _______________ ______________ ____________
ii) ____________ ____________ _______________ ______________ ____________
iii) ____________ ____________ _______________ ______________ ____________
iv) ____________ ____________ _______________ ______________ ____________
b) Future
Name of site Area Capacity of site Life
(hectares) (tonnes per day) (years)
i) ___________________ _______________ _______________ _______________
ii) ___________________ _______________ _______________ _______________
iii) ___________________ _______________ _______________ _______________
iv) ___________________ _______________ _______________ _______________
7. Composting
a) Method used (in tonnes) i) Pit composting:_____________________________
ii) Vermi composting: ______________ iii) Mechanical composting: _____________________
iv) Wind Rows: ____________________ v) Others (specify): _____________________________
b) Whether the compost is sold or not: Yes / No If yes, rate at which sold (Rs.): _______________
__________________________________________________________________________________

7/21/2019 Status Watersupply
http://slidepdf.com/reader/full/status-watersupply 865/869
845
8. Methane gas
a) Whether methane gas is produced from land fill site: Yes/No
If yes, quantity (in cu. m.) produced per year __________________________________________
b) Is the gas sold: Yes/No If yes, rate at which gas is sold (Rs.): ___________________________
9. Staff position
a) Total no. of supervisory staff (including sanitary inspectors) : ____________________________
b) Total no. of subordinate staff including sweepers etc.: ___________________________________
c) Average area/ length of road covered per sweeper: _____________________________________
10. Privatisation in solid waste management
a) Has any part of solid waste management been privatised? Yes/No
b) If yes, give details:
Activity* Specific Privatisation Year in No. of Costs (Rs.)
area(s) mode which contractors Before Aftercovered used privatised Privati- Privati-
sation sation
i) ______________ _________ _________ _________ _________ _________ _________
ii) ______________ _________ _________ _________ _________ _________ _________
• Please provide a copy of the contract documents.
c) If not, any future plans for privatisation?: Yes / No / Not sure
If yes, which aspects: _______________________________________________________________
11. Revenue Income and Expenditure (Actuals) related to Solid Waste Management
(Use separate sheet if necessary) (Rs. in ……………..)
a) Heads of Revenue 1996-97 1997-98
i) Sanitation tax/ cess* ______________________ ________________________
ii) Sale of compost ______________________ ________________________
iii) Sale of gas ______________________ ________________________
iv) _________________________ ______________________ ________________________
v) _________________________ ______________________ ________________________
Total ______________________ _______________________
* Rate of sanitation tax/ cess: ………………………………………

7/21/2019 Status Watersupply
http://slidepdf.com/reader/full/status-watersupply 866/869
846
b) Heads of Expenditure 1996-97 1997-98
i) Salary and wages _______________________ ______________________
ii) Consumables (petrol, diesel etc.) _______________________ ______________________
iii) Vehicle repair _______________________ ______________________
iv) Contingency _______________________ ______________________
v) ___________________________ _______________________ ______________________
vi) ___________________________ _______________________ ______________________
Total _________________________ ______________________
12. Capital Expenditure incurred on Solid Waste Management since 1994
(Use separate sheet if necessary)
Name of the scheme/ Purpose Year Total Source Per capitaExpenditure Head Started Completed/ Cost of cost of
ongoing (Rs.) funding scheme
(Rs.)
i) ________________ _________ ________ ________ _______ _________ __________
ii) ________________ _________ ________ ________ _______ _________ __________
iii) ________________ _________ ________ ________ _______ _________ __________
• Please provide project proposal/ report.
13. Future schemes
Name of the scheme/ Purpose Expected year of Total Source Per capita
Expenditure Head Starting Comple- Cost of cost of
tion (Rs.) funding scheme
(Rs.)
i) ________________ _________ _________ ________ ________ _________ __________
ii) ________________ _________ _________ ________ ________ _________ __________
iii) ________________ _________ _________ ________ ________ _________ __________
• Please provide project proposal/ report.

7/21/2019 Status Watersupply
http://slidepdf.com/reader/full/status-watersupply 867/869
847
SANITATION
Septic Tank and Low Cost Sanitation (LCS)
1998-99
1. Population covered by septic tanks ('000): ______________________________________
2. Population covered by LCS ('000): ______________________________________
3. No. of individual pour flush latrines:
a) Existing ______________________________________
b) Under construction ______________________________________
c) To be constructed ______________________________________
4. No. of community latrines:
a) Existing ______________________________________
b) Under construction ______________________________________
c) To be constructed ______________________________________
5. No. of dry latrines:
a) Existing ______________________________________
b) Under conversion ______________________________________
c) To be converted ______________________________________
6. Population using dry latrines: ______________________________________
7. Population provided with LCS facility,
but not using the same: ______________________________________
8. No. of scavengers:
a) Public ______________________________________
b) Private ______________________________________
Stamp of the agency

7/21/2019 Status Watersupply
http://slidepdf.com/reader/full/status-watersupply 868/869

7/21/2019 Status Watersupply
http://slidepdf.com/reader/full/status-watersupply 869/869


