

Supplementary Figures
Supplementary Figure S1 Steam etching process used to create porous structures. Hot vapor was applied to
the PDMS prepolymer surface, and the porous structures polymerized immediately under the hot vapor without
the need for an extra thermal curing process.

Supplementary Figure S2 Characteristics of Porous PDMS thin membrane. (a) Deep porous PDMS surface.
The depth could be regulated by the steam pressure and changes in the viscoelastic properties of the prepolymer
PDMS. (b) Semi-transparent characteristics of the porous structure. (c) Comparison of mechanical property of
the porous and bulk PDMS (elongation and thermal expansion).
100µm
a
b Porous PDMS membrane
10 mm
c

Supplementary Figure S3 FTIR spectrum of a normal PDMS sample (cured on a hot plate for 2 hours) and
a steam-etched PDMS sample. No significant differences were observed.
2905, -Si(CH3)2
2960, -Si(CH3)2
1410, Si-CH=CH2

Supplementary Figure S4 Resistance changes during the cycling tests. The data supports the hysteresis
measurements shown in Fig 2a.
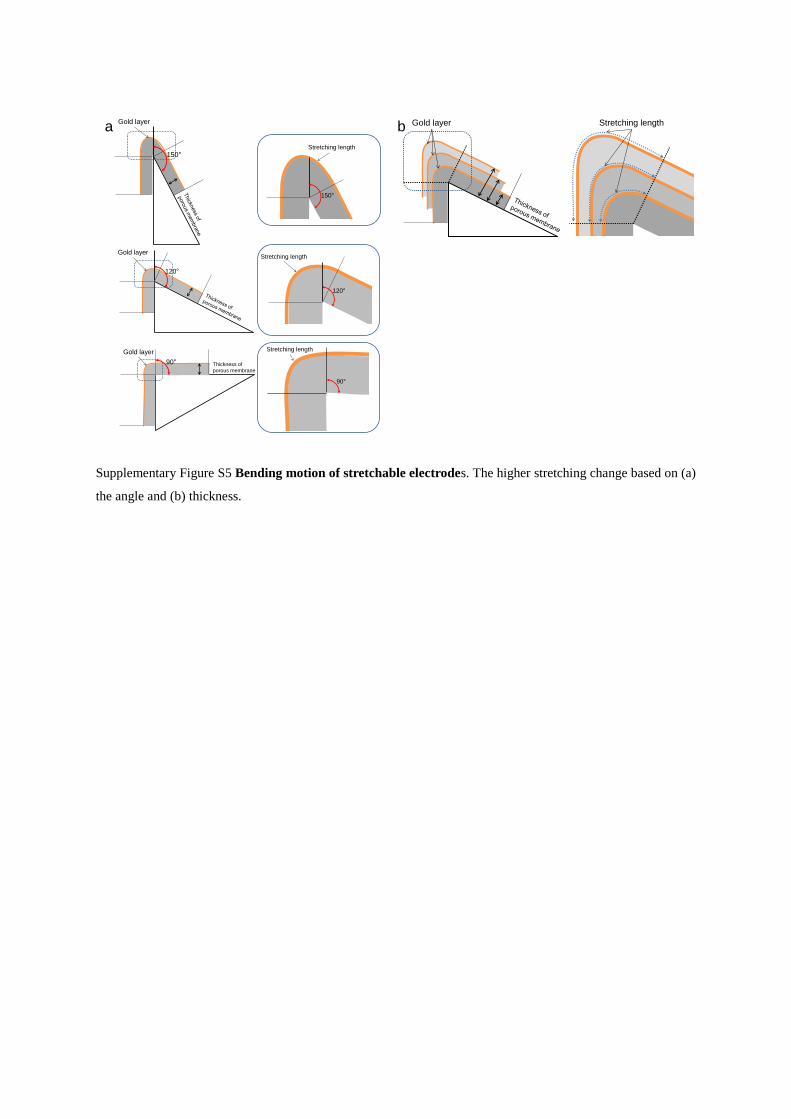
Supplementary Figure S5 Bending motion of stretchable electrodes. The higher stretching change based on (a)
the angle and (b) thickness.
b Gold layer Stretching lengtha
Thickness of
porous membrane
Gold layer
90°
Stretching length
90°
Gold layer
120°
Stretching length
120°
Stretching length
150°
Gold layer
150°
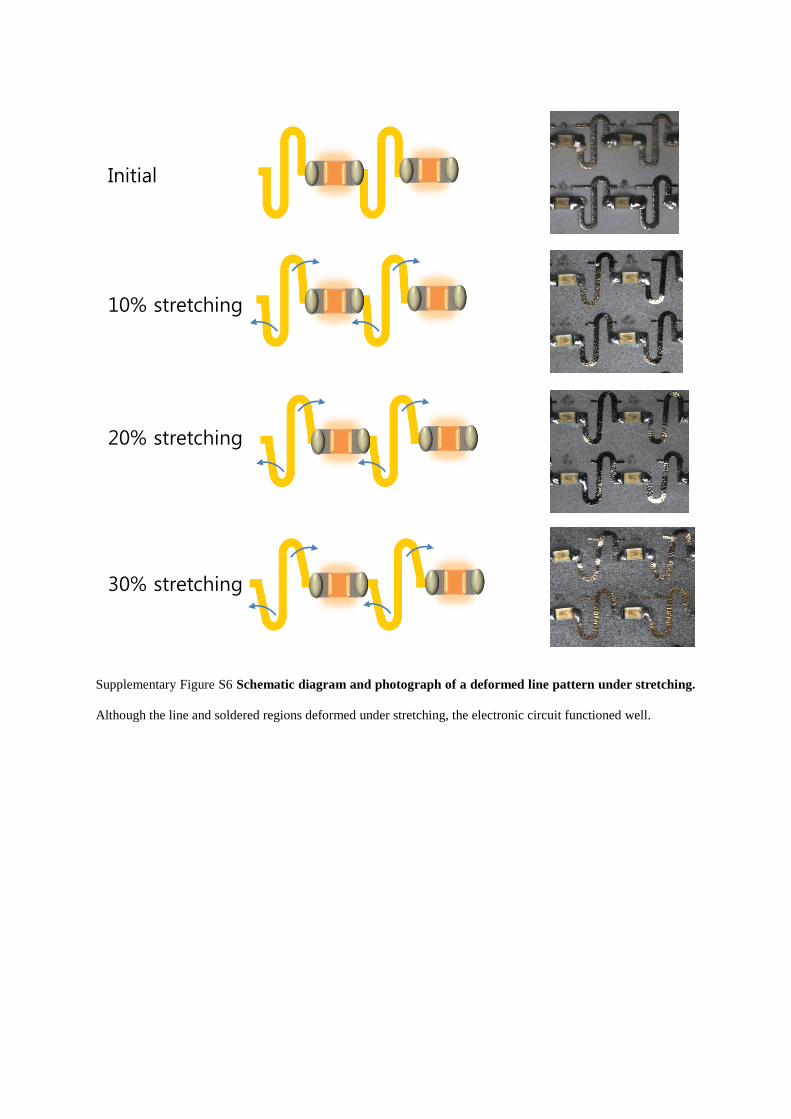
Supplementary Figure S6 Schematic diagram and photograph of a deformed line pattern under stretching.
Although the line and soldered regions deformed under stretching, the electronic circuit functioned well.
Initial
10% stretching
20% stretching
30% stretching
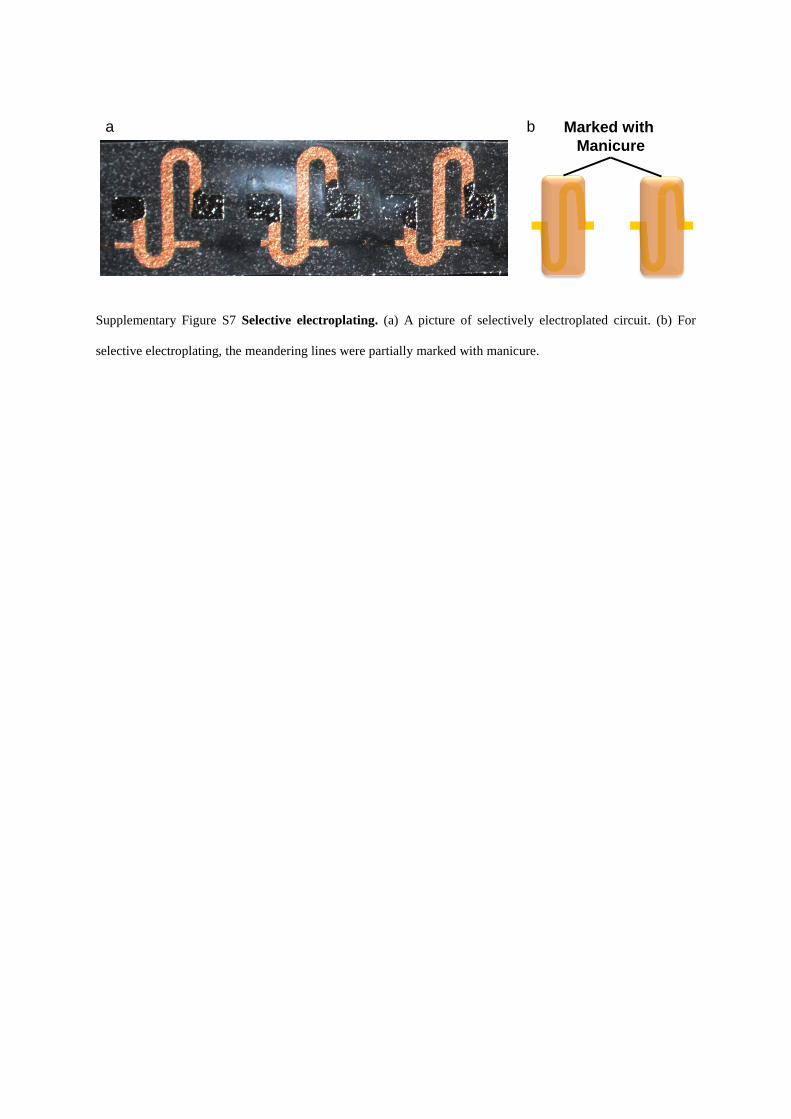
Supplementary Figure S7 Selective electroplating. (a) A picture of selectively electroplated circuit. (b) For
selective electroplating, the meandering lines were partially marked with manicure.
a Marked with
Manicure
b
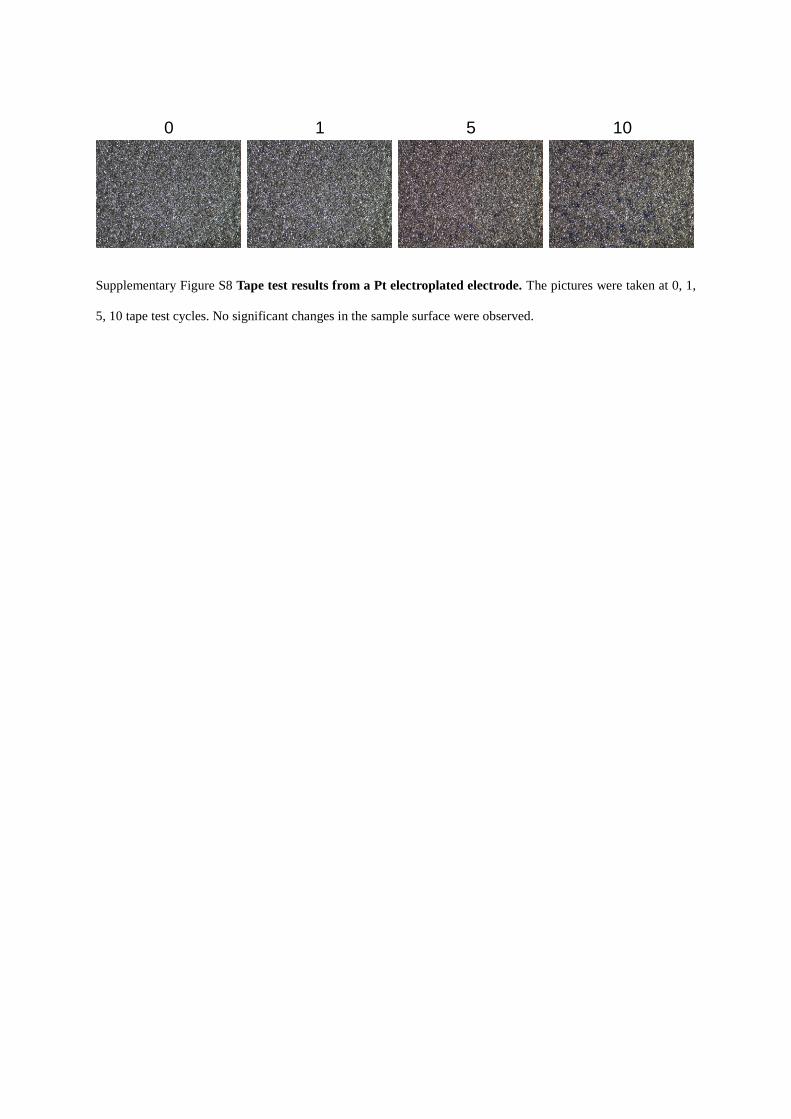
Supplementary Figure S8 Tape test results from a Pt electroplated electrode. The pictures were taken at 0, 1,
5, 10 tape test cycles. No significant changes in the sample surface were observed.
0 1 5 10
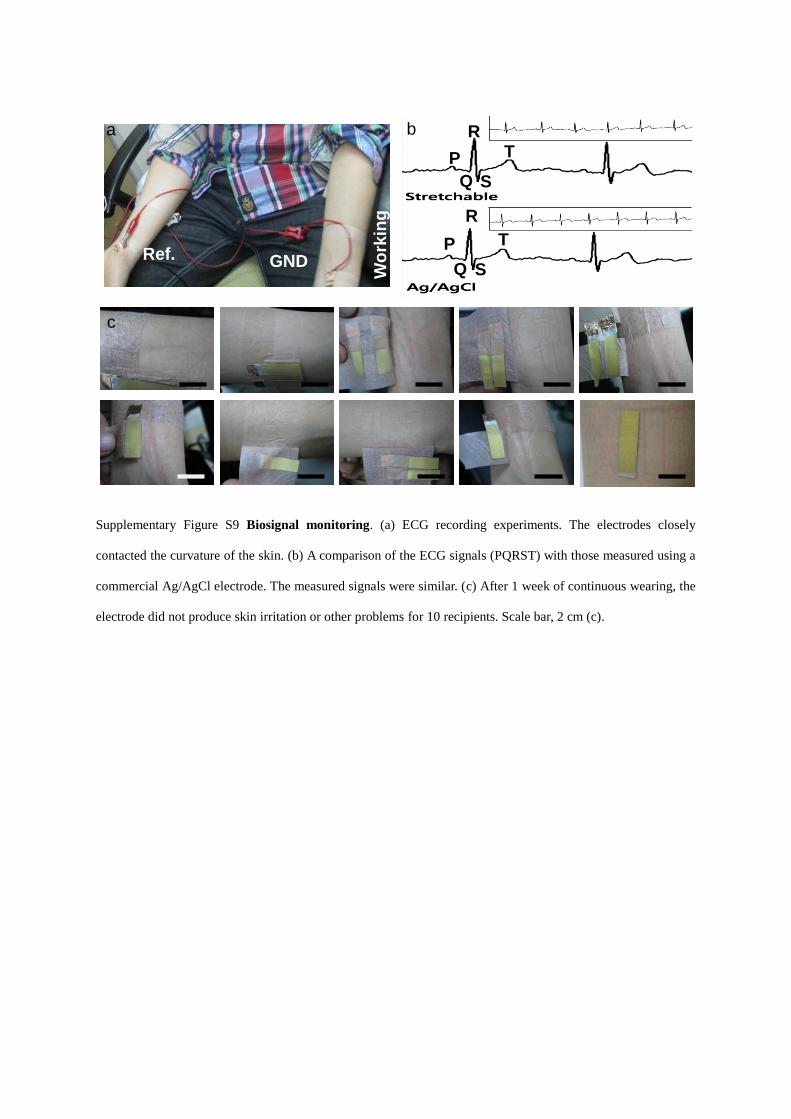
Supplementary Figure S9 Biosignal monitoring. (a) ECG recording experiments. The electrodes closely
contacted the curvature of the skin. (b) A comparison of the ECG signals (PQRST) with those measured using a
commercial Ag/AgCl electrode. The measured signals were similar. (c) After 1 week of continuous wearing, the
electrode did not produce skin irritation or other problems for 10 recipients. Scale bar, 2 cm (c).
Ref.
Wo
rkin
g
GND
a
P
Q
R
S
T
b
P
Q
R
S
T
c
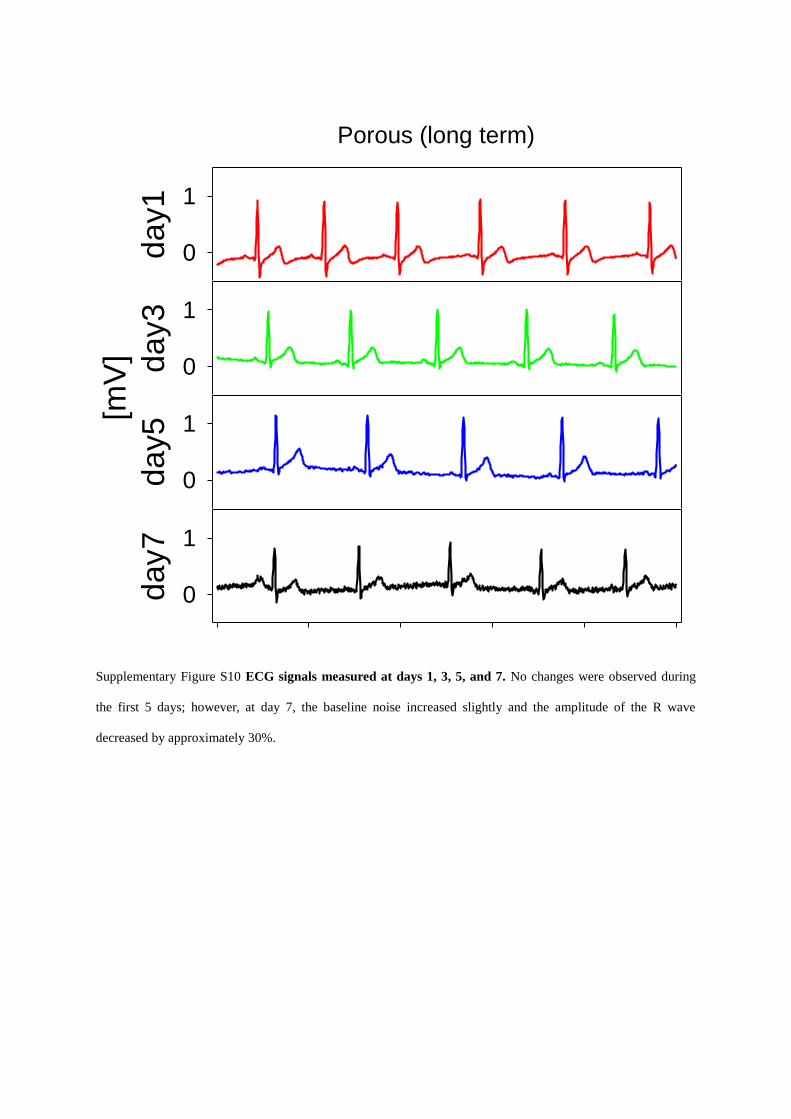
Supplementary Figure S10 ECG signals measured at days 1, 3, 5, and 7. No changes were observed during
the first 5 days; however, at day 7, the baseline noise increased slightly and the amplitude of the R wave
decreased by approximately 30%.
da
y1
0
1
da
y3
0
1
da
y5
0
1
da
y7
0
1
[mV
]Porous (long term)

Supplementary Figure S11 H&E stained tissue after long-term implantation of the porous PDMS in a
mouse for 1, 2, 4 and 8 weeks. Scale bar, 100 μm.
1week
2week
4week
8week
Supplementary Tables
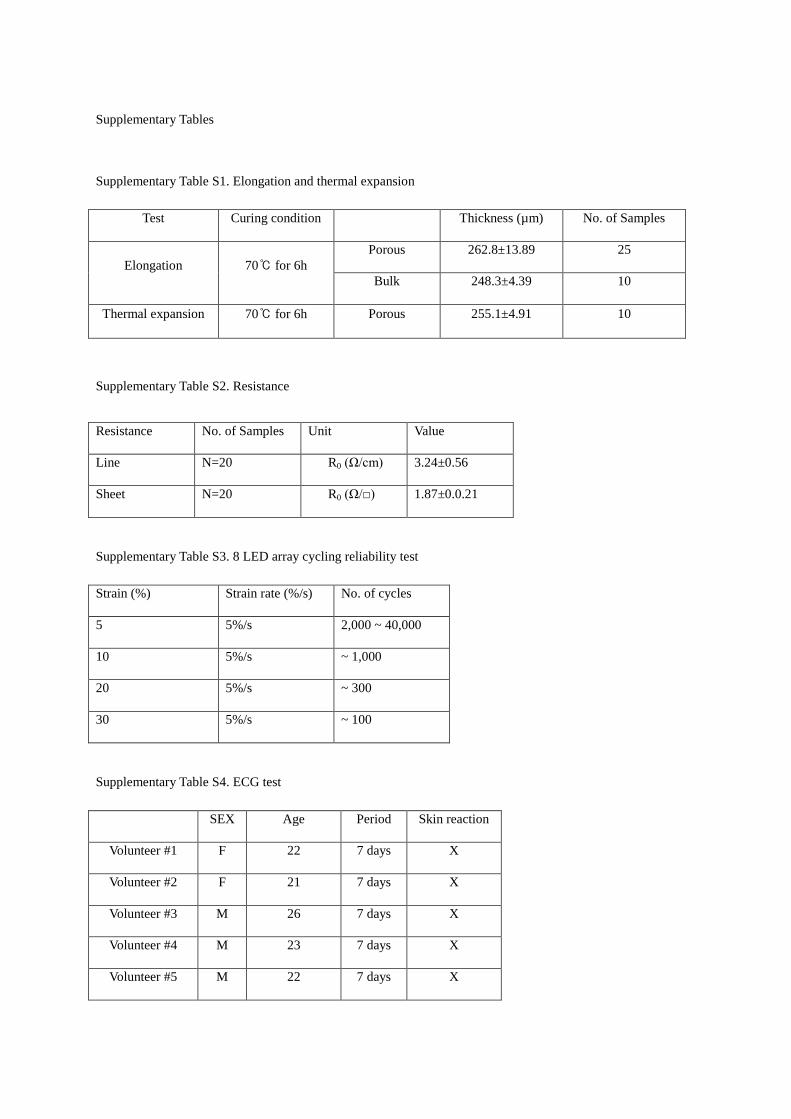
Supplementary Table S1. Elongation and thermal expansion
Test Curing condition Thickness (µm) No. of Samples
Elongation 70℃ for 6h
Porous 262.8±13.89 25
Bulk 248.3±4.39 10
Thermal expansion 70℃ for 6h Porous 255.1±4.91 10
Supplementary Table S2. Resistance
Resistance No. of Samples Unit Value
Line N=20 R0 (Ω/cm) 3.24±0.56
Sheet N=20 R0 (Ω/□) 1.87±0.0.21
Supplementary Table S3. 8 LED array cycling reliability test
Strain (%) Strain rate (%/s) No. of cycles
5 5%/s 2,000 ~ 40,000
10 5%/s ~ 1,000
20 5%/s ~ 300
30 5%/s ~ 100
Supplementary Table S4. ECG test
SEX Age Period Skin reaction
Volunteer #1 F 22 7 days X
Volunteer #2 F 21 7 days X
Volunteer #3 M 26 7 days X
Volunteer #4 M 23 7 days X
Volunteer #5 M 22 7 days X

Volunteer #6 M 28 7 days X
Volunteer #7 M 25 7 days X
Volunteer #8 M 21 7 days X
Volunteer #9 M 20 7 days X
Volunteer #10 M 25 7 days X
Mean 23.3 ± 2.45
Supplementary Table S5. Strain test
Strain test Strain rate Figure
10 % 5%/s Fig. 2 a & b
20% 5%/s Fig. 2 a & b
30% 5%/s Fig. 2 a & b
80% Manually Fig.2 c
Supplementary Table S6. Bending test
Test Thickness (µm) No. of Samples
Bending test
236.5±4.8 8
349.8±15.31 8
412.18±14.72 8
Supplementary Table S7. Elongation and thermal expansion
Test Curing condition Thickness (µm) No. of Samples
Elongation 70oC for 6h
Porous 262.8±13.89 25
Bulk 248.3±4.39 10
Thermal expansion 70oC for 6h Porous 255.1±4.91 10
Supplementary Table S8. Resistance comparison

Ref. Material R0
R. Carta31
Cu foil meandering 0.94~2.23 (Ω/cm)
F. Axisa16
Cu foil meandering 0.8~1.3 (Ω/cm)
S. Rosset36
Au(sputtering),
Au (implant)
17 (Ω/□)
34~398 (Ω/□)
L. Hu37
SWNT ≤ 1.0 (Ω/□)
S. Lacour38
Au (wavy line) 35~320 (Ω/cm)
M. Urdaneta25
Pt salt mixture 2.2(Ω/□)
Our study Ti-Au (evaporation) 3.24±0.56 (Ω/cm)
1.87±0.21 (Ω/□)


