
APPLICATION NOTE NEUTRAL SIZING IN HARMONIC-RICH INSTALLATIONS
Stefan Fassbinder
May 2012
ECI Publication No Cu0153
Available from www.leonardo-energy.org/node/144091

Publication No Cu0153
Issue Date: May 2012
Page 1
Document Issue Control Sheet
Document Title: Application Note – Neutral Sizing in Harmonic-rich Installations
Publication No: Cu0153
Issue: 02
Release: May 2012
Author(s): Stefan Fassbinder
Reviewer(s): David Chapman
Document History
Issue Date Purpose
1 June 2003 Initial publication on Leonardo Energy
2 May 2012 Reworked version for publication in the Good Practice Guide
3
Disclaimer
While this publication has been prepared with care, European Copper Institute and other contributors provide
no warranty with regards to the content and shall not be liable for any direct, incidental or consequential
damages that may result from the use of the information or the data contained.
Copyright© European Copper Institute.
Reproduction is authorised providing the material is unabridged and the source is acknowledged.
Publication No Cu0153
Issue Date: May 2012
Page 2
CONTENTS
Summary ........................................................................................................................................................ 3
Introduction .................................................................................................................................................... 3
Normative situation ........................................................................................................................................ 3
Theoretical background .................................................................................................................................. 4
Procedure in situations not previously covered by the standards ................................................................... 8
Note on the RMS value ........................................................................................................................................... 8
Procedure for calculating capacity ....................................................................................................................... 10
Further influencing factors ................................................................................................................................... 11
Alternatives........................................................................................................................................................... 12
Practical guidelines ....................................................................................................................................... 13
Example values ..................................................................................................................................................... 13
Implementation in practice .................................................................................................................................. 14
Notes ................................................................................................................................................................ 15
Numerical example ............................................................................................................................................... 16
Special information....................................................................................................................................... 17
In cables and wiring: short-circuit current calculation ......................................................................................... 17
In transformers ..................................................................................................................................................... 17
Conclusion .................................................................................................................................................... 17
References .................................................................................................................................................... 18

Publication No Cu0153
Issue Date: May 2012
Page 3
SUMMARY Both national and international standards for the conductor sizing of cables do not adequately take into
account the additional heat load arising from harmonic currents. Some standards prescribe the maximum
current values for four-conductor and five-conductor cables under the assumption that only two or three
conductors are loaded. However, today’s harmonic situations may give rise to the fourth conductor (neutral)
being fully loaded or even overloaded simultaneously with a balanced load on the three phase conductors.
Other standards provide a general instruction that under a particular harmonic impact on the phase
conductors, a certain additional load has to be taken into account for sizing the neutral conductor. However,
the practitioner will usually not know how much harmonic impact arises from a particular load or group of
loads.
In the following application note, an approach will be given to estimate the additional thermal impact due to
harmonic currents in the LV power supply system of a building. Based on this estimation, it provides a
methodology on how to dimension and select three-phase cables that are supposed to feed single-phase final
circuits containing distorting loads.
INTRODUCTION If three A.C. circuits are formed from a three-phase system at the end-user to feed single-phase loads, as is
normally the case in any household or office, an effort is made to distribute these loads evenly across the
three phases.
However, it has long been known that currents, the curve shapes of which are not sinusoidal, at most partly
cancel each other out in the return, and there has been much discussion of consequences and measures.
There have been sporadic reports of neutral conductors burning out. Nevertheless, how relevant are these
unquestionably existing effects in the average usage scenario, and how should the planner handle them?
NORMATIVE SITUATION Unfortunately, when the newly revised standard VDE 0298-4 was published in August 2003, these
circumstances, which were known at the time, had again not been taken into consideration. This standard
gives a variety of values for the current-carrying capacity of cables and wiring of various cross-sections for
different layouts and grouping factors, although as in the previous version, limit values are only given for
cables and wiring with either two or three loaded wires. Once again no account was taken of the fact that
today four wires can also be loaded simultaneously in a five-core cable, since despite the balanced distribution
of the single-phase loads the neutral can conduct additional current – and in extreme cases too much current.

Publication No Cu0153
Issue Date: May 2012
Page 4
Figure 1 – With a balanced three-phased load the neutral current is zero – provided the loads are linear with
sinusoidal currents
This shortcoming is shortly covered by Annex E of IEC 60364-5-52 and now stands to be put right in a
somewhat more detailed way with the publication of supplementary sheet 3 to VDE 0100-520, which shows
the planner how the cables and wiring should be selected and measured if a neutral load is to be expected.
Above all, the planner should be put in a position to assess whether such a risk exists at all, and if so, to what
extent. The approach adopted there corresponds approximately to the observations below.
THEORETICAL BACKGROUND In a star-connected three-phase system, the current in the neutral conductor is the vector sum of the three
line currents. With a balanced three-phase system, this sum is zero at any point in time and the neutral current
is therefore zero, provided the loads are linear (figure 1). These involve a sinusoidal voltage that always results
in a sinusoidal (or cosinusoidal) current curve, in other words ohmic, inductive, capacitive and their hybrid
forms. Now, a vector sum can only be formed from sine and cosine curves, since simply put, vectors have
something to do with angles, and sine and cosine are angle functions. However, other curve shapes can be
divided into an infinite sum of sine curves, the so-called harmonics, the frequencies of which are integral
multiples of the “fundamental frequency” to be depicted. Vector analysis must therefore be carried out for
each of these sine oscillations individually, including the fundamental.
Publication No Cu0153
Issue Date: May 2012
Page 5
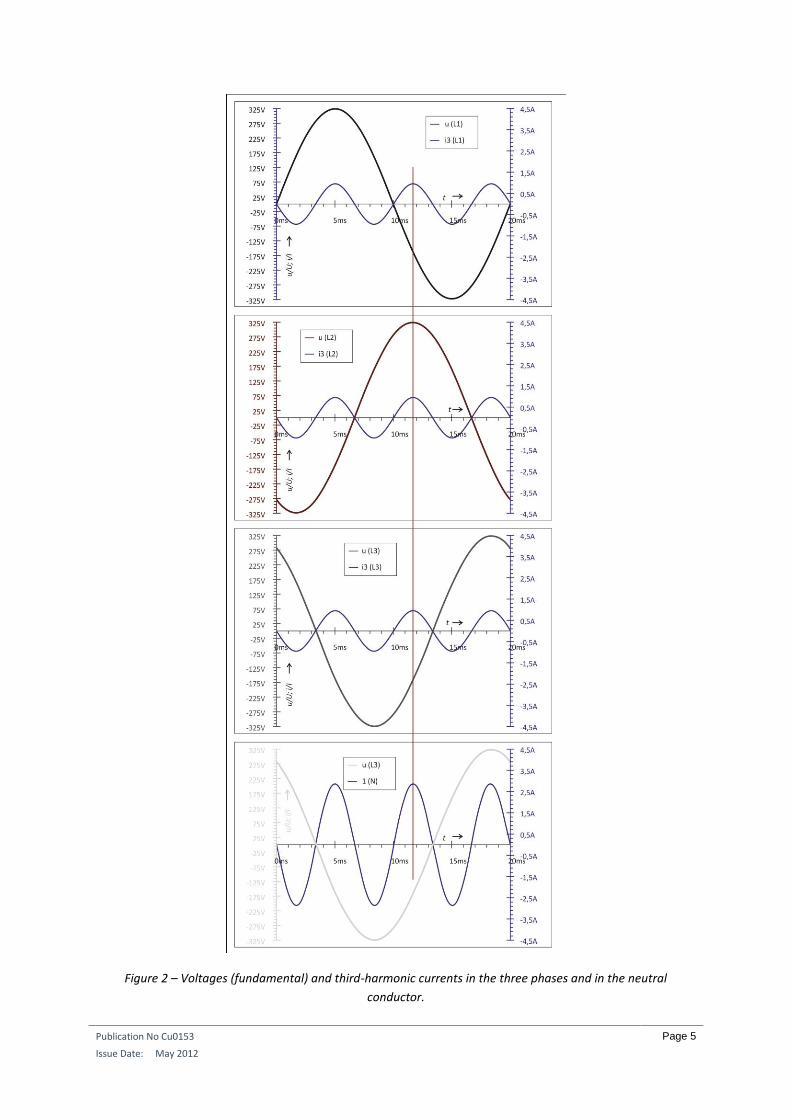
Figure 2 – Voltages (fundamental) and third-harmonic currents in the three phases and in the neutral
conductor.

Publication No Cu0153
Issue Date: May 2012
Page 6
Figure 3 – Phase-angle dimmer with ohmic load (100 W lamp), truncated by 120° (60° conductive angle only):
balanced 0.19 A in each phase, but almost 0.33 A in the neutral.

Publication No Cu0153
Issue Date: May 2012
Page 7
No, this does not require interminable effort, since the amplitudes of these partial oscillations become smaller
and smaller towards higher frequencies and therefore lose their practical significance relatively quickly. It is
then possible to stop adding together. That’s the good news.
The bad news is that the phase sequence and phase angle of these harmonics do not necessarily correspond to
those of the (line-frequency) fundamental. In part they have the opposite direction of rotation, and those
harmonic numbers that are multiples of three, i.e. primarily the third (150 Hz) and ninth (450 Hz), have no
direction of rotation at all, but are in phase in all three phase conductors (figure 2). The even-order harmonics
(100 Hz, 200 Hz, 300 Hz, etc.) only occur with unbalanced curve shapes such as one-way rectification and
therefore rarely occur in practical techniques.
Figure 4 – With an unbalanced three-phase load the neutral current is not zero, but it is smaller than the
biggest phase current.

Publication No Cu0153
Issue Date: May 2012
Page 8
Figure 5 – With a non-linear, albeit balanced, three-phase load the neutral current is not zero and can even be
larger than the phase current because of the zero phase-sequence system.
In a three-phase system feeding single-phase loads the neutral current is rarely zero because the load on each
phase is more or less different. Typically, however, the difference is small, and in any case far lower than the
biggest phase currents (figure 4). Where non-linear loads are being supplied, however, even when the load is
well balanced across the 3 phases, even with the same RMS values and phase angles of the phase currents,
there is likely to be substantial current in the neutral conductor (figure 5). For example, three currents with
equal RMS values and square shape will result in a significant neutral current, proportionally to the phase
current all the more so, the smaller the conductive angle, i.e. the more acute the triangle.
PROCEDURE IN SITUATIONS NOT PREVIOUSLY COVERED BY THE STANDARDS Under the conditions of current distortion described, heat loss in the conductors is greater than under the
linear conditions assumed in the standards, and the line capacity is correspondingly lower. Neutral conductors,
often previously undersized, as can often still be found in buildings, can be overloaded without the neutral
current reaching the phase current at all.
It is impossible to determine the neutral current unless the real or theoretical wave form of the load currents
is known. However, as an approximation the neutral current can be assumed to be around 1.6 times the phase
current (figure 6) in the case of rectifier loads such as smaller compact fluorescent discharge lamps, including
LED lamps in the range up to a rated power of 25 W, but can also reach its theoretical maximum value of 1.73
times the phase current in the worst situations, e.g. with phase controls set to small delay angles (α ≥ 120°, see
figure 3).
NOTE ON THE RMS VALUE
The arithmetic mean value of the neutral current in figure 3 is even 3 times each phase current, as can be seen
by simply adding the current/time areas. Since these processes do not reveal any temporal overlaps of the

Publication No Cu0153
Issue Date: May 2012
Page 9
three phase currents, quantitative addition takes place. Only if phase currents partially or entirely overlap in
time, in other words if the incoming current of a phase simultaneously forms the reverse current of another
phase, can a full or partial extinction of the phase currents in the neutral occur. However, the RMS value of the
neutral current, which appears without overlaps, is determined by the factor √3, by which the phase current
must be multiplied; whereas the arithmetic mean value is determined with the factor 3. However, the measure
for the thermal load of a line is the RMS value.
Figure 6 – Operation of 21 W compact fluorescent discharge lamps (“energy-saving lamps”) – at the top one
lamp connected in single-phase, in the middle two lamps connected in two-phase, at the bottom three lamps
connected in three-phase; voltage L1 against N and current in neutral recorded.
In principle, with compact fluorescent discharge lamps with a rated power greater than 25 W, only a small
harmonic load on the network need be taken into account (figure 7), since according to EN 61000-3-2:2010-03
significantly lower limits apply here, so that an appreciable additional load of the neutral beyond the single-
phase loads caused by unbalanced distribution no longer need be taken into account. In practice, it should be
noted that in particular new components such as LED lamps often do not satisfy this requirement – and others,
or the requirement is bypassed “quite legally”, for example by using two 24 W lamps instead of one 48 W
lamp. The type and number of lamps operated is therefore decisive. It is less helpful, for example, to fit the
popular quadruple lamps in a commercial building with 4 fluorescent discharge lamps each of 18 W with 4
individual EBs (electronic ballasts) instead of using 2 double EBs or one quadruple EB, to keep the individual
power of the appliances < 25 W per EB and bypass the stricter normative limits. Besides, it is better to use

Publication No Cu0153
Issue Date: May 2012
Page 10
IMBs (improved inductive / magnetic ballasts), a combination of tandem and lead-lag wiring and electronic
starters, despite these being frequently but incorrectly deemed to be inefficient. Such a system, with some
2400 lights, i.e. 9600 lamps, 9600 starters, 4800 IEBs and 2400 capacitors, has now been running for 5 years
without a single outage – no lamp, no IEB, no starter and no capacitor [1] has yet failed.
Figure 7 – 30 W compact fluorescent discharge lamp – modern, compliance replacement for an incandescent
lamp of around 150 W.
PROCEDURE FOR CALCULATING CAPACITY
To calculate the capacity of a 4- or 5-conductor cable with a neutral loaded by harmonic currents, the THDI
(total harmonic distortion) of the current must first be determined. This is the ratio of the total RMS value of
all harmonics contained in the load current to the fundamental, in other words to the line-frequency sinusoidal
part of the total load current. The load current from VDE 0295 should then be multiplied by the following
correction factors (Table 1):
For phase currents containing up to 15% THDI, no corrective measures are required. Under these
circumstances, the neutral current might be expected to be up to 45% of the phase current, and an
increase of about 6% in heat loss across the entire cable compared to the normal cable rating. This
excess is normally tolerable.
For phase currents containing 15% to 33% THDI, the neutral current may be expected to be similar to
the phase current, and the cable must be de-rated by a factor of 0.86. In other words, for a current of
20 A, a cable capable of carrying 23.25 A would be selected.
Harmonic content THDI in the phase conductor current
Value selected according to
Phase conductor
current
Neutral conductor
current
0% … 15% 1 -
15% … 33% 0.86 -
33% … 45% - 0.86
>45% - 1
Table 1 – Reduction factors for cables carrying harmonic currents.
As soon as the THDI exceeds 33%, the cable must be selected based on the neutral current. For phase
currents containing 33% to 45% THDI, the cable size is determined by the neutral current, and the
load is to be reduced by a factor of 0.86.
For even higher harmonic components, the cable size is determined solely by the neutral current.
There is no need for a correction factor because the phase conductors are now over-sized, and
Publication No Cu0153
Issue Date: May 2012
Page 11
therefore generate correspondingly less heat, which balances out the overload on the neutral.
However, the question is when and where such high harmonic components ever occur in practice.
At the same time, in the case of THDI as when measuring power, care must be taken to ensure that the correct
current is assigned to the correct voltage. In figure 6 bottom right, for example, this is not the case, since there
the focus was on the neutral current. However, the measuring device is still triggered by the mains voltage of
50 Hz. The measuring device interprets this as the fundamental, but with a balanced distribution of the loads
in the N-current no longer finds any 50 Hz component. The 50 Hz components still cancel each other out; only
for the harmonic components does this not apply. The instrument therefore thinks that the current can only
be a distortion current, as there is no longer a fundamental current, and displays a THDI of almost 100%.
Obviously that cannot be true. Rather, the N-current only has a fundamental of 150 Hz, and its harmonics of
450 Hz, 1350 Hz, etc. in turn make up its THDI. Had the measuring device’s voltage circuit been disconnected,
the device would automatically have switched to current triggering, not found any further oscillation of 50 Hz
and deemed 150 Hz to be the fundamental. That, however, was not the object under consideration (figure 6).
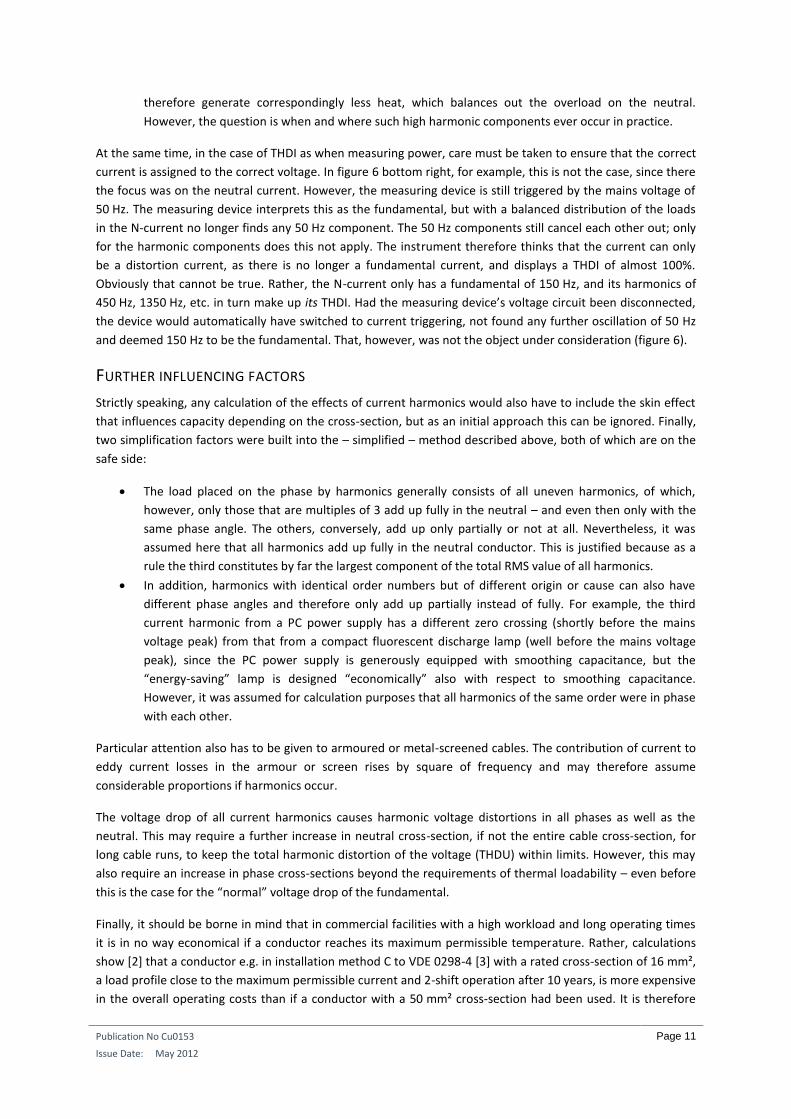
FURTHER INFLUENCING FACTORS
Strictly speaking, any calculation of the effects of current harmonics would also have to include the skin effect
that influences capacity depending on the cross-section, but as an initial approach this can be ignored. Finally,
two simplification factors were built into the – simplified – method described above, both of which are on the
safe side:
The load placed on the phase by harmonics generally consists of all uneven harmonics, of which,
however, only those that are multiples of 3 add up fully in the neutral – and even then only with the
same phase angle. The others, conversely, add up only partially or not at all. Nevertheless, it was
assumed here that all harmonics add up fully in the neutral conductor. This is justified because as a
rule the third constitutes by far the largest component of the total RMS value of all harmonics.
In addition, harmonics with identical order numbers but of different origin or cause can also have
different phase angles and therefore only add up partially instead of fully. For example, the third
current harmonic from a PC power supply has a different zero crossing (shortly before the mains
voltage peak) from that from a compact fluorescent discharge lamp (well before the mains voltage
peak), since the PC power supply is generously equipped with smoothing capacitance, but the
“energy-saving” lamp is designed “economically” also with respect to smoothing capacitance.
However, it was assumed for calculation purposes that all harmonics of the same order were in phase
with each other.
Particular attention also has to be given to armoured or metal-screened cables. The contribution of current to
eddy current losses in the armour or screen rises by square of frequency and may therefore assume
considerable proportions if harmonics occur.
The voltage drop of all current harmonics causes harmonic voltage distortions in all phases as well as the
neutral. This may require a further increase in neutral cross-section, if not the entire cable cross-section, for
long cable runs, to keep the total harmonic distortion of the voltage (THDU) within limits. However, this may
also require an increase in phase cross-sections beyond the requirements of thermal loadability – even before
this is the case for the “normal” voltage drop of the fundamental.
Finally, it should be borne in mind that in commercial facilities with a high workload and long operating times
it is in no way economical if a conductor reaches its maximum permissible temperature. Rather, calculations
show [2] that a conductor e.g. in installation method C to VDE 0298-4 [3] with a rated cross-section of 16 mm²,
a load profile close to the maximum permissible current and 2-shift operation after 10 years, is more expensive
in the overall operating costs than if a conductor with a 50 mm² cross-section had been used. It is therefore
Publication No Cu0153
Issue Date: May 2012
Page 12
more economical to always assume the largest conceivable THDI, even if no THDI at all subsequently occurs in
actual operation. This not only applies to cost-effectiveness, but the other performance characteristics of the
installation, such as voltage drop, are also improved as a result.
ALTERNATIVES
The most direct way to proceed is independent sizing of the neutral conductor. When using single-core cables
the choice of the neutral and phase conductor cross-sections becomes independent. On the other hand, the
mutual thermal interaction is more difficult to model analytically because of the varying relative positions.
Duplicate logistics also become necessary, for instance for clamp and plug connections of two different sizes.
As a rule it is better to use the aforementioned benefits of over-sized phase conductors and therefore to
always select these conductors to be as strong as the neutral has to be.
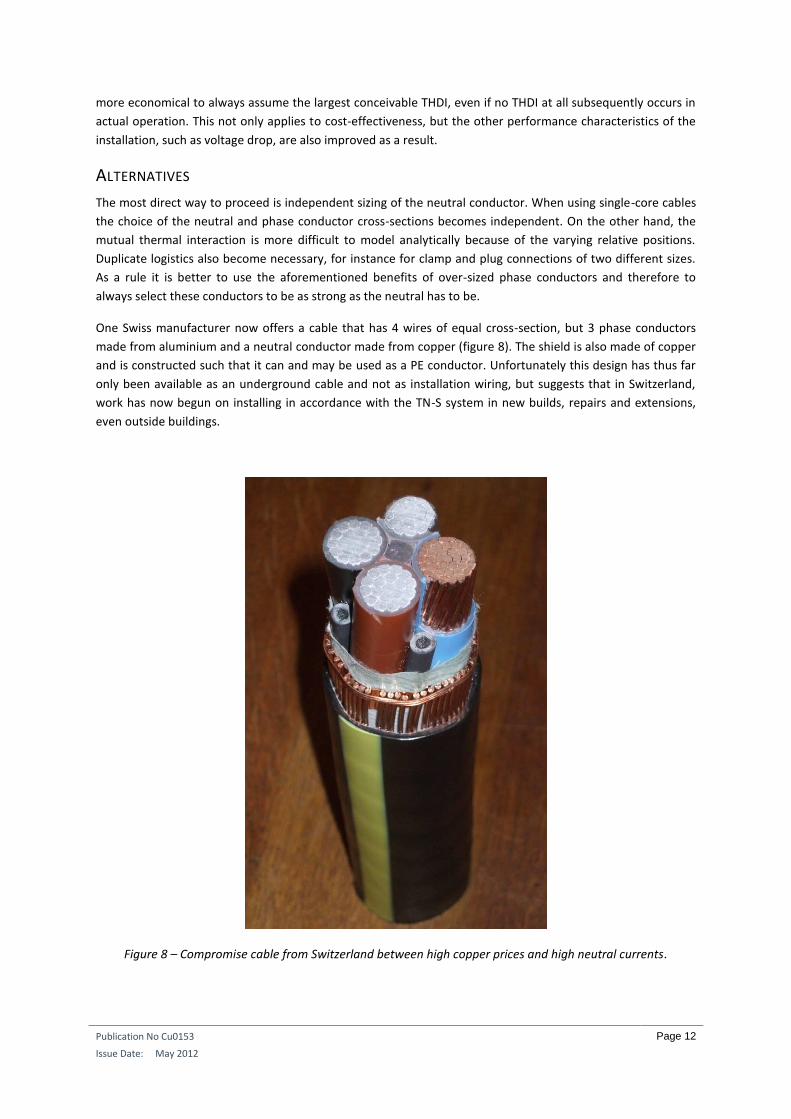
One Swiss manufacturer now offers a cable that has 4 wires of equal cross-section, but 3 phase conductors
made from aluminium and a neutral conductor made from copper (figure 8). The shield is also made of copper
and is constructed such that it can and may be used as a PE conductor. Unfortunately this design has thus far
only been available as an underground cable and not as installation wiring, but suggests that in Switzerland,
work has now begun on installing in accordance with the TN-S system in new builds, repairs and extensions,
even outside buildings.
Figure 8 – Compromise cable from Switzerland between high copper prices and high neutral currents.

Publication No Cu0153
Issue Date: May 2012
Page 13
PRACTICAL GUIDELINES The weak point of everything described up to this point as a possible way of proceeding lies in the fact that the
load on the phase conductors with current distortions, from which the neutral load could be deduced, is not
known. In this respect, this way of proceeding is not possible simply because many low-voltage distribution
systems have to be planned for buildings for which no users have been found, not to mention the fact that the
type of load then has to be guessed. However, equipping a modern office with electrical appliances is very
similar to any other modern office. Here, a glance at the characteristics of the consumables normally used in
such cases, together with an estimate of numbers, depending, for instance, on the available area or the
number of workstations, can help obtain a usable ballpark value. But where to get the data from without
stealing them? Manufacturers do not specify the THDI of their appliances. Even current or apparent power are
often missing. Therefore, several measurements were carried out on common office equipment by way of
example.
EXAMPLE VALUES
Table 2 gives guidelines for the expected neutral load for a selection of typical harmonic-generating single-
phase loads as used extensively in residential and office buildings. Since the actual power consumption can
sometimes differ considerably from the given power PNom of the appliances or – despite their – no rated power
is given, typical measured values for the active power PMeas and the apparent power SMeas were also given in
each case. It is particularly noticeable that PC power supplies are commonly oversized by several magnitudes,
so that a calculation based on rated values would give false results in any event. With part-loads, the THDI,
while being smaller in absolute terms (measured in amperes), is higher in relative values (percentages) [4]. The
values in actual operation are therefore somewhere in between – but where? To be able to estimate this,
Table 2 also shows the values for phase currents IL1, IL2, IL3 and neutral current IN measured on selected
example appliances that are produced if three appliances are operated on the network in question – spread
evenly across the three phases.
Figure 9 – Long-term measurements on a photocopier.
Publication No Cu0153
Issue Date: May 2012
Page 14
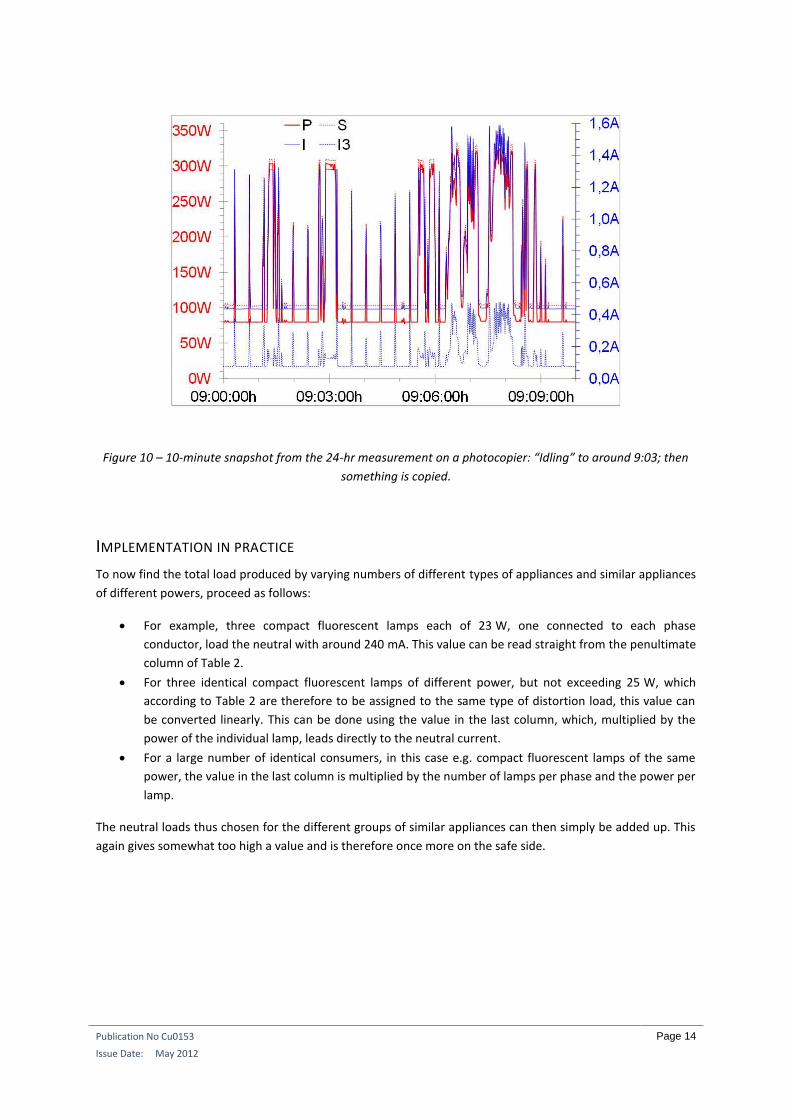
Figure 10 – 10-minute snapshot from the 24-hr measurement on a photocopier: “Idling” to around 9:03; then
something is copied.
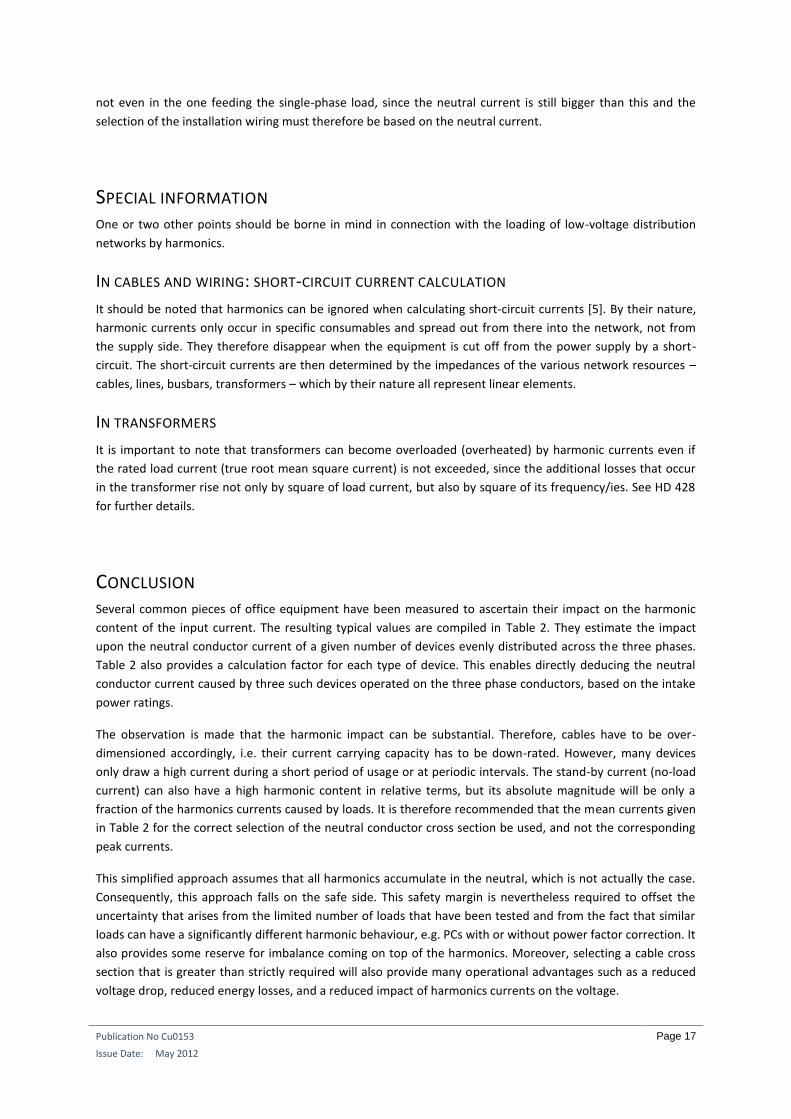
IMPLEMENTATION IN PRACTICE
To now find the total load produced by varying numbers of different types of appliances and similar appliances
of different powers, proceed as follows:
For example, three compact fluorescent lamps each of 23 W, one connected to each phase
conductor, load the neutral with around 240 mA. This value can be read straight from the penultimate
column of Table 2.
For three identical compact fluorescent lamps of different power, but not exceeding 25 W, which
according to Table 2 are therefore to be assigned to the same type of distortion load, this value can
be converted linearly. This can be done using the value in the last column, which, multiplied by the
power of the individual lamp, leads directly to the neutral current.
For a large number of identical consumers, in this case e.g. compact fluorescent lamps of the same
power, the value in the last column is multiplied by the number of lamps per phase and the power per
lamp.
The neutral loads thus chosen for the different groups of similar appliances can then simply be added up. This
again gives somewhat too high a value and is therefore once more on the safe side.

Publication No Cu0153
Issue Date: May 2012
Page 15
Table 2 – Typical values of non-linear single-phase loads, 3 operated divided evenly between 3 phases.
NOTES
1. Because the harmonics produced by different loads generally have identical order numbers but
slightly different phase angles, the harmonic currents can sometimes be extinguished instead of
added. Through arithmetic addition, therefore, the necessary safety framework is created for the
simplified procedure and the reserve established so that the appliances given here by way of example
do not necessarily have to be the worst distorters under the sun. Also, the values thus calculated are
on the safe side of reality simply because the cables and above all the feeding distribution
transformer have certain filtering effects on the harmonic currents. Thus, when the total connected
distorting loads are multiplied, the harmonic currents do not multiply to precisely the same degree,
but somewhat less than the linear extrapolation would give with the number of same loads and the
addition of the groups of different loads. For example, in practice, 100 flat screens will not cause 100
times as large harmonic currents as one flat screen, but roughly speaking, depending on the
characteristics of the network, perhaps 70 times.
2. If the network load is unbalanced, e.g. with only 2 compact fluorescent lamps on 2 phases, it can be
assumed that the loading of the neutral by harmonics drops about as far as its load due to the
imbalance increases. The unbalance current is therefore simply added to the harmonic current in the
N-conductor. The resultant error is again on the safe side.
Mains loaded with 1 device per phase
Example measurementsPower intake Current
P Nom P Meas S Meas I L1 I L2 I L3 I N
Compact fluorescent lamps up to 25 W 23W 23W 35VA 0.15A 0.15A 0.15A 0.24A 10.43mA/W
30W 29W 30VA 0.13A 0.13A 0.13A 0.06A 2.00mA/W
Linear lamp with external ballast 58W 55W 59VA 0.25A 0.25A 0.25A 0.13A 2.24mA/W
without compensation (inductive) 58W 62W 140VA 0.60A 0.60A 0.60A 0.20A 3.45mA/W
with parallel compensation 58W 62W 67VA 0.30A 0.30A 0.30A 0.20A 3.45mA/W
with serial compensation (capacitive) 58W 75W 170VA 0.73A 0.73A 0.73A 0.30A 5.17mA/W
undimmed (min. angle ≈5°) 200W 200VA 0.87A 0.87A 0.87A 0.02A 0.10mA/W
dimmed 60° (120° conductive angle) 161W 179VA 0.78A 0.78A 0.78A 0.67A 3.36mA/W
dimmed 120° (60° conductive angle) 38W 87VA 0.38A 0.38A 0.38A 0.66A 3.29mA/W
without ballast 26W 27VA 0.12A 0.12A 0.12A 0.05A 1.87mA/W
with magnetic ballast 27W 27VA 0.12A 0.12A 0.12A 0.06A 2.38mA/W
inactive (idling) 80W 105VA 0.46A 0.46A 0.46A 0.76A 1.89mA/W
Mean office workday 85W 112VA 0.48A 0.48A 0.48A 0.81A 2.02mA/W
Peak (max. processor demand) 145W 190VA 0.83A 0.83A 0.83A 1.34A 3.36mA/W
inactive (idling) 77W 83VA 0.36A 0.36A 0.36A 0.16A 0.40mA/W
Mean office workday 82W 87VA 0.38A 0.38A 0.38A 0.17A 0.43mA/W
Peak (max. processor demand) 136W 139VA 0.60A 0.60A 0.60A 0.24A 0.60mA/W
CRT monitor Obsolete technology, dropping stocks 60W 60W 90VA 0.38A 0.38A 0.38A 0.60A 10.00mA/W
100% brightness 32W 54VA 0.24A 0.24A 0.24A 0.41A 11.71mA/W
20% brightness 22W 38VA 0.17A 0.17A 0.17A 0.29A 8.33mA/W
PC operating & charging battery 65W 118VA 0.53A 0.53A 0.53A 0.91A 13.99mA/W
PC operating, heavy CPU load 24W 50VA 0.20A 0.20A 0.20A 0.35A 5.33mA/W
PC operating, weak CPU load 16W 38VA 0.17A 0.17A 0.17A 0.29A 4.40mA/W
PC operating & charging battery 67W 84VA 0.36A 0.36A 0.36A 0.60A 6.67mA/W
PC operating, heavy CPU load 56W 69VA 0.30A 0.30A 0.30A 0.54A 6.00mA/W
PC operating, weak CPU load 17W 23VA 0.10A 0.10A 0.10A 0.18A 2.00mA/W
Stand-by 20W 40VA 0.16A 0.16A 0.16A 0.21A 10.68mA/W
Active 325W 330VA 1.40A 1.40A 1.40A 0.57A 1.76mA/W
Daily minimum 62W 101VA 0.43A 0.43A 0.43A 0.22A 3.47mA/W
Daily mean 103W 142VA 0.61A 0.61A 0.61A 0.43A 4.21mA/W
Daily maximum 324W 352VA 1.59A 1.59A 1.59A 1.93A 5.96mA/W
25W
Con-
version
I N/P device
Device under test and its
operating / measurement
conditions
Remarks and explanations
Photo copier –
Laptop-PC above 75 W (limit
according to EN 61000-3-2:2010-03)90W
Fax machine 3A
Laptop-PC up to 75 W (limit according
to EN 61000-3-2:2010-03)65W
Flat screen 35W
Office PC without active power factor
correction (PFC)
400W
Compact fluorescent lampsFluorescent lamps above 25 W with
internal or external electronic gear
Office PC with active power factor
correction (PFC)
LED lighting tubes (perceived re-
placement for fluorescent lamp 58 W)
Fluorescent lamps above 25 W with
internal or external magnetic gear
Incandescent lamps with phase angle
control dimmers200W

Publication No Cu0153
Issue Date: May 2012
Page 16
NUMERICAL EXAMPLE
Twelve PC workstations are to be created on one floor of an office. To this can be added a total of 30 compact
fluorescent lamps, each of 20 W, and 1 photocopier. The probable load of the neutral as a result of supplying
this floor is to be calculated.
Procedure:
It is assumed that the computers – desktops with separate monitors – are distributed evenly, i.e. 4 per phase
conductor. The same applies to the lamps: 10 per phase conductor. It is not known whether the computers’
power supplies will be fitted with active electronic power factor correction (PFC) or not. For safety’s sake it
must therefore be assumed that none of the computers will be. It may, however, be assumed that “shoot-‘em-
up” games will not constantly be running on these computers, but that they will be used for ordinary office
work. Peak load does not therefore need to be taken into consideration, and the mean load value can be used.
The power take-up of the appliances is not known. An economical computer with the latest processing
technology and a fanless power supply uses 45 W, but who pays attention to power take-up when buying
computers? The empirical value of 85 W from Table 2 is therefore assumed. The neutral current of 810 mA
from Table 2 can then be multiplied directly by 4.
It is safe to assume that CRT monitors are no longer used. The value for flat screens at full brightness, again
multiplied by 4, provides sufficient accuracy.
There is no 20 W compact fluorescent lamp in Table 2. The relative neutral current in the last column helps
here. The total power can first easily be determined – 10 lamps each of 20 W per phase makes 200 W – and
then multiply by the typical value for this category of loads of 10.43 mA/W neutral current.
Note: This gives a quite different result from, for instance, 5 lamps each of 40 W! According to Table 2, such
lamps would be in a different category and cause far less harmonic current.
The only photocopier present (figure 9) cannot be “evenly distributed”. It represents a single-phase, i.e.
unbalanced, load – and indeed a relatively big one. The relative distortion remains within limits, but is a highly
erratic load with extreme peaks (figure 10 shows actual power, apparent power, total current and current of
the third harmonic in operation and “at rest”). For the sake of simplicity, the neutral current of the copier,
which is therefore necessarily identical to its phase current, is added to the neutral current of the evenly
distributed but distorting loads. The mean is sufficient, the regularly occurring pulse-like peaks typical of
devices with laser printing, are short and contained within the mean. The unevenness of this load, which
actually increases the heating of the conductor, is counterbalanced by the fact that the linear addition of the
fundamental of the copier current to the harmonic current of the other users in the N-conductor leads to the
assumption of an excessively high neutral current. The total neutral load is therefore calculated as follows:
3 * 4 PCs 4 * 0.81 A = 3.24 A
3 * 4 flat screens 4 * 0.41 A = 1.64 A
3 * 10 compact fluorescent lamps each 20 W 10 * 20 W * 10.43 mA/W = 2.09 A
1 photocopier 0.43 A
Total 7.40 A
Table 3 –Totalized neutral current from the example calculation.
Adding the phase currents of these users together gives 4.76 A for that phase on which the photocopier is
operated in addition to the evenly distributed loads. Accordingly, in this case the conductor cross-section must
be chosen on the basis of the neutral current. A reduction factor is then no longer required, since although 4
conductors are loaded simultaneously, the full current is not or cannot be reached in all 3 phase conductors,
Publication No Cu0153
Issue Date: May 2012
Page 17
not even in the one feeding the single-phase load, since the neutral current is still bigger than this and the
selection of the installation wiring must therefore be based on the neutral current.
SPECIAL INFORMATION One or two other points should be borne in mind in connection with the loading of low-voltage distribution
networks by harmonics.
IN CABLES AND WIRING: SHORT-CIRCUIT CURRENT CALCULATION
It should be noted that harmonics can be ignored when calculating short-circuit currents [5]. By their nature,
harmonic currents only occur in specific consumables and spread out from there into the network, not from
the supply side. They therefore disappear when the equipment is cut off from the power supply by a short-
circuit. The short-circuit currents are then determined by the impedances of the various network resources –
cables, lines, busbars, transformers – which by their nature all represent linear elements.
IN TRANSFORMERS
It is important to note that transformers can become overloaded (overheated) by harmonic currents even if
the rated load current (true root mean square current) is not exceeded, since the additional losses that occur
in the transformer rise not only by square of load current, but also by square of its frequency/ies. See HD 428
for further details.
CONCLUSION Several common pieces of office equipment have been measured to ascertain their impact on the harmonic
content of the input current. The resulting typical values are compiled in Table 2. They estimate the impact
upon the neutral conductor current of a given number of devices evenly distributed across the three phases.
Table 2 also provides a calculation factor for each type of device. This enables directly deducing the neutral
conductor current caused by three such devices operated on the three phase conductors, based on the intake
power ratings.
The observation is made that the harmonic impact can be substantial. Therefore, cables have to be over-
dimensioned accordingly, i.e. their current carrying capacity has to be down-rated. However, many devices
only draw a high current during a short period of usage or at periodic intervals. The stand-by current (no-load
current) can also have a high harmonic content in relative terms, but its absolute magnitude will be only a
fraction of the harmonics currents caused by loads. It is therefore recommended that the mean currents given
in Table 2 for the correct selection of the neutral conductor cross section be used, and not the corresponding
peak currents.
This simplified approach assumes that all harmonics accumulate in the neutral, which is not actually the case.
Consequently, this approach falls on the safe side. This safety margin is nevertheless required to offset the
uncertainty that arises from the limited number of loads that have been tested and from the fact that similar
loads can have a significantly different harmonic behaviour, e.g. PCs with or without power factor correction. It
also provides some reserve for imbalance coming on top of the harmonics. Moreover, selecting a cable cross
section that is greater than strictly required will also provide many operational advantages such as a reduced
voltage drop, reduced energy losses, and a reduced impact of harmonics currents on the voltage.

Publication No Cu0153
Issue Date: May 2012
Page 18
REFERENCES [1] See practical problem “Vorschaltgerätbestückung in LS-Lampen” in “de” 5/2009, p. 18
[2] Stefan Fassbinder: “Norm in den Dornröschenschlaf geschickt.” “de” 3/2004, see 30VDE0298 Part 100
[3] DIN VDE 0298-4 (VDE 0298 Part 4):2003-08
[4] Pratical problem “Leistungsbilanz an Schaltnetzteilen”, “de” 20/2008, p. 44
[5] Stefan Fassbinder: “Verhalten von Schutzwandlern bei Kurzschluss”. ”de” 23-24/2004, p. 18


