

Strategies for Cheaper Bitumen
Peters & Co. - Lake Louise
January 25, 2008

January 2008
2Strategies for Cheaper Bitumen
1.Cheap Steam
2.Less Steam
3.No Steam
January 2008
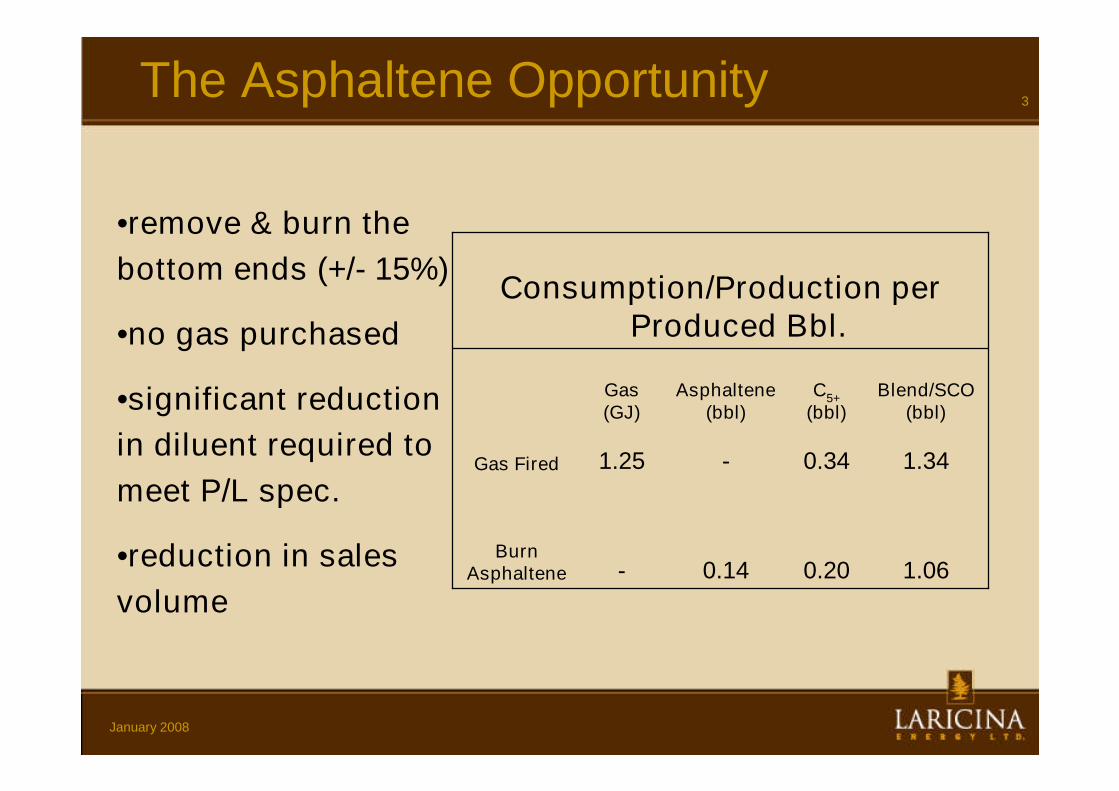
3The Asphaltene Opportunity
1.060.200.14-Burn
Asphaltene
1.340.34-1.25Gas Fired
Blend/SCO(bbl)
C5+
(bbl)Asphaltene
(bbl)Gas(GJ)
Consumption/Production perProduced Bbl.
•remove & burn the
bottom ends (+/- 15%)
•no gas purchased
•significant reduction
in diluent required to
meet P/L spec.
•reduction in sales
volume

January 2008
4Asphaltene Challenges
• 8% Sulphur
• 1% Ash (Vanadium, Nickel)
• Volume loss (bottoms are not
completely worthless)

January 2008
5Wet Combustion
TreaterSkim
Tank
DeAsph
0.14 bbl Asphaltene
Reactor
O2 Plant
1 bbl
Bitumen
Production
Water
0.86 bbl
DAO
Steam
+ CO2
+ SO2
Sludge
CO2 (+SO2)
Sequester
Blending0.21 bbl
C5+
1.07 bbl
CLB
Deoil Soften
2.5 bbl
Steam

January 2008
6Strategies for Cheaper Bitumen
1.Cheap Steam
2.Less Steam
3.No Steam
January 2008
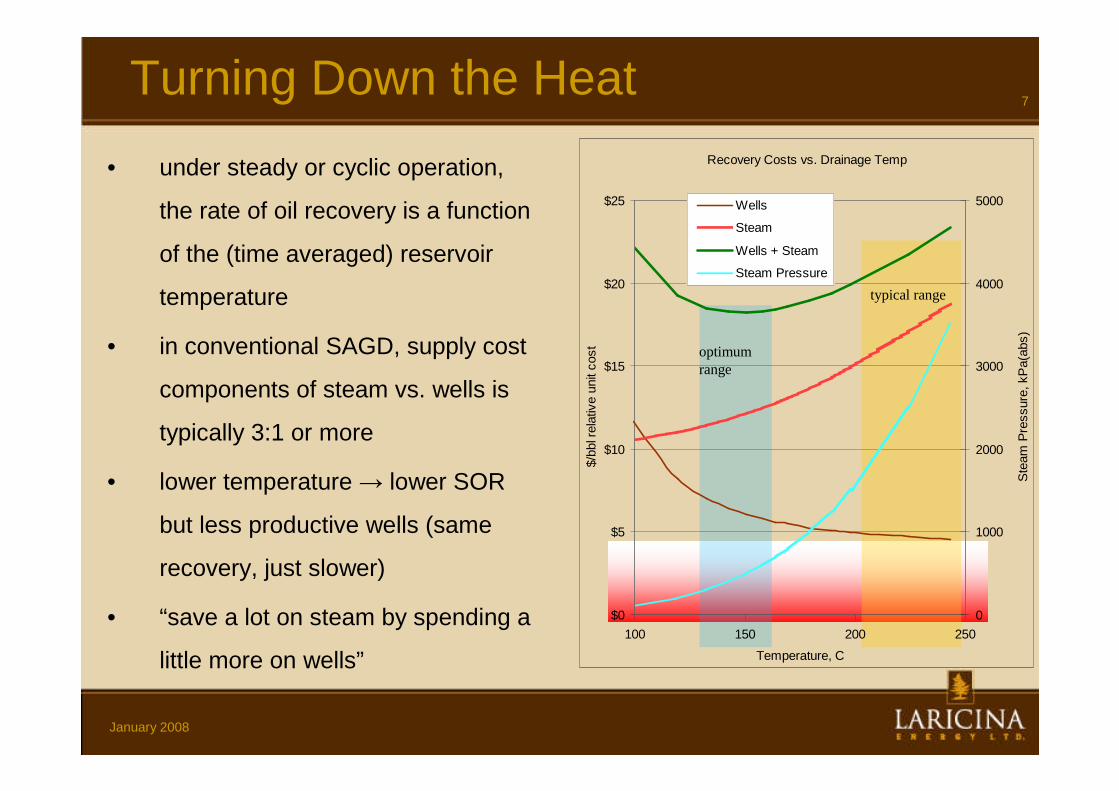
7Turning Down the Heat
• under steady or cyclic operation,
the rate of oil recovery is a function
of the (time averaged) reservoir
temperature
• in conventional SAGD, supply cost
components of steam vs. wells is
typically 3:1 or more
• lower temperature → lower SOR
but less productive wells (same
recovery, just slower)
• “save a lot on steam by spending a
little more on wells”
optimumrange
typical range
Recovery Costs vs. Drainage Temp
$0
$5
$10
$15
$20
$25
100 150 200 250
Temperature, C
$/b
blr
ela
tive
unit
cost
0
1000
2000
3000
4000
5000
Ste
am
Pre
ssure
,kP
a(a
bs)
Wells
Steam
Wells + Steam
Steam Pressure

January 2008
8Cyclic, Horizontal Steam Stimulation
Primrose 2A18 HCSS
1.0
1.5
2.0
2.5
3.0
3.5
4.0
4.5
0 1 2 3 4 5 6 7 8 9
Years After First Steam
CS
OR
0
25
50
75
100
125
150
175
Matc
hin
gS
team
Pre
ssu
re,
kP
aa
Field CSOR
Model CSOR @ 200 kPaa/119C
Temperature to match vs. time

January 2008
9The Gravity Conspiracy Theory
• CSS– Unocal history provides
grounding for reservoir values(match & extrapolation)
• SAGD– Horizontals recover ~2.5x
more oil from same heatedarea
– Lower pressure more gentleprocess
– Controlled distribution
– Better SOR
Vertical CSS (i.e. radial, cyclic SAGD):● 1/3 sweep @ 10 years (typ.)● 1/3 * (.85-.15) = 23% recovery
(Horizontal) SAGD:● 85% sweep @ 10 years (typ.)● .85 * (.85-.15) = 60% recovery

January 2008
10Grand Rapids – CSS @3000 kPa IP
Generic Grand Rapids Model, CSOR v % Recovery Case Comparison(250 - 1500 Cases, 3000 kPaa injection over initial 6 months)
0.0
1.0
2.0
3.0
4.0
5.0
6.0
0 10 20 30 40 50 60 70 80
% Recovery
Cu
mu
lati
ve
Ste
am
/Oil
Rati
o(m
3/m
3)
250 kPaa Inj
500
750
1000
1500
2000
2500
3000
3500
4000
2000 UI
2500 UI
3000 UI
3500 UI
4000 UI
3 Cycle CSS

January 2008
11Strategies for Cheaper Bitumen
1.Cheap Steam
2.Less Steam
3.No Steam
January 2008
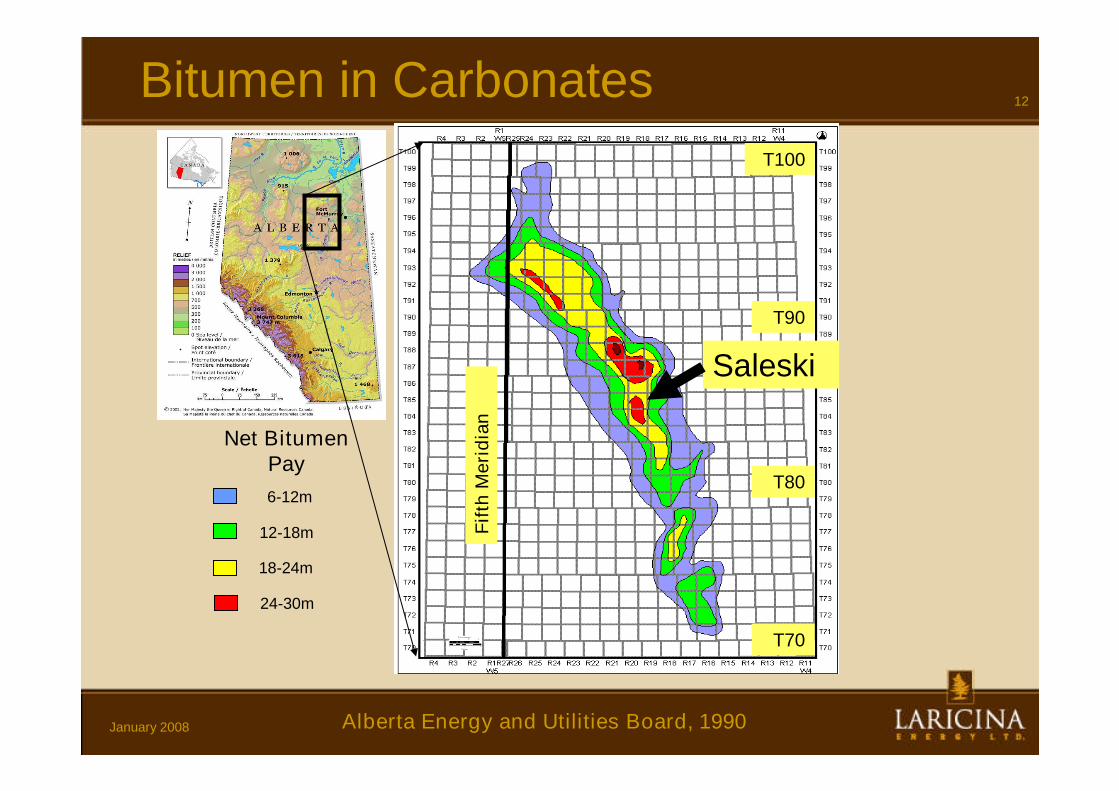
12Bitumen in Carbonates
Alberta Energy and Utilities Board, 1990
6-12m
12-18m
18-24m
24-30m
Fif
thM
eri
dia
n
T90
T80
T70
T100
Net BitumenPay
Saleski

January 2008
13McMurray vs. Grosmont
10585ROIP, mmbbl/sec
6.55.3ROIP*, m
‘extreme’5kh , D
>5-1005kv, D
5025h, m
.2x(.9-.25) = .13.3x(.85-.15) = .21•So
GrosmontMcMurray
*Recoverable OIP, assuming 100%volumetric sweep
January 2008
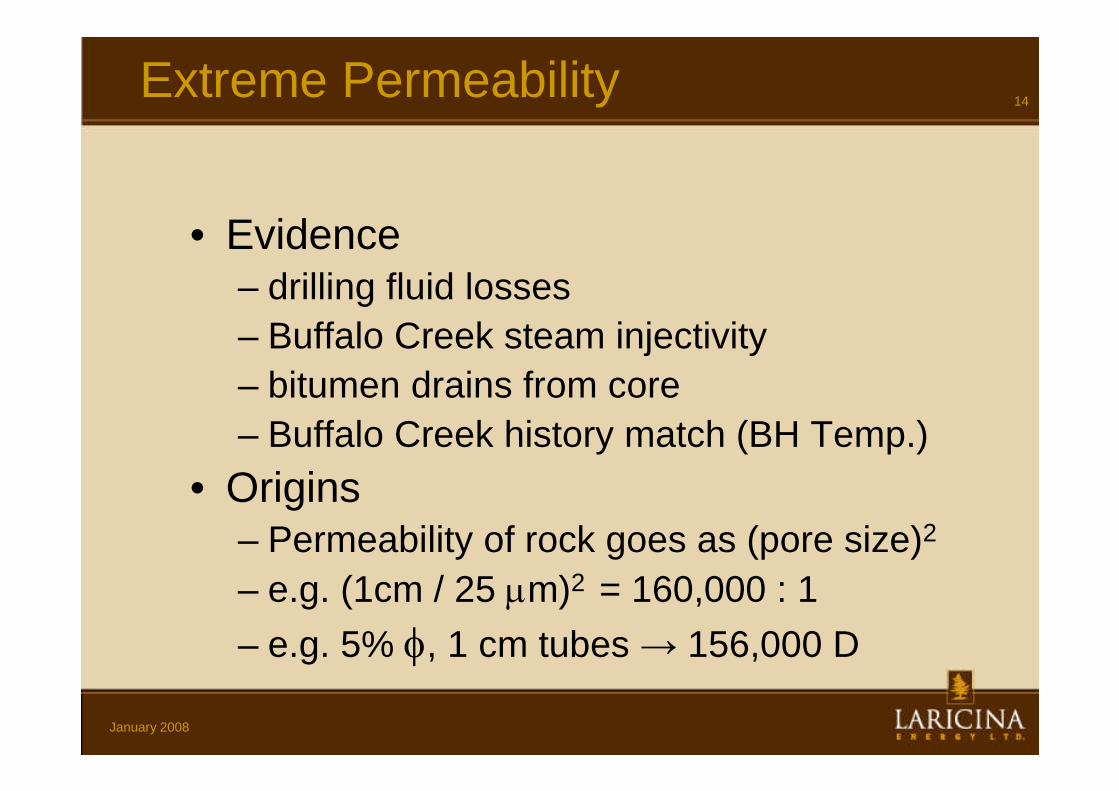
14Extreme Permeability
• Evidence– drilling fluid losses
– Buffalo Creek steam injectivity
– bitumen drains from core
– Buffalo Creek history match (BH Temp.)
• Origins– Permeability of rock goes as (pore size)2
– e.g. (1cm / 25 m)2 = 160,000 : 1
– e.g. 5% , 1 cm tubes → 156,000 D

January 2008
15Enhanced porosity and permeability
(TIPM Labs – Apostolos Kantzas)
CT Scan Core X-Sections

January 2008
16High bitumen saturations
Bitumen Covered Core Barrel (Saleski 10-27-85-19W4)Encountered 3m cavern; recovered only bitumen no rock
Typical Saleski Core Sample
• Bitumen saturations exceeding 85%at Saleski

January 2008
17
D Mega Ф Zones
C Mega Ф Zone
10-35 10-26 7-26 10-23 10-14-85-19W4
Regional Constituency
January 2008
18Solvent Recovery from Carbonates
• versus thermal:
– porosity is not critical: rock doesn’t absorb solvent
– thickness is not critical: solvent is not lost to confining
strata
• high permeability key to minimizing solvent
requirement
• fractures & vugs provide ‘fractal’ access to reservoir
volume (convection beats diffusion)
• heat+solvent spectrum – use genetics to explore
and optimize

January 2008
19Saleski Cold Solvent soak experiment
• performed by U of C-TIPM atinitial reservoir temperatureand pressure
• zero pressure gradient(recovery by gravity drainage& oil phase swelling)
• recovery was > 50% in < 2weeks
• Laricina is currently preparinga single-well cold solvent fieldtest

January 2008
20100˚C: The Thermal Divide
• Thermal facilities, field piping, and well tubularsare all subject to significant thermal expansion atsteam temperatures
• e.g. flowlines must accommodate the strain,hence on piles above ground, hence insulatedand drainable or traced
• below about 100˚, lines can be plowed in andpiping standards relaxed;
• a cold (or warm) solvent process is expected tohave field development costs more akin toconventional production, i.e. about half of SAGD
January 2008
21
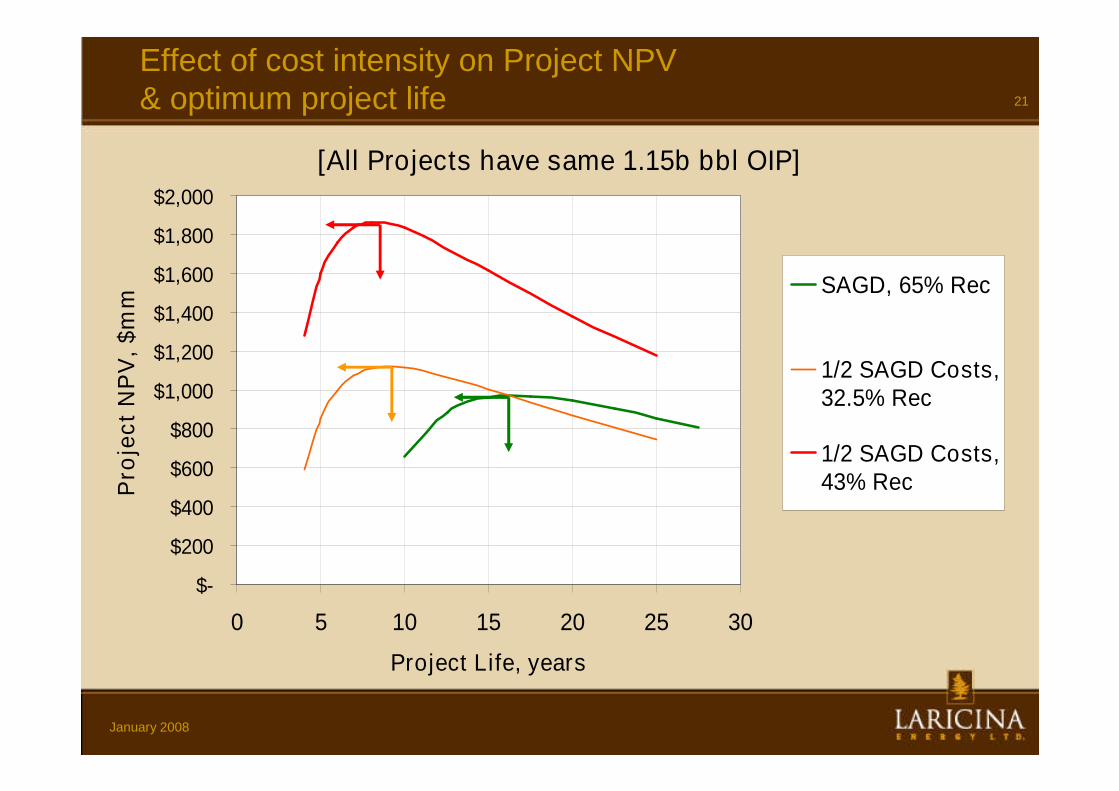
Effect of cost intensity on Project NPV& optimum project life
[All Projects have same 1.15b bbl OIP]
$-
$200
$400
$600
$800
$1,000
$1,200
$1,400
$1,600
$1,800
$2,000
0 5 10 15 20 25 30
Project Life, years
Pro
jec
tN
PV
,$
mm
SAGD, 65% Rec
1/2 SAGD Costs,32.5% Rec
1/2 SAGD Costs,43% Rec

January 2008
22Conclusions
• There is a lot of room for improvement in bitumen recovery
technology and cost
• Asphaltene burning appears to justify the req’d environmental
investment; reduced diluent usage is a major benefit
• The thermal intensity of SAGD can be optimized (lowered) by
cyclic steaming strategies
• The Grosmont carbonates are an emerging resource with
attractive qualities for thermal recovery
• Highly developed secondary porosity may enable a low-cost,
cold solvent recovery process

January 2008
23Forward-Looking Statement Disclaimer
Certain statements contained in this document are“forward-looking statements”. The projections,estimates and beliefs contained in such forward-looking statements involve known and unknownrisks, uncertainties and other factors which maycause actual results or events to differ materiallyfrom those anticipated in any forward-lookingstatements.
It is believed that expectations reflected in thoseforward-looking statements are reasonable,however assurance cannot be provided that theseexpectations will prove to be correct.


