

Strategies to combat inequality and
eradicate poverty in Latin America
and the Caribbean
Sandra García – Universidad de los Andes
UN Expert Group Meeting “Evaluating the Implementation of the Second United Nations Decade for the Eradication of Poverty (2008-2017)”
New York, May 10-11, 2017

Poverty in Latin America: slow progress after 2010
Source: ECLAC. (2016). Social Panorama of Latin America 2015. Santiago de Chile: Economic Comission for
Latin America and the Caribbean (ECLAC)

Inequality in Latin America: slow progress after 2010
Source: Cord, L., et al. (2014). “Inequality Stagnation in Latin America in the Aftermath of the Global
Financial Crisis.” Policy Research Working Papers 7146, World Bank, Washington, DC.

Slight increase in social spending
Source: ECLAC. (2016). Social Panorama of Latin America 2015. Santiago de Chile: Economic Comission for
Latin America and the Caribbean (ECLAC)
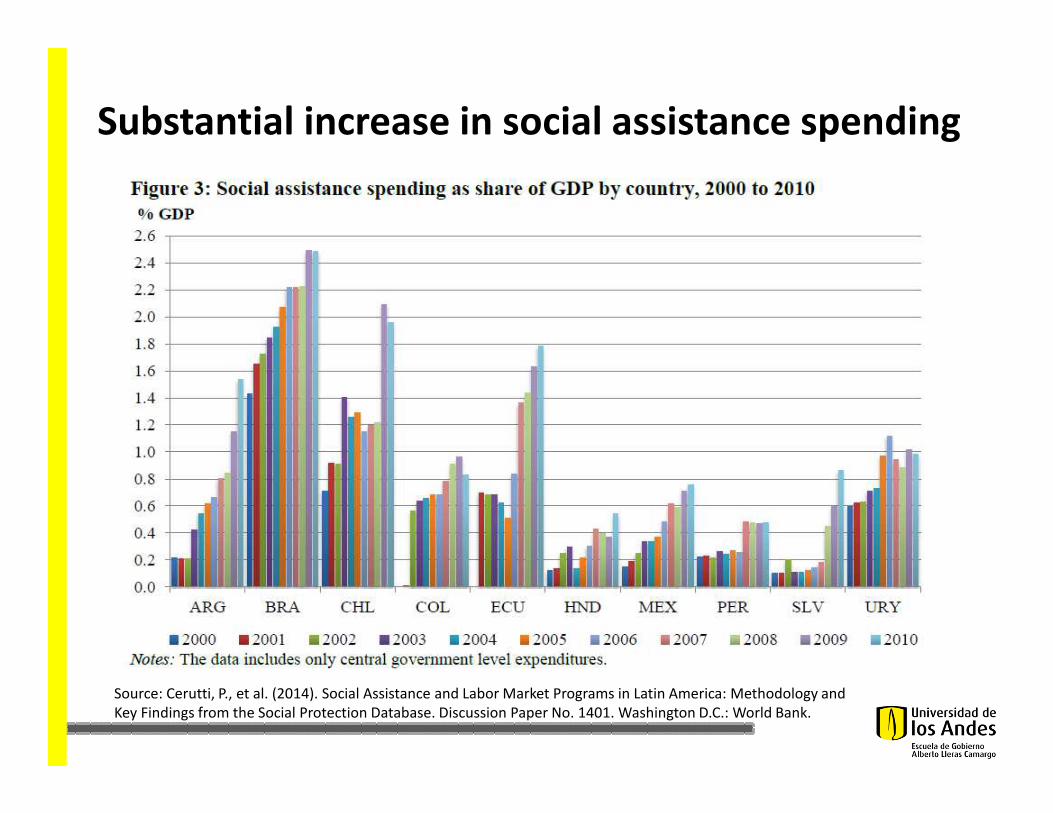
Substantial increase in social assistance spending
Source: Cerutti, P., et al. (2014). Social Assistance and Labor Market Programs in Latin America: Methodology and
Key Findings from the Social Protection Database. Discussion Paper No. 1401. Washington D.C.: World Bank.
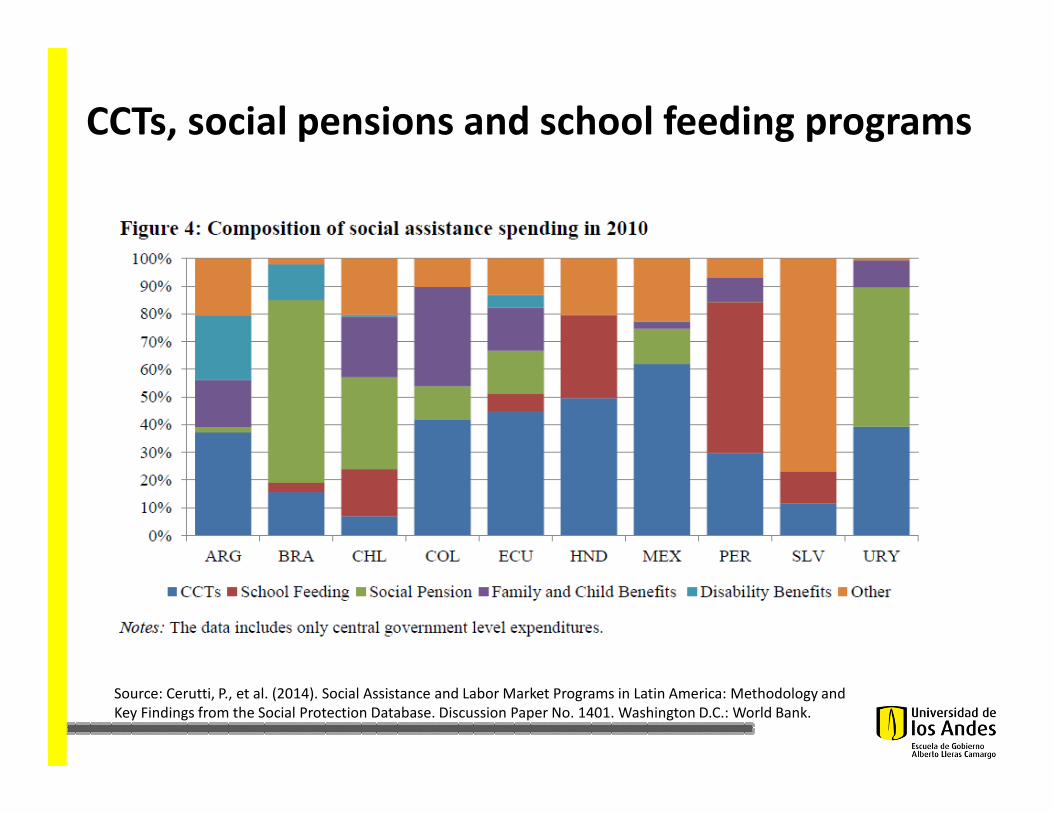
CCTs, social pensions and school feeding programs
Source: Cerutti, P., et al. (2014). Social Assistance and Labor Market Programs in Latin America: Methodology and
Key Findings from the Social Protection Database. Discussion Paper No. 1401. Washington D.C.: World Bank.

Agenda
• Social assistance programs
– Conditional Cash Transfers
– Social Pensions
– School feeding programs
– Youth Training
• Integrated/multifaceted programs
• Education and inequality

CCT PROGRAMS AROUND THE WORLD
Over 150 million
beneficiaries
worldwide
78 CCT programs in 49 countries
(19 in LAC)

NOTE: Weights are from random effects analysis
Overall
2
2
3
1
1
1
2
LAC countries
2
1
3
3
3
3
2
Subtotal
1
2
Quality
3
3
Non-LAC countries
Subtotal
3
2
1
1
2
2
2
3
WWC
Brazil
Ghana
Macedonia
Morocco
Tanzania
Honduras
Colombia
Kenya
Burkina Faso
Peru
India
Bangladesh
Turkey
Bolivia
Nicaragua
Indonesia
Country
El Salvador
Guatemala
Bangladesh
Phillipines
Indonesia
Honduras
Mexico
Ecuador
Panama
Mexico
4
2
2
2
3
1
2
2
2
3
8
6
1
3
2
1
Years
1
1
1
3
2
2
1
2
2
5
Bolsa Familia
Livelihood Empowerment Against Poverty
Macedonia CCT Project
Tayssir
Tanzania Community Based CCT
Bono 10,000
Familias en Acción
Cash Transfer for OVC
Orphans and Vulnerable Children
Juntos
Apni Beti Apna Dhan
Primary Education Stipend Program
Social Risk Mitigation Project
Bono Juancito Pinto
Red de Protección Social
Jaring Pengamanan Social
Program
Comunidades Solidarias Rurales
Mi Familia Progresa
Shombhob Project
Pantawid Pamilyang Pilipino Program
Keluarga Harapan
Programa de Asignación Familiar II
Progresa
Bono de Desarrollo Humano
Red de Oportundiades
Oportunidades
3.00 (1.77, 4.24)
3.00 (-2.68, 8.68)
-1.00 (-3.16, 1.16)
-4.30 (-9.98, 1.38)
5.30 (4.71, 5.89)
4.00 (-3.84, 11.84)
4.40 (2.05, 6.75)
1.80 (0.65, 2.96)
1.58 (-3.91, 7.07)
10.50 (-0.08, 21.08)
4.00 (2.04, 5.96)
0.20 (-5.48, 5.88)
16.96 (-30.08, 64.00)
1.80 (-1.14, 4.74)
0.20 (-0.78, 1.18)
2.37 (-0.03, 4.77)
12.80 (4.37, 21.23)
10.00 (3.14, 16.86)
ES (95% CI)
5.20 (0.69, 9.71)
3.61 (1.69, 5.53)
3.14 (1.93, 4.35)
3.60 (-2.28, 9.48)
4.50 (1.76, 7.24)
-1.30 (-3.26, 0.66)
2.90 (-1.02, 6.82)
0.86 (0.44, 1.28)
10.30 (0.89, 19.71)
3.66 (0.15, 7.17)
11.17 (5.04, 17.30)
0-10 0 10
Percentage points
Primary Enrollment-All Studies
Data source: García, S., & Saavedra, J. E. (forthcoming). Educational Impacts and Cost-Effectiveness of Conditional Cash Transfer
Programs in Developing Countries: A Meta-analysis. Working Paper.

Data source: García, S., & Saavedra, J. E. (forthcoming). Educational Impacts and Cost-Effectiveness of Conditional Cash Transfer
Programs in Developing Countries: A Meta-analysis. Working Paper.
NOTE: Weights are from random effects analysis
Overall
3
2
LAC countries
2
3
2
1
2
2
3
1
1
2
3
Subtotal
2
WWC
3
2
1
1
2
1
1
Quality
3
Non-LAC countries
Subtotal
Mexico
Cambodia
Mexico
Bangladesh
Colombia
Colombia
Ghana
Indonesia
Colombia
Indonesia
Tanzania
Phillipines
Macedonia
Cambodia
Turkey
Panama
Malawi
Colombia
Brazil
Honduras
Colombia
Country
Pakistan
5
1
1
4
2
3
2
1
3
2
3
3
2
1
1
2
2
3
4
1
2
Years
5
Oportunidades
JFPR Scholarship Program
Progresa
Female Secondary School Stipend Program
Familias en Acción
Subsidios Condicionados Bogota (Savings)
Livelihood Empowerment Against Poverty
Jaring Pengamanan Social
Familias en Acción (Urban Expansion)
Keluarga Harapan
Tanzania Community Based CCT
Pantawid Pamilyang Pilipino Program
Macedonia CCT Project
CESSP Scholarship Program
Social Risk Mitigation Project
Red de Oportundiades
CCT for Schooling in Malawi
Subsidios Condicionados Bogota (Basic)
Bolsa Familia
Bono 10,000
Subsidios Condicionados Bogota (Tertiary)
Program
Punjab Female School Stipend Program
7.13 (4.59, 9.66)
19.50 (6.17, 32.83)
31.00 (22.77, 39.23)
9.17 (8.59, 9.75)
2.26 (1.39, 3.13)
5.11 (3.03, 7.20)
3.40 (1.05, 5.75)
7.00 (0.92, 13.08)
10.63 (-3.20, 24.47)
2.80 (0.64, 4.96)
-1.30 (-5.22, 2.62)
4.00 (-3.84, 11.84)
2.22 (-1.84, 6.28)
6.50 (0.42, 12.58)
5.36 (2.75, 7.98)
20.40 (11.38, 29.42)
1.20 (-0.37, 2.77)
8.69 (1.01, 16.37)
11.30 (3.66, 18.94)
1.40 (-1.74, 4.54)
7.30 (-1.32, 15.92)
4.40 (2.05, 6.75)
4.40 (-1.09, 9.89)
ES (95% CI)
17.44 (16.00, 18.87)
8.87 (3.92, 13.83)
0-8 0 30
Percentage points
Secondary Enrollment-All Studies

CCTs effectiveness in LAC
• Also significant effects on– Increasing primary and secondary attendance
– Reducing primary and secondary dropout
– Use of health care services (Filmer & Schady, 2009).
• Mixed effects on nutritional status (Bouillon & Tejerina, 2007; Filmer
& Schady, 2009) .
• Limited effects on longer term outcomes– 0.5 to 1 additional years of schooling in LAC (Molina-Millan et al.,
2016)
– Small effects on school completion (García & Saavedra, forthcoming).
– Small (or not significant effects on learning) (Báez & Camacho (2011), García & Hill (2010), Snilstveit et al. (2015)).
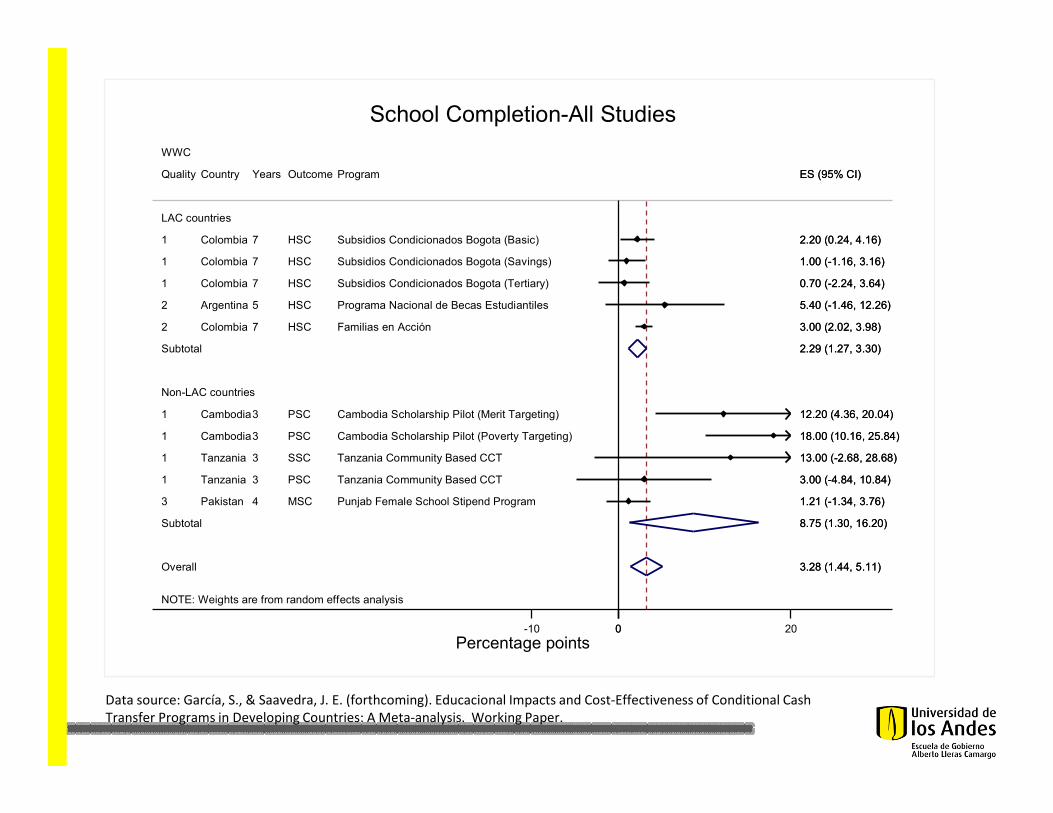
Data source: García, S., & Saavedra, J. E. (forthcoming). Educacional Impacts and Cost-Effectiveness of Conditional Cash
Transfer Programs in Developing Countries: A Meta-analysis. Working Paper.
NOTE: Weights are from random effects analysis
Overall
Quality
Subtotal
2
1
1
1
WWC
1
1
2
Subtotal
1
1
3
LAC countries
Non-LAC countries
Country
Argentina
Tanzania
Colombia
Colombia
Colombia
Cambodia
Colombia
Tanzania
Cambodia
Pakistan
Years
5
3
7
7
7
3
7
3
3
4
Outcome
HSC
PSC
HSC
HSC
HSC
PSC
HSC
SSC
PSC
MSC
Program
Programa Nacional de Becas Estudiantiles
Tanzania Community Based CCT
Subsidios Condicionados Bogota (Tertiary)
Subsidios Condicionados Bogota (Basic)
Subsidios Condicionados Bogota (Savings)
Cambodia Scholarship Pilot (Poverty Targeting)
Familias en Acción
Tanzania Community Based CCT
Cambodia Scholarship Pilot (Merit Targeting)
Punjab Female School Stipend Program
3.28 (1.44, 5.11)
ES (95% CI)
2.29 (1.27, 3.30)
5.40 (-1.46, 12.26)
3.00 (-4.84, 10.84)
0.70 (-2.24, 3.64)
2.20 (0.24, 4.16)
1.00 (-1.16, 3.16)
18.00 (10.16, 25.84)
3.00 (2.02, 3.98)
8.75 (1.30, 16.20)
13.00 (-2.68, 28.68)
12.20 (4.36, 20.04)
1.21 (-1.34, 3.76)
3.28 (1.44, 5.11)
ES (95% CI)
2.29 (1.27, 3.30)
5.40 (-1.46, 12.26)
3.00 (-4.84, 10.84)
0.70 (-2.24, 3.64)
2.20 (0.24, 4.16)
1.00 (-1.16, 3.16)
18.00 (10.16, 25.84)
3.00 (2.02, 3.98)
8.75 (1.30, 16.20)
13.00 (-2.68, 28.68)
12.20 (4.36, 20.04)
1.21 (-1.34, 3.76)
0-10 0 20
Percentage points
School Completion-All Studies
Program characteristics and
effect sizes
• More stringent conditions (strict enforcement and monitoring of conditions) is associated with larger effects of CCTs on schooling outcomes (Baird et al. (2014)).
• Effects for primary enrollment attendance are larger in programs that complement cash transfers with supply side interventions (Garcia & Saavedra, forthcoming).
• Some individual programs suggest promising results from savings component at the end of high-school (Barrera, Linden & Saavedra, 2016).
• Transfer amounts not associated with larger effect sizes (Baird et al. (2014); Snilstveit et al. (2015)).

School feeding programs
• Represent an important proportion of social assistance spending in the region (over 30% of SA spending in Honduras and Peru).
• High levels of coverage among school-aged children (85% of children in the poorest quintile in Chile, Costa Rica, El Salvador and Panama (Cerutti et al., 2014)).
• Evidence on effectiveness is limited (Snilstveit et al.,2015).
– Positive effects on school attendance (for Guyana, Peru and Jamaica – though not for Chile)
– Small or no effects on cognitive development or test scores (although positive for children at risk)
• Challenges regarding implementation and targeting.

Social Pensions• Non-contributory pensions are increasing in terms of both spending and
number of beneficiaries.
• In 2010, these programs represented close to 60% of social assistance spending in Brazil, 50% in Uruguay and 33% in Chile (Cerutti et al., 2014).
• In Mexico and Colombia SP spending almost doubled between 2010 and 2014: from 0.11 to 0.21% of GDP in Mexico, and from 0.08 to 0.14 % of GDP in Colombia (World Bank, 2017).
• Effectiveness:– Positive effects on health among beneficiaries (Aguila et al. 2015; Galiani et al.
2016).
– Mixed effects on household consumption: positive for Mexico, no effect for for Brazil (Aguila et al., 2015; Kassouf & Oliveira, 2007).
– Mixed effects on labor supply of other adults in the household: no effects for Mexico and negative effects for Brazil (Galiani et al. ,2016; Kassouf & Oliveira, 2012).
– Mixed effects on beneficiaries’ labor supply: reduction in Mexico and Brazil and positive for adults under 70 in Colombia (Galiani et al., 2016; Kassouf & Oliveira; 2012 Pfutze & Rodríguez-Castelán, 2015).

Youth training programs
• Most common among active labor market programs (ALMP) in LAC.
• Present in at least 10 countries in the region (Dominican Republic, Colombia, Uruguay, Chile, Peru, Panama, Argentina, Venezuela, Paraguay and Haiti).
• Two main features: – Training is demand driven and depends on the needs
of the productive sector.
– Training includes not only classroom instruction but also on-the-job training (internship).

Short-term effectiveness larger than medium-term
Source: Kluve, J. (2016). A review of the effectiveness of Active Labor Market Programmes with a focus on Latin
America and the Caribbean. Working paper # 9. Geneva: International Labour Office, Research Department.

Long-term effectiveness of some
programs
• Dominican Republic (Juventud y Empleo) has shown sustained impact on job quality (formal employment), particularly for men (Ibarrarán et al.,
2015).
• Colombia (Jóvenes en Accción) has demonstrated a positive long-term effect on formal employment and earnings (Attanasio et al., 2015).
• These programs, in addition to technical skills training and in-job training, have a soft-skills component.
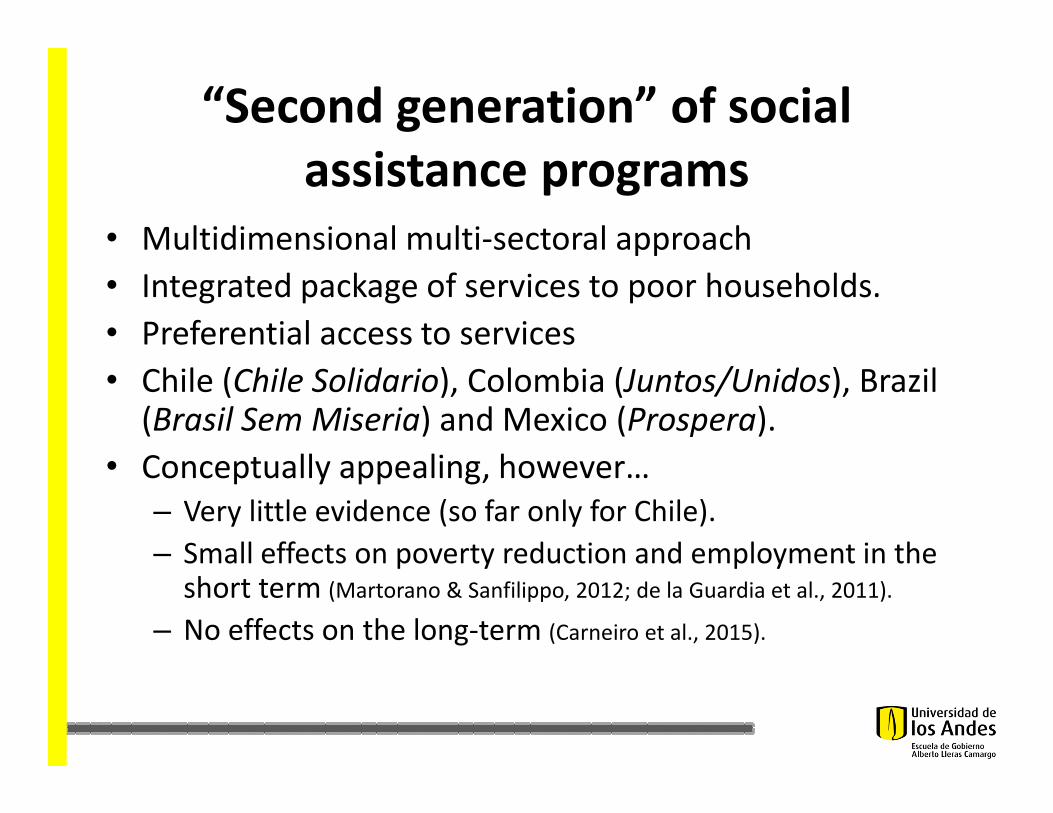
“Second generation” of social
assistance programs
• Multidimensional multi-sectoral approach
• Integrated package of services to poor households.
• Preferential access to services
• Chile (Chile Solidario), Colombia (Juntos/Unidos), Brazil (Brasil Sem Miseria) and Mexico (Prospera).
• Conceptually appealing, however…
– Very little evidence (so far only for Chile).
– Small effects on poverty reduction and employment in the short term (Martorano & Sanfilippo, 2012; de la Guardia et al., 2011).
– No effects on the long-term (Carneiro et al., 2015).

Multifaceted pilots
• “Ultra-poor graduation” programs
• Multicomponent: cash transfers, assettransfers, training, microfinance and healthservices.
• Pilot in Peru and Honduras
• Effects on income, consumption and foodsecurity are small (or zero) – substantiallysmaller than results from pilots in otherregions (Banerjee et al., 2015).

Source: J-PAL and IPA Policy Bulletin. 2015. “Building Stable Livelihoods for the Ultra-Poor.” Cambridge, MA: Abdul Latif
Jameel Poverty Action Lab and Innovations for Poverty Action.

What’s next?
• Cannot rule out multicomponent programs with the evidence so far. Some unanswered questions:– What is the right bundle of services? (type of assets,
training, etc.)
– How to reach remote areas with the right services?
– What is the minimum quality and intensity to guarantee sustained impacts on poverty reduction?
• Time for a “new generation” of CCTs. Changes in design– Conditionalities
– Additional incentives in school transitions (primary to secondary, secondary to higher education)
– Complement with supply-side interventions (Access to quality of services)
• Role of the educational system in the long-run

Inequality in secondary school completion
Source: ECLAC. (2016). Social Panorama of Latin America 2015. Santiago de Chile: Economic Comission for Latin
America and the Caribbean (ECLAC)
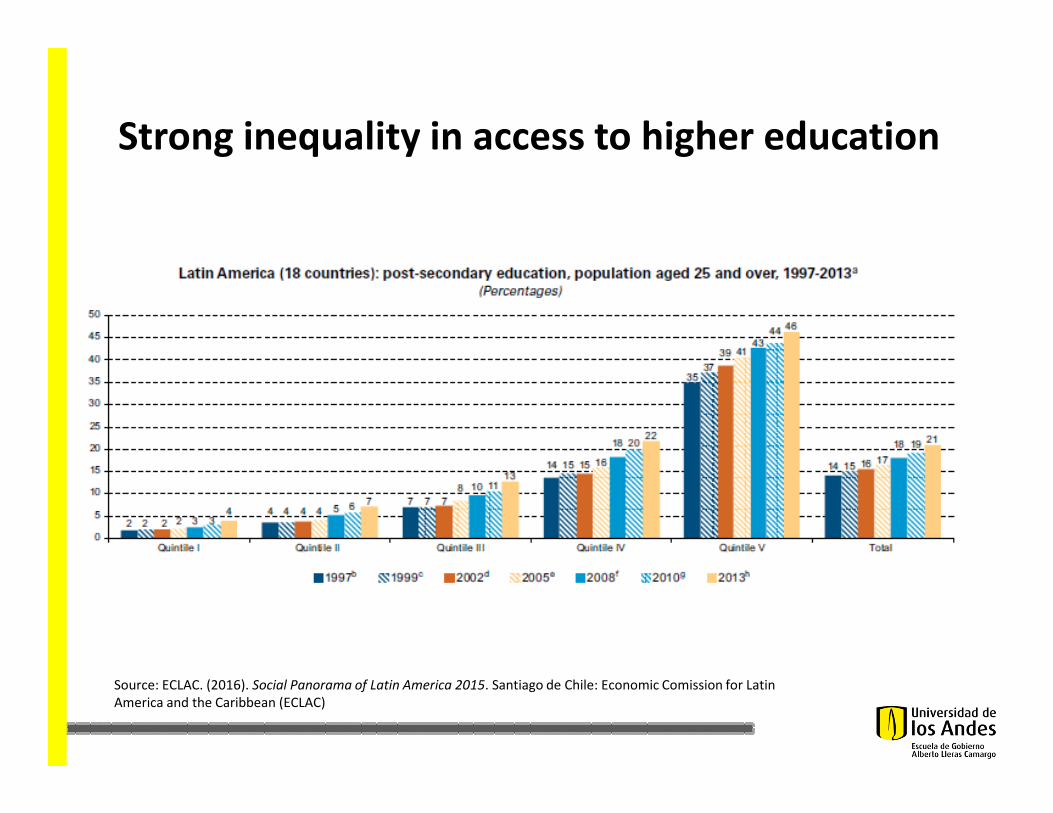
Strong inequality in access to higher education
Source: ECLAC. (2016). Social Panorama of Latin America 2015. Santiago de Chile: Economic Comission for Latin
America and the Caribbean (ECLAC)
Conclusions
• Progress in social indicators in LAC.
• Demonstrated effectiveness of some social assistance programs, particularly CCTs.
• Despite positive impacts on short-term outcomes, effectiveness on long-term outcomes aimed at reducing poverty and inequality is limited.
• Time for a “new generation” of programs after CCT wave.
• A more systemic approach to social protection is needed.
• Further research needed on multicomponent programs.
• Combating inequality requires structural changes in the education system: one that guarantees access to good quality education to all, particularly for vulnerable children and youth.


