

Stream Side ScienceLesson Plans and Water Related Activities

i
0LENE S. WALKERGOVERNOR
STATE OF UTAHOFFICE OF THE GOVERNOR
SALT LAKE CITY84114-060 I
GAYLE F. McKEACHNIELIEUTENANT
July 12, 2004
Dear Teachers:
I am pleased to introduce Stream Side Science, a new curriculum that offers 9’h grade students important information about our environment. The lessons and hands on activities are designed to instill in students an appreciation for our water resources. All of us should be more mindful of how we may sometimes waste this precious resource.
Stream Side Science was created for my Governor’s Watershed Initiative by Utah State University Extension, in partnership with the Utah State Office of Education and the Utah Departments of Agriculture and Foods, Environmental Quality and Natural Resources.
The lessons and activities help fulfill core curriculum objectives for Earth Systems Science. In addition, they increase student awareness of watersheds, water quality, and water resources. I am excited about this new teaching tool that will expand young minds and challenge our youth to conserve and protect our watersheds.
Olene S. WalkerGovernor

ii
Stream Side ScienceLesson Plans and Water Related Activities
Third EditionJune 2012
This curriculum was made possible through funding from the Environmental Protection Agency, the United States Department of Agriculture, Cooperative State Research,Education, and Extension Service, the Utah Division of Wildlife Resources, and Utah State University Extension.

iii
Authors: Andree’ Walker (Utah State University Water Quality Extension)Nancy Mesner (Utah State University Water Quality Extension)
The following individuals provided valuable contributions and review of these materials.Ann Evans (Utah Division of Wildlife Resources), Lael Gilbert (Institute for Outdoor Recreation and Tourism), Steve Mangel (Davis County School District), Brett Moulding (Utah State Office of Education), Carolyn Robertson (Weber County School District), Russ Tucker (Davis County School District), Jen Vistacion (Utah Society for Environmental Education), Glen Westbroek (Alpine School District), and Jack Wilbur (Utah Department of Agriculture and Food).
Our special thanks to all the teachers and students who provided their expertise, time, and feedback in helping us develop these materials.
The activities in the Stream Side Science Curriculum are based on the Utah Stream Team Volunteer Moni-toring Manual (UST), written by John Geiger and Nancy Mesner (2002).
Additional copies of this curriculum or the Utah Stream Team Manual can be obtained by contacting USU Water Quality Extension at 5210 Old Main Hill, Logan UT 84322-5210 (435) 797-2580.
Utah State University is committed to providing an environment free from harassment and other forms of illegal discrimination based on race, color, religion, sex, national origin, age (40 and older), disability, and veteran’s status. USU’s policy also prohibits discrimination on the basis of sexual orientation in employment and academic related practices and decisions. Utah State University employees and students cannot, because of race, color, religion, sex, national origin, age, disability, or veteran’s status, refuse to hire; discharge; promote; demote; terminate; discriminate in compensation; or discriminate regarding terms, privileges, or conditions of employment, against any person otherwise qualified. Employees and students also cannot discriminate in the classroom, residence halls, or in on/off campus, USU-sponsored events and activities.
This publication is issued in furtherance of Cooperative Extension work, acts of May 8 and June 30, 1914, in cooperation with the U.S. Department of Agriculture, Noelle Cockett, Vice President for Extension and Agriculture, Utah State University.
Acknowledgements

1
Table of Contents
Introduction
Activities
Where’s the Water? What’s in the Water? Who Lives in the Water? Missing Macroinvertebrates Wetland Versus Stream Macroinvertebrates Riparian Review Nitrogen Cycle When Things Heat Up
Aquatic Invasion!
That’s Predictable
Water Management Biodiversity Debate Appendix A - Curriculum Connections
Appendix B - Sampling Safety
Appendix C - A Note on Units
Appendix D - Glossary
2
9
17
37
49
61
69
89
101
117
135
147
159
166
170
171
172

2
The 12 activities in Stream Side Science bring a water focus to standards and objectives in the Utah Core Curriculum for Junior High and High School math, science and social studies courses. These hands-on activities help students learn basic concepts while exploring watershed and water quality issues.
Each lesson plan contains background information, step by step instructions for the activity, suggestions for applying the data, and further discussion questions. Student worksheets, sampling instructions, and teacher resource pages are also provided. Tips on safety when working near a waterbody can be found in Appendix A. Correlations to the Utah State Core Curriclum are available upon request from Utah State University Water Quality Extension (www.extension.usu.edu/waterquality or 435-797-2580).
The curriculum was developed from the more comprehensive set of stream monitoring materials found in the Utah Stream Team Volunteer Monitoring Manual, which is available from Utah State University Water Quality Extension (www.extension.usu.edu/waterquality).
Introduction

3
Where’s the Water?In this classroom activity, a teacher led presentation helps students identify the reservoirs of the Earth’s water cycle and understand the relative amounts in each reservoir through estimation.
What’s in the Water?*On a field trip, or in the classroom, students will measure four abiotic factors (pH, dissolved oxygen, turbidity, and temperature). They will learn how these factors are influenced by external conditions such as location, land use, and pollution.
Who Lives in the Water?*Students explore diversity and adaptation to aquatic environments by observing aquatic macroinvertebrates collected in a stream.
Missing Macroinvertebrates*Students sort and count aquatic macroinvertebrates and use a simple index to predict the quality of the water where the organisms were collected. Wetland versus Stream Macroinvertebrates*Students will compare aquatic macroinvertebrates collected in wetland and stream sites and use these observations to understand the differences between the two environments. Riparian Review*On a field trip students will measure or observe biotic factors of a stream environment, including different measures of vegetation and wildlife.
Nitrogen Cycle*Students will diagram the nitrogen cycle following a teacher led discussion, and will measure nitrogen in water samples collected from different sources to better understand human impacts on the global nitrogen cycle.
Lesson Plans
The Stream Side Science activities are designed to be used individually, but may also be combined for use as an entire water study unit.

4
When Things Heat Up*Students will measure temperature and dissolved oxygen, and learn how these two abiotic factors affect each other and are affected by other physical and biological conditions in a stream or lake.
Aquatic Invasion*Students will investigate the distribution and life histories of an aquatic invasive species and understand the effects they have on aquatic ecosystems. That’s PredictableStudents will research and report on ecosystem changes that occur as a result of changes in abiotic or biotic factors such as a drought or the construction of a dam.
Water ManagementStudents will participate in a mock “community meeting” to discuss their positions on water use, water shortages, water distribution, and water quality.
Biodiversity DebateStudents will hold a debate about the construction of a dam in terms of biological, aesthetic, social, and economic arguments with regard to maintaining biodiversity.
* These lesson plans all include a field activity, during which data is collected and students develop a sense of place and context for the information being learned. To reduce the number of field trips, however, the field activities for all these lesson plans can easily be combined into a single trip.
As an alternative to class field trips, the teacher or a volunteer can collect samples prior to the class time and the entire activity can then be done in the classroom. The exception to this is Riparian Review, which requires that the field work be done by the students.
Lesson Plans, Continued
Lesson Plan Field Data Required What’s in the Water? - pH - Dissolved Oxygen - Temperature - TurbidityWho Lives in the Water? - Aquatic MacroinvertebratesMissing Macroinvertebrates - Aquatic Macroinvertebrates Wetland vs. Stream Macroinvertebrates - Macroinvertebrates at two sites Riparian Review - Streamside Vegetation Nitrogen Cycle - Wildlife - Nitrate When Things Heat Up - Temperature - Dissolved Oxgen
Introductory Activity - Use Where’s the Water? to introduce students to concepts of water distribution and use, and both the positive and negative impacts from human activities.
Activities that require field data - The field activities for Stream Side Science can be combined into a single field trip if you wish. Important elements in these lesson plans can be introduced prior to the field day so students have more context for their activities. We also suggest going over the different activities in the class prior to the field trip to help the field day run more smoothly. Working with data and discussion of the results can be done either in the field or can be spread out over several sessions back in the classroom. The following lessons require field data:
Follow Up Activities These lessons challenge students to use the information they have learned to demonstrate a more complete understanding of the concepts and to undertake more in-depth studies.
• That’s Predictable Can use data from What’s in the Water?, Who Lives in the Water?, and Riparian Review.
• Water Management Encourages students to use concepts introduced in Where’s the Water?, Riparian Review, When Things Heat Up, and That’s Predictable.
• Biodiversity Debate Can use data from What’s in the Water?, Who Lives in the Water?, Missing Macroinvertebrates, and Riparian Review.
How to Use These Activities
5

6
These lessons can be taught in any order or several can be taught as a unit to achieve a unique learning objective. See below for 3 suggested sequences
Chemical properties of stream/rivers.
1. Where’s the Water? – Introduce students to the location and relative amounts of water on the Earth.
2. What’s in the Water? – Simple tests for pH, DO, turbidity, and temperature. Introduce students to field and lab tech-niques.
3. Nitrogen Cycle – An opportunity to look at Nitrogen in more depth.
4. When Things Heat up – An opportunity to use analyzed data collected in previous lessons.
Biological properties of a stream system
1. Where’s the Water? – Introduce students to the location and relative amounts of water on the Earth.
2. Who Lives in the Water? – Students explore river habitats and observe invertebrates collected from the stream.
3. Missing Macroinvertebrates – Students use invertebrates to calculate a water quality index for a river or stream.
4. Wetland vs Stream Macroinvertebrates – Students com-pare invertebrates collected from a wetland environment and a stream environment.
5. Riparian Review – Students will measure or observe biotic factors such as vegetation and wildlife.
6. Aquatic Invasion! - Students will investigate aquatin inva-sive speices and the impacts they have on aquatic systems.
7. Biodiversity Debate – An opportunity to research and explore human impacts on biodiversity.
How to Use These Activities, Continued
6
Water management
1. Where’s the Water? – Introduce students to the location and relative amounts of water on the Earth.
2. What’s in the Water? – Simple tests for pH, DO, turbidity, and temperature. Introduce students to field and lab techniques.
3. Who Lives in the Water? – Students explore river habitats and observe invertebrates collected from the stream.
4. Riparian Review – Student will measure or observe biotic factors such as vegetation and wildlife.
5. That’s Predictable – Students will explore human impacts on the abiotic and biotic factors in an ecosystem.
6. Biodiversity Debate – An opportunity to research and explore human impacts on biodiversity.
7. Water Management – An opportunity to explore the use and management of water.
9
How to Use These Activities, Continued
7

8

Where’s the Water?
To identify the reservoirs of the Earth’s water cycle (e.g., oceans, icecaps / glaciers, atmosphere, lakes, rivers, ground water) locally and globally and graph or chart relative amounts in global reser-voirs.
Students will use 10 liters (approximately 2.5 gallons) of water to represent all the water on the earth. They will be given the percentage for each water source in relation to the total amount, and asked to divide the 10 liters of water to demonstrate this.
Approximately 72 percent of the earth is covered with water. Sources of water are the oceans, icecaps and glaciers, groundwa-ter, freshwater lakes, inland seas and salt lakes, the atmosphere, and rivers. In this activity, 10 liters of water in a bucket are used to represent all the water on the earth. See the table below for the percentage of each water reservoir in relation to the total amount, and the appropriate measurement for each reservoir.
Duration: Classroom 40 minutes
Setting: Classroom
Purpose:
Summary:
Background:
USU Water Quality Extension - Stream Side Science Where’s the Water?
The percentage of usable freshwater is reduced by pollution and availability (location). Therefore, the actual amount of water that is usable by humans is very small (approximately 0.00003 percent).
9
RESERVIOR APPROXIMATE % OF THE TOTAL AMOUNT MEASURMENT
Oceans 97.25 All water left in bucketIcecaps / glaciers 2.0 ~200 mlGroundwater 0.7 ~70 mlFreshwater lakes 0.006 ~3 mlInland seas / salt lakes 0.004 ~4 dropsAtmosphere 0.001 ~1 dropRivers 0.0001 ~1 flick

1. Show the students a map of the world or the globe. Ask them what the color blue represents (water). Ask them what percentage of the globe/earth is covered in water (72%). Is it all usable by humans? (No)
2. Ask the students to identify the various reservoirs of water on the earth other than oceans. As they give answers, make a list on the board in the front of the room. Students’ responses may in-clude reservoirs like dams, which would be included with lakes or rivers; wells, which come from groundwater; springs, which may be included in rivers, and so forth. The final list should be icecaps / glaciers, groundwater, freshwater lakes, inland seas / salt lakes, atmosphere, and rivers.
3. When the list on the board is complete, pass out the water distri-bution worksheet and divide the students into groups.
4. Give each group 10 liters of water in a bucket (approximately 2.5 gallons), graduated cylinders, an eye dropper and six small clear containers. Explain that the 10 liters represent all the water on the earth.
5. Have the students label the six small containers with the various water reservoirs (icecaps / glaciers, groundwater, freshwater lakes, inland seas / salt lakes, atmosphere, and rivers).
6. Ask the students to estimate the percentage of water in each reservoir. Have them measure the appropriate amount of water for each reservoir and record their data on the water distribution worksheet. Remind them that they will leave the ocean water in the bucket.
ClassroomActivity:
Where’s the Water?
USU Water Quality Extension - Stream Side ScienceWhere’s the Water?10
•Map of world or globe
For each group of students:•2.5 gallon water container (to hold the 10 liters)•Graduated cylinders
Materials:
•Eye dropper•10 liters of water •6 small clear containers (e.g., pint jars)

7. Discuss the results of the groups’ estimations. Where did they think most of the water was located? Is there more water in rivers or in the atmosphere?
8. After discussing the initial estimations, demonstrate to the class the actual amounts found in each reservoir (found on the table on the first page of this activity). Be sure to have the class fill in the correct amounts on the student worksheet.
1. How much of the water on the earth is actually available for human use? Logically, one would assume if you added the percentage of usable water sources, you would find the total amount of usable water. This does not work out to be true because the amount is reduced by pollution and availability (location). The actual amount is approximately 0.00003 percent.
2. How can students conserve water? There are many ways students can conserve water. Discuss the following tactics with your students:
Don’t leave the water running while brushing your teeth.Limit your showers to 10 minutes or less.Look around your house for leaky faucets. Ask your par-ents to fix them immediately.Keep a pitcher of water in the refrigerator so you don’t have to run the faucet and wait for the water to cool.Clean your sidewalks with a broom, not a hose.Wash your car or dog on the lawn instead of the driveway. This way your lawn gets watered too. Only wash full loads of dishes and laundry.
Where’s the Water?
USU Water Quality Extension - Stream Side Science Where’s the Water?
FurtherDiscussion:
11
12USU Water Quality Extension - Stream Side Science
Where’s the Water?
Where’s in the Water?
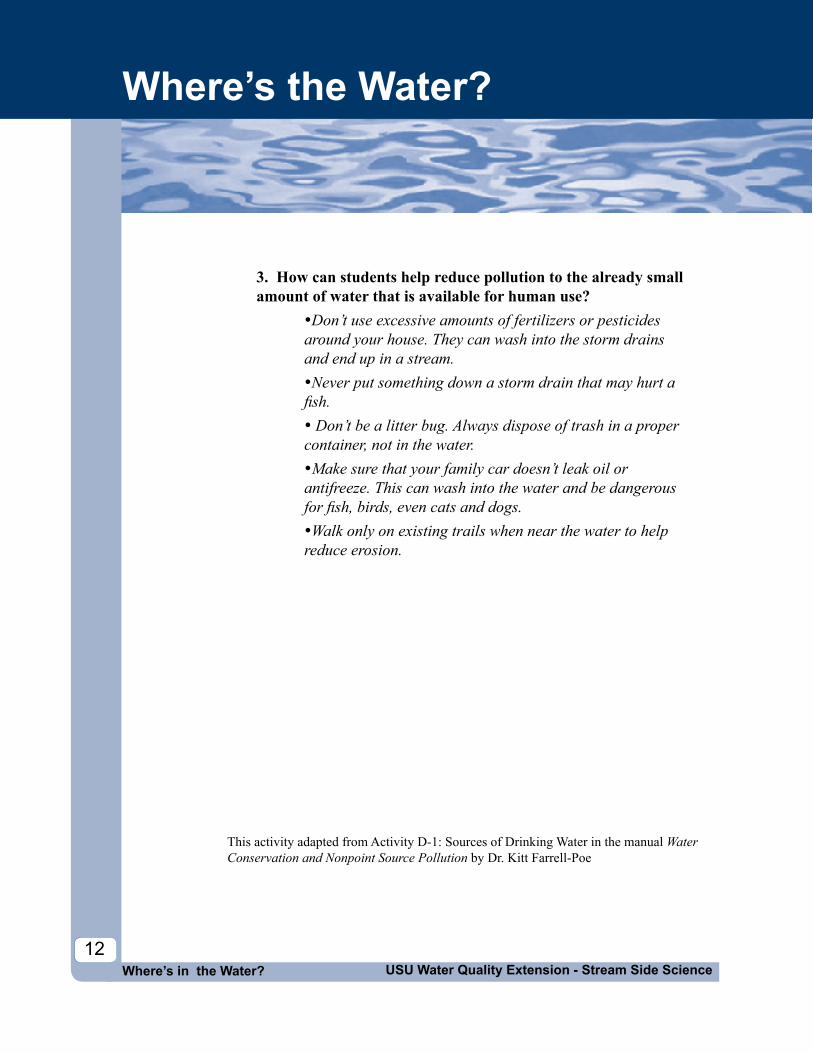
3. How can students help reduce pollution to the already small amount of water that is available for human use?
Don’t use excessive amounts of fertilizers or pesticides around your house. They can wash into the storm drains and end up in a stream.Never put something down a storm drain that may hurt a fish. Don’t be a litter bug. Always dispose of trash in a proper container, not in the water.Make sure that your family car doesn’t leak oil or antifreeze. This can wash into the water and be dangerous for fish, birds, even cats and dogs.Walk only on existing trails when near the water to help reduce erosion.
This activity adapted from Activity D-1: Sources of Drinking Water in the manual Water Conservation and Nonpoint Source Pollution by Dr. Kitt Farrell-Poe

Name: __________________________ Date: ___________________________
Estimate the percentage of water in each reservoir. Measure the appropriate amount in mil-liliters. (Remember that the total amount is 10 liters)
As your teacher demonstrates the true percentages and measurements found in each source, record the data below.
Conversion hints...1 liter = 1000 ml1 ml ~ 5 drops
Water Distribution Worksheet
USU Water Quality Extension - Stream Side Science Where’s the Water?13
Wor
kshe
et
RESERVOIR APPROXIMATE % OF THE TOTAL AMOUNT MEASUREMENT
Oceans All water left in bucketIcecaps / glaciersGroundwaterFreshwater lakesInland seas / salt lakesAtmosphereRivers
RESERVOIR APPROXIMATE % OF THE TOTAL AMOUNT MEASUREMENT
Oceans All water left in bucketIcecaps / glaciers mlGroundwater mlFreshwater lakes mlInland seas / salt lakes dropsAtmosphere dropsRivers

Measurement Conversion to Cups
USU Water Quality Extension - Stream Side ScienceWhere’s the Water?14
Res
ourc
e
If you would like to convert the measurements for this activity to cups, use the table provided below.
RESERVOIRAPPROXIMATE
% OF THE TOTAL AMOUNT
MEASUREMENT
Oceans 97.25% All water left in bucketIcecaps / glaciers 2.0% ~3/4 cupGroundwater 0.7% ~1/4 cupFreshwater lakes 0.006% ~1/8 tspInland seas / salt lakes 0.004% ~1/12 tspAtmosphere 0.001% ~1 dropRivers 0.0001% ~1 flick

USU Water Quality Extension - Stream Side Science Where’s the Water?15
Notes

16USU Water Quality Extension - Stream Side ScienceWhere’s the Water?

What’s in the Water?
Purpose:
Summary:
Background:
USU Water Quality Extension - Stream Side Science What’s in the Water?
Duration: Classroom 40 minutes Outdoors 50 minutes
Setting: Classroom Outdoors
To observe and list abiotic factors in specific ecosystems.
In this exercise, students will observe and list abiotic factors in an aquatic system and measure four of them (pH, dissolved oxygen, turbidity, and temperature).
For background information:• The Resource pages provided with this activity give additional information about each factor, including how that factor may vary at different locations, during different times, and some suggested discussion questions.
• The Chemical Properties section of the Utah Stream Team Man-ual defines each factor and discusses how the factor changes due to natural and human influences, why the factor is important in aquatic ecosystems, how to take a sample, and how to interpret the results.
• pH test kits * • Dissolved oxygen test kits * • Turbidity tubes * • Field thermometers * • Pencils• Bucket
1. Ask students to list all the abiotic factors they can think of in an aquatic system (e.g., solar radiation, physical structure of the stream or lake, surrounding landscape, weather, and the properties of water itself).
Materials:
ClassroomActivity:
• Copies of the student worksheet• Copies of the chemical sampling instruction sheets • Waste bottles (e.g., empty pop bottles)• Clipboards
17
* For information on equipment for loan or for purchase, contact USU Water Quality Extension at (435) 797-2580 or www.exten-sion.usu.edu/waterquality

18USU Water Quality Extension - Stream Side Science
What’s in the Water?
What’s in the Water?
2. Tell them they will be testing four of these factors that relate specifically to the water – pH, dissolved oxygen (DO), turbidity and temperature.
3. Define each of these factors. Talk about why these factors are important in an aquatic ecosystem, what can naturally influence these factors, and what humans can do to influence these factors. 4. Explain to the students that they will be going out to a stream (or other water body) to measure pH, DO, turbidity, and temperature. Sampling instruction sheets are found at the end of this lesson. You may want to review the actual testing procedures before going into the field.
1. Set up a station for each factor (pH, DO, turbidity, and temperature).
At each station, provide: • Sampling instruction sheets (if possible, laminate these!)• Waste bottles• The appropriate testing kit• Sample bottles if you are not near the stream
2. Divide the students into four groups. Provide each group with clipboards, pencils, and worksheets. Explain to the students that each group will start at a different station, and rotate so they will measure all the factors.
3. Have the students fill out the site observations section of the student worksheet before beginning their measurements. Have them follow the instructions for measuring each factor found on the sampling instruction sheets.
FieldActivity:
Safety First!Always consider safety factors when working near water.

USU Water Quality Extension - Stream Side Science
What’s in the Water?
What’s in the Water?
4. Have the students record their results on the student worksheet. You can choose to have one record keeper per group, or have each student record all the information.
ACTIVITY EXTENSIONS: • Use other water sources to compare results.• Sample the same station on multiple dates to compare results.• Take measurements on “modified samples” – see the Utah Stream Team Manual
Chemical Properties Section for more information.
Applying the Data:
This graph shows temperature change throughout a year at one site.
19
Have the students compile and graph the data to demonstrate a par-ticular pattern. For example:
• Create a time series graph to show changes in one factor over time.• Create a graph comparing the results from different water sources.• Create a graph comparing the results from different teams.• Create a graph that shows sample statistics (e.g., the mean and
standard deviation or range of different student measurements).• Create a graph that shows the relationship between different fac-
tors (e.g., samples at different times or from different sources).
See sample graphs below and on the following page.
Tem
pera
ture
(°C
)
Month
FurtherDiscussion:
USU Water Quality Extension - Stream Side Science
What’s in the Water?
What’s in the Water?
(See additional discussion questions relating to each measurement in the Resource pages.)
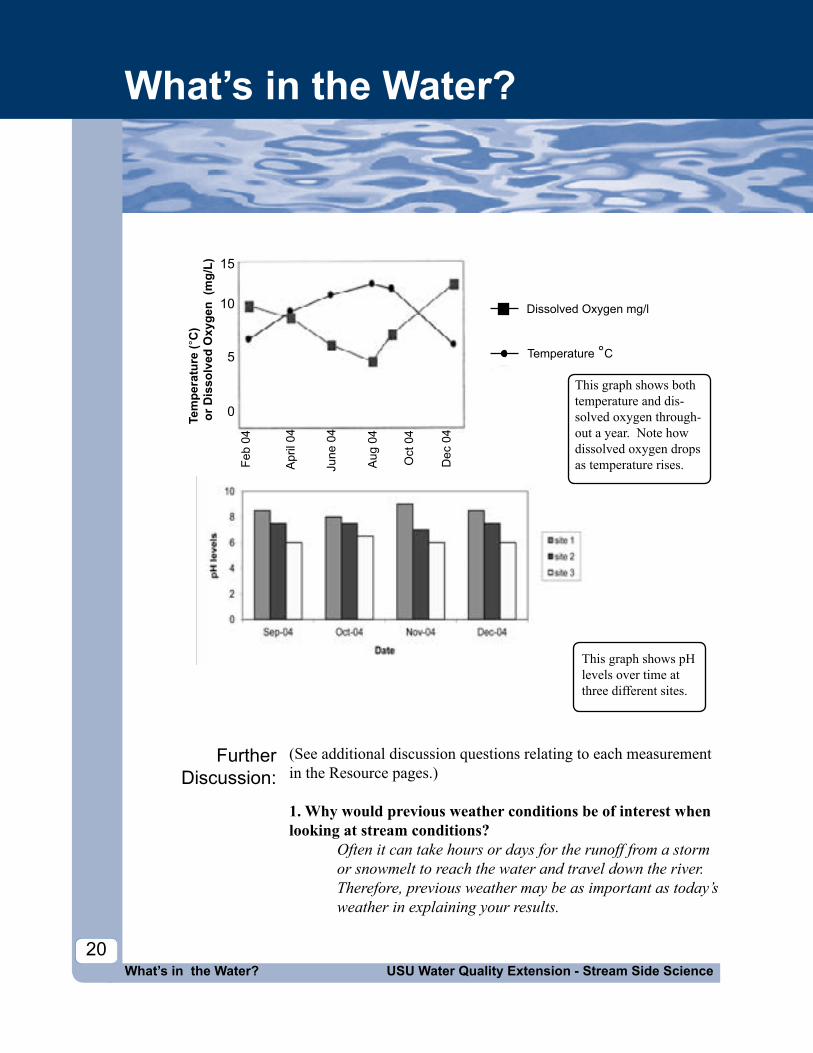
1. Why would previous weather conditions be of interest when looking at stream conditions?
Often it can take hours or days for the runoff from a storm or snowmelt to reach the water and travel down the river. Therefore, previous weather may be as important as today’s weather in explaining your results.
This graph shows pH levels over time at three different sites.
20
This graph shows both temperature and dis-solved oxygen through-out a year. Note how dissolved oxygen drops as temperature rises.
Dissolved Oxygen mg/l
15
10
5
0Tem
pera
ture
(°C
) o
r Dis
solv
ed O
xyge
n (m
g/L)
Feb
04
Apr
il 04
June
04
Aug
04
Oct
04
Dec
04
Temperature °C

USU Water Quality Extension - Stream Side Science
What’s in the Water?
What’s in the Water?
2. How do you think the abiotic factors you observed at the site may have affected your measurements?
• Hot weather may result in extra snowmelt upstream and increase flows. Sunny weather may increase photosynthesis at your site, and therefore increase dissolved oxygen and pH levels. Higher flows from storms or snowmelt may increase the turbidity in your stream. • Soils in the watershed will affect the chemical composition of the runoff that reaches the stream. Topography (the steepness of the land) will determine whether the stream is steep and fast or slow and wide, which will affect dissolved oxygen and temperature. • Vegetation along the stream provides shade and protects the banks from erosion.• Land uses along the stream and in the watershed will de-termine what type of pollutants may enter the stream (e.g., sediment from agriculture or logging, metals and oils from roads, or fertilizers from golf courses).
3. Discuss variability in the data, or discuss why the measurements may be variable.
There is always natural variability in ecosystems (see the discussion question above). When we take measurements, we also introduce some variability due to differences in observers (eye sight, experience) and limitations of the equipment.
4. Discuss why the results might change under the following conditions. (See the Resource pages that follow about each param-eter to help guide this discussion).
• seasons• from year to year• throughout the day
21
What’s in the Water?
Student Worksheet
USU Water Quality Extension - Stream Side ScienceWhat’s in the Water?
Name: ___________________________ Group #: ____________________Date: __________________________ Site ID: _____________________
Site Observations:
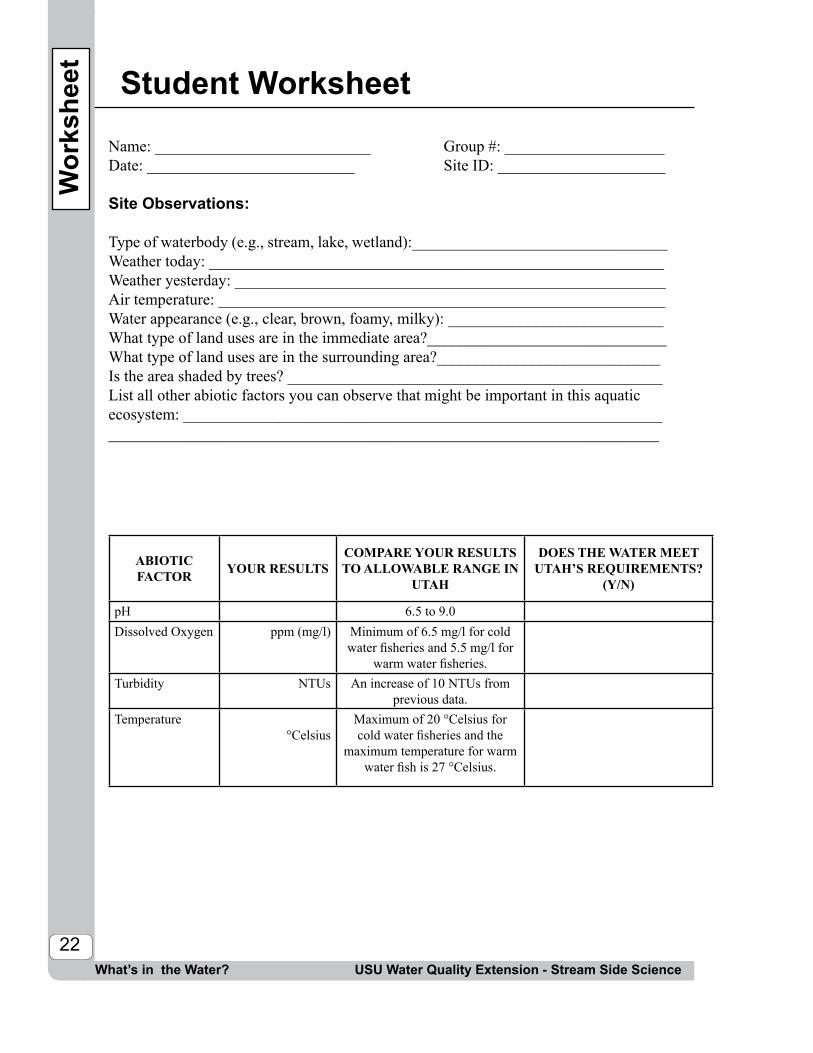
Type of waterbody (e.g., stream, lake, wetland):________________________________Weather today: _________________________________________________________Weather yesterday: ______________________________________________________Air temperature: ________________________________________________________Water appearance (e.g., clear, brown, foamy, milky): ___________________________What type of land uses are in the immediate area?______________________________What type of land uses are in the surrounding area?____________________________Is the area shaded by trees? _______________________________________________List all other abiotic factors you can observe that might be important in this aquatic ecosystem: _________________________________________________________________________________________________________________________________
22
Wor
kshe
et
ABIOTICFACTOR YOUR RESULTS
COMPARE YOUR RESULTS TO ALLOWABLE RANGE IN
UTAH
DOES THE WATER MEET UTAH’S REQUIREMENTS?
(Y/N)
pH 6.5 to 9.0Dissolved Oxygen ppm (mg/l) Minimum of 6.5 mg/l for cold
water fisheries and 5.5 mg/l for warm water fisheries.
Turbidity NTUs An increase of 10 NTUs from previous data.
Temperature°Celsius
Maximum of 20 °Celsius for cold water fisheries and the
maximum temperature for warm water fish is 27 °Celsius.

USU Water Quality Extension - Stream Side Science
pH Sampling Instructions
What’s in the Water?
Step 1 Dip one strip of indicator (litmus) paper into the stream for 30 seconds then pull it out.
Step 2Wait 2 minutes.
Step 3Compare the color of the litmus paper to the pH color key on the pH box.
Step 4Record the number associated with the correct color match on the student worksheet.
Remember: Take pH readings directly in the stream. If this cannot be done safely, collect water in a bucket or a sample bottle and immediately take the pH reading.
Time – 2 minutesPersons – 1Materials – pH strips
In Utah:The allowable range of pH is 6.5 to 9.0.
23
Sam
plin
g

Dissolved Oxygen Sampling Instructions
USU Water Quality Extension - Stream Side ScienceWhat’s in the Water?24
Sunlight can damage the ampoules in your DO kit. Keep them shaded at all times.
Step 1 1. Pre-rinse collection bottle with stream water.2. Fill the sample cup to the 25 ml mark with your sample.
Step 2 1. Place the glass ampoule in the sample cup. 2. Snap the tip by pressing the ampoule against the side of the cup.3. The ampoule will fill, leaving a small bubble that will help you mix the contents.
Step 31. Mix the contents of the ampoule by turning it up and down several times, allowing the bubble to travel from end to end each time.2. Wipe all liquid from the outside of the ampoule.
Step 41. Wait 2 minutes for color development.
Step 51. With the sun (or another light source) shining on the comparator (rack of colored tubes) from directly above, place the dissolved oxygen ampoule between the color standards for viewing. It is important that the ampoule be compared by placing it on both sides of the color standard tube before deciding that it is darker, lighter or equal to the color standard.2. Record the concentration of the best color match.
Time – 3 minutesPersons – 1Materials – Chemetrics Dissolved Oxygen Sampling Kits
In Utah:The minimum concentration for coldwater fish is 6.5 mg/l.The minimum concentration for warmwater fish is 5.5 mg/l.
Sam
plin
g
Turbidity Sampling Instructions
USU Water Quality Extension - Stream Side Science What’s in the Water?25
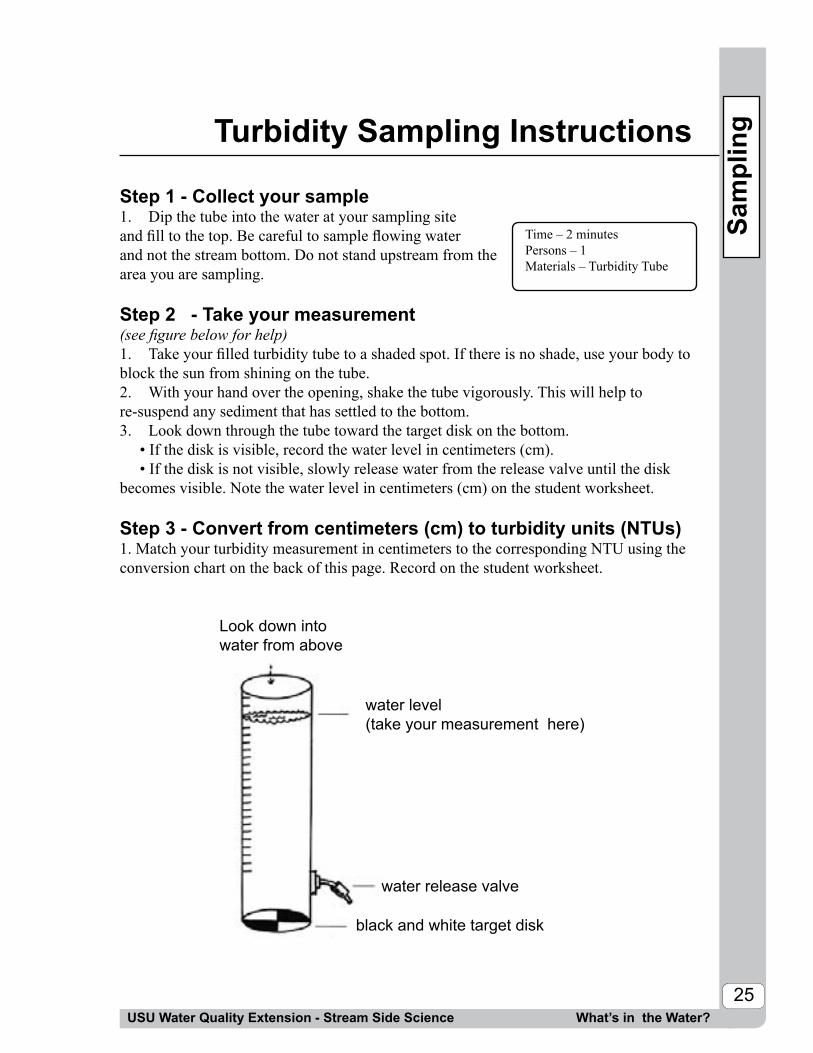
Step 1 - Collect your sample1. Dip the tube into the water at your sampling site and fill to the top. Be careful to sample flowing water and not the stream bottom. Do not stand upstream from the area you are sampling.
Step 2 - Take your measurement(see figure below for help)1. Take your filled turbidity tube to a shaded spot. If there is no shade, use your body to block the sun from shining on the tube.2. With your hand over the opening, shake the tube vigorously. This will help to re-suspend any sediment that has settled to the bottom.3. Look down through the tube toward the target disk on the bottom. • If the disk is visible, record the water level in centimeters (cm). • If the disk is not visible, slowly release water from the release valve until the disk becomes visible. Note the water level in centimeters (cm) on the student worksheet.
Step 3 - Convert from centimeters (cm) to turbidity units (NTUs)1. Match your turbidity measurement in centimeters to the corresponding NTU using the conversion chart on the back of this page. Record on the student worksheet.
Time – 2 minutesPersons – 1Materials – Turbidity Tube
Look down into water from above
water level(take your measurement here)
water release valve
black and white target disk
Sam
plin
g

Turbidity Conversion Chart
USU Water Quality Extension - Stream Side ScienceWhat’s in the Water?26
Sam
plin
g
In Utah: An increase of more than 10 NTUs (from one time to another or from one location to another downstream) violates water quality criteria.
Turbidity Conversion ChartDistance from bottom of tube (cm) NTUs< 6 >2406 to 7 2407 to 8 1858 to 9 1509 to 10 12010 to 12 10012 to 14 9014 to 16 6516 to 19 5019 to 21 4021 to 24 3524 to 26 3026 to 29 2729 to 31 2431 to 34 2134 to 36 1936 to 39 1739 to 41 1541 to 44 1444 to 46 1346 to 49 1249 to 51 1151 to 54 1054 to 58 958 to 60 8Over the top 6

Temperature Sampling Instructions
USU Water Quality Extension - Stream Side Science What’s in the Water?
Step 11. Dip the thermometer into a moving part of the stream or river.
2. Wait for the temperature to stop changing (at least 1 minute).
Step 21. Read the temperature and record on the student worksheet.
Converting Fahrenheit to Celsius: °C = (5/9) x (°F - 32)
Converting Celsius to Fahrenheit: °F = [(9/5) x °C] + 32
Time – 2 minutesPersons – 1Materials – Thermometer
In Utah:The maximum temperature allowed for warm water fisheries and aquatic wildlife is 27° C (81° F).
The maximum temperature allowed for cold water fisheries and aquatic wildlife is 20° C (68° F).
27
Sam
plin
g

pH
USU Water Quality Extension - Stream Side ScienceWhat’s in the Water?28
What is pH?pH is a measurement of how acidic or alkaline (basic) the water is. pH is measured on a scale of 0 to 14, with 0 being the most acidic, and 14 being the most basic. Distilled water, which has no impurities, is neutral, and has a pH of 7.
Refer to the Utah Stream Team Manual for more information on the definition and importance of pH to fish and other aquatic life, and how natural and human activities affect pH levels.
pH must be measured in the field. The pH will change if the water is collected and stored, and will not reflect the true value at the site.
Discussion Questions for pH:
1. Why does the pH of rainwater or snowmelt increase as the water moves over a landscape?
Soils in Utah contain acid neutralizing minerals, such as calcium and magnesium compounds, which are dissolved by the water as it moves through the soil and over the land. These minerals neutralize the acid in the rain. In some areas, the geology does not contain these minerals (for example the Adirondack Mountains in New York) and the acids in the water are not neutralized.
2. What is acid rain? Acid rain is caused by air pollution such as sulfur and nitrogen oxides, which dis-solve in rain water and form strong acids. Soils in Utah contain enough neutral-izing compounds to buffer these acids (see #1), but in poorly buffered soils, lakes and streams can become so acidic that fish and other organisms cannot survive.
3. How does pH affect living organisms? pH affects the function of membranes in living organisms. Therefore even moderately acidic waters may irritate the gills of fish and aquatic insects, and may reduce the hatching success of eggs. Many amphibians are particularly vulnerable because their skin is so sensitive to pollution.Changes in pH may also affect the chemicals in the water. For example, ammonia is harmless to fish in water that isn’t acidic, but becomes much more toxic in acidic water. Lower pH causes certain heavy metals to dissolve, resulting in toxic concentrations of these metals when the pH is low.
Res
ourc
e

pH (continued)
USU Water Quality Extension - Stream Side Science What’s in the Water?
29
Suggested sources of water samples, with expected results and explanation. Res
ourc
e
Water Source Expected result Explanation
Rain water low (~5.6-6.0)
Natural rainwater is slightly acidic because the rain dissolves atmospheric carbon dioxide, forming carbonic acid.
Snowmelt low (~5.6-6.0)
Like rain, snow is slightly acidic. During rapid snow-melt events, snowmelt may run directly into the streams with no buffering by contact with soils.
Stream water varies (6.5-9.0)
The results will vary depending on geography, location, season, and the time of day. See UST Manual.
Tap Water neutral (~7.0)
Dissolved calcium, magnesium and other compounds in most Utah surface and groundwater neutralizes the water.
Groundwater neutral to high (7.0-8.5)
Same as above, but may be more alkaline because the groundwater has more contact with buffering materials due to the longer storage time.
Ponds/lakes (high productivity)
high (>9)
Will vary according to local geology and may vary during the day if many aquatic plants are present. Photosynthesis removes the carbonic acid from water, making the water more alkaline (increasing pH). This effect is strongest in the late afternoon of a sunny day.
Sphagnum (peat moss) bogs
low (5-6)
Sphagnum and other mosses absorb calcium and magnesium, and release hydrogen ions into the water, lowering the pH.

Dissolved Oxygen (DO)
USU Water Quality Extension - Stream Side ScienceWhat’s in the Water?30
What is Dissolved Oxygen?Dissolved oxygen (DO) is a measurement of the concentration of the O2 molecules that are actually dissolved in water. This is the form of oxygen that fish and aquatic insects need.
Oxygen is not very soluble in water. At most, about 12 parts of oxygen can dissolve in a million parts of water (12 mg/liter). The maximum amount of oxygen that can dissolve in water is called saturation concentration. The saturation concentration decreases as water temperature or elevation increases.
Refer to the Utah Stream Team Manual for more information on the definition and importance of DO to fish and other aquatic life, and how natural and human activities affect DO levels.
DO must be measured in the field. The DO will change if the water is collected and stored, and will not reflect the true value at the site.
Discussion Questions for Dissolved Oxygen:
1. How does oxygen get into water?Oxygen is dissolved into water by contact with the atmosphere, or from aquatic plants that produce oxygen during photosynthesis. Therefore, oxygen will be higher in turbulent stream water (mixing with the atmosphere) or in water with many plants (but only during the day, when photosynthesis can occur).
2. How does oxygen get used up in water?The respiration of animals and plants uses oxygen. Bacterial decomposition of dead organic materials can also be a major factor, and may cause the dissolved oxygen to be completely consumed in deep pools or lakes. Some chemical reactions (oxidation reactions) also require and consume oxygen.
3. How will dissolved oxygen concentrations be affected by the dumping of yard clippings or the runoff of animal manure?
The decomposition of organic materials such as these may use all the available oxygen in the water. Secondary treatment by municipal treatment plants removes the organic material from the water for just this purpose. Before municipal wastewater was treated properly, many rivers and streams had fish kills and dead zones caused by low oxygen as this waste decomposed.
Res
ourc
e

Dissolved Oxygen (continued)
USU Water Quality Extension - Stream Side Science What’s in the Water?31
Res
ourc
e
Water Source Expected Results Explanation
Fast moving cool stream high (>10 mg/l)
Turbulence mixes atmospheric oxygen into the water. The water may even be super-saturated.
Still water (e.g. productive pond water)
may vary throughout the day: lower at night (<4 mg/1) and much higher in the late afternoon. (>10 mg/l)
No turbulence to mix the oxygen. Plants produce oxygen, but the plants respiration and decay may also use it up.
Warm water low (<8 mg/l) Warm water holds less oxygen than cold water.
Stream water in a closed jar without any plants
low to moderate (6-8 mg/l)
No plants to produce oxygen, no opportu-nity for mixing with atmospheric oxygen. Note: microscopic plants may complicate results.
Stream water in a closed jar with leaf litter (dead or decaying plants)
low (<6 mg/l) Decaying plants/leaf litter use the oxygen in the water.
Suggested sources of water samples, with expected results and explanation.

Turbidity
USU Water Quality Extension - Stream Side ScienceWhat’s in the Water?32
Res
ourc
e
What is Turbidity? Turbidity is a measure of how much suspended material is in the water. Turbidity may be caused by eroded sediment, organic debris, suspended minerals, or by microscopic plants growing in the water.
Refer to the Utah Stream Team Manual for more information on the definition and importance of turbidity to fish and other aquatic life, and how natural and human activities affect turbidity levels.
The turbidity will change if the water is collected and stored, and will not reflect the true value at the site if the particles settle to the bottom. Make sure you shake a stored sample before measuring turbidity.
Discussion Questions for Turbidity:
1. Why does turbidity often increase in a stream when the flow increases? As the velocity of water increases, the increased energy of the water can carry more sediment. In very quiet waters the sediment will settle out. This is easily demonstrated by shaking a closed bottle with water and a little sand or silt. The sand stays suspended until the bottle is placed down, at which point the sand or silt will settle. Note that the heavier sand particles settle first.
2. How might different land uses (logging, agriculture, construction) affect turbidity of nearby streams?
All of these activities may disturb the land and increase the potential for erosion. In all cases, turbidity might increase, especially during a rainstorm or if snowmelt runs off over these disturbed sites. Irrigation return flows may carry sediment directly from the field back to a stream.
3. Why does turbidity matter in a stream?In most streams, turbidity is a measurement of the amount of suspended sediment (silt, etc.) in the stream. Most streams can handle a certain amount of sediment (depending on the size and shape of the stream). However, if a major source of additional sediment occurs (from eroding banks or from changes in land uses), the stream may receive more sediment than it can transport. In these cases, the sediment will settle and may cover up important habitat for aquatic insects, or smother the eggs of fish.

Turbidity (continued)
USU Water Quality Extension - Stream Side Science What’s in the Water?33
Res
ourc
e
Suggested sources of water samples, with expected results and explanation.
Water Source Expected Results Explanation
A river or stream in the mid-summer to early fall low
Flows are generally lower in the early fall, so the water doesn’t have as much energy to carry sediment.
A river or stream in the spring high Flows are generally higher in the spring,
so there is more energy to carry sediment.
Productive pond highAlgae and other plant matter (rather than inorganic sediment) will cause the water to be turbid.
NOTE: If you cannot sample where there is varying turbidity, use the following to demonstrate turbidity.
Clear water/Tap water low Clear water has few suspended solids, so it will have the lowest turbidity.
Water with 2 grams of silt per gallon higher
Turbidity is a measurement of the suspend-ed solids in the water so adding silt will cause the turbidity to be higher.
Water with 2 grams of sand per gallon moderate
Turbidity is a measurement of the num-ber of suspended soilds in the water (not the mass) so, 2 grams of sand will be less turbid than 2 grams of silt.

Temperature
USU Water Quality Extension - Stream Side ScienceWhat’s in the Water?34
What is Temperature?Temperature is the measure of how much heat energy water contains. A stream’s temperature is affected by the season, but also by the source of water, the geographic area of the stream, the shape of the channel, and whether the stream is shaded. Most aquatic organisms require a specific temperature range, and many of our sport fish require cold water.
Refer to the Utah Stream Team Manual for more information on the definition and importance of temperature to fish and other aquatic life, and how natural and human activities affect temperature levels.
Temperature must be measured in the field. The temperature will change if the water is collected and stored, and will not reflect the true value at the site.
Discussion Questions for Temperature:
1. Draw a graph of the temperature of a high mountain stream for an entire year. Draw another line on the graph to show how the temperature might change as you move further down the river.
Temperatures in streams can change beyond the obvious seasonal differences. The temperature in streams is often cold near the headwaters (snowmelt or shallow springs) and warm up as the stream moves down through the watershed. Shading (riparian vegetation) and the width and depth of the stream will all affect a stream’s temperature.
2. How will groundwater entering a stream affect its temperature?Groundwater is usually colder than surface water and therefore would probably cool the stream. Some areas in Utah, however, have hot springs which introduce heat and minerals to a stream. Because the temperature of the groundwater doesn’t fluctuate much throughout a year, a stream with a major groundwater component may show less seasonal variability than a stream fed entirely by surface runoff.
3. Discuss how different land uses (e.g., logging, road building, agriculture, urban uses) might affect temperature.
The major influences on temperature in a stream are exposure to the sun and exposure to heated surfaces. Any activity that causes a stream to become shallower and wider (this can happen when too much sediment enters a stream) will cause the stream to heat more rapidly. When trees along the banks are removed, the loss of shading can cause the stream to heat up. Water that is diverted (such as for irrigation) and then returned to the stream usually heats up. Finally, streams with small flows will heat faster than streams with lots of water, so removing water from a stream can cause an increase in temperature.
Res
ourc
e

Temperature (continued)
USU Water Quality Extension - Stream Side Science What’s in the Water?35
Res
ourc
e
Suggested sources of water samples, with expected results and explanation.
Water Source Expected Result Explanation
A stream or river in the late sum-mer / early fall
warmerWarm air temperatures, plus no source of cold water (e.g., snowmelt) cause streams to be warmer in the late summer / early fall.
A stream or river in the spring or winter
cooler Cold air temperatures, plus snowmelt in the spring lowers the temperature of the water.
A stream near its headwaters cooler The water source is snowmelt or groundwater. These
streams are also usually shaded by trees and bushes.
A stream after it has traveled through a large valley or through a city
warmer (compared to the headwater stream)
The water warms as it travels away from the headwaters due to solar radiation and heat transfer from the stream bed and banks. Areas with little riparian vegetation (no shading) will heat faster. Streams with concrete banks (e.g., urban areas) will absorb heat from these artificial banks.
Near a hot spring warmer Hot spring water will mix with the stream water, raising the temperature.

36USU Water Quality Extension - Stream Side ScienceWho Lives in the Water?

Who Lives in the Water?
Purpose:
Summary:
Background:
USU Water Quality Extension - Stream Side Science Who Lives in the Water?
Duration: Classroom 20 minutes Outdoors 50 minutes +travel time
Setting: Classroom Outdoors
Materials:
ClassroomActivity:
37
To investigate the diversity in a specific area through observation and charting.
In this exercise, students will collect and observe macroinvertebrates in an aquatic system. They will record and summarize their findings.
For background information see the macroinvertebrate section of the Utah Stream Team Manual for information about macroinvertebrates and natural and human influence on macroinvertebrate populations.
• Kick nets* • Bucket • Plastic pans* • Pencils • Transfer pipettes* • Clipboards • Magnifying glasses* • Plastic petri dishes* • Copies of student worksheet • Waders • Macroinvertebrate keys and photos* • Copies of macroinvertebrate sampling instructions If you wish to preserve samples: • Ethanol or isopropyl alcohol (70% alcohol, 30% water) • Small glass vials* 1. Tell your students this activity will focus on the diversity of
macroinvertebrates found in an aquatic ecosystem. a. Ask the students to define the term aquatic macroinvertebrate. (An organism that is large enough to see with the naked eye, and has no backbone.)b. Ask the students to define the term diversity. (The number of
different species found in an area.)
* For information on equipment for loan or for purchase, contact USU Water Quality Extension at (435) 797-2580 or www.extension.usu.edu/waterquality

USU Water Quality Extension - Stream Side ScienceWho Lives in the Water?
FieldActivity:
Who Lives in the Water?
c. Have students compare two different stream types (e.g., a small fast moving stream versus a large slow stream). Ask students what adaptations organisms would need to allow them to live in each environment. Why would the adaptations differ? (Examples include: external conditions such as climate; the degree to which a system is isolated from other areas; different types of physical habi-tats; condition of the water, including chemical conditions, temperature, clarity, velocity, depth, food avail-ability, and presence of predators).
2. Review common macroinvertebrates found in your area with the students. Be sure they are familiar with the keys they will be using in the field. If you would like a larger, laminated version of the key provided in the Resource pages, please contact USU Water Quality Extension at (435) 797-2580. 3. Review instructions for sampling and processing macroinverte-brates with your students before they go into the field.
1. Set up stations for sampling macroinvertebrates (if possible set up enough stations to have about five students at each). These areas should be easily accessible and should represent different conditions, such as different substrates (pebble, cobble, or silt), different flow conditions (running water or still backwater), or areas with leaf and woody debris.
Each station should include: • Sampling instruction sheets (it helps to laminate these!)• Waders • Kick net• Plastic pan• Transfer pipettes• Magnifying glasses
Safety First!Always consider safety factors when working near water.
• Petri dishes• Macroinvertebrate keys
38

USU Water Quality Extension - Stream Side Science39
Who Lives in the Water?
Who Lives in the Water?
2. Demonstrate with two students how to safely collect samples with a kick net.
3. Divide the students into groups. Provide each group with clipboards, pencils, and student worksheets. Each group will sample at a different station.
4. At each station, the students will put the samples into plastic pans and sort them with transfer pipettes and petri dishes.
5. Have the students follow the instructions for sampling and sort-ing macroinvertebrates on the macroinvertebrate sampling sheet.
6. Have the students record their results onto the macroinvertebrate worksheet. You can choose to have one record keeper per group, or have each student record all the information.
7. You may want to preserve some macroinvertebrates to keep in the classroom. To do this, place the macroinvertebrate into a glass vial or collection bottle and fill with 70% alcohol and 30% water.
ACTIVITY EXTENSIONS: • Use other water sources or other locations along a single river or stream to
compare results (see the activity Wetland versus Stream Macroinvertebrates).• Sample the same stations on multiple dates to compare results.• Research factors that would contribute to a decline in the diversity of
macroinvertebrates (refer back to the activity What’s in the Water? and/or see the activity Missing Macroinvertebrates).
Remind the student to observe the behaviors and adaptations of the macroinvertebrates. How do they move? How do they eat? Are they adapted for one area over another?

USU Water Quality Extension - Stream Side Science40
Who Lives in the Water?
Who Lives in the Water?
• Have the students calculate the diversity for each area they sampled. The simplest method is to count the number of different types of organism in each sample. See the Further Discussion sec-tion below for other thoughts on diversity calculations.• Have students present data in tables or graphs (see example below).• Compare results from different sites.
This graph shows the diversity of macroinvertebrates at Silver Creek.
Applying the Data:
Mayfli
es
Caddi
sflies
Snail
s
Macroinvertebrate Sample - Silver Creek4
3
2
1
0Num
ber o
f typ
es fo
und
Ston
eflies Flies
Midge
flies
Macroinvertebrates
FurtherDiscussion:
USU Water Quality Extension - Stream Side Science41
Who Lives in the Water?
1. What habitats had the greatest diversity? What habitats had the lowest diversity? Why?
More diverse aquatic habitats provide more niches or microhabitats that specialized organisms may inhabit. Therefore, cobble bottomed streams may have more types of organisms living in them than a silt bottomed backwater. Keep in mind, however, that many other factors may affect the diversity you observe. The absence or presence of predators can greatly affect diversity and food availability may restrict certain types of organisms. In addition, many aquatic organisms are susceptible to water pollutants or even to increases in water temperature. In these situations, so-called “pollution tolerant” species may be all you will see. Refer to the Missing Macroinvertebrates lesson plan for more specifics on pollution tolerance.
2. How might water pollution affect the diversity you observed?
Typically, in polluted water, many sensitive species will disappear. Often these systems will still have a high abundance of organisms, and may even have higher total abundance of organisms than “pristine” systems, but the number of different types of species is greatly reduced.
3. How do adaptations of the insects allow them to inhabit dif-ferent niches in an aquatic ecosystem?
The organisms you collect display an array of adaptations to their unique environment. For example, most organisms you collect in fast moving water either have clawed feet for holding on, have a very streamlined body, or may have some means of attaching to the rocks. Organisms found in soft silt in quiet waters may experience low oxygen conditions. You may find “blood worms,” which are dipteran fly larvae. The red color is from hemoglobin, which helps theseorganisms trap oxygen when there isn’t much around.
Who Lives in the Water?

USU Water Quality Extension - Stream Side Science42
Who Lives in the Water?
Who Lives in the Water?
4. Would you expect to find similar degrees of diversity and similar adaptations to similar habitats in other parts of the world?
Probably, all else being equal, you might expect the same level of diversity in similar situations. The level of diversity is one ecological measure that scientists use worldwide to compare systems.
5. Would you expect to find the exact same species (types) of organisms? The actual species present would probably be very different, and would reflect the evolutionary history of that particular continent or region.
6. What is the best way to express diversity in an ecosystem? There are many different diversity indices (a numeric value representing diversity). The simplest diversity index is simply the number of species found at a site. Other more complicated diversity indices weigh the index according to the number of individuals found for each species.For example, a class collects two samples with 10 species each. However, Sample 1 had 91 individuals of one species and only 1 individual of each other species while sample 2 had 10 individuals of each species. Are these equally diverse?

USU Water Quality Extension - Stream Side Science
Who Lives in the Water?
Who Lives in the Water?
Notes
43

USU Water Quality Extension - Stream Side ScienceWho Lives in the Water?
44
Macroinvertebrate WorksheetW
orks
heet
Name: ___________________________ Group #: ______________________Date: ____________________________ Site ID: _______________________
MACROINVERTEBRATES TALLY OF TYPES OF INDIVIDUALS
Ephemeroptera (mayflies)
Odonata (dragonflies and damselflies)
Plecoptera (stoneflies)
Trichoptera (caddisflies)
Diptera (flies)
Megaloptera (fishflies and dobsonflies)
Coleptera (beetles)
Amphipoda (shrimp and scuds)
Ispoda (sow bugs)
Decapoda (crayfish)
Catropoda (snails)
Pelecypoda (mussels and clams)
Oligochaeta (all segmented worms except leeches)
Hirudinea (leeches)
Other

USU Water Quality Extension - Stream Side Science
45
Macroinvertebrate Sampling
Who Lives in the Water?
Step 1 - Choose your sample site
Select sampling reaches that are safe and easily accessed by everyone in your group. A riffle will offer the best variety of organisms.
Step 2 - Collect your sample If you are sampling in flowing water:1. Wade into the stream and place your net so the mouth of the net is perpendicular to and facing the flow of water.2. Stand upstream of the net and disturb the stream bottom with your feet and hands. 3. Carefully pick up and rub stones directly in front of the net to remove attached organisms. The stream bottom material and organisms will be carried by the current into the net. If the rocks are lodged in the stream bottom, rub them vigorously, concentrating your effort on any cracks or indentations.4. After removing all large stones, disturb the sand and gravel to a depth of about 3 inches by raking and stirring with your hands.5. Continue this process until you can see no additional animals or organic matter being washed into the net.
If you are sampling in pools or highly-vegetated areas:1. Scoop material from the stream bottom with the net. Try to scoop up as little sediment as possible as this will make it difficult to sort the macroinvertebrates.2. Push and pull the net through aquatic vegetation.3. Hand pick organisms from sticks and other structures.4. Continue until you have at least 100 organisms.
Step 3 - Empty your sample
1. Hold your sampling net over a plastic pan and use a bucket of stream water to wash the material into the pan.2. If your sample contains a lot of rocks or debris, stir the sample in the pan to suspend the animals, then pour the suspended material back into your net. Rinse the debris from the pan, then wash the animals in the net back into the pan.
Time – 40 minutesPersons – 2 Materials -
• kick net• plastic pan• transfer pipettes• plastic petri dishes• magnifying glasses • dichotomous key• ruler
OPTIONAL• 5 gallon bucket for decanting• waders
Sam
plin
g

USU Water Quality Extension - Stream Side ScienceWho Lives in the Water?46
Macroinvertebrate Sampling (Continued)Sa
mpl
ing
Step 4 – Sort out 100 macroinvertebrates.
1. Pour most of the water from the pan, so that the materials and animals are no longer floating. Distribute the material evenly in the bottom of the pan.
2. Take a ruler and divide the material in half. Remove one half of the material from the pan.3. Redistribute the material again over the bottom of the pan and divide this
material again with a ruler.4. Continue this process until you have a sample with about 100 organisms total.5. Add some stream water back into the pan for easier sorting.6. Sort and identify the macroinvertebrates. Use petri dishes to group similar organisms.7. Keep track of the number of types of organisms on the macroinvertebrate worksheet.
For example, if you collect two mayflies, but they have distinct differences, record that you have two types of mayflies.

USU Water Quality Extension - Stream Side Science47
Key to Aquatic Invertebrates in Utah
Who Lives in the Water?
Res
ourc
e
No
Shel
ls
Lee
ch(H
irud
inea
)
4 pa
ir o
f leg
s
Scud
(Am
phip
od)
10 +
legs
Wor
m li
ke
Sow
bug
(Iso
pod)
No
legs
Cra
yfis
h (D
ecap
oda)
Flat
wor
m
(Tur
bella
ria)
With
tent
acle
s, b
rush
es o
r
Leg
s
Shel
ls
Sing
le S
hell
Dou
ble
Shel
l
Snai
ls(G
astr
opod
a)C
lam
s, M
usse
ls
(Biv
alvi
a)
Fly
larv
e
Wat
er m
ite
(Tro
mbi
difo
rmes
)
3 pa
irs
of le
gs
No
Win
gs
Bee
tle-l
ike,
ha
rd w
ings
L
eath
ery
win
gs
Win
gs
Wat
er B
eetle
s (C
oleo
pter
a)W
ater
Bug
s (H
emip
tera
)
May
fly
(Eph
emer
opte
ra)
3 ta
ils
1 or
2 ta
ils
No
tails
Dam
self
ly
(Odo
nata
)D
rago
nfly
(O
dona
ta)
Bee
tle L
arva
(C
oleo
pter
a)
Ston
efly
(P
leco
pter
a)
May
fly
(E
phem
erop
tera
) C
addi
sfly
(T
rich
opte
ra)
Bee
tle
Lar
va
Key
to M
acro
inve
rteb
rate
Lif
e in
Pon
ds a
nd R
iver
s in
Uta
h
Ald
erlf
y (M
egal
opte
ra)
Segm
ente
d w
orm
(O
ligoc
haet
a)
http
://w
ww
.ext
ensi
on.u
su.e
du/w
ater
qual
ity
Imag
es c
ourt
esy
of U
SU W
ater
Qua
lity
Ext
ensi
on
and
Uni
vers
ity o
f W
isco
nsin
– E
xten
sion
Env
iron
-m
enta
l Res
ourc
es C
ente
r. IM
AG
ES
NO
T T
O S
CA
LE
Ald
erfl
y
(Meg
alop
tera
)
Cad
disf
ly
(Tri
chop
tera
)
Fly
larv
e (D
ipte
ra)
Aqu
atic
Mot
h (L
epid
opte
ra)

48USU Water Quality Extension - Stream Side Science

Missing Macroinvertebrates
Purpose:
Summary:
Background:
USU Water Quality Extension - Stream Side Science Missing Macroinvertebrates
Duration: Classroom 20 minutes Outdoors 50 minutes
Setting: Classroom Outdoors
Materials:
49
To make inferences about the quality and/or quantity of freshwater using macroinvertebrate data collected from local water systems. To explain the factors that contribute to the extinction of a species.
In this exercise, students will collect macroinvertebrates from a stream site, sort and identify them, and use their findings to identify current and past impacts to the quality of the water. They will also make predictions of how the impacts to the water quality contributed to the localized extinction of some types of macroin-vertebrates.
Aquatic macroinvertebrates (insects and other organisms that live in streams and ponds) display a wide range of adaptations to different aquatic conditions. Some types of macroinvertebrates are extremely tolerant of changes in temperature, flow, food, or even the presence of pollutants, while other types are so sensitive to these changes that they may die or move to other areas. In this activity, students identify the macroinvertebrates in a stream. By noting which types are most abundant and which of the sensitive species are missing, we can learn a lot about present and past conditions of a stream.
For more background on macroinvertebrates in streams, see the Macroinvertebrate section of the Utah Stream Team Manual.
• Plastic petri dishes* • Magnifying glasses*• Macroinvertebrate keys*• Copies of student worksheets• Copies of macroinvertebrate sampling instructions• Copies of water quality index instructions• Kick nets*
• Plastic pans*• Transfer pipettes*• Bucket•
Missing Macroinvertebrates
* For information on equipment for loan or for purchase, contact USU Water Quality Extension at (435) 797-2580 or www.extension.usu.edu/water-quality
• Waders• Clipboards• Pencils

50USU Water Quality Extension - Stream Side Science
FieldActivity:
Missing Macroinvertebrates
Missing Macroinvertebrates
NOTE: If you have already done the activity Who Lives in the Water? review the classroom activity with the students, then skip to step 6 of the field activity.
1. Ask the students to identify the types of plants and animals that live in streams (or other aquatic systems such as wetlands or ponds). Tell them this activity will focus on the diversity of macroinvertebrates found in streams. (Make sure they know the definition of a macroinvertebrate.)
2. Explain to the students they will collect a macroinvertebrate sample in a stream, identify the different types of organisms in their sample, and calculate a “water quality index”, which is a numeric way of rating the health of a stream. An index like this allows them to compare different sites in an objective way.
3. Ask the students to think about what might affect the diversity of plants and animals they would find in this aquatic ecosystem (e.g., pollutants entering the water, changes in habitat, natural or human caused changes in temperature, flow, substrate, food abundance or quality, predators in the system).
4. Review common macroinvertebrates found in your area with the students. Have the students hypothesize what kinds of macroinvertebrates they expect to find. Be sure they are familiar with the macroinvertebrate keys they will be using in the field. If you would like a larger, laminated version of the key provided, please contact USU Water Quality Extension at (435) 797-2580.
5. Review sampling instructions with your students before they go into the field.
1. Set up stations for sampling macroinvertebrates. These areas should be easily accessible and, if possible, have a range of substrate, such as small pebble, larger cobble, or woody debris.
ClassroomActivity:

USU Water Quality Extension - Stream Side Science51
Missing Macroinvertebrates
Missing Macroinvertebrates
Safety First!Always consider safety factors when working near water.
Each station should include: • Sampling instruction sheets (it helps to laminate these!)• Waders• Kick net• Plastic pan• Transfer pipettes• Magnifying glasses• Petri dishes• Macroinvertebrate keys (it helps to laminate these!)
2. Divide the students into groups. Group size should be six students or less to make sure that everyone gets to participate. Provide each group with clipboards, pencils, and student work-sheets. Each group will sample at a different station.
3. Demonstrate to the group how to sample for macroinvertebrates, then have the students collect samples. Have the students follow the instructions on the macroinvertebrate sampling sheet.
4. If time allows, give students an opportunity to observe the various types of macroinvertebrates in their sample.
5. The students must sort and count the types of organisms found in a subsample (~100 organisms). They will record this information on the macroinvertebrate sorting worksheet. Complete instructions on taking a subsample and sorting organisms are provided on the macroinvertebrate sampling page.NOTE: The subsampling, sorting and counting can be done in the field or back in the classroom with preserved samples.
6. Calculate the water quality index for each sample. Have the students follow the instructions on the water quality index instructions worksheet.NOTE: This step can be done in the classroom.
FurtherDiscussion:
USU Water Quality Extension - Stream Side Science52
Missing Macroinvertebrates
Missing Macroinvertebrates
7. Have the students hypothesize the driving factors behind their water quality index. If they have a low water quality index (an ab-sence of some species of macroinvertebrates), what is causing the populations to disappear?
Applying the Data:
Have the students compile and graph their data results. For example:• A graph showing the diversity of macroinvertebrates found at the site.• A graph showing the water quality index at different sites.
1. What kind of information does the water quality index provide that simple observations of diversity might miss?
Diversity tells you how many types of organisms are found in an area. The Water Quality Index includes some of the attributes of the macroinvertebrates found in a stream, such as their sensitivity or tolerance to pollutants or other adverse conditions. Therefore, it provides additional information. The two measurements are closely related, however, because polluted streams often have less diverse macroinvertebrate populations.
2. Why do some types of organisms seem to be more sensitive to pollutants than others?
This question doesn’t have one simple answer, but it’s an interesting opportunity to discuss and speculate on the differences in these organisms.
ACTIVITY EXTENSIONS: • Calculate and compare water quality indices using macroinvertebrates from other water sources (e.g., see the activity Wetland versus Stream Macroinverte-brates).• Sample the same stations on multiple dates and compare results.• Research factors that would contribute to a decline in the diversity of macroinvertebrates.

USU Water Quality Extension - Stream Side Science53
Missing Macroinvertebrates
More tolerant organisms may be those that evolved under more diverse conditions, and therefore are now able to handle a wider range of conditions. Animals that evolved under very unique or non-varying conditions may have very narrow ranges of tolerance to change.
Another way to look at this question is to consider the adaptations these organisms have and the type of pollutants or stressors they experience. Mayflies, caddisflies, and stoneflies that are typically found in fast moving streams probably have a high metabolic rate and require a lot of oxygen. If your class has already looked at the chemical properties of a stream, you know that as the temperature increases in a stream, the oxygen concentration declines. Therefore, just increasing the average temperature in a stream may deprive these organisms of the oxygen they need. Also, with high metabolic rates, these organisms may be more sensitive to small concentrations of toxic pollutants in a stream.
3. What does the water quality index tell you about the conditions in a stream that a water chemistry sample collected at the same time doesn’t tell you?
A water sample only tells you about conditions in the stream at the very moment you are sampling. Water that was at that site yesterday is already downstream, and water that will be at that site tomorrow is upstream. Therefore, your water sample is like a “snapshot” of the stream. Because the macroinvertebrates live in a stream for periods of up to several years (typically for months at least), they are exposed to many different conditions. Because of this, the types of macroinvertebrates found on a given day reflect the conditions in the stream for the past several months or more. Therefore, macroinvertebrates can tell you about past conditions.
Missing Macroinvertebrates

USU Water Quality Extension - Stream Side ScienceMissing Macroinvertebrates
54
Wor
kshe
et Macroinvertebrate Sorting
Name:_____________________________ Group #:______________________Date:______________________________ Site ID:_______________________
Observations about the stream site: Weather today: ___________________________________________________________Weather yesterday: ________________________________________________________Air temperature: __________________________________________________________Water appearance (e.g., clear, brown, foamy, milky):_____________________________What type of land uses are in the immediate area? _______________________________What type of land uses are in the surrounding area? ______________________________Is the area shaded by trees? _________________________________________________List any factors that may lead to a disappearance of a species of macroinvertebrates________________________________________________________ ________________________________________________________________________
MACROINVERTEBRATES TALLY OF INDIVIDUALSEphemeroptera (mayflies)Odonata (dragonflies and damselflies)Plecoptera (stoneflies)Trichoptera (caddisflies)Diptera (flies)Megaloptera (fishflies and dobsonflies)Coleoptera (beetles)Amphipoda (shrimp and scuds)Isopoda (sow bugs)Decapoda (crayfish)Gastropoda (snails)Bivalvia (mussels and clams)Oligochaeta (all segmented worms except leeches)Hirudinea (leeches)Other

Name: ___________________________ Group #: ______________________Date: ____________________________ Site ID:_______________________
Follow the Water Quality Index Instruction Sheet to complete this chart.(Column A) (Column B) (Column C)
MACROINVERTEBRATE # of Types Tolerance Value TOTALEphemeroptera (mayflies) X 90 =
Odonata (dragonflies and damselflies) X 60 =
Plecoptera (stoneflies) X 100 =
Trichoptera (caddisflies) X 80 =
Diptera (flies) X 70 =
Megaloptera (fishflies and dobsonflies) X 90 =
Coleoptera (beetles) X 70 =
Amphipoda (shrimp and scuds) X 40 =
Isopoda (sow bugs) X 30 =
Decapoda (crayfish) X 50 =
Gastropoda (snails) X 40 =
Bivalvia (mussels and clams) X 20 =
Oligochaeta (all segmented worms except leeches) X 20
=
Hirudinea (leeches) X 10 =
SUM OF COLUMNS (A) --- (C)
Water Quality Index Number (sum of column C / sum of column A) =_____________
Compare your water quality index number to the scale in the box to the right.
Health of the site = ______________________________
Observations about the area that may affect the water quality: ______________________________________________________________________________________________________________________________________________________________________________________________________________________________________________USU Water Quality Extension - Stream Side Science
55Missing Macroinvertebrates
Wor
kshe
etWater Quality Index
Water Quality Index>79 = Excellent60-79 = Good40-59 = Fair<40 = Poor

Macroinvertebrate Sampling
Step 1 - Choose your sample site
Select sampling reaches that are safe and easily accessed by everyone in your group. A riffle will offer the best variety of organisms.
Step 2 - Collect your sample If you are sampling in flowing water:1. Wade into the stream and place your net so the mouth of the net is perpendicular to and facing the flow of water.2. Stand upstream of the net and disturb the stream bottom with your feet and hands. 3. Carefully pick up and rub stones directly in front of the net to remove attached animals. The stream bottommaterial and organisms will be carried by the current into the net. If the rocks are lodged in the stream bottom, rub them vigorously, concentrating your effort on any cracks or indentations.4. After removing all large stones, disturb the sand and gravel to a depth of about 3 inches by raking and stirring with your hands.5. Continue this process until you can see no additional animals or organic matter being washed into the net.
If you are sampling in pools or highly-vegetated areas:1. Scoop material from the stream bottom with the net. Try not to scoop up too much sediment as it will make it difficult to sort the macroinvertebrates.2. Push and pull the net through aquatic vegetation.3. Hand pick organisms from sticks and other structures.4. Continue until you hav at least 100 organisms.
Step 3 - Empty your sample
1. Hold your sampling net over a plastic pan and use a bucket of stream water to wash the material into the pan.2. If your sample contains a lot of rocks or debris, stir the sample in the pan to suspend the animals, then pour the suspended material back into your net. Rinse the debris from the pan, then wash the animals in the net back into the pan.
Sam
plin
g
56Missing Macroinvertebrates USU Water Quality Extension - Stream Side Science
Time – 40 minutesPersons – 2 Materials -
• kick net• plastic pan• transfer pipettes• plastic petri dishes• magnifying glasses • macroinvertebrate key• ruler
OPTIONAL• 5 gallon bucket for decanting• waders

USU Water Quality Extension - Stream Side Science57
Missing Macroinvertebrates
Sam
plin
gMacroinvertebrate Sampling
Step 4 - Sort out 100 macroinvertebrates
1. Pour most of the water from the pan, so that the materials and animals are no longer floating. Distribute the material evenly in the bottom of the pan.2. Take a ruler and divide the material in half. Remove one half of the material from the pan.3. Redistribute the material again over the bottom of the pan and divide this material again with a ruler.4. Continue this process until you have a sample with about 100 organisms total.5. Add some stream water back into the pan for easier sorting.6. Sort and identify the macroinvertebrates using the petri dishes and pipettes.7. Keep track of the number of types of organisms on the macroinvertebrate sorting worksheet. For example, if you have two macroinvertebrates that you identify as mayflies, but they have distinct differences, record that you have two types of mayflies.
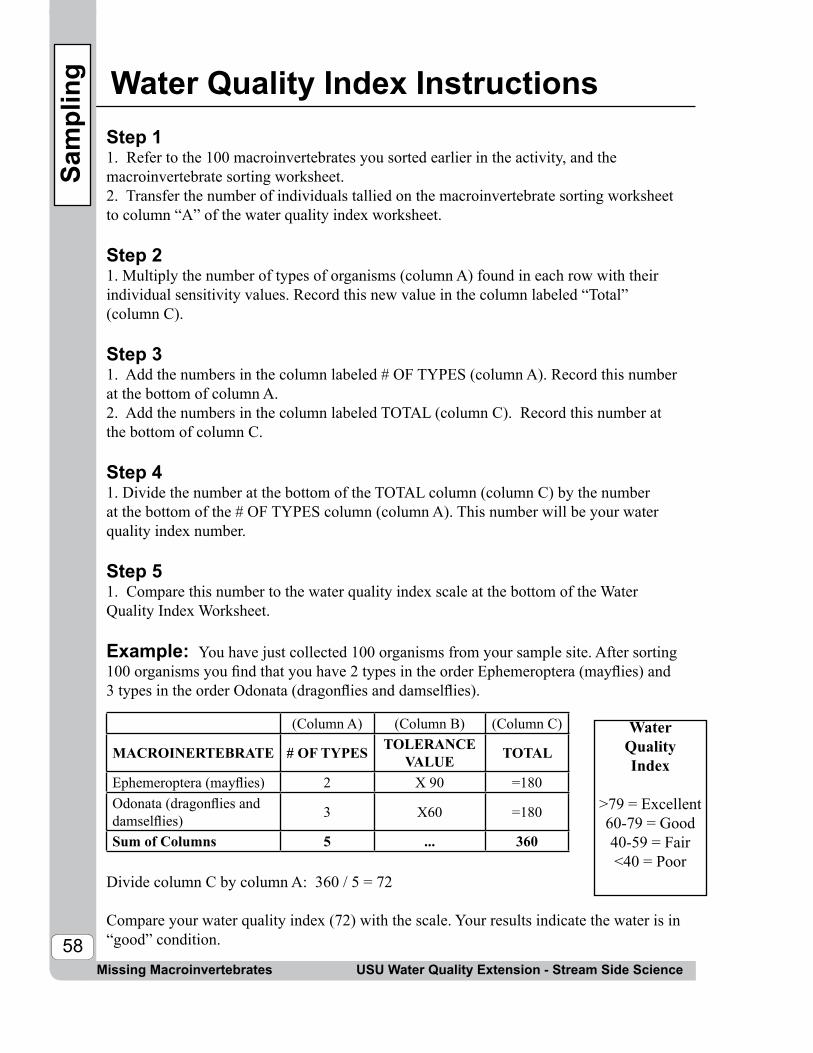
USU Water Quality Extension - Stream Side ScienceMissing Macroinvertebrates58
Sam
plin
g Water Quality Index InstructionsStep 11. Refer to the 100 macroinvertebrates you sorted earlier in the activity, and the macroinvertebrate sorting worksheet.2. Transfer the number of individuals tallied on the macroinvertebrate sorting worksheet to column “A” of the water quality index worksheet.
Step 21. Multiply the number of types of organisms (column A) found in each row with their individual sensitivity values. Record this new value in the column labeled “Total” (column C).
Step 31. Add the numbers in the column labeled # OF TYPES (column A). Record this number at the bottom of column A. 2. Add the numbers in the column labeled TOTAL (column C). Record this number at the bottom of column C.
Step 41. Divide the number at the bottom of the TOTAL column (column C) by the number at the bottom of the # OF TYPES column (column A). This number will be your water quality index number.
Step 51. Compare this number to the water quality index scale at the bottom of the Water Quality Index Worksheet.
Example: You have just collected 100 organisms from your sample site. After sorting 100 organisms you find that you have 2 types in the order Ephemeroptera (mayflies) and 3 types in the order Odonata (dragonflies and damselflies).
Divide column C by column A: 360 / 5 = 72
Compare your water quality index (72) with the scale. Your results indicate the water is in “good” condition.
(Column A) (Column B) (Column C)
MACROINERTEBRATE # OF TYPES TOLERANCE VALUE TOTAL
Ephemeroptera (mayflies) 2 X 90 =180Odonata (dragonflies and damselflies) 3 X60 =180
Sum of Columns 5 ... 360
Water Quality Index
>79 = Excellent60-79 = Good40-59 = Fair<40 = Poor

USU Water Quality Extension - Stream Side Science59
Missing Macroinvertebrates
Res
ourc
e
No
Shel
ls
Leec
h(H
irudi
nea)
4 pa
ir of
legs
Scud
(Am
phip
od)
10 +
legs
Wor
m li
ke
Sow
bug
(Iso
pod)
No
legs
Cra
yfis
h (D
ecap
oda)
Flat
wor
m
(Tur
bella
ria)
With
tent
acle
s, b
rush
es o
r
Legs
Shel
ls
Sing
le S
hell
Dou
ble
Shel
l
Snai
ls(G
astro
poda
)C
lam
s, M
usse
ls
(Biv
alvi
a)
Fly
larv
e
Wat
er m
ite
(Tro
mbi
difo
rmes
)
3 pa
irs o
f leg
s
No
Win
gs
Bee
tle-li
ke,
hard
win
gs
Leat
hery
win
gs
Win
gs
Wat
er B
eetle
s (C
oleo
pter
a)W
ater
Bug
s (H
emip
tera
)
May
fly
(Eph
emer
opte
ra)
3 ta
ils
1 or
2 ta
ils
No
tails
Dam
selfl
y (O
dona
ta)
Dra
gonf
ly
(Odo
nata
)B
eetle
Lar
va
(Col
eopt
era)
Ston
efly
(P
leco
pter
a)
May
fly
(Eph
emer
opte
ra)
Cad
disf
ly
(Tric
hopt
era)
B
eetle
La
rva
Key
to M
acro
inve
rtebr
ate
Life
in P
onds
and
Riv
ers
in U
tah
Ald
erlfy
(M
egal
opte
ra)
Segm
ente
d w
orm
(O
ligoc
haet
a)
http
://w
ww
.ext
ensi
on.u
su.e
du/w
ater
qual
ity
Imag
es c
ourte
sy o
f U
SU W
ater
Qua
lity
Exte
nsio
n an
d U
nive
rsity
of W
isco
nsin
– Ex
tens
ion
Envi
ron-
men
tal R
esou
rces
Cen
ter.
IMA
GES
NO
T T
O S
CA
LE
Ald
erfly
(M
egal
opte
ra)
Cad
disf
ly
(Tric
hopt
era)
Fly
larv
e (D
ipte
ra)
Aqu
atic
Mot
h (L
epid
opte
ra)
Key to Aquatic Invertebrates in Utah

USU Water Quality Extension - Stream Side Science60

Purpose:
Summary:
Background:
USU Water Quality Extension - Stream Side Science
Duration: Classroom 20 minutes Outdoors 2 sessions, 40 min. each
Setting: Classroom Outdoors
Materials:
61
Wetland versusStream Macroinvertebrates
Wetland vs. Stream Macroinvertebrates
To investigate various biomes through observation and comparison of the diversity of life, in particular, the specific number of species, biomass, and type of organisms.
In this exercise, students will use their data from the activity Who Lives in the Water? or Missing Macroinvertebrates and compare it to a macroinvertebrate sample collected from a wetland site.
For background information, see:• The Macroinvertebrate section of the Utah Stream Team Manual which defines a macroinvertebrate and discusses how macroinver-tebrate populations change due to natural and human influences, why macroinvertebrates are important in aquatic ecosystems, how to collect a sample and how to interpret the results.• The activity Who Lives in the Water? or Missing Macroinverte-brates.
• Kick nets*• plastic pan* • Transfer pipettes* • Plastic petri dishes*• Magnifying glasses*• Copies of macroinvertebrate keys • Copies of student worksheet• Copies of macroinvertebrate sampling instructions• Data from activity Who Lives in the Water? or Missing Macroinvertebrates• Bucket
• Waders• Clipboard• Pencils
* For information on equipment for loan or for purchase, contact USU Water Quality Extension at (435) 797-2580 or www.exten-sion.usu.edu/waterquality

USU Water Quality Extension - Stream Side Science62
Wetland vs. Stream Macroinvertebrates
Wetland versusStream Macroinvertebrates
1. Ask the students to list differences between a stream biome and a wetland biome (e.g., water velocity, temperature, depth, width, vegetation, sediment, inhabitants). Tell them that for this activity they will compare the diversity of macroinvertebrates found in a stream to those found in a wetland.
2. Explain to the students that they will be using their data from the activity Who Lives in the Water? to compare with the new data they collect from a wetland biome.
3. Ask the students about the differences they expect to see in the macroinvertebrates from the two types of biomes. Why would there be differences?
4. Be sure the students are familiar with the macroinvertebrate keys they will be using in the field and also the sampling procedures. If you would like a larger, laminated version of the key provided, please contact USU Water Quality Extension at (435) 797-2580.
1. Set up stations for sampling macroinvertebrates. These areas should be easily accessible and safe to enter. Each station should include: • Wetland sampling instruction sheets (it helps to laminate these!)• Waders• Kick net• Plastic pan• Transfer pipettes• Magnifying glasses• Petri dishes• Macroinvertebrate keys
2. Divide the students into groups. The groups should be made up of no more than six students to be sure everyone gets to
FieldActivity:
Safety First!Always consider safety factors when working near water.
ClassroomActivity:

USU Water Quality Extension - Stream Side Science63
Wetland versus Stream Macroinvertebrates
Wetland vs. Stream Macroinvertebrates
participate. Provide each group with clipboards, pencils, and worksheets. Each group will sample at a different station.
3. Have the students follow the instructions for sampling macroinvertebrates on the macroinvertebrate sampling sheet, and record the information on the macroinvertebrate sorting worksheet.
ACTIVITY EXTENSIONS: • Research factors that would contribute to a decline in the diversity of macroinvertebrates (refer to the activity What’s in the Water and/or see the activity Missing Macroinvertebrates).
Use the following suggestions to have the students compare their data. 1. Have the students graph the number of each species or types found at each site. Are there entire groups present at one site, but missing at another? 2. Have the students graph the number of individuals found at each site. See example below.3. Have the students estimate the biomass (organisms per unit area) at each site.
Applying the Data:
454035302520151050
# fo
und
at e
ach
site
May
fly n
ymph
Cad
disfl
y la
rva
Dra
gonfl
y ny
mph
Dam
selfl
y ny
mph
Bla
ckfly
larv
a
Cra
nefly
larv
a
Scu
ds
Leec
hes
Mid
ge la
rva
Bee
tle la
rva
Sna
ils
Aqu
atic
wor
ms
Wat
er b
oatm
en
Wat
er s
tride
r
Mos
quito
larv
a
Macroinvertebrate Diversity
Site 1Site 2
USU Water Quality Extension - Stream Side Science64
Wetland versus Stream Macroinvertebrates
Wetland vs. Stream Macroinvertebrates
1. Were there some types of organisms found in both biomes and other types of organisms not found in one or the other?
The most obvious difference in large macroinvertebrates in a wetland is the presence of dragonfly and damselfly larvae. These are rarely found in moving streams because they require emergent vegetation such as cattails for resting, and for laying their eggs. You may also find considerably more swimming beetles (Order Coleoptera) or boatmen and backswimmers (Order Hemiptera) in a wetland than in a stream, because they do better in still water.
Zooplankton are also typically found in wetland ponds. Look for Daphnia and other microscopic animals swimming in the water.
Animals found in moving water may be more stream lined or have adaptations for clinging to rocks compared to animals who live in still water. They may be less streamlined and have adaptations for swimming.
2. What features of those habitats might have caused these dif-ferences?
The most obvious difference between the two habitats is flow. Water slowly moves through a wetland, but there is not any measurable velocity. Materials settle in these conditions, typically resulting in a soft, mucky bottom rather than the rocky bottom of many fast streams. Standing water may warm up faster than running water, resulting in changes in oxygen. Both systems have standing plants and mats of plants that cover some of the surfaces, but a pond/wetland is much more likely to have an abundance of suspended single celled plants (algae).
FurtherDiscussion:

USU Water Quality Extension - Stream Side Science
65Wetland vs. Stream Macroinvertebrates
Wor
kshe
etMacroinvertebrate Sorting - Wetlands
Name: ___________________________ Group #: ______________________Date: ____________________________ Site ID: ______________________
MACROINVERTEBRATES TALLY OF TYPES OF INDIVIDUALS
Ephemeroptera (mayflies)
Odonata (dragonflies and damselflies)
Plecoptera (stoneflies)
Trichoptera (caddisflies)
Diptera (flies)
Megaloptera (fishflies and dobsonflies)
Coleptera (beetles)
Amphipoda (shrimp and scuds)
Isopoda (sow bugs)
Decapoda (crayfish)
Gastropoda (snails)
Bivalvia (bussels and clams)
Oligochaeta (All segmented worms except leeches)
Hirudinea (leeches)
Other

USU Water Quality Extension - Stream Side Science66
Wetland vs. Stream Macroinvertebrates
Sam
plin
g Macroinvertebrate Sampling - Wetlands
Step 1 - Choose your sample siteSelect sampling reaches that are safe and easily accessed by everyone in your group.
Step 2 - Collect your sample 1. Wade into the water and scoop material from the wetland bottom. Be sure to not scoop up too much sediment with your sample.2. Push and pull the net through aquatic vegetation.3. Hand pick organisms from sticks and other structures.4. Continue this process until you have approximately 100 organisms.
Step 3 - Empty your sample1. Hold your sampling net over a plastic pan and use a bucket of water to wash the material into the pan.2. If your sample contains a lot of sediment, stir the sample in the pan to suspend the animals, and then pour the suspended material back into your net. Rinse the sediment from the pan, and then wash the animals from the net back into the pan.
Step 4 - Sort out 100 macroinvertebrates1. Pour most of the water from the pan so that materials and animals are no longer floating. Distribute the material evenly in the bottom of the pan.2. Take a ruler and divide the material in half. Remove one half of the material from the pan.3. Redistribute the material again over the bottom of the pan and divide this material again with a ruler.4. Continue this process until you have a sample with about 100 organisms total.5. Add some stream water back into the pan for easier sorting.6. Sort and identify the macroinvertebrates using the key, petri dishes, and pipettes.7. Keep track of the number of the types of organisms on the macroinvertebrate sorting worksheet. For example, if you collect two mayflies, but they have distinct differences, then you have two types of mayflies.
Time – 40 minutesPersons – 2 Materials -
• kick net• plastic pan• transfer pipettes• plastic petri dishes• magnifying glasses • dichotomous key• ruler
OPTIONAL• 5 gallon bucket for decanting• waders

Key to Aquatic Invertebrates in Utah
USU Water Quality Extension - Stream Side Science67
Wetland vs. Stream Macroinvertebrates
Res
ourc
e
No
Shel
ls
Leec
h(H
irudi
nea)
4 pa
ir of
legs
Scud
(Am
phip
od)
10 +
legs
Wor
m li
ke
Sow
bug
(Iso
pod)
No
legs
Cra
yfis
h (D
ecap
oda)
Flat
wor
m
(Tur
bella
ria)
With
tent
acle
s, br
ushe
s or
Legs
Shel
ls
Sing
le S
hell
Dou
ble
Shel
l
Snai
ls(G
astro
poda
)C
lam
s, M
usse
ls
(Biv
alvi
a)
Fly
larv
e
Wat
er m
ite
(Tro
mbi
difo
rmes
)
3 pa
irs o
f leg
s
No
Win
gs
Bee
tle-li
ke,
hard
win
gs
Leat
hery
win
gs
Win
gs
Wat
er B
eetle
s (C
oleo
pter
a)W
ater
Bug
s (H
emip
tera
)
May
fly
(Eph
emer
opte
ra)
3 ta
ils
1 or
2 ta
ils
No
tails
Dam
selfl
y (O
dona
ta)
Dra
gonf
ly
(Odo
nata
)B
eetle
Lar
va
(Col
eopt
era)
Ston
efly
(P
leco
pter
a)
May
fly
(Eph
emer
opte
ra)
Cad
disf
ly
(Tric
hopt
era)
B
eetle
La
rva
Key
to M
acro
inve
rtebr
ate
Life
in P
onds
and
Riv
ers i
n U
tah
Ald
erlfy
(M
egal
opte
ra)
Segm
ente
d w
orm
(O
ligoc
haet
a)
http
://w
ww
.ext
ensi
on.u
su.e
du/w
ater
qual
ity
Imag
es c
ourte
sy o
f U
SU W
ater
Qua
lity
Exte
nsio
n an
d U
nive
rsity
of W
isco
nsin
– Ex
tens
ion
Envi
ron-
men
tal R
esou
rces
Cen
ter.
IMA
GES
NO
T T
O S
CA
LE
Ald
erfly
(M
egal
opte
ra)
Cad
disf
ly
(Tric
hopt
era)
Fly
larv
e (D
ipte
ra)
Aqu
atic
Mot
h (L
epid
opte
ra)

68USU Water Quality Extension - Stream Side Science
USU Water Quality Extension - Stream Side Science69
Riparian Review
Riparian Review
Purpose:
Summary:
Background:
Duration: Classroom 20 minutes Outdoors 50 minutes
Setting: Classroom Outdoors
To observe and list biotic factors that affect a given ecosystem.
In this exercise, students will identify and observe biotic factors in a riparian ecosystem, which is the green strip of vegetation alongside a waterbody; they will measure the types of vegetation at the water’s edge, the function of plants as ground cover and canopy cover, and observe the wildlife in the area.
Riparian areas are the transition zones between aquatic and terrestrial systems. The plants in this zone depend on high water tables and flooding patterns associated with the aquatic systems. Riparian zones cover a very small area in a watershed, but are extremely important.
Riparian Zone Functions:• Bank stability to resist erosion• Habitat for a diverse community of plants and animals• Canopy cover which provides shading• Organic materials drop from canopy cover into waterbodies• Soils soak up water from runoff and help mitigate flooding• Healthy riparian areas protect the land from flooding, and provide storage for a sustained summer flow
For more background information, see:• The Riparian Zone section of the Utah Stream Team Manual which defines a riparian zone and discusses how it would change due to natural and human influences, why the riparian zone is important in an aquatic ecosystem, and how to measure and interpret the results. • For information on Utah’s wildlife, see the Utah Division of Wildlife Resources Data Center website – http://dwrcdc.nr.utah.gov/ucdc

70
Riparian Review
USU Water Quality Extension - Stream Side ScienceRiparian Review
• Flagging • Measuring tapes* • Ocular tubes* • Copies of the student worksheets • Copies of the riparian zone instruction sheets• Copies of wildlife observation instruction sheets• Wildlife checklists (optional)• Binoculars• Clipboards• Pencils• Plant guides (optional)
1. Define the term riparian zone. The riparian zone is the green ribbon of vegetation along a stream, and the associated animals that live in or use this area. Talk about why a riparian zone is important to the health of an aquatic ecosystem, natural changes in the riparian zone, and also what humans do to alter the riparian zone.
2. Ask the students to list all the biotic factors they can think of in a riparian system (e.g., types of plants, specific plants, and animals). Ask them to think about how this community of plants and animals might be different from those found in a deep forest, in open range land, or in their backyards. How might they be similar?
3. Explain to the students that they will be going out to a stream site to evaluate the structure and function of the riparian area. These functions include both the riparian vegetation and wildlife. They will also use other techniques to observe or find evidence of animal activity.
4. Explain to them what measurements they will be taking and why. Measurements are found on the following page:
ClassroomActivity:
Materials:
* For information on equipment for loan or for purchase, contact USU Water Quality Extension at (435) 797-2580 or www.extension.usu.edu/waterquality

71
FieldActivity:
Riparian Review
USU Water Quality Extension - Stream Side Science Riparian Review
Safety First!Always consider safety factors when working near water.
• Greenline - they will measure the type of vegetation that grows closest to the water’s edge. This is an indication of the bank stability. See Further Discussion question number 1 for more information.• Ground Cover - they will record the width of the zone in which riparian plants grow. • Canopy Cover - they will measure the amount of shade the riparian plants provide. • Wildlife Signs - they will identify animals and signs of ani-mal activity.
Because there are four sets of measurements, we strongly recommend reviewing the actual measuring procedures with the class before going into the field.
1. Divide your students into groups of no more than six students.
2. Assign each group with a measurement (greenline, ground cover, canopy cover, or wildlife signs) and provide them with the appropriate materials.
Greenline GroupFlaggingMeasuring tapeGreenline sampling instructionsGreenline worksheet
Canopy Cover GroupFlaggingOcular tubeMeasuring tapeCanopy cover sampling instructionsCanopy cover worksheet
Ground Cover GroupMeasuring tapeGround cover sampling instructionsGround cover worksheet
Wildlife Signs GroupBinocularsWildlife worksheetWildlife observation instructionsField checklists (optional) Field guides (optional)

72
Applying the Data:
Riparian Review
USU Water Quality Extension - Stream Side ScienceRiparian Review
3. Explain to the students that each group will take a differentmeasurement, and share their data with each other back in the classroom.
NOTE: If time allows, you can have the groups do more than one of the measurements.
4. Review the sampling instructions for each particular measurement. Have the students fill out the site observations section of the student worksheets before beginning their measurements.
5. Have the students record their results onto the student worksheets. You can choose to have one record keeper per group, or have each student record all the information. You may also want to suggest to your students that they take turns conducting the measurements throughout the process.
• Map the stream segment - e.g., width of riparian zone, areas with canopy cover, different types of plants.• Compare (graphically) different reaches of a river - e.g., a more developed area versus a pristine one, such as a city site versus the headwaters.• Discuss big rivers versus small streams - how do the functions of riparian zones differ?
ACTIVITY EXTENSIONS: • Compare your results to results from other streams or other locations on the same stream.• Sample the same station on multiple dates (fall vs. spring) to compare results. • Use the activity What’s in the Water? to collect chemical measurements in the stream. Have students hypothesize about the links between the riparian zone and the water chemistry. See discussion questions below.

73
FurtherDiscussion:
USU Water Quality Extension - Stream Side Science Riparian Review
1. How do the greenline measurements help us undestand how well a stream bank resists erosion?
Fast moving water can cause banks to erode. The greenlineis a measure of how well the plants along the water’s edge will help the banks resist erosion (bank stability). We determine stability by calculating the proportion of different vegetation types. These are sedges and rushes, shrubs and trees, grasses, forbs, (a non-woody plant that is not a grass), and bare ground. Each vegetation type has a different ability to stabilize the banks due primarily to the depth and density of the roots, and whether they are annuals (die back after one year), or perennials (live through the winter). For example, sedges are perennials that have deep, thick root masses that cling to and stabilize soils, while many annuals have shallow or sparse roots that do not contribute to bank stability. In the field, look at the vegetation in areas where serious erosion has occurred compared to areas with stable banks. Think about how different land uses affect vegetation and therefore bank stability.
2. How does the canopy cover affect the physical properties of the stream itself?
Canopy cover provides shade and is important in keeping water temperatures low in small headwater streams. Many fish and other aquatic organisms are sensitive to high temperatures, and may disappear from streams that have lost their shade.
The canopy of a stream also represents the leaves and debris that may fall directly into the stream. This external input of material is an important source of food and shelter for the fish and other organisms living in these small streams. The relative importance of canopy cover (both for shade and for input of organic material) decreases as a river gets increasingly larger.
Riparian Review

74
Riparian Review
USU Water Quality Extension - Stream Side ScienceRiparian Review
3. How do humans affect the health of the riparian zone? The riparian zone is a very small area compared to the entire land area of a watershed, and humans can have a serious impact on this important ecosystem through different types of activities. • Clearing: Riparian areas are often cleared for agriculture, logging, or housing and other development. This can lead to destabilized banks, heavy erosion, and loss of stream and riparian functions.• Introduced species: Many riparian areas are affected throughout the world by introduced species, which take over the riparian area and radically change the habitat. Species such as russian olive, tamarisk, and purple loosestrife may form “monocultures,” replacing native plants and resulting in a serious loss of plant and animal diversity and a loss in other riparian functions such as storing and filtering wastes.• Grazing: While grazing by cattle and other livestock has been shown to be compatible with healthy riparian areas, the type of grazing is extremely important. Most riparian areas can handle short term, “intensive” grazing, with sufficient recovery time. Continuous grazing in a riparian area can limit the plants’ abilities to recover and may ultimately lead to loss of vegetation or a change in species.• Recreation: Recreationalists flock to riparian areas, but may “love them to death.” Trampling, multiple trails, wood removal for campfires, and littering all can impair riparian areas.
4. Why would a stream area be a good habitat for wildlife?The diversity of plant species (from small annuals to dense sedges to tall trees) provides food and shelter for a wide diversity of animals, ranging from insects to birds to mammals. One function of riparian areas that people sometimes neglect is their use as a “corridor” for wildlife, providing connecting routes across otherwise dry or uninhabitable landscapes. These corridors are important not only for migration, but also for connecting different breeding populations.

Name: ___________________________ Group #: ______________________Date: ___________________________ Site ID: ______________________
SITE OBSERVATIONS:Type of waterbody (e.g., stream, lake, wetland):_________________________________Water appearance (e.g., clear, brown, foamy, milky):_________________________What type of land uses are in the immediate area?_______________________________What type of land uses are in the surrounding area?______________________________
USU Water Quality Extension - Stream Side Science
75
Greenline Worksheet
Riparian Review
The higher the score, the more the stream banks will resist erosion.
Site Scores7 - 10 healthy banks4 – 7 semi healthy banks0 – 4 unhealthy banks
Total Score (add up all scores in Row 6):______________________________
Wor
kshe
et
Vegetation Categories
Deep Rooted Plants
Shallow Rooted Plants
Bare Ground
Sedges & Rushes
Shrubs & Trees Grasses Forbs
Row 1: Record each observation as a slash mark in the appropriate box.Row 2: Total number of observations for each category.Row 3: Total number of observations for the entire greenline (sum of all observations in Row 2).Row 4: Proportion of each category (divide row 2 vlaues by total in row 3).Row 5: Multiply each value in row 4 by the factor in each category. Record in row 6.
X 10 X 8 X 6 X 3 X 1
Row 6: Score for each category.

USU Water Quality Extension - Stream Side Science
76Riparian Review
Canopy CoverName: ___________________________ Group #: _____________________Date: ____________________________ Site ID: ______________________
SITE OBSERVATIONS:Type of waterbody (e.g., stream, lake, wetland):_________________________________Water appearance (e.g., clear, brown, foamy, milky): _____________________________What types of land uses are in the immediate area?______________________________What types of land uses are in the surrounding area?_____________________________
The more covered area available, the more shading the stream receives. This keeps the water cool, provides food for aquatic organisms, and woody debris that falls into the stream provides fish habitat.
Wor
kshe
et
“Miss” (Open sky) “Hit” (Vegetation)
Row 1: At each step along the water’s edge, record with a slash whether you see a “miss” (open sky) or a “hit” (vegetation) in your ocular tube.
Row 2: Total # of slash marks for each category.
Row 3: Total number of observations
Percent canopy cover. Divide total “hits” (Row 2) by total observations (Row 3) and multiply by 100.

USU Water Quality Extension - Stream Side Science
77
Ground Cover
Riparian Review
Name: ___________________________ Group #: _________________Date: ___________________________ Site ID: _________________
SITE OBSERVATIONS:Type of waterbody (e.g., stream, lake, wetland):_________________________________Water appearance (e.g., clear, brown, foamy, milky):_____________________________What types of land uses are in the immediate area?_______________________________What types of land uses are in the surrounding area?______________________________
Wor
kshe
etThe percentage of each category above may vary depending on where the site is. A mixture of cover types is ideal because each provides a different service. Although bare ground does nothing, vegetation functions well as a filter and also buffers against ero-sion. Rock does little to filter pollutants, but does protect against erosion. Litter serves both functions.
Transects Perpendicular to the stream(20 paces per transect)
1 2 3 4 5 Category Total(percent of total)
Live vegetation =
Litter (dead vegetation or
sticks)=
Rocks =
Bare ground =
At each step along the transect record. with a slash mark, the type of ground cover you see. Add the slash marks for each row and record in the Category Total column. Because there are 100 observations, the total will equal the percent.

USU Water Quality Extension - Stream Side Science
78Riparian Review
Wildlife Signs
Name: ___________________________ Group #: ______________________Date: ___________________________ Site ID: _______________________
SITE OBSERVATIONS:Type of waterbody (e.g., stream, lake, wetland):__________________________________Water appearance (e.g., clear, brown, foamy, milky):______________________________What types of land uses are in the immediate area?_______________________________What types of land uses are in the surrounding area?______________________________
Wor
kshe
et
Types of ObservationsV = saw animal T = track S = scatB = bones O = other sign such as burrow, teeth marks, nests
COMMON NAME How is it using the riparian area? TYPE OF OBSERVATION
e.g., American Dipper e.g., food, shelter, traveling through e.g., V, O

Greenline
USU Water Quality Extension - Stream Side Science
79Riparian Review
1. Measure a 100 foot stretch along the stream. Place a flag near the water at the beginning and end points.
2. Standing at the first flag, note the vegetation type that is closest to the water and record it in row 1 of the worksheet.
3. Take one pace toward the other flag and stop A pace is a normal stride you would take while walk-ing. Look toward the water and record the vegeta-tion type closest to the water by placing a slash mark in the appropriate box. See the Teacher Re-source page for definitions of vegetation types.
4. Repeat these steps until you reach the other flag.
5. Tally the number of slash marks in each box and record this for each category in row 2.
6. Add up all the observations and record that total in row 3.
7. For each vegetation category, divide the number in row 2 by the number in row 3, and record in row 4. This will give the proportion of the greenline that is made up of that vegetation category.
8. For each vegetation category, multiply the number in row 4 by the factor in row 5 and record in row 6. This will give you the “site score” for each vegetation category. Because sedges and rushes have the strongest roots and prevent erosion the best, they receive the highest factor - “10.” Bare ground doesn’t prevent erosion so it receives the lowest factor - “1.”
9. Add the individual site scores in row 6 to get the “total site score” for that stretch of stream.
10. Compare the site score to the “Site Scores” box on the worksheet to determine the health of the greenline.
Time – 30 minutesPersons – 2Materials –
• Flagging• Measuring tape• Greenline worksheet• Plant guide (optional)
Sam
plin
g
The Greenline Transect
1st line ofvegetation
Greenline transect

USU Water Quality Extension - Stream Side Science
80Riparian Review
Canopy Cover
Time – 30 minutesPersons – 2Materials –
• Ocular tube• Measuring tape• Canopy cover worksheet• Flagging
1. Measure a 100 foot stretch along the stream. Place a flag near the water at the beginning and end points or use the same measurements set out by the greenline group.
2. Standing at the first flag, point the ocular tube straight into the air (90 degree angle) and look through it with one eye. Your partner who is recording data can tell you how to adjust the tube until it is pointing as straight up as possible.
3. Tell the recorder whether the “X” at the end of the tube points at sky (a “miss”) or a part of a tree or bush (a “hit”). Record this in the first row on the canopy cover worksheet.
4. Take one pace toward the other flag and stop. A pace is a normal stride you would take while walking. Again, point the ocular tube straight into the air and record a hit or a miss.
5. Repeat these steps until you reach the other flag.
6. Add the total hits and misses and record in the second row.
7. Add the two scores recorded in row 2. This will tell you the “total number of observations” you took along the transect (the greenline). Record this total in row 3.
8. Divide the number of “hits” in row 2 by the total observations in row 3 and multiply by 100. This will give you the percentage of canopy cover for the transect.
Sam
plin
g
Canopy Cover Transect

Ground Cover
USU Water Quality Extension - Stream Side Science
81Riparian Review
1. You will collect data along five separate transects in your stream stretch, spaced out at approximately equal distances along your stream reach. If possible, you should run two transects on one side of the stream and three on the other to get a better picture of the total riparian zone. Refer to the figure to the right for help locating these transects.
2. Begin at your first transect. Starting at the stream’s edge, take one pace away from the stream. Touch your finger to the ground at the tip of your front foot.
3. Note the ground cover type that your finger touches. The categories are: live vegetation, litter (dead vegetation or sticks), rocks, or bare ground. Record the type with a slash in the appropriate box on the ground cover worksheet. Note that each column on the data chart is for a separate transect.
4. Repeat steps 2 – 3 for 20 paces. Then move on to the second transect. Repeat for all 5 transects.
5. When you’ve finished with all five transects, add the totals for each row (cover type). This will give you the percentage of each type of ground cover in the riparian zone. To check your math, add your percentages for each ground cover type. They should total 100%.
Time – 35 minutesPersons – 2Materials –
• Measuring tape• Ground cover worksheet
Note: Riparian ground cover transects start at the stream edge and extend 20 paces away from the stream, into the riparian vegetation.
The percentage of each ground cover type provides a measure of ground cover that can be compared to other sites or used to compare changes over time (between different years or seasons). As a general rule, though, a healthy riparian zone will be covered by a mixture of litter, rock and vegetation. Important exceptions to this are desert streams, which have very sandy banks.
Sam
plin
g
Ground Cover Transect

USU Water Quality Extension - Stream Side Science
82Riparian Review
Wildlife Signs
Time – 35 minutesPersons – 2Materials –
• Binoculars• Wildlife worksheet• Field guides• Field checklists (optional)• Magnifying glasses (optional)
Note: Wildlife and birds are shy and may be hard to observe. You may want to send your wildlife observers directly upstream or downstream of your transect so the noise and activity of the vegetation survey won’t interfere with their observations. Only do this if it is safe and practical.
1. Slowly walk a 100 foot length along the stream’s edge. Look carefully for tracks, scat or other animal signs. Also watch for birds, mammals, reptiles, or amphibians as you walk. Record all species that can be identified by sight or sound on the wildlife signs worksheet. Also note how the wildlife may have been using the riparian area, and the type of observation.
2. Return to approximately the middle of the length of stream you just walked, and walk 20 paces away from the stream’s edge. Stand quietly, watching and listening for two minutes. Record all species that can be identified.
3. Slowly walk back toward the stream, looking for tracks, scat or other animal signs. Once you have reached the stream, listen and watch for another two minutes. Repeat this procedure at three points (more if time allows) along the stream.
4. After sampling, spend any extra time investigating the entire site looking for animals or signs of them.
Sam
plin
g
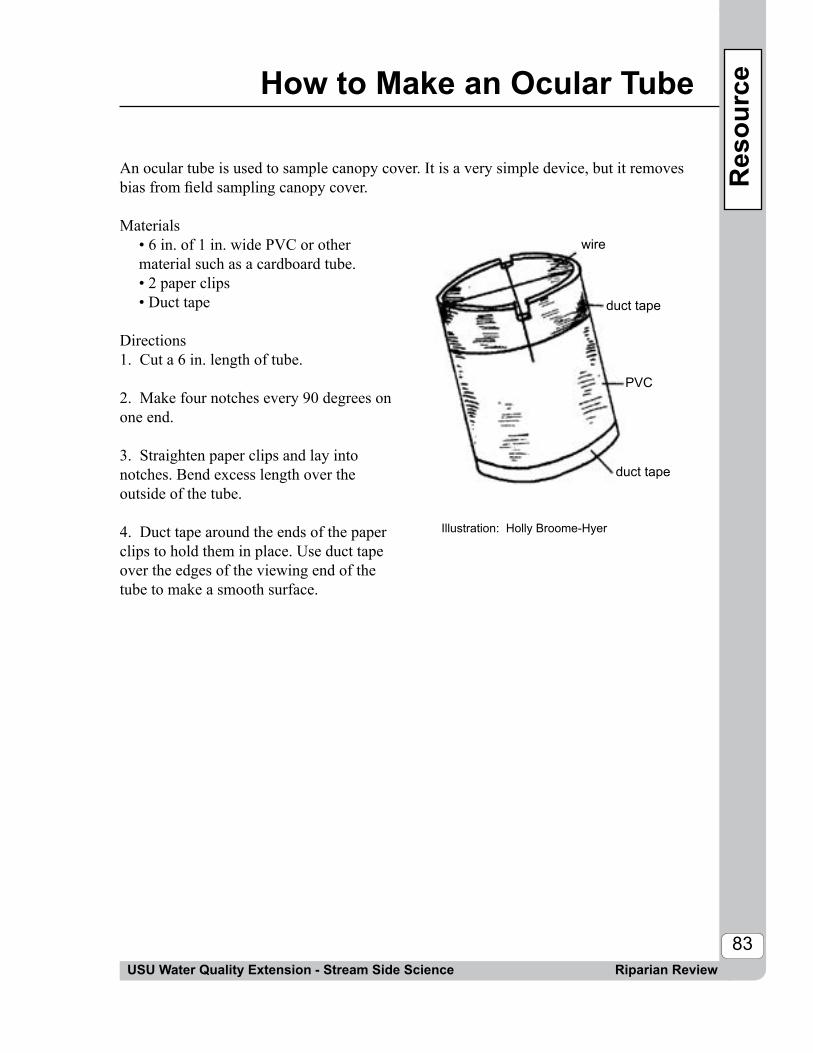
How to Make an Ocular Tube
USU Water Quality Extension - Stream Side Science
83Riparian Review
An ocular tube is used to sample canopy cover. It is a very simple device, but it removes bias from field sampling canopy cover.
Materials • 6 in. of 1 in. wide PVC or other material such as a cardboard tube. • 2 paper clips • Duct tape
Directions1. Cut a 6 in. length of tube.
2. Make four notches every 90 degrees on one end.
3. Straighten paper clips and lay into notches. Bend excess length over the outside of the tube.
4. Duct tape around the ends of the paper clips to hold them in place. Use duct tape over the edges of the viewing end of the tube to make a smooth surface.
Res
ourc
e
Illustration: Holly Broome-Hyer
wire
duct tape
PVC
duct tape

USU Water Quality Extension - Stream Side Science
84Riparian Review
Field Checklist for MammalsR
esou
rce
✓ Common Name Scientific Name
Masked Shrew Sorex cinereus
Dusky Shrew Sorex obscurus
Northern Water Shrew Sorex palustris
Black Bear Ursus americanus
Raccoon Procyon lotor
Longtail Weasel Mustela frenata
Mink Mustela vison
River Otter Lutra canadensis
Striped Skunk Mephitis mephitis
Coyote Canis latrans
Red Fox Vulpes fulpa
Mountain Lion Felis concolor
Bobcat Lynx rufus
Yellowbelly Marmot Marmota flaveventis
Northern Pocket Gopher Thomomys talpoides
Beaver Castor canadensis
Meadow Vole Microtus pennslvanicus
Muskrat Ondantra zibethica
Porcupine Erethizon dorsatum
Mountain Cottontail Sylvilagus nutalli
Elk Cervus elaphus
Mule Deer Odocoileus hemionu
Moose Alces alces
Pronghorn Antilocapra Americana
Douglas’ Squirrel Tamiasciurus douglasii

Field Checklist for Birds
USU Water Quality Extension - Stream Side Science
85Riparian Review
Res
ourc
e
✓ Riparian Species of Utah *=southern Utah species
Ring-necked Pheasant
Wild Turkey
Great Blue Heron
Cooper’s Hawk
Red-tailed Hawk
American Kestrel
Yellow-billed Cuckoo
Western Screech-owl
Great Horned Owl
Black-chinned Hummingbird
Belted Kingfisher
Downy Woodpecker
Willow Flycatcher
Cassin’s Kingbird
Eastern Kingbird
Bell’s Vireo *
Plumbeous Vireo
Brown Creeper
Bewick’s Wren
House Wren
American Dipper
Swainson’s Thrush
American Robin
Gray Catbird
European Starling
Cedar Waxwing
Yellow Warbler
Wilson’s Warbler
Yellow-breasted Chat
Spotted Towhee
Abert’s Towhee *
Fox Sparrow
Song Sparrow
Lincoln’s Sparrow
Black-headed Grosbeak
Blue Grosbeak
Lazuli Bunting
Brown-headed Cowbird
Bullock’s Oriole
Lesser Goldfinch *

USU Water Quality Extension - Stream Side Science
86Riparian Review
Plant Identification
Grasses – These have hollow stems that are jointed and leaves with parallel veins. The leaves come off the stem in opposite directions. Grass-like sedges – These resemble grasses but have solid, triangular stems with no joints. The leaves have parallel veins but they come off the stem in three directions. This group also includes rushes which have round, hollow stems with very small or no leaves.Forbs – These generally have broad leaves with net-like veins. The stems are solid or spongy and they die back to the ground every year.Shrubs and trees – These have woody stems that remain alive all year. The leaves tend to have net-like veins. Rarely do shrubs grow taller than 13 feet. Trees are similar to shrubs in that they generally have a single woody stem but grow taller than 13 feet.
Res
ourc
e

Notes
USU Water Quality Extension - Stream Side Science
87Riparian Review

88USU Water Quality Extension - Stream Side ScienceRiparian Review

USU Water Quality Extension - Stream Side Science89
Nitrogen Cycle
Nitrogen Cycle
Purpose:
Summary:
Background:
Duration: Classroom 50 minutes
Setting: Classroom
To diagram the nitrogen cycle and provide examples of human actions that affect this cycle.
Students will learn about the nitrogen cycle through discussion and the construction of a diagram. They will also measure the nitrate levels in various water samples and discuss how humans affect nitrate content in the water.
Nitrogen is all around us and is found in a variety of forms throughout the global environment. The nitrogen cycle demonstrates the many different paths nitrogen may follow around our earth and the different reservoirs in which nitrogen is stored.
Although nitrogen gas (N2) is an important component of proteins for both plants and animals, most plants cannot use the nitrogen gas directly. The process of converting nitrogen to a “biologically available” form - in other words, converting nitrogen gas to a form that plants can use - is called nitrogen fixation. Only specialized bacteria in soil and certain types of algae in water can fix nitrogen. Lightning strikes also result in some nitrogen fixation.
Human activities have had a huge impact on global nitrogen cycles. The amount of biologically available nitrogen generated by human activities now far exceeds nitrogen fixed by bacteria, algae and lightning. Humans produce synthetic fertilizers, burn fossil fuels, grow legumes (which fix nitrogen) as a crop, and engage in various land clearing, burning and wetland draining activities, which all release nitrogen in forms that plants use. See the table on the Resource page for more details on the amount of fixed nitrogen humans produce.
See the Utah Stream Team Manual or the Further Discussion questions to learn more about the nitrogen cycle and how humans have affected it.
90
Nitrogen Cycle
USU Water Quality Extension - Stream Side ScienceNitrogen Cycle
• Nitrate kits*• Copies of nitrate sampling instruction sheets*• Waste bottles• Clipboards• Pencils• Plastic water bottles for collecting samples
Part One1. Discuss the nitrogen cycle with your students
• Ask them to identify where nitrogen is found. Talk about how nitrogen is found in many different forms, both organic and inorganic. • Ask the students what the most common inorganic form is (nitrogen gas, which makes up 80% of the atmosphere). • Ask students where organic nitrogen might be found (plants and animals and dead material – nitrogen is used in proteins). • Ask the students what type of nitrogen most plants can use (nitrate or ammonia – two common forms of inorganic nitrogen). Point out that only a few very specialized plants and microorganisms can use nitrogen gas directly. All other plants use nitrogen in the form of nitrate or ammonia.
2. As the students talk about forms of nitrogen. Draw a nitrogen cycle on the board, adding reservoirs and process lines as the stu-dents suggest them (see example on the Teacher Resource page).
Part Two1. Explain to the students that they will measure one type of nitrogen found in water - nitrate. Nitrate is a common form of inorganic nitrogen that is easily used by plants.
ClassroomActivity:
Materials:
* For information on equipment for loan or for purchase, contact USU Water Quality Extension at (435) 797-2580 or www.extension.usu.edu/water-quality

91
Nitrogen Cycle
USU Water Quality Extension - Stream Side Science Nitrogen Cycle
2. Provide water samples from different sources. Groundwater, surface water, or water from a fish tank are all good sources.
3. Divide students into groups of no more than six so that everyone can be involved.
4. Give each group a water sample. Have the groups follow the directions found on the nitrate sampling sheet.
5. Have students record their results on the board and discuss why different sources of water have different concentrations.
6. Explain that nitrate is extremely soluble and moves into our groundwater easily. Explain that in surface waters, the nitrate is used up rapidly by aquatic plants. Part Three1. Return to the drawing of the nitrogen cycle from your earlier discussion, or use the cycle in this lesson as a guide. Ask the students to suggest ways that humans may have affected the nitrogen cycle.
2. Discuss their answers. Be sure to mention the points below.• Inorganic Fertilizers - fertilizers have been produced commercially since the 1950’s andnow account for 80 tg of fixed nitrogen entering the global environment every year. • Feedlots introduce a lot of ammonia into the air.• Fossil fuel combustion (cars and coal burning energy plants) convert nitrogen gas into nitric and nitrous oxides, which are dissolved into rainwater and fall as nitric acid. This is not only a source of acid rain, but also nitrogen fertilizer.
Note: 1 tg (terragram) is equal to 1 million metric tons

92USU Water Quality Extension - Stream Side ScienceNitrogen Cycle
1. Discuss the following terms with your students. Be sure they understand how these relate to the nitrogen cycle.
• Microorganisms are extremely important in converting nitrogen from one form to another. • Nitrification is the transformation of ammonia to nitrite and finally to nitrate. This usually happens by microorganisms in conditions with plenty of oxygen.• Denitrification by a different group of microorganisms is the transformation of nitrate to nitrite and finally to nitrogen gas. • Nitrogen fixation is the conversion of nitrogen gas to nitrate or ammonia, and occurs when there’s little or no free oxygen in the environment (e.g., in the sediments at the bottom of a lake).
2. What form of nitrogen is measured in the water test?This test measures the nitrate (NO3) + nitrite (NO2) concentration in the water, but we generally refer to the results as nitrate only, because nitrite concentrations are usually extremely low in surface waters. Nitrate is one of the two common forms of inorganic nitrogen found in water, and is readily used by plants. The other form, ammonia, is less common in unpolluted surface water.
The nitrate test has two steps. The first step is to shake the water sample with a small amount of ground cadmium. This “strips away” one oxygen atom from the nitrate molecule, converting everything to nitrite. The second step is a color test designed to analyze for nitrite concentrations. The intensity of the pink color is proportional to the amount of nitrite.
FurtherDiscussion:
Nitrogen Cycle

93USU Water Quality Extension - Stream Side Science Nitrogen Cycle
3. What are the impacts of the large amounts of biologically available nitrogen released by human activities?
Nitrogen in such abundance has many impacts. • Over-fertilization of lakes and estuaries is called eutrophication. Runoff of synthetic fertilizers, runoff from feed lots, runoff from drained wetlands, burned areas, and atmospheric deposition all contribute to this problem. The nitrogen stimulates excessive plant growth. The plants eventually die and decompose, which can use up all the dissolved oxygen in the water. This kills fish in lakes, and has also produced an area the size of Massachusetts on the floor of the Gulf of Mexico that is a “dead zone”... no oxygen left so nothing else can live there. • Burning of fossil fuels creates nitric and nitrous oxide as a byproduct in the atmosphere. This falls to earth as nitric acid, a strong acid that can cause acidification of lakes, especially in areas where soils are not well buffered. Heavy nitrogen deposition on soils can acidify the soils, which damages terrestrial ecosystems. They are also a source of fertilizer.• Combustion engines also convert nitrogen gas to nitrous oxide, which is a greenhouse gas (traps heat and contributes to global warming).• Nitrogen can be directly toxic to humans and animals as well. Drinking water nitrate concentrations above 10 ppm (mg/l) cause blue baby syndrome and ammonia at much lower concentrations can be toxic to fish.
Nitrogen CycleNitrogen Cycle

USU Water Quality Extension - Stream Side ScienceNitrogen Cycle
Notes
94
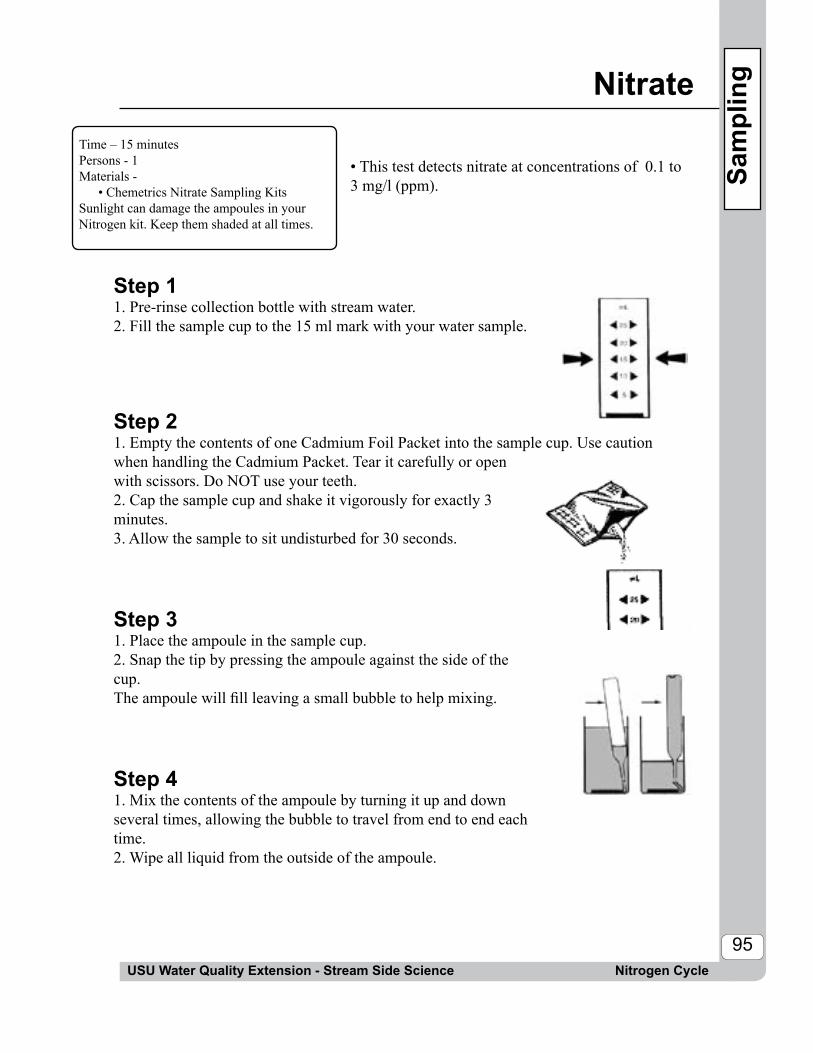
USU Water Quality Extension - Stream Side Science
95
Nitrate
Nitrogen Cycle
• This test detects nitrate at concentrations of 0.1 to 3 mg/l (ppm).
Step 11. Pre-rinse collection bottle with stream water.2. Fill the sample cup to the 15 ml mark with your water sample.
Step 2 1. Empty the contents of one Cadmium Foil Packet into the sample cup. Use caution when handling the Cadmium Packet. Tear it carefully or open with scissors. Do NOT use your teeth. 2. Cap the sample cup and shake it vigorously for exactly 3 minutes.3. Allow the sample to sit undisturbed for 30 seconds.
Step 31. Place the ampoule in the sample cup.2. Snap the tip by pressing the ampoule against the side of the cup. The ampoule will fill leaving a small bubble to help mixing.
Step 41. Mix the contents of the ampoule by turning it up and down several times, allowing the bubble to travel from end to end each time.2. Wipe all liquid from the outside of the ampoule.
Time – 15 minutesPersons - 1Materials -
• Chemetrics Nitrate Sampling KitsSunlight can damage the ampoules in your Nitrogen kit. Keep them shaded at all times.
Sam
plin
g
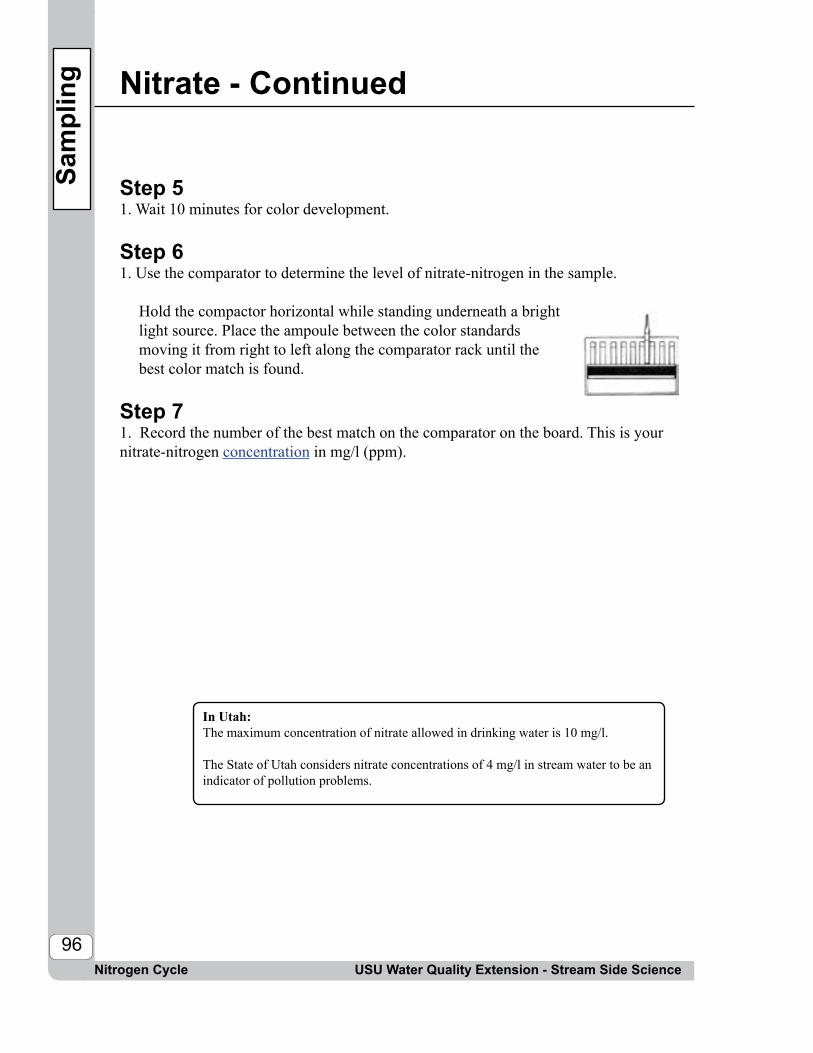
USU Water Quality Extension - Stream Side Science
96Nitrogen Cycle
Nitrate - Continued
Step 51. Wait 10 minutes for color development.
Step 61. Use the comparator to determine the level of nitrate-nitrogen in the sample.
Hold the compactor horizontal while standing underneath a bright light source. Place the ampoule between the color standards moving it from right to left along the comparator rack until the best color match is found.
Step 71. Record the number of the best match on the comparator on the board. This is your nitrate-nitrogen concentration in mg/l (ppm).
In Utah:The maximum concentration of nitrate allowed in drinking water is 10 mg/l.
The State of Utah considers nitrate concentrations of 4 mg/l in stream water to be an indicator of pollution problems.
Sam
plin
g

USU Water Quality Extension - Stream Side Science
97
The Nitrogen Cycle
Nitrogen Cycle
Global reservoirs of nitrogen:Stream and lake sedimentLiving plants and animalsDead plants and animalsAnimal wasteSoilsAtmosphereLakes and riversOceanFertilizersGroundwaterRain water
How nitrogen moves from one reservoir to another:Uptake by plantsEaten by animalsDecay of dead materialRainfallSurface runoffBacterial conversionNitrogen fixationDenitrificationNitrificationLightningVolcanic eruptionsAnimal wasteGroundwater movement
Res
ourc
e
Source: Gilbert Graphics

USU Water Quality Extension - Stream Side Science
98
Nitrogen Sources
Nitrogen Cycle
Res
ourc
e
Source: Peter M. Vitousek at al. 1997. “Human Alteration of the Global Nitrogen Cycle: Causes and Consequences, “ Issues in Ecology, No. 1, pp. 4-6.
* 1 tg (terragram) is equal to 1 million metric tons
Global Sources of Biologically Available (Fixed) Nitrogen
ANTHROPOGENIC (HUMAN) SOURCES
ANNUAL RELEASE OF FIXED NITROGEN
(teragrams)*Fertilizer 80 tgLegumes and other plants grown as crops 40 tgFossil fuels (coal plants and automobiles) 20 tgBiomass burning 40 tgWetland draining 10 tgLand clearing 20 tgTotal from human sources 210 tg
NATURAL SOURCESSoil bacteria, algae, lightning, etc. 140 tg

USU Water Quality Extension - Stream Side Science
99
Notes
Nitrogen Cycle

USU Water Quality Extension - Stream Side ScienceNitrogen Cycle100

USU Water Quality Extension - Stream Side Science
When Things Heat Up
When Things Heat Up
Purpose:
Summary:
Background:
Duration: Classroom 20 minutes Outdoors 50 minutes
Setting: Classroom Outdoors
Materials:
To relate the physical and chemical properties of water to a water pollution issue.
In this exercise, students will measure the temperature and dissolved oxygen of a stream (or use their findings from the activity What’s in the Water?) and discuss what this information can tell us about possible pollution problems.
During this activity students will investigate two properties of wa-ter in a stream – the temperature and the concentration of dissolved oxygen in the water. Students will explore how natural influences, human activities and pollution may cause these parameters to change. They will compare their results to Utah’s water quality standards and investigate possible ways to restore a polluted stream to healthier conditions.
Temperature and oxygen were chosen for this activity because they are easy to measure, the causes of change are both varied and easy to understand, and also the two properties are related to each other. Fish and other animals living in water can be harmed by high temperatures and low oxygen concentrations. As water gets warmer the “saturation concentration” for oxygen gets lower – in other words the warmer the water, the less oxygen it can hold. Therefore, when water temperatures increase, fish are often hit with a double whammy of low oxygen as well. For more information about dissolved oxygen or temperature, see the Utah Stream Team Manual or the Further Discussion questions. This lesson plan is designed to follow the activity What’s in the Water?, during which the students measure several abiotic factors in a stream, or the lesson can be conducted as a stand alone. • Dissolved Oxygen kits * • Field thermometers * • Copies of the student worksheets • Copies of the sampling instructions
• Waste bottles (e.g., empty pop bottles) • Clipboards • Bucket 101

FieldActivity:
USU Water Quality Extension - Stream Side Science
Safety First!Always consider safety factors when working near water.
When Things Heat Up
When Things Heat Up
1. Ask the students to list all the abiotic factors they can think of in an aquatic system (e.g., solar radiation, physical structure of the stream or lake, surrounding landscape, weather, and the properties of water itself).
2. Tell them they will be testing two of these factors that relate specifically to the water – dissolved oxygen (DO) and temperature.
3. Define each of these factors, talk about why these factors are important in an aquatic ecosystem, what can naturally influence these factors, and also what humans can do to influence these factors. 4. Explain to the students that they will be going to a stream (or other waterbody) to measure DO and temperature. You may want to review the actual testing procedures before going into the field.
NOTE: If you have already done the activity What’s in the Water? skip to field activity step five. 1. Set up a station for each factor (DO and temperature). You may want to have multiple stations for each factor so your students can work in smaller groups. At each station, provide:
• Sampling instruction sheets (it may be a good idea to laminate these!)• Waste bottles• A thermometer or DO kit• Clipboards
ClassroomActivity:
* For information on equipment for loan or for purchase, contact USU Water Quality Extension at (435) 797-2580 or www.extension.usu.edu/waterquality
NOTE: These measurements must be taken at the stream site, as storing them will give an inaccurate measurement.
102
103USU Water Quality Extension - Stream Side Science
When Things Heat Up
When Things Heat Up
2. Divide the students into groups. Provide each group with clipboards, pencils, and student worksheets. Explain to the students that each group will start at a different station, and rotate so each group will measure both factors.
3. Have the students follow the instructions for measuring each factor found on the sampling instruction sheets.
4. Have the students record their results onto the student worksheet.
5. Have the students compare their results to the state standards for water quality (found on the student worksheet) and determine if the water is in accordance with state standards.
6. If the results are in violation of the state standards, have the students hypothesize what may have caused this. Alternatively, give the students the following hypothetical situation and again have them hypothesize what may be causing the problem.
“You have returned to the same stream site to test the temperature and DO again. This time your data show that the temperature is 20o C and your DO level is 4 ppm.” What may have happened to change the results? (Summer versus winter time temperatures, loss of canopy cover, low flows, thermal source, pooled or widened stream).
For more information, see the Further Discussion questions at the end of this activity and at the end of the activity What’s in the Water?
ACTIVITY EXTENSIONS: • Give the students the data provided in the resource pages and have them graph the saturation concentrations of oxygen in relation to temperature.• Have the students graph temperature and oxygen concentration vs. time.
Be sure to point out that factors such as elevation and salt content will affect the ability water has to hold oxygen. At higher elevation, water holds less oxygen and salty water holds less oxygen.

USU Water Quality Extension - Stream Side Science
When Things Heat Up
When Things Heat Up
1. Are high temperatures or low dissolved oxygen necessarily a sign of a pollution problem in the stream?
No. Temperatures change throughout the seasons and will also vary from year to year. During warm drought years as opposed to wet years, temperatures in most streams will be higher during the summer because of lower flows and warm-er air temperatures. Therefore, the first thing to consider is whether you’re just observing natural changes in a stream. Stream standards allow for occasional violations because of this natural variation.
2. Would you expect dissolved oxygen to be lower if the temperature is higher?
Yes. The maximum amount of oxygen that can dissolve in water is called the “saturation concentration.” Water can never dissolve a lot of oxygen, and under normal conditions, saturation concentrations will not exceed ~ 12 mg / l (ppm). The amount of oxygen that water will dissolve decreases as the water warms. Therefore, even saturated warm water may have very low concentrations of oxygen (see graph on re-source page).
3. How could human activities have increased the temperature in your later (or hypothetical) sample?
Humans can affect the temperature of rivers by discharing heated water. Industrial or energy plants often produce heated water as a byproduct. Also, when we modify the stream banks (riparian area) and reduce the amount of canopy cover, we can have a direct impact on stream conditions without ever dumping in a pollutant.
Example: Discharge water from energy plants and from some other industrial plants may be considerably warmer than the stream it discharges to. This type of “thermal pollution” is considered a point source (it travels from a source to a stream through a pipe or ditch). Your students should consider any such sources in their community.
FurtherDiscussion:
104
105USU Water Quality Extension - Stream Side Science
When Things Heat Up
When Things Heat Up
Many other human activities affect water quality through indirect means. Urban development, agricultural areas and logging areas may all result in removal of riparian vegetation along a stream. When the shade from these plants disappears, the stream is exposed to more sunlight and heats up. Therefore, your problem may just be some “brush clearing” activities upstream of your site.
4. How could human activities have decreased oxygen in your later sample?
Oxygen can only get into water from the surface (mixing with the atmosphere) or from oxygen produced by plants in the water. Oxygen in water is consumed by animal and plant respiration, during various chemical reactions, and during the decay of organic material. Humans can have a profound effect on how much decaying material is in a stream. Grass clippings, runoff from feedlots, and debris from logged areas are just a few of the sources of material which will ultimately decay in the water and in doing so, use up oxygen. In a rapidly moving stream, the water usually mixes with the atmosphere enough to replace this oxygen. In a pooled up or very slow moving stream, especially if it’s warm, oxygen can be used up very quickly.
NOTE: Dumping nutrients into water (e.g., from yard fertilizers), can stimulate plant growth in a stream or lake. When these plants die, you may also see a drop in oxygen.
5. Why would the time of day make a difference when measuring oxygen concentration in a stream?
We often forget that plants not only create oxygen, but also use it for their cell metabolism. During the night, plants do not photosynthesize but still use oxygen. In streams that have become congested with an overabundance of living plants, oxygen may be very high during the day, but can be extremely low just before dawn because of plant uptake.

USU Water Quality Extension - Stream Side Science
106
Dissolved Oxygen and Temperature
When Things Heat Up
Name: ___________________________ Group #: ______________________Date: ____________________________ Site ID: _______________________
SITE OBSERVATIONS:
Type of waterbody (e.g., stream, lake, wetland):_________________________________Weather today: ___________________________________________________________Weather yesterday: ________________________________________________________Air temperature: __________________________________________________________Water appearance (e.g., clear, brown, foamy, milky):_____________________________What types of land uses are in the immediate area?_______________________________What types of land uses are in the surrounding area?______________________________Is the area shaded by trees? _________________________________________________
Wor
kshe
et
ABIOTIC FACTOR YOUR RESULTS
COMPARE YOUR RESULTS TO ALLOWABLE RANGE
IN UTAH
DOES THE WATER MEET UTAH’S
REQUIREMENTS? (Y/N)
Dissolved Oxygen
ppm (mg/L)
Minimum of 6.5 mg/l for cold water fisheries and 5.5 mg/l for
warm water fisheries.Temperature
°Celsius
Maximum of 20° Celsius for cold water fisheries and the maximum temperature for
warm water fish is 27 ° Celsius.

USU Water Quality Extension - Stream Side Science
107
Dissolved Oxygen
When Things Heat Up
Step 1 1. Pre-rinse collection bottle with stream water.2. Fill the sample cup to the 25 ml mark with your sample.
Step 2 1. Place the glass ampoule in the sample cup. 2. Snap the tip by pressing the ampoule against the side of the cup.3. The ampoule will fill, leaving a small bubble that will help you mix the contents of the ampoule.
Step 31. Mix the contents of the ampoule by turning it up and down several times, allowing the bubble to travel from end to end each time.2. Wipe all liquid from the outside of the ampoule.
Step 41. Wait 2 minutes for color development.
Step 51. With the sun or another light source shining on the comparator (rack of colored tubes) from directly above, place the dissolved oxygen ampoule between the color standards for viewing. It is important that the ampoule be compared by placing it on both sides of the color standard tube before deciding that it is darker, lighter or equal to the color standard.2. Record the concentration of the best color match.
Time - 3 minutes Persons - 1Materials -• Chemetrics DO Sampling Kits Note: Sunlight can damage the ampoules in your DO kit. Keep them shaded at all times
In Utah:The minimum concentration for coldwater fish is 6.5 mg/l.The minimum concentration for warmwater fish is 5.5 mg/l.
Sam
plin
g
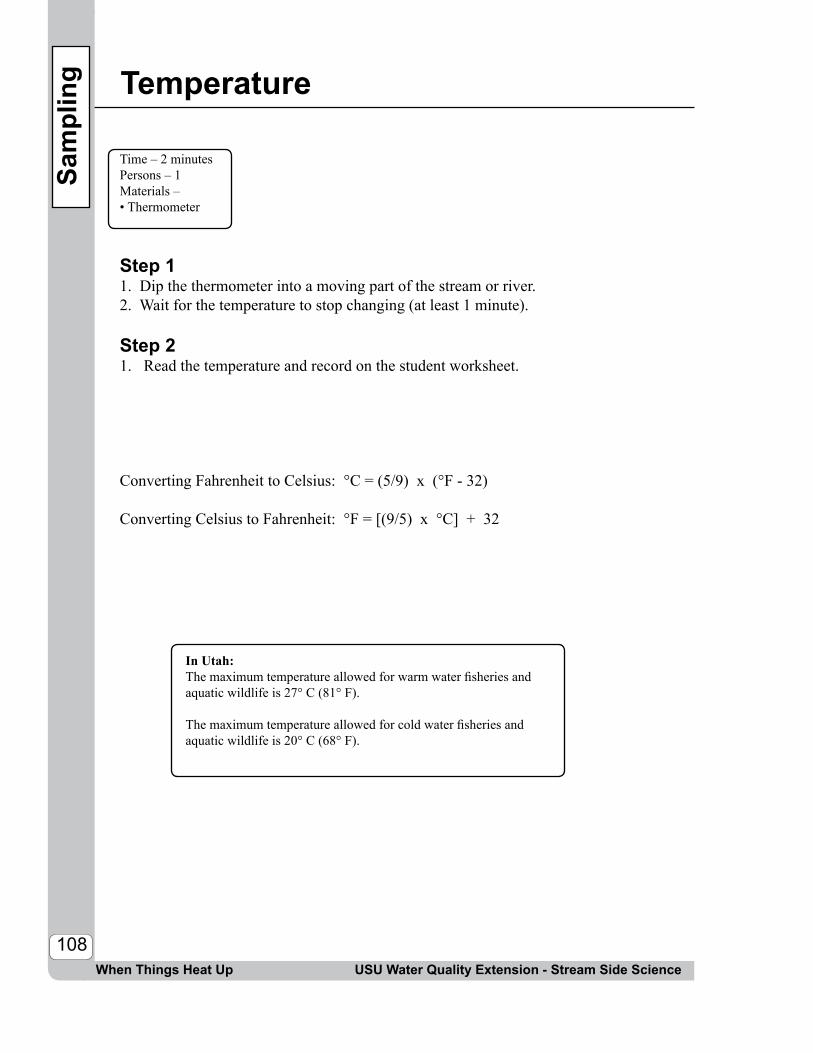
USU Water Quality Extension - Stream Side Science
108
Temperature
When Things Heat Up
Time – 2 minutesPersons – 1Materials – • Thermometer
Step 11. Dip the thermometer into a moving part of the stream or river.2. Wait for the temperature to stop changing (at least 1 minute).
Step 21. Read the temperature and record on the student worksheet.
Converting Fahrenheit to Celsius: °C = (5/9) x (°F - 32)
Converting Celsius to Fahrenheit: °F = [(9/5) x °C] + 32
In Utah:The maximum temperature allowed for warm water fisheries and aquatic wildlife is 27° C (81° F).
The maximum temperature allowed for cold water fisheries and aquatic wildlife is 20° C (68° F).
Sam
plin
g

USU Water Quality Extension - Stream Side Science
109When Things Heat Up
Res
ourc
e
What is Temperature?Temperature is the measure of how much heat energy water contains. A stream’s temperature is affected by the season, the source of water, the geographic area of the stream, the shape of the channel and whether the stream is shaded. Most aquatic organisms require a specific temperature range, and many of our sport fish require cold water.
Refer to the Utah Stream Team Manual for more information on the definition and importance of temperature to fish and other aquatic life, and how natural and human activities affect temperature levels.
Temperature must be measured in the field. The temperature will change if the water is collected and stored, and will not reflect the true value at the site.
Discussion Questions for Temperature:
1. Draw a graph of the temperature of a high mountain stream over an entire year. Draw another line on the graph to show how the temperature might change as you move farther down the river.
Temperatures in streams can change beyond the obvious seasonal differences. Temperatures in streams are often cold near the headwaters, especially if they originate from snowmelt or shallow springs, and get warm from the sun as they move down through the watershed. Shading (riparian vegetation), and the width and depth of the stream will all affect a stream’s temperature.
2. How will groundwater entering a stream affect its temperature?Groundwater is usually colder than surface water and therefore it would probably cool the stream. Some areas in Utah, however, have hot springs which introduce heat and minerals to a stream. Because the temperature of groundwater doesn’t fluctuate much throughout a year, a stream with a major groundwater component may show less seasonal variability than a stream fed entirely by surface runoff.
Temperature

USU Water Quality Extension - Stream Side Science
110
Temperature, Continued
When Things Heat Up
3. Discuss how different land uses (logging, road building, agriculture, urban uses) might affect temperature.
The major influences on temperature in a stream are exposure to the sun, and exposure to heated surfaces. Any activity that causes a stream to become shallower and wider (this can happen when too much sediment enters a stream) will cause the stream to heat more rapidly. When trees along the banks are removed, the loss of shading can cause the stream to heat up. Water that is diverted (such as for irrigation) and then returned to the stream usually heats up. Finally, streams with small flows will heat faster than streams with lots of water, so removing water from a stream can cause an increase in temperature.
Suggested sources of water samples, with expected results and explanation:
Res
ourc
e
Water Source Expected Result
Explanation
A stream or river in the late summer / early fall
warmer Warmer air temperatures, plus no source of cold water (e.g., snowmelt) cause streams to be warmer in the later summer / early fall
A stream or river in the spring or winter
cooler Cold air temperatures plus snowmelt in the spring lower the temperature of the water.
A stream near its headwaters
cool The water source is snowmelt or groundwater. These streams are also usually shaded by trees and bushes.
A stream after it has traveled through a large valley or through a city
warmer (com-pared to the head-water stream)
The water warms as it travels away from the headwaters due to solar radiation and heat transfer from the streambed and banks. Areas with little riparian vegetation (no shading) will heat faster. Streams with concrete banks (e.g., urban areas) will absorb heat from these artificial banks.
A stream near a hot spring
warmer Hot spring water will mix with the stream water, raising the temperature.

Dissolved Oxygen
USU Water Quality Extension - Stream Side Science
111When Things Heat Up
What is Dissolved Oxygen?Dissolved oxygen (DO) is a measurement of the concentration of O2 molecules actually dissolved in water. This is the form of oxygen that fish and aquatic insects need.
Oxygen is not very soluble in water. Usually, about 12 parts of oxygen can dissolve into a million parts of water. In very cold water however, concentrations can be as much as 14 parts per million (ppm) or mg/1. The maximum amount of oxygen that can dissolve in water is called its saturation concentration. The saturation concentration decreases as water temperature or elevation increase.
Refer to the Utah Stream Team Manual for more information on the definition and importance of DO to fish and other aquatic life, and how natural and human activities affect the DO levels.
DO must be measured in the field. The DO will change if the water is collected and stored, and will not reflect the true value at the site.
Discussion Questions for Dissolved Oxygen:
1. How does oxygen get into water? Oxygen is dissolved into water by contact with the atmosphere, or from aquatic plants that produce oxygen during photosynthesis. Therefore, oxygen will be higher in turbulent stream water (lots of mixing with the atmosphere) or in water with lots of plants (but only during the day, when photosynthesis can occur).
2. How does oxygen get used in water?The respiration of animals and plants uses oxygen. Bacterial decomposition of dead organic materials can be a major factor, and may cause the dissolved oxygen to be completely consumed in deep pools or lakes. Some chemical reactions (oxidation reactions) also require and consume oxygen.
3. How will dissolved oxygen concentrations be affected by the dumping of yard clippings or the runoff of animal manure?
The decomposition of organic materials such as these may use all the available oxygen in the water. Secondary treatment by municipal treatment plants removes the organic material from the water for just this purpose. Before municipal wastewater was treated properly, many rivers and streams had fish kills and dead zones caused by low oxygen as this waste was decomposed.
Res
ourc
e

USU Water Quality Extension - Stream Side Science
112
Dissolved Oxygen, Continued
When Things Heat Up
Suggested sources of water samples, with expected results and explanation: Res
ourc
e
Water Source Expected Results Explanation
Fast moving cool stream high (>10 mg/l)
Turbulence mixes atmospheric oxygen into the water. The water may even be supersaturated.
Still water (e.g., productive pond water)
may vary through-out the day: lower at night (<4 mg/l) and much higher in the late afternoon. (>10 mg/l)
No turbulence to mix the oxygen. Plants produce oxygen, but the plant respiration and decay may also use it up.
Warm water low (<8 mg/l) Warm water holds less oxygen than cold water.
Stream water in a closed jar without any plants
low to moderate (6-8 mg/l)
No plants to produce oxygen, no opportunity for mixing with atmospheric oxygen. Note: microscopic plants may complicate results.
Stream water in a closed jar with leaf litter (dead or decaying plants)
low (<6 mg/l) Decaying plants/leaf litter use the oxygen in the water.

Activity Extension
USU Water Quality Extension - Stream Side Science
113
Effect of Temperature on Dissolved Oxygen Concentrations
When Things Heat Up
Res
ourc
e
The data below show the maximum amount of dissolved oxygen the water can hold at different temperatures. This is called the “saturation concentration” of oxygen.
Have your students use this information to create a graph showing the “saturation concentrations” of water as temperature changes. See the example graph below.
Oxy
gen
Con
cent
ratio
n (m
g/l)
Water Temperature (oC)0 5 10 15 20 25 30 35
16
14
12
10
8
6
4
2 0
Temperature (°C)
Dissolved Oxygen (mg/l)
Temperature (°C)
Dissolved Oxygen (mg/l)
Temperature (°C)
Dissolved Oxygen (mg/l)
0 14.2 12 10.4 24 8.21 13.8 13 10.2 25 8.12 13.4 14 10.0 26 8.03 13.0 15 9.8 27 7.94 12.7 16 9.6 28 7.75 12.4 17 9.4 29 7.66 12.1 18 9.2 30 7.57 11.8 19 9.0 31 7.48 11.5 20 8.8 32 7.39 11.1 21 8.7 33 7.210 10.9 22 8.5 34 7.111 10.7 23 8.4 35 7.0

USU Water Quality Extension - Stream Side Science
114
Activity Extension, Continued
When Things Heat Up
Res
ourc
e
Changes in Temperature and Dissolved Oxygen Throughout a Year
The table on the next page contains temperature and dissolved oxygen concentrations measured at the same site in a stream throughout an entire year. The site has slow moving water, and aquatic plants grow in the soft sediments of the stream from spring through fall. The first column of DO measurements were taken at 4:00 p.m. and the second column of DO measurements were taken at 4:00 a.m.
Have your students graph temperature and the first set of dissolved oxygen versus time.
How do temperature and dissolved oxygen change throughout the year? Temperature is highest in summer, while DO is lowest in summer. This is because saturation concentration of dissolved oxygen decreases as the water temperature increases (see graph below).
Now have your students add the second set of dissolved oxygen data to the graph. Tell them the samples were collected at 4:00 a.m.
Why was the dissolved oxygen lower at 4:00 a.m. than at 4:00 p.m.? The plants in the water consume oxygen at night (due to metabolic respiration), but cannot produce oxygen from photosynthesis at night when there is not light. Therefore DO can be substantially lower in water at one time of day than another.
Temperature and Dissolved Oxygen
Tem
p (
C) o
r DO
(mg/
l)
302520151050
14-Jan 23-Apr 1-Aug 9-Nov 17-Feb
DO at 4:00 pm DO at 4:00 amTemperature
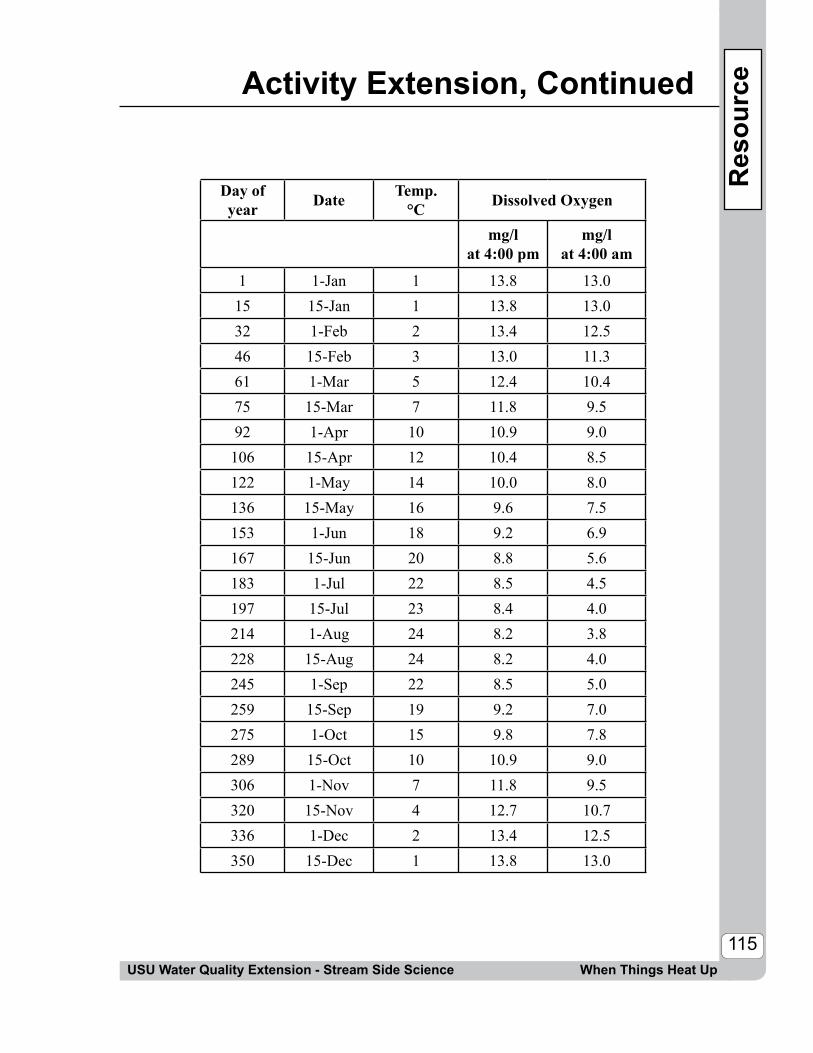
Activity Extension, Continued
USU Water Quality Extension - Stream Side Science
115When Things Heat Up
Res
ourc
e
Day of year Date Temp.
°C Dissolved Oxygen
mg/lat 4:00 pm
mg/lat 4:00 am
1 1-Jan 1 13.8 13.015 15-Jan 1 13.8 13.032 1-Feb 2 13.4 12.546 15-Feb 3 13.0 11.361 1-Mar 5 12.4 10.475 15-Mar 7 11.8 9.592 1-Apr 10 10.9 9.0106 15-Apr 12 10.4 8.5122 1-May 14 10.0 8.0136 15-May 16 9.6 7.5153 1-Jun 18 9.2 6.9167 15-Jun 20 8.8 5.6183 1-Jul 22 8.5 4.5197 15-Jul 23 8.4 4.0214 1-Aug 24 8.2 3.8228 15-Aug 24 8.2 4.0245 1-Sep 22 8.5 5.0259 15-Sep 19 9.2 7.0275 1-Oct 15 9.8 7.8289 15-Oct 10 10.9 9.0306 1-Nov 7 11.8 9.5320 15-Nov 4 12.7 10.7336 1-Dec 2 13.4 12.5350 15-Dec 1 13.8 13.0

116USU Water Quality Extension - Stream Side ScienceWhen Things Heat Up

USU Water Quality Extension - Stream Side Science
Aquatic Invasion!
Aquatic Invasion!
Purpose:
Summary:
Background:
To understand the properties of invasive species and learn about aquatic invasive species and their effect on aquatic ecosystems.
In the excersie, students will investigate aquatic invasive species. They will choose one aquatic invasive species, investigate its dis-tribution, life history, and possible solutions or management prac-tices to control the species and/or its impacts. From this information students will create an “unwanted” poster to engage local citizens and help them understand the importance of controlling the organ-ism.
Invasive species are non-native (or alien) to an ecosystem whose introduction causes, or is likely to cause, harm to the economy, the environment, or human health. Not all non-native species are considered invasive, since many non-native species are not able to spread or reproduce once introduced to a new habitat. Some non-native species provide economic benefits, like crops, and are not condsidered invasive.
Invasive species may prey upon, displace or otherwise harm native species. They may also alter ecosystem processes, transport disease, or cause illnesses in animals and humans. Invasives can affect the commercial, agricultural, aquacultural, and recreational activities dependent on such waters, resulting in severe economic impacts. Control of invasives can be extremely difficult once they are estab-lished. Many natural barriers exist which help isolate species and prevent their introduction into new regions. Invasive species must overcome barriers in the environment that would otherwise prevent their spread. These barriers are:
• Geographic barriers such as a mountain range, ocean or river that prevents easy movement from one area to another and separates different habitats.
117
Duration: Classroom 2 hours Outdoors 1 hour
Setting: Classroom Outdoors

USU Water Quality Extension - Stream Side Science
Aquatic Invasion!
Aquatic Invasion!118
• Survival and establishment barriers are environmental features that prevent an introduced species from thriving. These might include soil moisture and pH for plant species, water temperature, pH, or salinity for aquatic species.
• Dispersal and spread barriers are natural or constructed block-ades such as a wall of vegetation on land or a barrier of electricity in water. These are made to prevent rapid dispersal and spread from the site of establishment.
Human activities are often the culprit in introducing and perpetuating the spread of invasive species. Here are some examples of human activities which have served as pathways for spreading invasive species:
• Illegal fish stocking: Illegally introducing a non-native fish into a water body.
• Legal stocking: Legally introducing a non-native fish into a water body, usually for recreational fishing, or for population controls on other fish.
• Ships and boats: To stabilize ships, water is often taken into a ballast tank. Aquatic organisms can be taken in and transported in this ballast water. Organsims can also be transported by attaching to the ship itself, this is called hull fouling.
• Ornamental plants: Some ornamental plants can spread into the wild and become invasive.
• Pet trade: Intentionally or accidentally releasing pets into their non-native habitat.
• Wood: Insects can get into wood, shipping palettes, and crates that are shipped around the world.
Proper retiring of classroom animalso Give the animal to another responsible teacher o Return it to the place where it was purchased (perhaps make prior arrange-ments to do so) o Keep it as a classroom pet o Donate it to your local natural history museum, zoo, or aquarium (check before you acquire the animal) o Humane euthanasia (contact your local veterinarian for advice)For more information, see: http://wild-life.state.co.us/WildlifeSpecies/Living-WithWildlife/Pets/

119USU Water Quality Extension - Stream Side Science
Aquatic Invasion!
Aquatic Invasion!
• Agriculture: Invasive pests and diseases can be transported across US borders through the commercial or personal transport of agricultural items, such as fruit, vegetables, and plants.
• Improperly cleaned equipment: Fieldwork and recreational ac-tivities can unintentionally spread invasive species on the equip-ment that is used.
For more information on aquatic invasive species please call the Division of Wildlife Resources at (801) 538-4700, email [email protected], or see:
• http://wildlife.utah.gov/mussels/plan.php• http://invasivespeciesinfo.gov/docs/council/isacdef.pdf• http://protectyourwaters.net/prevention• http://www.utahweed.org/• http://ag.utah.gov/divisions/animal/fish/nuisance.html
• Computer with internet access• Poster paper• Miscellaneous art supplies• Group presentation worksheet
Part 1 1. Define the term aquatic invasive species. Aquatic invasive spe-
cies non-native to the ecosystem under consideration whose introduction causes or is likely to cause harm to the economy, the environment, or human health. Talk about why invasive species are a threat to native species in a given ecosystem.
2. Give students examples of invasive species. Examples can be found in the Resource pages of this lesson.
3. Ask the students if they can think of any local examples of aquat-ic invasive species. Ask them if they can think of any possible ways the invasive species were introduced into the ecosystem. Be sure to inform them of the human activities which often introduce aquatic invasive species to an ecosystem.
• Waders• Plastic pan• Kick net• Invasive species pictures
Materials:
ClassroomActivity:
USU Water Quality Extension - Stream Side Science
Aquatic Invasion!
Aquatic Invasion!120
Part 21. Explain to the students that they will be researching and
presenting on a specific aquatic invasive species within Utah. 2. Separate the students into small groups of three or four. Assign
each group a specific aquatic invasive species that is affecting the state. A list of aquatic invasive species can be found in the Resource section of this lesson.
3. Have students use the Internet to research their assigned invasive species. From their research, students will fill out the accompany-ing worksheet found in the Resources section of this lesson. Be sure they list the reference.
4. Each group will then make a creative, informative poster of their invasive species using the information from their research work-sheet (see the Resource section of this lesson for an example). This can be done on the computer or with art supplies.
5. After the posters are completed, each group will use their post-ers as a visual in a presentation on their aquatic invasive species. Additionally, the posters can be displayed within the school or community in order to educate others on aquatic invasive species within Utah.
1. Take a field trip to a lo-cal, safe, accessible water body. It could be a river, pond, lake, reservoir, or stream.
2. Lead a discussion about invasive species. Perhaps start by asking the stu-dents what activities take place at the field trip location. Then focus on how these activities may facilitate the spread of invasive species if the proper precau-tions are not taken.
FieldActivity:
• As with any field trip, exercise appro-priate safety precautions. See Appendix A in this manual for more information on safety in the field.
• This is an excellent opportunity to teach the students the responsibility of field work and even recreation. Use Best Management Practices (BMP) discussed in the Further Discussion questions.

121USU Water Quality Extension - Stream Side Science
Aquatic Invasion!
Aquatic Invasion!
3. Have the students look at pictures of different invasive species located within Utah. Talk about the environments where these species live. Ask the students which of the species they know are located, or have potential to be located, within the field trip loca-tion.
4. Ask the students how they think the invasive species could have gotten there.
5. Have the students sample the water body using the kicknet. It is likely that the students will not find an invasive species; however, this is an opportunity to train them to use Best Management Prac-tices (BMPs) in their fieldwork (e.g., properly disinfecting wad-ers, kicknets, and any other equipment used in the water).
ACTIVITY EXTENSIONS:• Write to a government agency or political leader with concerns and recommen-
dations for aquatic invasive species.• Have students create an outreach campaign for the community based on their
posters of the aquatic invasive species. This can include tips and suggestions for the prevention of introduction and spreading of aquatic invasive species.
• Have a guest speaker from an agency implementing invasive species action plans or with knowledge and experience on invasive species come speak to the class.
1. What are the characteristics of an environment that is vulnerable to invasive species?
• Lack of biotic constraints: Natural predators or disease, which the invading organism had in its native environment are biotic constraints. Natural predators help control populations of their prey. Since an invasive species often has no natural predator in its non-native environment, its population rapidly increases. With a large population, it is easy for an invasive species to outcompete native species.
• Disturbances: Fire, construction, agriculture, etc., prior to the invasion cause a disruption in an ecosystem’s natural function and structure. A disrupted ecosystem is vulnerable to invasive species establishment.
FurtherDiscussion:

USU Water Quality Extension - Stream Side Science
Aquatic Invasion!
Aquatic Invasion!
• Proximity to potential sources of invasive species: Since people transport many non-native species, urban areas and recreational areas typically have a high number of invasive species.
New species often find their way into new ecosystems, but not all become nuisance species. In order for a non-native species to become an invasive species, it must harm and negatively impact its new envi-ronment.
2. What can be done to control aquatic invasive species?
• Mechanical Control removes an invasive species by hand or with a machine. The process is often very labor intensive and needs multiple efforts. In Utah Lake, the Common Carp is being removed using boats, large nets, and hand labor to capture and remove about five million pounds of fish annually over a six year period. Trapping, electricity, trawling, or baiting may also be used.
• Chemical Control uses chemical applications to control invasive species. The chemical Rotenone is often used to treat water bod-ies infested with invasive fish species. However, chemicals like Rotenone, such as pesticides, herbicides, or other piscicides, are often not target-specific and can harm water resources as well as other plants and animals besides invasive species.
• Biological Control involves the release of a new species in the environment to control an invasive species. A biological control agent, the Saltcedar Leaf beetle Diorhabda elongate, has been released in nine western states including Utah in order to control tamarisk populations.
122

123USU Water Quality Extension - Stream Side Science
Aquatic Invasion!
Aquatic Invasion!
3. What are specific procedures to protect against introduction of aquatic invasives?• Assume every water body is contaminated and that boats and
equiment should always be considered contaminated• Eliminate water from all equipment before transporting
anywhere• Remove all visible mud, plants, and fish/animals• Keep one set of equipment for use only on infested waters • Decontaminate equipment following each use, whenever
possible, by cleaning and drying anything that came in contact with the water
• Keep boat and equipment clean between trips and let dry for as long as possible
• Do not release or put plants, fish or animals into a body of water unless they came out of that body of water
• Report the finding of an aquatic invasive species to the Utah Division of Wildlife Resources at 801-538-4700
4. Why are the definitions of invasive species sometimes unclear?Some non-native species are considered harmful and therefore invasive by some sectors of our society while others consider them beneficial. This discontinuity is reflective of the different value systems operating in our free society and contributes to the complexity of defining the term invasive species. (http://www.invasivespeciesinfo.gov/docs/council/isacdef.pdf)

USU Water Quality Extension - Stream Side Science
Aquatic Invasion!
Aquatic Invasion!
5. How do aquatic invasive species affect water quality?Aquatic invasive species affect water quality through small changes in the ecosystem. These small changes have a significant, negative impact over time. One example of this is the CommonCarp. This is a fish which feeds by browsing through underwater vegetation. This feeding uproots plants which muddies the water and destroys the food and cover needed by other fish. Another example of this is the Water Hyacinth. This is a plant which blocks light for photosynthesis, which greatly reduces oxygen levels in the water. This reduction in oxygen in turn reduces other under-water life such as fish and other plants, thus depleting biological diversity which alters an ecosystem’s animal community. (For more information, see: http://www.protectyourwaters.net/impacts.php)
6. What are some impacts of aquatic invasive species? How do invasive species affect water resources and what are the associated effects?Invasive aquatic plants and animals destroy habitats in coastal waterways and interrupt the flow of water in inland desert irrigation canals. They clog storm canals leading to the flooding of homes and displace native species in our nation’s wetlands. Furthermore, they compete with native species for resources, often leading to a decline in the population of native species. One example of this is seen in the competition between the native Cutthroat Trout and the nonnative Brown Trout in many rivers within Utah. Both are competing for the same food source, which is causing a decline in the native Cutthroat Trout population.
124

125USU Water Quality Extension - Stream Side Science
Aquatic Invasion!
Aquatic Invasion!
7. Invasive species have a place in their native habitat. When introduced to a new habitat, they are only doing what every other organism does: taking advantage of opportunities to survive and perpetuate their species. How does knowing this change our actions in order to mitigate the spread of invasive species?Most invasive insects, marine invertebrates, and microorganisms are accidentally introduced. For this reason, most countries have many restrictions and regulations in place detailing how imported and exported products will be monitored.
8. What are our future management, policy, and societal needs to lessen or adapt to the effects of invasive species as they alter aquatic ecosystems?“The best way to limit impacts of non-native species is to prevent them from invading and becoming established in a new area. If thisfails, eradication may still be possible, but generally only if the species is identified and treated quickly. Once established, efforts to restrict spread to uninfested areas can limit further damage. Controlling population sizes in heavily invaded areas can also reduce deleterious effects, but is unlikely to lead to eradication. Last, maintaining healthy natural communities, either by limiting human disturbance, or restoring of previously impacted areas, can limit opportunities for exotics to take hold.”http://www.esa.org/education/edupdfs/invasion.pdf
9. What can you do to prevent the spread of invasive species?• Inspect your boat and equipment (waders, ect). Remove any
plants or animals.• Decontaminate boats and equipment before use in another
waterbody.• Drain water from the motor and all containers including,
balast tank, bilge, and transom well and allow them to dry.• Never transfer live aquatic species from one water body into
another.• Never dump aquarium plants or pets in lakes or streams.• Don’t plant invasive species in your yard or garden.• Get involved in a project to remove invasive species.
126
Wor
kshe
et
USU Water Quality Extension - Stream Side ScienceAquatic Invasion!
Name: ___________________________ Date: ____________________________ When filling out the answers below, remember to cite the website and author from each answer on the back of this page.
1. What is the common name of the aquatic invasive species you chose?_____________
2. What is the scientific name of the aquatic invasive species? _____________________
3. Describe 3 characteristics of the aquatic invasive species. 1. ______________________________________________________________ 2. ______________________________________________________________ 3. ______________________________________________________________
4. Where did your aquatic invasive species originate? _________________________________________________________________________________________________
5. What is the current geographical range of your aquatic invasive species? ________________________________________________________________________________
6. How was your aquatic invasive species introduced to that range? ______________________________________________________________________________________
7. Give 3 reasons why the spread of your aquatic invasive species is harmful and should be prevented. 1. ______________________________________________________________ 2. ______________________________________________________________ 3. ______________________________________________________________
8. Name 2 ways the spread of your aquatic invasive species can be prevented. 1. ______________________________________________________________ 2. ______________________________________________________________
9. Name and describe a plan your state has in place to manage your aquatic invasive species. If a plan does not currently exist, what would you do? ____________________________________________________________________________________________________________________________________________________________________________________________________________________________________________________________________________________________________________
10. Give one cool fact about your aquatic invasive species. _____________________________________________________________________________________________
Research Worksheet

127
Wor
kshe
et
USU Water Quality Extension - Stream Side Science Aquatic Invasion!
Citations1. __________________________________________________________________________________________________________________________2. __________________________________________________________________________________________________________________________3. __________________________________________________________________________________________________________________________4. __________________________________________________________________________________________________________________________5. __________________________________________________________________________________________________________________________6. __________________________________________________________________________________________________________________________7. __________________________________________________________________________________________________________________________8. __________________________________________________________________________________________________________________________9. __________________________________________________________________________________________________________________________

USU Water Quality Extension - Stream Side Science
128Aquatic Invasion!
Res
ourc
e
o Whirling Disease (Myxobolus cerebralis)• Original distribution: In Europe in brown trout• Invasive distribution: It is in the Western and North Eastern
United States
o Asian Tapeworm (Bothriocephalus acheilognathi)• Original distribution: This species is native to East Asia • Invasive distribution: It is is known in several areas of the
United States. It appears to be well established in the lower Colorado River and the Hawaiian islands, and has recently been reported in the Great Lakes.
o Chytrid (Batrachochytrium dendrobatidis)• Original distribution: South Africa• Invasive distribution: It is presently found in Australia;
Africa; North, Central and South America; Europe; New Zealand; and Oceania. It is found across the United States, including across all of Utah.
o Rock Snot (Didymosphenia geminate)• Original distribution: Northern Europe and northern North
America• Invasive distribution: Scattered populations exist through-
out the United States, including New England, the Mid-Atlantic Region, and the Western U.S.
Pathogens and parasites
Fungus and Algae
wildlife.state.co.us
sci.sdsu.edu
frogsabound.org
cisr.ucr.edu
List of Aquatic Invasive Species
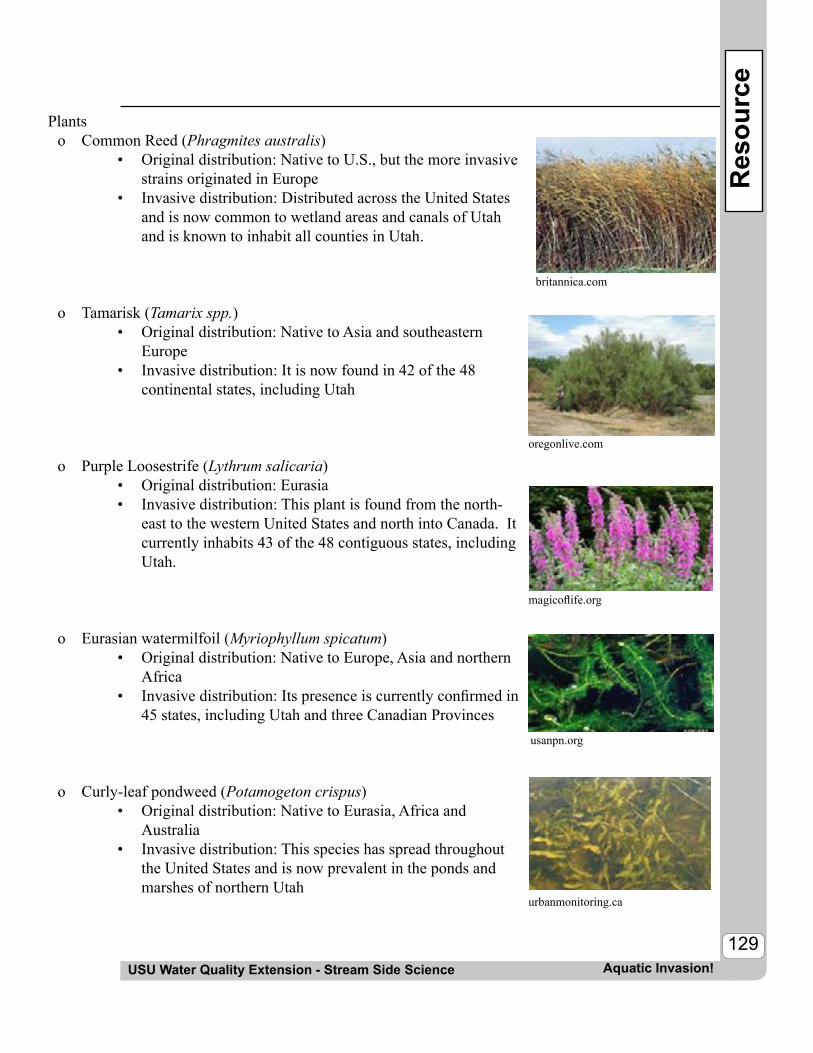
USU Water Quality Extension - Stream Side Science
129Aquatic Invasion!
Res
ourc
e
o Common Reed (Phragmites australis)• Original distribution: Native to U.S., but the more invasive
strains originated in Europe• Invasive distribution: Distributed across the United States
and is now common to wetland areas and canals of Utah and is known to inhabit all counties in Utah.
o Tamarisk (Tamarix spp.)• Original distribution: Native to Asia and southeastern
Europe• Invasive distribution: It is now found in 42 of the 48
continental states, including Utah
o Purple Loosestrife (Lythrum salicaria)• Original distribution: Eurasia• Invasive distribution: This plant is found from the north-
east to the western United States and north into Canada. It currently inhabits 43 of the 48 contiguous states, including Utah.
o Eurasian watermilfoil (Myriophyllum spicatum)• Original distribution: Native to Europe, Asia and northern
Africa• Invasive distribution: Its presence is currently confirmed in
45 states, including Utah and three Canadian Provinces
o Curly-leaf pondweed (Potamogeton crispus)• Original distribution: Native to Eurasia, Africa and
Australia• Invasive distribution: This species has spread throughout
the United States and is now prevalent in the ponds and marshes of northern Utah
britannica.com
oregonlive.com
magicoflife.org
urbanmonitoring.ca
usanpn.org
Plants

USU Water Quality Extension - Stream Side Science
130Aquatic Invasion!
Res
ourc
e
o Asian Clam (Corbicula fluminea)• Original distribution: Southeastern Asia• Invasive distribution: It is found in 38 states, including
Utah, and the District of Columbia
o Red-rimmed Melania (Melanoides tuberculatus)• Original distribution: Northern Africa to southern Asia• Invasive distribution: Confirmed in 12 western and south-
ern states, including Utah
o Quagga Mussel (Dreissena bugensis)• Original distribution: Dneiper River drainage of Ukraine• Invasive distribution: Currently distributed in all five Great
Lakes, throughout the St. Lawrence River north to Quebec City, and in New York, Ohio, Michigan, Pennsylvania, and southwestern United States, including Utah
o Zebra Mussel (Dreissena. Polymorpha)• Original distribution: The Black, Caspian and Azov seas• Invasive distribution: Eurpope and the Mississippi River
drainage.
o New Zealand Mudsnail (Potamopyrgus antipodarum)• Original Distribution: New Zealand• Invasive Distribution: Australia, Europe,
Asia, and North America—now locally abundant in western rivers, including Utah
Mollusks
Dreissena Mussels
nas.er.usgs.gov
nas.er.usgs.gov
seagrant.umn.edu
esg.montana.edu
fl.biology.usgs.gov

USU Water Quality Extension - Stream Side Science
131Aquatic Invasion!
Res
ourc
e
o Western Mosquitofish (Gambusia affinis)• Original distribution: Native to the south-central United
States and Mexico• Invasive distribution: Pan-global distribution including
most of the United States
o Burbot (Lota lota)• Original distribution: Burbot are native to Alaska,
Canada and the northern continental U.S., with their range extending as far south as Wyoming and northeastern Utah
• Invasive distribution: Populations are now established in Connecticut, Illinois, Indiana, New Jersey, Ohio and Pennsylvania and various locations within Utah
o North American Bullfrog (Rana catesbeiana)• Original distribution: Eastern United States, but
historically absent from the Cape Cod archipelago and associated islands
• Invasive distribution: 11 states, including Utah
o Plains Leopard Frog (Rana blairi) • Original distribution: Southern Canada and
the northern United States• Invasive distribution: 3 western states, including Utah
o Red-Eared Slider (Trachemys scripta elegans)• Original distribution: the Mississippi valley from northern
Illinois and Indiana to the northern Gulf of Mexico, west to Texas and east to western Alabama
• Invasive distribution: 23 states, including Utah, as well as areas in Canada, Mexico, the Caribbean, and other global locations
Fish
Amphibians
fishtankforum.co.uk
fwp.mt.gov
georgiaencyclopedia.org
ndis.nrel.colostate.edu
blog.nus.edu.sg
Reptiles

USU Water Quality Extension - Stream Side Science
132Aquatic Invasion!
Res
ourc
e
Notes

USU Water Quality Extension - Stream Side Science
133Aquatic Invasion!
Res
ourc
e
Potamopyrgus antipodarum
Alias: New Zealand Mudsnail
Why unwanted: The New Zealand Mudsnail outcompetes native invertebrates for food and space because its population densities exceed 100,000 individuals per square meter. The Mud-snail can consume up to 75% of the gross primary production. This species has recently been seen biofouling, or accumulating in overwhelming numbers, in wetland areas.
Description: Small (<5mm), invasive, hydrobiid snail. It has an elongate, dextral shell that varies in color and typically has 5 to 6 whorls at maturity.
Originally from: New Zealand
Sightings: The New Zealand Mudsnail has been sighted in Australia, Europe, Asia and North America. In Utah, New Zealand Mudsnails are found in most of the major river drainages of the northern part of the state and in the Green River.
Mode of transport: The New Zealand Mudsnail is known to spread through the commercial transport of aquaculture products, independent locomotion upstream, recreational equipment, and the alimentary canals of fish.
Threat: This invasive species typically occurs in systems with high primary productivity, con-stant temperatures and constant flow. Furthermore, it is able to adapt to a wide range of tem-peratures, salinities, and substrates.
What you can do: Properly decontaminate any equipment used in the water through desiccation and freezing, or an appropriate cleaning solution.
Sample Poster

134USU Water Quality Extension - Stream Side ScienceAquatic Invasion!

USU Water Quality Extension - Stream Side Science That’s Predictable
Purpose:
Summary:
Background:
Duration: Classroom: Introduction 30 min. Student Work 2 weeks
Setting: Classroom
Materials:
That’s Predictable
To predict how an ecosystem will change as a result of major changes in the abiotic and/or biotic factors.
In this exercise, students will be asked to research and report on ecosystem changes that occur as a result of changes in an aquatic environment.
For background information, see:• The Resource page provided which includes a table showing the changes to an aquatic ecosystem and the ecosystem response.• The Chemical Properties section of the Utah Stream Team Manual which discusses abiotic factors in an aquatic ecosystems including how each chemical property changes due to natural and human influences, and why the factor is important in aquatic ecosystems.• The Biological Properties section of the Utah Stream Team Manual which discusses macroinvertebrates and riparian vegetation in an aquatic ecosystem.• The Physical Properties Section of the Utah Stream Team Manual which discusses stream flow and stream structure and how those are affected by human activities.
• Access to the library and other reference materials• Access to the internet• The Utah Stream Team Manual• Other reference sources (see a list on the Resource page)• Results from the Stream Side Science Activities (optional):
What’s in the Water?Riparian ReviewWho Lives in the Water?
135

USU Water Quality Extension - Stream Side Science
That’s Predictable
That’s Predictable
1. Ask the students to review all the abiotic and biotic factors in an aquatic ecosystem. Optional: Refer to the activities What’s in the Water?, Who lives in the Water? and Riparian Review.
2. Discuss the role that these factors play in the environment. Have the students discuss how a change in abiotic or biotic factors would affect the aquatic ecosystem.
3. Explain to the students that they will choose a change in abiotic or biotic factors in an aquatic ecosystem and explore it further in the form of a written paper, presentation or other format of the teacher’s choice. For ideas, see the Resource page.
4. To help the students get started, choose a topic and with the class, form a hypothesis of what might happen to the ecosystem as a result of the abiotic or biotic change. With the class, develop a list of sources where they will be able to find more information.
Suggested points that students may include:• Geographic scale of problem – e.g., watershed scale vs. backyard scale.• Magnitude of problem – e.g., slumping of entire hill slopes vs. loss of banks in small sections.• Reversibility of changes – e.g., loss of topsoil from a major avalanche vs. loss of vegetation in an avalanche.• Driving factors for changes – e.g., erosion from a construction site.• Natural forces – e.g., floods, tornadoes, droughts, global warming.• Economics – e.g., developers of housing developments or logging/mining interests.• Politics or regulations – e.g., requirements by law.• Cost/benefits – i.e., who or what will benefit, who will pay (consider costs and benefits to society, to individuals, to ecosystem functions or to different components of ecosystems).• Have the students research further on their topic for changes that have occurred in their area.
ClassroomActivity:
136

137USU Water Quality Extension - Stream Side Science
That’s Predictable
That’s Predictable
Applying the Information
• Use the information in the students’ papers to hold a debate for or against each of the changes in abiotic or biotic factors.• Have the students take action in their community on one of the topics they researched. For example:
• Work with local agencies to restore a section of a stream. (http://www.ut.nrcs.usda.gov/)• Conduct a service project such as a “stream clean-up”• Make a website• Educate the public about the issue at a public forum or through educational materials at a public location such as a park or mall • Participate in volunteer monitoring through USU Water Quality Extension (http://extension.usu.edu/waterquality)
1. Do you think that ecosystems will always be changed if there are small changes in abiotic or biotic factors?
• Change is a natural part of ecosystems, and all healthy ecosystems are to some extent “self-correcting.” For example, an early snowstorm may cause many trees or branches to fall, but in a healthy riparian system or healthy forest the trees will eventually regrow and any openings in the forest canopy will fill again. In fact, many ecosystems depend on some degree of disturbance. For example, sprouting young cottonwoods in riparian areas often depend on a flood event. • Some disturbances in ecosystems are more important than others. For example, the accidental introduction of a tiny mussel into the Great Lakes has led to extremely clear waters from these efficient filter feeders, but also to chang-es in food availability for other organisms, and economic impacts when huge mats of these mussels attach to intake pipes, docks and boats.
FurtherDiscussion:

118USU Water Quality Extension - Stream Side Science
That’s Predictable
That’s Predictable
2. What could be done to protect aquatic ecosystems from these changes?
Protecting through laws and regulations: Some potential problems are so severe that we regulate them with laws. A few examples are: • “Point source” water pollution: EPA and Utah’s Division of Water Quality regulate how much and what kind of pollut-ants can be dumped into our lakes and rivers from factories, municipal treatment plants, and large animal feeding operations. All point sources must have a “discharge permit” in Utah.• Modification of a stream channel: No one in Utah can modify a stream channel (e.g., take gravel from the channel or chan-nelize the stream banks) without a permit from the state Divi-sion of Water Rights.Protecting through voluntary approaches: In many cases, rath-er than regulating behavior with laws, we depend on people making the right decisions on how to best manage their own lands and activities. These are often called “Best Management Practices.” Because these practices are voluntary, it becomes especially important that citizens are well educated on how their activities affect the environment and why.
For aquatic systems, some Best Management Practices include:• Healthy riparian areas and buffer strips along streams and canals that shade the water, protect the banks from erosion, and filter runoff of pollutants. • Grassy swales or retention basins that slow the flow of urban runoff and promote infiltration rather than surface runoff.• Lawn care practices that avoid over fertilizing lawns and gardens and watering lawns only when needed.• Cleaning up pet waste so it is not washed into streams.
138

139USU Water Quality Extension - Stream Side Science That’s Predictable
Notes

Student Page
Name: _______________________________Date: ________________________________
Topic selected: ___________________________________________________________
Hypothesis of how the ecosystem will change: ______________________________________________________________________________________________________________________________________________________________________________________________________________________________________________________________________________________________________________________________________________________________________________
Resources for more information: __________________________________________________________________________________________________________________________________________________________________________________________________________________________________________________________________________________________
According to your research, what would be the expected changes? Did this fit your hypothesis? _____________________________________________________________________________________________________________________________________________________________________________________________________________________________________________________________________________________________________________________________________________________________________
Did this project leave you with additional questions? _____________________________________________________________________________________________________________________________________________________________________________________________________________________________________________________________________________________________________________________________________________________________________________________________________________________________
USU Water Quality Extension - Stream Side ScienceThat’s Predictable
140
Wor
kshe
et

USU Water Quality Extension - Stream Side Science
141
Changes from Abiotic and Biotic Factors
That’s Predictable
Res
ourc
e
The following resource pages provide tables outlining an abiotic or biotic change, how the ecosystems may respond and possible websites or organizations to look to for more information.
NOTE: Many of the impacts listed on the following pages appear to have mostly detrimental effects on the natural biota or ecosystem. Keep in mind, however, that humans often derive positive benefits from these same activities. For example, irrigation diversions allow agriculture to flourish in much of the west, and also may result in new riparian habitat forming along irrigation canals. The challenge to society is to find ways to minimize the impacts while retaining the benefits.
OTHER SUGGESTED RESOURCES:LibraryNewspaper and magazine articlesScientific journalsTalk to a specialist in the area (e.g., Natural Resource
Conservation Service, Utah State Geological Survey, Department of Environmental Quality, USU Extension)
University researchers or professionals (such as consultants) working in these areas
Watershed coordinators (lists available from Utah Division of Water Quality)

USU Water Quality Extension - Stream Side Science
142
Abiotic Changes
That’s Predictable
Res
ourc
e
WE
BSI
TE
S FO
R M
OR
E
INFO
RM
ATIO
N
http
://lib
rary
.wrd
s.uw
yo.e
du/w
rp
Food
and
Agr
icul
ture
Org
aniz
atio
n of
the
Uni
ted
Nat
ions
http
://w
ww.
fao.
org
(sea
rch
for p
ollu
tant
s, ru
noff,
ferti
lizer
)
Dul
uth
Stre
ams
http
://w
ww.
dulu
thst
ream
s.org
/und
erst
and-
ing/
impa
ct.h
tml
Envi
ronm
enta
l Pro
tect
ion
Age
ncy
http
://w
ww.
epa.
gov(
sear
ch fo
r dam
s, irr
igat
ion,
floo
d co
ntro
l)
EC
OSY
STE
M R
ESP
ON
SE
-Los
s of h
abita
t in
the
stre
am.
-Inc
reas
ed v
eloc
ity.
-Cha
nges
in n
atur
al st
ream
sinu
osity
.-R
educ
ed fi
sh a
nd m
acro
inve
rtebr
ate
dive
rsity
from
loss
of
spaw
ning
hab
itat,
loss
of m
acro
inve
rtebr
ate
habi
tats
, or l
oss
of fl
ood
fed
side
cha
nnel
s whi
ch a
re im
porta
nt fo
r nat
ive
fish
repr
oduc
tion.
-Los
s of r
ipar
ian
plan
ts, a
nd a
ssoc
iate
d w
ildlif
e.
-Los
s of “
bene
ficia
l use
s” (s
uch
as re
crea
tion,
irrig
atio
n, o
r aq
uatic
hab
itat)
of o
ur n
atur
al w
ater
s due
to in
crea
sed
pollu
tion.
May
als
o ch
ange
col
or a
nd sm
ell o
f wat
er.
-Los
s of p
ollu
tion
sens
itive
spec
ies,
repl
aced
by
pollu
tion
tole
rant
spec
ies.
-Ofte
n fe
wer
spec
ies (
less
div
ersi
ty).
-Hea
lth is
sues
for h
uman
s usi
ng w
ater
for r
ecre
atio
n or
dr
inki
ng.
-Cha
nge
in fl
ow p
atte
rns t
hrou
ghou
t a y
ear,
with
few
er
flood
s.-C
hang
e in
tem
pera
ture
(sur
face
of r
eser
voirs
bec
ome
war
mer
s, de
eper
wat
ers r
emai
n co
oler
).-C
hang
e in
sedi
men
t loa
d (r
eser
voirs
are
sedi
men
t tra
ps).
-Im
pact
s on
war
m w
ater
fish
if d
owns
tream
tem
pera
ture
de
crea
ses,
loss
of n
ativ
e fis
h th
at d
epen
d on
bac
k ch
anne
l flo
odin
g.-C
lear
er w
ater
dow
nstre
am o
f dam
s may
supp
ort s
alm
onid
s an
d ot
her s
port
fishe
s not
foun
d el
sew
here
in th
e riv
er.
AB
IOT
IC C
HA
NG
ES
Stre
am c
hann
eliz
atio
n:
caus
ed w
hen
stre
am
bank
s are
“ha
rden
ed”
with
rip
rap
or
“pro
tect
ed”
by b
erm
s.
Pollu
tant
s ent
erin
g th
e sy
stem
. Man
y ac
tiviti
es,
incl
udin
g in
dust
rial
di
scha
rges
, agr
icul
tura
l ru
noff
, im
prop
er c
lean
up
of p
et w
aste
and
ov
er-f
ertil
izat
ion
of
law
ns.
Con
stru
ctio
n of
dam
s for
ir
riga
tion,
floo
d co
ntro
l, re
crea
tion.

Abiotic Changes, Continued
143
Res
ourc
e
USU Water Quality Extension - Stream Side Science That’s Predictable
WE
BSI
TE
S FO
R M
OR
E
INFO
RM
ATIO
N
Rar
itan
Bas
in W
ater
shed
Man
agem
ent P
roje
ctht
tp://
ww
w.ra
ritan
basi
n.or
g (s
earc
h fo
r im
per-
viou
s sur
face
are
a)
Uta
h St
ate
Uni
vers
ity W
ater
Qua
lity
Exte
nsio
n ht
tp://
exte
nsio
n.us
u.ed
u/w
ater
qual
ity (s
earc
h fo
r im
perv
ious
surf
ace
area
)
Envi
ronm
enta
l Pro
tect
ion
Age
ncy
(clim
ate
chan
ge)
http
://w
ww.
epa.
gov/
clim
atec
hang
e/
Envi
ronm
enta
l Pro
tect
ion
Age
ncy
(sur
face
co
al m
inin
g ac
tiviti
es u
nder
cle
an w
ater
act
)ht
tp://
wat
er.e
pa.g
ov/la
wsr
egs/
guid
ance
/wet
la
nds/
min
ing.
cfm
EC
OSY
STE
M R
ESP
ON
SE
-Mor
e po
llutio
n fr
om u
rban
runo
ff.-L
ess g
roun
dwat
er re
char
ge.
-Hig
her fl
ows a
nd m
ore
flood
s dur
ing
rain
eve
nts.
-Los
s of p
ollu
tion
sens
itive
spec
ies,
repl
aced
by
pollu
tion
tole
rant
spec
ies.
-Cha
nge
in fl
ows.
-Los
s of n
ativ
e fis
h if
spaw
ning
are
as si
lted
in.
-Pos
sibl
e ba
nk e
rosi
on.
-Cha
nge
in se
dim
ent l
oad.
-Cha
nge
in te
mpe
ratu
re.
-Los
s of h
abita
t, im
pact
s to
cold
wat
er fi
sh a
s tem
-pe
ratu
re in
crea
ses,
impa
cts t
o w
ildlif
e fo
rage
and
co
ver.
-Pol
lutio
n in
crea
se d
eter
min
ed b
y m
inin
g op
era-
tions
.-I
ncre
ased
sedi
men
t run
off m
ay o
ccur
from
surf
ace
dist
urba
nce;
wat
er d
rain
ing
from
min
es m
ay b
e ex
trem
ely
acid
ic a
nd c
arry
hea
vy m
etal
s; w
ater
di
scha
rged
from
coa
l bed
met
hane
wel
ls c
an b
e ve
ry sa
lty.
-Los
s of n
ativ
e fis
h if
spaw
ning
are
as si
lted
in.
-Sen
sitiv
e sp
ecie
s rep
lace
d by
mor
e to
lera
nt sp
e-ci
es.
AB
IOT
IC C
HA
NG
ES
Dev
elop
men
t (in
crea
se
an im
perv
ious
surf
ace
area
)
Clim
ate
Cha
nges
: C
hang
es in
run
off
(rai
n ev
ent,
snow
mel
t).
Cha
nges
in m
axim
um
stre
am fl
ow (b
ig sn
ow
year
). D
roug
ht.
Min
ing
oil,
gas,
and
coal
: Cha
nges
in
grou
ndw
ater
mov
e-m
ent a
nd e
xpos
ure
of
grou
ndw
ater
to p
ol-
luta
nts,
dist
urba
nce
of
surf
ace,
rel
ease
of s
alty
or
pol
lute
d w
ater
to
surf
ace.

USU Water Quality Extension - Stream Side Science
144That’s Predictable
Res
ourc
e Biotic Changes
WE
BSI
TE
FO
R M
OR
E
INFO
RM
ATIO
N
Envi
ronm
enta
l Pro
tect
ion
Age
ncy
http
://w
ww.
epa.
gov
(sea
rch
for
inva
sive
spec
ies)
Uta
h D
epar
tmen
t of A
gric
ultu
re a
nd
Food
sht
tp://
ag.u
tah.
gov
(sea
rch
for
nuis
ance
spec
ies)
USD
A/F
ores
t Ser
vice
http
://w
ww.
srs.f
s.usd
a.go
v (s
earc
h fo
r log
ging
)
Kan
sas S
tate
Uni
vers
ityht
tp://
ww
w.ks
re.k
su.e
du/ (
sear
ch fo
r gr
azin
g)
EC
OSY
STE
M R
ESP
ON
SE
-Dep
ends
on
spec
ies.
-Com
petit
ion
for f
ood
and
habi
tat i
mpa
ctin
g na
tive
fish.
-Unc
ontro
lled
grow
th o
f int
rodu
ced
spec
ies a
nd o
ther
or
gani
sms.
-Los
s of w
ildlif
e an
d bi
rd h
abita
t.-I
ncre
ase
in w
ater
tem
pera
ture
(red
uced
shad
ing)
.-I
ncre
ase
in se
dim
ent l
oad
and
pollu
tant
runo
ff.-I
mpa
cts o
n co
ldw
ater
fish
as t
empe
ratu
res i
ncre
ase,
lo
ss o
f nat
ive
fish
if sp
awni
ng a
reas
are
silte
d in
.
BIO
TIC
CH
AN
GE
S
Intr
oduc
ed sp
ecie
s to
a st
ream
or
ripa
rian
are
a.
Los
s of r
ipar
ian
area
: du
e to
land
use
such
as
logg
ing,
urb
an
land
scap
ing,
or
graz
ing.

USU Water Quality Extension - Stream Side Science
145
Notes
That’s Predictable

USU Water Quality Extension - Stream Side ScienceThat’s Predictable146

Purpose:
Summary:
Background:
USU Water Quality Extension - Stream Side Science Water Management
Duration: Variable
Setting: Classroom
147
To analyze how communities deal with water shortages, distribution, and quality in designing a long-term water use plan.
In this exercise, students will be assigned roles as community members, develop questions and positions, and participate in a mock “community meeting” to discuss the development of a water use plan that addresses water shortages, distribution, and water quality.
Utah is the second driest state in the nation, yet has the second highest per capita water use in the nation. These seemingly contradictory facts are a result of our extensive system of storage and distribution of irrigation water – snowmelt that is trapped and used throughout the growing season. Utah also has a very high growth rate, primarily in urban areas. As our population increases, many water related issues will need to be addressed: How will water that has been used traditionally for agriculture be used in the future? How will the water needs of urban populations be met? Is there a need to build more water reservoirs and is the public willing to pay that cost? How does water conservation fit into this picture? You may want to check with your local Extension or city offices to obtain more detailed information for your area.
For more information on water use, planning and water law in Utah, see:
• Western Water Law - http://www.westernwaterlaw.com/utah.html • Utah Division of Water Resources - http://www.water.utah.gov/ • Utah Division of Water Rights - http://nrwrt1.nr.state.ut.us/ • Utah Division of Drinking Water - http://www.drinkingwater.utah.gov/
Water Management

USU Water Quality Extension - Stream Side Science
Water Management
Water Management
• Utah Division of Water Quality - http://www.waterquality.utah.gov/• EPA Watershed Management - http://water.epa.gov/type/watersheds/index.cfm • The Utah Stream Team Manual’s Water Pollution and Water Regulations Sections - Unit IV
Access to the internet and background resources listed above.
1. Ask the students to provide examples of different water uses occurring in their community. Make a list of these uses on the board. For a complete breakdown of public water use (residential, industrial, institutional, and commercial), and a breakdown of water use in the home, see the Resource pages provided.
2. Ask the students to tell you what kind of decisions need to be made about water use and distribution and about protecting water quality. Ask them how these decisions are made. Refer to the timeline of Utah’s role in water management and planning since statehood in the Resource pages.
3. Discuss with the students the importance of public input when developing water use plans. 4. Tell the students that they will be assigned different roles and participate in a mock community meeting to give their input on a water use plan focusing on water shortages, distribution and water quality. Divide the students into groups and assign them roles found on the Resource pages.
Materials:
ClassroomActivity:
148

USU Water Quality Extension - Stream Side Science149
Water Management
Water Management
5. Tell the students that during the mock town meeting, they will need to discuss their role in the community as it relates to water shortages, distribu-tion and water quality. How will a change in one of these issues affect them? What are the issues they would like to see covered in a water plan?
6. To help this activity run smoothly, assign a student to be the meeting facilitator. Before the meeting, they should develop a list of questions and concerns to be addressed by the group. Alternatively, this role can be played by the teacher. The students will also need to create rules and guidelines for the format of the meeting as a class.
7. If you are limited in time, you may need to let the students come up with their positions and needs quickly in class, and have the meeting on the same day. To give the debate a little more context, have the students research their positions further as an assignment and hold the community meeting another day.
NOTE: You may want to share the following resources with your students as they are formulating their concerns and needs. These are included in the Resource pages.
• The guidelines the Utah State Water Plan uses when developing documents• Present and Projected Total Municipal and Industrial Water Use by Basin• Water Prices of Various Western Cities• Typical Water Use Within the Home• Population Trend and Projection• Per Capita Use of Public Water Supplies in the United States
ACTIVITY EXTENSIONS: • Interview a local politician or community decision maker about the water use plan.(Utah agencies involved in water decisions include the Divisions of Water Resources, Water Rights, Wildlife Resources, Drinking Water and Water Quality. Other entities include county and city governments and planning offices, irrigation companies and water conservancy districts).
• After the meeting, have the students write a brief summary of the arguments presented.• Ask the students how they would decide to allocate limited water.
Applying the Data:
USU Water Quality Extension - Stream Side Science
Water Management
Water Management
1. Define western water law and discuss the role it has played in determining how water can be allocated in Utah.
In states governed by western water law, water may not be removed from a source unless the user has a “water right” to that water. Water rights are owned and sold separately from the land itself. “First in time, first in right” (the doctrine of prior appropriation) is a central theme of western water law. Water is allocated based on seniority of the water right. In times of drought, when water is scarce, the oldest or most senior rights will receive their allocations before less senior water right owners.
Water rights are tightly regulated, providing for the diversion of specific amounts of water, from a specific point, for a specific use, over a specific amount of time. Under current western law, water rights can be issued to anyone who is putting the water to a “beneficial use.”
Water must be used or the right to it may be lost. Recent changes in Utah law allow water owners to transfer their rights to the Utah Division of Parks or Wildlife Resources. This water can then remain in the stream to provide the beneficial use of aquatic habitat.
2. Discuss culinary water sources vs. irrigation water (secondary water) sources. How do these differ? What water quality considerations are there for both types of water?
There is no single definition of clean water used in water quality. Instead, the Department of Water Quality has determined the designated beneficial uses for each water body in the state and has determined the quality of water necessary to maintain those uses (see table on the next page). The level of protection varies according to the designated use. For example, drinking water sources must be free of many contaminants, while salts are the main contaminant of concern for irrigation water.
FurtherDiscussion:
150

USU Water Quality Extension - Stream Side Science151
Water Management
All waters of the state that do not meet their “designated uses” require a watershed protection plan. Water used for culinary purposes (e.g. Big Cottonwood Canyon) requires a separate source water protection plan. For example, dogs are not allowed up Big Cottonwood Canyon in Salt Lake City because the water coming from this area is used for drinking water. This is an example of regulation that is enforced for drinking water sources, but would not be an issue for agricultural water sources.
Beneficial uses of water (partial list)Class 1 – Drinking water designations 1C – Domestic purposes with prior treatment (drinking water)Class 2 – Protected for recreation and aesthetics 2A – Primary contact for recreation (swimming) 2B – Secondary contact for recreationClass 3 – Protected for aquatic wildlife 3A – Coldwater species of game fish and other aquatic life 3B – Warmwater species of game fish and other aquatic life 3C – Nongame fish and other aquatic life 3D – Waterfowl, shore birds and other water oriented wildlifeClass 4 – Protected for agriculture uses (irrigation and stock watering)Class 5 – Protected for the Great Salt Lake only (primary and secondary contact recreation, aquatic wildlife and mineral extraction)
3. Discuss conservation versus new water development. Discuss the table on the Resource page of costs/1000 gallons in different cities. Do you think that the price of water is a “tool” for encouraging conservation practices? What other ap-proaches might work?
• Rewards for conservation (e.g., lower prices for users who consume under a certain level of gallons per month).• Penalties for exceeding a certain level of water use per month.• More education on the need for water conservation.• Different prices for water used for different purposes (e.g., irrigation water is subsidized).
Water Management
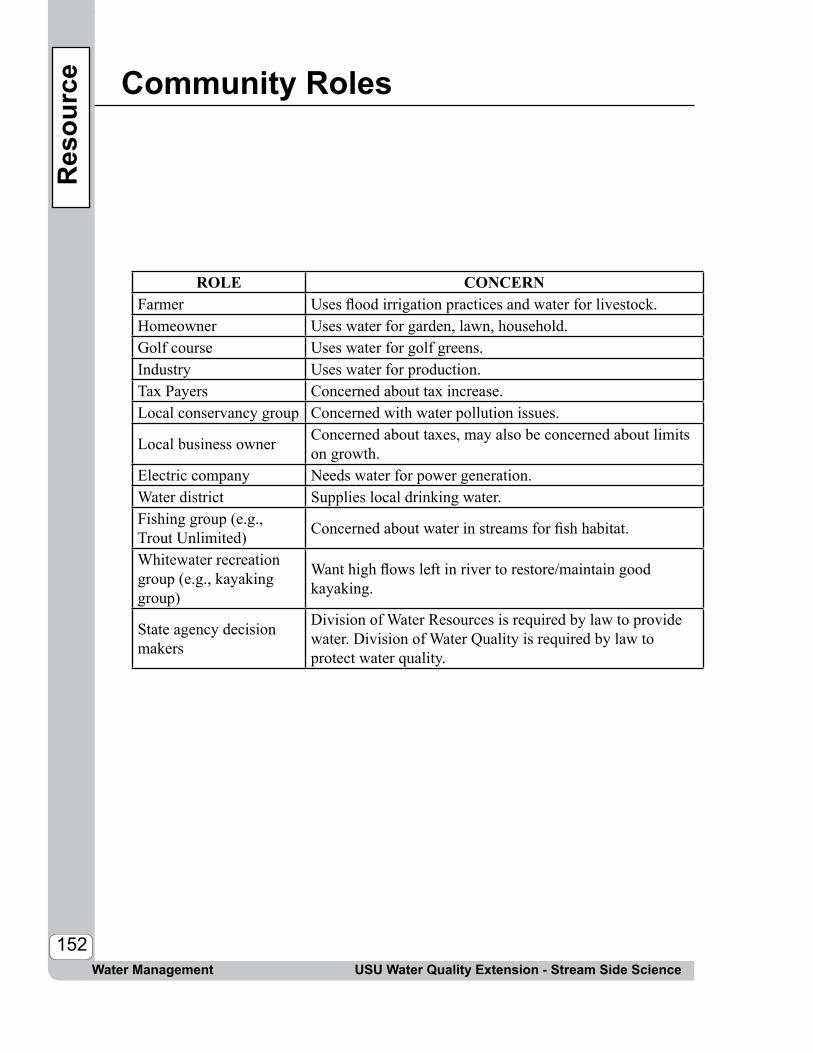
USU Water Quality Extension - Stream Side Science
152
Community Roles
Water Management
Res
ourc
e
ROLE CONCERNFarmer Uses flood irrigation practices and water for livestock.Homeowner Uses water for garden, lawn, household.Golf course Uses water for golf greens.Industry Uses water for production.Tax Payers Concerned about tax increase.Local conservancy group Concerned with water pollution issues.
Local business owner Concerned about taxes, may also be concerned about limits on growth.
Electric company Needs water for power generation.Water district Supplies local drinking water.Fishing group (e.g., Trout Unlimited) Concerned about water in streams for fish habitat.
Whitewater recreation group (e.g., kayaking group)
Want high flows left in river to restore/maintain good kayaking.
State agency decision makers
Division of Water Resources is required by law to provide water. Division of Water Quality is required by law to protect water quality.

USU Water Quality Extension - Stream Side Science
153
History of Water Management in Utah
Water Management
The following list chronicles the gradual evolution of Utah’s role in water resources planning and management since statehood.
• 1897 The office of the State Engineer (later renamed the Division of Water Rights) was established to oversee water appropriations.
• 1903 The Water Code became part of Utah law and The Doctrines of Prior Appropriation and Beneficial Use were officially adopted.
• 1921 The Utah Water Storage Commission was created to oversee important water developments and obtain the necessary water rights.
• 1935 Groundwater was added to the state’s water code.
• 1947 The Utah Water and Power Board was created to continue the mission of the Utah Water Storage Commission, which was discontinued in 1941.
• 1953 Specific legislation was passed directing the Water and Power Board to develop a state water plan.
• 1963 The Bureau of Water Pollution Control was created.
• 1967 The Water and Power Board was renamed the Board of Water Resources, and the Division of Water Resources was created.
• 1979 The Bureau of Drinking Water and Sanitation was created.
• 1991 The Department of Environmental Quality was created. As part of this department, the Division of Drinking Water and the Division of Water Quality were formed, replacing the Bureau of Drinking Water and Sanitation and the Bureau of Water Pollution and Control.
Res
ourc
e
Source: Utah State Water Plan: Planning for the Future http://www.water.utah.gov/waterplan/

USU Water Quality Extension - Stream Side Science
Guidelines for State Water Plans
Water Management
Utah State Water Plans use the following guidelines when developing documents.
1. All waters, whether surface or subsurface, are held in trust by the state as public property and their use is subject to rights administered by the State Engineer.
2. Water rights owners are entitled to transfer their rights under free market conditions. Any change in place or nature of use is subject to approval by the State Engineer.
3. The state of Utah’s role is to set policy, provide assistance and protect statewide water resource interests.
4. The responsibility for making many local decisions regarding water resources resides with local leaders.
5. Educating the public on water resources issues and seeking their input in the decision-making process is vital to effective planning, management and development.
6. Long-term water planning will help ensure sufficient water supplies needed for Utah’s growing population.
7. Local, state and federal water resources planning and management activities should be coordinated to effect cooperation and minimize duplication.
8. The maintenance of water quality within the state’s water quality standards will help sustain all present and future uses of Utah’s water resources.
9. Water conservation and efficient management of existing water supplies are needed to help satisfy future water demands in the most economical and timely fashion.
10. Water development, based on sound engineering, and economic and environmental principles, will help meet future water needs.
11. Recreation, aesthetic and environmental uses of water should be included in water planning, management and development activities.
Res
ourc
e
Source: Utah State Water Plan: Planning for the Future http://www.water.utah.gov/waterplan/
154

USU Water Quality Extension - Stream Side Science
Water Usage and Cost
Water Management
Res
ourc
e
Source: Utah State Water Plan: Planning for the Future http://www.water.utah.gov/waterplan/
Present and Projected Total Municipal & Industrial Water Use by BasinBasin (acre-feet / yr)
Present 2020 2050Jordan River 332,000 449,000 650,000Weber River 170,00 267,000 358,000Utah Lake 134,000 207,000 338,000Bear River 50,000 71,000 103,000West Colorado River 51,000 55,000 62,000Sevier River 48,000 55,000 64,000Kanab Creek/ Virgin River
42,000 86,000 183,000
West Desert 24,000 35,000 53,000Uintah 24,000 27,000 31,000Cedar/Beaver 20,000 33,000 51,000Southeast Colorado River 9,000 10,000 12,000TOTAL 904,000 1,320,000 1,950,000
Water Prices of Various Western CitiesCity Estimated Cost per 1,000 gallons
Reno $3.39Seattle $2.30Los Angeles $2.22Park City, UT $2.20Tucson $1.81Boise $1.68Las Vegas $1.65Phoenix $1.61Albuquerque $1.41Denver $1.14Sandy, UT $.99Salt Lake City $.87Provo, UT $.75Sacramento $.75
AVERAGE $1.63Utah Average $1.15
National Average $1.96
155

USU Water Quality Extension - Stream Side Science
Typical Water Use Within the Home
Water Management
Res
ourc
e
The typical U.S. residence consumes about 69 gallons per person per day inside the home. This is approximately equivalent to one completely full bathtub. Utah is the second driest state in the nation, but typical Utah residents consume 293 gallons per person per day, 214 more gallons per person than the U.S. average. As indicated by the accompanying chart, approximately 27 percent of all the water used indoors goes down the toilet. The clothes washer uses another 22 percent for a total of nearly 50 percent of indoor water use from just two household appliances. Showers and baths consume about 18 percent and faucets another 16 percent. Leaks account for a significant 14 percent.
Surprisingly, only 3 percent of water used indoors is used by the dishwasher or other domestic purposes such as cooking and cleaning. Despite this fact, 100 percent of water supplied inside the home must meet stringent drinking water standards. The American Water Works Association (AWWA) estimates that a comprehensive program to install water efficient plumbing fixtures within the home and fix leaks could reduce total indoor water consumption by as much as 30 percent.
156
Residential Water Use
Source: Mayer, Peter W. et al., Residential End Uses of Water [AWWA Research Foundation, 1999], xxvi

USU Water Quality Extension - Stream Side Science
Water Use Facts
Water Management
Res
ourc
e
Breakdown of Public Supply Water Use
Source: Division of Water Resources. Municipal and Industrial Water Supply and Uses. 2000
Residential66%
Institutional17%
Commercial 12%
Industrial5%
LegendWater use in (gpcd)U.S. Average = 179
130-149150-174175-199200-224225-268269-325
Per Capita Water Use of Public Water Supplies in the United States
Source: USGS, Estimated Use of Water in the United States in 1995.157

USU Water Quality Extension - Stream Side ScienceWater Management158

Biodiversity Debate
Purpose:
Summary:
Background:
USU Water Quality Extension - Stream Side Science Biodiversity Debate
Duration: Classroom 50 minutes
Setting: Classroom
159
To evaluate the biological, aesthetic, ethical, social and economic arguments with regard to maintaining biodiversity.
In this exercise, students will hold a debate about the construction of a dam in terms of the biological, aesthetic, ethical, social and economic arguments with regard to maintaining biodiversity. Students will be assigned different roles to argue either for or against the dam.
When people build a dam on a river it changes the ecosystem in many ways. Dams may impact, both positively and negatively, the biodiversity of terrestrial plant communities, fish and other aquatic life, mammals and birds. See the Further Discussion questions following the activity for more information about these impacts.
Note that there are many other arguments for and against a new reservoir that do not relate specifically to biodiversity. These include economic opportunity (irrigation or drinking water) versus economic losses (flooded communities or cost of construction), recreational opportunities (boating and fishing), and opportunities for developers (water front housing), aesthetic considerations and more.
Other Stream Side Science activities such as, That’s Predictable and Missing Macroinvertebrates, may be helpful for the students to review how ecosystems change due to various factors.
More information about dams can be found on the internet sites listed on the Resource pages.

USU Water Quality Extension - Stream Side Science
Biodiversity Debate
Biodiversity Debate
ClassroomActivity:
• Access to the internet• The Utah Stream Team Manual • Other reference sources (see a list on the Resource page)• Results from the following activities (optional):
What’s in the Water?Riparian ReviewWho Lives in the Water? Missing MacroinvertebratesThat’s Predictable
1. Ask the students to define the term biodiversity, (biological diversity in an environment is indicated by numbers of different species of plants and animals). Ask the students to give a biological, aesthetic, ethical, social and economic reason to maintain biodiversity.
2. Discuss with the students how biodiversity may change due to a change in the ecosystem. Ask the students if a change in biodiversity is always negative. Specifically, discuss with the students the different impacts of a dam on the biodiversity of the river system and surrounding plant community.
3. Divide the students into eight groups. Tell the groups they will be assigned different roles as community members in a community that is proposing the construction of a dam on the river in their area. See the Resource page for community roles and helpful worksheets. 4. Tell the students that they will be holding a debate on whether the dam should be constructed or not. The students will need to discuss their role in the community and, based on their assigned role, debate on whether or not they support the construction. Remind the students to keep in mind the idea of maintaining biodiversity when preparing their debate (e.g., is biodiversity something they value or not?).
Materials:
160
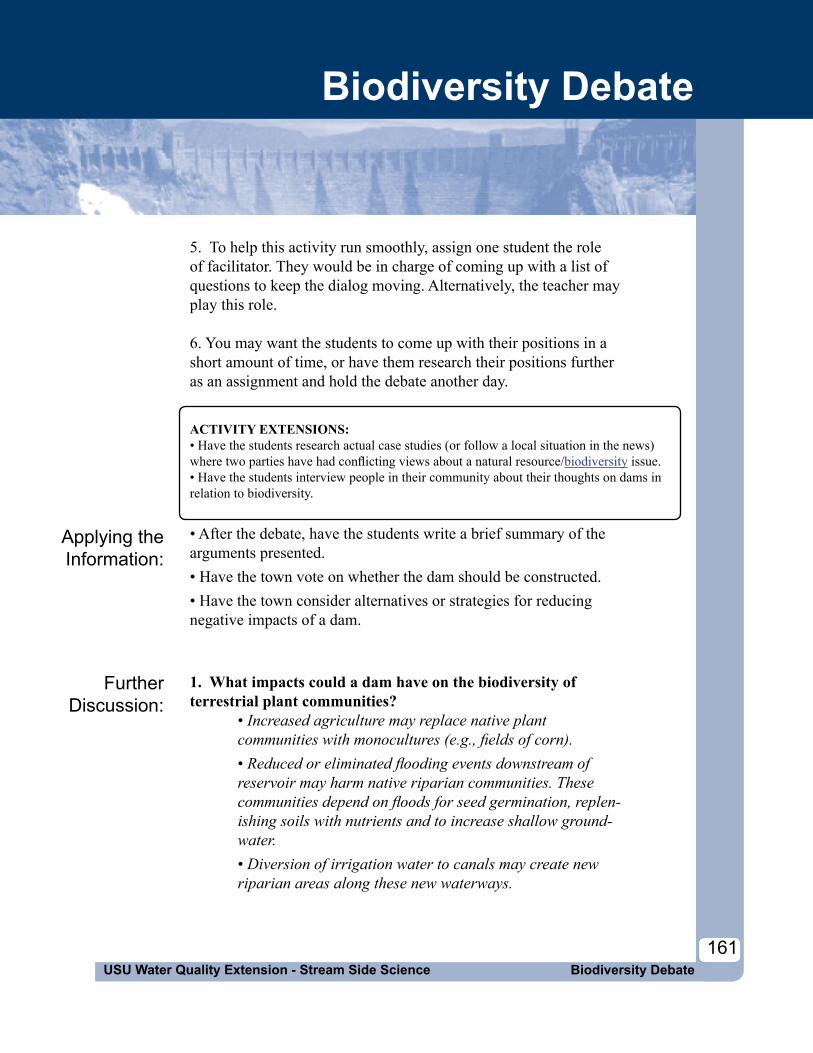
USU Water Quality Extension - Stream Side Science161
Biodiversity Debate
Biodiversity Debate
FurtherDiscussion:
Applying the Information:
5. To help this activity run smoothly, assign one student the role of facilitator. They would be in charge of coming up with a list of questions to keep the dialog moving. Alternatively, the teacher may play this role.
6. You may want the students to come up with their positions in a short amount of time, or have them research their positions furtheras an assignment and hold the debate another day.
ACTIVITY EXTENSIONS: • Have the students research actual case studies (or follow a local situation in the news) where two parties have had conflicting views about a natural resource/biodiversity issue.• Have the students interview people in their community about their thoughts on dams in relation to biodiversity.
• After the debate, have the students write a brief summary of the arguments presented. • Have the town vote on whether the dam should be constructed.• Have the town consider alternatives or strategies for reducing negative impacts of a dam.
1. What impacts could a dam have on the biodiversity of terrestrial plant communities?
• Increased agriculture may replace native plant communities with monocultures (e.g., fields of corn).• Reduced or eliminated flooding events downstream of reservoir may harm native riparian communities. These communities depend on floods for seed germination, replen-ishing soils with nutrients and to increase shallow ground-water.• Diversion of irrigation water to canals may create new riparian areas along these new waterways.

USU Water Quality Extension - Stream Side Science
Biodiversity Debate
Biodiversity Debate
2. What impacts could a dam have on the biodiversity of fish populations?• The reservoir provides new habitat for fish and invertebrates and often results in a new sport fishery.• Large reservoirs in big rivers such as the Columbia and Snake disrupt migration patterns of salmon. Salmon have evolved to migrate during the high flows of spring runoff from the high mountain areas to the ocean. When a dam is introduced into the system, the salmon start down the stream and are stopped by a reservoir. The reservoir slows the fish, and delays their arrival at the ocean. As salmon travel to the ocean, their bodies change to allow them to live in a salt water environment. When the migration is slowed, these changes occur before they reach the ocean, which can be fatal to the fish.• Changes in downstream fish communities will depend on the temperature of the water released from the reservoir.• If cold, deep water is released from the reservoir, downstream temperatures may be too cool for native warmwater fish, because the cool temperatures slow the development of eggs and young.• BUT, cold water releases from reservoir may create a trout fishery below the dam where none existed before.
3. How might a dam affect the physical structure of a river system? Reservoirs are natural sediment traps, so downstream of the dam, the water may be much clearer. This may cause loss of beaches and gravel bars, but may allow aquatic plants and trout fisheries to thrive. When a dam causes a stretch of river to dry up completely, all invertebrates and fish are lost from that area. Canals do not typically have water year round, so they do not create similar habitat.
4. What impacts could a new dam have on diversity of birds and mammals?
• Reservoirs would provide new habitat for ducks and other waterfowl. • New wetland areas near their inflows may also be created, providing new habitat for mammals and shorebirds. • A new reservoir would flood existing habitat.
162

USU Water Quality Extension - Stream Side Science
163Biodiversity Debate
Wor
kshe
etCommunity Role
Name: _______________________________Date: ________________________________
Community Role: _________________________________________________________
Benefits of the River Benefits of the Dam/Reservoir
Do the benefits of the river outweigh the benefits of the dam? ______________________
How does your position relate to biodiversity? Is it important to you? Why or why not?
________________________________________________________________________________________________________________________________________________________________________________________________________________________________________________________________________________________________________________________________________________________________________________________________________________________________________________
____________________________________________________________________________________________________________________________________________________________________________________________________________________________
____________________________________________________________________________________________________________________________________________________________________________________________________________________________

USU Water Quality Extension - Stream Side ScienceBiodiversity Debate
Res
ourc
e Student Roles
Websites for further information:
Tennessee Valley Authority - www.tvakids.com/environment/cleanwater_dams.htm
The Nature Conservancy - http://www.nature.org/ourinitiatives/habitats/riverslakes/index.htm
Bureau of Reclamation - http://www.usbr.gov/projects/
EPA - http://water.epa.gov/type/watersheds/index.cfm
For Dam Construction Against Dam Construction
Farmer Wants sustained flows for irrigation. Tax payers Don’t want to pay for it.
Local business owner
Increase in tourism will help business. River guides/rafters
Companies will lose business. Rafters and kayakers want the river.
Electric company
Will sell electricity produced by dam.
Conservationist groups- concerned with native species
Change in ecosystem up and down stream. Loss of native species.
Recreationists-houseboats, and lake fishing
Excited about having a reservoir in the local area.
River front property owner
Will lose prime area for summer home. Doesn’t want to lose the view of the river.
Water districtWould use water to supply drinking water for urbanizing areas.
Local Hiking ClubDon’t want to lose the trail access along the river.
164

Appendices
Appendix A Curriculum Connections
Appendix B Sampling Safety
Appendix C A Note on Units
Appendix D Glossary
166
170
171
172
Contents
USU Water Quality Extension - Stream Side Science Appendices
165Appendices

Appendix ACurriculum Connections for 6th Grade Science
USU Water Quality Extension - Stream Side ScienceAppendix A166
Inte
nded
Lea
rnin
g O
utco
mes
6c X X X X X X
6b X X X X X
6a X
5b X X
5a X X X X X X
4e X
4d X X X
4c X X
4b X X X X X X
4a X X X X X X X
3c X
3b
3a
2f X X
2e X X X X X
2d X X X
2c X X X X X X
2b
2a X X X X X X X X X
1i X X X X X X X
1h X X X
1g X X X X X X X
1f
1e X X X X X
1d X X X X X X X X X X X
1c X X X
1b X X X X X
1a X X X X X X X X
Act
ivity
Whe
re’s
the
Wat
er?
Wha
t’s in
the
Wat
er?
Who
live
s in
the
Wat
er?
Mis
sing
Mac
roin
verte
brat
es
Wet
land
VS
Stre
am M
acro
s
Rip
aria
n R
evie
w
Nitr
ogen
Cyc
le
Whe
n Th
ings
Hea
t Up
Aqu
atic
Inva
sion
!
That
’s P
redi
ctab
le
Wat
er M
anag
emen
t
Bio
dive
rsity
Deb
ate
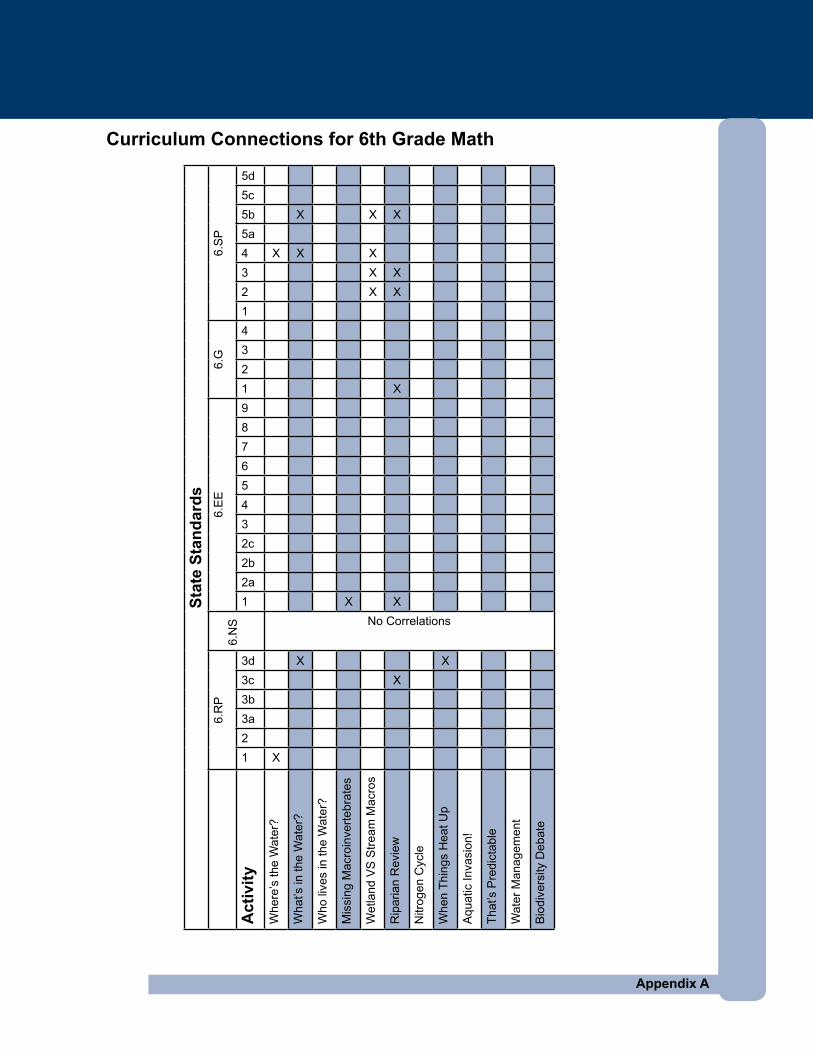
Appendix A
Stat
e St
anda
rds
6.S
P
5d5c5b X X X5a4 X X X3 X X2 X X1
6.G
4321 X
6.E
E
98765432c2b2a1 X X
6.N
S No Correlations
6.R
P
3d X X3c X3b3a21 X
Act
ivity
Whe
re’s
the
Wat
er?
Wha
t’s in
the
Wat
er?
Who
live
s in
the
Wat
er?
Mis
sing
Mac
roin
verte
brat
es
Wet
land
VS
Stre
am M
acro
s
Rip
aria
n R
evie
w
Nitr
ogen
Cyc
le
Whe
n Th
ings
Hea
t Up
Aqu
atic
Inva
sion
!
That
’s P
redi
ctab
le
Wat
er M
anag
emen
t
Bio
dive
rsity
Deb
ate
Curriculum Connections for 6th Grade Math

Stream Side Science Lessonsw
hat a
re th
ese?
?
Whe
re's
the
Wat
er?
Wha
t's in
the
Wat
er?
Who
live
s in
the
Wat
er?
Mis
sing
Mac
roin
verte
brat
es
Wet
land
VS
Stre
am M
acro
s
Rip
aria
n R
evie
w
Nitr
ogen
Cyc
le
Whe
n Th
ings
Hea
t Up
Aqu
atic
Inva
sion
!
That
's Pr
edic
tabl
e
Wat
er M
anag
emen
t
Bio
dive
rsity
Deb
ate
6(10)6(9b) X X X X6(8) X somewhere6(7) X X X X
6(3-6)6(2) X6(1)
7(10)7(9b) X X X X7(8) X7(7) X X X X
7(3-6)7(2) X7(1)
8(10)8(9b) X X X X8(8) X8(7) X X X X
8(3-6)8(2) X8(1)
9-10(10)9-10(9b) X
9-10(1-9a)
No Correlation
Writing Standards 6-12
No Correlation
Gra
de 6
G
rade
7G
rade
8G
rade
9-
10
Grade 11-12No Correlation
No CorrelationNo Correlation
No Correlation
No Correlation
No Correlation
No Correlation
No Correlation
No Correlation
No Correlation

Curriculum Connections for 7th Grade Science
Appendix A
Inte
nded
Lea
rnin
g O
utco
mes
6f X
6e X X
6d X
6c X X X X X X X X
6b X
6a X X X
5d
5c X X X
5b X X X
5a X X X X X X X X X
4f X
4e X X X X X X
4d X X X
4c X X
4b X X X X
4a X X X X X X X X
3d
3c X X X X X X X X X X
3b X X X X
3a X
2f
2e X X X X X
2d X X X X
2c X X
2b X X X X X X
2a
1g X X X X
1f X X X
1e X
1d X X X
1c X X X X X
1b X X X X X
1a X X X X X X X X
Act
ivity
Whe
re’s
the
Wat
er?
Wha
t’s in
the
Wat
er?
Who
live
s in
the
Wat
er?
MIs
sing
Mac
roin
verte
brat
es
Wet
land
VS
Stre
am M
acro
s
Rip
aria
n R
evie
w
Nitr
ogen
Cyc
le
Whe
n Th
ings
Hea
t Up
Aqu
atic
Inva
sion
That
’s P
redi
ctab
le
Wat
er M
anag
emen
t
Bio
dive
rsity
Deb
ate
III
IIIIV
Stan
dard
VA
ctiv
ity
V-1a
V-1b
V-1c
V-1d
V-2a
V-2b
V-2c
V-2d
V-2e
V-3a
V-3b
V-3c
V-3d
Whe
re’s
the
Wat
er?
No Correlations
No Correlations
No Correlations
No Correlations
X
Wha
t’s in
the
Wat
er?
X
X
X
X
X
Who
live
s in
the
Wat
er?
X
X
X
X
X
X
X
X
Mis
sing
Mac
roin
verte
brat
es
X
X
X
X
X
X
X
XW
etla
nd V
S S
tream
Mac
ros
X
X
X
X
X
X
X
XR
ipar
ian
Rev
iew
X
X
X
X
X
X
Nig
roge
n C
ycle
XW
hen
Thin
gs H
eat U
p
Aqu
atic
Inva
sion
!
That
’s P
redi
ctab
le
Wat
er M
anag
emen
t
X
Bio
dive
rsity
Deb
ate
X

Curriculum Connections for 7th Grade Math

Curriculum Connections for 7th Grade Math
Appendix AUSU Water Quality Extension - Stream Side Science Appendices167
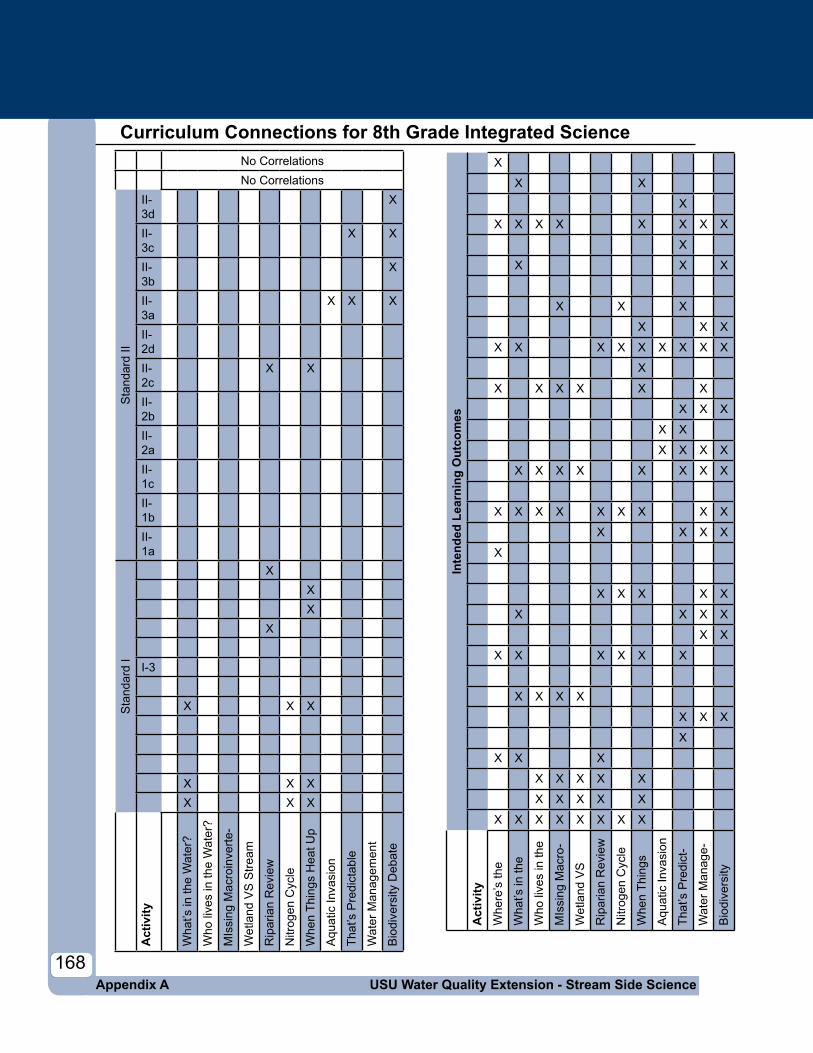
USU Water Quality Extension - Stream Side ScienceAppendix A
Curriculum Connections for 8th Grade Integrated Science
168
Inte
nded
Lea
rnin
g O
utco
mes
X
X X
X
X X X X X X X X
X
X X X
X X X
X X X
X X X X X X X X X
X
X X X X X X
X X X
X X
X X X X
X X X X X X X X
X X X X X X X X X
X X X X
X
X X X X X
X X X X
X X
X X X X X X
X X X X
X X X
X
X X X
X X X X X
X X X X X
X X X X X X X X
Act
ivity
Whe
re’s
the
Wha
t’s in
the
Who
live
s in
the
MIs
sing
Mac
ro-
Wet
land
VS
Rip
aria
n R
evie
w
Nitr
ogen
Cyc
le
Whe
n Th
ings
Aqu
atic
Inva
sion
That
’s P
redi
ct-
Wat
er M
anag
e-
Bio
dive
rsity
No CorrelationsNo Correlations
Sta
ndar
d II
II-3d
X
II-3c
X X
II-3b
X
II-3a
X X X
II-2dII-2c
X X
II-2bII-2aII-1cII-1bII-1a
Sta
ndar
d I
XXX
X
I-3
X X X
X X XX X X
Act
ivity
Wha
t’s in
the
Wat
er?
Who
live
s in
the
Wat
er?
MIs
sing
Mac
roin
verte
-
Wet
land
VS
Stre
am
Rip
aria
n R
evie
w
Nitr
ogen
Cyc
le
Whe
n Th
ings
Hea
t Up
Aqu
atic
Inva
sion
That
’s P
redi
ctab
le
Wat
er M
anag
emen
t
Bio
dive
rsity
Deb
ate

Curriculum Connections for 8th Grade Math
S P
No Correlations
G No CorrelationsF
No Correlations
EE
8c8b8a7b7a65 X X4321
NS
No Correlations
Act
ivity
Whe
re’s
the
Wat
er?
Wha
t’s in
the
Wat
er?
Who
live
s in
the
Wat
er?
MIs
sing
Mac
roin
verte
brat
es
Wet
land
VS
Stre
am M
acro
s
Rip
aria
n R
evie
w
Nitr
ogen
Cyc
le
Whe
n Th
ings
Hea
t Up
Aqu
atic
Inva
sion
That
’s P
redi
ctab
le
Wat
er M
anag
emen
t
Bio
dive
rsity
Deb
ate

Curriculum Connections for Intended Learning Outcomes for High School Earth Systems Science, Biology, Chemistry, and Physics
Appendix AUSU Water Quality Extension - Stream Side Science Appendices169

Curriculum Connections for High School Earth Systems Science
VI No Correlations
Stan
dard
V
V-2d
V-2c
V-2b
V-2a
V-1d
V-1c
V-1b X
V-1a
Stan
dard
IV
IV-2e
IV-2d
IV-2c
IV-2b
IV-2a
IV-1e X X
IV-1d X X X X X X X
IV-1c X X X X X X
IV-1b
IV-1a X
Stan
dard
III
III-1c
III-1b
III-1a
Stan
dard
II
II-3e X X X
II-3d X
II-3c X X X X
II-3b
II-3a X X X
II-2f X X X X
II-2e X X X X X X X X X
II-2d
II-2c X X X
II-2b X X X X
II-2a X X X
II-1c
II-1b
II-1a
I No Correlations
Act
ivity
Whe
re’s
the
Wat
er?
Wha
t’s in
the
Wat
er?
Who
live
s in
the
Wat
er?
Mis
sing
Mac
roin
verte
brat
es
Wet
land
VS
Stre
am M
acro
s
Rip
aria
n R
evie
w
Nitr
ogen
Cyc
le
Whe
n Th
ings
Hea
t Up
Aqu
atic
Inva
sion
!
That
’s P
redi
ctab
le
Wat
er M
anag
emen
t
Bio
dive
rsity
Deb
ate

Curriculum Connections for High School Biology

Curriculum Connections for High School Chemistry

Curriculum Connections for High School Statistics and Probability
M D No Correlations
C P No Correlations
I C No Correlations
ID
9
8
7
6c
6b
6a
5
4
3
2 X X X X
1 X X X X
Act
ivity
Whe
re’s
the
Wat
er?
Wha
t’s in
the
Wat
er?
Who
live
s in
the
Wat
er?
MIs
sing
Mac
roin
verte
brat
es
Wet
land
VS
Stre
am M
acro
s
Rip
aria
n R
evie
w
Nitr
ogen
Cyc
le
Whe
n Th
ings
Hea
t Up
Aqu
atic
Inva
sion
That
’s P
redi
ctab
le
Wat
er M
anag
emen
t
Bio
dive
rsity
Deb
ate

Appendix BSampling Safety
The Stream Side Science Curriculum provides the opportunity for students and teachers to collect data in the field, and work in and around water. To ensure the safety of your students, consider the following guidelines before going out to your sampling site.
How to manage a group in the field• Have an adult supervisor accompany each group, with six students or less per adult. • Keep a good line of communication between all groups at all times and have a plan in case students become separated. For example, keep groups within shouting distance and establish a central meeting place. • Make sure each group has access to a first aid kit and knows how to use it.• Be aware of medical considerations, such as students with allergies to bee stings. • Know the causes and early warning signs of hypothermia and heat exhaustion.
How to choose a safe site• Before the field trip, visit the site to make sure there is easy public access and available parking.• Avoid areas with steep, slippery banks. Be aware of holes, vertical banks and other hazards that can be especially difficult to see when the banks are very heavily vegetated.• Scout the area for hazards such as broken glass, rusted wire or poisonous plants. • Flag these areas to avoid if necessary.
When is it unsafe to enter the stream?• Moving water is deceptively dangerous. Don’t let students enter water over their knees or water that is moving very fast (more than 1 foot per second).• Cold water can cause hypothermia, even on warm days. Students who intend to enter the water should wear proper clothing (waders or good wading shoes) and should bring a change of clothing. • Avoid any waters that are obviously polluted or are directly downstream from a pollution discharge pipe. • Never sample during a lightening storm. Be aware of sudden storms higher in the watershed that could produce flash floods.• Never let students enter the water if adult supervisors are not present.
Safety guidelines when conducting chemical tests • Avoid contact between chemicals and eyes, nose, and mouth. NEVER open chemical packets with teeth -- use the scissors provided or tear the packets. • All the tests are designed to be safe when used correctly, but it is a good idea to avoid touching any chemicals directly. • After all field activities, wash hands thoroughly. Use lots of water and avoid no-water cleaners.• The solutions remaining from the tests can be mixed together without any risk. Deposit all liquid waste in a plastic screw-top waste bottle such as a pop bottle. Deposit all solid waste (packets and glass ampoules) in a separate screw top bottle. Liquid waste can be safely flushed down a school drain. Make sure that glass waste is also disposed of safely.
USU Water Quality Extension - Stream Side ScienceAppendix B170

Appendix CA Note on Units
The Stream Side Science Curriculum uses the metric system throughout the lesson plans and activities. Be sure to stress to your students the importance of using proper units when collecting data. The following conversion chart may be helpful as you work through the activities.
If you know Multiply by To get To get Divide by If you know
Lengthinches (in) 2.5 centimeters (cm)feet (ft) 30.0 centimeters (cm)yards (yd) 0.9 meters (m)miles (mi) 1.6 kilometers (km)AreaSquare inches (in²) 6.5 square centimeters (cm²)square feet (ft²) 0.093 square meters (m²)square yards (yd²) 0.84 square meters (m²)square mile (mi²) 640.0 acres (acre)acre (acre) 43,560 square feet (ft²)acre (acre) 4,047 square meters (m²)acre (acre) 0.405 hectacres (ha)Massounces (oz) 28.35 grams (g)pounds (lb) 0.45 kilograms (kg)Volumeteaspoons (tsp) 5.0 milliliters (ml)tablespoons (tbs) 15.0 milliliters (ml)fluid ounces (fl oz) 30.0 milliliters (ml)cups (c) .24 liters (l)pints (pt) .47 liters (l)quarts (qt) 0.95 liters (l)gallon (gal) 0.134 cubic feet (ft³)gallon (gal) 3.79 liters (l)cubic feet (ft³) 0.03 cubic meters (m³)cubic feet (ft³) 28.32 liters (l)Flowcubic feet per second (cfs) 0.03 cubic meters per sec (m³/s)cubic feet per second (cfs) 1.98 acre-feet per day (af/day) cubic feet per second (cfs) 448.8 gallons per minute (gpm)cubic feet per second (cfs) 646,320 gallons per day (gpd)Temperaturedegrees Celsius (C°) (9/5 x °C) + 32 degrees Fahrenheit (°F)degrees Fahrenheit (°F) 5/9 x (°F – 32) degrees Celsius (°C)Other water equivalents1 cubic foot (ft³) = 7.48 gallons (gal) = 62.4 pounds of water (lb/ft³)1 cubic foot per second (cfs) flowing for one year = 724 acre-feet (af)1 gallon (gal) = 0.134 cubic feet = 8.34 pounds of water (lb/gal)1 acre-foot = one and a half football fields 1 foot deep1 acre-foot = a typical garden hose (5 gpm) flowing continuously for 45 days1 acre-foot = approximately 3,475,700 12 oz. cans of soda
USU Water Quality Extension - Stream Side Science Appendices
171Appendix C
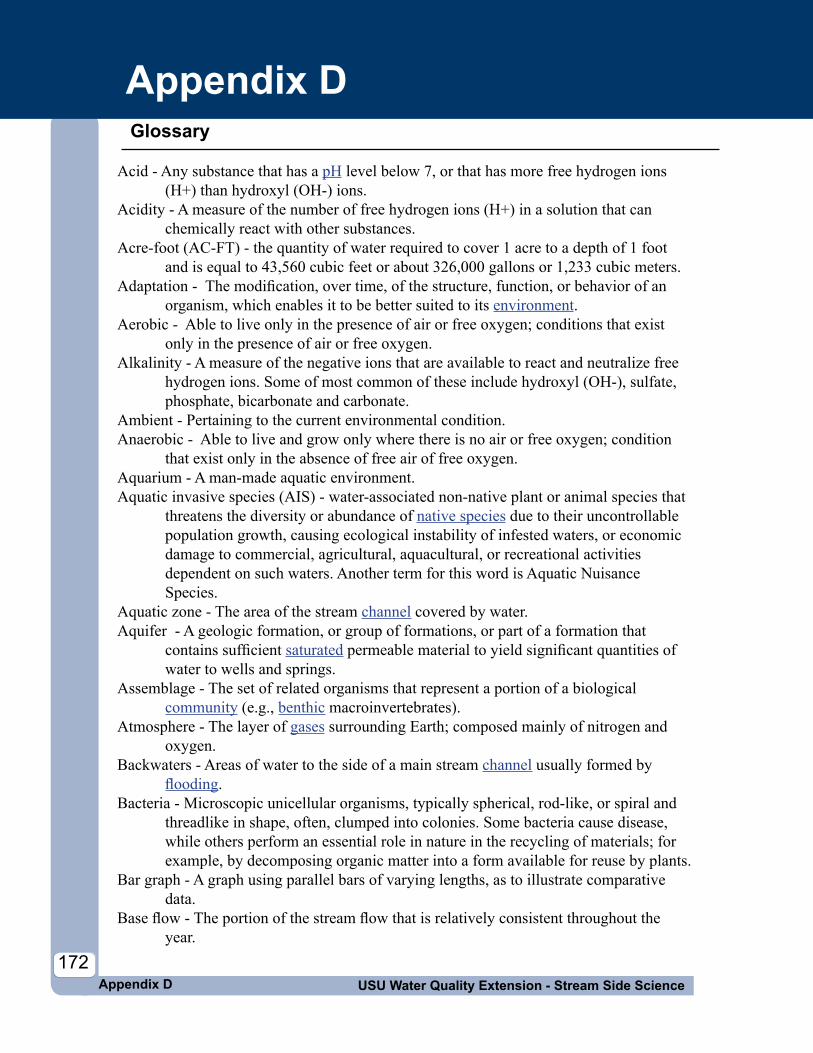
Appendix DGlossary
Acid - Any substance that has a pH level below 7, or that has more free hydrogen ions (H+) than hydroxyl (OH-) ions.
Acidity - A measure of the number of free hydrogen ions (H+) in a solution that can chemically react with other substances.
Acre-foot (AC-FT) - the quantity of water required to cover 1 acre to a depth of 1 foot and is equal to 43,560 cubic feet or about 326,000 gallons or 1,233 cubic meters.
Adaptation - The modification, over time, of the structure, function, or behavior of an organism, which enables it to be better suited to its environment.
Aerobic - Able to live only in the presence of air or free oxygen; conditions that exist only in the presence of air or free oxygen.
Alkalinity - A measure of the negative ions that are available to react and neutralize free hydrogen ions. Some of most common of these include hydroxyl (OH-), sulfate, phosphate, bicarbonate and carbonate.
Ambient - Pertaining to the current environmental condition.Anaerobic - Able to live and grow only where there is no air or free oxygen; condition
that exist only in the absence of free air of free oxygen.Aquarium - A man-made aquatic environment.Aquatic invasive species (AIS) - water-associated non-native plant or animal species that
threatens the diversity or abundance of native species due to their uncontrollable population growth, causing ecological instability of infested waters, or economic damage to commercial, agricultural, aquacultural, or recreational activities dependent on such waters. Another term for this word is Aquatic Nuisance Species.
Aquatic zone - The area of the stream channel covered by water. Aquifer - A geologic formation, or group of formations, or part of a formation that
contains sufficient saturated permeable material to yield significant quantities of water to wells and springs.
Assemblage - The set of related organisms that represent a portion of a biological community (e.g., benthic macroinvertebrates).
Atmosphere - The layer of gases surrounding Earth; composed mainly of nitrogen and oxygen.
Backwaters - Areas of water to the side of a main stream channel usually formed by flooding.
Bacteria - Microscopic unicellular organisms, typically spherical, rod-like, or spiral and threadlike in shape, often, clumped into colonies. Some bacteria cause disease, while others perform an essential role in nature in the recycling of materials; for example, by decomposing organic matter into a form available for reuse by plants.
Bar graph - A graph using parallel bars of varying lengths, as to illustrate comparative data.
Base flow - The portion of the stream flow that is relatively consistent throughout the year.
USU Water Quality Extension - Stream Side ScienceAppendix D172

Basic - Alkaline. Basic water contains high concentrations of hydroxyl ions (OH-).Beneficial use - The legal, designated uses for a water body including, drinking,
recreation, fish and wildlife, etc. Water quality standards are designed to support a water body’s beneficial use(s).
Benthic - Pertaining to the bottom (bed) of a water body.Biochemical oxygen demand (BOD) - A measure of the quantity of dissolved oxygen,
in milligrams per liter, necessary for the decomposition of organic matter by micro-organisms, such as bacteria.
Biodiversity - A measure of the distinct characteristics, qualities, or elements of plant and animal life in a defined area; a measure of biological differences.
Biological integrity - The condition of the aquatic community inhabiting unimpaired water bodies as measured by community structure and function.
Biomass - the amount of living matter (as in a unit area or volume of habitat).Buffer - To maintain high pH levels. Alkaline soils keep the pH of water from getting too
low.Capillary action - Forces of adhesion and cohesion help water to move through the soil
from areas of greater concentration to areas of lesser concentration.Cause - The producer of an effect.Channel - The section of the stream that contains the main flow.Channelization - The straightening of a stream; this often is a result of human activity.Collectors - Macroinvertebrates that collect bits of food from the water column.Community - The whole of the plant and animal population inhabiting a given area. Culvert - Man-made construction that diverts the natural flow of water. Comparability - The degree to which we can compare data between dates and locations. Concentration - The amount of a specific substance dissolved in a given amount (volume)
of another substance.Condensation - The process by which a vapor becomes a liquid; the opposite of
evaporation.Contaminant - Any substance that when added to water (or another substance) makes it
impure and unfit for consumption or use.Control - A standard for comparing, checking, or verifying the results of an experiment or
activity.Correlation - The mutual relation of two or more things.Cubic foot per second (ft³/s)/Cubic meter per second (m³/s) - Units typically used in
measuring streamflow that express rate of discharge. The measurement is equal to the discharge in a stream cross section one foot wide and one foot deep, flowing with an average velocity of one foot per second; 1 cfs = 44.8 gallons per minute (gpm); 1 cms = 1,000 liters per second.
Decomposition - The breakdown or decay of organic matter through the digestive processes of microorganisms, macroinvertebrates, and scavengers.
Density - The compactness or crowdedness of matter (ex. water molecules) in a given area.
Deposition - The process of laying down sediment or accumulating layers of material
USU Water Quality Extension - Stream Side Science Appendices
173Appendix D

carried in suspension.Designated beneficial uses - State-established desirable uses that waters should support,
such as fishing, swimming, and aquatic life. Listed in state water quality standards. Detection limit - The lowest point at which a particular piece of sampling equipment can
accurately assess chemical concentrations. D-frame net - A fine mesh net that is attached to a pole and used for sampling. It
resembles a butterfly net. Dichotomous key - A tool for identifying objects, such as macroinvertebrates. The key
presents a series of yes or no questions to the observer; each question brings the observer closer to the identification.
Discharge - The volume of water (or more broadly, volume of fluid plus suspended sediment) that passes through a cross-section of the channel within a given period of time.
Discharge limits - Any restriction on quantities, rates, and concentrations of chemical, physical, biological or other constituents which are discharged from point sources.
Dissolved Solids - These are dissolved materials that can pass through a standard glass-fiber filter with about one micrometer pore size.
Dissolved oxygen (DO) - Oxygen dissolved in water and available for living organisms to use for respiration.
Distillation - The purification of water. When water evaporates the vapor separates from impurities.
Distilled water - Water that has had most of its impurities removed. Downstream - In the direction of a stream’s current; in relation to water rights, refers to
water uses or locations that are affected by upstream uses or locations.Drainage basin - Part of the surface of the earth that is occupied by a drainage system,
which consists of a surface stream or a body of impounded surface water together with all tributary surface streams and bodies of impounded surface water. See watershed.
Ecosystem - A community of living organisms and their interrelated physical and chemical environment; also, a land area within a climate.
Effluent - Waste material discharged into the environment.Emergent plants - Plants rooted underwater, but with their tops extending above the water. Engulfers - Macroinvertebrate predators that feed by swallowing their prey whole.Environment - All of the external factors, conditions, and influences that affect an
organism or a biological community.Ephemeral - Occurs intermittently. Ephemeral streams flow only during and shortly after
extreme precipitation or snowmelt events.EPT Value - An index of water quality derived from the percent of Ephemeroptera
(mayflies), Plecoptera (stoneflies), and Tricoptera (caddisflies) in a 100-individual sample of macroinvertebrates.
Erosion - The wearing down or washing away of the soil and land surface by the action of water, wind or ice.
Erosive - The power of wind or water to wear away sediment. Highly erosive water can wear away more sediment.
USU Water Quality Extension - Stream Side ScienceAppendix D174

Eutrophic - A condition in which the water in a lake, pond, or reservoir is enriched with plant nutrients such as nitrogen and phosphorous which results in large amounts of plant and algal production. As the plants and algae die and sink to the bottom, an organic sediment is created which removes oxygen from the water as it decays.
Evaporation - The conversion of a liquid (e.g., water) into a vapor (a gaseous state) usually through the application of heat energy; the opposite of condensation.
Evapotranspiration - The loss of water from the soil through both evaporation and transpiration from plants.
Exotic Species - a species that does not naturally occur in an ecosystem, but does not necessarily cause problems for native species.
Floating plants - Plants that grow free floating, rather that being attached to the stream bed.
Flood - Any relatively high streamflow overtopping the natural or artificial banks of a stream.
Floodplain - Any normally dry land area that is susceptible to being inundated by water from any natural source; usually lowland adjacent to a stream or lake.
Forbs - Plants with broad leaves and net-like veins; stems are solid and spongy and die back to the ground every year.
Functional feeding groups - Classification of macroinvertebrate groups according to their mode of feeding.
Gas (gaseous) - The state of water in which individual molecules are highly energized and move about freely; also known as vapor.
Glide/run - A section of a stream with a relatively high velocity and with little or no turbulence on the surface of the water.
Gradient - A measure of degree of incline; the steepness of slope.Grass - Plants with hollow stems that are jointed and leaves with parallel veins. The
leaves come off the stem opposite to each other. Gravity - The natural force of attraction exerted by Earth on objects or materials on its
surface that tends to draw them down toward its center.Greenline - A line of vegetation that runs alongside the stream. It is the first line of
vegetation you encounter as you move away from the water.Groundwater - Water found in spaces between soil particles underground (located in the
zone of saturation).Habitat - The environment occupied by individuals of a particular species, population, or
community.Headwaters - The source of a stream.Hydrograph - A representation of water discharge over time.Hydrology - The study of Earth’s waters, including properties, circulation, principles and
distribution.Hydrophilic - Water-loving.Impaired waters - Waters that fail to meet applicable water quality standards or to protect
designated uses (such as fishing or swimming).
USU Water Quality Extension - Stream Side Science Appendices
175Appendix D

Independent variable - A factor in a relationship that is not affected by the relationship. Time is a common independent variable.
Indicator - A gauge of water pollution: not legal criteria but, rather a sign that there may be a problem. When an indicator level is exceeded, further studies are done.
Instream flow - The minimum amount of water required in a stream to maintain the existing aquatic resources and associated wildlife and riparian habitat.
Instream use - Uses of water within a stream’s channel (e.g., fish and other aquatic life, recreation, navigation and hydroelectric power production).
Intermittent - A stream that does not flow year round.Invasive Species - a non-native (or alien) to the ecosystem under consideration whose
introduction causes or is likely to cause economic or environmental harm or harm to human health.
Irrigation - The controlled application of water to cropland, hay fields, and/or pasture to supplement that supplied by nature.
Kick-net - A fine mesh net used to collect organisms. Kick-nets vary in size, but generally are about three feet long and are attached to two wooden poles at each end.
Land uses - Activities that take place on the land, such as construction, farming, or tree clearing.
Large woody material - Fallen trees and limbs in a stream.Larva - The immature, wingless, feeding stage of an insect that undergoes complete
metamorphosis.Line graph - An illustration of data points where individual points are connected by a
line. Line graphs show a continuous trend.Litter - Dead plant material on the ground.Macroinvertebrate - Organisms that lack a backbone and can be seen with the naked eye.Mainstem - The primary path for waterflow in a watershed.Mean - Average. The sum of all the measurement values divided by the number of
measurements.Meandering - The curving pattern of a stream channel.Metabolism - The physical and chemical processes in an organism that produce energy
and result in the production, maintenance, or destruction of materials in the body. Many metabolic processes involve water.
Metal - An elementary substance, such as gold or silver, which is crystalline when solid and yields positively charged ions in aqueous solutions of its salts. Metals can be very toxic in streams at low concentrations.
Metamorphosis - A change in form from one stage to the next in the life history of an organism, as from the caterpillar to the pupa and from the pupa to the adult butterfly.
Milligrams per liter (mg/1) - Used to refer to the concentration of a substance in the water; milligram of a substance dissolved in one liter of water.
Minimum instream flow requirements - Regulations set by management agencies that determine the least amount of water a stream can hold. Requirements protect the aquatic ecosystem and balance competing out-of-stream uses.
USU Water Quality Extension - Stream Side ScienceAppendix D176

Municipal water system - A network of pipes, pumps, and storage and treatment facilities designed to deliver potable water to homes, schools, businesses and other users in the city or town and to remove and treat waste materials.
Narrative criteria - Chemical, physical or biological concentrations in water that are expressed in words.
National Pollutant Discharge Elimination System (NPDES) - A national program in which pollution dischargers, such as factories and sewage treatment plants, are given permits to discharge. These permits contain limits on the pollutants they are allowed to discharge.
Native Species - a Biota (plant or animal species) occurring naturally in a specified geo graphic area comprising its ecological range.
Nephelometer (turbidity tube) - A clear tube used to measure the turbidity of a stream or water body.
Nephelometric turbidity unit (NTU) - A unit used to describe turbidity measurements.Neutral - A substance, such as distilled water, with a pH of 7.Nitrate - A nitrogen compound (NO3) that functions as a plant nutrient. An overabundance
of nitrate is considered a water pollutant.Nitrite - A combination of nitrogen, ammonia and oxygen (NO2) that functions as a plant
nutrient. An overabundance of nitrite is considered a water pollutant. Nitrogen fixation - Changing nitrogen gas into ammonia. Some plants and algae fix
nitrogen.Nonconsumptive uses - Instream use of water that does not reduce the supply; or,
removing water and returning it to the source without reducing the supply.Non-native Species - biota (plant or animal species) not natural to a specified geographic
area, having been introduced either purposely or unintentionally. Only a select group of non-native species are recognized as AIS, since many other create a quality of life desired by man.
Nonpoint source pollution - Refers to pollution sources that are diffuse and do not have a single point of origin. Run-off from agriculture, forestry and construction sites are examples.
Numeric criteria - Chemical, physical or biological concentrations in water that are typically expressed as concentrations, such as milligrams per liter.
Nutrient - An element, such as nitrogen or phosphorus, or compound needed for the reproduction, survival or growth of plants and animals.
Nymph - The young of an insect that undergoes incomplete metamorphosisOccular tube - A device used to measure canopy cover.Organic - Of, related to, or derived from living organisms. Organic substances contain
carbon.Parameter - A distinguishing characteristic or feature. For example, nitrate is a water
quality parameter.Parts per million (ppm)/parts per billion (ppb) - Units typically used in measuring
the number of “parts” by weight of a substance in water; commonly used in representing pollutant concentrations.
Pathogen - A disease-producing agent, especially a microorganism. USU Water Quality Extension - Stream Side Science Appendices
177Appendix D
Peak flow - The largest rate of flow during a certain time period.Piercers - Macroinvertebrate predators that feed by injecting a sharp mouth part into their
prey and sucking out body fluids.Percent saturation - The amount of dissolved oxygen in water compared to the amount of
dissolved oxygen the water can hold.Percolation - Describes the action of water as it moves through spaces in the soil and rock.Perennial - Occurs year-round. Perennial streams hold water throughout the year.Permit - Legal authority to carry out a regulated activity.pH - A numerical measure of the hydrogen ion concentration used to indicate the
alkalinity or acidity of a substance. Measured on a scale of 0.0 (acidic) to 14.0 (basic); 7.0 is neutral.
Photosynthesis - The chemical reaction in plants that utilizes light energy from the sun to convert water and carbon dioxide into simple sugars. This reaction is facilitated by chlorophyll.
Pipette - An eye dropper-like instrument that can measure very small amounts of a liquid. Point source pollution - Refers to pollution resulting from discharges into receiving
waters from any discernible, confined and discrete conveyance such as a pipe, ditch, or sewer.
Pool - A deeper portion of a stream where water flows slower than in neighboring, shallower portions.
Precipitation - Water falling, in a liquid or solid state, from the atmosphere to Earth (e.g., rain, snow).
Predator - An animal, such as a macroinvertebrate, that feeds on other animals.Protocol - A defined procedure. Reagent - A substance or chemical used to indicate the presence of a chemical or to
induce a chemical reaction to determine the chemical characteristics of a solution. Representative - Accurately depicting the true characteristics of the stream.Reservoir - A still, lake-like water body that forms upstream from a dam. Reservoirs store
water and often provide for recreation. Riffle - A shallow area in a stream where water flows swiftly over gravel and rock. Riparian zone - The vegetative area on each bank of a body of water that receives flood
waters.Run/glide - See glide/run. Runoff - Precipitation that flows overland to surface streams, rivers, and lakes.Rushes - Similar to sedges but have round (verses triangular) stems and very small or no
leaves. Rushes stabilize stream banks and prevent erosion.Saturated - Inundated; filled to the point of capacity or beyond.Saturation concentration - The amount of dissolved oxygen a body of water can hold.Scrapers - Macroinvertebrates that feed by scraping algae and other material from the
surface of plants, wood and rock. Also known as grazers.Season - A period of time during the year classified by length of day and weather
conditions.Sedges - Sedges resemble grasses but have solid, triangular stems with no joints. The
leaves have parallel veins and come off the stem in three directions. Sedges areUSU Water Quality Extension - Stream Side ScienceAppendix D
178

effective at stabilizing stream banks and preventing erosion.Sediment - Solid material that originates mostly from disintegrated rocks and is
transported by, suspended in, or deposited from water; it includes chemical and biochemical precipitates and decomposed organic material such as humus. The quantity, characteristics, and cause of the occurrence of sediment in streams are influenced by the quantity and intensity of precipitation.
Shredder - A macroinvertebrate that feeds by cutting or tearing on leaves and woody material that falls into the stream.
Shrubs - Plants with woody stems that remain alive all year. The leaves tend to have net-like veins. Shrubs rarely grow larger than 13 ft tall; if they do they may be considered trees.
Siltation - An increased supply of fine sediments to a stream bottom or channel. Siltation can cover up and harm fish spawning areas and macroinvertebrate habitat.
Sinuosity - The degree to which a stream meanders, or curves.Soil - The top layer of Earth’s surface, containing unconsolidated rock and mineral
particles mixed with organic material. Solids - Water, a liquid, can contain quite a bit of solid material, both in dissolved and
suspended forms. Solids captured on the filter are, by definition, suspended solids. Solids which settle out of a water sample on standing for a period of an hour are defined as settleable.
Soluble - Able to be dissolved in water.Solute - A substance dissolved in another substance (the solvent) to create a solution.Solvent - A material such as water that dissolves another substance (the solute) to form a
solution.Spreadsheet - A work sheet that is arranged in the manner of a mathematical matrix and
contains a multicolumn analysis of related entries for easy reference on a single sheet.
Stream - A channel of water that flows as a function of gravity and elevation across the Earth’s surface.
Streamflow - The discharge that occurs in a natural channel. Although the term discharge can be applied to the flow of a canal, the word streamflow uniquely describes the discharge in surface stream course. The term streamflow is more general than runoff as streamflow may be applied to discharge whether or not it is affected by diversion or regulation.
Submergent plants - Plants that live and grow fully submerged under the water.Substrate - Refers to a surface. This includes the material comprising the streambed or the
surfaces which plants or animals may attach or live upon.Surface runoff - Water that flows over the surface of the land or through the upper layer
of soil.Surface water - Water above the surface of the land, including lakes, rivers, streams,
ponds, floodwater, and runoff. Suspended solids - Particles carried in water without being dissolved. Taxon (plural taxa) - A level of classification within a scientific system that categorizes
USU Water Quality Extension - Stream Side Science Appendices
179Appendix D

living organisms based on their physical characteristics.Taxonomic key - A quick reference guide used to identify organisms. They are available
in varying degrees of complexity and detail.Temperature - The measurement of the average kinetic energy of moving molecules
within a substance. Tolerance - The ability to withstand a particular condition - (e.g., pollution tolerant indicates the ability to live in polluted waters).
Topography - The shape of the land’s surface.Toxic - Poisonous or damaging.Turbidity - Murkiness or cloudiness of water, indicating the presence of some suspended
sediments, dissolved solids, natural or man-made chemicals, algae, etc.Turbidity tube (nephelometer) - A clear tube for measuring the turbidity of a stream or
water body.Uplands zone - The area of the watershed that does not receive regular flooding by a
stream. The uplands zone borders the riparian zone.Upstream - Toward the source or upper part of a stream; against the current. In relation to
water rights, refers to water uses or locations that affect water quality or quantity of downstream water uses or locations.
Utah State Standard - The legally designated allowable concentration of an impurity in a water body. Concentrations over this state standard are considered as pollution.
Velocity - The speed of water flow. Volume - The amount of water in a stream.Wastewater - Water that contains unwanted materials from homes, businesses, and
industries; a mixture of water and dissolved or suspended substances.Wastewater treatment - Any of the mechanical or chemical processes used to modify
the quality of wastewater in order to make it more compatible or acceptable to humans and the environment.
Water (H2O) - An odorless, tasteless, colorless liquid made up of a combination of hydrogen and oxygen. Water forms streams, lakes, and seas, and is a major constituent of all living matter. The word water and important concepts related to water appear on almost every page of this text.
Water allocation - In a hydrologic system in which there are multiple uses or demands for water, the process of measuring a specific amount of water devoted to a given purpose.
Water cycle - The paths water takes through its various states-vapor, liquid, and solid-as it moves throughout Earth’s systems (oceans, atmosphere, groundwater, streams, etc.). Also known as the hydrologic cycle.
Water quality - The chemical, physical, and biological characteristics of water with respect to its suitability for a particular use.
Water quality criteria - Maximum concentrations of pollutants that are acceptable, if those waters are to meet water quality standards. Listed in state water quality standards.
Water quality rating index - An index of water quality derived from a 100-individual sample of macroinvertebrates. The more pollution-intolerant individuals found in the sample, the better the water quality.
USU Water Quality Extension - Stream Side ScienceAppendix D180

Water quality standard - Recommended or enforceable maximum contaminant levels of chemicals or materials (e.g., nutrients). In relation to water rights, refers to water uses or locations that affect water quality or quantity of downstream water uses or locations.
Water right - A legal right to use a specified amount of water for beneficial purposes. Watershed - The land area from which surface runoff drains into a stream channel, lake,
reservoir or other body of water; also called a drainage basin.Water table - The top of an unconfined aquifer; indicates the level below which soil and
rock are saturated with water.Wetlands - Lands where water saturation is the dominant factor determining the nature of
soil development and the types of plant and animal communities. Other common names for wetlands are sloughs, ponds and marshes.
USU Water Quality Extension - Stream Side Science Appendices
181Appendix D


